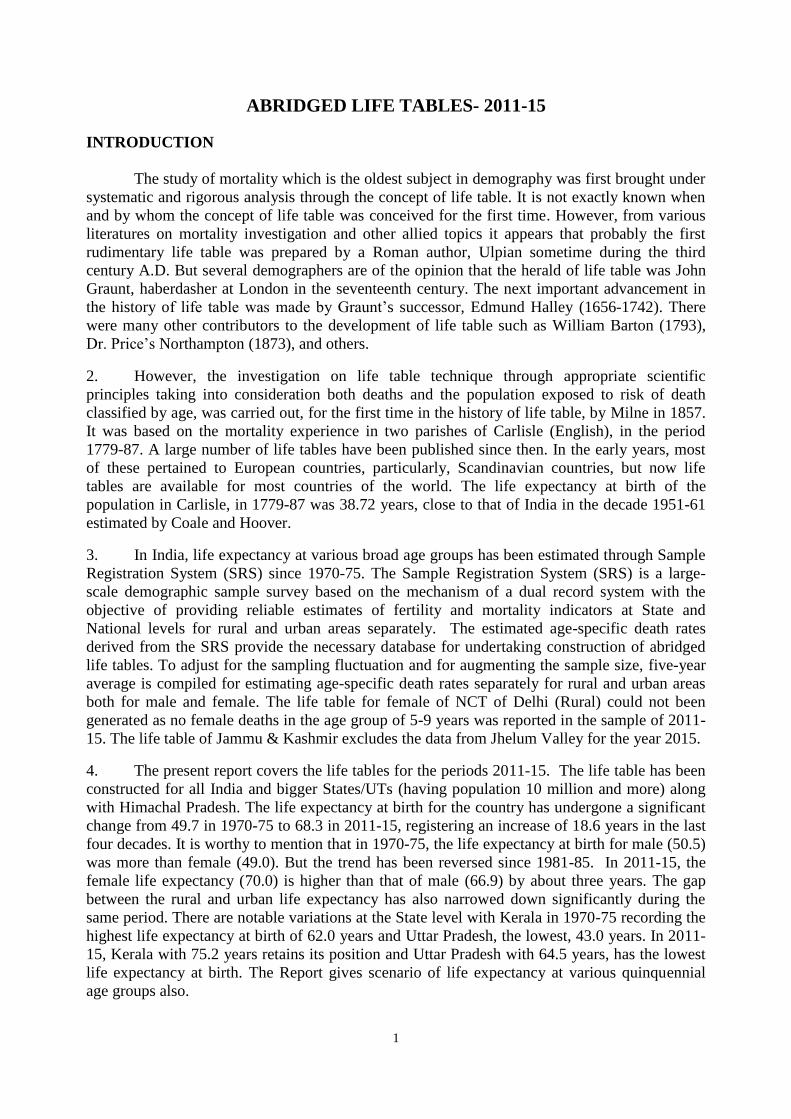
1 ABRIDGED LIFE TABLES- 2011-15 INTRODUCTION The study of mortality which is the oldest subject in demography was first brought under systematic and rigorous analysis through the concept of life table. It is not exactly known when and by whom the concept of life table was conceived for the first time. However, from various literatures on mortality investigation and other allied topics it appears that probably the first rudimentary life table was prepared by a Roman author, Ulpian sometime during the third century A.D. But several demographers are of the opinion that the herald of life table was John Graunt, haberdasher at London in the seventeenth century. The next important advancement in the history of life table was made by Graunt’s successor, Edmund Halley (1656-1742). There were many other contributors to the development of life table such as William Barton (1793), Dr. Price’s Northampton (1873), and others. 2. However, the investigation on life table technique through appropriate scientific principles taking into consideration both deaths and the population exposed to risk of death classified by age, was carried out, for the first time in the history of life table, by Milne in 1857. It was based on the mortality experience in two parishes of Carlisle (English), in the period 1779-87. A large number of life tables have been published since then. In the early years, most of these pertained to European countries, particularly, Scandinavian countries, but now life tables are available for most countries of the world. The life expectancy at birth of the population in Carlisle, in 1779-87 was 38.72 years, close to that of India in the decade 1951-61 estimated by Coale and Hoover. 3. In India, life expectancy at various broad age groups has been estimated through Sample Registration System (SRS) since 1970-75. The Sample Registration System (SRS) is a large- scale demographic sample survey based on the mechanism of a dual record system with the objective of providing reliable estimates of fertility and mortality indicators at State and National levels for rural and urban areas separately. The estimated age-specific death rates derived from the SRS provide the necessary database for undertaking construction of abridged life tables. To adjust for the sampling fluctuation and for augmenting the sample size, five-year average is compiled for estimating age-specific death rates separately for rural and urban areas both for male and female. The life table for female of NCT of Delhi (Rural) could not been generated as no female deaths in the age group of 5-9 years was reported in the sample of 2011- 15. The life table of Jammu & Kashmir excludes the data from Jhelum Valley for the year 2015. 4. The present report covers the life tables for the periods 2011-15. The life table has been constructed for all India and bigger States/UTs (having population 10 million and more) along with Himachal Pradesh. The life expectancy at birth for the country has undergone a significant change from 49.7 in 1970-75 to 68.3 in 2011-15, registering an increase of 18.6 years in the last four decades. It is worthy to mention that in 1970-75, the life expectancy at birth for male (50.5) was more than female (49.0). But the trend has been reversed since 1981-85. In 2011-15, the female life expectancy (70.0) is higher than that of male (66.9) by about three years. The gap between the rural and urban life expectancy has also narrowed down significantly during the same period. There are notable variations at the State level with Kerala in 1970-75 recording the highest life expectancy at birth of 62.0 years and Uttar Pradesh, the lowest, 43.0 years. In 2011- 15, Kerala with 75.2 years retains its position and Uttar Pradesh with 64.5 years, has the lowest life expectancy at birth. The Report gives scenario of life expectancy at various quinquennial age groups also.

Welcome message from author
This document is posted to help you gain knowledge. Please leave a comment to let me know what you think about it! Share it to your friends and learn new things together.
Transcript
1
ABRIDGED LIFE TABLES- 2011-15
INTRODUCTION
The study of mortality which is the oldest subject in demography was first brought under
systematic and rigorous analysis through the concept of life table. It is not exactly known when
and by whom the concept of life table was conceived for the first time. However, from various
literatures on mortality investigation and other allied topics it appears that probably the first
rudimentary life table was prepared by a Roman author, Ulpian sometime during the third
century A.D. But several demographers are of the opinion that the herald of life table was John
Graunt, haberdasher at London in the seventeenth century. The next important advancement in
the history of life table was made by Graunt’s successor, Edmund Halley (1656-1742). There
were many other contributors to the development of life table such as William Barton (1793),
Dr. Price’s Northampton (1873), and others.
2. However, the investigation on life table technique through appropriate scientific
principles taking into consideration both deaths and the population exposed to risk of death
classified by age, was carried out, for the first time in the history of life table, by Milne in 1857.
It was based on the mortality experience in two parishes of Carlisle (English), in the period
1779-87. A large number of life tables have been published since then. In the early years, most
of these pertained to European countries, particularly, Scandinavian countries, but now life
tables are available for most countries of the world. The life expectancy at birth of the
population in Carlisle, in 1779-87 was 38.72 years, close to that of India in the decade 1951-61
estimated by Coale and Hoover.
3. In India, life expectancy at various broad age groups has been estimated through Sample
Registration System (SRS) since 1970-75. The Sample Registration System (SRS) is a large-
scale demographic sample survey based on the mechanism of a dual record system with the
objective of providing reliable estimates of fertility and mortality indicators at State and
National levels for rural and urban areas separately. The estimated age-specific death rates
derived from the SRS provide the necessary database for undertaking construction of abridged
life tables. To adjust for the sampling fluctuation and for augmenting the sample size, five-year
average is compiled for estimating age-specific death rates separately for rural and urban areas
both for male and female. The life table for female of NCT of Delhi (Rural) could not been
generated as no female deaths in the age group of 5-9 years was reported in the sample of 2011-
15. The life table of Jammu & Kashmir excludes the data from Jhelum Valley for the year 2015.
4. The present report covers the life tables for the periods 2011-15. The life table has been
constructed for all India and bigger States/UTs (having population 10 million and more) along
with Himachal Pradesh. The life expectancy at birth for the country has undergone a significant
change from 49.7 in 1970-75 to 68.3 in 2011-15, registering an increase of 18.6 years in the last
four decades. It is worthy to mention that in 1970-75, the life expectancy at birth for male (50.5)
was more than female (49.0). But the trend has been reversed since 1981-85. In 2011-15, the
female life expectancy (70.0) is higher than that of male (66.9) by about three years. The gap
between the rural and urban life expectancy has also narrowed down significantly during the
same period. There are notable variations at the State level with Kerala in 1970-75 recording the
highest life expectancy at birth of 62.0 years and Uttar Pradesh, the lowest, 43.0 years. In 2011-
15, Kerala with 75.2 years retains its position and Uttar Pradesh with 64.5 years, has the lowest
life expectancy at birth. The Report gives scenario of life expectancy at various quinquennial
age groups also.
2
5. There are several methods for construction of life tables. In this report, the life tables
have been generated using mortality package for life table estimation (MORTPAK 4), which is a
United Nation’s software package for mortality measurements. The various columns given in the
abridged life table are nqx, lx, nLx and ex. In the life table nqx represents the probability of dying
between exact age x and x+n, lx is the expected number of persons surviving at exact age x out
of the original cohort of say 1,00,000 persons; nLx denotes the expected number of persons-years
lived between ages x and x+n years; and ex denotes the expectation of life at age x viz. the
average number of additional years a person would live if the current mortality trends were to
continue.
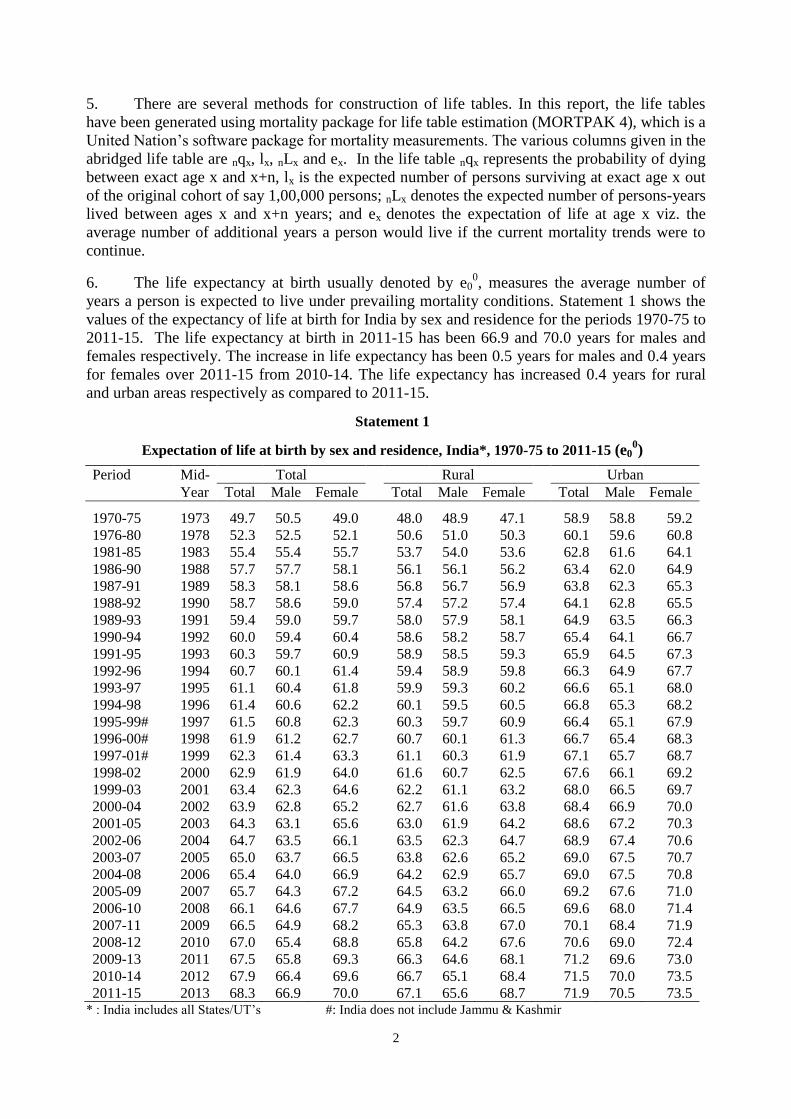
6. The life expectancy at birth usually denoted by e00, measures the average number of
years a person is expected to live under prevailing mortality conditions. Statement 1 shows the
values of the expectancy of life at birth for India by sex and residence for the periods 1970-75 to
2011-15. The life expectancy at birth in 2011-15 has been 66.9 and 70.0 years for males and
females respectively. The increase in life expectancy has been 0.5 years for males and 0.4 years
for females over 2011-15 from 2010-14. The life expectancy has increased 0.4 years for rural
and urban areas respectively as compared to 2011-15.
Statement 1
Expectation of life at birth by sex and residence, India*, 1970-75 to 2011-15 (e0
0)
Period Mid- Total Rural Urban
Year Total Male Female Total Male Female Total Male Female
1970-75 1973 49.7 50.5 49.0
48.0 48.9 47.1
58.9 58.8 59.2
1976-80 1978 52.3 52.5 52.1
50.6 51.0 50.3
60.1 59.6 60.8
1981-85 1983 55.4 55.4 55.7
53.7 54.0 53.6
62.8 61.6 64.1
1986-90 1988 57.7 57.7 58.1
56.1 56.1 56.2
63.4 62.0 64.9
1987-91 1989 58.3 58.1 58.6
56.8 56.7 56.9
63.8 62.3 65.3
1988-92 1990 58.7 58.6 59.0
57.4 57.2 57.4
64.1 62.8 65.5
1989-93 1991 59.4 59.0 59.7
58.0 57.9 58.1
64.9 63.5 66.3
1990-94 1992 60.0 59.4 60.4
58.6 58.2 58.7
65.4 64.1 66.7
1991-95 1993 60.3 59.7 60.9
58.9 58.5 59.3
65.9 64.5 67.3
1992-96 1994 60.7 60.1 61.4
59.4 58.9 59.8
66.3 64.9 67.7
1993-97 1995 61.1 60.4 61.8
59.9 59.3 60.2
66.6 65.1 68.0
1994-98 1996 61.4 60.6 62.2
60.1 59.5 60.5
66.8 65.3 68.2
1995-99# 1997 61.5 60.8 62.3
60.3 59.7 60.9
66.4 65.1 67.9
1996-00# 1998 61.9 61.2 62.7
60.7 60.1 61.3
66.7 65.4 68.3
1997-01# 1999 62.3 61.4 63.3
61.1 60.3 61.9
67.1 65.7 68.7
1998-02 2000 62.9 61.9 64.0
61.6 60.7 62.5
67.6 66.1 69.2
1999-03 2001 63.4 62.3 64.6
62.2 61.1 63.2
68.0 66.5 69.7
2000-04 2002 63.9 62.8 65.2
62.7 61.6 63.8
68.4 66.9 70.0
2001-05 2003 64.3 63.1 65.6
63.0 61.9 64.2
68.6 67.2 70.3
2002-06 2004 64.7 63.5 66.1
63.5 62.3 64.7
68.9 67.4 70.6
2003-07 2005 65.0 63.7 66.5
63.8 62.6 65.2
69.0 67.5 70.7
2004-08 2006 65.4 64.0 66.9
64.2 62.9 65.7
69.0 67.5 70.8
2005-09 2007 65.7 64.3 67.2
64.5 63.2 66.0
69.2 67.6 71.0
2006-10 2008 66.1 64.6 67.7
64.9 63.5 66.5
69.6 68.0 71.4
2007-11 2009 66.5 64.9 68.2
65.3 63.8 67.0
70.1 68.4 71.9
2008-12 2010 67.0 65.4 68.8 65.8 64.2 67.6 70.6 69.0 72.4
2009-13 2011 67.5 65.8 69.3 66.3 64.6 68.1 71.2 69.6 73.0
2010-14 2012 67.9 66.4 69.6 66.7 65.1 68.4 71.5 70.0 73.5
2011-15 2013 68.3 66.9 70.0 67.1 65.6 68.7 71.9 70.5 73.5 * : India includes all States/UT’s #: India does not include Jammu & Kashmir

3
Chart 1 presents the expectancy of life at birth between 1970-75 to 2011-15 periods separately
for males and females, by residence.
Chart 1: Expectation of life at birth by sex and residence, India, 1970-75 to 2011-15
40
45
50
55
60
65
70
75
19
70-7
5
19
76-8
0
19
81-8
5
19
86-9
0
1987-9
1
19
88-9
2
19
89-9
3
19
90-9
4
19
91-9
5
19
92-9
6
19
93-9
7
19
94-9
8
19
95-9
9
19
96-0
0
19
97-0
1
19
98-0
2
19
99-0
3
20
00-0
4
20
01-0
5
20
02-0
6
20
03-0
7
20
04-0
8
20
05-0
9
20
06-1
0
20
07-1
1
20
08-1
2
2009-1
3
20
10-1
4
20
11-1
5
Lif
e ex
pec
tan
cy i
n y
ears
Period
Total
40
45
50
55
60
65
70
75
1970-7
5
1976-8
0
1981-8
5
1986-9
0
19
87-9
1
1988-9
2
1989-9
3
1990-9
4
1991-9
5
1992-9
6
1993-9
7
1994-9
8
1995-9
9
1996-0
0
1997-0
1
1998-0
2
1999-0
3
2000-0
4
2001-0
5
2002-0
6
2003-0
7
2004-0
8
2005-0
9
2006-1
0
2007-1
1
2008-1
2
20
09-1
3
2010-1
4
2011-1
5Lif
e ex
pec
tan
cy i
n y
ears
Period
Rural
50
55
60
65
70
75
19
70-7
5
19
76-8
0
19
81-8
5
19
86-9
0
19
87-9
1
19
88-9
2
19
89-9
3
19
90-9
4
19
91-9
5
19
92-9
6
1993-9
7
19
94-9
8
19
95-9
9
19
96-0
0
19
97-0
1
19
98-0
2
19
99-0
3
20
00-0
4
20
01-0
5
20
02-0
6
20
03-0
7
20
04-0
8
20
05-0
9
20
06-1
0
20
07-1
1
20
08-1
2
20
09-1
3
20
10-1
4
20
11-1
5
Lif
e ex
pec
tan
cy i
n y
ears
Period
Urban
Male Female
4
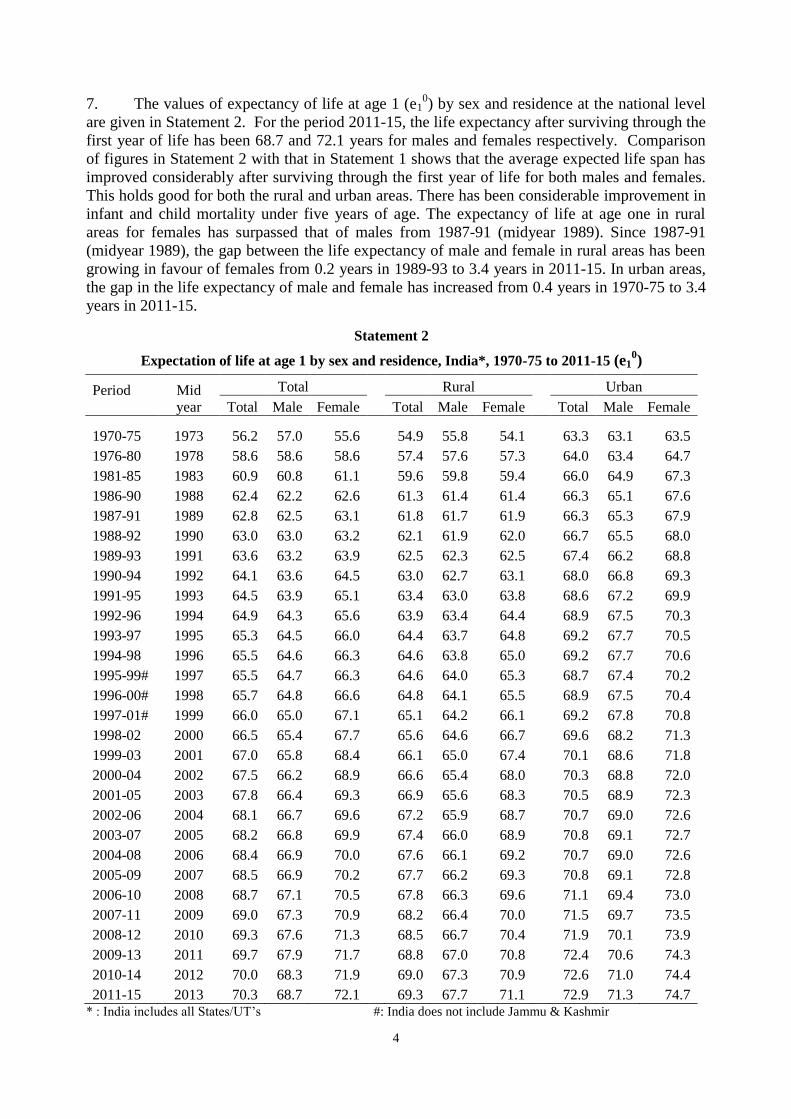
7. The values of expectancy of life at age 1 (e10) by sex and residence at the national level
are given in Statement 2. For the period 2011-15, the life expectancy after surviving through the
first year of life has been 68.7 and 72.1 years for males and females respectively. Comparison
of figures in Statement 2 with that in Statement 1 shows that the average expected life span has
improved considerably after surviving through the first year of life for both males and females.
This holds good for both the rural and urban areas. There has been considerable improvement in
infant and child mortality under five years of age. The expectancy of life at age one in rural
areas for females has surpassed that of males from 1987-91 (midyear 1989). Since 1987-91
(midyear 1989), the gap between the life expectancy of male and female in rural areas has been
growing in favour of females from 0.2 years in 1989-93 to 3.4 years in 2011-15. In urban areas,
the gap in the life expectancy of male and female has increased from 0.4 years in 1970-75 to 3.4
years in 2011-15.
Statement 2
Expectation of life at age 1 by sex and residence, India*, 1970-75 to 2011-15 (e10)
Period
Mid
year
Total Rural Urban
Total Male Female Total Male Female Total Male Female
1970-75 1973 56.2 57.0 55.6
54.9 55.8 54.1
63.3 63.1 63.5
1976-80 1978 58.6 58.6 58.6
57.4 57.6 57.3
64.0 63.4 64.7
1981-85 1983 60.9 60.8 61.1
59.6 59.8 59.4
66.0 64.9 67.3
1986-90 1988 62.4 62.2 62.6
61.3 61.4 61.4
66.3 65.1 67.6
1987-91 1989 62.8 62.5 63.1
61.8 61.7 61.9
66.3 65.3 67.9
1988-92 1990 63.0 63.0 63.2
62.1 61.9 62.0
66.7 65.5 68.0
1989-93 1991 63.6 63.2 63.9
62.5 62.3 62.5
67.4 66.2 68.8
1990-94 1992 64.1 63.6 64.5
63.0 62.7 63.1
68.0 66.8 69.3
1991-95 1993 64.5 63.9 65.1
63.4 63.0 63.8
68.6 67.2 69.9
1992-96 1994 64.9 64.3 65.6
63.9 63.4 64.4
68.9 67.5 70.3
1993-97 1995 65.3 64.5 66.0
64.4 63.7 64.8
69.2 67.7 70.5
1994-98 1996 65.5 64.6 66.3
64.6 63.8 65.0
69.2 67.7 70.6
1995-99# 1997 65.5 64.7 66.3
64.6 64.0 65.3
68.7 67.4 70.2
1996-00# 1998 65.7 64.8 66.6
64.8 64.1 65.5
68.9 67.5 70.4
1997-01# 1999 66.0 65.0 67.1
65.1 64.2 66.1
69.2 67.8 70.8
1998-02 2000 66.5 65.4 67.7
65.6 64.6 66.7
69.6 68.2 71.3
1999-03 2001 67.0 65.8 68.4
66.1 65.0 67.4
70.1 68.6 71.8
2000-04 2002 67.5 66.2 68.9
66.6 65.4 68.0
70.3 68.8 72.0
2001-05 2003 67.8 66.4 69.3
66.9 65.6 68.3
70.5 68.9 72.3
2002-06 2004 68.1 66.7 69.6
67.2 65.9 68.7
70.7 69.0 72.6
2003-07 2005 68.2 66.8 69.9
67.4 66.0 68.9
70.8 69.1 72.7
2004-08 2006 68.4 66.9 70.0
67.6 66.1 69.2
70.7 69.0 72.6
2005-09 2007 68.5 66.9 70.2
67.7 66.2 69.3
70.8 69.1 72.8
2006-10 2008 68.7 67.1 70.5 67.8 66.3 69.6 71.1 69.4 73.0
2007-11 2009 69.0 67.3 70.9
68.2 66.4 70.0
71.5 69.7 73.5
2008-12 2010 69.3 67.6 71.3 68.5 66.7 70.4 71.9 70.1 73.9
2009-13 2011 69.7 67.9 71.7 68.8 67.0 70.8 72.4 70.6 74.3
2010-14 2012 70.0 68.3 71.9 69.0 67.3 70.9 72.6 71.0 74.4
2011-15 2013 70.3 68.7 72.1 69.3 67.7 71.1 72.9 71.3 74.7 * : India includes all States/UT’s #: India does not include Jammu & Kashmir

5
8. Statement 3 below gives the estimates of life expectancy at birth by sex and residence in
bigger States/UTs in the period 2011-15. Almost all the States have recorded a higher life
expectancy for females in 2011-15 both across the rural and urban areas. Kerala has recorded
the highest life expectancy at birth for males and females in rural areas where as Himachal
Pradesh has recorded the highest for males in urban areas and Jammu & Kashmir for female in
urban areas in 2011-15. The lowest life expectancy at birth has been recorded in the State of
Madhya Pradesh for rural males and Uttar Pradesh for rural females. In Urban, the lowest life
expectancy at birth has been recorded in Chhattisgarh & Uttar Pradesh for males and females
respectively during 2011-15.
Statement 3
Expectation of life at birth by sex and residence, India and bigger States/UTs, 2011-15, (e00)
India &
bigger States/UTs
Total
Rural
Urban
Total Male Female
Total Male Female
Total Male Female
India* 68.3 66.9 70.0
67.1 65.6 68.7
71.9 70.5 73.5
Andhra Pradesh 69.0 67.1 71.2
67.6 65.5 69.9
72.7 71.2 74.4
Assam 64.7 63.5 66.2
63.7 62.5 65.2
71.5 70.7 72.7
Bihar 68.4 68.5 68.3
68.1 68.2 67.9
71.4 71.1 71.7
Chhattisgarh 65.2 63.6 66.8
64.5 63.0 65.9
68.6 66.4 71.0
NCT of Delhi 73.8 72.5 75.4
71.4 69.5
74.1 72.8 75.6
Gujarat 69.1 66.9 71.6 67.6 64.8 70.8 71.5 70.1 73.0
Haryana 69.1 66.9 71.9 68.2 65.8 71.2 71.1 69.2 73.3
Himachal Pradesh 72.0 69.1 75.2 71.6 68.6 74.9 76.8 75.1 79.4
Jammu & Kashmir 73.2 71.2 76.1 72.2 70.4 74.9 76.6 73.9 80.2
Jharkhand 67.2 67.0 67.5
66.3 66.1 66.3
71.7 70.8 72.6
Karnataka 69.0 67.2 70.9
67.4 65.4 69.5
72.0 70.7 73.5
Kerala 75.2 72.2 78.2
75.1 71.9 78.4
75.4 72.9 77.7
Madhya Pradesh 64.8 63.2 66.5
63.5 62.0 65.4
69.4 67.7 71.2
Maharashtra 72.0 70.3 73.9
70.7 69.0 72.5
73.9 72.1 75.8
Odisha 66.9 65.6 68.3
66.2 64.9 67.7
70.8 69.7 71.8
Punjab 72.1 70.3 74.2
70.8 69.0 72.8
74.1 72.2 76.5
Rajasthan 67.9 65.7 70.4
67.0 64.6 69.8
71.1 69.5 72.8
Tamil Nadu 71.0 69.1 73.0
69.5 67.6 71.6
72.8 71.0 74.7
Uttar Pradesh 64.5 63.4 65.6
63.6 62.5 64.8
68.1 67.3 68.8
Uttrakhand 71.8 68.9 74.9
71.1 67.8 74.7
74.1 72.7 75.5
West Bengal 70.5 69.4 71.8 69.6 68.3 70.9 72.7 71.7 73.9 * : India includes all States/UT’s
Note: Andhra Pradesh includes Telangana.
6
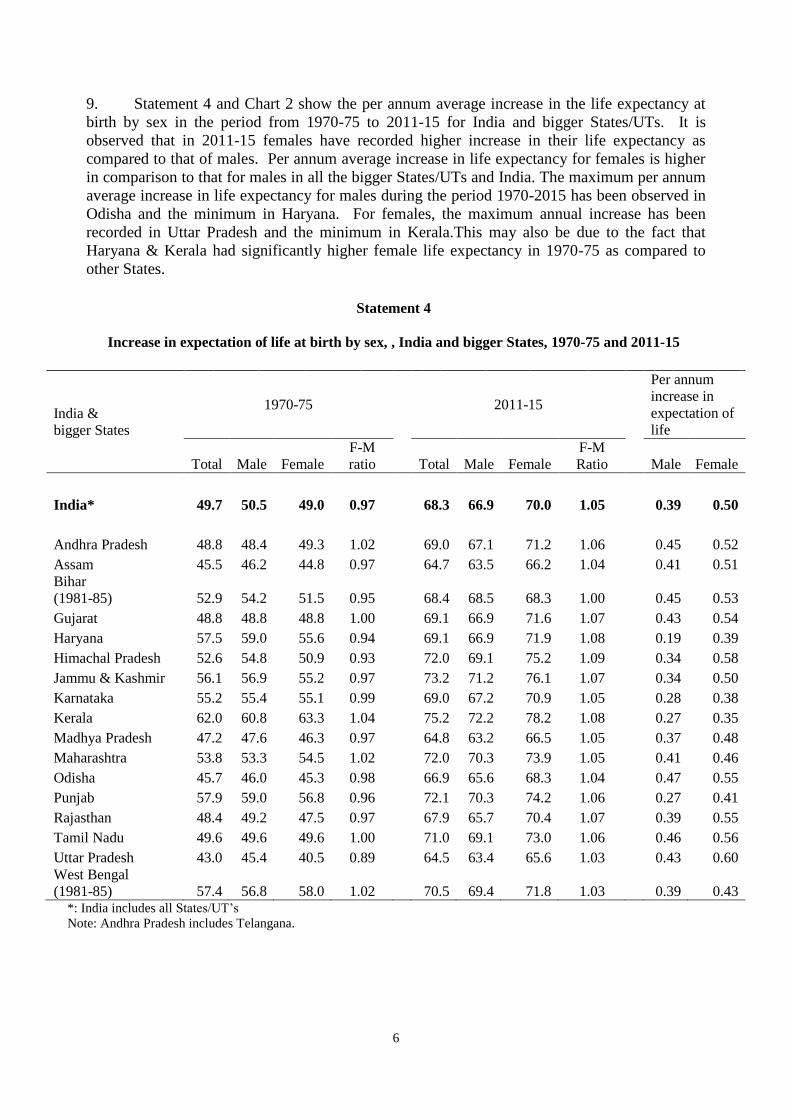
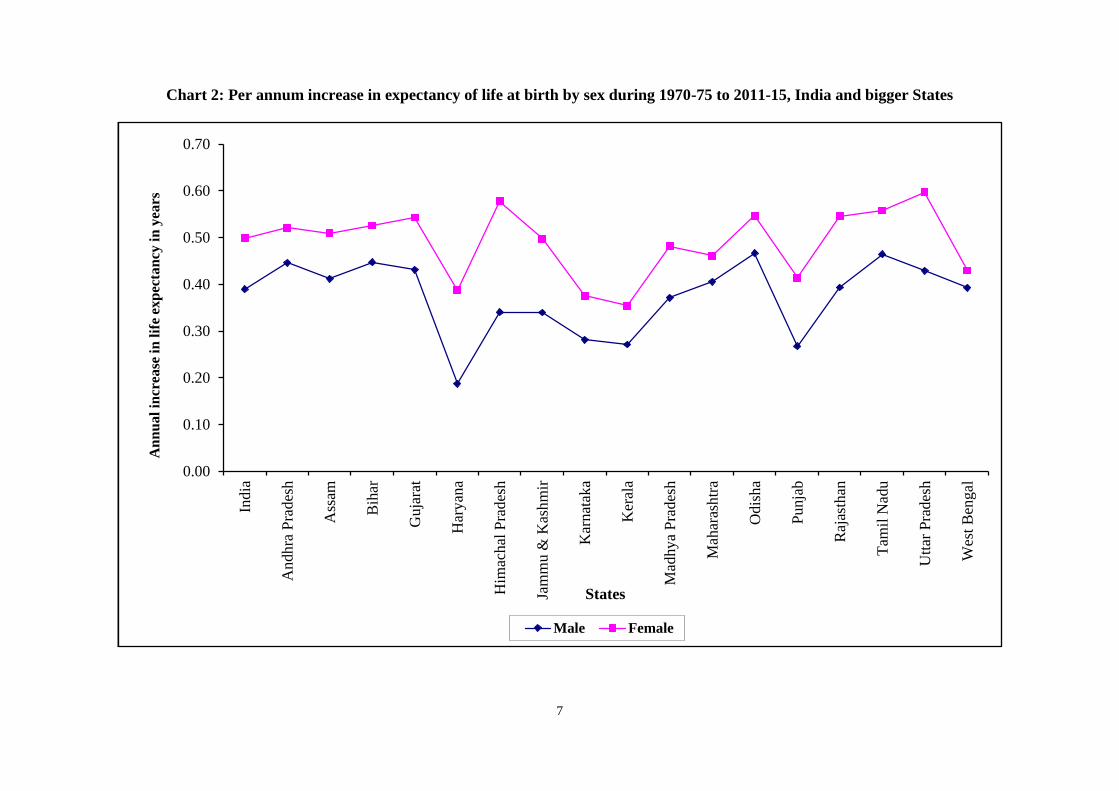
9. Statement 4 and Chart 2 show the per annum average increase in the life expectancy at
birth by sex in the period from 1970-75 to 2011-15 for India and bigger States/UTs. It is
observed that in 2011-15 females have recorded higher increase in their life expectancy as
compared to that of males. Per annum average increase in life expectancy for females is higher
in comparison to that for males in all the bigger States/UTs and India. The maximum per annum
average increase in life expectancy for males during the period 1970-2015 has been observed in
Odisha and the minimum in Haryana. For females, the maximum annual increase has been
recorded in Uttar Pradesh and the minimum in Kerala.This may also be due to the fact that
Haryana & Kerala had significantly higher female life expectancy in 1970-75 as compared to
other States.
Statement 4
Increase in expectation of life at birth by sex, , India and bigger States, 1970-75 and 2011-15
India &
bigger States
1970-75
2011-15
Per annum
increase in
expectation of
life
Total Male Female
F-M
ratio Total Male Female
F-M
Ratio Male Female
India* 49.7 50.5 49.0 0.97
68.3 66.9 70.0 1.05
0.39 0.50
Andhra Pradesh 48.8 48.4 49.3 1.02 69.0 67.1 71.2 1.06 0.45 0.52
Assam 45.5 46.2 44.8 0.97 64.7 63.5 66.2 1.04 0.41 0.51
Bihar
(1981-85) 52.9 54.2 51.5 0.95 68.4 68.5 68.3 1.00 0.45 0.53
Gujarat 48.8 48.8 48.8 1.00 69.1 66.9 71.6 1.07 0.43 0.54
Haryana 57.5 59.0 55.6 0.94 69.1 66.9 71.9 1.08 0.19 0.39
Himachal Pradesh 52.6 54.8 50.9 0.93 72.0 69.1 75.2 1.09 0.34 0.58
Jammu & Kashmir 56.1 56.9 55.2 0.97 73.2 71.2 76.1 1.07 0.34 0.50
Karnataka 55.2 55.4 55.1 0.99 69.0 67.2 70.9 1.05 0.28 0.38
Kerala 62.0 60.8 63.3 1.04 75.2 72.2 78.2 1.08 0.27 0.35
Madhya Pradesh 47.2 47.6 46.3 0.97 64.8 63.2 66.5 1.05 0.37 0.48
Maharashtra 53.8 53.3 54.5 1.02 72.0 70.3 73.9 1.05 0.41 0.46
Odisha 45.7 46.0 45.3 0.98 66.9 65.6 68.3 1.04 0.47 0.55
Punjab 57.9 59.0 56.8 0.96 72.1 70.3 74.2 1.06 0.27 0.41
Rajasthan 48.4 49.2 47.5 0.97 67.9 65.7 70.4 1.07 0.39 0.55
Tamil Nadu 49.6 49.6 49.6 1.00 71.0 69.1 73.0 1.06 0.46 0.56
Uttar Pradesh 43.0 45.4 40.5 0.89 64.5 63.4 65.6 1.03 0.43 0.60
West Bengal
(1981-85) 57.4 56.8 58.0 1.02 70.5 69.4 71.8 1.03 0.39 0.43 *: India includes all States/UT’s
Note: Andhra Pradesh includes Telangana.
7
Chart 2: Per annum increase in expectancy of life at birth by sex during 1970-75 to 2011-15, India and bigger States
0.00
0.10
0.20
0.30
0.40
0.50
0.60
0.70
Ind
ia
An
dh
ra P
rad
esh
Ass
am
Bih
ar
Gu
jara
t
Har
yan
a
Him
ach
al P
rad
esh
Jam
mu
& K
ash
mir
Kar
nat
aka
Ker
ala
Mad
hy
a P
rad
esh
Mah
aras
htr
a
Od
ish
a
Pu
nja
b
Raj
asth
an
Tam
il N
adu
Utt
ar P
rad
esh
Wes
t B
eng
al
An
nu
al
incr
ease
in
lif
e ex
pec
tan
cy i
n y
ears
States
Male Female
8
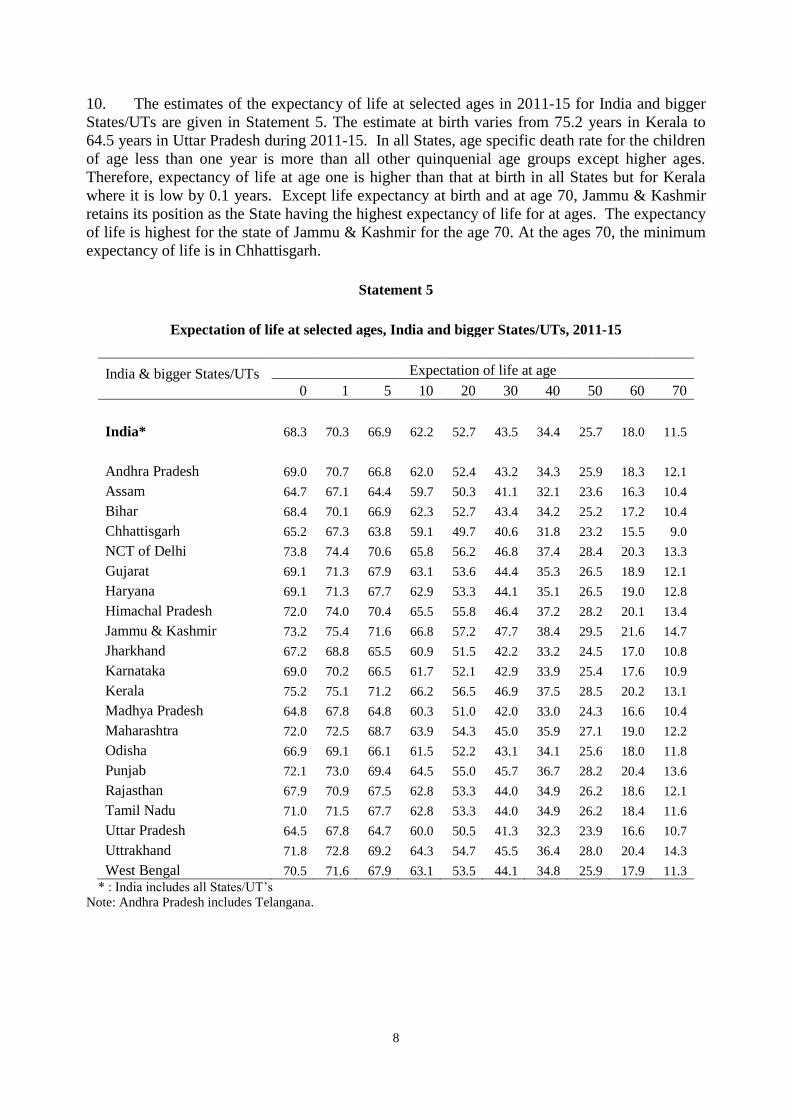
10. The estimates of the expectancy of life at selected ages in 2011-15 for India and bigger
States/UTs are given in Statement 5. The estimate at birth varies from 75.2 years in Kerala to
64.5 years in Uttar Pradesh during 2011-15. In all States, age specific death rate for the children
of age less than one year is more than all other quinquenial age groups except higher ages.
Therefore, expectancy of life at age one is higher than that at birth in all States but for Kerala
where it is low by 0.1 years. Except life expectancy at birth and at age 70, Jammu & Kashmir
retains its position as the State having the highest expectancy of life for at ages. The expectancy
of life is highest for the state of Jammu & Kashmir for the age 70. At the ages 70, the minimum
expectancy of life is in Chhattisgarh.
Statement 5
Expectation of life at selected ages, India and bigger States/UTs, 2011-15
India & bigger States/UTs
Expectation of life at age
0 1 5 10 20 30 40 50 60 70
India* 68.3 70.3 66.9 62.2 52.7 43.5 34.4 25.7 18.0 11.5
Andhra Pradesh 69.0 70.7 66.8 62.0 52.4 43.2 34.3 25.9 18.3 12.1
Assam 64.7 67.1 64.4 59.7 50.3 41.1 32.1 23.6 16.3 10.4
Bihar 68.4 70.1 66.9 62.3 52.7 43.4 34.2 25.2 17.2 10.4
Chhattisgarh 65.2 67.3 63.8 59.1 49.7 40.6 31.8 23.2 15.5 9.0
NCT of Delhi 73.8 74.4 70.6 65.8 56.2 46.8 37.4 28.4 20.3 13.3
Gujarat 69.1 71.3 67.9 63.1 53.6 44.4 35.3 26.5 18.9 12.1
Haryana 69.1 71.3 67.7 62.9 53.3 44.1 35.1 26.5 19.0 12.8
Himachal Pradesh 72.0 74.0 70.4 65.5 55.8 46.4 37.2 28.2 20.1 13.4
Jammu & Kashmir 73.2 75.4 71.6 66.8 57.2 47.7 38.4 29.5 21.6 14.7
Jharkhand 67.2 68.8 65.5 60.9 51.5 42.2 33.2 24.5 17.0 10.8
Karnataka 69.0 70.2 66.5 61.7 52.1 42.9 33.9 25.4 17.6 10.9
Kerala 75.2 75.1 71.2 66.2 56.5 46.9 37.5 28.5 20.2 13.1
Madhya Pradesh 64.8 67.8 64.8 60.3 51.0 42.0 33.0 24.3 16.6 10.4
Maharashtra 72.0 72.5 68.7 63.9 54.3 45.0 35.9 27.1 19.0 12.2
Odisha 66.9 69.1 66.1 61.5 52.2 43.1 34.1 25.6 18.0 11.8
Punjab 72.1 73.0 69.4 64.5 55.0 45.7 36.7 28.2 20.4 13.6
Rajasthan 67.9 70.9 67.5 62.8 53.3 44.0 34.9 26.2 18.6 12.1
Tamil Nadu 71.0 71.5 67.7 62.8 53.3 44.0 34.9 26.2 18.4 11.6
Uttar Pradesh 64.5 67.8 64.7 60.0 50.5 41.3 32.3 23.9 16.6 10.7
Uttrakhand 71.8 72.8 69.2 64.3 54.7 45.5 36.4 28.0 20.4 14.3
West Bengal 70.5 71.6 67.9 63.1 53.5 44.1 34.8 25.9 17.9 11.3
* : India includes all States/UT’s
Note: Andhra Pradesh includes Telangana.
9
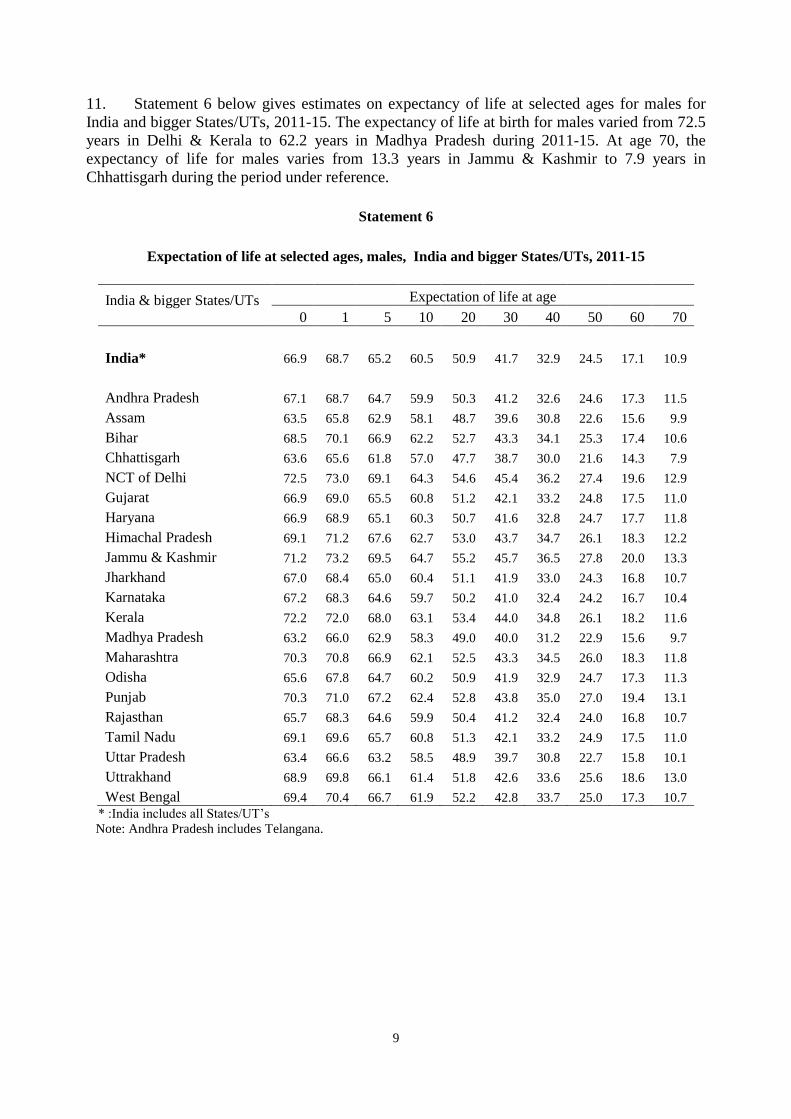
11. Statement 6 below gives estimates on expectancy of life at selected ages for males for
India and bigger States/UTs, 2011-15. The expectancy of life at birth for males varied from 72.5
years in Delhi & Kerala to 62.2 years in Madhya Pradesh during 2011-15. At age 70, the
expectancy of life for males varies from 13.3 years in Jammu & Kashmir to 7.9 years in
Chhattisgarh during the period under reference.
Statement 6
Expectation of life at selected ages, males, India and bigger States/UTs, 2011-15
India & bigger States/UTs
Expectation of life at age
0 1 5 10 20 30 40 50 60 70
India* 66.9 68.7 65.2 60.5 50.9 41.7 32.9 24.5 17.1 10.9
Andhra Pradesh 67.1 68.7 64.7 59.9 50.3 41.2 32.6 24.6 17.3 11.5
Assam 63.5 65.8 62.9 58.1 48.7 39.6 30.8 22.6 15.6 9.9
Bihar 68.5 70.1 66.9 62.2 52.7 43.3 34.1 25.3 17.4 10.6
Chhattisgarh 63.6 65.6 61.8 57.0 47.7 38.7 30.0 21.6 14.3 7.9
NCT of Delhi 72.5 73.0 69.1 64.3 54.6 45.4 36.2 27.4 19.6 12.9
Gujarat 66.9 69.0 65.5 60.8 51.2 42.1 33.2 24.8 17.5 11.0
Haryana 66.9 68.9 65.1 60.3 50.7 41.6 32.8 24.7 17.7 11.8
Himachal Pradesh 69.1 71.2 67.6 62.7 53.0 43.7 34.7 26.1 18.3 12.2
Jammu & Kashmir 71.2 73.2 69.5 64.7 55.2 45.7 36.5 27.8 20.0 13.3
Jharkhand 67.0 68.4 65.0 60.4 51.1 41.9 33.0 24.3 16.8 10.7
Karnataka 67.2 68.3 64.6 59.7 50.2 41.0 32.4 24.2 16.7 10.4
Kerala 72.2 72.0 68.0 63.1 53.4 44.0 34.8 26.1 18.2 11.6
Madhya Pradesh 63.2 66.0 62.9 58.3 49.0 40.0 31.2 22.9 15.6 9.7
Maharashtra 70.3 70.8 66.9 62.1 52.5 43.3 34.5 26.0 18.3 11.8
Odisha 65.6 67.8 64.7 60.2 50.9 41.9 32.9 24.7 17.3 11.3
Punjab 70.3 71.0 67.2 62.4 52.8 43.8 35.0 27.0 19.4 13.1
Rajasthan 65.7 68.3 64.6 59.9 50.4 41.2 32.4 24.0 16.8 10.7
Tamil Nadu 69.1 69.6 65.7 60.8 51.3 42.1 33.2 24.9 17.5 11.0
Uttar Pradesh 63.4 66.6 63.2 58.5 48.9 39.7 30.8 22.7 15.8 10.1
Uttrakhand 68.9 69.8 66.1 61.4 51.8 42.6 33.6 25.6 18.6 13.0
West Bengal 69.4 70.4 66.7 61.9 52.2 42.8 33.7 25.0 17.3 10.7
* :India includes all States/UT’s
Note: Andhra Pradesh includes Telangana.

10
12. The expectancy of life at selected ages for females in Statement 7 indicates that the
highest expectancy of life at birth 78.2 years in 2011-15 has been reported in Kerala and the
lowest 65.6 in Uttar Pradesh. At age 70, the variation in expectancy of life has been from 17.2
years in Jammu & Kashmir to 10.0 years in Chhattisgarh in 2011-15. The expectancy of life at
different ages by sex at the national level during 2011-15 is presented in Chart 3. The graph
clearly indicates that the expectancy of life for the female is higher than male at all the selected
ages in the period 2011-15.
Statement 7
Expectation of life at selected ages, females, India and bigger States/UTs, 2011-15
India & bigger States/UTs
Expectation of life at age
0 1 5 10 20 30 40 50 60 70
India* 70.0 72.1 68.9 64.1 54.7 45.3 36.0 27.0 18.9 12.2
Andhra Pradesh 71.2 73.0 69.2 64.4 54.8 45.4 36.2 27.4 19.4 12.9
Assam 66.2 68.7 66.3 61.7 52.2 43.0 33.8 24.9 17.3 11.0
Bihar 68.3 70.1 67.0 62.3 52.8 43.5 34.2 25.1 17.0 10.2
Chhattisgarh 66.8 69.0 65.9 61.2 51.8 42.7 33.6 24.8 16.8 10.0
NCT of Delhi 75.4 76.1 72.4 67.5 58.0 48.5 38.9 29.6 21.1 13.6
Gujarat 71.6 73.9 70.6 65.8 56.3 47.0 37.6 28.4 20.4 13.3
Haryana 71.9 74.3 70.9 66.1 56.6 47.2 37.8 28.7 20.5 14.0
Himachal Pradesh 75.2 77.0 73.4 68.6 59.0 49.4 39.8 30.6 22.1 14.6
Jammu & Kashmir 76.1 78.5 74.7 69.9 60.3 50.6 41.2 32.2 24.1 17.2
Jharkhand 67.5 69.1 66.1 61.5 51.9 42.6 33.5 24.6 17.1 10.9
Karnataka 70.9 72.3 68.6 63.8 54.2 44.8 35.5 26.6 18.5 11.4
Kerala 78.2 78.2 74.3 69.3 59.5 49.8 40.2 30.9 22.1 14.3
Madhya Pradesh 66.5 69.8 67.1 62.5 53.3 44.3 35.0 26.0 17.8 11.1
Maharashtra 73.9 74.5 70.7 65.8 56.2 46.7 37.4 28.3 19.7 12.6
Odisha 68.3 70.7 67.7 63.0 53.7 44.5 35.4 26.6 18.7 12.4
Punjab 74.2 75.2 71.8 66.9 57.4 47.9 38.6 29.6 21.4 14.1
Rajasthan 70.4 73.8 70.8 66.2 56.6 47.2 37.8 28.7 20.5 13.5
Tamil Nadu 73.0 73.6 69.8 65.0 55.5 46.1 36.7 27.7 19.3 12.2
Uttar Pradesh 65.6 69.2 66.3 61.7 52.2 43.1 34.0 25.2 17.5 11.3
Uttrakhand 74.9 76.1 72.5 67.6 58.0 48.7 39.4 30.5 22.3 15.5
West Bengal 71.8 73.0 69.3 64.5 55.0 45.6 36.1 26.9 18.7 12.0
* : India includes all States/UT’s
Note: Andhra Pradesh includes Telangana.

11
Chart 3: Expectancy of life at birth and conditional life expectancy at
Selected ages by sex, India, 2011-15
0.0
10.0
20.0
30.0
40.0
50.0
60.0
70.0
80.0
0 10 20 30 40 50 60 70 80 90
Lif
e ex
pec
tan
cy i
n y
ears
Age
Male Female
12
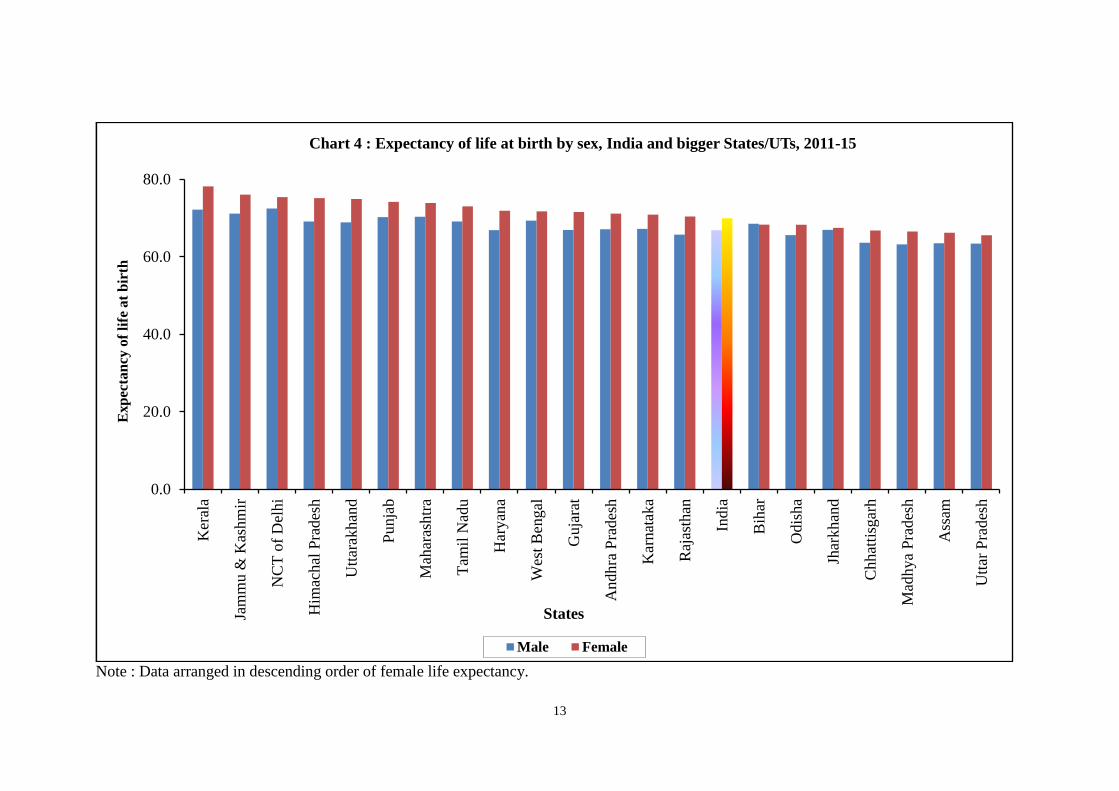
13. The expectancy of life at birth, infancy, childhood and retiring age (60 years) has been
graphically presented in Chart 4 to 7 by sex for India and bigger States/UTs. To improve
readability, all charts have been depicted in descending order of female expectancy of life.
Chart 4 presents State level expectancy of life at birth for males and females during 2011-15.
The female life expectancy at birth is higher than males in all the States except Bihar. The
female life expectancy at birth is highest in the State of Kerala followed by Jammu & Kashmir
and Delhi whereas it is the lowest for Uttar Pradesh preceded by Assam and Madhya Pradesh in
that order.
14. Chart 5 gives graphical presentation of expectancy of life at infancy (age 1) during 2011-15
for India and bigger States/UTs separately for males and females. In general, the expectancy of
life at age 1 is higher than that at birth. The expectancy of life for female after attaining the age
of 1 is higher than that of males in all the States. The female life expectancy at infancy is the
highest in the State of Jammu & Kashmir followed by Kerala and Himachal Pradesh whereas it
is the lowest for Assam preceded by Chhattisgarh and Jharkhand in that order.
15. The State-wise expectancy of life at childhood (age 5) separately for males and females
is presented in Chart 6. The female expectancy of life at childhood is higher than males for all
bigger States/UTs. The female life expectancy at childhood is highest in the State of Jammu &
Kashmir followed by Kerala and Himachal Pradesh whereas it is lowest for Chhattisgarh
preceded by Jharkhand and Assam in that order. It has been observed that the first two positions
in terms of female expectancy of life at birth, infancy and childhood have been occupied by
Kerala and Jammu & Kashmir whereas the last place is taken by Uttar Pradesh and Assam at
birth, and Assam and Chhattisgarh at infancy and Chhattisgarh and Jharkhand for childhood life
expectancy.
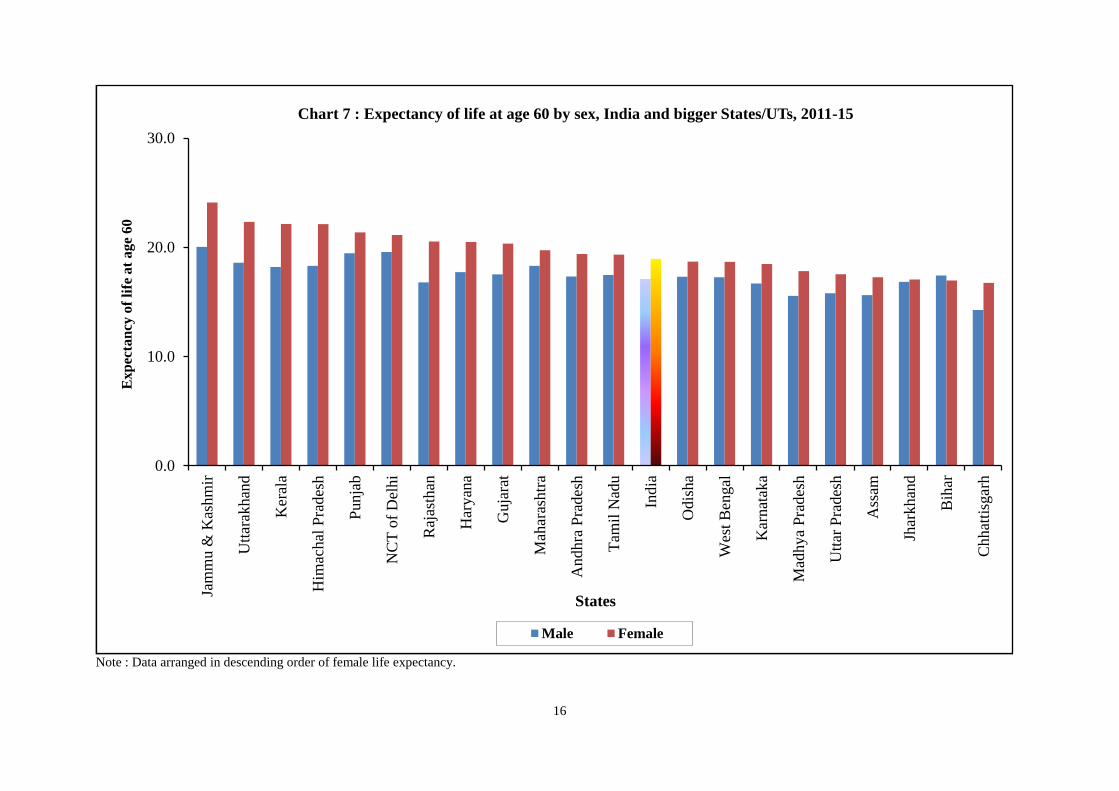
16. Chart 7 gives graphical presentation of expectancy of life at retiring age (age 60) during
2011-15 for India and bigger States/UTs separately for males and females. The female
expectancy of life at age 60 is also higher than that of males in all the bigger States/UTs. The
female life expectancy at age 60 is highest in the State of Jammu & Kashmir followed by
Uttarakhand and Kerala whereas it is the lowest for Chhattisgarh preceded by Jharkhand and
Bihar in that order. The inter-se position of States in terms of expectancy of life at age 60 differs
than that at younger ages. At age 60, Jammu & Kashmir and Uttarakhand exceed Kerala, which
occupies the first position in ranking the expectancy of life at birth. Even at age 60, the
expectancy of life differs significantly by sex and from State to State.
13
Note : Data arranged in descending order of female life expectancy.
0.0
20.0
40.0
60.0
80.0
Ker
ala
Jam
mu &
Kas
hm
ir
NC
T o
f D
elhi
Him
achal
Pra
des
h
Utt
arak
han
d
Punja
b
Mah
aras
htr
a
Tam
il N
adu
Har
yan
a
Wes
t B
engal
Guja
rat
Andhra
Pra
des
h
Kar
nat
aka
Raj
asth
an
India
Bih
ar
Odis
ha
Jhar
khan
d
Chhat
tisg
arh
Mad
hya
Pra
des
h
Ass
am
Utt
ar P
rades
h
Exp
ecta
ncy
of
life
at
bir
th
States
Chart 4 : Expectancy of life at birth by sex, India and bigger States/UTs, 2011-15
Male Female

14
Note : Data arranged in descending order of female life expectancy.
0.0
20.0
40.0
60.0
80.0
Jam
mu &
Kas
hm
ir
Ker
ala
Him
achal
Pra
des
h
NC
T o
f D
elhi
Utt
arak
han
d
Punja
b
Mah
aras
htr
a
Har
yan
a
Guja
rat
Raj
asth
an
Tam
il N
adu
Wes
t B
engal
Andhra
Pra
des
h
Kar
nat
aka
India
Odis
ha
Bih
ar
Mad
hya
Pra
des
h
Utt
ar P
rades
h
Jhar
khan
d
Chhat
tisg
arh
Ass
am
Exp
ecta
ncy
of
life
at
age
1
States
Chart 5 : Expectancy of life at age 1 by sex, India and bigger Sates/UTs, 2011-15
Male Female

15
Note : Data arranged in descending order of female life expectancy.
0.0
20.0
40.0
60.0
80.0
Jam
mu &
Kas
hm
ir
Ker
ala
Him
achal
Pra
des
h
Utt
arak
han
d
NC
T o
f D
elhi
Punja
b
Har
yan
a
Raj
asth
an
Mah
aras
htr
a
Guja
rat
Tam
il N
adu
Wes
t B
engal
Andhra
Pra
des
h
India
Kar
nat
aka
Odis
ha
Mad
hya
Pra
des
h
Bih
ar
Utt
ar P
rades
h
Ass
am
Jhar
khan
d
Chhat
tisg
arh
Exp
ecta
ncy
of
life
at
age
5
States
Chart 6 : Expectancy of life at age 5 by sex, India and bigger States/UTs, 2011-15
Male Female
16
Note : Data arranged in descending order of female life expectancy.
0.0
10.0
20.0
30.0
Jam
mu &
Kas
hm
ir
Utt
arak
han
d
Ker
ala
Him
achal
Pra
des
h
Punja
b
NC
T o
f D
elhi
Raj
asth
an
Har
yan
a
Guja
rat
Mah
aras
htr
a
Andhra
Pra
des
h
Tam
il N
adu
India
Odis
ha
Wes
t B
engal
Kar
nat
aka
Mad
hya
Pra
des
h
Utt
ar P
rades
h
Ass
am
Jhar
khan
d
Bih
ar
Chhat
tisg
arh
Exp
ecta
ncy
of
life
at
age
60
States
Chart 7 : Expectancy of life at age 60 by sex, India and bigger States/UTs, 2011-15
Male Female

17
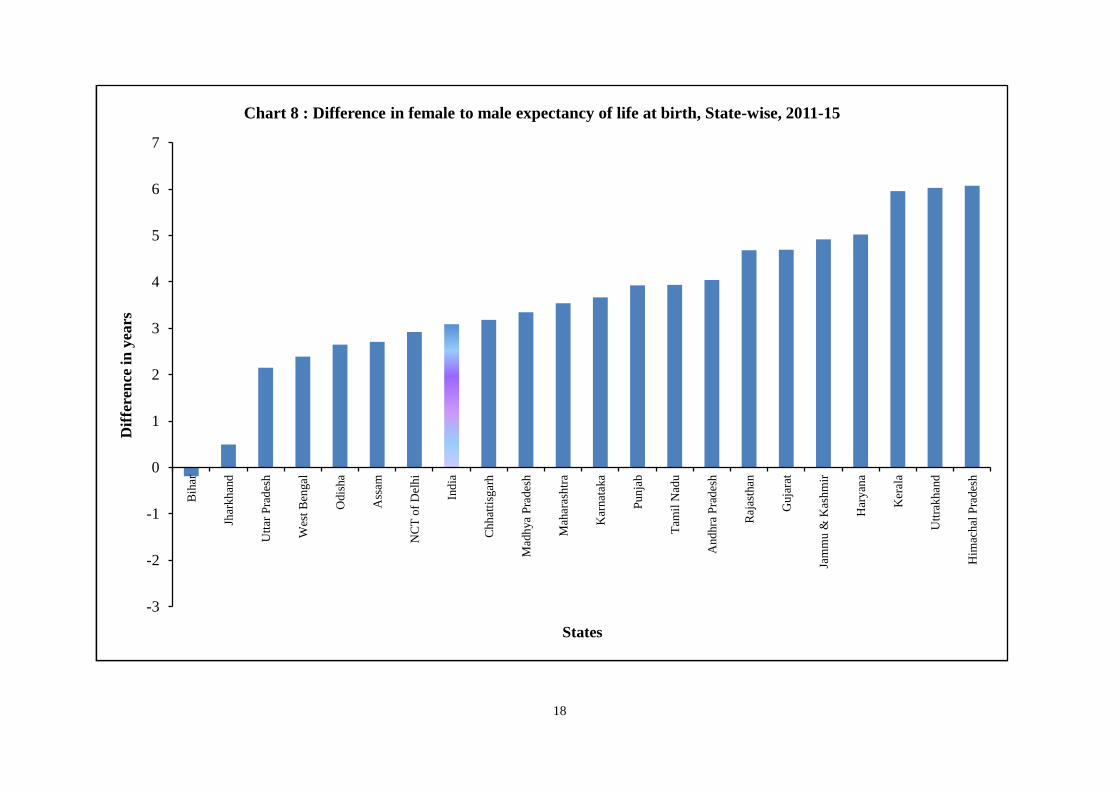
17. The State-wise variation in estimated life expectancy at birth by sex during 2011-15 is
presented in Chart 8. Seven out of twenty one States fall below all-India difference (3.1)
between female and male life expectancy at birth, whereas the remaining fourteen States are
above it with Chhattisgarh & Madhya Pradesh registering the lowest and Himachal Pradesh the
highest gap respectively. Kerala has reported significantly higher life expectancy at birth for
female child as compared to the male child.
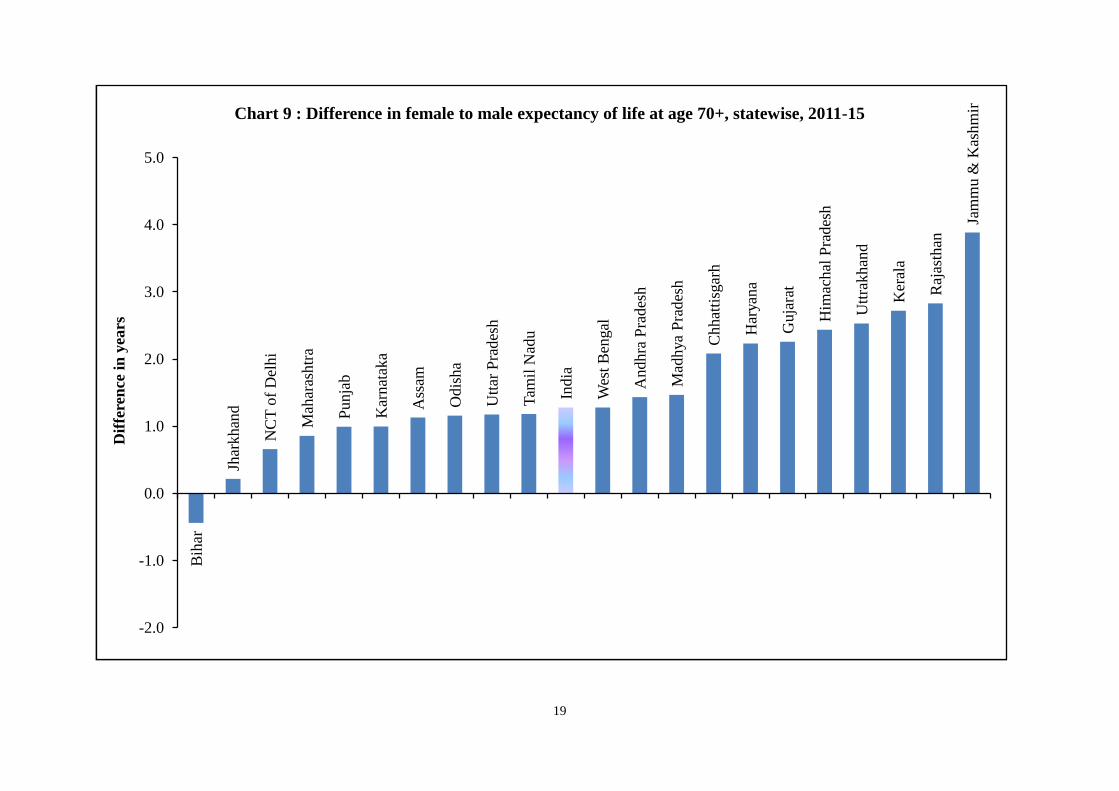
18. The State-wise female-male gap in life expectancy at age 70 during 2011-15 is presented
in Chart 9. Jammu & Kashmir has registered the highest favorable gap of 3.9 years, whereas the
lowest gap of 0.2 years has been reported for the state of Jharkhand.
18
-3
-2
-1
0
1
2
3
4
5
6
7
Bih
ar
Jhar
kh
and
Utt
ar P
rad
esh
Wes
t B
engal
Odis
ha
Ass
am
NC
T o
f D
elh
i
Ind
ia
Ch
hat
tisg
arh
Mad
hya
Pra
des
h
Mah
aras
htr
a
Kar
nat
aka
Pun
jab
Tam
il N
adu
And
hra
Pra
des
h
Raj
asth
an
Guja
rat
Jam
mu
& K
ash
mir
Har
yan
a
Ker
ala
Utt
rak
han
d
Him
ach
al P
rades
h
Dif
fere
nce
in
yea
rs
States
Chart 8 : Difference in female to male expectancy of life at birth, State-wise, 2011-15
19
Bih
ar
Jhar
khan
d
NC
T o
f D
elhi
Mah
aras
htr
a
Punja
b
Kar
nat
aka
Ass
am
Odis
ha
Utt
ar P
rades
h
Tam
il N
adu
India
Wes
t B
engal
Andhra
Pra
des
h
Mad
hya
Pra
des
h
Chhat
tisg
arh
Har
yan
a
Guja
rat
Him
achal
Pra
des
h
Utt
rakhan
d
Ker
ala
Raj
asth
an
Jam
mu &
Kas
hm
ir
-2.0
-1.0
0.0
1.0
2.0
3.0
4.0
5.0
Dif
fere
nce
in
yea
rs
Chart 9 : Difference in female to male expectancy of life at age 70+, statewise, 2011-15
Related Documents
![Xlr8 presentation k_akers_aug 2011 v3 abridged [compatibility mode]](https://static.cupdf.com/doc/110x72/54953a8eb47959c91c8b488f/xlr8-presentation-kakersaug-2011-v3-abridged-compatibility-mode.jpg)