MATHEMATICAL MODELING OF MICROSHRINKAGE FORMATION DURING SOLIDIFICATION OF A356 ALLOY CASTINGS by AKASH HIMANGSHU PATEL LAURENTIU NASTAC, COMMITTEE CHAIR NAGY EL-KADDAH MARK WEAVER BRIAN JORDAN A THESIS Submitted in partial fulfillment of the requirements for the degree of Master of Science in the Department of Metallurgical and Materials Engineering in the Graduate School of The University of Alabama TUSCALOOSA, ALABAMA 2013

Welcome message from author
This document is posted to help you gain knowledge. Please leave a comment to let me know what you think about it! Share it to your friends and learn new things together.
Transcript

MATHEMATICAL MODELING OF MICROSHRINKAGE
FORMATION DURING SOLIDIFICATION OF
A356 ALLOY CASTINGS
by
AKASH HIMANGSHU PATEL
LAURENTIU NASTAC, COMMITTEE CHAIR
NAGY EL-KADDAH
MARK WEAVER
BRIAN JORDAN
A THESIS
Submitted in partial fulfillment of the requirements for
the degree of Master of Science in the Department
of Metallurgical and Materials Engineering
in the Graduate School of
The University of Alabama
TUSCALOOSA, ALABAMA
2013

Copyright Akash Himangshu Patel 2013
ALL RIGHTS RESERVED

ii
ABSTRACT
Significant efforts have been made by materials scientists and metallurgists to understand
the underlying physics involved in solidification of aluminum alloys to predict a variety of
casting defects. Shrinkage porosity is one of the most important types of casting defects.
Addressing porosity has been a formidable challenge due to many contributing (and interacting)
phenomena responsible for its formation and growth. Shrinkage porosity occurs by nucleation
and growth phenomena. Very few previous models for shrinkage prediction consider the pore
formation based on a nucleation and growth basis. Several models that can predict micro
shrinkage in castings were revised in detail.
The main purpose of this study was to develop a comprehensive model which can predict
micro-shrinkage pores that are forming during solidification of A356 castings. The model
utilizes a stochastic approach and takes into consideration the Niyama criterion as well as the
nucleation potential for formation of pores. Therefore, it can predict the random nature of pore
formation during casting solidification. Correlations between the predictions and the pore
amount were developed. For this model, literature validation was provided for an A356 alloy
plate casting. Further validation was performed for a bar geometry cast in a silica sand mold.
The model predictions match reasonably well with the experimental pore distribution profile.
iii
LIST OF ABBREVIATIONS AND SYMBOLS
SDAS Secondary Dendrite Arm Spacing
P Metal pressure
Dynamic viscosity of liquid
g Gravity vector
liq Density of liquid melt
mzK Permeability of mushy zone
stP Metallostatic pressure
shrP Negative pressure due to resistance to shrinkage induced flow through fixed
dendrite skeleton
β Shrinkage ratio
rfeed Radius of the cylindrical feeding channel
L Length of the mushy zone
ς Thermal function
ξ Tortuosity factor
km Thermal conductivity of mold
ρm Density of mold
cm Specific heat of mold
ρ Density of melt
ΔH Latent heat of fusion
Tf Liquidus temperature

iv
To Room temperature
V/A Casting modulus
GT Thermal gradient
fs Fraction solid
Ny Niyama criterion
crNy Threshold Niyama criterion
Geometric parameter for feeding
SLT Solidification interval
Sk Thermal conductivity of solid
Ct Solidification time for center of plate
l Half the thickness of plate
*Ny Dimensionless Niyama criterion
G Thermal gradient
Secondary dendrite arm spacing
Critical pressure drop for stable pore to exist
Cooling rate
Freezing range
Dynamic viscosity of liquid
Dimensionless number
Liquid volume fraction
Final pore volume fraction
Pe Local pressure in melt
v
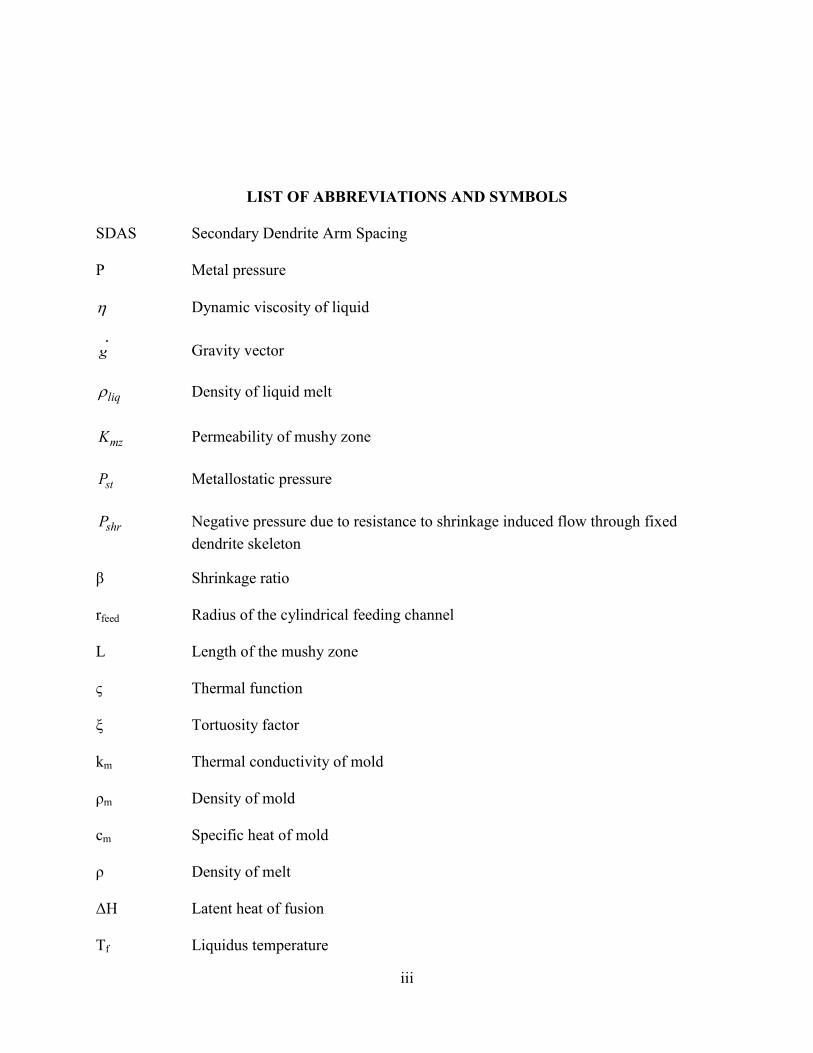
V Volume of bubble
A Area of liquid-gas interface
γ Interfacial energy per unit area
Pi Pressure from the interior of bubble
∆P* Critical pressure difference to form a pore
We Weber number
Fr Froude number
Number of entrapped oxides resulted from the collision
, Parameters depending on alloy composition
Collision surface area
, Velocity of the free surfaces
Average surface area of the broken oxides
Surface area of the broken oxide film
Distance of oxide movement
Tensor of pulse flow velocity
Kinematic viscosity
Normal vector to the solid surface
Volume fraction of solid phase
Volume fraction of liquid phase
Volume fraction of empty phase
Temporal evolution of density of solid phase
Temporal evolution of density of liquid phases
Concentrations of the ith
alloy component in solid phases

vi
Concentrations of the ith
alloy component in liquid phases
Specific heat of solids as a function of time
Specific heat of liquid as a function of time
Heat conduction coefficient with respect to time
Crystallization heat of alloy
Nucleation probability
N Total amount of oxides
n Local amount of oxides

vii
ACKNOWLEDGEMENTS
It is my privilege being related to Professor Laurentiu Nastac, the only person without
which this thesis would not have been possible. He has helped me walk my first steps in
Metallurgical Engineering, made me understand the different perspectives related to the subject,
improved my vision and provided guidance for my research. I appreciate all his efforts behind
me and am grateful to him for being my guru in the truest sense.
I would like to acknowledge my friend Mohammad Farooq for helping me out in writing
the code for the proposed model.
I would like to express my gratitude to Robert Fanning and my colleagues and friends,
Xiaoda Liu and Shian Jia for their continuous support and for being with me during almost every
experiment I performed.
I would like to thank my father who in spite of having finance background could
understand what I was trying to do and also for being the person with whom I could discuss apart
from my advisor. His criticism at every stage of my research had forced me to think beyond
ideas available in literature.
Finally, I would also like to thank my mother, brother and my little sister for their never-
ending love and support.

viii
CONTENTS
ABSTRACT .................................................................................................................................... ii
LIST OF ABBREVIATIONS AND SYMBOLS .......................................................................... iii
ACKNOWLEDGEMENTS .......................................................................................................... vii
LIST OF TABLES ...........................................................................................................................x
LIST OF FIGURES ....................................................................................................................... xi
1.0 INTRODUCTION .....................................................................................................................1
1.1 Motivation ..................................................................................................................................2
1.2 Main Objectives .........................................................................................................................3
2.0 LITERATURE REVIEW ..........................................................................................................5
2.1 Porosity Types ...........................................................................................................................5
2.2 General Shrinkage Behavior ......................................................................................................5
2.3 Feeding Mechanisms for Shrinkage Porosity ............................................................................8
2.4 Review of Criterion Functions .................................................................................................10
2.5 Dimensionless Numbers ..........................................................................................................25
2.6 Review on Modeling of Oxide Films.......................................................................................27
3.0 DESCRIPTION OF NUMERICAL MODEL .........................................................................29
3.1 Novaflow Model [76] ..............................................................................................................29
3.2 Novasolid Model [76] ..............................................................................................................30
3.3 Pore Nucleation Model ............................................................................................................32
4.0 RESULTS AND DISCUSSION ..............................................................................................35

ix
4.1 Simulation Results ...................................................................................................................35
4.2 Experimental Results ...............................................................................................................42
5.0 CONCLUDING REMARKS AND FUTURE WORK ...........................................................48
REFERENCES ..............................................................................................................................50
x
LIST OF TABLES
Table I: Solidification shrinkage for some metals [5] .....................................................................7
Table II: Fracture Pressure for liquids [5] ......................................................................................20
Table III: Simulation Parameters ..................................................................................................40

xi
LIST OF FIGURES
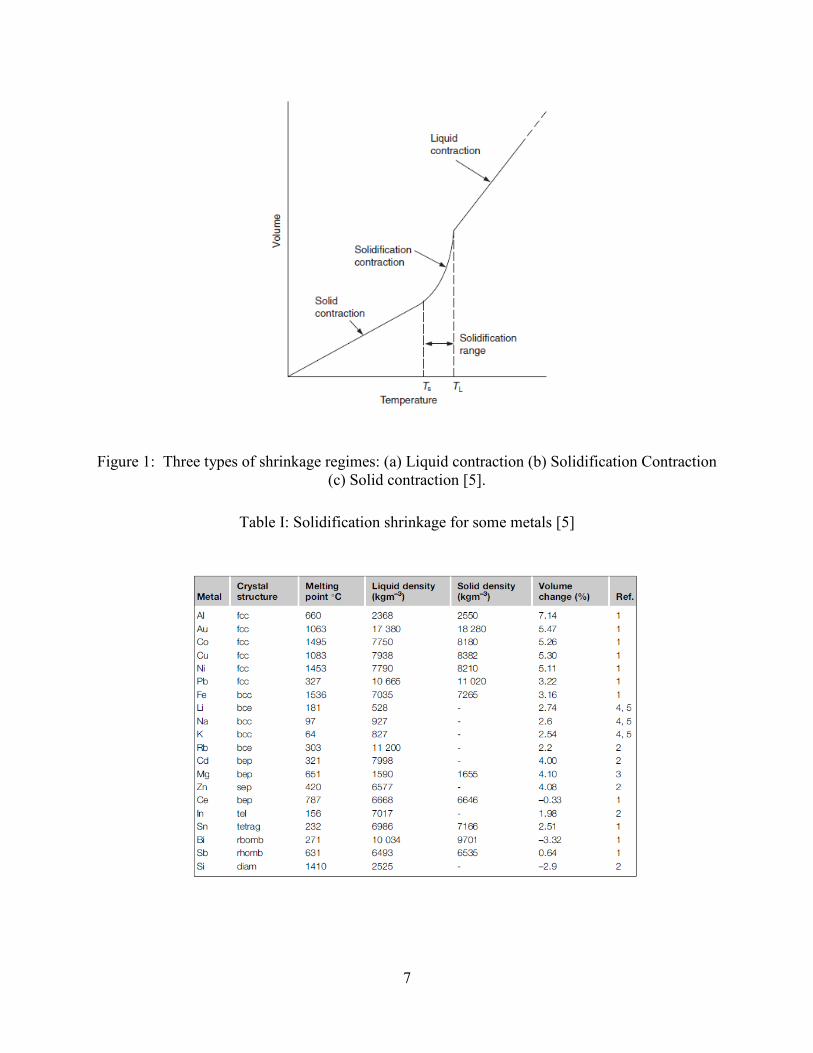
Figure 1: Three types of shrinkage regimes: (a) Liquid contraction (b) Solidification
Contraction (c) Solid contraction [5]. ............................................................................................. 7
Figure 2: Five feeding mechanisms in a solidifying casting [5]. ................................................... 8
Figure 3: Pore location based on thermal gradient and plate thickness (T) [26]. ........................ 12
Figure 4: Schematic illustration of geometric model by Sigworth and Wang [45] ...................... 14
Figure 5: Schemetic diagram of mushy zone solidifying with constant temperature
gradient, G and isotherm velocity, R [42]. .................................................................................... 16
Figure 6: Ellingham Diagram referring to the tendency of aluminum to oxidize [68]. ............... 21
Figure 7: (a) Effect of 1% of alloying element on aluminum at 800 oC (b) Growth
of pure aluminum in a flow of oxygen, dry and moist air [5, 50]. ................................................ 23
Figure 8: Formation of bifilm AB and bubbles CD creating bubble trails [5]. ........................... 24
Figure 9: Smoke simulation showing the increase in amount of surface turbulence [55]. .......... 25
Figure 10: Computer simulation of excess free surface of melt as a function of
gate velocity [1] ............................................................................................................................ 26
Figure 11: Geometry of a pore in contact with a solid surface. .................................................... 32
Figure 12: Flowchart for Matlab code .......................................................................................... 34
Figure 13: Modulus profile of for the 12.5 mm thickness cast A 356mm plate. .......................... 35
Figure 14: Solidification time profile for the 12.5 mm thickness cast A356 plate. ...................... 36
Figure 15: Profile for Niyama values for the cast A356 plate at 3% solid fraction. ..................... 36
Figure 16: Niyama plot shown from the top view of the A356 plate at 3% solid fraction. .......... 37
Figure 17: Shrinkage contraction plot in the cast the A356 plate. ................................................ 37
Figure 18: Distribution of oxides in the cast A356 plate. ............................................................. 38

xii
Figure 19: Measurement location for shrinkage prediction [30]. ................................................. 38
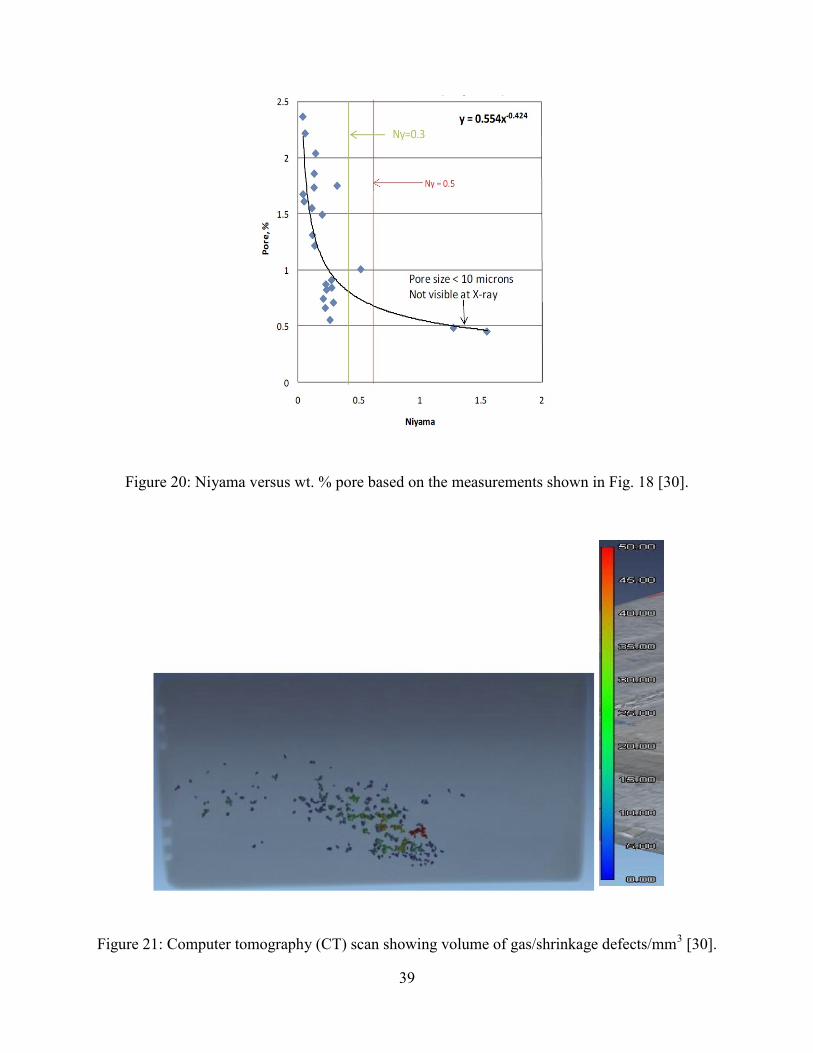
Figure 20: Niyama versus wt. % pore based on the measurements shown in Fig. 18 [30]. ......... 39
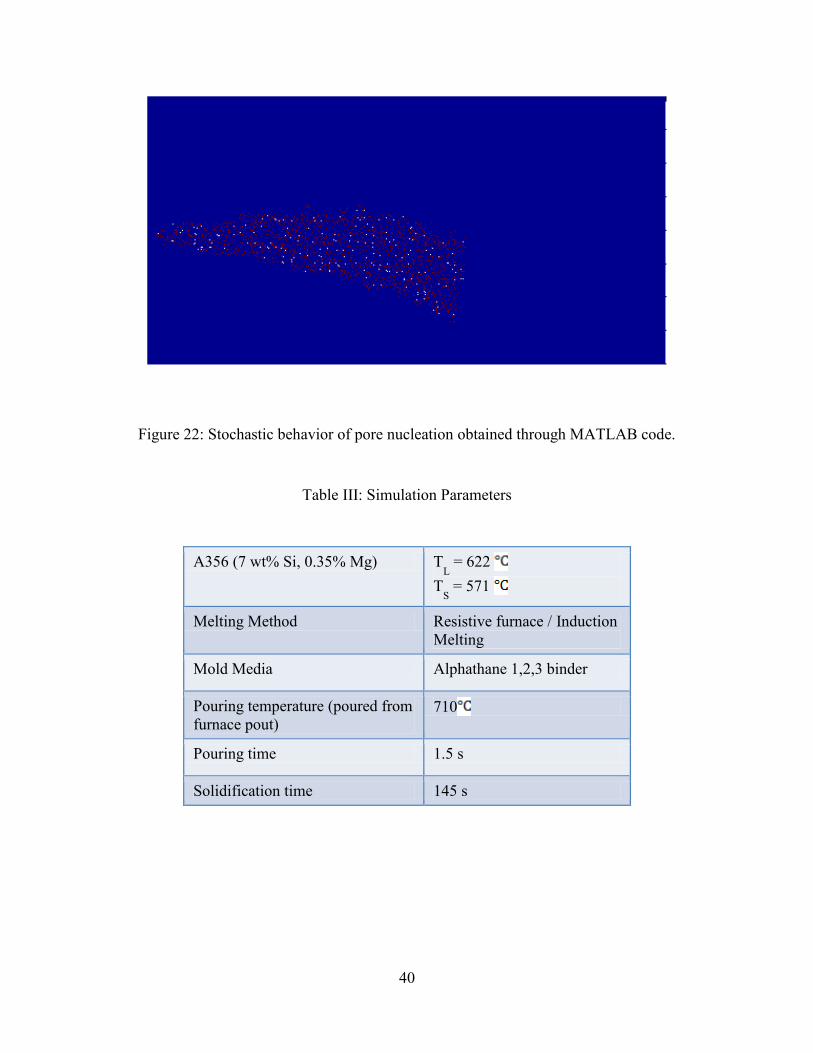
Figure 21: Computer tomography (CT) scan showing volume of gas/shrinkage
defects/mm3 [30] ........................................................................................................................... 39
Figure 22: Stochastic behavior of pore nucleation obtained through MATLAB code. ................ 40
Figure 23: Solidification time plot in the 20 mm×20 mmA356 bar geometry. ........................... 41
Figure 24: Niyama plot in the 20 mm×20 mm A356 bar geometry at 3% solid fraction. ........... 41
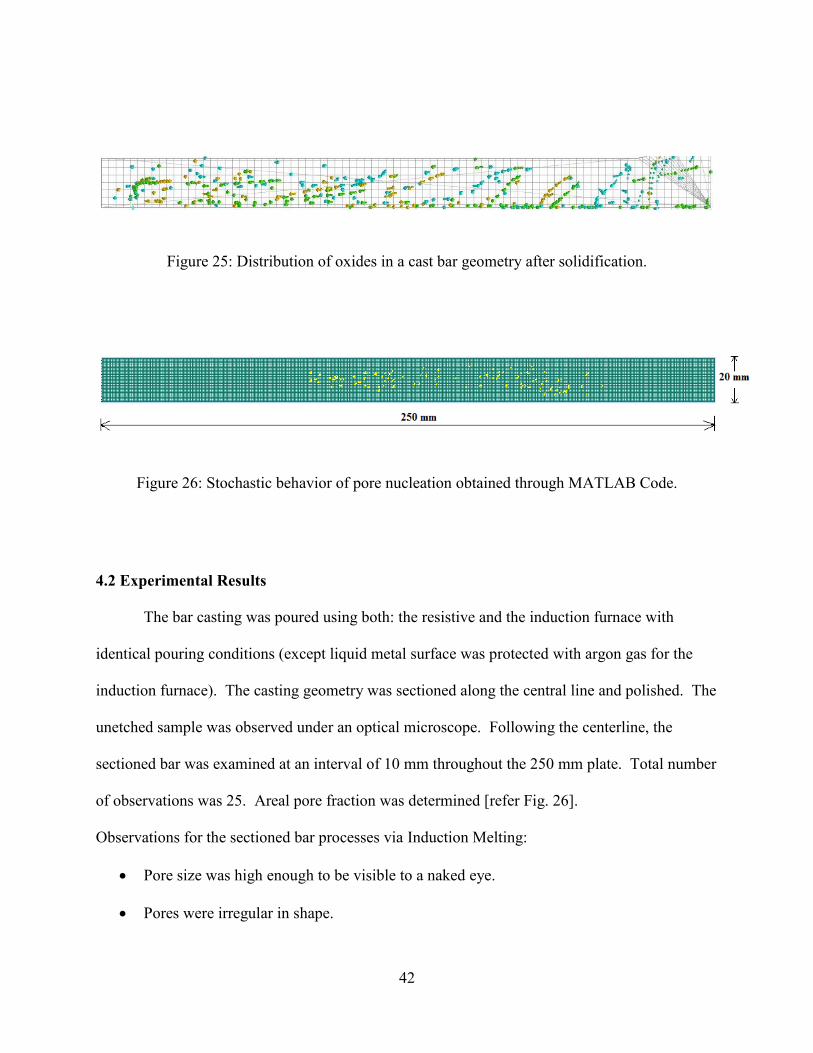
Figure 25: Distribution of oxides in a cast bar geometry after solidification. .............................. 42
Figure 26: Stochastic behavior of pore nucleation obtained through MATLAB Code. ............... 42
Figure 27: Areal pore % observed at different metallographic cross-sections of the bar. ............ 44
Figure 28: Effect of Niyama criterion on pore percentage. .......................................................... 44
Figure 29: Comparing pore size with SDAS at an interval of 10 mm along the centerline
of bar ............................................................................................................................................. 45
Figure 30: Typical examples of micro-shrinkage observed on metallographic
cross-sections at: (a) 210 mm, (b) 230 mm, (c) 170 mm (d) 150 mm and (e) 140 mm
from end of the plate. ................................................................................................................... 47
1
1.0 INTRODUCTION
Porosity is one of the most important types of casting defect. Addressing porosity has
been a formidable challenge due to many contributing (and interacting) phenomena responsible
for its formation and growth. There are many types of porosity [1], but the most severe is
microporosity. Micro-pores act as local stress concentrators and crack initiation sites thereby
negating the mechanical properties, especially on ductility and fatigue life. There are two main
causes for formation of microporosity in castings: (a) shrinkage porosity due to volume change
upon solidification combined with restricted flow during mushy zone region. (b) gas porosity
caused by dissolved gases which condense upon solidification due to solubility difference of
such in gases in liquid and solid media [2].
Significant effort has been made by materials scientists and metallurgists to understand
the underlying physics involved in solidification of aluminum alloys to predict a variety of
casting defects. These phenomena include restricted fluid flow in the solidifying metal, pore
nucleation, soluble gas partitioning between the liquid and solid including its diffusion to pores
and interaction of the pores with developing microstructure [3]. The objective of this thesis is to
review the relevant literature models and develop a numerical model to predict shrinkage
porosities and test the same on plate and bar geometries of A356 castings.
The cooling of metal from its pouring to solidification temperature is accompanied by
density changes that induce motion of liquid metal in the volume of the casting. Stokes equation
can be used for calculating metal pressure before dendrite coherency point. Beyond this point,

2
Darcy Law of flow through porous media can be applied. Their equations are as follows,
respectively:
2 liqP V g [1]
liqmz
P V gK
[2]
Catalina et al. recently developed a simple model for calculating liquid metal pressure
based on only density changes during solidification without the need to find the superficial
velocity vector [4]. Their model does not account for the heterogeneous nucleation and
growth kinetics of the shrinkage pores as well as pressure change due to the formation of gas
pores.
1.1 Motivation
Porosity occurs by nucleation and growth phenomena. Very few previous models for
shrinkage prediction consider the pore formation based on nucleation and growth basis. If the
metal is exceptionally clean, i.e. without inclusions it is very difficult to nucleate a pore by
homogenous nucleation. Strength of liquid metals is almost as high as that of solid metals with
liquid metals being close-packed random structures whereas solid metals being regular close-
packed structures. Non-metallic inclusions are potentially the weakest part of liquid metal (refer
to Table II). Therefore, heterogeneous pore nucleation is more active in presence of non-metallic

3
inclusions like compounds of oxygen, sulphur, phosphorous or other nuclei which do not wet
very well with the melt [5].
Presence of inclusions like oxides greatly increases the propensity of porosity formation
in aluminum castings [6-10]. Along with thermal conditions, negative pressure for shrinkage
pore formation there also exists a need of oxide nuclei (or other non-wetting inclusion) to create
a pore. In my previous work on steel castings, there were often pores randomly generated in
regions less susceptible to pore formation possibly due to oxide. So, our intention was to track
the oxides generated and transported through fluid flow, trace them at the end of solidification
and couple this information with the already well accepted Niyama criterion. In the later part of
my research work, fundamental research on oxide formation, entrainment and growth appeared
to me as equally important if not less than that to study pore formation. Not all non-metallic
inclusions promote pore formation. Inclusions like borides, carbides and nitrides, which wet very
well with melt act as grain refiners instead of nucleation site for pore formation. Wetting
becomes very important to study because of the fact that nano-sized aluminum oxide (Al2O3)
particles are used to obtain grain refinement and reduction of porosity in Aluminum Metal
Matrix Nano Composite (MMNC) [11, 12, 13].
1.2 Main Objectives
The main objectives of this fundamental research are as follows:
(1) To review the already existing criterion for predicting shrinkage.
(2) To modify the Niyama criterion for pore prediction and develop a stochastic model to
predict the randomized shrinkage pore formation in an A356 alloy based on the
principles of heterogeneous nucleation.

4
(3) To validate this model for casting geometries (bars and plates) produced through the
gravity-sand (silica sand) casting process.
The thesis is presented in the following sequence: chapter II provides a literature review,
chapter III will present the model description, chapter IV will present and discuss in detail the
modeling results and chapter V will present the conclusions and recommended future work.
5
2.0 LITERATURE REVIEW
2.1 Porosity Types
The porosity types can be defined based on the following:
Size:
Macro-shrinkage: Such porosity is visible to the naked eye (bigger than 1 mm).
Micro-shrinkage: Such porosity ranges on the scale of microns to less than 1 mm.
Cause:
Shrinkage: Resulting from density difference between solid and liquid phases
Gas: hydrogen is the major contributor of gas shrinkage in aluminum castings [14]
Due to solubility difference in solubility of gas in liquid and solid phase
Precipitated from solution of bifilms during solidification
Entrainment due to surface turbulence
Mechanically blown into the melt (eg. Core blow) [14]
2.2 General Shrinkage Behavior
Molten metal occupies considerably more volume than the solidified castings. Metal
contracts at three different rates when cooling from its liquid state (addition of liquidus
temperature and the amount of superheat) to room temperature [14].
(a) Liquid Contraction: As temperature reduces, first contraction is observed in liquid
state. Such contraction is not troublesome because the extra liquid metal required to
6
compensate for this small reduction in volume is provided without difficulty resulting
in a slight fall in level in the feeder.
(b) Solidification Contraction: This contraction is a result of density difference between
melt at solidus and liquidus temperature. Solidification shrinkage for some metals is
shown in Table I. This contraction causes several issues including:
Requirement for ‘feeding’ which allows for compensation of contraction
during solidification.
‘Shrinkage porosity’ resulting from improper feeding mechanism.
(c) Solid Contraction: Cooling from solidus temperature to room temperature results into
metal contraction. Problems associated with such contraction includes:
Patternmakers allowance or contraction allowance needs to be considered into
casting design which is difficult to quantify.
Mold constraint during solid contraction may lead to localized defects like hot
tearing or cracking.
7
Figure 1: Three types of shrinkage regimes: (a) Liquid contraction (b) Solidification Contraction
(c) Solid contraction [5].
Table I: Solidification shrinkage for some metals [5]

8
2.3 Feeding Mechanisms for Shrinkage Porosity
As freezing liquid contracts to form solid, internal pressure may fall far enough to
become negative. Such negative pressure differentials provide the driving force for initiation and
growth of volume defects such as porosity and surface sinks on castings. There are five feeding
mechanisms leading to reduction in hydrostatic tension [15]. A more recent study by Dahle et al.
confirms this hypothesis [16, 17].
Figure 2: Five feeding mechanisms in a solidifying casting [5].
Liquid Feeding: Since liquid metal has low viscosity (near to that of water) this mechanism
works effectively at negligibly small pressure gradients. Skin-forming alloys such as pure metals
and eutectics will have a smooth solidification front resulting in a smooth shrinkage pipe and this
9
mechanism is the only form of feeding mechanism. Long freezing range alloys will solidify
solidified in the form of a mesh of dendrites and hence interdendritic feeding becomes more
crucial compared to liquid feeding.
Mass Feeding: Feeding occurs by such mechanism when volume fraction of solid reaches
between 0 and 50%, depending on the pressure differential driving the flow and percentage of
dendrites free from points of attachments to the casting wall.
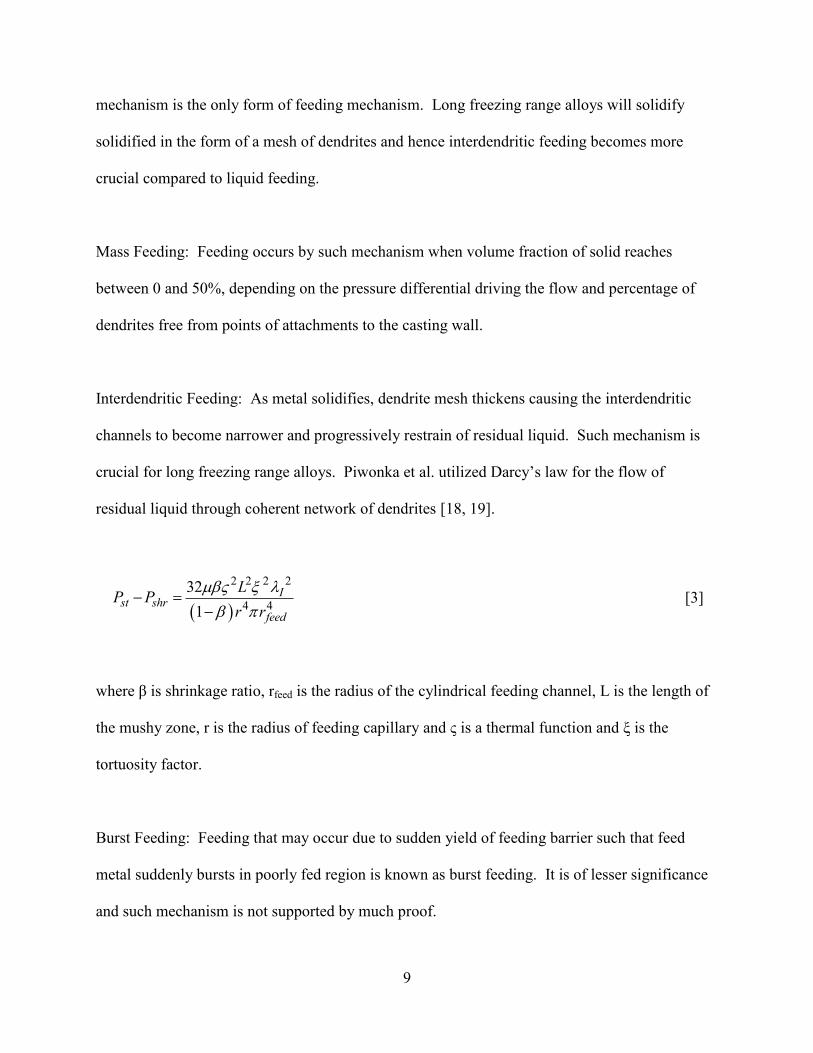
Interdendritic Feeding: As metal solidifies, dendrite mesh thickens causing the interdendritic
channels to become narrower and progressively restrain of residual liquid. Such mechanism is
crucial for long freezing range alloys. Piwonka et al. utilized Darcy’s law for the flow of
residual liquid through coherent network of dendrites [18, 19].
2 2 2 2
4 4
32
1
Ist shr
feed
LP P
r r
[3]
where β is shrinkage ratio, rfeed is the radius of the cylindrical feeding channel, L is the length of
the mushy zone, r is the radius of feeding capillary and ς is a thermal function and ξ is the
tortuosity factor.
Burst Feeding: Feeding that may occur due to sudden yield of feeding barrier such that feed
metal suddenly bursts in poorly fed region is known as burst feeding. It is of lesser significance
and such mechanism is not supported by much proof.

10
Solid Feeding: It describes the condition when a region of casting has been isolated from feed
liquid supply. As the residual liquid freezes it progressively occupies lesser space. There are two
options to account for this space. One alternative is to grow as a shrinkage or gas pore and the
other option is for the solid shell of casting to collapse inwards under internal reduced pressure,
making up for the volume deficit. Solid feeding therefore relives hydrostatic tensile stress built
up by inward flow of the solid. If yield stress of solid shell is low as in aluminum alloys, then
solid feeding is much dominant compared to steels.
2.4 Review of Criterion Functions
The mathematical complexity of the numerical models for shrinkage porosity prediction
and lack of reliable and repeatable experimental database [20] have led a number of researchers
to develop simpler analytical equations termed as “Criterion Functions” to predict regions of the
casting with maximum probability of defects. Criterion functions are simple empirical rules that
relate local conditions (e.g., cooling rate, thermal gradient, solidification velocity, etc.) in order
to predict defects [19]. Berry, Spittle and their respective coworkers have reviewed certain of
the existing criteria proposed [21, 22].
Chvorinov’s Criterion: Chvorinov (1940) proposed a famous feeding criterion function to avoid
shrinkage in casting. According to this criterion, the feeder must solidify after the casting.
Solidification time was based modulus (total volume / total cooling surface area) of the casting
based on 1-D heat transport across mold-metal interface [23].

11
2 21 H
4f
m m m f o
Vt
k c T T A
[4]
where tf is solidification time, km is thermal conductivity of mold, ρm is density of mold, cm is
specific heat of mold, ρ is density of melt, ΔH is latent heat of fusion, Tf is liquidus temperature,
To is room temperature and V/A is modulus of the casting.
Limitations: This modulus based criterion may only be used as a rough approximation as it does
not consider the shape factor (good thing is its size independent) and orientation of casting
compared to the feeder.
Pellini Criterion: Pellini (1953) formulated a criterion which states that a shrinkage defect may
occur in a region where the thermal gradient is smaller than a critical value, GT < GTcr
, at the end
of solidification (when fs = 1 or fs < fscr
). Based on experimentation on carbon steels in green
sand molds he related feeding distance (L) to section thickness of plates (T). He concluded that
plates castings are free from pores along the length of (provided that alloy is well degassed) 2.5T
due to chilling effect of casting edge and remaining 2.0T due to the feeder [24, 25].

12
Figure 3: Pore location based on thermal gradient and plate thickness (T) [26].
Limitations:
Hansen and Sahm (1988) pointed out that the critical thermal gradient to avoid shrinkage
porosity in a steel bar is five to ten times more than that required for a plate geometry.
Critical thermal gradient in a cylindrical steel casting depends on its diameter. Hence, this
criterion cannot work for all geometries [27].

13
Kubo and Pehlke (1985) developed a theoretical model which was in agreement with
Pellini’s results for steel castings, but not for Al-4.5Cualloy [28]. Therefore, it changes
for different alloy systems and so more sophisticated models were necessary to predict
shrinkage.
Niyama Criterion: Niyama et al. (1982) elaborated on Pellini’s idea developing a new criterion
for low-carbon steel castings. They used Darcy’s law in cylindrical coordinates to relate fluid
velocity to pressure drop in the mushy zone, Carman-Kozeny model to calculate permeability of
the mushy zone, assumed no gas fraction gp (no gas pore) and expressed pressure drop in the
mushy zone as an inverse of 2
/
tG
dT dt.
Niyama value is computed as follows:
/
tGNydT dt
; crNy Ny [5]
where Gt is the thermal gradient and dT/dt is the cooling rate. Based on his experiments, Niyama
stated that the shrinkage defects are more susceptible to occur in casting locations where Ny is
less than some critical Niyama value (Nycr) which is alloy dependent [29]. Critical Niyama
value (or threshold Niyama value) for steels is 1 K1/2
s1/2
mm-1
. There is much experimental
validation of Niyama criterion to prove its validity and applicability [29 – 35].

14
Advantages:
Cooling rate and gradient are easy to determine in the casting. Hence this criterion can be
applied with ease
Experimentally proven for steel alloys
Limitations:
Threshold Niyama value (Nycr) is alloy dependent. Experimental validation of this
threshold value is required before using it for alloy systems other than steels
Does not provide pore size and pore distribution
It does not lend any insight into the nucleation and growth of pores
Geometric Model by Sigworth and Wang: Sigworth and Wang proposed a “geometric” model of
the solidification process as shown in Figure 1 which represents schematically the cross section
of a solidifying plate casting. The dark area in the center of the plate represents the tapered
liquid pool. They determined the critical thermal gradient as a function of the angle of inner
feeding channel inside the casting, θ required to avoid micro-shrinkage [36].
Figure 4: Schematic illustration of geometric model by Sigworth and Wang [45]
15
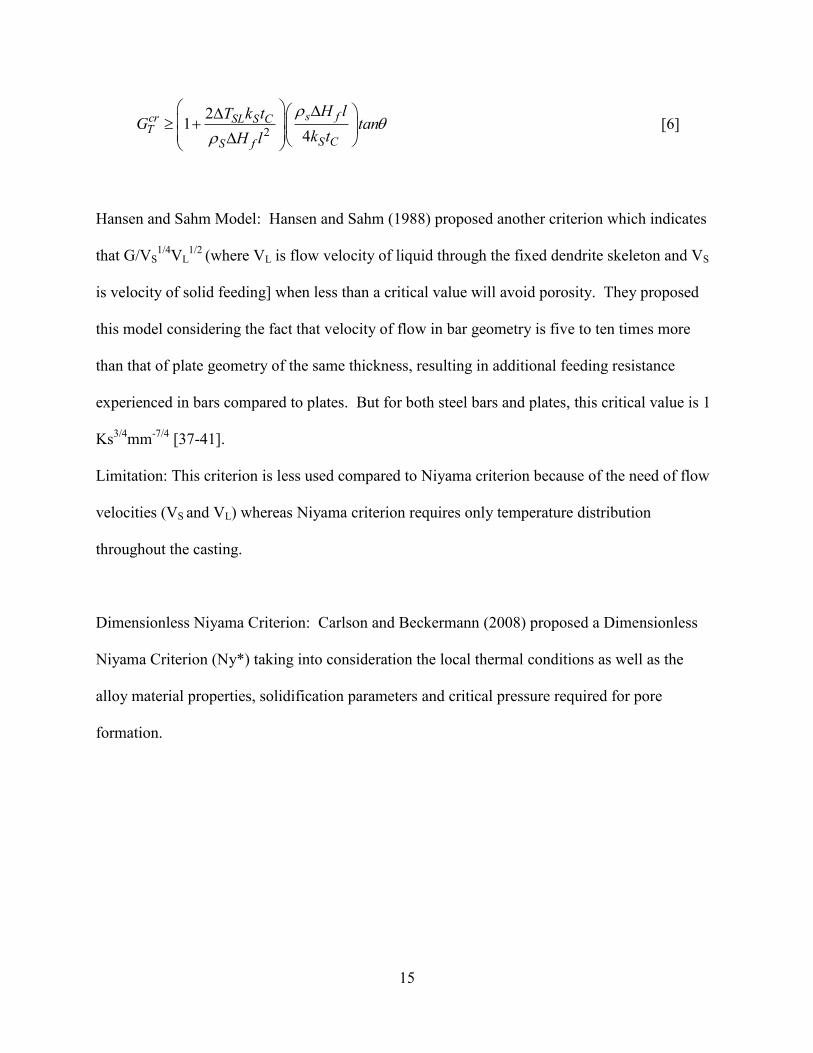
2
21
4
s fcr SL S CT
S CS f
H lT k tG tan
k tH l
[6]
Hansen and Sahm Model: Hansen and Sahm (1988) proposed another criterion which indicates
that G/VS1/4
VL1/2
(where VL is flow velocity of liquid through the fixed dendrite skeleton and VS
is velocity of solid feeding] when less than a critical value will avoid porosity. They proposed
this model considering the fact that velocity of flow in bar geometry is five to ten times more
than that of plate geometry of the same thickness, resulting in additional feeding resistance
experienced in bars compared to plates. But for both steel bars and plates, this critical value is 1
Ks3/4
mm-7/4
[37-41].
Limitation: This criterion is less used compared to Niyama criterion because of the need of flow
velocities (VS and VL) whereas Niyama criterion requires only temperature distribution
throughout the casting.
Dimensionless Niyama Criterion: Carlson and Beckermann (2008) proposed a Dimensionless
Niyama Criterion (Ny*) taking into consideration the local thermal conditions as well as the
alloy material properties, solidification parameters and critical pressure required for pore
formation.

16
Figure 5: Schemetic diagram of mushy zone solidifying with constant temperature gradient, G
and isotherm velocity, R [42].
The solver uses the following equations to calculate Ny*:
2 *
cr
f l
G PNy
T T µ
=2
cr
f l
PNy
T µ
=
,( )l crI g [7]
where
17
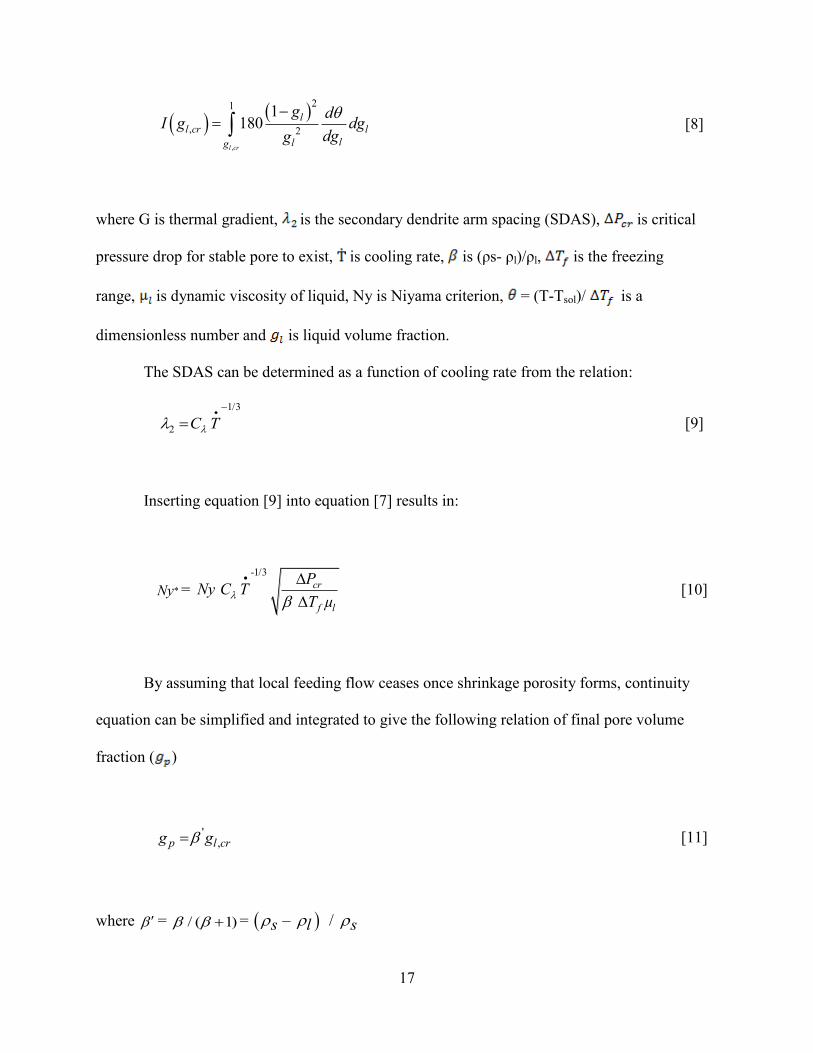
,
21
, 2
1 180
l cr
ll cr l
llg
g dI g dg
dgg
[8]
where G is thermal gradient, is the secondary dendrite arm spacing (SDAS), is critical
pressure drop for stable pore to exist, is cooling rate, is (ρs- ρl)/ρl, is the freezing
range, is dynamic viscosity of liquid, Ny is Niyama criterion, = (T-Tsol)/ is a
dimensionless number and is liquid volume fraction.
The SDAS can be determined as a function of cooling rate from the relation:
1/3
2 .TC
[9]
Inserting equation [9] into equation [7] results in:
* Ny =
-1/3
.cr
f l
PN
T µTy C
[10]
By assuming that local feeding flow ceases once shrinkage porosity forms, continuity
equation can be simplified and integrated to give the following relation of final pore volume
fraction ( )
', p l crg g [11]
where = / ( 1) = – / s l s

18
Simulator uses the following sequence to determine final pore volume fraction :
*Ny ,l crI g ,l crg pg [12]
Advantages:
It is dimensionless and easy to handle
Considers the local thermal conditions as well as the alloy material properties and
solidification parameters
Directly yields the pore volume fraction eliminating the need for estimation of a critical
Niyama value
Can be calculated by any simulation software in the same manner as the original Niyama
criterion (Ny)
Experimentally proven for steel, aluminum alloys, magnesium alloys and nickel based
alloys [42, 43].
However, Sigworth contends that Niyama should not be used in first place to predict
shrinkage because shrinkage formation is driven by freezing rate and gases in melt [44]. Carlson
and Beckermann defended their work by replying that their model predicts shrinkage pores only
and definitely not gas pores [45].
Limitation: It does not consider the complex nucleation and growth of pores phenomena.
Coupled with oxide distribution this criterion would work remarkably well.
19
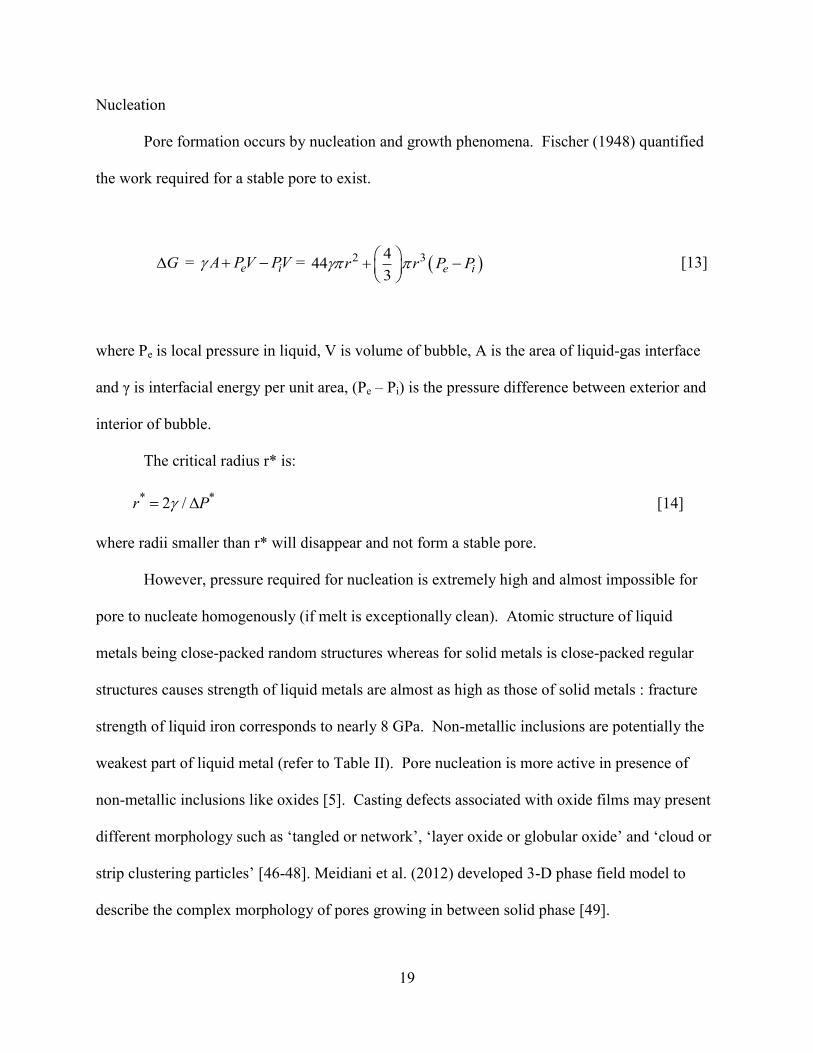
Nucleation
Pore formation occurs by nucleation and growth phenomena. Fischer (1948) quantified
the work required for a stable pore to exist.
G = e iA PV PV = 2 3444
3e ir r P P
[13]
where Pe is local pressure in liquid, V is volume of bubble, A is the area of liquid-gas interface
and γ is interfacial energy per unit area, (Pe – Pi) is the pressure difference between exterior and
interior of bubble.
The critical radius r* is:
* *2 /r P [14]
where radii smaller than r* will disappear and not form a stable pore.
However, pressure required for nucleation is extremely high and almost impossible for
pore to nucleate homogenously (if melt is exceptionally clean). Atomic structure of liquid
metals being close-packed random structures whereas for solid metals is close-packed regular
structures causes strength of liquid metals are almost as high as those of solid metals : fracture
strength of liquid iron corresponds to nearly 8 GPa. Non-metallic inclusions are potentially the
weakest part of liquid metal (refer to Table II). Pore nucleation is more active in presence of
non-metallic inclusions like oxides [5]. Casting defects associated with oxide films may present
different morphology such as ‘tangled or network’, ‘layer oxide or globular oxide’ and ‘cloud or
strip clustering particles’ [46-48]. Meidiani et al. (2012) developed 3-D phase field model to
describe the complex morphology of pores growing in between solid phase [49].

20
Table II: Fracture Pressure for liquids [5]
∆P*
Liquid Surface
Tension(N/m)
Atomic
Diameter (nm)
Hall Petch
(atm)
From Fischer
(atm)
Complex
Inclusion
(atm)
Water 0.072 - - 1320 16
Mercury 0.5 0.3 16700 22300 200
Aluminum 0.9 0.29 31000 30000 360
Copper 1.3 0.26 50000 50000 600
Iron 1.9 0.25 76000 70000 850

21
Figure 6: Ellingham Diagram referring to the tendency of aluminum to oxidize [68].

22
From a thermodynamic point of view, Figure 6 shows the tendency of aluminum to form
oxides. Thiele studied the oxide growth on aluminum alloys with respect to time and also the
oxidation in different environments: refer Figure 7 (a) and (b). Thiele experimentally found out
the thickness of oxide film for liquid aluminum at 700 to be 900 nm when melt was held for 1
hour. After 5 seconds at 700 the measured oxide film thickness was about 24 nm. When the
oxide time was increased by a factor of ten, the oxide film thickness doubled [50].
(a)

23
(b)
Figure 7: (a) Effect of 1% of alloying element on aluminum at 800 (b) Growth of pure
aluminum in a flow of oxygen, dry and moist air [5, 50].
However, Campbell (1991) was the first to lend much insight into the oxidation behavior
of a cast alloy. Oxides usually form a skin on the surface of liquid metal. Such oxide films can
be entrained in bulk liquid. The oxide films for aluminum alloys may originate from two main
sources: (a) “Old” oxide films formed during melt preparation (b) “Young” oxide films formed
during the flow of metal in the gating system for a short time period [56]. These results are
consistent with the study conducted by Runyoro et al. [51].
The entrainment action is the enfolding of surface leading to folding in and subduction of
its surface film. These films being solid at the melt temperature, when get entrained, the dry

24
films fold facing each other cannot bond each other, being a ceramic- ceramic interface: see
Figure 8.
Figure 8: Formation of bifilm AB and bubbles CD creating bubble trails [5].
These bifilm cracks are usually invisible and often undetected because surface oxides are usually
only a few molecules thick, approximately 20 nm.
Campbell (2003) derived a critical in-gate velocity of 0.5 m/s at which the surface will
start to suffer from surface turbulence (breaking waves and entrainment of surface into the bulk)
resulting into oxide bifilms causing random defects and reduced mechanical properties in
castings [1, 5, 21, 26]. Surface turbulence is massive subject and studying the latter is out of the
scope of this thesis.
25
2.5 Dimensionless Numbers
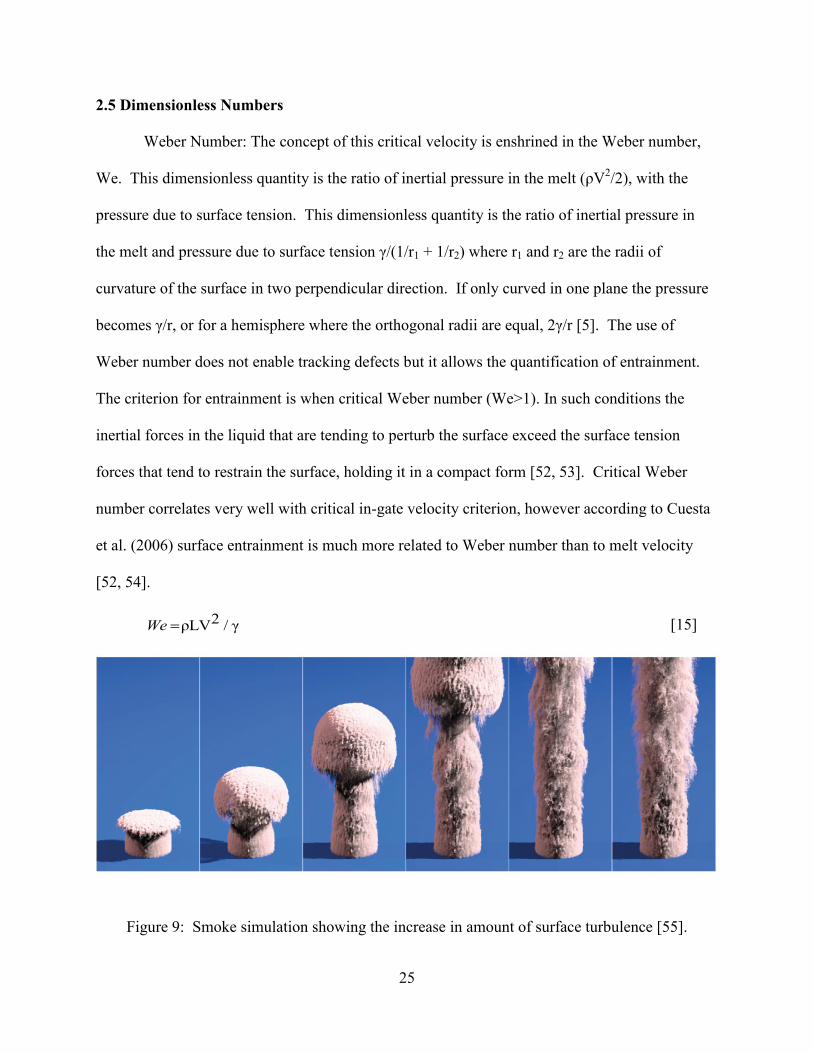
Weber Number: The concept of this critical velocity is enshrined in the Weber number,
We. This dimensionless quantity is the ratio of inertial pressure in the melt (ρV2/2), with the
pressure due to surface tension. This dimensionless quantity is the ratio of inertial pressure in
the melt and pressure due to surface tension γ/(1/r1 + 1/r2) where r1 and r2 are the radii of
curvature of the surface in two perpendicular direction. If only curved in one plane the pressure
becomes γ/r, or for a hemisphere where the orthogonal radii are equal, 2γ/r [5]. The use of
Weber number does not enable tracking defects but it allows the quantification of entrainment.
The criterion for entrainment is when critical Weber number (We>1). In such conditions the
inertial forces in the liquid that are tending to perturb the surface exceed the surface tension
forces that tend to restrain the surface, holding it in a compact form [52, 53]. Critical Weber
number correlates very well with critical in-gate velocity criterion, however according to Cuesta
et al. (2006) surface entrainment is much more related to Weber number than to melt velocity
[52, 54].
2 ρLV / γWe [15]
Figure 9: Smoke simulation showing the increase in amount of surface turbulence [55].
26
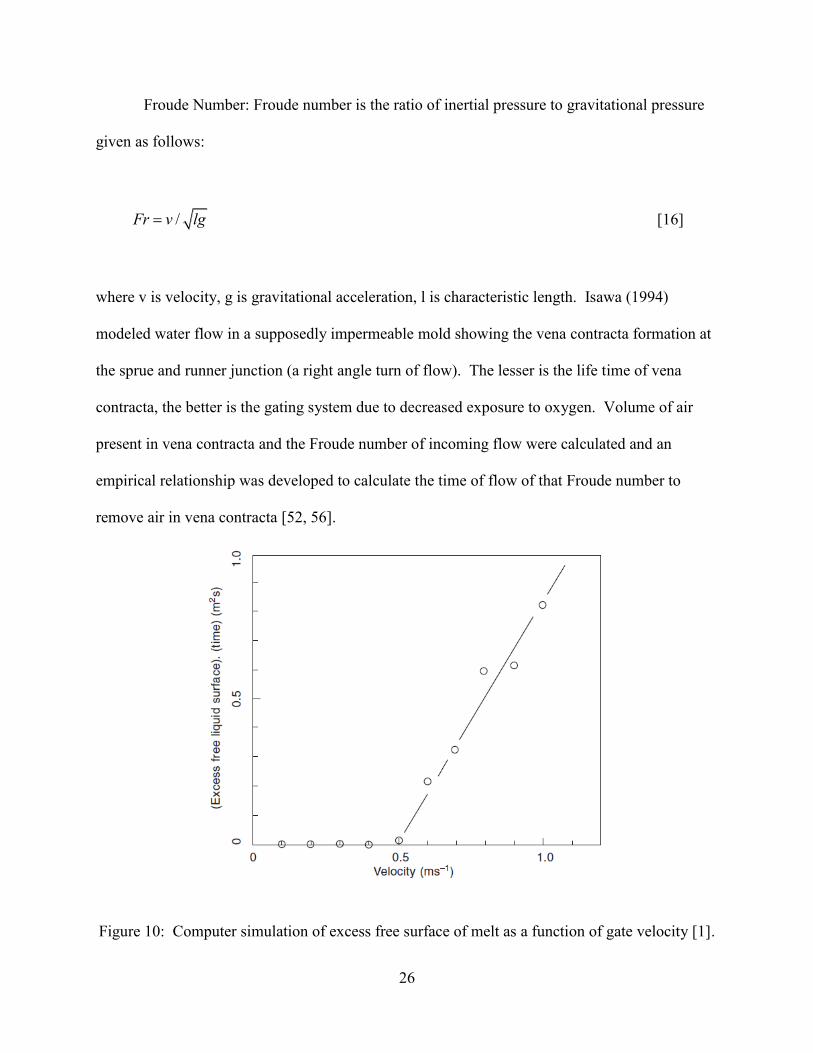
Froude Number: Froude number is the ratio of inertial pressure to gravitational pressure
given as follows:
/Fr v lg [16]
where v is velocity, g is gravitational acceleration, l is characteristic length. Isawa (1994)
modeled water flow in a supposedly impermeable mold showing the vena contracta formation at
the sprue and runner junction (a right angle turn of flow). The lesser is the life time of vena
contracta, the better is the gating system due to decreased exposure to oxygen. Volume of air
present in vena contracta and the Froude number of incoming flow were calculated and an
empirical relationship was developed to calculate the time of flow of that Froude number to
remove air in vena contracta [52, 56].
Figure 10: Computer simulation of excess free surface of melt as a function of gate velocity [1].
27
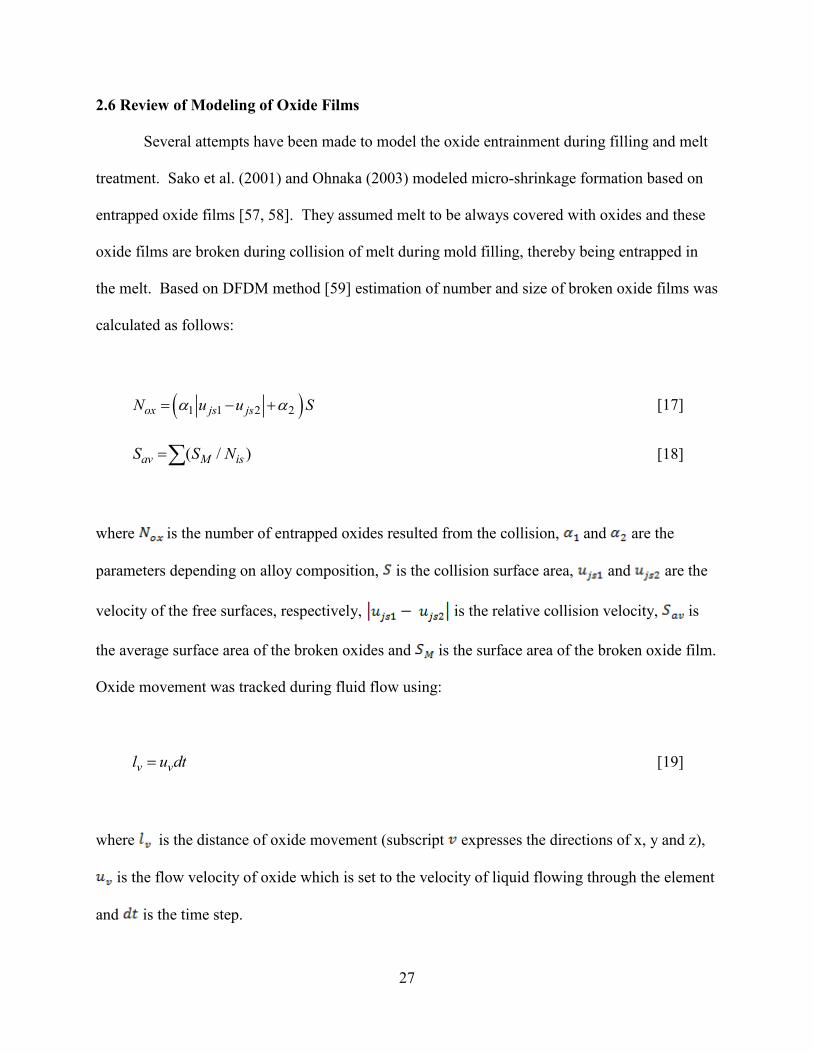
2.6 Review of Modeling of Oxide Films
Several attempts have been made to model the oxide entrainment during filling and melt
treatment. Sako et al. (2001) and Ohnaka (2003) modeled micro-shrinkage formation based on
entrapped oxide films [57, 58]. They assumed melt to be always covered with oxides and these
oxide films are broken during collision of melt during mold filling, thereby being entrapped in
the melt. Based on DFDM method [59] estimation of number and size of broken oxide films was
calculated as follows:
1 1 2 2 ox js jsN u u S [17]
( / )av M isS S N [18]
where is the number of entrapped oxides resulted from the collision, and are the
parameters depending on alloy composition, is the collision surface area, and are the
velocity of the free surfaces, respectively, is the relative collision velocity, is
the average surface area of the broken oxides and is the surface area of the broken oxide film.
Oxide movement was tracked during fluid flow using:
v vl u dt [19]
where is the distance of oxide movement (subscript expresses the directions of x, y and z),
is the flow velocity of oxide which is set to the velocity of liquid flowing through the element
and is the time step.

28
Campbell et.al (2006) has well summarized the current modeling methods in entrainment
[56]. Carlson et al. (2009) modeled the oxide generation, growth and agglomeration of oxides
and implemented in a general purpose simulation code [60]. Prakash et al. (2006) used meshless
Smoothed Particle Hydrodynamics (SPH) method to oxide formation during mold filling stage in
Direct Chill (DC) casting of extrusion billets [61-63]. In-depth description of SPH method is
available [64-66]. Dai et al. (2012) developed an Oxide Film Entrainment Tracking Algorithm
(OFET) method to simulate the movement of oxide films on the liquid metal surface [67].
29
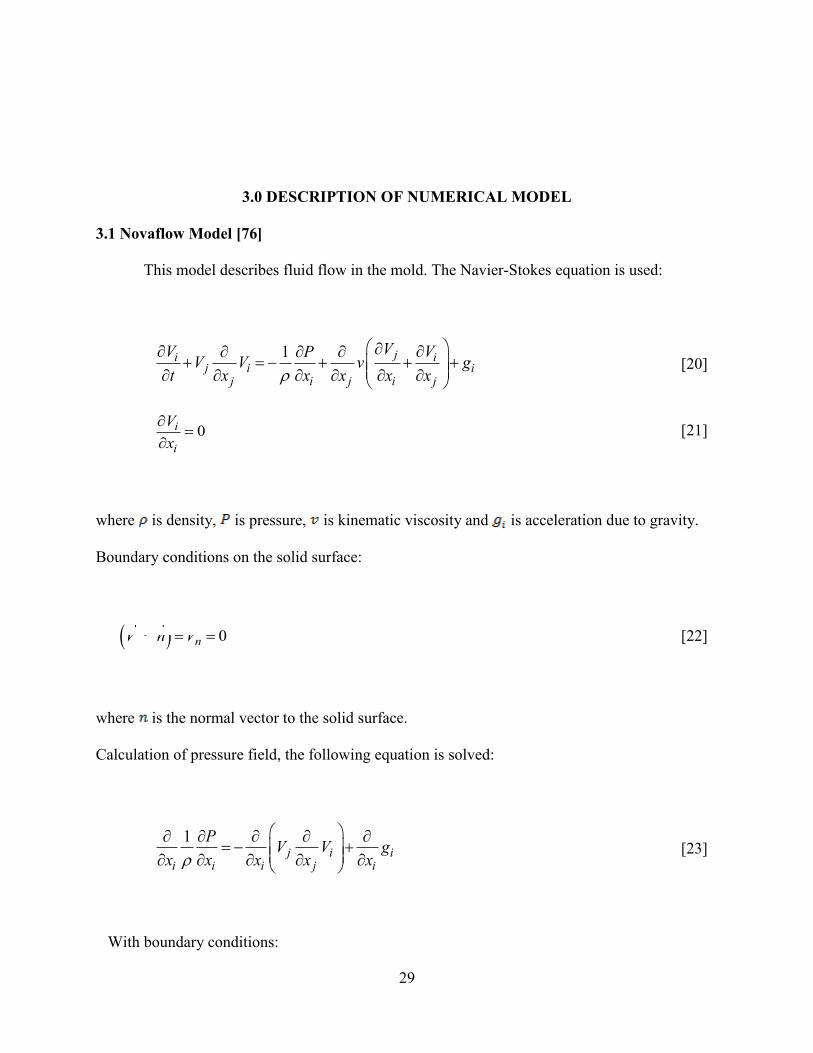
3.0 DESCRIPTION OF NUMERICAL MODEL
3.1 Novaflow Model [76]
This model describes fluid flow in the mold. The Navier-Stokes equation is used:
1 ji ij i i
j i j i j
VV VPV V v g
t x x x x x
[20]
0i
i
V
x
[21]
where is density, is pressure, is kinematic viscosity and is acceleration due to gravity.
Boundary conditions on the solid surface:
0nV n V [22]
where is the normal vector to the solid surface.
Calculation of pressure field, the following equation is solved:
1j i i
i i i j i
PV V g
x x x x x
[23]
With boundary conditions:

30
On free surface P = 0
Taking into account equation [22] at solid surface
3.2 Novasolid Model [76]
This model describes heat flow in the casting. The volume fraction of solid phase ,
liquid phase and empty phase are related by the following equation:
, , , 1S r t L r t P r t [24]
The phase balance in time derivations is follows:
, , ,0
S r t L r t P r t
t t t
[25]
The law of conservation of mass is reduced to the following equation:
0s L
ST T L
t t
[26]
where and are temporal evolution of density of solid and liquid phases.
The mass conservation law for alloy species is reduced to following equation:

31
0i is S L L
ST C T C T T L
t t
; 1,2,3...i [27]
where , are the concentrations of the ith
alloy component in the liquid and solid
phases being in equilibrium at temperature.
The basic equation being added to this system of equations: the equation of heat conduction with
sources and convective heat transfer.
s s L L s
T T SS T Cp T L T Cp T V T q T
t t t
= div T T [28]
where , are the specific heats of liquid and solids as a function of time at constant
pressure, is the heat conduction coefficient of alloy with respect to time, is the
crystallization heat of alloy.
For the mold, the heat conduction equation is as follows:
K K K
TT Cp T div T T
t
[29]
where indicates the similar properties for the mold.
If the convective heat transfer is neglected in equation [28] (e.g. small casting sizes), then
equations [25 – 29] form closed system of four equations: , , , , , , ,S r t L r t P r t T r t which
composes the heat flow model for NovaSolid.
32
3.3 Pore Nucleation Model
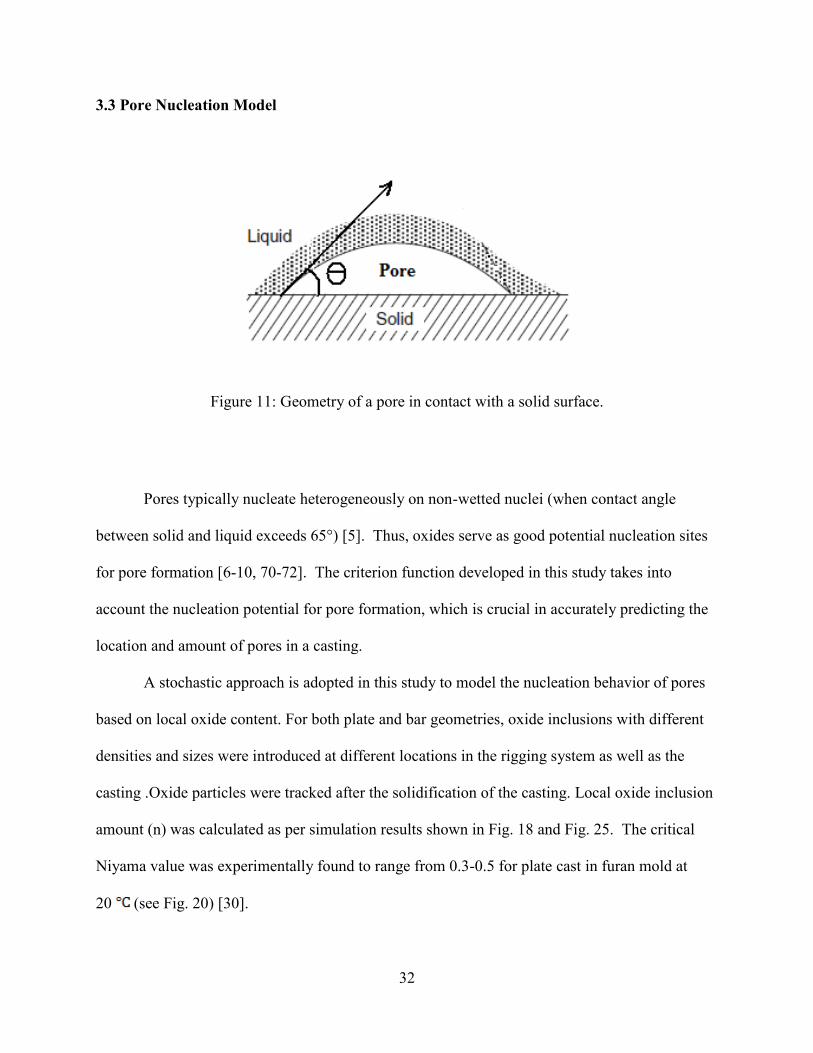
Figure 11: Geometry of a pore in contact with a solid surface.
Pores typically nucleate heterogeneously on non-wetted nuclei (when contact angle
between solid and liquid exceeds 65°) [5]. Thus, oxides serve as good potential nucleation sites
for pore formation [6-10, 70-72]. The criterion function developed in this study takes into
account the nucleation potential for pore formation, which is crucial in accurately predicting the
location and amount of pores in a casting.
A stochastic approach is adopted in this study to model the nucleation behavior of pores
based on local oxide content. For both plate and bar geometries, oxide inclusions with different
densities and sizes were introduced at different locations in the rigging system as well as the
casting .Oxide particles were tracked after the solidification of the casting. Local oxide inclusion
amount (n) was calculated as per simulation results shown in Fig. 18 and Fig. 25. The critical
Niyama value was experimentally found to range from 0.3-0.5 for plate cast in furan mold at
20 (see Fig. 20) [30].
33
It is assumed that pores will only grow when the following two conditions hold true
simultaneously:
(i) Ny < Nycritic [30]
(ii) A randomly computer generated number, (0 ) is smaller than the nucleation
probability, . The nucleation probability can be calculated as follows:
/nP n N where 0 n N [31]
where N is the total oxide content, n is the predicted local oxide content that governs the
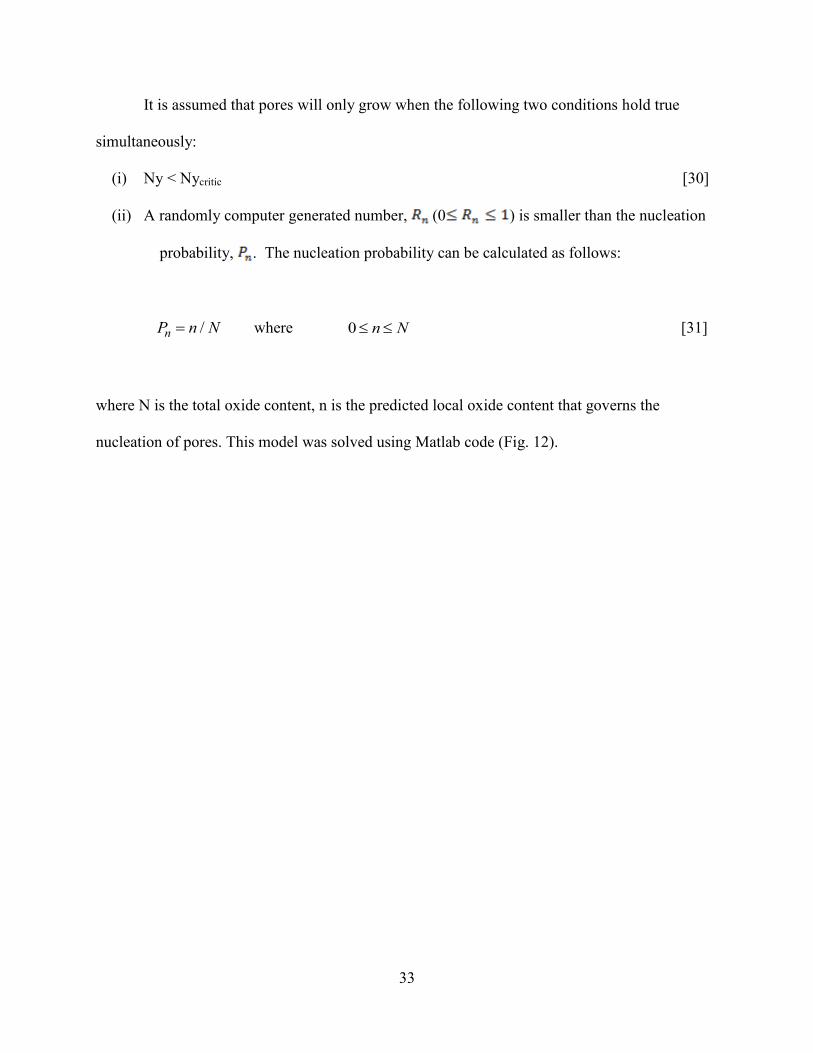
nucleation of pores. This model was solved using Matlab code (Fig. 12).
34
Figure 12: Flowchart for Matlab code
35
4.0 RESULTS AND DISCUSSION
4.1 Simulation Results
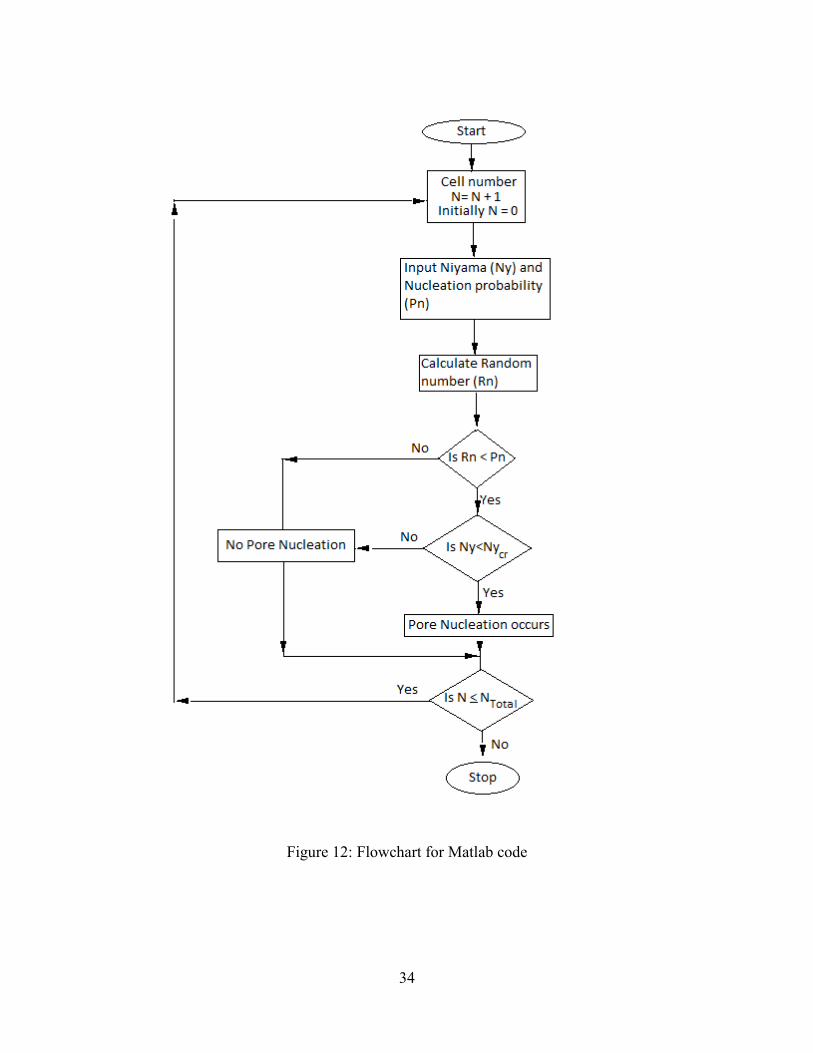
This model was tested on a cast A356 plate ( 500mm ×250mm×25mm) and A356 bar
( 250mm×20mm×20mm ) using finite volume based NovaFlow&Solid simulation using the
experimental data from [30] (Figs. 13-20).
The current nucleation model was solved using Matlab generating results as shown in
Fig.22 and Fig. 26. This model matches reasonably well with the observed porosity defects
shown in Fig. 21 and Fig. 27. This model does not consider oxide generation during filling and
life-cycle of oxide bi-films. With the addition of these phenomena, the nucleation potential can
be further refined to match results with pores formed after an actual metal pour. However,
capturing the nucleation of pores requires a mesh size (of micron / millimeter scale) equivalent to
the critical pore size to form a stable pore.
Figure 13: Modulus profile of for the 12.5 mm thickness cast A 356mm plate.

36
Figure 14: Solidification time profile for the 12.5 mm thickness cast A356 plate.
Figure 15: Profile for Niyama values for the cast A356 plate at 3% solid fraction.

37
Figure 16: Niyama plot shown from the top view of the A356 plate at 3% solid fraction.
Figure 17: Shrinkage contraction plot in the cast the A356 plate.

38
Figure 18: Distribution of oxides in the cast A356 plate.
Figure 19: Measurement location for shrinkage prediction [30].
39
Figure 20: Niyama versus wt. % pore based on the measurements shown in Fig. 18 [30].
Figure 21: Computer tomography (CT) scan showing volume of gas/shrinkage defects/mm3 [30].
40
Figure 22: Stochastic behavior of pore nucleation obtained through MATLAB code.
Table III: Simulation Parameters
A356 (7 wt% Si, 0.35% Mg) TL = 622
TS = 571
Melting Method Resistive furnace / Induction
Melting
Mold Media Alphathane 1,2,3 binder
Pouring temperature (poured from
furnace pout) 710
Pouring time 1.5 s
Solidification time 145 s

41
Figure 23: Solidification time plot in the 20 mm 20 mm A356 bar geometry.
Figure 24: Niyama plot in the 20 mm 20 mm A356 bar geometry at 3% solid fraction.
42
Figure 25: Distribution of oxides in a cast bar geometry after solidification.
Figure 26: Stochastic behavior of pore nucleation obtained through MATLAB Code.
4.2 Experimental Results
The bar casting was poured using both: the resistive and the induction furnace with
identical pouring conditions (except liquid metal surface was protected with argon gas for the
induction furnace). The casting geometry was sectioned along the central line and polished. The
unetched sample was observed under an optical microscope. Following the centerline, the
sectioned bar was examined at an interval of 10 mm throughout the 250 mm plate. Total number
of observations was 25. Areal pore fraction was determined [refer Fig. 26].
Observations for the sectioned bar processes via Induction Melting:
Pore size was high enough to be visible to a naked eye.
Pores were irregular in shape.

43
On visual inspection they appeared to have dispersed uniformly throughout the bar.
Induction melted A356 samples had much higher porosities compared to A356 processed
via the resistive furnace. Repeating the revelation made by Berry (2006), the continuous
circulation currents in the crucible containing the melt cause oxide films on the melt
which get sucked inside and new melt surfaces are continuously generated for more oxide
films to form [69].
Results for A356 bar processed via the Resistive Furnace:
Pores were more prominent above the center line of the bar casting.
Areal pore fraction was determined at intervals of 10 mm distance along the central line
of bar [Fig. 27].
The severity of pore formation was related to Niyama criterion [Fig. 28].
Considering pores to be spherical, pore size was calculated at an interval of 10 mm and it
was related to SDAS [Fig. 29].

44
Figure 27: Areal pore % observed at different metallographic cross-sections of the bar.
Figure 28: Effect of Niyama criterion on pore percentage.

45
Figure 29: Comparing pore size with SDAS at an interval of 10 mm along the centerline of bar.
(a)
46
(b)
(c)

47
(d)
(e)
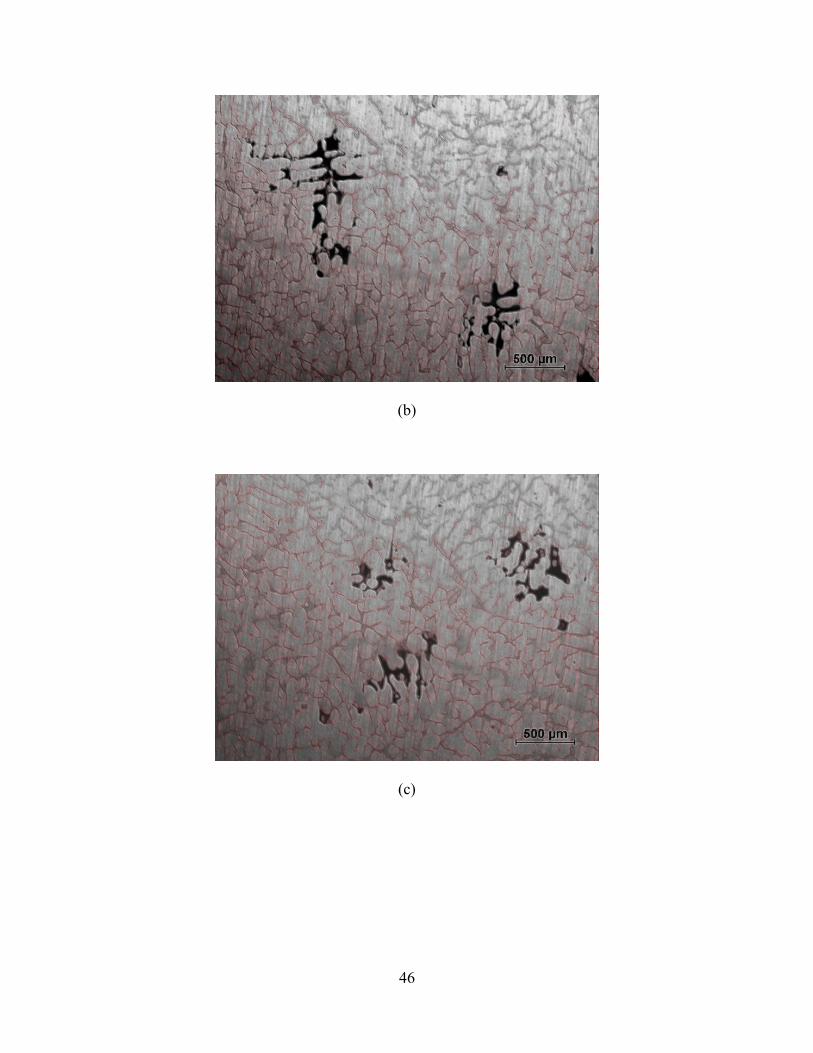
Figure 30: Typical examples of micro-shrinkage observed on metallographic cross-sections at:
(a) 210 mm, (b) 230 mm, (c) 170 mm (d) 150 mm and (e) 140 mm from end of the plate.

48
5.0 CONCLUDING REMARKS AND FUTURE WORK
Conclusions:
An attempt has been done to observe and model the stochastic behavior of nucleation of
pores during casting solidification for A356 plate and bar.
• The reoxidation effects of the liquid metal during mold filling and the oxide film
entrapment may have a very strong effect on shrinkage porosity formation.
Data for Niyama criterion values and oxide distribution were generated through
NovaFlow&Solid simulation software and the model was solved using Matlab.
The model for plate geometry matches reasonably to the experimentally measured pore
defects in the A356 plate.
However, following limitations need to be addressed:
• This model does not include the pore growth model and hence cannot predict pore
size.
• The oxidation effects of the liquid metal during mold filling and the oxide film
entrapment may have a very strong effect on shrinkage porosity formation.
• The feasibility of this model also depends on the correct calculation of number,
size and distribution of “old” oxide films and “young” oxide films formation
which requires specification of melt treatment, melt handling, rigging system and
other process specifications.
• To capture the stochastic behavior of pore nucleation, the mesh size needs to be of
the order of a few microns requiring high computational effort .
49
Future Work:
Future work will include:
An improved model that will account for the phenomena discussed above
Model validation for other cast alloys.
Implement the developed micro-shrinkage model into the stochastic mesoscopic models
for prediction of microstructure evolution of dendritic alloys [73-75]. This will improve
significantly the predictions of the location and morphology (shape and size) of the
micro-shrinkage that is forming in the interdendritic region or at the grain boundary.

50
REFERENCES
[1] J. Campbell, Castings, 2nd
edition , 2003, Butterworth-Heinemann, Oxford, UK.
[2] J. Dantzig, M. Rappaz, Solidification, 1st edition, 2009 EFPL Press, Lausanne, Switzerland.
[3] P.D. Lee, J.D. Hunt, “Hydrogen porosity in directionally solidified aluminum-copper alloys:
A mathematical model”, Acta Materilia, vol. 49 (2001), pp. 1383-1398.
[4] A. Catalina A. and C. Monroe, “A simplified model for quantitative shrinkage porosity
prediction in steel castings”, IOP Conference Series: Materials Science and Engineering, vol. 33
(2012), pp. 12067-12074.
[5] J. Campbell, Complete Casting Handbook: Metal Casting Processes, Techniques and Design
1st Edition, 2011 Elsevier, MA, USA.
[6] D. Emadi, J. E. Gruzleski, M. Pekguleryuz, “Melt oxidation behavior and inclusion content in
unmodified as Sr-modified A356 alloy- their role in pore nucleation”, AFS Transactions., vol.
104 (1996), pp. 763-768.
[7] A. Kaye, A. Street, Die Casting Metallurgy, 1982, Butterworth, London, UK.
[8] A. M. Samuel, F. H. Samuel, “Porosity factor in quality aluminum castings”, AFS
Transactions, vol. 100 (1992), pp. 657-666.
[9] C. J. Simenson, G. Berg, “A survey of inclusions in aluminum”, Aluminum, vol. 56 (1980),
pp. 335-340.
[10] P. S. Mohanty, F. H. Samuel, J. E. Gruzleski, “Experimental study on pore nucleation by
inclusions in aluminum castings”, AFS Transactions, vol. 103 (1995), pp. 555-564.
[11] X. Liu, “Ultrasonic cavitation-assisted molten metal processing of A356-Nanocomposites”,
Master Thesis (2013), The University of Alabama.
[12] D. Y. Ying, D. L. Zhang, “Processing of Cu-Al2O3 metal matrix nanocomposite materials
by using high energy ball milling”, Materials Science and Engineering: A, vol. 286 (2000), pp.
152-156.
[13] M. J. Kok, “Production and mechanical properties of Al2O3 particle-reinforced 2024
aluminum alloy composites”, Journal of Materials Processing Technology, vol. 161 (2005), pp.
381-387.
51
[14] D. M. Stefanescu, ASM Handbook, Vol. 15: Casting, 1988, ASM International, Ohio, US.
[15] J. Campbell, “Feeding Mechanisms in Castings”, AFS Cast Metals Research Journal, Vol. 5
(1969), pp. 1-8.
[16] A. K. Dahle, L. Arnberg, D. Apelian, “Burst feeding and its role in porosity formation
during solidification of aluminum alloys”, AFS Transactions, vol. 105 (1997), pp. 963-970.
[17] A. K. Dahle, H. J. Thevik, L. Arnberg, D. H. StJohn, “Modeling the fluid-flow-induced
stress and collapse in a dendritic network”, Metallurgical and Materials Transactions B, vol. 30B
(1999), pp. 287.
[18] T. S. Piwonka, M.C. Flemings, “Pore formation in solidification”, Transactions of the
Metallurgical Society of AIME, vol. 236 (1966), pp.1157.
[19] D. M. Stefanescu, Science and Engineering of Casting Solidification, 2nd
Edition, 2008,
Springer, N.Y., US
[20] M. Tiryakioglu and J. Campbell, “Guidelines for designing metal casting research:
application to aluminium alloy castings”, International Journal of Cast Metals Research, vol. 20
(2007), pp. 25-29.
[21] J. Berry, H. Huang, “Evaluation of criteria functions to minimize microporosity formation
in long-freezing range alloys”, American Foundry Society Transactions (1993), pp. 669-675.
[22] J. Spittle, S. Brown, J. Sullivan, “Application of criteria functions to the prediction of
microporosity levels in castings”, Proceedings of the 4th
Decennial International Conference of
Solidification Processing, Sheffield (July 1997), pp. 251-255.
[23] N. Chvorinov, “Theory of the solidification of castings”, Giesserei, Vol. 27 (1940), pp. 177-
186.
[24] W.S. Pellini, “Factors which determine riser adequacy and feeding range, AFS
Transactions, vol. 61 (1953), 61-80.
[25] E. T. Myskowski, H. F. Bishop, W. S. Pellini, “Feeding range of joined sections”, AFS
Transactions, vol 61 (1953), pp. 302-308.
[26] J. Campbell, Castings Practice: The Ten Rules of Castings, 1st edition, 2003, Butterworth-
Heinemann, Oxford, UK.
[27] P. N. Hansen, P. R. Sahm, “Modeling of casting, welding and advanced solidification
processes IV”, The Mineral, Metals and Materials Society (1988), Warrendale, PA, pp.33.
[28] K. Kubo, R. D. Pehlke, “Mathematical modeling of porosity formation in solidification”,
Metallurgical and Materials Transactions, vol. 16B (1985), pp. 359-366.

52
[29] E. Niyama E., T. Uchida, M. Morikawa. and S. Saito, “A method of shrinkage prediction
and its application to steel castings practice”, AFS International Cast Metals Journal, vol. 7
(1982), pp. 52-63.
[30] L. Nastac, “Modeling approach for quantitative prediction of macro-shrinkage and
microshrinkage in A356 sand mould castings”, International Journal of Cast Metals Research,
Vol 25, No. 3 (2012), 145-154.
[31] K. D. Carlson, S. Ou, R. A. Hardin, C. Beckermann, “Development of new feeding distance
rules using casting simulation: Part I: Methodology”, Metallurgical and Materials Transactions
B, vol. 33B (2002), pp. 731-740.
[32] K. D. Carlson, S. Ou, R. A. Hardin, C. Beckermann, “Development of a methodology to
predict and prevent leakers caused by microporosity in steel castings”, Proceedings of the 55th
SFSA Technical and Operating Conference, Chicago, IL, 2001.
[33] K. D. Carlson, S. Ou, R. A. Hardin, C. Beckermann, “Feeding of High-Nickel alloy
castings”, Metallurgical and Materials Transaction B, 2005, vol. 36B, pp. 843-856.
[34] K. D. Carlson, Z. Lin, C. Beckermann, Metallurgical and Materials Transactions B, vol.
38B (2007), pp. 541-555.
[35] S. Ou, K. D. Carlson, C. Beckermann, “Feeding and risering of high-alloy steel castings”,
Metallurgical and Materials Transactions B, vol. 36B (2005), pp. 97-116.
[36] G. K. Sigworth and C. Wang, “Evolution of porosity in long freezing range alloys”,
Metallurgical and Materials Transactions B., vol. 24B (1993), pp. 365-377.
[37] P. N. Hansen, P. R. Sahm, “How to model and simulate the feeding process in casting to
predict shrinkage and porosity formation”, Modeling of Casting and Welding Process IV, TMS-
AIME (1988), pp. 33-42.
[38] P. N. Hansen, P. R. Sahm, “How to select and use criterion functions in solidification
simulation”, AFS Transactions, vol. 101 (1993), pp. 443-446.
[39] M. J. Jolly, H. S.Lo, M. Turan, J. Campbell, X. Yang, “Use of simulation rules in the
practical development of a method for manufacture of cast iron camshafts”, Modeling of
Casting, Welding and Advanced Solidification Processing IX, Aechen, Germany (2000).
[40] H. Lo, J. Campbell, “The modeling of ceramic foam filters”, Modeling of Casting, Welding
and Advanced Solidification Processes IX, Edited by P. N. Hansen, P. R. Sahm, 2000, pp. 373-
380.
[41] I. L. Svensson, A. Dioszegi, “Modeling of volume related defect formation in cast irons”,
Modeling of Casting, Welding and Advanced Solidification Processes IX, Edited by P. Sahm, P.
Hansen, Conley, 2000, pp. 102-109.

53
[42] K. D. Carlson, C. Beckermann, “Prediction of Shrinkage Pore Volume Fraction using a
Dimensionless Niyama Criterion”, Metallurgical and Materials Transactions A, vol. 40A (2009),
pp. 163-175.
[43] K. D. Carlson, C. Beckermann, “Use of the Niyama Criterion to Predict Shrinkage-related
Leaks in High-Nickel Steel and Nickel-Based Alloy Castings”, Proceedings of the 62nd
SFSA
Technical and Operating Conference, Steel Founders’ Society of America, Chicago, IL, 2008.
[44] G. K. Sigworth, Discussion of “Prediction of Shrinkage Pore Volume Fraction using a
Dimensionless Niyama Criterion”, Metallurgical and Materials Transactions A, vol. 40A (2009),
pp. 3051-3053.
[45] K. D. Carlson, C. Beckermann, Reply: Author’s reply to the Discussion of “Prediction of
Shrinkage Pore Fraction using a Dimensionless Niyama Criterion”, Metallurgical and Materials
Transactions A, vol. 40A (2009), pp. 3054-3055.
[46] M. Divandari, “Mechanism of bubble damage in casings”, PhD Thesis, University of
Birmingham, UK (2001), pp. 12-16.
[47] N. R. Green, J. Campbell, “Influence in oxide film filling defects on strength of Al-7Si-Mg
alloy castings”, AFS Transactions, vol. 114 (1994), pp. 341-347.
[48] W. Huang, J. W. Shu, S. T. Shih, “Diagnosis and analysis of oxide films in Al-Si-Mg
alloys”, AFS Transactions, vol. 108 (2000), pp. 547-560.
[49] H. Meidani, J. Desbiolles, A. Jacot, M. Rappaz, “Three-dimendional phasefield simulation
of micropore formation during solidification: Morphological analysis and pinching effect”, Acta
Materialia, vol.60 (2012), pp. 2518-2527.
[50] W. Thiele, “The oxidation of melts of aluminum and aluminum alloys”, Aluminum, Vol. 38
(1962), pp. 707-715 and 780-786.
[51] J. Runyoro, S. Boutarabi, and J. Campbell, “Critical gate velocity for film forming casting
alloys, a basis for process specification, AFS Transactions, vol. 100 (1992), pp. 225-234.
[52] T. Isawa, “The control of the initial fall of liquid metal in gravity filled casting systems”,
Department of Metallurgy and Materials, The University of Birmingham, Birmingham, UK,
1994.
[53] B. S. Massey, Mechanics of Fluids, 6th
edition, 1992, Chapman & Hall, London, UK.
[54] R. Cuesta, A. Delgado, A. Maroto, D. Mozo, “Numerically modeling oxide entrainment in
the filling of castings: The effect of Weber number”, JOM, vol. 58 (2006), pp. 62-65.
[55] T. Kim, Nils Thürey, Doug James, and Markus Gross, “Wavelet turbulence for fluid
simulation”, SIGGRAPH, 2008.

54
[56] J. Campbell, “The Modeling of entrainment defects during casting”, TMS Annual Meeting,
Simulation of Aluminum Shape Casting Processing: form Alloy Design to Mechanical
Properties, TMS, San Antonio, TX, United States, 2006.
[57] Y. Sako, I. Ohnaka, J.D. Zhu and H. Yasuda, “Modeling of oxide entrapment during mold
filling of Al-alloy casting”, Proceedings of the 7th
Asian Foundry Congress, The Chinese
Foundrymen’s Association, Taipei (2001), pp. 363-369.
[58] I. Ohnaka, Modeling of Casting, Welding and Advanced Solidification Processes X, eds.
D.M Stefanescu et al., TMS, Warrendale Pa. 2003, pp. 403.
[59] J. Zhu, I. Ohnaka, “Three Dimensional Computer Simulation of Mold Filling of Casting by
Finite Difference Method”, Transaction of Japan Foundrymen’s Society, vol. 68 (1996), pp. 668-
673.
[60] K. D. Carlson, A. Melendez, C. Beckermann, “Modeling of Reoxidation inclusion in steel
sand casting”, Proceedings of the 63rd
SFSA technical and Operating Conference, paper no. 5.6,
Steel Founders Society, Chicago, IL, 2009.
[61] M. Prakash, H. A. Joseph, P. Cleary, J. Grandfield, “Preliminary SPH modeling of oxide
formation during the mold filling phase in DC casting of extrusion billets”, Fifth International
Conference on CFD in the Process Industries, CSIRO, Melbourne, Australia, 13-15 Dec., 2006.
[62] P. W. Baker, K. Nguyen, R. Kirkaldie, “Dross generation of during transfer operations”, 4th
Australian Asian Pacific Conference, Aluminum Cast House Technology, TMS 1995, pp. 109-
122.
[63] J. Ha, P. W. Cleary, V. Alguine, T. Nguyen, “Simulation of die filling in gravity die casting
using SPH and MAGMAsoft”, Proceedings of 2nd
International Conference on CFD in Minerals
& Process Industries, 1999, Melbourne, Australia, pp. 423-428.
[64] P. W. Cleary, J. Monaghan, “Conduction modeling using smoothed particle
hydrodynamics”, Journal of Computational Physics, vol. 148 (1999), pp. 227-264.
[65] R. A. Gingold, J. Monaghan, “Smoothed particle hydrodynamics: Theory and application to
non-spherical stars”, Monthly Notices of Royal Astronomical Society, vol. 181 (1997), pp. 375-
389.
[66] J. Monaghan, “Smoothed particle hydrodynamics”, Annual Review of Astronomy and
Astrophysics, vol. 30 (1992), pp. 543-574.
[67] X. Dai, M. Jolly, X. Yang, J. Campbell, “Modeling of liquid metal flow and oxide film
defects of aluminum alloy castings”, Materials Science and Engineering, vol. 33 (2012), pp. 1-
10.

55
[68] F. D. Richardson, Physical Chemistry of Melts in Metallurgy, Vol. 2 (1994), Academic
Press, Massachussetts, US.
[69] J. T. Berry, R. Luck, “Porosity criteria functions revisited”, World Foundry Congress,
Harrogate, UK, June 4-7, 2006.
[70] S. Fox, J. Campbell, “Visualization of oxide film defects during solidification of aluminum
alloys”, Scripta Materialia, vol. 43 (2000), pp. 881-886.
[71] C. Tian, J. Law, J van der Touw, M. Murray, J. Yao, D. Graham, D. John, “Effect of melt
cleanliness on the formation of porosity defects in automotive aluminum high pressure die
castings”, Journal of Materials Processing Technology, vol. 122 (2002), pp. 82-93.
[72] G. Backer, M. Ranganathan, J. Heimsch, M. Mclaughlin, C. Kim, “Simulation of flow
induced gas entrapment and its effect on porosity in aluminum die castings”, Conference of 2001
Die Casting in the 21st Century, Cincinnati, October 29 – Nov. 1, 2001.
[73] L. Nastac, Modeling and Simulation of Microstructure Evolution in Solidifying Alloys,
Springer, 2004, Kluwer Academic Publishers, Boston, US.
[74] L. Nastac, “Numerical Modeling of Solidification Morphologies and Segregation Patterns in
Cast Dendritic Alloys”, Acta Materialia, Vol. 47 (1999), No. 17, pp. 4253-4262.
[75] L. Nastac, D. M. Stefanescu, “Stochastic Modeling of Microstructure Formation in
Solidification Processes”, Modeling and Simulation in Materials Science and Engineering,
Institute of Physics Publishing, Vol. 5 (1997), No. 4, pp. 391-420.
[76] NovFlow&Solid by Novacast: User Mannual: http://www. novacast.se/
Related Documents