journal of materials processing technology 209 ( 2 0 0 9 ) 1060–1073 journal homepage: www.elsevier.com/locate/jmatprotec Impact behaviour of A356 alloy for low-pressure die casting automotive wheels Mattia Merlin a,∗ , Giulio Timelli b , Franco Bonollo b , Gian Luca Garagnani a a Department of Engineering, University of Ferrara, Via Saragat 1, I-44100 Ferrara, Italy b Department of Management and Engineering, University of Padova, Stradella S. Nicola 3, I-36100 Vicenza, Italy article info Article history: Received 2 April 2007 Received in revised form 6 March 2008 Accepted 15 March 2008 Keywords: Aluminium alloys Impact strength Castings defects Microstructure Numerical simulation abstract Instrumented impact strength tests have been carried out on KV sub-size Charpy samples drawn from A356 aluminium alloy 17-in. wheels, produced by a low-pressure die cast- ing. The wheels show different geometry and thermal treatment. In this paper, the effects of microstructure and defects on the impact properties are studied. The results indicate that the impact energy is lower in as-cast wheel than in T6 heat-treated wheels. A finer microstructure always corresponds to higher impact strength, while a direct correlation between the resistance to crack propagation values and secondary dendrite arm spacing (SDAS) exists. Casting defects, revealed by means of X-ray and density measurements tech- niques, become critical when concentrated around the V-notch, where they reduce the load bearing area of Charpy specimens. The fracture profile and surface of Charpy spec- imens have been investigated revealing how the crack crosses the interdendritic eutectic region where a significant fraction of cracked eutectic silicon and intermetallic particles is found. Numerical simulations have been performed to study the filling and solidification behaviour of the alloy of the wheels analysed, in order to predict the final microstructure and shrinkage formation. Solidification times, estimated by means of SDAS measurements and calculated with a numerical simulation approach, show a good correspondence. Critical areas, as concern hot spots and shrinkage porosities, are generally revealed in the zone of the wheels between the spoke and the rim, as well as in the rim area. © 2008 Elsevier B.V. All rights reserved. 1. Introduction Lowering pollutant emission is a priority objective of inter- national policies together with lowering energy consumption and increasing recycled materials; not only for its effect on the quality and environmental equilibrium, but because it has a strong impact in the competitiveness of companies in several sectors. In this context, only the introduction of tech- ∗ Corresponding author. Tel.: +39 0532 974914; fax: +39 0532 974870. E-mail addresses: [email protected] (M. Merlin), [email protected] (G. Timelli), [email protected] (F. Bonollo), [email protected] (G.L. Garagnani). nological innovation will be able to reconcile objectives of an environmental and energetic nature with those of a com- petitive type. Recently, the application of aluminium alloys in automotive sector can be one of these economically sus- tainable innovations, which enable a wider mix of objectives to be achieved. Both Flinn (1963) and Sicha (1971) affirm in their works that, due to their excellent castability and good compromise between mechanical properties and lightness, 0924-0136/$ – see front matter © 2008 Elsevier B.V. All rights reserved. doi:10.1016/j.jmatprotec.2008.03.027

Welcome message from author
This document is posted to help you gain knowledge. Please leave a comment to let me know what you think about it! Share it to your friends and learn new things together.
Transcript
j o u r n a l o f m a t e r i a l s p r o c e s s i n g t e c h n o l o g y 2 0 9 ( 2 0 0 9 ) 1060–1073
journa l homepage: www.e lsev ier .com/ locate / jmatprotec
Impact behaviour of A356 alloy for low-pressure diecasting automotive wheels
Mattia Merlina,∗, Giulio Timelli b, Franco Bonollob, Gian Luca Garagnania
a Department of Engineering, University of Ferrara, Via Saragat 1, I-44100 Ferrara, Italyb Department of Management and Engineering, University of Padova,Stradella S. Nicola 3, I-36100 Vicenza, Italy
a r t i c l e i n f o
Article history:
Received 2 April 2007
Received in revised form
6 March 2008
Accepted 15 March 2008
Keywords:
Aluminium alloys
Impact strength
Castings defects
Microstructure
Numerical simulation
a b s t r a c t
Instrumented impact strength tests have been carried out on KV sub-size Charpy samples
drawn from A356 aluminium alloy 17-in. wheels, produced by a low-pressure die cast-
ing. The wheels show different geometry and thermal treatment. In this paper, the effects
of microstructure and defects on the impact properties are studied. The results indicate
that the impact energy is lower in as-cast wheel than in T6 heat-treated wheels. A finer
microstructure always corresponds to higher impact strength, while a direct correlation
between the resistance to crack propagation values and secondary dendrite arm spacing
(SDAS) exists. Casting defects, revealed by means of X-ray and density measurements tech-
niques, become critical when concentrated around the V-notch, where they reduce the
load bearing area of Charpy specimens. The fracture profile and surface of Charpy spec-
imens have been investigated revealing how the crack crosses the interdendritic eutectic
region where a significant fraction of cracked eutectic silicon and intermetallic particles is
found.
Numerical simulations have been performed to study the filling and solidification
behaviour of the alloy of the wheels analysed, in order to predict the final microstructure
and shrinkage formation. Solidification times, estimated by means of SDAS measurements
and calculated with a numerical simulation approach, show a good correspondence. Critical
areas, as concern hot spots and shrinkage porosities, are generally revealed in the zone of
the wheels between the spoke and the rim, as well as in the rim area.
tainable innovations, which enable a wider mix of objectives
1. Introduction
Lowering pollutant emission is a priority objective of inter-national policies together with lowering energy consumptionand increasing recycled materials; not only for its effect on
the quality and environmental equilibrium, but because ithas a strong impact in the competitiveness of companies inseveral sectors. In this context, only the introduction of tech-∗ Corresponding author. Tel.: +39 0532 974914; fax: +39 0532 974870.E-mail addresses: [email protected] (M. Merlin), [email protected]
[email protected] (G.L. Garagnani).0924-0136/$ – see front matter © 2008 Elsevier B.V. All rights reserved.doi:10.1016/j.jmatprotec.2008.03.027
© 2008 Elsevier B.V. All rights reserved.
nological innovation will be able to reconcile objectives ofan environmental and energetic nature with those of a com-petitive type. Recently, the application of aluminium alloysin automotive sector can be one of these economically sus-
nipd.it (G. Timelli), [email protected] (F. Bonollo),
to be achieved. Both Flinn (1963) and Sicha (1971) affirm intheir works that, due to their excellent castability and goodcompromise between mechanical properties and lightness,
t e c h
aus
ramruroacmwmatcba8
mmtmtAesfamottrtt
ef(Adso0pidaeet
pia
j o u r n a l o f m a t e r i a l s p r o c e s s i n g
luminium–silicon alloys are the most important and widelysed casting alloys in order to cast components with complexhapes.
A consolidated example of aluminium alloy employmentegards the production of wheels, which, together withn improved aesthetic appearance, guarantees an improve-ent of driving, like directed consequence of the inertia
eduction of the wheels. These components are somewhatnique as they must meet, or exceed, a combination ofequirements, from high-quality surface finish, as wheels arene of the prominent cosmetic features of cars, to impactnd fatigue performance, because wheels are critical safetyomponents. Generally, the main technology for casting alu-inium alloy wheels is the low-pressure die casting (LPDC),hich guarantees to obtain a good compromise between high-echanical properties, high production, cost-effectiveness
nd design demand. Street (1986) stated that LPDC allowso produce castings similar to those obtained by gravityasting, with good superficial aspect and thin thicknesses,ut the advantage to have one central metal inlet and thebsence of risers allows to obtain an optimal yield, around5–95%.
Li et al. (2004) analysed the effect of various alloying ele-ents and different heat treatments in A319-type alloys byeans of instrumented impact test; in particular they found
hat impact tests can give a measure of the capability of theaterial to resist to crash, providing an useful estimation of
he ductility of an alloy under conditions of rapid loading.nalysing the impact properties of Al–Si foundry alloys, Parayt al. (2000) evaluated the total absorbed energy of the samplesubjected to impact test like the sum of the energy requiredor crack nucleation and the energy required for crack prop-gation, in order to describe the dynamic toughness of theaterial. Srivastava et al. (2006) demonstrated that in the case
f cast aluminium alloys the presence of a notch can decreasehe impact values even further, by up 80%, when comparedo un-notched specimens; even a shallow scratch of 0.1 mmeduces the energy absorption by 30%. If a notch is present,he absorbed energy can be dependent on the notch geometryhan on the microstructure.
Impact test is a useful methodology in evaluating theffects of process parameters and microstructure on dynamicracture toughness of engineering materials. Murali et al.1992) evaluated the influence of magnesium content in thelSi7Mg0.3 alloy with low-iron level: the absorbed energyrops significantly by about 50% with increasing magne-ium content from 0.32 to 0.65 wt.%. Similar behaviour isbserved increasing the iron content from 0.2 to 0.8 wt.%, at.32 wt.% Mg, due to an increased precipitation of �-Al5FeSilatelets. Shivkumar et al. (1994), analysing Charpy specimens
n A356-T6 machined from plate and cylindrical castings,emonstrated that the strontium modification, as well asn increase of solidification rate, improves the impact prop-rties of sand and permanent mould castings, even if theffect is more pronounced at low-magnesium and -iron con-ent.
As specified by Zhang et al. (2002), the T6 heat treatmentrovides beneficial effects to cast aluminium components:
t increases the yield strength, through the precipitation oflarge number of fine �′-Mg2Si particles, and improves the
n o l o g y 2 0 9 ( 2 0 0 9 ) 1060–1073 1061
ductility, through spheroidisation of the eutectic silicon parti-cles. Earlier Caceres et al. (1995) and later Wang and Caceres(1998) observed that the inter-particle spacing plays a domi-nant role in determining cracks’ nucleation and propagationand that the fracture path considerably depends on the den-drite cell size. The nucleation of the cracks usually starts withcracking of brittle particles. Once a large number of parti-cles are cracked, cracks grow by linking microvoids formed bythe cracking of these particles. With a smaller inter-particlespacing, the microvoids link and grow easily. Li et al. (2004)demonstrated that oxides, such as phosphorous oxides, whichact as nucleation sites for Al2Cu precipitates in A319-T6 alloy,can accelerate the cracking process reducing the impact prop-erties.
While the benefit effect of T6 heat treatment is recog-nized, the additional cost and required time are substantial.Zhang et al. (2002) showed that shortening the total timeof the T6 heat treatment cycle there exists a region wherethe impact energy decreases to a minimum before increas-ing. The cause of this region seems due to a conflict betweenthe negative effect of solution treatment on ductility andimpact strength, associated with a rapid increase in the yieldstrength and the more slowly developing positive effect asso-ciated with the spheroidization and coarsening of siliconparticles.
The aim of this study is to investigate the impact prop-erties of KV sub-size Charpy specimens, drawn from A35617-in. wheels with different geometry and temper, by meansof instrumented Charpy impact testing including discussionof individual energy portions during fracture. Microstructuralfeatures, such as secondary dendrite arm spacing (SDAS) andeutectic silicon particles, have been correlated to impact prop-erties: absorbed energy, maximum load, crack nucleation andpropagation energy. Caceres and Selling (1996) carried out aseries of experiments to quantify the effect of casting defectsin AlSi7Mg0.4-T6 casting alloy and they found that poros-ity is critical on mechanical properties of cast aluminiumalloys, since it can overcome the effect of microstructureitself. In order to evaluate the presence of porosity, densitymeasurements and X-ray investigations have been carriedout on KV samples. In addition to metallographic inspec-tions, fractography has been presented to underline the effectof microconstituents on crack nucleation and propagation.Concurrent with experimental approach, the filling and solid-ification behaviour of the wheels analysed have been assessedvia numerical simulation codes.
2. Experimental procedure
Instrumented impact tests have been performed on KV sub-size Charpy specimens drawn from different A356 wheels,named wheel-1, wheel-2 and wheel-3, respectively. Whilewheel-1, a 7-spoke wheel in the as-cast temper, has a weight of10.6 kg, wheel-2 and wheel-3, which are 5-spoke wheels in thesame T6 condition, weigh 12.2 and 11.9 kg, respectively. The
wheels’ diameter is 43.35 cm, while the rim width is 21.8 cmfor wheel-1 and 19.1 cm for wheel-2 and wheel-3. The wheelsdiffer mainly on the geometry and thickness of spokes andrims. All the wheels were cast by LPDC.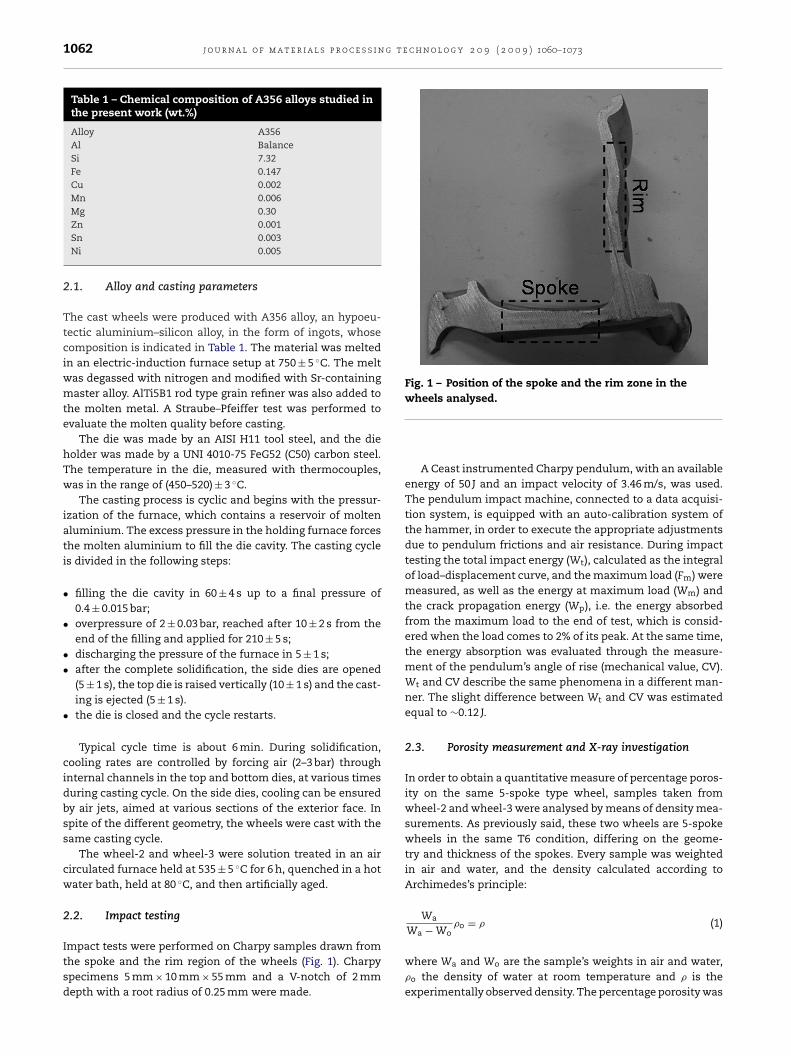
1062 j o u r n a l o f m a t e r i a l s p r o c e s s i n g t e c h n o l o g y 2 0 9 ( 2 0 0 9 ) 1060–1073
Table 1 – Chemical composition of A356 alloys studied inthe present work (wt.%)
Alloy A356Al BalanceSi 7.32Fe 0.147Cu 0.002Mn 0.006Mg 0.30
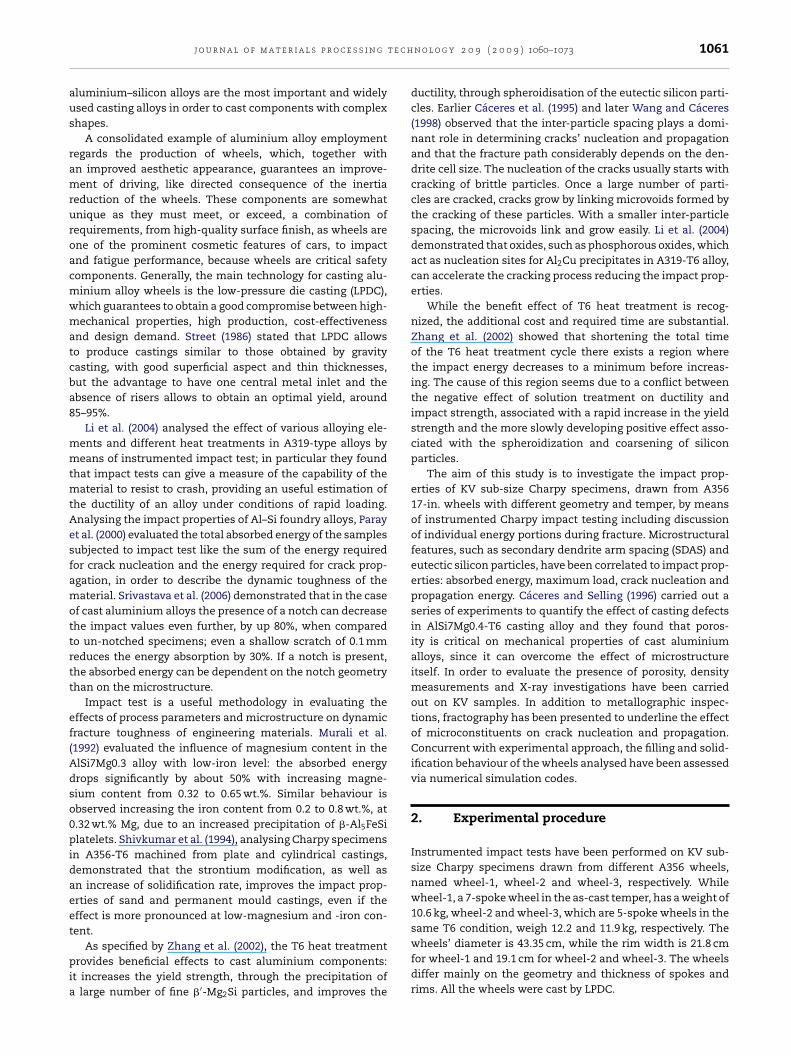
Fig. 1 – Position of the spoke and the rim zone in thewheels analysed.
Zn 0.001Sn 0.003Ni 0.005
2.1. Alloy and casting parameters
The cast wheels were produced with A356 alloy, an hypoeu-tectic aluminium–silicon alloy, in the form of ingots, whosecomposition is indicated in Table 1. The material was meltedin an electric-induction furnace setup at 750 ± 5 ◦C. The meltwas degassed with nitrogen and modified with Sr-containingmaster alloy. AlTi5B1 rod type grain refiner was also added tothe molten metal. A Straube–Pfeiffer test was performed toevaluate the molten quality before casting.
The die was made by an AISI H11 tool steel, and the dieholder was made by a UNI 4010-75 FeG52 (C50) carbon steel.The temperature in the die, measured with thermocouples,was in the range of (450–520) ± 3 ◦C.
The casting process is cyclic and begins with the pressur-ization of the furnace, which contains a reservoir of moltenaluminium. The excess pressure in the holding furnace forcesthe molten aluminium to fill the die cavity. The casting cycleis divided in the following steps:
• filling the die cavity in 60 ± 4 s up to a final pressure of0.4 ± 0.015 bar;
• overpressure of 2 ± 0.03 bar, reached after 10 ± 2 s from theend of the filling and applied for 210 ± 5 s;
• discharging the pressure of the furnace in 5 ± 1 s;• after the complete solidification, the side dies are opened
(5 ± 1 s), the top die is raised vertically (10 ± 1 s) and the cast-ing is ejected (5 ± 1 s).
• the die is closed and the cycle restarts.
Typical cycle time is about 6 min. During solidification,cooling rates are controlled by forcing air (2–3 bar) throughinternal channels in the top and bottom dies, at various timesduring casting cycle. On the side dies, cooling can be ensuredby air jets, aimed at various sections of the exterior face. Inspite of the different geometry, the wheels were cast with thesame casting cycle.
The wheel-2 and wheel-3 were solution treated in an aircirculated furnace held at 535 ± 5 ◦C for 6 h, quenched in a hotwater bath, held at 80 ◦C, and then artificially aged.
2.2. Impact testing
Impact tests were performed on Charpy samples drawn fromthe spoke and the rim region of the wheels (Fig. 1). Charpyspecimens 5 mm × 10 mm × 55 mm and a V-notch of 2 mmdepth with a root radius of 0.25 mm were made.
A Ceast instrumented Charpy pendulum, with an availableenergy of 50 J and an impact velocity of 3.46 m/s, was used.The pendulum impact machine, connected to a data acquisi-tion system, is equipped with an auto-calibration system ofthe hammer, in order to execute the appropriate adjustmentsdue to pendulum frictions and air resistance. During impacttesting the total impact energy (Wt), calculated as the integralof load–displacement curve, and the maximum load (Fm) weremeasured, as well as the energy at maximum load (Wm) andthe crack propagation energy (Wp), i.e. the energy absorbedfrom the maximum load to the end of test, which is consid-ered when the load comes to 2% of its peak. At the same time,the energy absorption was evaluated through the measure-ment of the pendulum’s angle of rise (mechanical value, CV).Wt and CV describe the same phenomena in a different man-ner. The slight difference between Wt and CV was estimatedequal to ∼0.12 J.
2.3. Porosity measurement and X-ray investigation
In order to obtain a quantitative measure of percentage poros-ity on the same 5-spoke type wheel, samples taken fromwheel-2 and wheel-3 were analysed by means of density mea-surements. As previously said, these two wheels are 5-spokewheels in the same T6 condition, differing on the geome-try and thickness of the spokes. Every sample was weightedin air and water, and the density calculated according toArchimedes’s principle:
Wa
Wa − Wo�o = � (1)
where Wa and Wo are the sample’s weights in air and water,�o the density of water at room temperature and � is theexperimentally observed density. The percentage porosity was
t e c h
d
P
w
nftvtl
2
TisaetdSo
moasFim(
2
Tliat
•
••
ivdaa
ioaed
j o u r n a l o f m a t e r i a l s p r o c e s s i n g
efined by the equation:
orosity (%) = �nom − �
�nom× 100 (2)
here �nom is the density of fully dense material.In order to localise the porosity distribution around the
otch, impact test specimens were analysed with a micro-ocus X-ray equipment, which can magnify an image severalimes while still offering a better definition than a con-entional X-ray tube. Every wheel was previously mappedhroughout with a macro focus X-ray equipment for a pre-iminary analysis and comparison.
.4. Image analysis and fractography
he microstructures of the as-cast and the T6 heat-treatedmpact test samples were observed using an optical micro-cope and quantitatively analysed by means of an imagenalyser. Average SDAS values were obtained using the lin-ar intercept method. In each specimen, drawn from the hub,he spoke and the rim region of the wheels analysed, ten ran-om areas were acquired over the entire sample surface forDAS analysis. Several measurements were done, in order tobtain reliable mean values.
Important information, concerning fracture path andicrostructure components involved in crack process, were
btained observing the fracture profile, on the prepared met-llographic section, cut out perpendicularly to the fractureurface. An optical microscope was used for this investigation.inally, the fracture surfaces of the Charpy specimens after thempact test were observed and analysed by scanning electron
icroscopy (SEM) and by energy dispersive X-ray spectroscopyEDS).
.5. Casting simulation
he MAGMASOFT® v.4.2. (2002) software, with its module forow-pressure die casting MAGMAlpdc, was used for numer-cally simulating the filling and solidification behaviour ofnalysed wheels. The characteristics of MAGMAlpdc used inhis study are as follows:
ease of physical interpretation of various steps of algo-rithms;conservation of physical properties;reduction of solving time.
Basic governing equations of MAGMASOFT® are continu-ty equation, Navier–Stoke’s equation, energy equation andolume of fluid (VoF) method for the free surface movementuring the die filling. MAGMAlpdc employs the finite volumepproach to convert differential equations into algebraic onesnd solve them on a rectangular grid.
For every wheel, the CAD model was drawn and importedn the simulation software where a controlled volume mesh
f 15,300,000 cells for the whole system (die and casting) wasutomatically generated by MAGMAlpdc; a mesh of 670,000lements was generated for the die cavity. The initial con-itions for numerical simulation were defined to reproducen o l o g y 2 0 9 ( 2 0 0 9 ) 1060–1073 1063
the LPDC parameters. The pouring temperature was set at750 ◦C, while, for the die, the temperature for the first cyclewas assumed to be at a uniform temperature of 450 ◦C. In thesubsequent cycles, the initial temperature in the die is takento be the predicted temperature distribution at the end of theprevious cycle. A number of 15–20 cycles were taken after thestart up to reach a quasi-steady-state temperature in the die.The thermal conductivity of the die and die holder varied inthe range of 33.4–31.5 and 39.4–35.6 W/mK, respectively, in theworking temperature range of 450–520 ◦C. The thermal con-ditioning of the die is given by air circuits or jets at 30 ◦C.The other physical constants and properties of the die andthe alloy, and their evolution with temperature, were chosenamong those present in the MAGMASOFT® v.4.2. (2002) soft-ware database, as well as the heat transfer coefficients (HTC),taking into account affecting parameters, like the type andthickness of coating, and the pouring temperature. To definethe whole set of boundary conditions in the model, the processparameters (e.g. regarding the filling and cooling cycle) and thecycle time, acquired from the casting process, were importedin the software, increasing the reliability of numerical simu-lation. Virtual thermocouples were inserted in the differentzones of the die in order to control the temperature profilesand to compare these values with the real ones. Solidificationtime and feeding properties were assessed via numerical sim-ulation codes, in order to predict the final microstructure andthe shrinkage formation.
3. Results and discussion
3.1. Microstructural analysis
Impact strength tests can supply useful information on frac-ture mechanisms of the material under conditions of rapidloading and on the role played by the secondary phase par-ticles and the defects like porosity, oxides and inclusions oncrack trigger and propagation, and on fracture morphology.
The microstructure of the wheels analysed consists of aprimary phase, �-Al solid solution, and an eutectic mixture ofaluminium and silicon. �-Al precipitates from the liquid as theprimary phase in the form of dendrites. Intermetallics com-pounds, such as Fe-rich intermetallics, were also observed.
The scale of microstructure in different zones of the wheelsanalysed was characterized by means of SDAS measurementsand then correlated with impact properties. These data aredescribed in Section 3.2.1.
In Fig. 2, typical microstructures of the wheels analysed arereported with reference to the different positions, in particularthe hub (H), the spoke (S) and the rim (R) zones. While Fig. 2ashows the microstructure of as-cast wheel-1, in Fig. 2b themicrostructure of T6 heat-treated wheel-2 is presented.
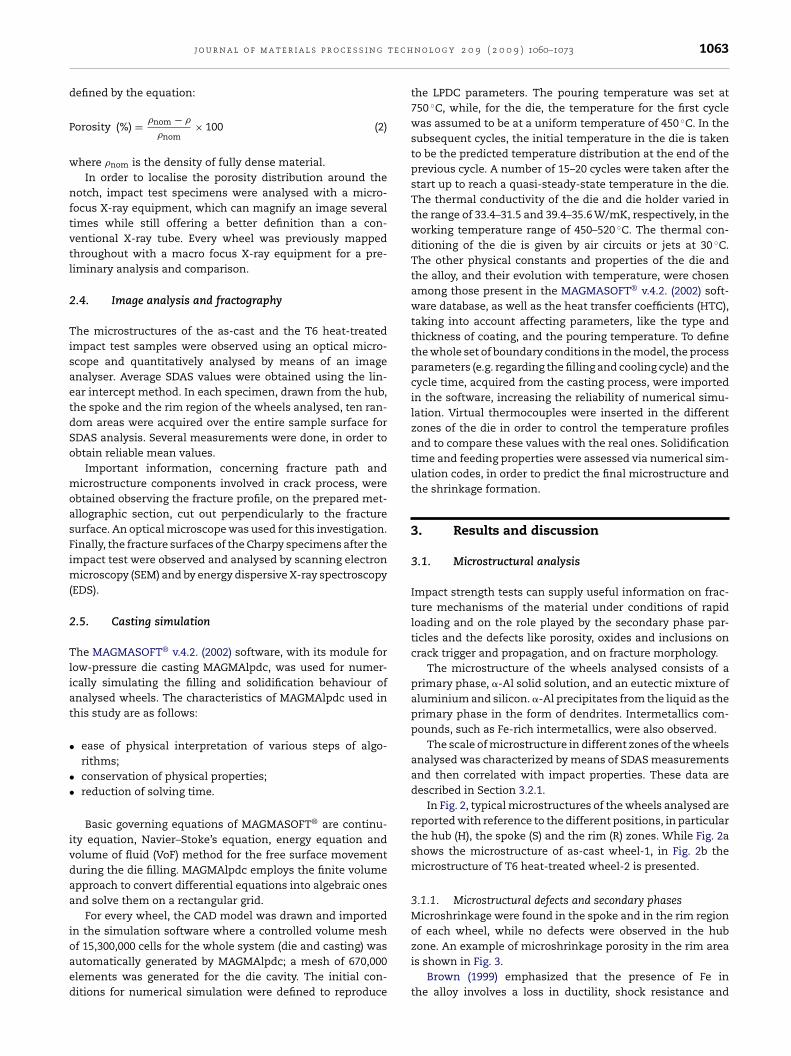
3.1.1. Microstructural defects and secondary phasesMicroshrinkage were found in the spoke and in the rim regionof each wheel, while no defects were observed in the hub
zone. An example of microshrinkage porosity in the rim areais shown in Fig. 3.Brown (1999) emphasized that the presence of Fe inthe alloy involves a loss in ductility, shock resistance and
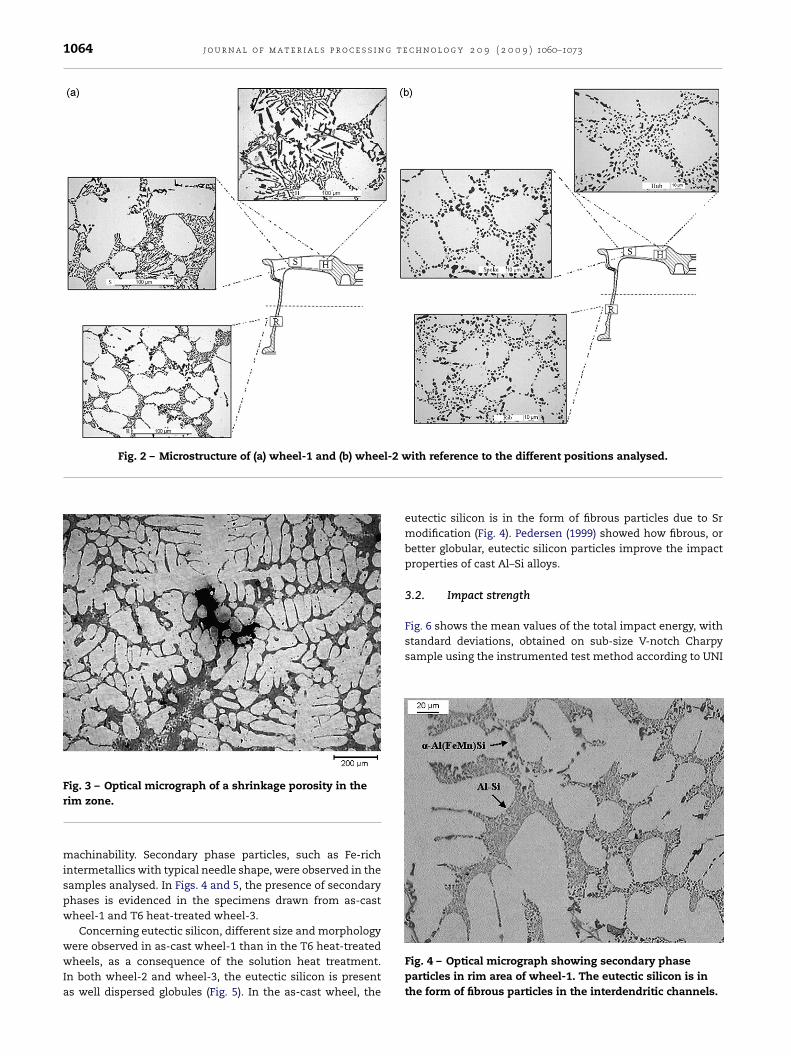
1064 j o u r n a l o f m a t e r i a l s p r o c e s s i n g t e c h n o l o g y 2 0 9 ( 2 0 0 9 ) 1060–1073
Fig. 2 – Microstructure of (a) wheel-1 and (b) wheel-2 w
Fig. 3 – Optical micrograph of a shrinkage porosity in the
Fig. 6 shows the mean values of the total impact energy, withstandard deviations, obtained on sub-size V-notch Charpysample using the instrumented test method according to UNI
rim zone.
machinability. Secondary phase particles, such as Fe-richintermetallics with typical needle shape, were observed in thesamples analysed. In Figs. 4 and 5, the presence of secondaryphases is evidenced in the specimens drawn from as-castwheel-1 and T6 heat-treated wheel-3.
Concerning eutectic silicon, different size and morphology
were observed in as-cast wheel-1 than in the T6 heat-treatedwheels, as a consequence of the solution heat treatment.In both wheel-2 and wheel-3, the eutectic silicon is presentas well dispersed globules (Fig. 5). In the as-cast wheel, theith reference to the different positions analysed.
eutectic silicon is in the form of fibrous particles due to Srmodification (Fig. 4). Pedersen (1999) showed how fibrous, orbetter globular, eutectic silicon particles improve the impactproperties of cast Al–Si alloys.
3.2. Impact strength
Fig. 4 – Optical micrograph showing secondary phaseparticles in rim area of wheel-1. The eutectic silicon is inthe form of fibrous particles in the interdendritic channels.
j o u r n a l o f m a t e r i a l s p r o c e s s i n g t e c h n o l o g y 2 0 9 ( 2 0 0 9 ) 1060–1073 1065
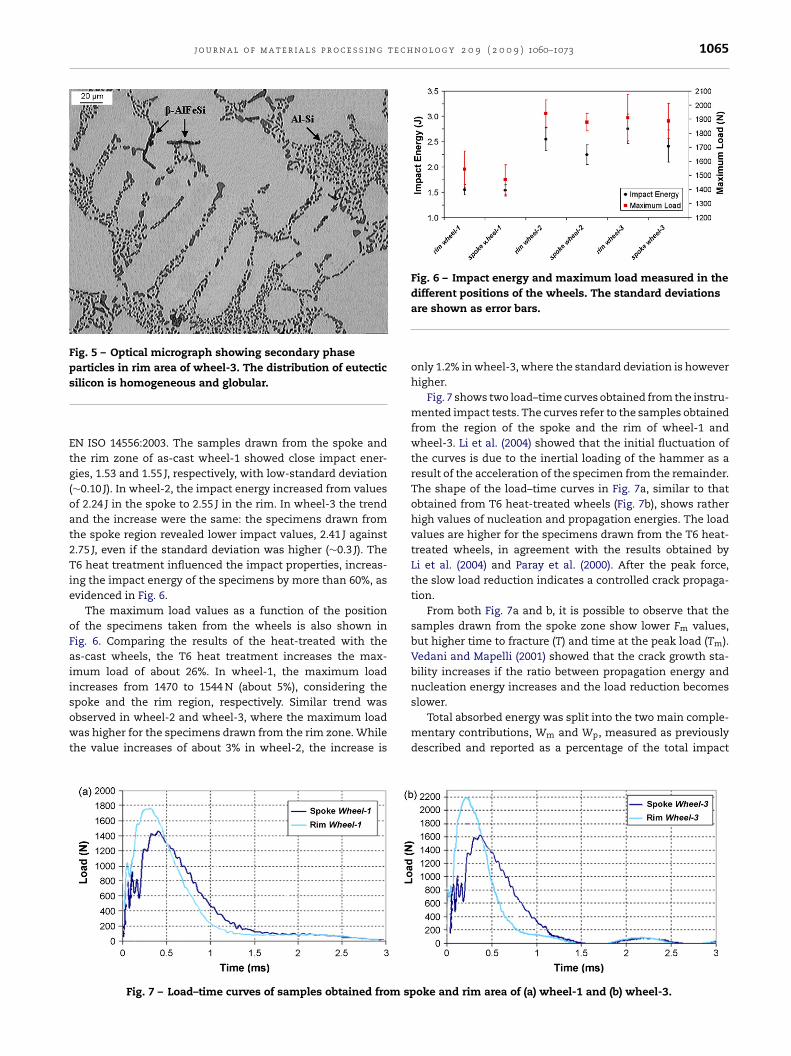
Fig. 5 – Optical micrograph showing secondary phaseparticles in rim area of wheel-3. The distribution of eutectics
Etg(oat2Tie
oFaiisowt
Fig. 6 – Impact energy and maximum load measured in thedifferent positions of the wheels. The standard deviations
ilicon is homogeneous and globular.
N ISO 14556:2003. The samples drawn from the spoke andhe rim zone of as-cast wheel-1 showed close impact ener-ies, 1.53 and 1.55 J, respectively, with low-standard deviation∼0.10 J). In wheel-2, the impact energy increased from valuesf 2.24 J in the spoke to 2.55 J in the rim. In wheel-3 the trendnd the increase were the same: the specimens drawn fromhe spoke region revealed lower impact values, 2.41 J against.75 J, even if the standard deviation was higher (∼0.3 J). The6 heat treatment influenced the impact properties, increas-
ng the impact energy of the specimens by more than 60%, asvidenced in Fig. 6.
The maximum load values as a function of the positionf the specimens taken from the wheels is also shown inig. 6. Comparing the results of the heat-treated with thes-cast wheels, the T6 heat treatment increases the max-mum load of about 26%. In wheel-1, the maximum loadncreases from 1470 to 1544 N (about 5%), considering the
poke and the rim region, respectively. Similar trend wasbserved in wheel-2 and wheel-3, where the maximum loadas higher for the specimens drawn from the rim zone. Whilehe value increases of about 3% in wheel-2, the increase is
Fig. 7 – Load–time curves of samples obtained from sp
are shown as error bars.
only 1.2% in wheel-3, where the standard deviation is howeverhigher.
Fig. 7 shows two load–time curves obtained from the instru-mented impact tests. The curves refer to the samples obtainedfrom the region of the spoke and the rim of wheel-1 andwheel-3. Li et al. (2004) showed that the initial fluctuation ofthe curves is due to the inertial loading of the hammer as aresult of the acceleration of the specimen from the remainder.The shape of the load–time curves in Fig. 7a, similar to thatobtained from T6 heat-treated wheels (Fig. 7b), shows ratherhigh values of nucleation and propagation energies. The loadvalues are higher for the specimens drawn from the T6 heat-treated wheels, in agreement with the results obtained byLi et al. (2004) and Paray et al. (2000). After the peak force,the slow load reduction indicates a controlled crack propaga-tion.
From both Fig. 7a and b, it is possible to observe that thesamples drawn from the spoke zone show lower Fm values,but higher time to fracture (T) and time at the peak load (Tm).Vedani and Mapelli (2001) showed that the crack growth sta-bility increases if the ratio between propagation energy andnucleation energy increases and the load reduction becomes
slower.Total absorbed energy was split into the two main comple-mentary contributions, Wm and Wp, measured as previouslydescribed and reported as a percentage of the total impact
oke and rim area of (a) wheel-1 and (b) wheel-3.
1066 j o u r n a l o f m a t e r i a l s p r o c e s s i n g t e c h n o l o g y 2 0 9 ( 2 0 0 9 ) 1060–1073
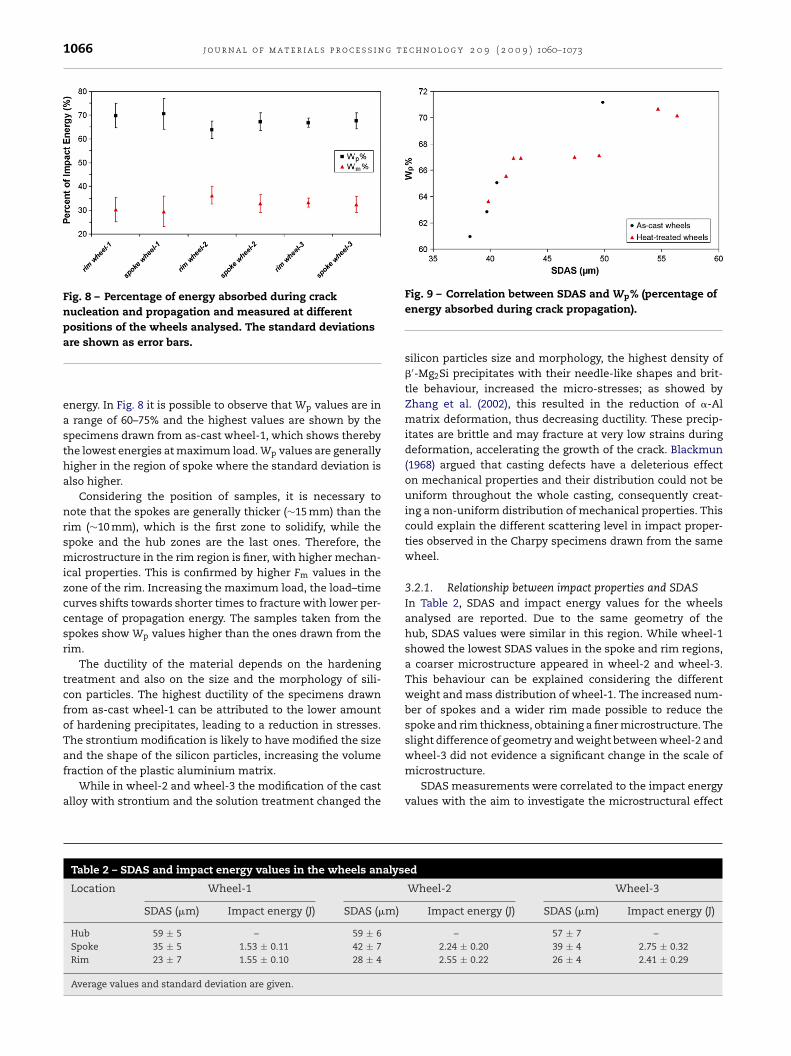
Fig. 8 – Percentage of energy absorbed during cracknucleation and propagation and measured at differentpositions of the wheels analysed. The standard deviations
are shown as error bars.energy. In Fig. 8 it is possible to observe that Wp values are ina range of 60–75% and the highest values are shown by thespecimens drawn from as-cast wheel-1, which shows therebythe lowest energies at maximum load. Wp values are generallyhigher in the region of spoke where the standard deviation isalso higher.
Considering the position of samples, it is necessary tonote that the spokes are generally thicker (∼15 mm) than therim (∼10 mm), which is the first zone to solidify, while thespoke and the hub zones are the last ones. Therefore, themicrostructure in the rim region is finer, with higher mechan-ical properties. This is confirmed by higher Fm values in thezone of the rim. Increasing the maximum load, the load–timecurves shifts towards shorter times to fracture with lower per-centage of propagation energy. The samples taken from thespokes show Wp values higher than the ones drawn from therim.
The ductility of the material depends on the hardeningtreatment and also on the size and the morphology of sili-con particles. The highest ductility of the specimens drawnfrom as-cast wheel-1 can be attributed to the lower amountof hardening precipitates, leading to a reduction in stresses.The strontium modification is likely to have modified the size
and the shape of the silicon particles, increasing the volumefraction of the plastic aluminium matrix.While in wheel-2 and wheel-3 the modification of the castalloy with strontium and the solution treatment changed the
Table 2 – SDAS and impact energy values in the wheels analyse
Location Wheel-1
SDAS (�m) Impact energy (J) SDAS (�m)
Hub 59 ± 5 – 59 ± 6Spoke 35 ± 5 1.53 ± 0.11 42 ± 7Rim 23 ± 7 1.55 ± 0.10 28 ± 4
Average values and standard deviation are given.
Fig. 9 – Correlation between SDAS and Wp% (percentage ofenergy absorbed during crack propagation).
silicon particles size and morphology, the highest density of�′-Mg2Si precipitates with their needle-like shapes and brit-tle behaviour, increased the micro-stresses; as showed byZhang et al. (2002), this resulted in the reduction of �-Almatrix deformation, thus decreasing ductility. These precip-itates are brittle and may fracture at very low strains duringdeformation, accelerating the growth of the crack. Blackmun(1968) argued that casting defects have a deleterious effecton mechanical properties and their distribution could not beuniform throughout the whole casting, consequently creat-ing a non-uniform distribution of mechanical properties. Thiscould explain the different scattering level in impact proper-ties observed in the Charpy specimens drawn from the samewheel.
3.2.1. Relationship between impact properties and SDASIn Table 2, SDAS and impact energy values for the wheelsanalysed are reported. Due to the same geometry of thehub, SDAS values were similar in this region. While wheel-1showed the lowest SDAS values in the spoke and rim regions,a coarser microstructure appeared in wheel-2 and wheel-3.This behaviour can be explained considering the differentweight and mass distribution of wheel-1. The increased num-ber of spokes and a wider rim made possible to reduce thespoke and rim thickness, obtaining a finer microstructure. Theslight difference of geometry and weight between wheel-2 and
wheel-3 did not evidence a significant change in the scale ofmicrostructure.SDAS measurements were correlated to the impact energyvalues with the aim to investigate the microstructural effect
d
Wheel-2 Wheel-3
Impact energy (J) SDAS (�m) Impact energy (J)
– 57 ± 7 –2.24 ± 0.20 39 ± 4 2.75 ± 0.322.55 ± 0.22 26 ± 4 2.41 ± 0.29
j o u r n a l o f m a t e r i a l s p r o c e s s i n g t e c h n o l o g y 2 0 9 ( 2 0 0 9 ) 1060–1073 1067
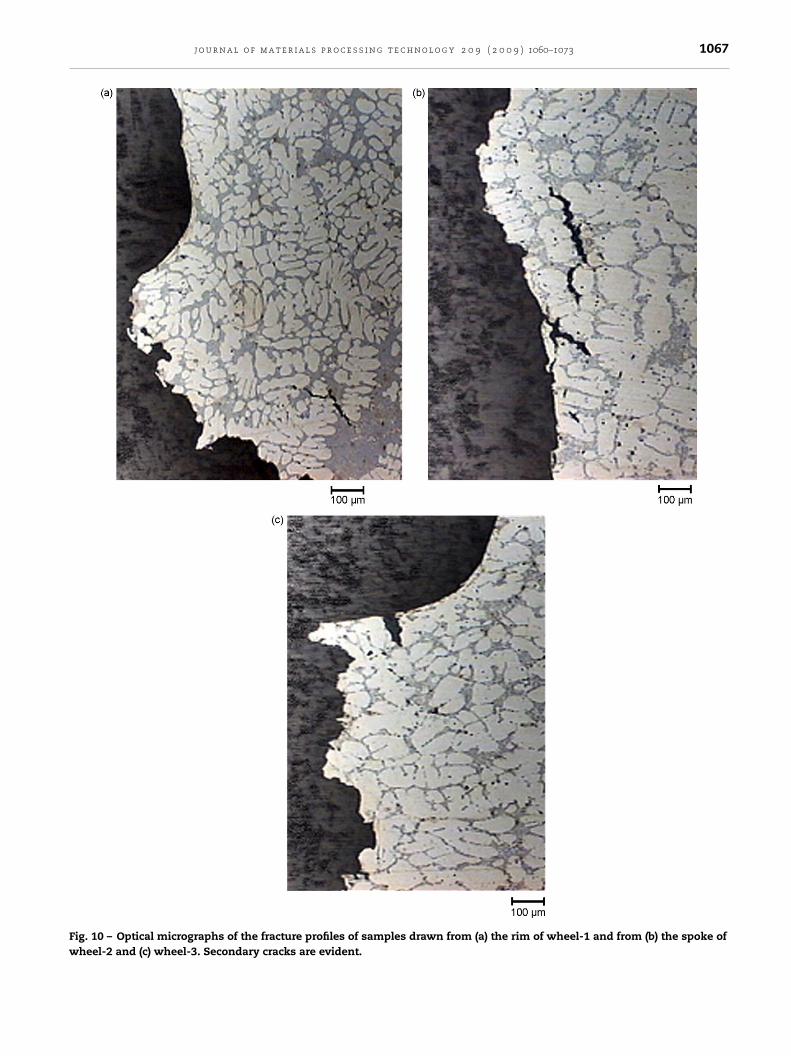
Fig. 10 – Optical micrographs of the fracture profiles of samples drawn from (a) the rim of wheel-1 and from (b) the spoke ofwheel-2 and (c) wheel-3. Secondary cracks are evident.
g t e
1068 j o u r n a l o f m a t e r i a l s p r o c e s s i non impact properties. In accordance with Li et al. (2004),it was possible to understand from Table 2, there existsan inverse correlation between SDAS and impact energy,a finer microstructure corresponds to an higher impactenergy.
In Fig. 9, the crack propagation energy (Wp) has been cor-related to SDAS values for the as-cast and the T6 heat-treatedwheels. A direct correlation has been found, not depending onthe wheel’s temper.
3.2.2. Microstructural analysis of fracture profilesThe crack crosses the interdendritic eutectic region, where asignificant fraction of cracked eutectic silicon and intermetal-lic particles is found, following the dendritic profile of the �-Alsolid solution. In Fig. 10a–c the fracture profiles of samplestaken from the different wheels can be seen. In agreement
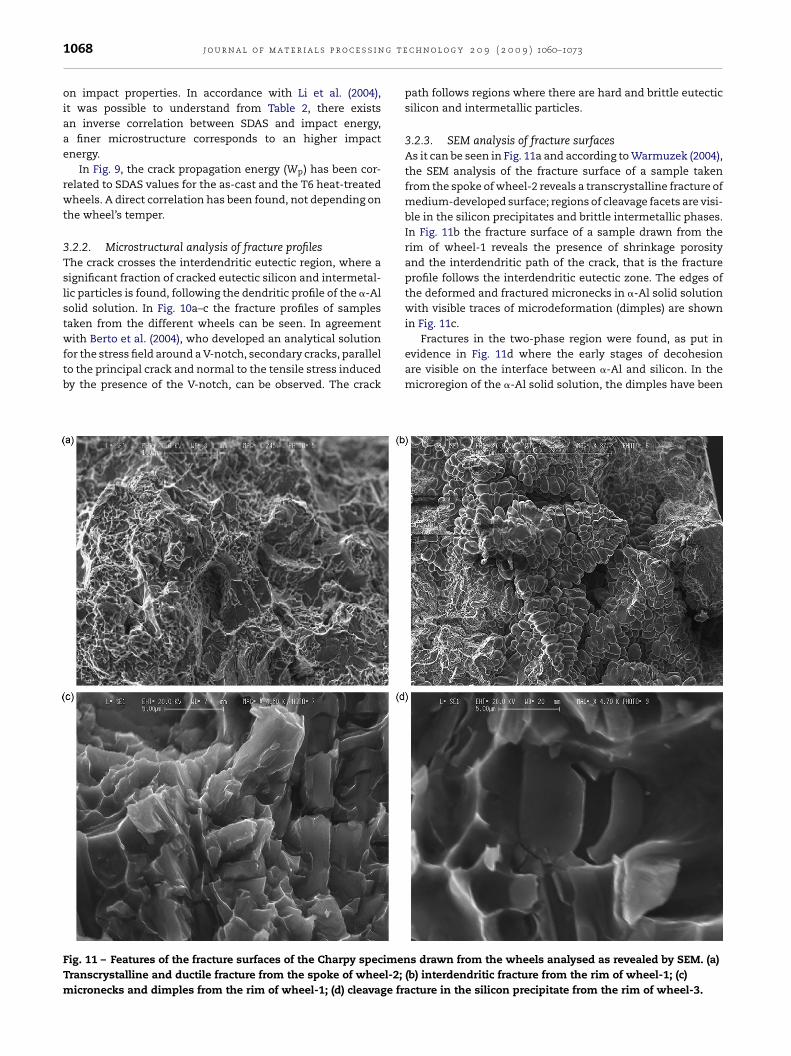
with Berto et al. (2004), who developed an analytical solutionfor the stress field around a V-notch, secondary cracks, parallelto the principal crack and normal to the tensile stress inducedby the presence of the V-notch, can be observed. The crackFig. 11 – Features of the fracture surfaces of the Charpy specimenTranscrystalline and ductile fracture from the spoke of wheel-2;micronecks and dimples from the rim of wheel-1; (d) cleavage fra
c h n o l o g y 2 0 9 ( 2 0 0 9 ) 1060–1073
path follows regions where there are hard and brittle eutecticsilicon and intermetallic particles.
3.2.3. SEM analysis of fracture surfacesAs it can be seen in Fig. 11a and according to Warmuzek (2004),the SEM analysis of the fracture surface of a sample takenfrom the spoke of wheel-2 reveals a transcrystalline fracture ofmedium-developed surface; regions of cleavage facets are visi-ble in the silicon precipitates and brittle intermetallic phases.In Fig. 11b the fracture surface of a sample drawn from therim of wheel-1 reveals the presence of shrinkage porosityand the interdendritic path of the crack, that is the fractureprofile follows the interdendritic eutectic zone. The edges ofthe deformed and fractured micronecks in �-Al solid solutionwith visible traces of microdeformation (dimples) are shownin Fig. 11c.
Fractures in the two-phase region were found, as put inevidence in Fig. 11d where the early stages of decohesionare visible on the interface between �-Al and silicon. In themicroregion of the �-Al solid solution, the dimples have been
s drawn from the wheels analysed as revealed by SEM. (a)(b) interdendritic fracture from the rim of wheel-1; (c)cture in the silicon precipitate from the rim of wheel-3.
j o u r n a l o f m a t e r i a l s p r o c e s s i n g t e c h n o l o g y 2 0 9 ( 2 0 0 9 ) 1060–1073 1069
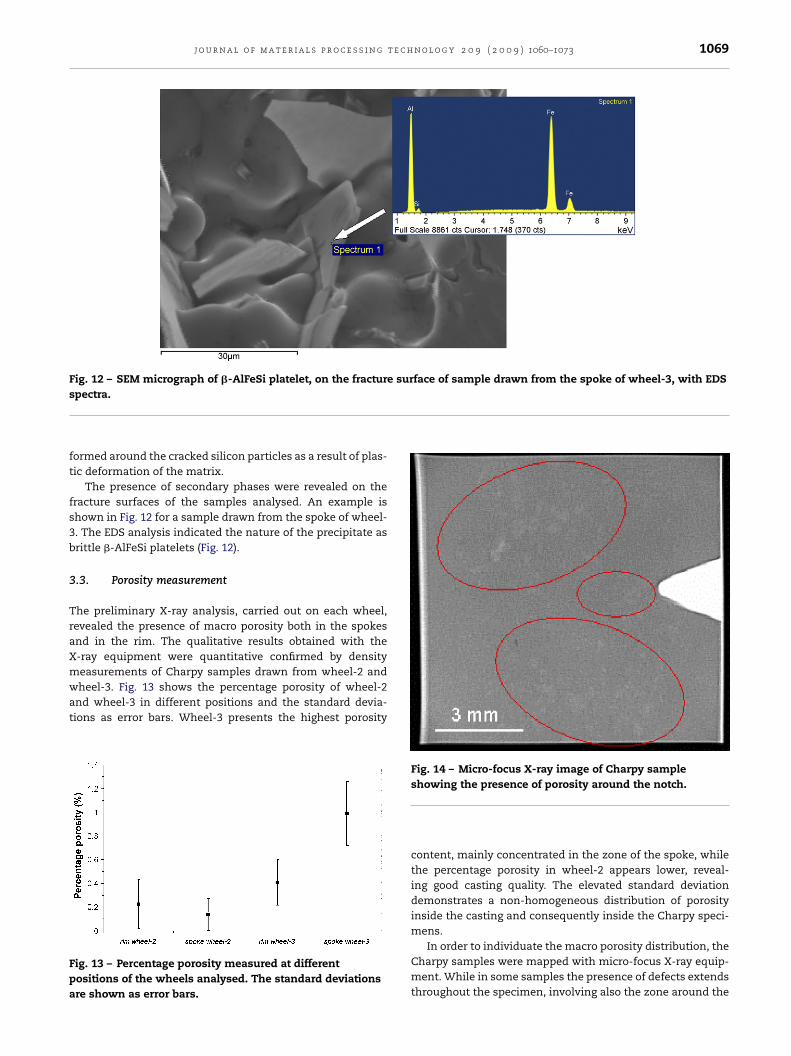
Fig. 12 – SEM micrograph of �-AlFeSi platelet, on the fracture surface of sample drawn from the spoke of wheel-3, with EDSs
ft
fs3b
3
TraXmwat
Fpa
pectra.
ormed around the cracked silicon particles as a result of plas-ic deformation of the matrix.
The presence of secondary phases were revealed on theracture surfaces of the samples analysed. An example ishown in Fig. 12 for a sample drawn from the spoke of wheel-. The EDS analysis indicated the nature of the precipitate asrittle �-AlFeSi platelets (Fig. 12).
.3. Porosity measurement
he preliminary X-ray analysis, carried out on each wheel,evealed the presence of macro porosity both in the spokesnd in the rim. The qualitative results obtained with the-ray equipment were quantitative confirmed by density
easurements of Charpy samples drawn from wheel-2 andheel-3. Fig. 13 shows the percentage porosity of wheel-2nd wheel-3 in different positions and the standard devia-ions as error bars. Wheel-3 presents the highest porosity
ig. 13 – Percentage porosity measured at differentositions of the wheels analysed. The standard deviationsre shown as error bars.
Fig. 14 – Micro-focus X-ray image of Charpy sampleshowing the presence of porosity around the notch.
content, mainly concentrated in the zone of the spoke, whilethe percentage porosity in wheel-2 appears lower, reveal-ing good casting quality. The elevated standard deviationdemonstrates a non-homogeneous distribution of porosityinside the casting and consequently inside the Charpy speci-mens.
In order to individuate the macro porosity distribution, theCharpy samples were mapped with micro-focus X-ray equip-ment. While in some samples the presence of defects extendsthroughout the specimen, involving also the zone around the
1070 j o u r n a l o f m a t e r i a l s p r o c e s s i n g t e c h n o l o g y 2 0 9 ( 2 0 0 9 ) 1060–1073
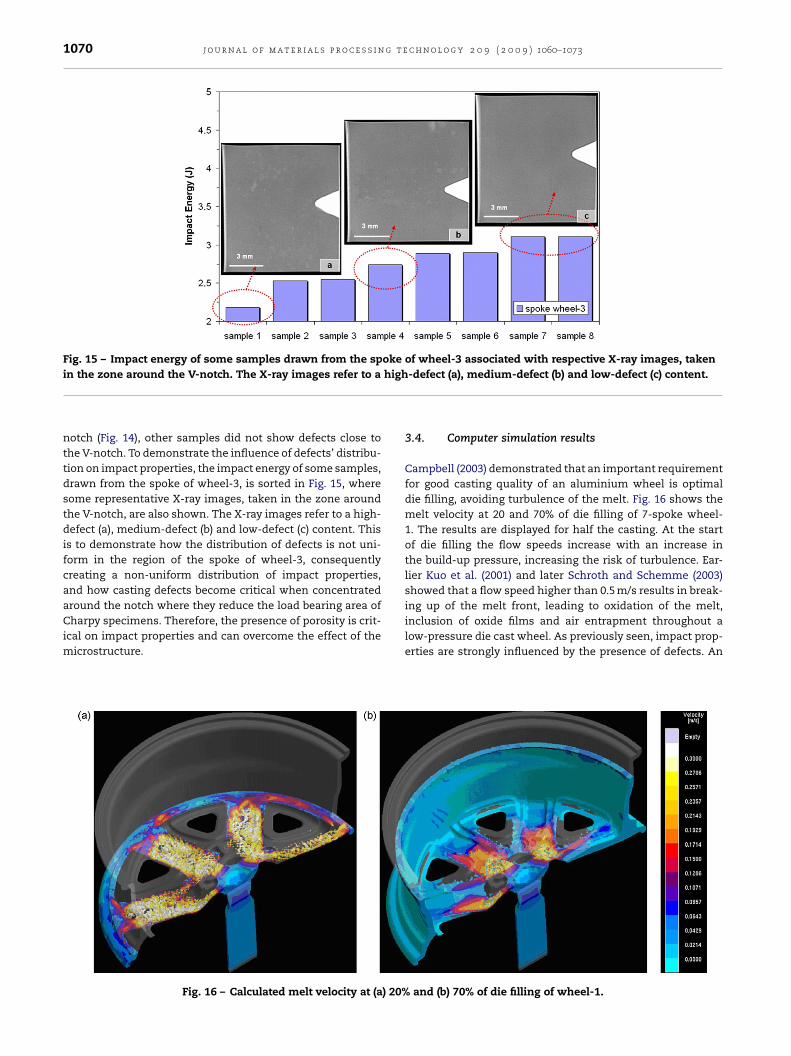
Fig. 15 – Impact energy of some samples drawn from the spoke of wheel-3 associated with respective X-ray images, takenhigh
in the zone around the V-notch. The X-ray images refer to anotch (Fig. 14), other samples did not show defects close tothe V-notch. To demonstrate the influence of defects’ distribu-tion on impact properties, the impact energy of some samples,drawn from the spoke of wheel-3, is sorted in Fig. 15, wheresome representative X-ray images, taken in the zone aroundthe V-notch, are also shown. The X-ray images refer to a high-defect (a), medium-defect (b) and low-defect (c) content. Thisis to demonstrate how the distribution of defects is not uni-form in the region of the spoke of wheel-3, consequentlycreating a non-uniform distribution of impact properties,and how casting defects become critical when concentratedaround the notch where they reduce the load bearing area of
Charpy specimens. Therefore, the presence of porosity is crit-ical on impact properties and can overcome the effect of themicrostructure.Fig. 16 – Calculated melt velocity at (a) 20%
-defect (a), medium-defect (b) and low-defect (c) content.
3.4. Computer simulation results
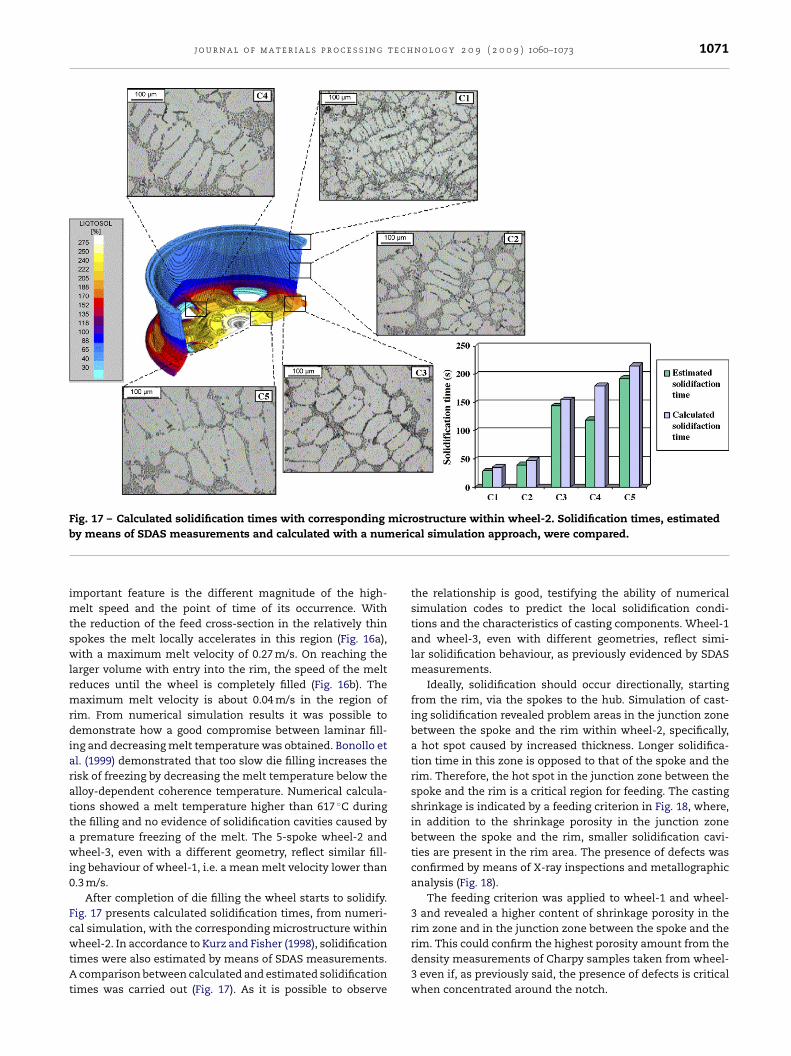
Campbell (2003) demonstrated that an important requirementfor good casting quality of an aluminium wheel is optimaldie filling, avoiding turbulence of the melt. Fig. 16 shows themelt velocity at 20 and 70% of die filling of 7-spoke wheel-1. The results are displayed for half the casting. At the startof die filling the flow speeds increase with an increase inthe build-up pressure, increasing the risk of turbulence. Ear-lier Kuo et al. (2001) and later Schroth and Schemme (2003)showed that a flow speed higher than 0.5 m/s results in break-ing up of the melt front, leading to oxidation of the melt,
inclusion of oxide films and air entrapment throughout alow-pressure die cast wheel. As previously seen, impact prop-erties are strongly influenced by the presence of defects. Anand (b) 70% of die filling of wheel-1.
j o u r n a l o f m a t e r i a l s p r o c e s s i n g t e c h n o l o g y 2 0 9 ( 2 0 0 9 ) 1060–1073 1071
Fig. 17 – Calculated solidification times with corresponding microstructure within wheel-2. Solidification times, estimatedb eric
imtswlrmrdiarattawi0
FcwtAt
y means of SDAS measurements and calculated with a num
mportant feature is the different magnitude of the high-elt speed and the point of time of its occurrence. With
he reduction of the feed cross-section in the relatively thinpokes the melt locally accelerates in this region (Fig. 16a),ith a maximum melt velocity of 0.27 m/s. On reaching the
arger volume with entry into the rim, the speed of the melteduces until the wheel is completely filled (Fig. 16b). The
aximum melt velocity is about 0.04 m/s in the region ofim. From numerical simulation results it was possible toemonstrate how a good compromise between laminar fill-
ng and decreasing melt temperature was obtained. Bonollo etl. (1999) demonstrated that too slow die filling increases theisk of freezing by decreasing the melt temperature below thelloy-dependent coherence temperature. Numerical calcula-ions showed a melt temperature higher than 617 ◦C duringhe filling and no evidence of solidification cavities caused by
premature freezing of the melt. The 5-spoke wheel-2 andheel-3, even with a different geometry, reflect similar fill-
ng behaviour of wheel-1, i.e. a mean melt velocity lower than.3 m/s.
After completion of die filling the wheel starts to solidify.ig. 17 presents calculated solidification times, from numeri-al simulation, with the corresponding microstructure within
heel-2. In accordance to Kurz and Fisher (1998), solidificationimes were also estimated by means of SDAS measurements.comparison between calculated and estimated solidification
imes was carried out (Fig. 17). As it is possible to observe
al simulation approach, were compared.
the relationship is good, testifying the ability of numericalsimulation codes to predict the local solidification condi-tions and the characteristics of casting components. Wheel-1and wheel-3, even with different geometries, reflect simi-lar solidification behaviour, as previously evidenced by SDASmeasurements.
Ideally, solidification should occur directionally, startingfrom the rim, via the spokes to the hub. Simulation of cast-ing solidification revealed problem areas in the junction zonebetween the spoke and the rim within wheel-2, specifically,a hot spot caused by increased thickness. Longer solidifica-tion time in this zone is opposed to that of the spoke and therim. Therefore, the hot spot in the junction zone between thespoke and the rim is a critical region for feeding. The castingshrinkage is indicated by a feeding criterion in Fig. 18, where,in addition to the shrinkage porosity in the junction zonebetween the spoke and the rim, smaller solidification cavi-ties are present in the rim area. The presence of defects wasconfirmed by means of X-ray inspections and metallographicanalysis (Fig. 18).
The feeding criterion was applied to wheel-1 and wheel-3 and revealed a higher content of shrinkage porosity in therim zone and in the junction zone between the spoke and the
rim. This could confirm the highest porosity amount from thedensity measurements of Charpy samples taken from wheel-3 even if, as previously said, the presence of defects is criticalwhen concentrated around the notch.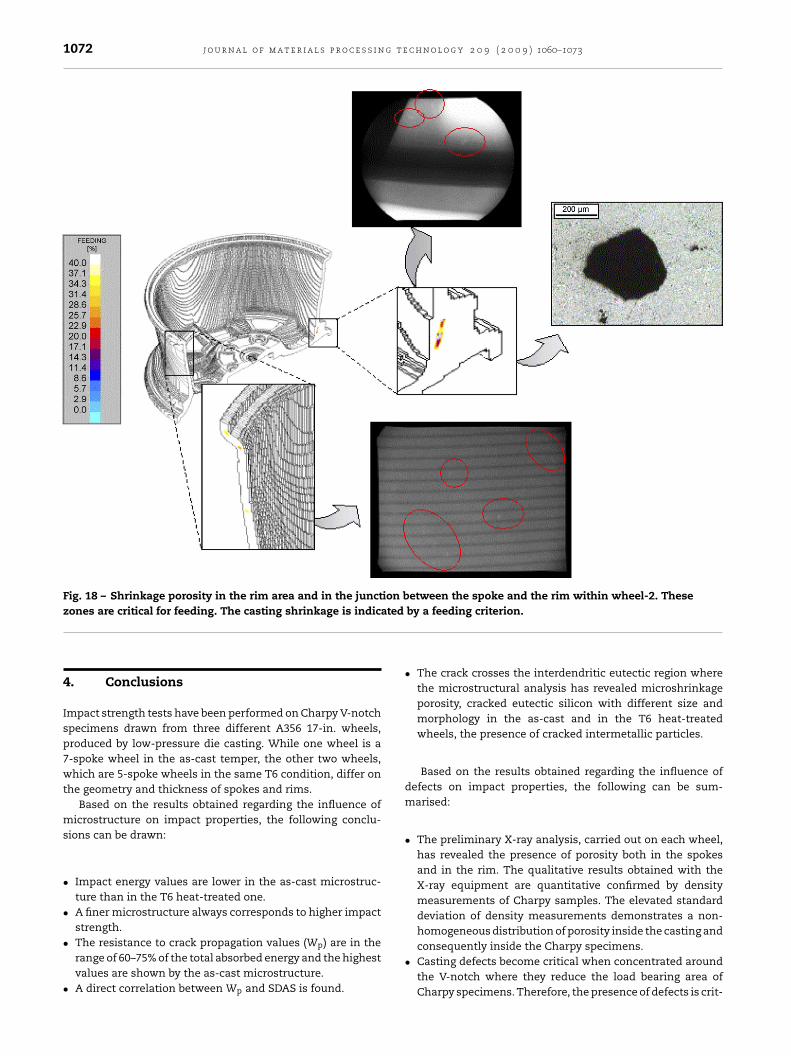
1072 j o u r n a l o f m a t e r i a l s p r o c e s s i n g t e c h n o l o g y 2 0 9 ( 2 0 0 9 ) 1060–1073
Fig. 18 – Shrinkage porosity in the rim area and in the junction between the spoke and the rim within wheel-2. Theseated
zones are critical for feeding. The casting shrinkage is indic4. Conclusions
Impact strength tests have been performed on Charpy V-notchspecimens drawn from three different A356 17-in. wheels,produced by low-pressure die casting. While one wheel is a7-spoke wheel in the as-cast temper, the other two wheels,which are 5-spoke wheels in the same T6 condition, differ onthe geometry and thickness of spokes and rims.
Based on the results obtained regarding the influence ofmicrostructure on impact properties, the following conclu-sions can be drawn:
• Impact energy values are lower in the as-cast microstruc-ture than in the T6 heat-treated one.
• A finer microstructure always corresponds to higher impactstrength.
• The resistance to crack propagation values (Wp) are in therange of 60–75% of the total absorbed energy and the highestvalues are shown by the as-cast microstructure.
• A direct correlation between Wp and SDAS is found.
by a feeding criterion.
• The crack crosses the interdendritic eutectic region wherethe microstructural analysis has revealed microshrinkageporosity, cracked eutectic silicon with different size andmorphology in the as-cast and in the T6 heat-treatedwheels, the presence of cracked intermetallic particles.
Based on the results obtained regarding the influence ofdefects on impact properties, the following can be sum-marised:
• The preliminary X-ray analysis, carried out on each wheel,has revealed the presence of porosity both in the spokesand in the rim. The qualitative results obtained with theX-ray equipment are quantitative confirmed by densitymeasurements of Charpy samples. The elevated standarddeviation of density measurements demonstrates a non-homogeneous distribution of porosity inside the casting and
consequently inside the Charpy specimens.• Casting defects become critical when concentrated aroundthe V-notch where they reduce the load bearing area ofCharpy specimens. Therefore, the presence of defects is crit-
t e c h
samit
A
TFtRN
r
B
B
B
B
C
C
C
F
K
Microfractographs, 1st ed. ASM International.
j o u r n a l o f m a t e r i a l s p r o c e s s i n g
ical on impact properties and can overcome the effect of themicrostructure.
In terms of utility, numerical simulation has been demon-trated to be able to predict the formation of macro-defects,s indicated by a feeding criterion, and the final scale oficrostructure within the casting. From these results, numer-
cal simulation has confirmed its potential as an engineeringool to predict the impact properties throughout the casting.
cknowledgements
he authors acknowledge Dr. E. Capatti, Dr. F. Piasentini, Dr.. Massari and Dr. N. Tomanin for the experimental contribu-ion to this research. Many thanks are also due to Dr. E. Dellaovere and G. Mazzacavallo. Many thanks are also due to Dr.. Gramegna for helping with MAGMASOFT® simulations.
e f e r e n c e s
erto, F., Lazzarin, P., Wang, C.H., 2004. Three-dimensional linearelastic distributions of stress and strain energy density aheadof V-shaped notches in plates of arbitrary thickness. Int. J.Fract. 127, 265–282.
lackmun, E.V., 1968. Casting. In: Kent, R., Van Horn (Eds.),Aluminum Vol. III—Fabrication and Finishing, 3rd ed.American Society for Metals, Metals Park, OH, pp. 43–80.
onollo, F., Gramegna, N., Odorizzi, S., 1999. La pressocolata delleleghe di alluminio: simulazione numerica del processo, 1st ed.Edimet, Brescia.
rown, R., 1999. Foseco Non-Ferrous Foundryman’s Handbook,11th ed. Butterworth-Heinemann, Oxford.
aceres, C.H., Davidson, C.J., Griffiths, J.R., 1995. The deformationand fracture behaviour of an Al–Si–Mg casting alloy. Mater.Sci. Eng. A 197, 171–179.
aceres, C.H., Selling, B.I., 1996. Casting defects and the tensileproperties of an Al–Si–Mg alloy. Mater. Sci. Eng. A 220, 109–116.
ampbell, J., 2003. Castings, 2nd ed.
Elsevier/Butterworth-Heinemann, Oxford.linn, R.A., 1963. Fundamentals of Metal Casting, 1st ed.Addison-Wesley Publishing Company, Massachusetts.
uo, J.-H., Hsu, F.-L., Hwang, W.-S., 2001. Development of aninteractive simulation system for the determination of the
n o l o g y 2 0 9 ( 2 0 0 9 ) 1060–1073 1073
pressure–time relationship during the filling in a low pressurecasting process. Sci. Technol. Adv. Mater. 2, 131–145.
Kurz, W., Fisher, D.J., 1998. Fundamentals of Solidification, 4th ed.Trans. Tech. Publications, Switzerland.
Li, Z., Samuel, A.M., Samuel, F.H., Ravindran, C., Doty, H.W.,Valtierra, S., 2004. Parameters controlling the performance ofAA319-type alloys. Part II. Impact properties and fractography.Mater. Sci. Eng. A 367, 111–122.
MAGMASOFT® v.4.2, 2002. MAGMAlpdc Module Manual, MAGMAGiessereitechnologie GmbH.
Murali, S., Raman, K.S., Murthy, K.S.S., 1992. Effect of magnesium,iron (impurity) and solidification rates on the fracturetoughness of Al–7Si–0.3Mg casting alloy. Mater. Sci. Eng. A 151,1–10.
Paray, F., Kulunk, B., Gruzleski, J.E., 2000. Impact properties ofAl–Si foundry alloys. Int. J. Cast Met. Res. 13, 17–37.
Pedersen, L., 1999. Solution Heat Treatment of AlSiMg FoundryAlloys. PhD Thesis. Norwegian University of Science andTechnology (NTNU), Trondheim.
Schroth, A., Schemme, D., 2003. Simulation in modern qualitymanagement systems—simulation assists theimplementation of quality management systems infoundries. Cast. Plant Technol. 19, 8–18.
Shivkumar, S., Wang, L., Keller, C., 1994. Impact properties ofA356-T6 alloys. J. Mater. Eng. Perform. 3, 83–90.
Sicha, W.E., 1971. Properties of commercial casting alloys. In:Kent, R., Van Horn (Eds.), Aluminum Vol. I—Properties,Physical Metallurgy and Phase Diagram, 4th ed. AmericanSociety for Metals, Metals Park, OH,pp. 277–302.
Srivastava, M.C., Lohne, O., Arnberg, L., Laukli, H.I., Gjestland, H.,2006. Energy absorption of HPDC aluminium and magnesiumalloys. In: Proc. High Tech Die Casting 2006, Vicenza, Italy,paper 10.
Street, A.C., 1986. The Diecasting Book, 2nd ed. Portcullis Press,London.
Vedani, M., Mapelli, C., 2001. Effect of thermal treatments onmicrostructure and impact toughness of die-cast Mg–Al–Mnalloys. Mater. Sci. Technol. 17, 938–944.
Wang, Q.G., Caceres, C.H., 1998. The fracture mode in Al–Si–Mgcasting alloys. Mater. Sci. Eng. A 241, 72–82.
Warmuzek, M., 2004. Aluminium–Silicon Casting Alloys: Atlas of
Zhang, D.L., Zheng, L.H., StJohn, D.H., 2002. Effect of a shortsolution treatment time on microstructure and mechanicalproperties of modified Al–7 wt.% Si–0.3 wt.% Mg alloy. J. LightMet. 2, 27–36.
Related Documents