Faculty of Technology, Policy and Management Social Business Intelligence How and where firms can use social media data for performance measurement, an exploratory study Final Joeri Heijnen Master Thesis

Welcome message from author
This document is posted to help you gain knowledge. Please leave a comment to let me know what you think about it! Share it to your friends and learn new things together.
Transcript

Faculty of Technology, Policy and Management
Social Business IntelligenceHow and where firms can use social media data forperformance measurement, an exploratory study
Final
Joeri Heijnen
Mas
terT
hesis


Social Business IntelligenceHow and where firms can use social media data for performance
measurement, an exploratory study
Master Thesis
EmptyJoeri Heijnen
1320319
December, 2012
Faculty of Technology, Policy and Management · Delft University of Technology

The work in this thesis was supported by KPMG Advisory N.V. Their cooperation is hereby gratefullyacknowledged.
Copyright c© Faculty of Technology, Policy and ManagementAll rights reserved.

Graduation Committee
Formal Chair First Supervisorprof. dr. Y.H. (Yao-Hua) Tan dr. ir. G.A. (Mark) de ReuverFull professor Assistant professorDelft University of Technology Delft University of TechnologyFaculty of Technology, Policy and Management Faculty of Technology, Policy and ManagementSection Information- and Communication Technology Section Information- and Communication Technology
Second Supervisor External Supervisordr. M.E. (Martijn) Warnier ir. M.H. (Han) Horlings AITAPAssistant professor Manager Business IntelligenceDelft University of Technology KPMG Advisory N.V.Faculty of Technology, Policy and Management IT AdvisorySection Systems Engineering Business Intelligence
Abstract
IntroductionBoth for individuals and for organisations the first decade of the 21st century is characterised by the socialmedia trend. Social media platforms are increasingly popular, and are amongst others used by individualsto express their opinions. Also firms acknowledge the opportunities offered by social media and are thereforeincreasingly pursuing to realise their goals through means of social media (Murdough, 2009). The value of thedata produced on these platforms lies in the fact that consumers – i.e. (potential) clients – produce these data.In addition, the information is created instantly, real-time and by many people. It is therefore not surprisinglythat Dey and Haque (2008) state that data generated from online communication acts as “potential gold mines”for discovering knowledge.Next, firms are increasingly hungry for information that reveals underlying trends and dependencies affectingthe firm’s performance. Business intelligence systems are used to obtain such insights (Lonnqvist & Pirttimaki,2006). The demand for (real-time) business intelligence systems and the popularity of social media offer room forsynthesis. Systems that are purposed to derive actionable information from social media to support managerialdecision-making are referred to as social business intelligence systems. Thus far, business intelligence systemsparticularly derive management information from internal data. With the rise of a new data source – socialmedia platforms – the question rises how a firm should process these external data, what kind of managerialinformation could be derived from the new data sources, and whether or not each firm is able to apply socialbusiness intelligence. In business intelligence, indicators representing the strategy of a firm are established.These indicators are termed ‘key-performance indicators’. Consequently, data reflecting the performance ofdifferent processes are linked to these key-performance indicators.Whereas links between social media data and key-performance indicators may leverage the opportunities of socialmedia for firms, a fundamental prerequisite allowing social business intelligence is the existence of user-generatedsocial media content. After all, user-generated content that does not exist can not be analysed. Thus, anorganisation is dependent for the generation of content on social media users and needs to determine whethersocial media data exists before considering to invest in social business intelligence systems. So far, it is not clearwhich organisational characteristics affect the existence of social media content. In this research, two generalcharacteristics describing a firm are used to investigate the existence of social media data; (i) industry type and(ii) customer relation type.
Research ObjectiveOn the one hand social media is a new phenomenon and acknowledged as a source of data of which valuableinformation can be derived. On the other hand, it is unclear which firms are able to collect social media datathat is related to their firm and how firms should process these new data in accordance with existing businessintelligence processes. Therefore, the objective of this research has been formulated as:
The objective of this research is to develop a procedure to utilise social media data for businessintelligence, for which the applicability is investigated for firms in different industries and fordifferent customer relations.
MethodOur sample consists of social media messages related to eighteen different firms, in seven different industriesperforming different customer relations. Because the sample firms operate in different industries and execute
iii
different customer relations, it is possible to gain insight in potential differences between the social mediamessages related to these firms. During a period of two weeks, social media messages from various platformshave been crawled into a local database to allow further analyses. The content in the dataset is sourced fromTwitter, Facebook public pages, Flickr, Newssites, Google+ public pages, (Wordpress) Blogs, Picasa, YouTubeand Friendfeed. These platforms are popular in Western Europe.To gain insight in the amount of firm-related social media messages, the average daily mentions of firms servedas a proxy to compare the volume of messages related to different firms. Next, using a content analysis, aportion of the collected messages have manually been classified into different categories based on the messages’subjects. These categories correspond with generally applied categories of key-performance indicators. As such,the results of the content analysis are directly linked to firms’ key-performance indicators, allowing to drawconclusions on the relatedness of social media messages to different key-performance indicators.Incorporating the new external data source requires traditional business intelligence systems to be adjusted. Asocial business intelligence procedure should be consistent with these traditional systems, and should additionallyconsider the challenges involved when processing social media data. As such, the requirements for a socialbusiness intelligence procedure have been established based on generally applied business intelligence concepts.Furthermore, the challenges involved in the processing of social media data are discovered by the collectionof social media messages for the content analysis. Based on the traditional BI concepts and the challengesdiscovered in the content analysis, a business intelligence procedure is developed. The procedure is verified byanalysing its consistency with existing BI systems and its ability to solve the issues emerging when processingsocial media data.
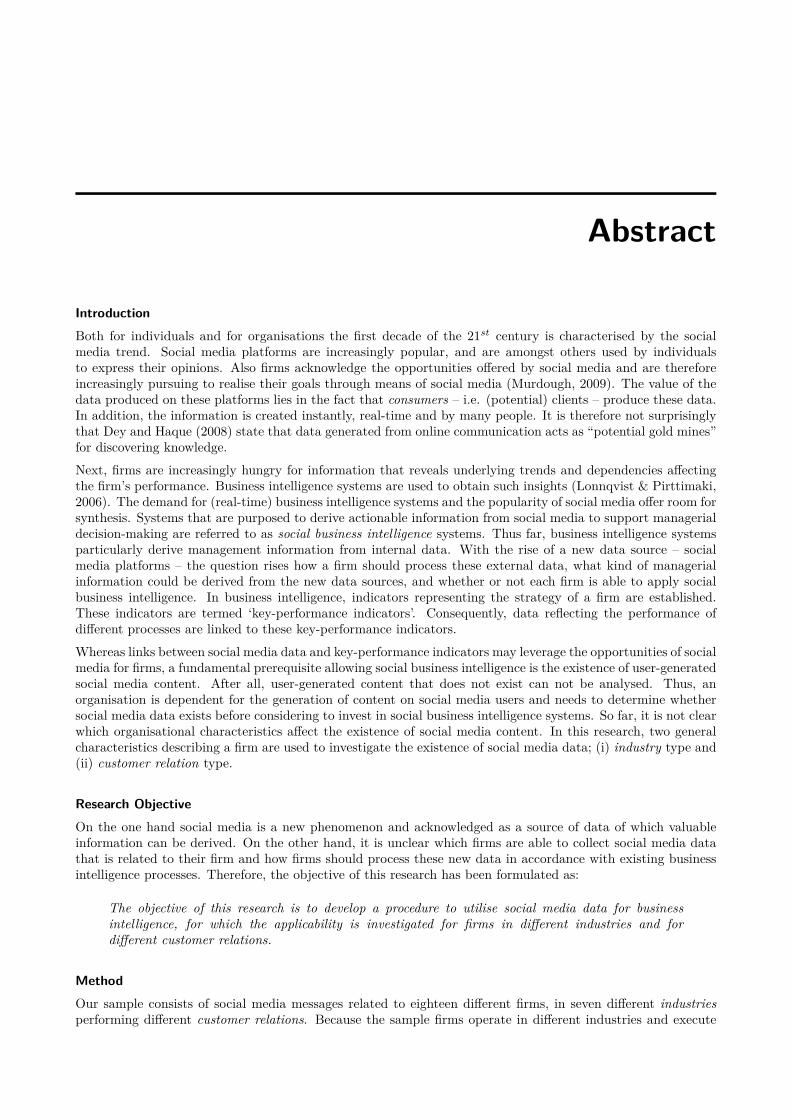
ResultsThe results of this research are twofold. Firstly, we gained insight in the applicability of social businessintelligence by investigating the existence and content of firm-related social media messages. Secondly,a procedure to collect, process and analyse social media data for business intelligence purposes has beenestablished.(ii) Applicability of social business intelligenceThe applicability of social business is investigated on two facets. Firstly, the volume of firm-related social mediamessages is investigated to obtain insight in the amount of data that is available for firms. The volume offirm-related social media content is however not sufficient to draw conclusions on the applicability of socialbusiness intelligence. Therefore, the second facet on which the sample data is analysed relates to the contentof the social media messages. Especially, the subjects of the messages were analysed.VolumeThe average daily mentions differs from firm to firm. This implies that the applicability of social businessintelligence will not be possible for all firms, since not for each firm data is generated. Figure 1 illustrates theaverage daily mentions of different firms in our sample.
Heineken
Coca-Cola Philips3.000
3.500
TomTom
KLM
2.500
x 1/
day]
1.500
2.000
Ave
rage
Dai
ly M
entio
ns [x
1/d
ay
Bol.comNS
Albert HeijnC-1000
ABN AMRO ArcelorMittal500
1.000
Ave
r
Bol.comNS
PostNL
Blokker
Aegon UnibailRodamcoAkzoNobel
ArcelorMittal
Arcadis Fugro0
500
B2BB2C
Figure 1: Average Daily Mentions of Firms, Clustered per Customer Relation Type
Figure 1 shows the daily volume of firm-related social media content, in which the firms are clustered on theircustomer relation type and consequently ordered descending. This figure suggests that B2C firms – coloured
iv Abstract
in red – are more likely to find social media content that is related to their firm than firms performing B2Brelations (coloured in blue).
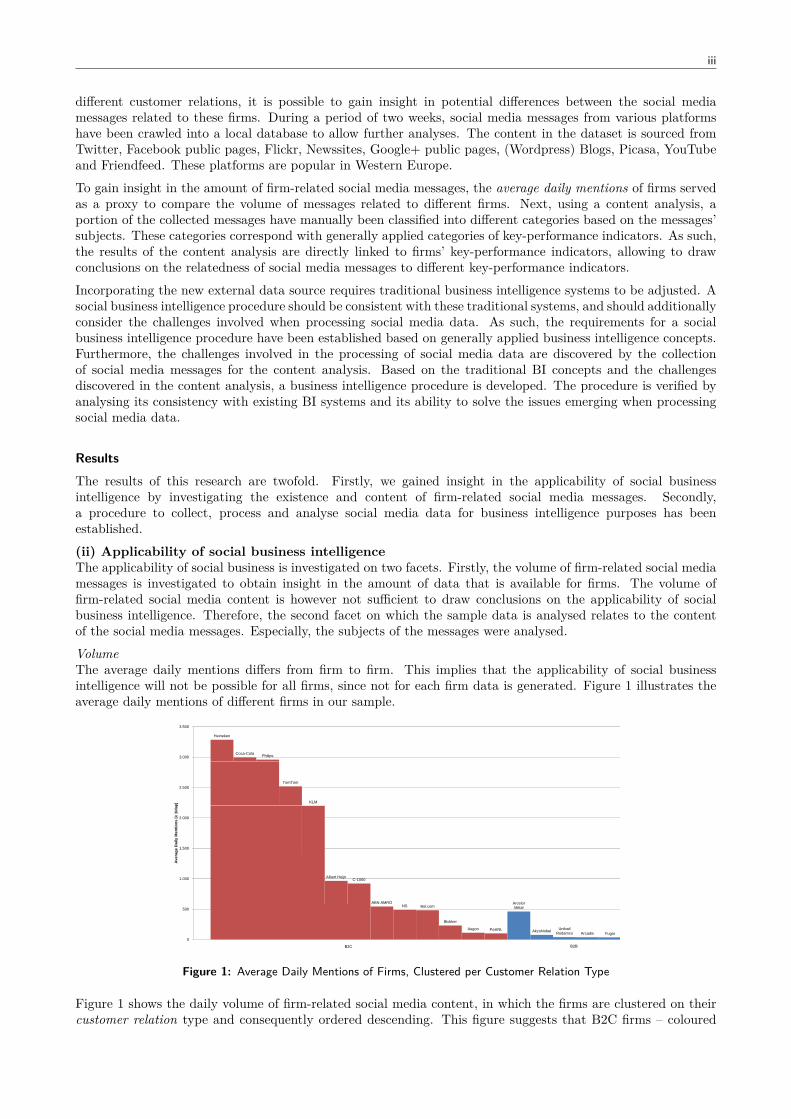
The second dimension on which the volume of firm-related social media content is investigated relates toindustries. Our sample consists of eighteen different firms active in seven different industries. As a first step toidentify possible differences in the volume of daily messages between industries, the firms have been clusteredon industry type in figure 2, and have consequently been sorted in descending order.
Heineken
Coca-Cola Philips3.000
3.500
TomTom
KLM
2.500
x 1/
day]
1.500
2.000
Ave
rage
Dai
ly M
entio
ns [x
1/d
ay
Albert HeijnC-1000
ABN AMRONSBol.com
ArcelorMittal500
1.000
Ave
r
NSBol.comArcelorMittal
Blokker
AegonPostNL AkzoNobelUnibailRodamco Arcadis Fugro
0
500
Information & Communication
Industry Transport & Storage Wholesale & Retail Financial Institutions Mining & QuarryingConsultancy, Research
& Other Specialised Business ServicesCommunication Business Services
Figure 2: Average Daily Mentions of Firms, Clustered per Industry Type
Figure 2 strongly suggests that there exists a difference in the amount of user-generated content between differentindustries, with industrial firms being highly mentioned on social media, while consulting firms are the leastmentioned.
SubjectsNext to an assessment of the amount of social media posts that are created on the web, this thesis examinedthe subjects of the social media posts in order to link the messages to firms’ key-performance indicators. Thesocial media messages of the firms have been classified into categories based on their subject. These categoriesare based on ten categories of commonly applied key-performance indicators. Consequently, the collected socialmedia posts of the firms in the sample have manually been classified into one of these categories.
Our analysis shows that the subjects of social media messages differ from firm to firm. The majority of socialmedia messages related to firms (41%) express how the external stakeholders of a firm perceive the company. Inthis thesis, such posts have been classified as community posts. 18% of the social media messages in our datasetcontained the name of a firm, but did not contain any valuable information for the firm and have consequentlybeen assigned as undefined posts. About 11% of the social media messages relate to financial results, whichconsist of financial performance discussions (5%) and stock related discussions (6%).
The content analysis of this research suggests that the subjects of social media messages related to B2Bfirms contain a higher percentage of short term financial results, news and professionals related messages thanmessages related to B2C firms. Unfortunately for B2B firms, such type of information is yet available internally.Acquiring social media data to gain additional management information is therefore of less value for B2B firms.Next, the analysis indicates that the social media messages related to B2C firms contain a higher percentageof posts related to customer relations, product and service quality and product and service innovation thanmessages related to B2B firms. It are these types of information that deliver additional value to the firm, sincethis information is not available at firms internally.
In addition, the content analysis of this research suggests that the subjects of social media posts differ betweenindustries, but that the majority of the subjects in each industry relates to community, i.e. social media postsrevealing how the community perceives the company. The results indicate that firms active in the information& communication, financial institutions and transport & storage industries are more subjected to social mediamessages related to customer relations, while firms active in the mining and quarrying and consulting industrieswill find messages related to financial performance.
v
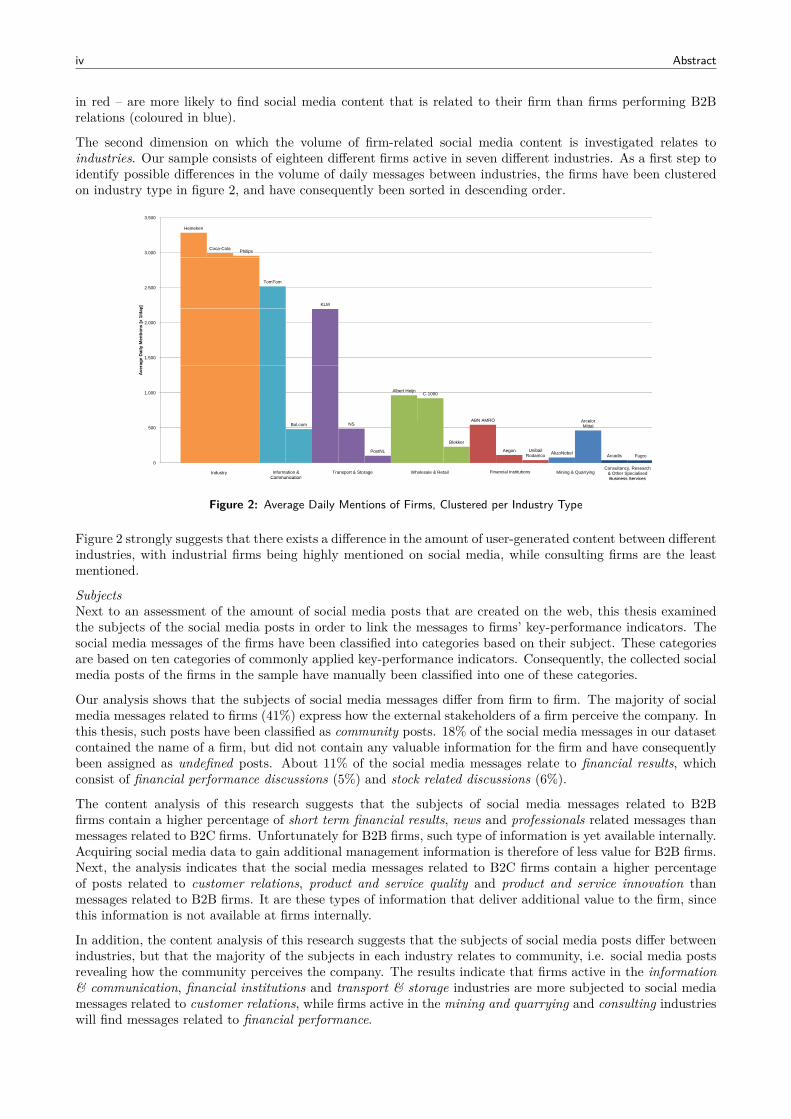
(ii) Procedure for social business intelligenceBased on (i) traditional business intelligence frameworks and (ii) the experience we gained in collecting,processing and analysing social media data in the content analysis, a social business intelligence (“SBI”)procedure has been developed. Figure 3 schematically shows the social business intelligence procedure.
Reaction based onsocial intelligence
Strategic mapping of
KPIsReacting
Search termsAction plan(s) to respond to gainedintelligence
g
CollectingMapping
insights to business
units
Data pre
Unstructureddata
Information forbusiness units
Data pre-processing
Categorising
Analysing
Structured, combined(and anonymised) data
Categorised data
Figure 3: Blueprint: Social Business Intelligence Procedure
Our SBI procedure consists of seven main components, being (i) strategic mapping of KPIs, (ii) collecting,(iii) data pre-processing, (iv) categorising, (v) analysing, (vi) mapping insights to the business units, and (vii)reacting. The seven steps can be interpreted as a cycle, i.e. the output of the last step influences the first step.
The very first step of social business intelligence sets the scene for the objects that are to be collected andanalysed. Namely, in the first step the key-performance indicators that are to be measured by social media dataare selected. Not each type of KPI is to be measured by social media data since there does simply not existany related social media data to these types of KPIs. Firms should mainly focus on KPIs related to customerrelations, public image and – to a less extent – on product and service innovation when selecting KPIs that areto be measured using social media data.
The second step of the SBI procedure relates to data collection. In contradiction to regular BI systems, thedata is to be sourced from external parties in social business intelligence. People create firm-related messageson different platforms, of which the vast majority of publicly accessible messages are created on Twitter. Thesearch terms that are used to filter out the content at which the firm is interested should be based on the socialKPIs selected in the previous step.
The social media data has been collected from multiple platforms which adhere to their own data format. Thedifferent format are to be combined into one uniform database, so that – in a later step – data analysis can beapplied on the complete dataset. Furthermore, the firm should select those attributes that are necessary for theanalysis, not each platform offers the same richness of attributes to a social media post. In addition, the datashould be anonymised to be in compliance with new Regulations regarding data privacy. Finally, spam – i.e.social media posts that do not relate to the firm – should be removed from the collected data.
The data pre-processing step resulted in a structured database in which the social media messages from multipleplatforms are combined. In the categorising step, the messages are clustered on different issues of interest,depending on the firm’s subject of interest. E.g., messages related to certain products can be categorised, orone can cluster the messages that are created by people with many followers, etc. Again, the criteria at whichthe messages are categorised are determined by the selection of the social KPIs in the first step.
So far, the collected data has not provided any insights. It is in this analysis step of the procedure where datais transformed into information. The categories that were established in the previous step are analysed in thisstep. For instance, sentiment analysis can be applied on the categories related to the firm’s products in orderto acquire intelligence related to customer experiences of the products. However, the most valuable intelligence

vi Abstract
is gained when social media data is related to internal data. For instance, the volume of social media messagesrelated to a certain product may be correlated with the sales volume of that product. It is in this phase of theSBI procedure where such relations are explored.
In the first step of the procedure, KPIs have been selected. These KPIs typically relate to a certain function ofthe firm, and hence have an “owner”. The intelligence gained in the previous step relates to KPIs, and shouldfeed back to the owner of the KPI. Generally, it are the people in the firm that are responsible for the KPI whoare the ones that can reason how the KPI is influenced. Therefore, these people are the ones that can draft anaction plan in case the KPI needs improvement.
The final step of the social intelligence procedures consists of the execution of the action plans that are developedin collaboration with people from the business lines that are responsible for the respective KPIs. Actions onthe gained intelligence may involve revisions of internal processes or strategies, or external interventions suchas social media engagement.
Contents
Graduation Committee i
Abstract ii
Preface xi
1 Research Problem 11-1 Introduction . . . . . . . . . . . . . . . . . . . . . . . . . . . . . . . . . . . . . . . . . . . . . . . . 11-2 Problem Statement . . . . . . . . . . . . . . . . . . . . . . . . . . . . . . . . . . . . . . . . . . . . 21-3 Research Objective . . . . . . . . . . . . . . . . . . . . . . . . . . . . . . . . . . . . . . . . . . . . 3
1-4 Research Questions . . . . . . . . . . . . . . . . . . . . . . . . . . . . . . . . . . . . . . . . . . . . 41-5 Coherence of Research Questions . . . . . . . . . . . . . . . . . . . . . . . . . . . . . . . . . . . . . 51-6 Research Method . . . . . . . . . . . . . . . . . . . . . . . . . . . . . . . . . . . . . . . . . . . . . 7
1-6-1 Exploratory Research . . . . . . . . . . . . . . . . . . . . . . . . . . . . . . . . . . . . . . . 7
1-6-2 Description of Research Methods . . . . . . . . . . . . . . . . . . . . . . . . . . . . . . . . . 7
1-6-3 Data Collection and Research Approach . . . . . . . . . . . . . . . . . . . . . . . . . . . . . 8
1-7 Project Scope . . . . . . . . . . . . . . . . . . . . . . . . . . . . . . . . . . . . . . . . . . . . . . . 9
1-8 Literature Review . . . . . . . . . . . . . . . . . . . . . . . . . . . . . . . . . . . . . . . . . . . . . 111-9 Scientific Relevance . . . . . . . . . . . . . . . . . . . . . . . . . . . . . . . . . . . . . . . . . . . . 131-10 Societal Relevance . . . . . . . . . . . . . . . . . . . . . . . . . . . . . . . . . . . . . . . . . . . . . 141-11 Project Deliverable . . . . . . . . . . . . . . . . . . . . . . . . . . . . . . . . . . . . . . . . . . . . 14
2 Conceptual Frame of Research 152-1 Business Intelligence Perspectives . . . . . . . . . . . . . . . . . . . . . . . . . . . . . . . . . . . . . 15
2-2 Registering the Right Indicators . . . . . . . . . . . . . . . . . . . . . . . . . . . . . . . . . . . . . . 16
2-2-1 Strategy and Business Model . . . . . . . . . . . . . . . . . . . . . . . . . . . . . . . . . . . 16
2-2-2 Frameworks Supporting the Formulation of Performance Indicators . . . . . . . . . . . . . . . 17
2-2-3 Performance Measurement System Design Process . . . . . . . . . . . . . . . . . . . . . . . 20
2-2-4 Typology of Performance Indicators . . . . . . . . . . . . . . . . . . . . . . . . . . . . . . . 21
2-2-5 KPI Categories . . . . . . . . . . . . . . . . . . . . . . . . . . . . . . . . . . . . . . . . . . 22
2-3 Processing . . . . . . . . . . . . . . . . . . . . . . . . . . . . . . . . . . . . . . . . . . . . . . . . . 24
2-4 Sub Conclusion: How Business Intelligence is Applied . . . . . . . . . . . . . . . . . . . . . . . . . . 25
viii Contents
3 Research Domain 273-1 Web 2.0 . . . . . . . . . . . . . . . . . . . . . . . . . . . . . . . . . . . . . . . . . . . . . . . . . . 273-2 Social Media . . . . . . . . . . . . . . . . . . . . . . . . . . . . . . . . . . . . . . . . . . . . . . . . 27
3-2-1 Social Media Platforms . . . . . . . . . . . . . . . . . . . . . . . . . . . . . . . . . . . . . . 283-2-2 User-Generated Content on Social Media Platforms . . . . . . . . . . . . . . . . . . . . . . . 313-2-3 Current Applications of Social Media in Firms . . . . . . . . . . . . . . . . . . . . . . . . . . 32
3-3 Social Business Intelligence . . . . . . . . . . . . . . . . . . . . . . . . . . . . . . . . . . . . . . . . 343-3-1 Current State of Social Business Intelligence . . . . . . . . . . . . . . . . . . . . . . . . . . . 35
3-4 EU Legislation on Social Media Data Processing . . . . . . . . . . . . . . . . . . . . . . . . . . . . . 393-4-1 What Firms are allowed to do with Public Data . . . . . . . . . . . . . . . . . . . . . . . . . 40
3-5 Sub Conclusion . . . . . . . . . . . . . . . . . . . . . . . . . . . . . . . . . . . . . . . . . . . . . . 40
4 Content Analysis 424-1 Theoretical Level . . . . . . . . . . . . . . . . . . . . . . . . . . . . . . . . . . . . . . . . . . . . . 43
4-1-1 Hypotheses Formulation . . . . . . . . . . . . . . . . . . . . . . . . . . . . . . . . . . . . . . 434-1-2 Material to Investigate . . . . . . . . . . . . . . . . . . . . . . . . . . . . . . . . . . . . . . 44
4-2 Establishment of Categories . . . . . . . . . . . . . . . . . . . . . . . . . . . . . . . . . . . . . . . . 444-2-1 Operationalising the Categories . . . . . . . . . . . . . . . . . . . . . . . . . . . . . . . . . . 444-2-2 Determining the Sample . . . . . . . . . . . . . . . . . . . . . . . . . . . . . . . . . . . . . 454-2-3 Description of the Measuring Period . . . . . . . . . . . . . . . . . . . . . . . . . . . . . . . 47
4-3 Pretest . . . . . . . . . . . . . . . . . . . . . . . . . . . . . . . . . . . . . . . . . . . . . . . . . . . 484-3-1 Categories of Social Media Posts . . . . . . . . . . . . . . . . . . . . . . . . . . . . . . . . . 484-3-2 Revised Taxonomy of Categories . . . . . . . . . . . . . . . . . . . . . . . . . . . . . . . . . 56
4-4 Data Collection and Evaluation . . . . . . . . . . . . . . . . . . . . . . . . . . . . . . . . . . . . . . 564-4-1 Search Terms . . . . . . . . . . . . . . . . . . . . . . . . . . . . . . . . . . . . . . . . . . . 584-4-2 Scraping Social Media Content . . . . . . . . . . . . . . . . . . . . . . . . . . . . . . . . . . 584-4-3 Data Cleaning . . . . . . . . . . . . . . . . . . . . . . . . . . . . . . . . . . . . . . . . . . . 60
4-5 Descriptive Statistical Analysis . . . . . . . . . . . . . . . . . . . . . . . . . . . . . . . . . . . . . . 604-5-1 Channel Distribution . . . . . . . . . . . . . . . . . . . . . . . . . . . . . . . . . . . . . . . 604-5-2 Volume of Firm-Related Social Media Messages . . . . . . . . . . . . . . . . . . . . . . . . . 624-5-3 Subjects of Social Media Posts . . . . . . . . . . . . . . . . . . . . . . . . . . . . . . . . . . 66
4-6 Interpretation of the Results . . . . . . . . . . . . . . . . . . . . . . . . . . . . . . . . . . . . . . . 684-6-1 Volume of Social Media Posts related to Firms . . . . . . . . . . . . . . . . . . . . . . . . . 684-6-2 Subjects of Social Media Posts related to Firms . . . . . . . . . . . . . . . . . . . . . . . . . 69
4-7 Sub Conclusion: Social Media Posts that relate to KPI Categories and the Performance PrismPerspectives . . . . . . . . . . . . . . . . . . . . . . . . . . . . . . . . . . . . . . . . . . . . . . . . 70
5 Blueprint of a Social Business Intelligence Procedure 725-1 Requirements Formulation . . . . . . . . . . . . . . . . . . . . . . . . . . . . . . . . . . . . . . . . 72
5-1-1 Description of Requirements . . . . . . . . . . . . . . . . . . . . . . . . . . . . . . . . . . . 725-1-2 Requirements Check on Business Intelligence Concepts . . . . . . . . . . . . . . . . . . . . . 76
5-2 Social Business Intelligence Procedure . . . . . . . . . . . . . . . . . . . . . . . . . . . . . . . . . . 785-2-1 Strategic mapping of KPIs . . . . . . . . . . . . . . . . . . . . . . . . . . . . . . . . . . . . 785-2-2 Collecting . . . . . . . . . . . . . . . . . . . . . . . . . . . . . . . . . . . . . . . . . . . . . 795-2-3 Data Pre-Processing . . . . . . . . . . . . . . . . . . . . . . . . . . . . . . . . . . . . . . . 795-2-4 Categorising . . . . . . . . . . . . . . . . . . . . . . . . . . . . . . . . . . . . . . . . . . . . 805-2-5 Analysing . . . . . . . . . . . . . . . . . . . . . . . . . . . . . . . . . . . . . . . . . . . . . 815-2-6 Mapping insights to Business Units . . . . . . . . . . . . . . . . . . . . . . . . . . . . . . . . 815-2-7 Reacting . . . . . . . . . . . . . . . . . . . . . . . . . . . . . . . . . . . . . . . . . . . . . . 81
5-3 Verification of Procedure . . . . . . . . . . . . . . . . . . . . . . . . . . . . . . . . . . . . . . . . . 835-4 Real-Time Social Business Intelligence . . . . . . . . . . . . . . . . . . . . . . . . . . . . . . . . . . 855-5 Social Business Intelligence versus Business Intelligence . . . . . . . . . . . . . . . . . . . . . . . . . 855-6 Sub Conclusion . . . . . . . . . . . . . . . . . . . . . . . . . . . . . . . . . . . . . . . . . . . . . . 87
Contents ix
6 Conclusions & Discussion 906-1 Conclusions . . . . . . . . . . . . . . . . . . . . . . . . . . . . . . . . . . . . . . . . . . . . . . . . 906-2 Contributions to Research . . . . . . . . . . . . . . . . . . . . . . . . . . . . . . . . . . . . . . . . . 93
6-2-1 Methodological Innovation . . . . . . . . . . . . . . . . . . . . . . . . . . . . . . . . . . . . 946-3 Implications for Practice . . . . . . . . . . . . . . . . . . . . . . . . . . . . . . . . . . . . . . . . . . 956-4 Reflection . . . . . . . . . . . . . . . . . . . . . . . . . . . . . . . . . . . . . . . . . . . . . . . . . 95
6-4-1 Twitter Scraper . . . . . . . . . . . . . . . . . . . . . . . . . . . . . . . . . . . . . . . . . . 956-4-2 If I had More Time . . . . . . . . . . . . . . . . . . . . . . . . . . . . . . . . . . . . . . . . 956-4-3 Stepwise Description of Data Collection Process . . . . . . . . . . . . . . . . . . . . . . . . . 96
6-5 Limitations . . . . . . . . . . . . . . . . . . . . . . . . . . . . . . . . . . . . . . . . . . . . . . . . . 976-6 Future Research . . . . . . . . . . . . . . . . . . . . . . . . . . . . . . . . . . . . . . . . . . . . . . 98
6-6-1 Classifier . . . . . . . . . . . . . . . . . . . . . . . . . . . . . . . . . . . . . . . . . . . . . . 986-6-2 Social Media Posts Categories . . . . . . . . . . . . . . . . . . . . . . . . . . . . . . . . . . 986-6-3 The Real Source . . . . . . . . . . . . . . . . . . . . . . . . . . . . . . . . . . . . . . . . . . 986-6-4 Case Study: Relations of Social Media Metrics and Key-Performance Indicators . . . . . . . . 98
A Performance Prism Perspectives and Key-Performance Indicators Categories 99
B Classification of Social Media Posts 101
C Social Media Platform Distribution 108
D Descriptive Statistics of Social Media Post Categories 112
E Corporate Engagement 116
Bibliography 118

x Contents

Preface
Social media is a trend in the first decade of this century, and the concept is increasingly incorporated in thedaily lives of people. Scepticism towards the new technology is losing support, and companies are aware thatthe new trend cannot be denied. Though the new phenomenon is gaining attention in the scientific world, socialmedia was not yet part of the curriculum at my faculty. I am grateful that I was offered the opportunity and theconfidence to dive in the rather unexplored world of research into social media, and explore the opportunitiesfor companies offered by social business intelligence.
First of all I would like to thank my graduation committee. My first supervisor of Delft University of Technology,Mark de Reuver, critically reviewed my work on a regular basis. I hereby thank Mark for his constructivecomments and suggestions for improvements, I experienced our meetings as pleasant and useful. Mark’sexperience in scientific research and knowledge of ICT and business models contributed to the quality of mythesis. Martijn Warnier supervised my work as second supervisor from the Systems Engineering section. Martijnindicated issues concerned with social media (data) that I did not think of in the first place, for which I amgrateful. Harry Bouwman chaired my committee as professor from the ICT section. Harry contributed to thisthesis by critically reviewing my work and offering suggestions for improvements, which were mainly related toscientific concepts. Thank you for these comments, the critical notions improved the level of this work.
I would like to express my gratitude to my supervisor at KPMG, Han Horlings. Thanks to weekly meetings withHan I was driven to progress my thesis. I found a sparring partner to discuss especially business intelligencerelated aspects of my work. Han, thanks for your time, contributions and coaching! In addition I would like tothank all employees and co-interns of KPMG’s Business Intelligence department for their interest in my thesis,their contributing opinions and ideas on the subject, for being challenging competitors during the karting eventand for the fun at the Amsterdam Parade last summer.
Amstelveen, December 2012
Joeri Heijnen

xii Preface
Chapter 1
Research Problem
1-1 IntroductionMore and more, customers are using content sharing sites to express their opinions about almost anything, fromsoccer matches to financial statements of large corporations. Examples of platforms where these expressionsare shared to the world are blogs and forums, social network sites and wikis. In 2008, “75% of internet surfersused social media” (A. M. Kaplan & Haenlein, 2010), and the usage of social media is not limited to teenagers.Members of generation X, now 35–44 years old, are increasingly active on social media sites (A. M. Kaplan &Haenlein, 2010). Anno 2012, people express how they feel, what they do, what they think of, and what theyintend to do in over 340 million daily Twitter posts (Twitter, 2012). The value of the information producedon these platforms lies in the fact that consumers produce these data. In addition, the information is createdinstantly, real-time and by many people. Since social media posts are often non-anonymous and directly linkedto a person, firm or brand, the content produced on social media platforms can be interpreted as an indicatorof people’s attitude towards a firm, product or service. The user-generated content is considered as a driver forfuture sales by Dhar and Chang (2009), hence containing economic value for firms (Ghose & Panagiotos, 2010).
In the first decade of the 21st century, business intelligence (“BI”) has evolved to one of the critical processesfor organisations to provide useful insight, to support decision-making, and to drive organisational performance(Ramakrishnan, Jones, & Sidorova, 2012). According to Watson and Wixom (2007) BI has become a “strategicinitiative and is regarded as an instrument in driving business effectiveness and innovation”. For organisations,it is increasingly important to quickly respond to changes in the environment (Gessner & Volonio, 2005).Therefore, BI systems are required to contain a component that allows monitoring the real-time environment.We define such systems as ‘real-time BI’ systems.
From the above, we can derive two trends in the current business landscape:
(i) an increase in the usage of social media, and,
(ii) an increase in the usage of business intelligence systems.
Trend (i): Social Media in Organisations Organisations are increasingly pursuing to realise their goalsthrough social media (Murdough, 2009). Social media applications support organisations in creating valuein many of their activities, e.g. in marketing, services, human resource management and customer relationshipmanagement (A. N. Smith, Fischer, & Yongjian, 2012). In addition, firms are able to acquire data from socialmedia at low costs. Dey and Haque (2008) state that data generated from online communication acts as“potential gold mines” for discovering knowledge. It is therefore that this thesis focuses on the extraction ofinformation based on the data created by consumers on social media.
The increased application of social media has serious consequences for an organisation’s exposure to the actors intheir environment, which include (potential) customers, suppliers and competitors. It seems that the power hasbeen taken from the corporate marketing departments by individual consumers that create, share and discussonline blogs, tweets, Facebook entries, movies, pictures, etc. (Kietzmann, Hermkens, McCarthy, & Silvestre,2011). With or without permission from the organisation, communication about brands will happen. In an
2 Research Problem
environment where customers gain more and more power, an organisation needs to carefully treat its actions andcontrol its exposure. Therefore, companies empower employees to talk, listen, and respond to what consumerspost on social media (A. N. Smith et al., 2012).
Though many organisations acknowledge the opportunities in the application of social media, there also existsa fair degree of uncertainty with respect to allocating marketing effort and budget to social media, and “limitedunderstanding” of the social media platforms (Weinberg & Pehlivan, 2011). Kietzmann et al. (2011) argue thatmany executives avoid or ignore social media because they do not understand what it is, how to engage with itand learn from it. This thesis contributes to a further understanding of social media and discovers opportunitiesto leverage the valuable content on these platforms for business purposes.
Trend (ii): Business Intelligence in Organisations Business intelligence systems are applied to obtain a betterunderstanding of underlying trends and dependencies – often coming from the external context – that affect thebusiness (Lonnqvist & Pirttimaki, 2006). Whereas BI systems were initially perceived as tools that were usedexclusively to support strategic decision-making, organisations have recently commenced to further exploit thecapabilities of BI systems to support wider business activities (Elbashir, Collier, & Davern, 2008).
The scale of recent investments in BI systems reflects the growing importance and highlights the need for moreattention in research studies. Elbashir et al. (2008) estimated that global spending on BI systems and relatedproducts reached USD 6.1 billion in 2008. A paper by Gartner (2009) predicted that organisations will increasespending on “packaged analytic applications, including corporate performance management (“CPM”), onlinemarketing analytics that optimise processes, not just report on them”. Azvine, Cui, and Nauck (2005) predictthat in the future, “business intelligence will be available to everyone in the enterprise, and will be embeddedin many business systems”.
1-2 Problem StatementThe demand for (real-time) business intelligence and the popularity of social media offer room for synthesis.The opportunities offered by linking both concepts are acknowledged in the literature, e.g by Dey and Haque(2008) and Lovejoy, Waters, and Saxton (2012). However, search queries1 related to the subject of this thesisinto the scientific databases ScienceDirect and JStore, and the search engine Google Scholar resulted in theunderstanding that social media applications for BI purposes are relatively underexposed in the literature.Generally, research in the area of social media is related to marketing activities, sales, promotions, publicrelations and customer relationship management, e.g. by Dong-Hun (2010); Ratner (2003); Klassen (2009);Kozinets, de Valck, Wojnicki, and Wilner (2010); Kirtis and Karahanb (2011); Hanna, Rohm, and Crittenden(2011); A. M. Kaplan and Haenlein (2012); You, Xia, Liu, and Liu (2012). The focus of the research conductedin the literature is mainly focused on the organisation expressing itself to the outside (social media) world,whereas this thesis focuses on the incoming aspect. A reason for the shallow results discovered in the literaturemay be the relatively new character of combining social media and business intelligence.
Zeng, Chen, Lusch, and Li (2010) distinguish social media research between social media analysis and socialmedia intelligence. Social media analysis is concerned with “developing and evaluating informatic tools andframeworks to collect, monitor, analyse, summarise, and visualise social media data”. Social media intelligence –on the other hand – “aims to derive actionable information from social media in context-rich application settings,develop corresponding decision-making or decision-aiding frameworks, and provide architectural designs andsolution frameworks for existing and new applications that can benefit from the wisdom of crowds through theweb”.
Many social media monitoring tools, like Socialmention.com, Radian6, RowFeeder, Trackur, uberVU, SASSocial Media Analytics, Finchline, Sprout Social, etc. mainly reveal the performance of a firm on social media(number of mentions, number of likes, % of positive mentions), and treat the social media component of a firmas a separate business unit executing its own strategy. However, the purpose of business intelligence is to revealthe underlying parameters that determine the performance of the organisation, that is, not limited to solelysocial media performance. In order to understand the influence of social media content on a firm’s performance,a link between the company’s key performance indicators (“KPIs”) and social media parameters is requiredbecause KPIs measure the performance of an organisation with respect to its strategy. Some social media
1(SOCIAL BUSINESS INTELLIGENCE), (BUSINESS INTELLIGENCE 3.0), (SOCIAL MEDIA) AND (ORGANISATION),(SOCIAL MEDIA) AND (BUSINESS), (SOCIAL MEDIA) AND (BUSINESS INTELLIGENCE), (TWITTER) AND (BUSINESSINTELLIGENCE), (WEB 2.0) AND (BUSINESS INTELLIGENCE), (SOCIAL MEDIA) AND (STRATEGY)
1-3 Research Objective 3
monitoring tools, like Kapow Software and ListenLogic seem – at a glance – to establish this link. Zeng et al.(2010) highlight the need for clearly defined social media performance measures because much of the researchis conducted in a setting which aims to support decisions in organisations. We argue that the possibilities ofsocial media for business intelligence purposes reaches further than what is currently offered by the social mediaanalytics tools. This argument is supported by Reinhold and Alt (2011), who state that “existing tools still havea limited functional scope”. The key benefits will be gained whenever the KPIs of an organisation are linked tothe parameters that are measured by social media tools. Only in that case, one can speak about ‘social businessintelligence’. This thesis contributes to a transition from social media ‘monitoring’ towards social ‘businessintelligence’.
Whereas links between organisational performance and social media content can leverage the opportunitiesof social media for firms, a fundamental prerequisite allowing social business intelligence is the existence ofuser-generated social media content. After all, user-generated content that does not exist can not be analysed.Thus, an organisation is dependent for the generation of content on social media users and needs to determinewhether social media data exists before considering to invest in social business intelligence systems. However,it is not clear which organisational characteristics affect the existence of social media content. The followingsection illustrates which factors are to be considered when one tries to categorise the availability of social mediacontent that is related to firms.
Firstly, it is likely that within some industries users express their opinions more often than in other industries.We expect that one expresses his or her opinion more often about a product that is purchased on a frequentbasis. For example, domestic products are purchased more frequent than a car or a house. Therefore, theconsumer industry is probably discussed more often than the real-estate market. Secondly, the relation withend-users makes it that people discuss the company on social media, or not. Some firms are more visiblefor consumers than others. Zhang, Jansen, and Chowdhury (2011) support this factor by concluding that“business engagement on social media relates directly to consumer’s engagement with online word-of-mouthcommunication”. When users experience malfunctions in a mobile network they complain at the firm at whichthey signed the contract, while the firm that delivered the network equipment – which may be responsible for theerrors – remains unaffected. This example illustrates that it is necessary to make a distinction between companiesin the same industry based on their position regarding consumers. Turban, Lee, King, and Chung (1999) classifye-commerce into either business-to-business (“B2B”), business-to-consumer (“B2C”), consumer-to-consumer(“C2C”), consumer-to-business (“C2B”), non-business e-commerce, or intra-business e-commerce” (as cited inChen, Jeng, Lee, and Chuang (2008)). We will use this classification to assign an organisation’s positionregarding consumers since it clearly illustrates how close an organisation acts to the end consumer. As such thenetwork service provider can be positioned as a B2C firm, while the provider of the equipment performs B2Brelations.
Next, in the case that there exists social media content, an organisation should be able collect and analyse thedata. The unstructured nature of the data, various languages, various data formats, interpretation difficulties,unverified information and privacy issues are aspects that make the usage of social media data for businessintelligence different from ‘regular’ – i.e. internal management information – BI data.
Knowledge Gap From the previous, we can conclude the following. It is unclear in which industries and forwhich type of customer relations firms can apply social media data for business intelligence. Secondly, thereis no understanding how organisations should process social media data in relation with business intelligence.Taking into account the previous, the following knowledge gap is formulated:
It is unclear how firms can process social media data for business intelligence, and how theapplicability of social media data for business intelligence varies among different industries anddifferent customer relation types.
1-3 Research ObjectiveSocial media is a new phenomenon, and increasingly popular for both consumers and organisations. Businessintelligence is applied in organisations to measure organisational performance and to provide managerialinformation. The literature agrees that social media posts may contain valuable insights for organisationsthat managers can use in their decision-making. Hence, the two concepts offer room for synthesis. However,there does not exist a structured procedure that prescribes how organisations should acquire and analyse these
4 Research Problem
social media posts in order to generate managerial information. In addition, it is unknown how (i) differentindustries and (ii) different customer relations affect the existence of social media data on the web. Afterall, if (potential) clients do not generate social media posts related to a firm, it will not be possible to deriveinformation from the posts. Therefore, the objective of this thesis is formulated as:
The objective of this research is to develop a procedure to utilise social media data for businessintelligence, for which the applicability is investigated for firms in different industries and fordifferent relations with end-users.
As such, insight in (i) the suitability of social media for business intelligence for different organisations and (ii)a procedure prescribing the steps required for social business intelligence is obtained.
Concepts in Research Objective In order to clarify the research objective, the key concepts are listed andexplained below.
• Procedure to utilise social media data for business intelligenceA procedure to utilise social media data for business intelligence prescribes which steps are necessary whenan organisation applies social media data for the measurement of organisational performance. Within businessintelligence procedures, managers endeavour to measure organisational performance based on metrics that reflectthe performance of organisational activities. Generally, these activities are performed by different departments.In this thesis we look for performance metrics that are influenced by social media data.
• Social media dataSocial media data can be quantitative or qualitative in nature. Examples of quantitative social media data are thenumber of likes, views or shares of a certain page, the number of followers, friends or retweets through the courseof time. Qualitative social media data contains the text of the posts. In this thesis, we investigate how socialmedia data can be used for business intelligence.
• Business intelligenceBusiness intelligence is a process in which information is derived from data to support decision making. Theacquired information is required to measure organisational performance, at which managers can base their decisions.Information may for example relate to trends in the level of inventory of a certain product, or the amount of salesin a certain period.
• Firm contextsThough there are various ways to define a firm’s context, we describe the context of a firm based on two dimensionsin this thesis: (i) industry and (ii) relation with end-consumers. We employ this definition of context in this thesisbecause we are particularly interested in the variations of the applicability of social business intelligence on thesetwo dimensions. Next, a generic classification of a firm’s context on these two dimensions allows the conclusionsof the research to be applicable at a broad range of firms.
i. IndustryOrganisations can be classified in industries. All organisations in the same industry deliver similar products/ services. We apply CBS’ (2012) classification to position firms in certain industries. Examples of industriesare the telecommunications industry, or the financial industry.
ii. Relation with end-usersEach organisation has different customers. Generally, a distinction between Business-To-Business (“B2B”)and Business-To-Consumer (“B2C”) is made to described the relation with an organisation’s customer. InB2C relations, the end-user is part of the relation.
1-4 Research QuestionsFrom the research objective, the following main research question is formulated:
How can firms use social media data for business intelligence, taking into account the firm’s specificindustry and relationship with end-users?
1-5 Coherence of Research Questions 5
In order to describe the domain of this thesis, the first sub question describes the current state of social media,the role of business intelligence in firms and the developments towards social business intelligence. Therefore,the first sub question is formulated as:
1. What is the current state of social media in relation with business intelligence?
(a) What are social media?(b) How are social media generally applied within firms?(c) How is business intelligence generally applied within firms?(d) How are key-performance indicators established within firms?(e) How can key-performance indicators be categorised?(f) What is social business intelligence?
The main research objective contains a component in which we reveal in which contexts – i.e. for whichindustries and for which customer relation type – firms are able to acquire social media data, and in which not.This objective follows from the fact that firms are dependent on the users of social media whether or not socialmedia data is available. Therefore, the second sub question investigates for which firms social media posts areavailable, and to what subjects the posts are related. The subjects of social media posts are consequently usedto assign social media posts to the KPIs of a firm. The composition of the second sub question is twofold, subquestions 2(a) and 2(b) are quantitative in nature and provide insight in the volume of social media posts. Onthe other hand, 2(c) and 2(d) are qualitative in nature and provide insight in the content of the social mediaposts related to firms. The second sub question is formulated as:
2. In which firm contexts2 are firms able to acquire social media data for business intelligence?
(a) How does the volume of social media posts related to firms vary between different industries?(b) How does the volume of social media posts related to firms vary between different relations with
end-users?(c) How do subjects of social media posts related to firms vary between different industries?(d) How do subjects of social media posts related to firms vary between different relations with
end-users?
Secondly, the research objective contains a component in which we describe how a firm can acquire and processsocial media data for business intelligence purposes. The third sub question focuses on the development of aprocedure to process social media data so that it can be joined up in business intelligence processes. A keyrequirement of this process is that it should fit within existing business intelligence activities. Therefore, 1(c)investigates how business intelligence is generally applied in organisations, and will result in requirements fora procedure in which social media data is applied for business intelligence. As discussed, social media datadiffers from data that is generally processed in BI systems. Question 3(a) discusses the potential problems andpitfalls when processing social media data. Consequently, 3(b) provides solutions for these problems. In 3(c),we determine how social media data can be linked to KPIs. Finally, 3(d) describes how a firm can process socialmedia data while following the generally applied BI approach. The third sub question is defined as:
3. Which processes are required to incorporate social media data into general business intelligenceframeworks?
(a) What problems arise when applying social media data for business intelligence?(b) How can the problems discovered in 3(a) be tackled?(c) How can social media data be linked to key-performance indicators?(d) How can social media data be processed in accordance with general business intelligence systems?
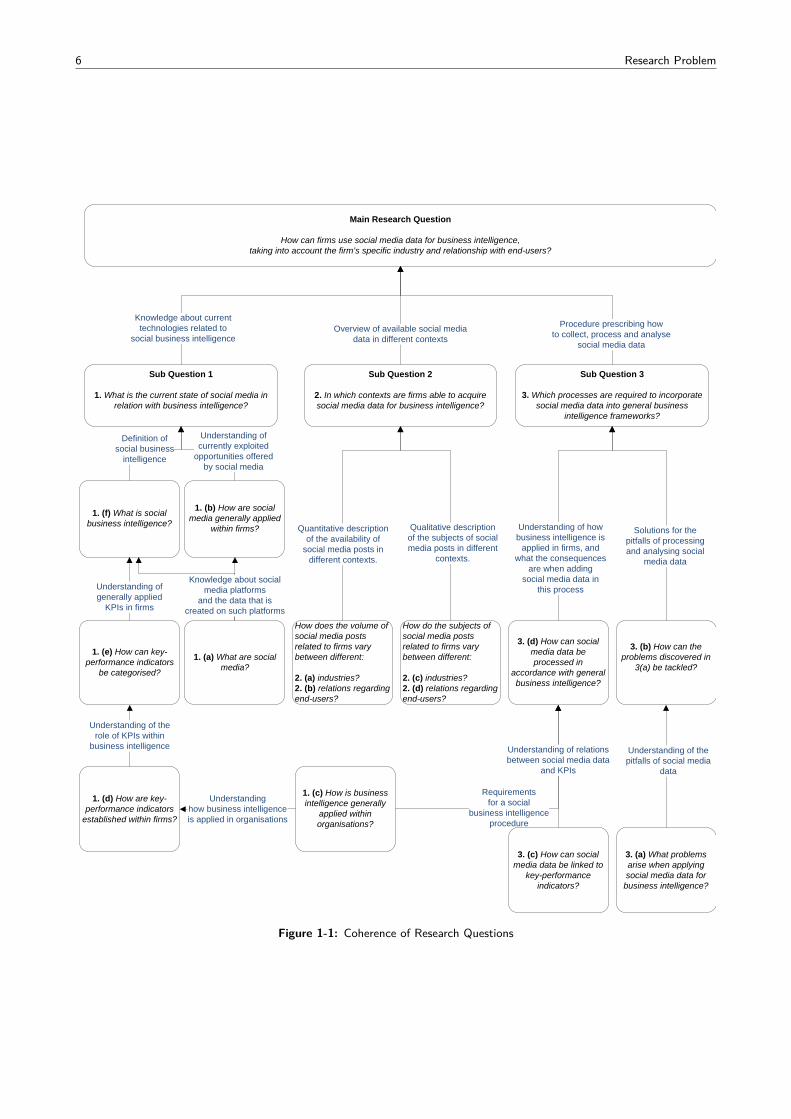
1-5 Coherence of Research QuestionsEach research question delivers information that is required to answer another question. The coherence of theresearch questions is presented in figure 1-1. The arrows represent the output of a research question which, inturn, serve as input to answer an other research question.
2In this thesis, we define a firm context based on the firm’s industry and customer relation type.
6 Research Problem
Requirementsfor a social
business intelligenceprocedure
Main Research Question
How can firms use social media data for business intelligence,taking into account the firm’s specific industry and relationship with end-users?
Sub Question 2
2. In which contexts are firms able to acquire social media data for business intelligence?
Sub Question 3
3. Which processes are required to incorporate social media data into general business
intelligence frameworks?
Procedure prescribing howto collect, process and analyse
social media data
How does the volume of social media posts related to firms vary between different:
2. (a) industries?2. (b) relations regarding end-users?
Quantitative descriptionof the availability of
social media posts in different contexts.
Qualitative descriptionof the subjects of socialmedia posts in different
contexts.
How do the subjects of social media posts related to firms vary between different:
2. (c) industries?2. (d) relations regarding end-users?
1. (c) How is business intelligence generally
applied within organisations?
3. (d) How can social media data be processed in
accordance with general business intelligence?
3. (a) What problems arise when applying social media data for
business intelligence?
Understanding of howbusiness intelligence is
applied in firms, andwhat the consequences
are when addingsocial media data in
this process
3. (b) How can the problems discovered in
3(a) be tackled?
Understanding of thepitfalls of social media
data
Solutions for thepitfalls of processingand analysing social
media data
Sub Question 1
1. What is the current state of social media in relation with business intelligence?
Overview of available social mediadata in different contexts
Knowledge about currenttechnologies related to
social business intelligence
3. (c) How can social media data be linked to
key-performance indicators?
Understanding of relationsbetween social media data
and KPIs
1. (a) What are social media?
1. (b) How are social media generally applied
within firms?
1. (d) How are key-performance indicators
established within firms?
Understandinghow business intelligenceis applied in organisations
1. (f) What is social business intelligence?
Definition ofsocial business
intelligence
Understanding of currently exploited
opportunities offeredby social media
Understanding ofgenerally applied
KPIs in firms
Knowledge about socialmedia platforms
and the data that iscreated on such platforms
1. (e) How can key-performance indicators
be categorised?
Understanding of therole of KPIs within
business intelligence
Figure 1-1: Coherence of Research Questions
1-6 Research Method 7
1-6 Research MethodThis section describes the type of research (section 1-6-1), the research method (section 1-6-2) and the approachof the research (section 1-6-3).
1-6-1 Exploratory ResearchExploratory research is conducted for a problem that has not been clearly defined. It relies on reviewingliterature and/or data. Often, the results of exploratory research are not usually useful for decision-making bythemselves, but they can provide significant insight into a given situation. The goal is to learn “what is going onthere?”, and to investigate social phenomena without explicit expectations. Mainly, the purposes of exploratoryresearch are exploratory, descriptive and explanatory in nature. This thesis researches an area that is relativelyunexplored, and of which the functioning is not clearly documented in theories and frameworks. Therefore, thisthesis can be positioned under exploratory research.
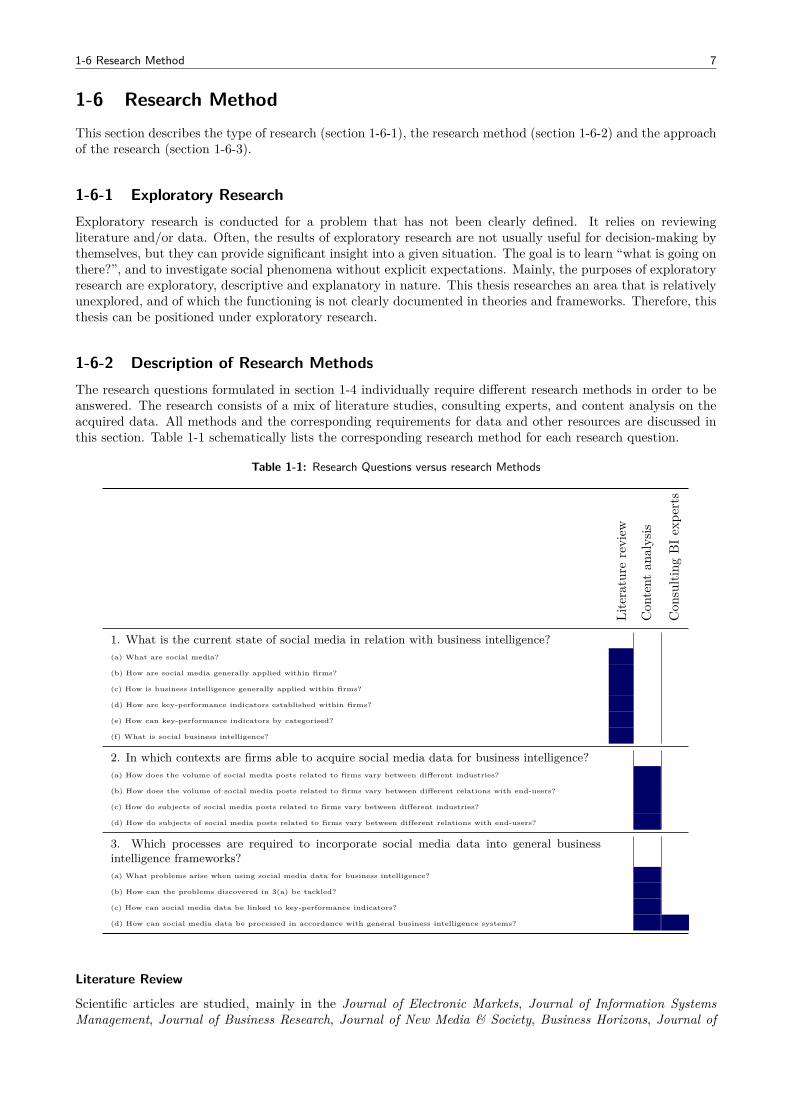
1-6-2 Description of Research MethodsThe research questions formulated in section 1-4 individually require different research methods in order to beanswered. The research consists of a mix of literature studies, consulting experts, and content analysis on theacquired data. All methods and the corresponding requirements for data and other resources are discussed inthis section. Table 1-1 schematically lists the corresponding research method for each research question.
Table 1-1: Research Questions versus research Methods
Literature
review
Con
tent
analysis
Con
sulting
BIexpe
rts
1. What is the current state of social media in relation with business intelligence?(a) What are social media?
(b) How are social media generally applied within firms?
(c) How is business intelligence generally applied within firms?
(d) How are key-performance indicators established within firms?
(e) How can key-performance indicators by categorised?
(f) What is social business intelligence?
2. In which contexts are firms able to acquire social media data for business intelligence?(a) How does the volume of social media posts related to firms vary between different industries?
(b) How does the volume of social media posts related to firms vary between different relations with end-users?
(c) How do subjects of social media posts related to firms vary between different industries?
(d) How do subjects of social media posts related to firms vary between different relations with end-users?
3. Which processes are required to incorporate social media data into general businessintelligence frameworks?(a) What problems arise when using social media data for business intelligence?
(b) How can the problems discovered in 3(a) be tackled?
(c) How can social media data be linked to key-performance indicators?
(d) How can social media data be processed in accordance with general business intelligence systems?
Literature Review
Scientific articles are studied, mainly in the Journal of Electronic Markets, Journal of Information SystemsManagement, Journal of Business Research, Journal of New Media & Society, Business Horizons, Journal of
8 Research Problem
Strategic Information Systems and the Journal of Computer-Mediated Communication. The literature reviewwas supported by books in the related research context. In addition, reports and white papers by acknowledgedconsulting firms in the field of information technology have been studied. The novel character of social mediaand social business intelligence makes it that especially in these reports social business intelligence is mentioned,whereas this term is less visible in the scientific area. These reports often contain examples from innovationsand practical experiences. A such, a variate overview will be presented about related research and theories tothis thesis.
Consulting Business Intelligence Experts
Firstly, interviewing experts contributes to an understanding of the actual situation of business intelligence inorganisations and the potential role of social media in this field. This allows to scope the research in a topicthat is actual and relevant. Secondly, a part of the research will describe how business intelligence is appliedin organisations. Whereas this is mainly investigated using literature in the field of business intelligence, BIexperts can validate the findings. Thirdly, a procedure prescribing how to execute social business intelligencewill be develop. Such a procedure is required to be applicable in organisations as an integral part of the existing– regular – BI process.
Content Analysis
Content analysis is appropriate for this research since it offers a systematic method to compare content for alarge sample of data. Content analysis is a research technique that can be used to identify what people aresharing on social media. The research technique is described by Stephens (2012) as an “in-depth look at recordedinformation” and as “a means of analysing texts” by Bos and Tarnai (1999). The sources of these texts can bevarious, for example newspapers, articles, web sites, or – as in this research – social media posts. Neuendorf(2002) defines content analysis as a “systematic, objective, quantitative analysis of message characteristics”.As discussed, this thesis purposes to analyse the characteristics of social media posts, and link these posts toorganisational functions. Krippendorff (2004) states that a “content analysis entails a systematic reading of abody of texts”, and argues that every content analysis requires the following six questions to be considered:
1. Which data are analysed?
2. How are they defined?
3. What is the population from which they are drawn?
4. What is the context relative to which the data are analysed?
5. What are the boundaries of the analysis?
6. What is the target of the inferences?
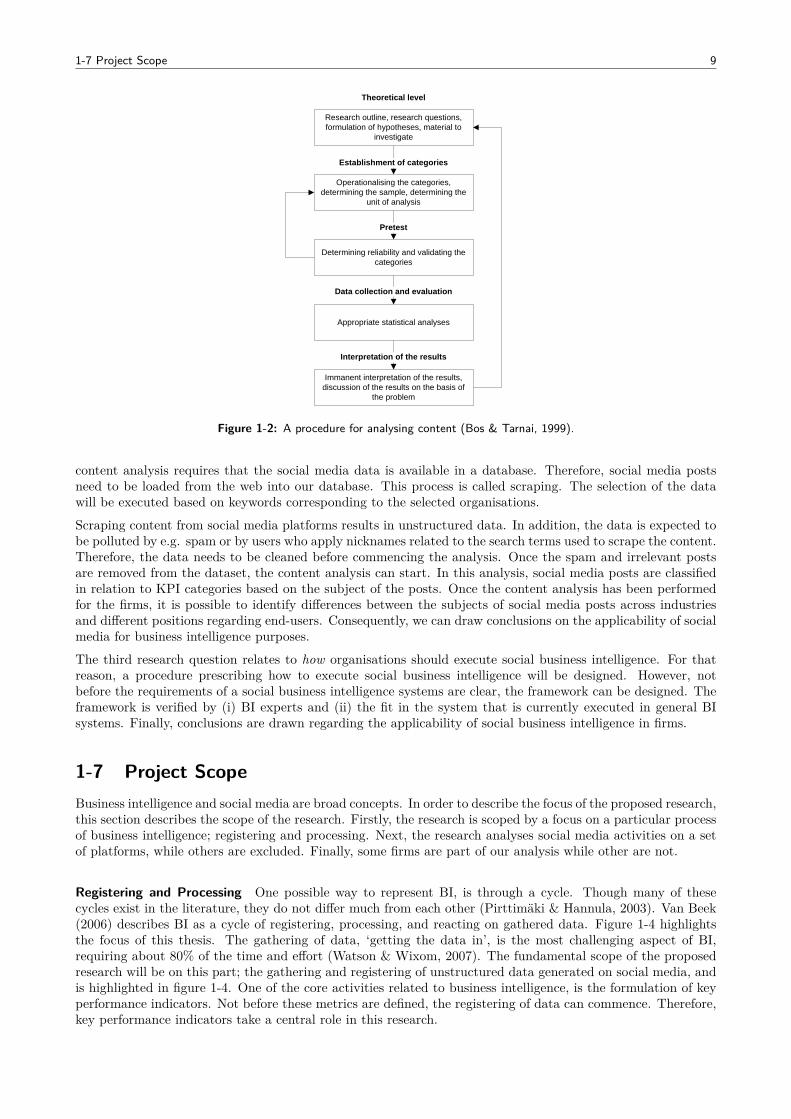
Bos and Tarnai (1999) provide a procedure for analysing content, which is schematically shown in figure 1-2. Inthe first step, the problem is formulated at the theoretical level, research questions are defined and the object ofinvestigation is determined. Secondly, the unit of analysis is defined by establishing categories and determiningthe sample. The third step consists of pretesting the reliability of the data, and the validation of the categoriesthat were established in step 2. Discovered deficiencies are consequently renovated. In the fourth step of thecontent analysis procedure the data is collected and analysed. Finally, the results are interpreted and discussedon the basis of the problem.
It is the stepwise approach of Bos and Tarnai (1999) that is applied on the content analysis of this thesis. We willretrieve user-generated content from various social media platforms, store it into a database, and consequentlyanalyse the collected posts. By analysing the social media content, it is possible to classify the nature of thecontent into categories, and find differences between posts related to different organisations.
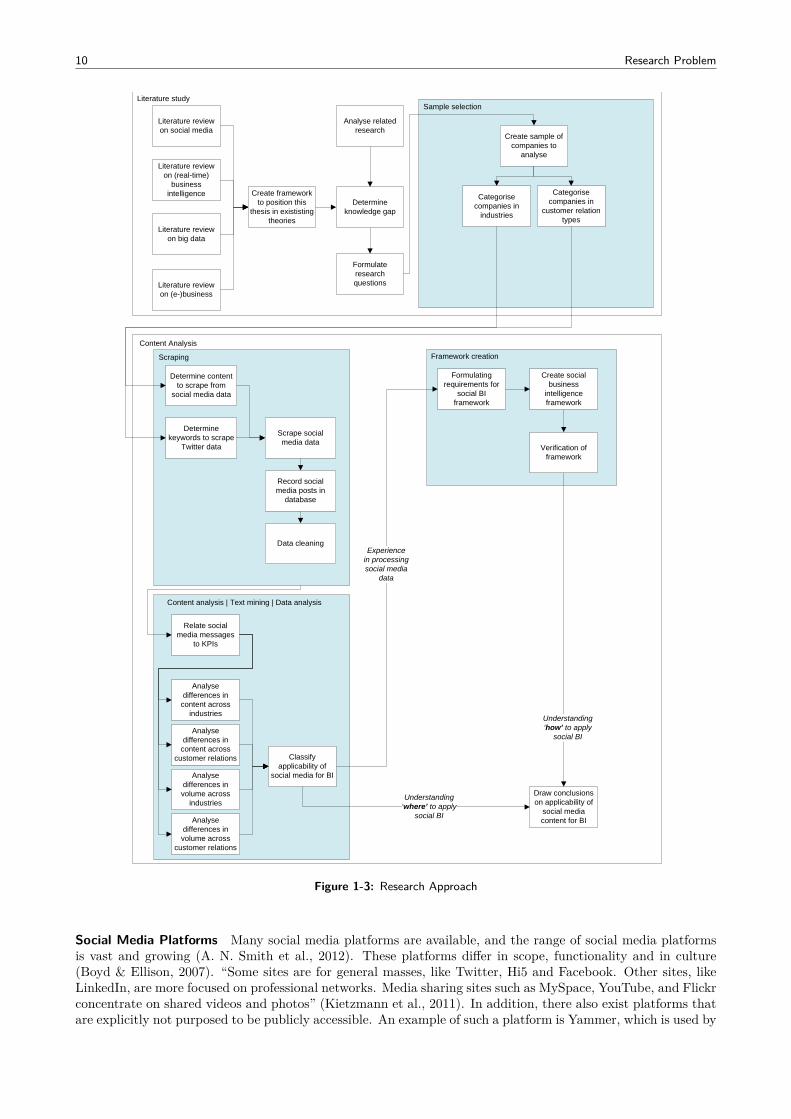
1-6-3 Data Collection and Research ApproachFigure 1-3 illustrates the sequence and the links of the research steps in a schematic manner. A sample consistingof several organisations across different industries and with different customer relation types will be established.The selection of the organisations forms the point of departure for the collection of social media data. The
1-7 Project Scope 9
Research outline, research questions, formulation of hypotheses, material to
investigate
Operationalising the categories, determining the sample, determining the
unit of analysis
Establishment of categories
Theoretical level
Determining reliability and validating the categories
Pretest
Appropriate statistical analyses
Data collection and evaluation
Immanent interpretation of the results, discussion of the results on the basis of
the problem
Interpretation of the results
Figure 1-2: A procedure for analysing content (Bos & Tarnai, 1999).
content analysis requires that the social media data is available in a database. Therefore, social media postsneed to be loaded from the web into our database. This process is called scraping. The selection of the datawill be executed based on keywords corresponding to the selected organisations.
Scraping content from social media platforms results in unstructured data. In addition, the data is expected tobe polluted by e.g. spam or by users who apply nicknames related to the search terms used to scrape the content.Therefore, the data needs to be cleaned before commencing the analysis. Once the spam and irrelevant postsare removed from the dataset, the content analysis can start. In this analysis, social media posts are classifiedin relation to KPI categories based on the subject of the posts. Once the content analysis has been performedfor the firms, it is possible to identify differences between the subjects of social media posts across industriesand different positions regarding end-users. Consequently, we can draw conclusions on the applicability of socialmedia for business intelligence purposes.
The third research question relates to how organisations should execute social business intelligence. For thatreason, a procedure prescribing how to execute social business intelligence will be designed. However, notbefore the requirements of a social business intelligence systems are clear, the framework can be designed. Theframework is verified by (i) BI experts and (ii) the fit in the system that is currently executed in general BIsystems. Finally, conclusions are drawn regarding the applicability of social business intelligence in firms.
1-7 Project ScopeBusiness intelligence and social media are broad concepts. In order to describe the focus of the proposed research,this section describes the scope of the research. Firstly, the research is scoped by a focus on a particular processof business intelligence; registering and processing. Next, the research analyses social media activities on a setof platforms, while others are excluded. Finally, some firms are part of our analysis while other are not.
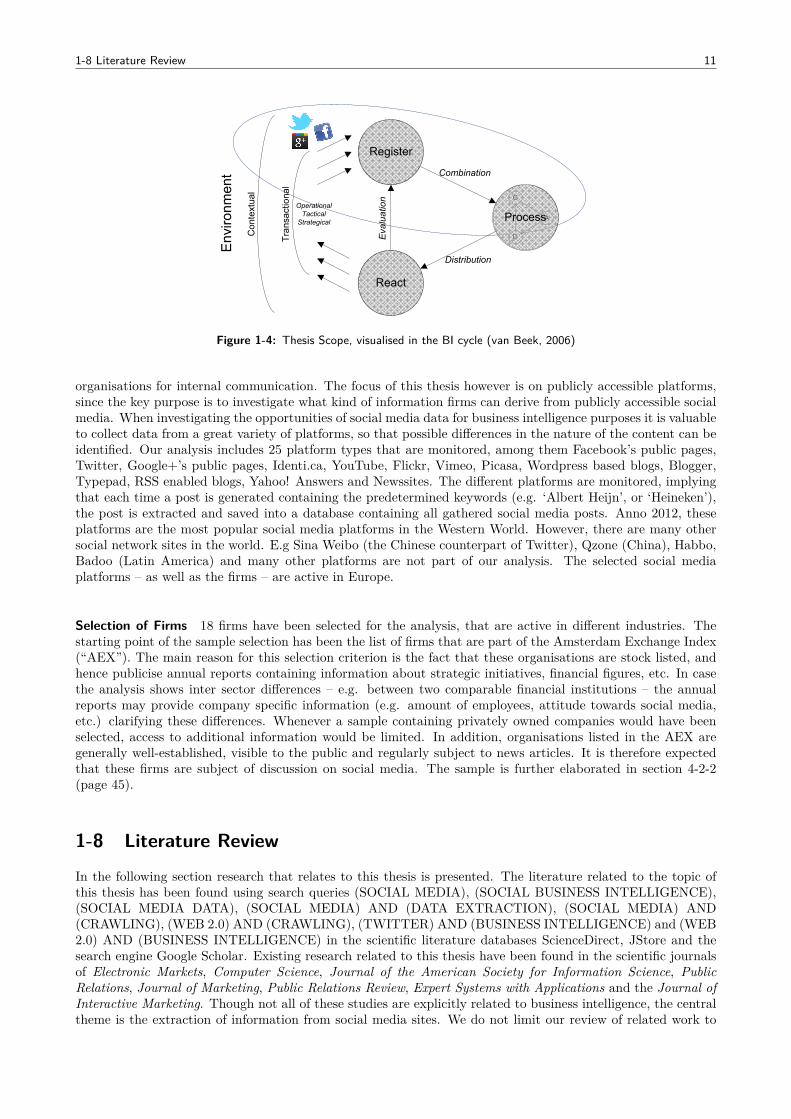
Registering and Processing One possible way to represent BI, is through a cycle. Though many of thesecycles exist in the literature, they do not differ much from each other (Pirttimäki & Hannula, 2003). Van Beek(2006) describes BI as a cycle of registering, processing, and reacting on gathered data. Figure 1-4 highlightsthe focus of this thesis. The gathering of data, ‘getting the data in’, is the most challenging aspect of BI,requiring about 80% of the time and effort (Watson & Wixom, 2007). The fundamental scope of the proposedresearch will be on this part; the gathering and registering of unstructured data generated on social media, andis highlighted in figure 1-4. One of the core activities related to business intelligence, is the formulation of keyperformance indicators. Not before these metrics are defined, the registering of data can commence. Therefore,key performance indicators take a central role in this research.
10 Research Problem
Sample selection
Content analysis | Text mining | Data analysis
Literature review on social media
Literature review on (real-time)
business intelligence
Literature review on big data
Literature study
Analyse related research
Create framework to position this
thesis in exististing theories
Content Analysis
Draw conclusions on applicability of
social media content for BI
Literature review on (e-)business
Determine knowledge gap
Formulate research questions
Relate social media messages
to KPIs
Analyse differences in volume across
industries
Analyse differences in
content across industries
Classify applicability of
social media for BI
Determine keywords to scrape
Twitter data
Scrape social media data
Record social media posts in
database
Determine content to scrape from
social media data
Scraping
Data cleaning
Analyse differences in
content across customer relations
Create sample of companies to
analyse
Categorise companies in
customer relation types
Categorise companies in
industries
Framework creation
Create social business
intelligence framework
Experiencein processingsocial media
data
Understanding‘where’ to apply
social BI
Understanding‘how’ to apply
social BI
Formulating requirements for
social BI framework
Verification of framework
Analyse differences in volume across
customer relations
Figure 1-3: Research Approach
Social Media Platforms Many social media platforms are available, and the range of social media platformsis vast and growing (A. N. Smith et al., 2012). These platforms differ in scope, functionality and in culture(Boyd & Ellison, 2007). “Some sites are for general masses, like Twitter, Hi5 and Facebook. Other sites, likeLinkedIn, are more focused on professional networks. Media sharing sites such as MySpace, YouTube, and Flickrconcentrate on shared videos and photos” (Kietzmann et al., 2011). In addition, there also exist platforms thatare explicitly not purposed to be publicly accessible. An example of such a platform is Yammer, which is used by
1-8 Literature Review 11
G
D
A
Register
React
Process
Combination
Distribution
Evaluation
OperationalTacticalStrategical
Contextual
Transactional
Environment
Figure 1-4: Thesis Scope, visualised in the BI cycle (van Beek, 2006)
organisations for internal communication. The focus of this thesis however is on publicly accessible platforms,since the key purpose is to investigate what kind of information firms can derive from publicly accessible socialmedia. When investigating the opportunities of social media data for business intelligence purposes it is valuableto collect data from a great variety of platforms, so that possible differences in the nature of the content can beidentified. Our analysis includes 25 platform types that are monitored, among them Facebook’s public pages,Twitter, Google+’s public pages, Identi.ca, YouTube, Flickr, Vimeo, Picasa, Wordpress based blogs, Blogger,Typepad, RSS enabled blogs, Yahoo! Answers and Newssites. The different platforms are monitored, implyingthat each time a post is generated containing the predetermined keywords (e.g. ‘Albert Heijn’, or ‘Heineken’),the post is extracted and saved into a database containing all gathered social media posts. Anno 2012, theseplatforms are the most popular social media platforms in the Western World. However, there are many othersocial network sites in the world. E.g Sina Weibo (the Chinese counterpart of Twitter), Qzone (China), Habbo,Badoo (Latin America) and many other platforms are not part of our analysis. The selected social mediaplatforms – as well as the firms – are active in Europe.
Selection of Firms 18 firms have been selected for the analysis, that are active in different industries. Thestarting point of the sample selection has been the list of firms that are part of the Amsterdam Exchange Index(“AEX”). The main reason for this selection criterion is the fact that these organisations are stock listed, andhence publicise annual reports containing information about strategic initiatives, financial figures, etc. In casethe analysis shows inter sector differences – e.g. between two comparable financial institutions – the annualreports may provide company specific information (e.g. amount of employees, attitude towards social media,etc.) clarifying these differences. Whenever a sample containing privately owned companies would have beenselected, access to additional information would be limited. In addition, organisations listed in the AEX aregenerally well-established, visible to the public and regularly subject to news articles. It is therefore expectedthat these firms are subject of discussion on social media. The sample is further elaborated in section 4-2-2(page 45).
1-8 Literature Review
In the following section research that relates to this thesis is presented. The literature related to the topic ofthis thesis has been found using search queries (SOCIAL MEDIA), (SOCIAL BUSINESS INTELLIGENCE),(SOCIAL MEDIA DATA), (SOCIAL MEDIA) AND (DATA EXTRACTION), (SOCIAL MEDIA) AND(CRAWLING), (WEB 2.0) AND (CRAWLING), (TWITTER) AND (BUSINESS INTELLIGENCE) and (WEB2.0) AND (BUSINESS INTELLIGENCE) in the scientific literature databases ScienceDirect, JStore and thesearch engine Google Scholar. Existing research related to this thesis have been found in the scientific journalsof Electronic Markets, Computer Science, Journal of the American Society for Information Science, PublicRelations, Journal of Marketing, Public Relations Review, Expert Systems with Applications and the Journal ofInteractive Marketing. Though not all of these studies are explicitly related to business intelligence, the centraltheme is the extraction of information from social media sites. We do not limit our review of related work to
12 Research Problem
one social media platform. Instead, the presented research consists of a mix in which Twitter, Facebook, Blogs,and Questioning and Answering sites served as the data source.
Jansen, Zhang, Sobel, and Chowdury (2009) analysed 150,000 tweets containing branding comments, sentiments,and opinions. The researchers analysed the content of the tweets, and found that 19% of microblogs’ postscontain a mention of a brand. Of these branding microblogs, nearly 20% contained some expression of brandsentiments. Of these, more than 50% were positive and 33% were critical of the company or product. Theresearch concludes that microblogging is an online tool for customer word of mouth communications, and isespecially suited for brand management activities.
Zhang et al. (2011) – in their quest to uncover the Twitter community dynamics – studied the “influences ofbusiness engagement in online word-of-mouth communication” and investigated “the trajectories of a business’online word-of-mouth message diffusion in the Twitter community”. They studied nine-brands on Twitter, andconcluded that “business engagement on Twitter enhances consumers’ engagement with online word-of-mouthcommunication”. Therefore, the authors argue that “businesses must go beyond simply being aware of or takinginto consideration electronic word-of-mouth messages and instead must engage in the communication processas both initiators and active participants. Next, Zhang et al. (2011) found that “retweeting, as an explicit wayto show consumers’ response to business engagement, only reaches consumers with a second-degree relationshipto the brand” and that the “life cycle of a tweet is generally 1.5 to 4 hours at most”.
McCorkindale (2010) investigated – based on a content analysis – how the Fortune 50 companies used Facebook.The research studied how many fans an organisation had, what organisational information was included, if theyused photos and videos, if they used discussion boards, whether they generated feedback, etc. She found thatcompanies are using Facebook extensively, but that most companies were not using the site to “disseminatenews and information about the organisation”. Next, the research indicated that the companies should focusmore on “relationship-building strategies in order to encourage users to revisit the sites”. The content analysisof McCorkindale (2010) revealed that there are several reasons why people post on Facebook pages. “Somewere current employees who identified where they worked and for how long, while some were former employeesreconnecting with past coworkers. Headhunters posted jobs at competing corporations on the wall, and jobseekers posted they were looking for employment. Customers having product problems, especially in thetechnology field, would post their issues on the wall hoping to find solutions. Journalists also posted on pagesrequesting interviews”.
Agichtein, Castillo, Donato, Gionis, and Mishne (2008) argue that the “quality of user-generated content variesdrastically from excellent to abuse and spam”, and that the “task of identifying high-quality content in sitesbased on user contributions – social media sites – becomes increasingly important”. Therefore, the authorsdeveloped a method to exploit “community feedback to automatically identify high quality content”. Agichteinet al. (2008) applied their model on a popular questioning and answering site (Yahoo! Answers). The systemof Agichtein et al. (2008) models all user relations, and applies the user ratings on the individual answers. Assuch, the system determines high-quality content based on the ratings that users assigned to the content.
Guo, Zhang, Tan, and Guo (2012) developed a system that detects popular topics on Twitter. According tothe authors, the key technology in mining web text includes the modules “text classification, clustering, topicdetection and tracking, opinion tendency identification, and multi-document automatic summarisation”. Guoet al. (2012) argue that popular topic detection systems should entail these five modules. However, the natureof tweets – “very short, sparse and spreading rapidly” – is different from regular web text. Therefore, Guo etal. (2012) propose a more “flexible and practical approach based on frequent pattern mining”.
Kozinets et al. (2010) qualitatively studied 83 blogs in order to understand how marketing departments influenceconsumer-to-consumer communications. The authors distinguished the strategies of the marketeers into fourcategories – evaluation, embracing, endorsement, and explanation.
Araujo and Neijens (2012) researched how top global brands participated in social network sites by investigatingwhich factors influence the presence and level of engagement of these brands on social network sites. The authorsreviewed the corporate websites of 129 brands in different markets, targeting different ages of audience, differenthome markets, different web operations and in different countries. Consequently, the authors determinedwhether or not the companies refer to their presence at social network sites. The research found that socialnetwork site “presence was significantly higher for information technology and telecommunication brands”(Araujo & Neijens, 2012), implying that the presence of firms on social media differs between firms in differentindustries. Furthermore, Araujo and Neijens (2012) found that “brands targeting younger audiences also engageat higher levels than brands targeting generic audiences” and that the “country in which the brand operatesplays a significant role in a brand’s likelihood of adopting social network sites”. The findings of Araujo and
1-9 Scientific Relevance 13
Neijens (2012) indicate that the applicability of social media for business purposes differs between firms, whichsupport the basis of this thesis.
Dey and Haque (2008) acknowledge that “the data generated from online communication acts as potential goldmines for discovering knowledge”. However, as Dey and Haque (2008) illustrate, “the quality of texts generatedfrom online sources can be extremely poor and noisy” because the “text data typically comprises spelling errors,ad-hoc abbreviations and improper casing, incorrect punctuation and malformed sentences”. It is thereforethat text mining techniques based on “pure linguistic strategies fail to extract information from noisy text”.According to Dey and Haque (2008), “statistical techniques on the other hand which though not as successfulas the linguistic methods, are more suited to extract information from noisy text. However, lack of appropriatetraining data often poses as a bottleneck”. Dey and Haque (2008) conclude that – when processing unstructuredsocial media data – “domain related training sets” are required to the clean the text before the text can beprocessed by Natural Language Processing Tools. With such domain related training sets, the word ‘small’ canbe classified as either positive or negative, depending on its context.
Lovejoy et al. (2012) performed a content analysis of the tweets related to 73 non-profit organisations to examine“how these organisations use Twitter to engage stakeholders”. Within that analysis, the researchers looked at“the organisations’ utilisation of tweet frequency, following behaviour, hyperlinks, hashtags, public messages,retweets, and multimedia files”. Lovejoy et al. (2012) conclude that non-profit organisations use social media asa “one-way communication channel”, and not as a platform for “conversation and community building”.
Lee (2012) acknowledge that the “contents of microblogs preserve valuable information”. In his study, Lee(2012) focused on real-world offline events, and the information that was generated on social media sites relatedto those events. With his system, it is possible to detect real-world events through the content on social mediasites. Also Lee (2012) argues that the challenge of automatically classifying social media posts is the informalstructure of the text.
Dhar & Chang’s (2009) research is one of the few that studied the relation between social media activity andorganisational performance. More specifically, they employed social media data to predict sales in the musicindustry. Using linear and nonlinear regression, Dhar and Chang (2009) found that “(a) the volume of blogposts about an album is positively correlated with future sales, (b) greater increases in an artist’s Myspacefriends week over week have a weaker correlation to higher future sales, (c) traditional factors are still relevant– albums released by major labels and albums with a number of reviews from mainstream sources also tendedto have higher future sales”.
Tirunillai and Tellis (2012) studied the relationship between user-generated content and stock marketperformance of the firm. The authors found that “of all the metrics of UGC, volume of chatter has thestrongest positive effect on abnormal returns and trading volume. Whereas negative UGC has a significantnegative effect on abnormal returns, positive UGC has no significant effects on these metrics. The volume ofchatter and negative chatter have a significant effect on trading volume”. In addition, Tirunillai and Tellis(2012) found that “an increase in off-line advertising significantly increases the volume of chatter and decreasesnegative chatter”.
From the literature review, we can conclude that there is scientific attention in the research field of social mediaand the relation with organisational performance. However, no research has been found that investigates theapplicability of social media for organisations in (i) different industries and with (ii) different customer relationtypes. Next, though some studies individual tackle difficulties that are inherent to the usage of social media data,no research has been found that integrally describes how social media should be collected and processed withina firm. As illustrated, the opportunities for social media are beneficial on many aspects. However, managersare also reluctant to allocate budget to social media activities (Weinberg & Pehlivan, 2011) and incorporatesocial media data in the firm’s BI process, because they do not fully understand what social media intelligencemay bring to the firm. In addition, it is unclear which type of firms are subject of discussion on social mediaand – if they are – how a firm should collect and process these data so that it adds value to the firm.
1-9 Scientific RelevanceThe proposed research touches the world of e-business, which implies “the transformation of key businessprocesses through the use of internet technologies” (Chaffey, 2009). The monitoring of opinions, customerthoughts, etc. by electronic means – for instance by social media sites – can be positioned under the denominator‘e-business’. Many literature exists in which the world of e-business is described. This research contributes toexisting models and theories by positioning social media content as an external factor in these theories.
14 Research Problem
Next, science is built on data. The more data is available to scientists, the “greater the level of transparencyand reproducibility and hence the more efficient the scientific process becomes” (Molloy, 2011). Historically,scientific data has not been openly available. In recent years, several scientists advocate the application of opendata. The proposed research will be based on publicly accessible data – coming from social media – and willhence contribute to understanding the opportunities and threats of applying public data for scientific purposes.
The literature contains many definitions of business intelligence, and provides theories describing how BIprocesses internal as well as external data. Data from social media can be positioned under external factors.This thesis positions explicitly adds social media data into the existing theories of business intelligence.
Next, the research will be executed based on the research methodology of content analysis. Though this methodis yet widely applied in many research areas, the fact that the source of the content in this research is socialmedia, makes it new. The lessons learned in this research from applying a content analysis on social media datacontribute to the research methodology of content analysis.
Finally, the literature of customer relationship management (“CRM”) describes how organisations interact withtheir customers. Recent literature also includes social media solutions into CRM activities. This research revealshow user-generated content varies between industries, departments and the position regarding consumers. Assuch, the conclusions of this thesis contribute to the applicability of CRM through means of social media.
1-10 Societal RelevanceMany executives avoid or ignore social media because they do not understand what it is and how to engagewith it and learn, though they sense that social media is – and will remain – an important “fabric of commerce”(Kietzmann et al., 2011; Weinberg & Pehlivan, 2011). This thesis contributes to a further understanding of socialmedia, and to leverage the opportunities of applying the valuable content on these platforms for organisationalefforts. The social media phenomenon is relatively fresh, Facebook was launched in 2004, Twitter in 2006.Because of the novelty, the opportunities for organisations’ social BI activities are rather unexplored. Thisresearch also contributes to an understanding for firms whether or not social media data can be applied forbusiness intelligence purposes in which context. In addition, we expect that legacy BI vendors – such as SAP,Oracle and IBM – are soon asked by their clients to add a social media component to their BI suite. For theseorganisations social business intelligence is also a new phenomenon, and social media data can not be directlyapplied to their existing systems (Reinhold & Alt, 2011). The conclusions of this thesis support BI vendors inthe development of social media components within their product range.
1-11 Project DeliverableThis research will reveal two central questions that describe (i) where and (ii) how firms can derive informationfrom social media data for their decision-making process. Therefore, the project has two deliverables.
Deliverable 1: Where? This deliverable specifies in which contexts a firm can implement social businessintelligence. For reasons explained in section 1-2, it is expected that a firm’s contexts and aspects determine theapplicability of social media data for BI purposes. This deliverable allows organisations to determine whetheror not they are suited for the applicability of social media for business intelligence.
Deliverable 2: How? This deliverable consists of a procedure that prescribes how firms can execute a socialbusiness intelligence system. The procedure can be considered as a document prescribing how an organisationcan execute social business intelligence, and which technical and institutional elements are involved in a socialBI system.
Chapter 2
Conceptual Frame of Research
In this chapter, we define and illustrate what business intelligence (“BI”) is, how BI is applied in firms, whatthe most important elements are and how BI is regarded in this thesis. In a later stadium of this research aprocedure for processing social media data to support business intelligence will be developed. Such a procedureis required to fit in the current method that firms adhere to in executing BI. Therefore, an understanding ofbusiness intelligence within firms is essential. This chapter provides the knowledge of business intelligence thatis required when we develop a procedure to collect and process social media data for BI purposes in a laterstadium.
Section 2-1 starts by a description of the various definitions of BI, and consequently formulates the perspectiveon BI that is adhered to throughout this research. In section 2-2 the elements relating to the determinationof ‘what to measure?’ are discussed, a key activity in business intelligence. Section 2-2 explains the relationbetween a firm’s strategy and the firm’s performance metrics. As we will see, performance metrics take a centralrole in BI. In section 2-3, the processing of data is described. Finally, section 2-4 concludes this chapter by adescription of how business intelligence is applied within firms.
2-1 Business Intelligence PerspectivesBusiness intelligence is a process in which data is translated into information that is required for managerialdecision-making. The literature contains many definitions of business intelligence. Elbashir et al. (2008) statethat “business intelligence systems provide the ability to analyse business information in order to supportand improve managerial decision making across a broad range of business activities”. Van Beek (2006)defines business intelligence as “a continuous process that helps organisations gathering and registering data,analysing it and consequently applying the resulting information and knowledge in decision-making processesto improve organisational performance”. Rouibah and Ould-ali (2002) describe business intelligence as “astrategic approach for systematically targeting, tracking, communicating and transforming relevant weak signsinto actionable information on which strategic decision-making is based”. Lonnqvist and Pirttimaki (2006)define BI as “an organised and systematic process by which organisations acquire, analyse, and disseminateinformation from both internal and external information sources significant for their business activities and fordecision making”. Although these definitions vary slightly from each other, the common aspect is that businessintelligence is perceived as a process that translates data into interpretable information that supports managerialdecision-making.
Van Beek (2006) visualises business intelligence (“BI”) as a cycle, consisting of three main processes (figure 2-1).For the remainder of this thesis, we follow van Beek’s – loosely defined – perspective on business intelligencebecause it captures the various definitions of BI found in the literature. The three main processes – register,process and react – are discussed in the following paragraphs.
Register The BI cycle starts with carefully listening – registering – to the environment. Within theenvironment, a distinction is made between contextual and transactional environments. The contextualenvironment consists of aspects that (may) have an effect on the organisation. The transactional environment
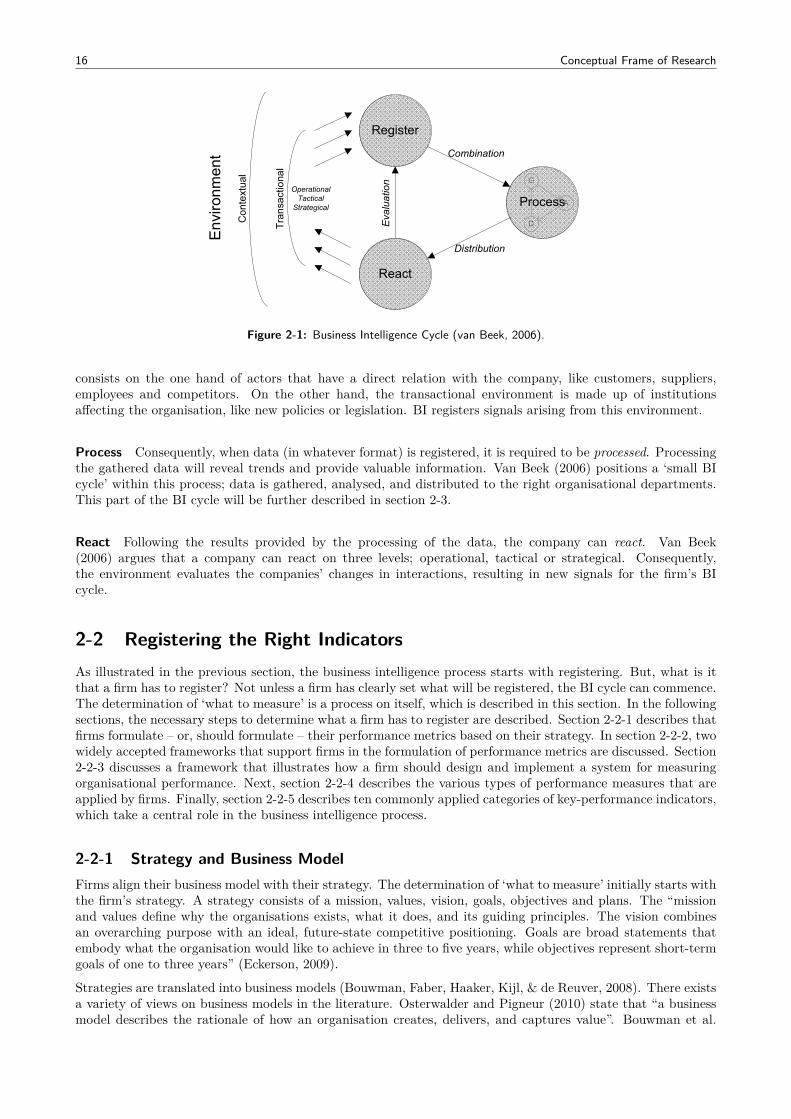
16 Conceptual Frame of Research
G
D
A
Register
React
Process
Combination
Distribution
Evaluation
OperationalTacticalStrategical
Contextual
Transactional
Environment
Figure 2-1: Business Intelligence Cycle (van Beek, 2006).
consists on the one hand of actors that have a direct relation with the company, like customers, suppliers,employees and competitors. On the other hand, the transactional environment is made up of institutionsaffecting the organisation, like new policies or legislation. BI registers signals arising from this environment.
Process Consequently, when data (in whatever format) is registered, it is required to be processed. Processingthe gathered data will reveal trends and provide valuable information. Van Beek (2006) positions a ‘small BIcycle’ within this process; data is gathered, analysed, and distributed to the right organisational departments.This part of the BI cycle will be further described in section 2-3.
React Following the results provided by the processing of the data, the company can react. Van Beek(2006) argues that a company can react on three levels; operational, tactical or strategical. Consequently,the environment evaluates the companies’ changes in interactions, resulting in new signals for the firm’s BIcycle.
2-2 Registering the Right IndicatorsAs illustrated in the previous section, the business intelligence process starts with registering. But, what is itthat a firm has to register? Not unless a firm has clearly set what will be registered, the BI cycle can commence.The determination of ‘what to measure’ is a process on itself, which is described in this section. In the followingsections, the necessary steps to determine what a firm has to register are described. Section 2-2-1 describes thatfirms formulate – or, should formulate – their performance metrics based on their strategy. In section 2-2-2, twowidely accepted frameworks that support firms in the formulation of performance metrics are discussed. Section2-2-3 discusses a framework that illustrates how a firm should design and implement a system for measuringorganisational performance. Next, section 2-2-4 describes the various types of performance measures that areapplied by firms. Finally, section 2-2-5 describes ten commonly applied categories of key-performance indicators,which take a central role in the business intelligence process.
2-2-1 Strategy and Business ModelFirms align their business model with their strategy. The determination of ‘what to measure’ initially starts withthe firm’s strategy. A strategy consists of a mission, values, vision, goals, objectives and plans. The “missionand values define why the organisations exists, what it does, and its guiding principles. The vision combinesan overarching purpose with an ideal, future-state competitive positioning. Goals are broad statements thatembody what the organisation would like to achieve in three to five years, while objectives represent short-termgoals of one to three years” (Eckerson, 2009).
Strategies are translated into business models (Bouwman, Faber, Haaker, Kijl, & de Reuver, 2008). There existsa variety of views on business models in the literature. Osterwalder and Pigneur (2010) state that “a businessmodel describes the rationale of how an organisation creates, delivers, and captures value”. Bouwman et al.
2-2 Registering the Right Indicators 17
(2008) provide an all-embracing definition of a business model for service-oriented organisations by stating that“a business model is a blueprint for a service to be delivered, describing the service definition and the intendedvalue for the target group, the sources of revenue, and providing an architecture for the service delivery, includinga description of the resources required, and the organisational and financial arrangements between the involvedbusiness actors, including a description of their roles and the division of costs and revenues over the businessactors”. In other words, a business model describes what a firm does, why it does that, how it does that, withwhom it does that and for whom it does that.
By aligning the business model with the firm’s strategy, managers question themselves “why are we performingthis activity?”, and “what does it contribute to?”. “It is only through consistency of action that strategiesare realised” (Neely, Gregory, & Platts, 1995). Gates (2001) argues that applying value driver maps toanalyse a company’s vision and drivers of performance helps a company aligning its business model with itsstrategy. By aligning the business model with the strategy, a firm ensures that it performs those activities thatcontribute to the intended strategy. It is in this phase of the BI process where managers determine where inthe organisation and by which activities value is added to the main objective of the organisation, and why andhow the performance of these activities are to be measured. There are many frameworks developed to crafta business model that is based on the firm’s strategy, at which – in the end – performance metrics can beformulated. These frameworks are the topic of the following section.
2-2-2 Frameworks Supporting the Formulation of Performance IndicatorsPerformance measurement is “the process of quantifying the efficiency and effectiveness of action” (Neely et al.,1995). To quantify actions – forming the firm’s business model – indicators are required that represent theseactions. Such indicators are called performance indicators. Performance indicators should be derived from afirm’s strategy (R. S. Kaplan & Norton, 1992, 1993, 1996; Kennerley & Neely, 2003; Tsai & Cheng, 2012;Fortuin, 1988). The previous section revealed that a business models amongst others specifies which activitiesare required to deliver value for the customer of the firm. Hence, the business model prescribes which activitiesare to be executed. The activities are consequently required to be measured, so that managers can determinethe organisation’s performance in accordance with its strategy. These activities are measured by performanceindicators, indicating the performance of the individual activities.
But how do we determine the right performance indicators? One of the first widely recognised frameworks(Neely, Bourne, & Kennerley, 2000) that help managers to decide ‘what to measure’ is the balanced scorecard,developed by R. S. Kaplan and Norton (1992). R. S. Kaplan and Norton (1992) provide a framework thatsupports managers in formulating performance indicators based on four perspectives. Because the balancedscorecard ensures that managers do not only focus on financial figures, it gives managers a “comprehensive viewof the business”, which is required in the competitive environment of the firm (R. S. Kaplan & Norton, 1992).Since the balanced scorecard links a company’s strategy with concrete actions (R. S. Kaplan & Norton, 1996),it is considered as a tool helping managers to align the company’s business model with its strategy. In responseto the balanced scorecard, Neely, Adams, and Crowe (2001) developed a scorecard that adopts a multi-actorview in formulating performance metrics, and hence incorporates the perceptions of multiple stakeholders intothe performance metrics formulation process. Both frameworks are discussed in the following sections.
The Balanced Scorecard
Because “you get what you measure” (Kennerley & Neely, 2003), R. S. Kaplan and Norton (1992) advocatethat a firm should measure those metrics that contribute to the firm’s strategy. In addition, R. S. Kaplanand Norton (1992) argue that managers should not only focus on financial figures, but also on other areasrepresenting organisational performance. Therefore, R. S. Kaplan and Norton (1992) developed the “balancedscorecard”. The balanced scorecard is not without reason called a ‘balanced’ scorecard. In essence, it stimulatesmanagers to not only think in financial figures when measuring organisational performance, but also on otherareas. The framework distinguishes organisational activities in the (i) customer-, (ii) internal business-, (iii)innovation and learning-, and (iv) financial perspective, which are discussed below:
• The customer perspective describes how customers view the firm, and ensures that customer’s needs arefulfilled. R. S. Kaplan and Norton (1992) further categorise the customer’s concerns into time, quality,performance and service, and cost. Hence, when a manager adopts the customer perspective in formulatingperformance metrics, he or she will formulate performance metrics that involve these categories.
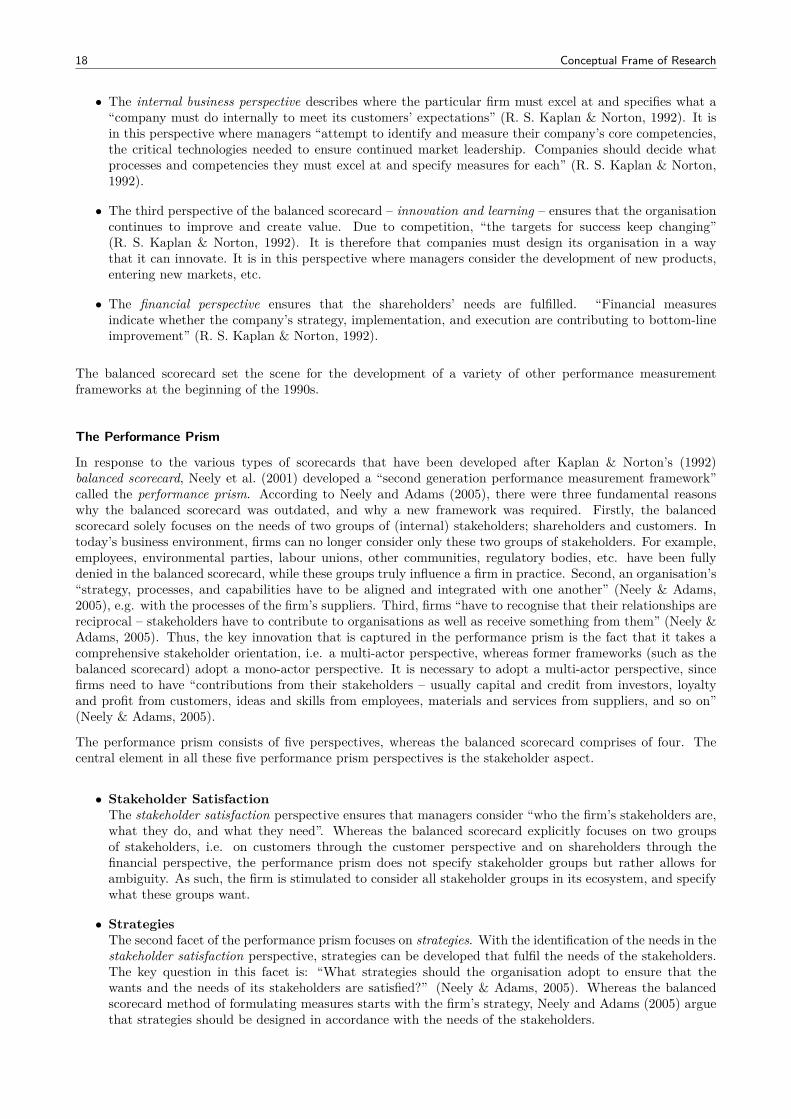
18 Conceptual Frame of Research
• The internal business perspective describes where the particular firm must excel at and specifies what a“company must do internally to meet its customers’ expectations” (R. S. Kaplan & Norton, 1992). It isin this perspective where managers “attempt to identify and measure their company’s core competencies,the critical technologies needed to ensure continued market leadership. Companies should decide whatprocesses and competencies they must excel at and specify measures for each” (R. S. Kaplan & Norton,1992).
• The third perspective of the balanced scorecard – innovation and learning – ensures that the organisationcontinues to improve and create value. Due to competition, “the targets for success keep changing”(R. S. Kaplan & Norton, 1992). It is therefore that companies must design its organisation in a waythat it can innovate. It is in this perspective where managers consider the development of new products,entering new markets, etc.
• The financial perspective ensures that the shareholders’ needs are fulfilled. “Financial measuresindicate whether the company’s strategy, implementation, and execution are contributing to bottom-lineimprovement” (R. S. Kaplan & Norton, 1992).
The balanced scorecard set the scene for the development of a variety of other performance measurementframeworks at the beginning of the 1990s.
The Performance Prism
In response to the various types of scorecards that have been developed after Kaplan & Norton’s (1992)balanced scorecard, Neely et al. (2001) developed a “second generation performance measurement framework”called the performance prism. According to Neely and Adams (2005), there were three fundamental reasonswhy the balanced scorecard was outdated, and why a new framework was required. Firstly, the balancedscorecard solely focuses on the needs of two groups of (internal) stakeholders; shareholders and customers. Intoday’s business environment, firms can no longer consider only these two groups of stakeholders. For example,employees, environmental parties, labour unions, other communities, regulatory bodies, etc. have been fullydenied in the balanced scorecard, while these groups truly influence a firm in practice. Second, an organisation’s“strategy, processes, and capabilities have to be aligned and integrated with one another” (Neely & Adams,2005), e.g. with the processes of the firm’s suppliers. Third, firms “have to recognise that their relationships arereciprocal – stakeholders have to contribute to organisations as well as receive something from them” (Neely &Adams, 2005). Thus, the key innovation that is captured in the performance prism is the fact that it takes acomprehensive stakeholder orientation, i.e. a multi-actor perspective, whereas former frameworks (such as thebalanced scorecard) adopt a mono-actor perspective. It is necessary to adopt a multi-actor perspective, sincefirms need to have “contributions from their stakeholders – usually capital and credit from investors, loyaltyand profit from customers, ideas and skills from employees, materials and services from suppliers, and so on”(Neely & Adams, 2005).
The performance prism consists of five perspectives, whereas the balanced scorecard comprises of four. Thecentral element in all these five performance prism perspectives is the stakeholder aspect.
• Stakeholder SatisfactionThe stakeholder satisfaction perspective ensures that managers consider “who the firm’s stakeholders are,what they do, and what they need”. Whereas the balanced scorecard explicitly focuses on two groupsof stakeholders, i.e. on customers through the customer perspective and on shareholders through thefinancial perspective, the performance prism does not specify stakeholder groups but rather allows forambiguity. As such, the firm is stimulated to consider all stakeholder groups in its ecosystem, and specifywhat these groups want.
• StrategiesThe second facet of the performance prism focuses on strategies. With the identification of the needs in thestakeholder satisfaction perspective, strategies can be developed that fulfil the needs of the stakeholders.The key question in this facet is: “What strategies should the organisation adopt to ensure that thewants and the needs of its stakeholders are satisfied?” (Neely & Adams, 2005). Whereas the balancedscorecard method of formulating measures starts with the firm’s strategy, Neely and Adams (2005) arguethat strategies should be designed in accordance with the needs of the stakeholders.
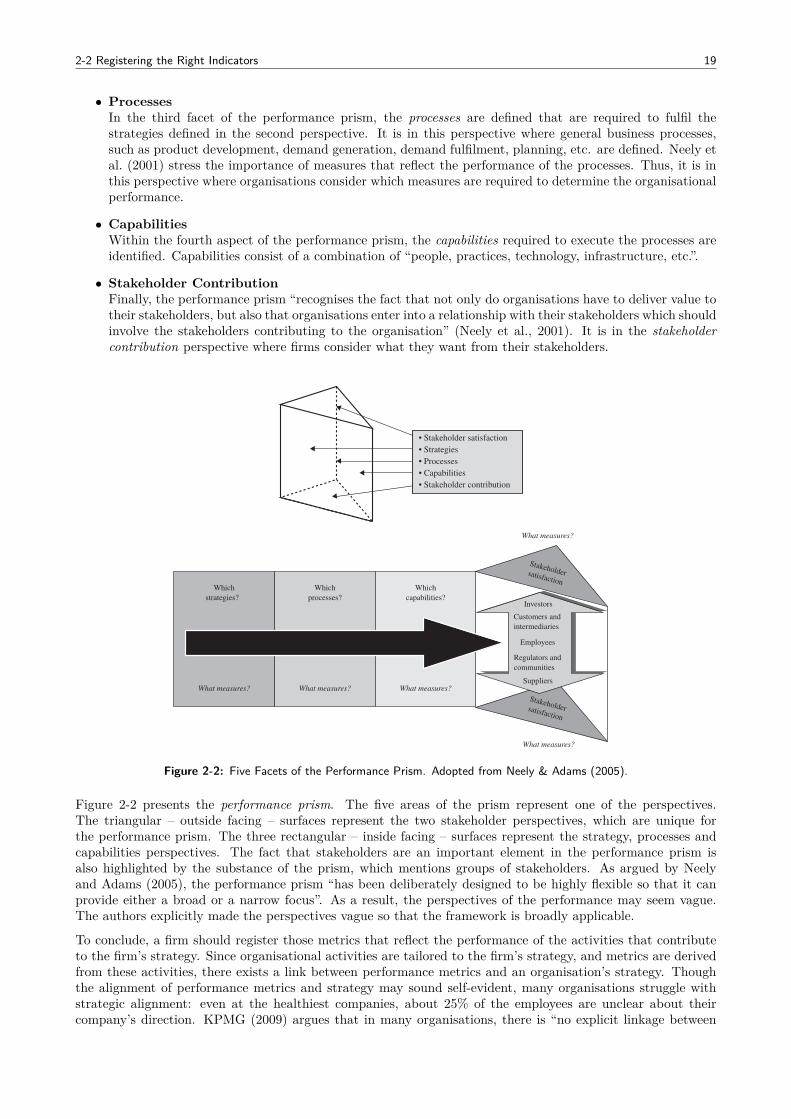
2-2 Registering the Right Indicators 19
• ProcessesIn the third facet of the performance prism, the processes are defined that are required to fulfil thestrategies defined in the second perspective. It is in this perspective where general business processes,such as product development, demand generation, demand fulfilment, planning, etc. are defined. Neely etal. (2001) stress the importance of measures that reflect the performance of the processes. Thus, it is inthis perspective where organisations consider which measures are required to determine the organisationalperformance.
• CapabilitiesWithin the fourth aspect of the performance prism, the capabilities required to execute the processes areidentified. Capabilities consist of a combination of “people, practices, technology, infrastructure, etc.”.
• Stakeholder ContributionFinally, the performance prism “recognises the fact that not only do organisations have to deliver value totheir stakeholders, but also that organisations enter into a relationship with their stakeholders which shouldinvolve the stakeholders contributing to the organisation” (Neely et al., 2001). It is in the stakeholdercontribution perspective where firms consider what they want from their stakeholders.
5. Capabilities: What capabilities do we need to putin place to allow us to operate our processes?
Together, these five perspectives provide a comprehen-sive and integrated framework for thinking about organi-zational performance in today’s operating environment(see Fig. 1).
The performance prism also seeks to address the short-comings of the first-generation measurement frameworksand methodologies, such as the balanced scorecard,the work on shareholder value, and the various self-assessment frameworks, such as the Malcolm BaldrigeAward criteria and the business excellence model ofthe European Foundation for Quality Management(EFQM).
The Nature of the MeasurementProblem
Why is this new performance measurement frameworkneeded? After all, everyone knows that ‘‘you can’t managewhat you don’t measure.’’ And given that people havebeen managing organizations for years, then surely bynow they must have perfected their measurementsystems.
Sadly, as in somanywalks of life, theory does not reflectpractice. The number of organizations with weak perfor-mance measures and measurement systems in place isimmense. Examples abound of organizations that haveintroduced performance measures that quite simplydrive entirely the wrong behaviors. There must bea better way.
There has been a revolution in performance measure-ment and management during the last few years. Variousframeworks and methodologies—such as the balancedscorecard, shareholder value added, activity-based cost-ing, cost of quality, and competitive benchmarking—haveeach generated vast interest, activity, and consulting rev-enues, but not always success. Yet therein lies a paradox.
It might reasonably be asked: how can multiple, andseemingly inconsistent, business performance frame-works and measurement methodologies exist? Eachclaims to be unique and comprehensive, yet each offersa different perspective on performance.
Kaplan and Norton’s balanced scorecard, with its fourperspectives, focuses on financials (shareholders), cus-tomers, internal processes, plus innovation and learning.In doing so, it downplays the importance of other stake-holders, such as employees, suppliers, regulators, andcommunities. The business excellence model combinesresults, which are readilymeasurable, with enablers, someof which are not. Shareholder value frameworks incorpo-rate the cost of capital into the equation, but ignore ev-erything (and everyone) else. Both the activity-basedcosting and the cost of quality frameworks, on theother hand, focus on the identification and control ofcost drivers (non-value-adding activities and failures/non-conformances, respectively), which are themselvesoften embedded in the business processes. But this highlyprocess-focused view ignores any other perspectives onperformance, such as the opinions of investors, custom-ers, and employees. Conversely, benchmarking tends toinvolve taking a largely external perspective, often com-paring performance with that of competitors or some-times other ‘‘best practitioners’’ of business processesor capabilities. However, this kind of activity is frequentlypursued as a one-off exercise toward generating ideasfor—or gaining commitment to—short-term improve-ment initiatives, rather than the design of a formalizedongoing performance measurement system.
How can this be? How can multiple, seeminglyconflicting, measurement frameworks andmethodologiesexist? The answer is simple: they can exist because they alladd value. They all provide unique perspectives on per-formance. They all furnishmanagerswith a different set oflenses through which they can assess the performance oftheir organizations. The key is to recognize that, despitethe claims of some of the proponents of these variousapproaches, there is no one best way to address the mea-surement andmanagement of business performance. Thereason for this is that business performance is itselfa multifaceted concept, the complexity of which the ex-isting frameworks only partially address. Essentially, theyprovide valuable point solutions.
A Better Solution to theMeasurement Problem
Our solution is the three-dimensional framework that wecall the performance prism. This framework has beendeliberately designed to be highly flexible so that it canprovide either a broad or a narrow focus. If only a partial
• Stakeholder satisfaction• Strategies• Processes• Capabilities• Stakeholder contribution
Figure 1
42 Performance Prism
aspect of performance management is required, such asa single stakeholder focus or a particular business processagenda, then the performance prism can be applied todesigning a measurement system and appropriate mea-sures (and their attendant metrics) that address that con-text. Conversely, if a broad corporate or business unitperformance management improvement initiative is re-quired, the performance prism is equally capable of sup-porting that, too. How does it help to achieve these aims?
The performance prism has five perspectives. The topand bottom perspectives are stakeholder satisfaction andstakeholder contribution. The three side perspectives arethe organization’s strategies, processes, and capabilitiesfor addressing those sets of wants and needs. Figure 2illustrates these five basic perspectives of performancemeasurement and management.
Why does the framework look like this and why does itconsist of these constituent components? It is clear thatthose organizations aspiring to be successful in the longtermwithin today’s business environment need to have anexceptionally clear picture of who their key stakeholdersare andwhat they want or need. But having a clear pictureis not enough. In order to satisfy their own wants andneeds, organizations have to access contributions fromtheir stakeholders—usually capital and credit frominvestors, loyalty and profit from customers, ideas andskills from employees, materials and services from sup-pliers, and so on. They also need to have defined whatstrategies they will pursue to ensure that value is deliveredto their stakeholders. In order to implement these strat-egies, they have to understand what processes the enter-prise requires and must operate both effectively andefficiently. Processes, in themselves, can only be executed
if the organization has the right capabilities in place—theright combination of people skill sets, best practices, lead-ing technologies, and physical infrastructure.
In essence, then, the performance prism providesa comprehensive yet easily comprehensible frameworkthat can be used to articulate a given business’s operatingmodel. Its components are described in the followingsections.
Stakeholder Satisfaction
Where should the measurement design process begin?One of the great myths (or fallacies) of measurementdesign is that performance measures should be derivedfrom strategy. Listen to any conference speaker on thesubject. Read anymanagement text written about it. Ninetimes out of ten the statement ‘‘Derive your measuresfrom your strategy’’ will be made. This is such a concep-tually appealing notion that nobody stops to question it.Yet to derive measures from strategy is to misunderstandfundamentally the purpose of measurement and the roleof strategy. Performance measures are designed to helppeople track whether they are moving in the intendeddirection. They help managers establish whether theyare going to reach the destination they set out to reach.Strategy, however, is not about destination. Instead, it isabout the route that is chosen—how to reach the desireddestination.
At one level, this is a semantic argument. Indeed,the original work on strategy, carried out in the 1970sby Andrews, Ansoff, and Mintzberg, asserted thata strategy should explain both the goals of the organizationand a plan of action to achieve these goals. Today,
Stakeholder satisfaction
Investors
Customers &Intermediaries
Employees
Regulators &Communities
SuppliersWhat measures? What measures? What measures?
What measures?
Investors
Customers &Intermediaries
Employees
Regulators &Communities
Suppliers
Investors
Customers and intermediaries
Employees
Regulators andcommunities
Suppliers
Which strategies?
What measures? What measures? What measures?
Which processes?
Which capabilities?
What measures?
What measures?
Stakeholder satisfaction
Figure 2
Performance Prism 43
Figure 2-2: Five Facets of the Performance Prism. Adopted from Neely & Adams (2005).
Figure 2-2 presents the performance prism. The five areas of the prism represent one of the perspectives.The triangular – outside facing – surfaces represent the two stakeholder perspectives, which are unique forthe performance prism. The three rectangular – inside facing – surfaces represent the strategy, processes andcapabilities perspectives. The fact that stakeholders are an important element in the performance prism isalso highlighted by the substance of the prism, which mentions groups of stakeholders. As argued by Neelyand Adams (2005), the performance prism “has been deliberately designed to be highly flexible so that it canprovide either a broad or a narrow focus”. As a result, the perspectives of the performance may seem vague.The authors explicitly made the perspectives vague so that the framework is broadly applicable.
To conclude, a firm should register those metrics that reflect the performance of the activities that contributeto the firm’s strategy. Since organisational activities are tailored to the firm’s strategy, and metrics are derivedfrom these activities, there exists a link between performance metrics and an organisation’s strategy. Thoughthe alignment of performance metrics and strategy may sound self-evident, many organisations struggle withstrategic alignment: even at the healthiest companies, about 25% of the employees are unclear about theircompany’s direction. KPMG (2009) argues that in many organisations, there is “no explicit linkage between
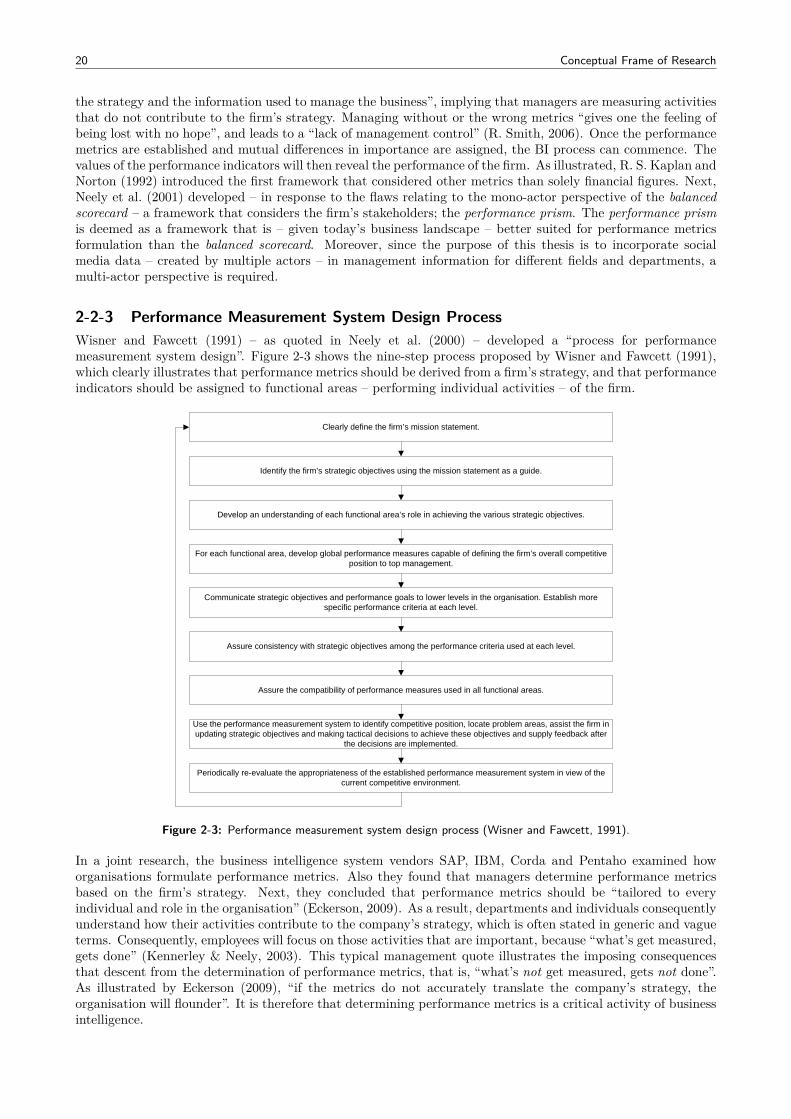
20 Conceptual Frame of Research
the strategy and the information used to manage the business”, implying that managers are measuring activitiesthat do not contribute to the firm’s strategy. Managing without or the wrong metrics “gives one the feeling ofbeing lost with no hope”, and leads to a “lack of management control” (R. Smith, 2006). Once the performancemetrics are established and mutual differences in importance are assigned, the BI process can commence. Thevalues of the performance indicators will then reveal the performance of the firm. As illustrated, R. S. Kaplan andNorton (1992) introduced the first framework that considered other metrics than solely financial figures. Next,Neely et al. (2001) developed – in response to the flaws relating to the mono-actor perspective of the balancedscorecard – a framework that considers the firm’s stakeholders; the performance prism. The performance prismis deemed as a framework that is – given today’s business landscape – better suited for performance metricsformulation than the balanced scorecard. Moreover, since the purpose of this thesis is to incorporate socialmedia data – created by multiple actors – in management information for different fields and departments, amulti-actor perspective is required.
2-2-3 Performance Measurement System Design ProcessWisner and Fawcett (1991) – as quoted in Neely et al. (2000) – developed a “process for performancemeasurement system design”. Figure 2-3 shows the nine-step process proposed by Wisner and Fawcett (1991),which clearly illustrates that performance metrics should be derived from a firm’s strategy, and that performanceindicators should be assigned to functional areas – performing individual activities – of the firm.
Clearly define the firm’s mission statement.
Identify the firm’s strategic objectives using the mission statement as a guide.
Develop an understanding of each functional area’s role in achieving the various strategic objectives.
For each functional area, develop global performance measures capable of defining the firm’s overall competitive position to top management.
Communicate strategic objectives and performance goals to lower levels in the organisation. Establish more specific performance criteria at each level.
Assure consistency with strategic objectives among the performance criteria used at each level.
Assure the compatibility of performance measures used in all functional areas.
Use the performance measurement system to identify competitive position, locate problem areas, assist the firm in updating strategic objectives and making tactical decisions to achieve these objectives and supply feedback after
the decisions are implemented.
Periodically re-evaluate the appropriateness of the established performance measurement system in view of the current competitive environment.
Figure 2-3: Performance measurement system design process (Wisner and Fawcett, 1991).
In a joint research, the business intelligence system vendors SAP, IBM, Corda and Pentaho examined howorganisations formulate performance metrics. Also they found that managers determine performance metricsbased on the firm’s strategy. Next, they concluded that performance metrics should be “tailored to everyindividual and role in the organisation” (Eckerson, 2009). As a result, departments and individuals consequentlyunderstand how their activities contribute to the company’s strategy, which is often stated in generic and vagueterms. Consequently, employees will focus on those activities that are important, because “what’s get measured,gets done” (Kennerley & Neely, 2003). This typical management quote illustrates the imposing consequencesthat descent from the determination of performance metrics, that is, “what’s not get measured, gets not done”.As illustrated by Eckerson (2009), “if the metrics do not accurately translate the company’s strategy, theorganisation will flounder”. It is therefore that determining performance metrics is a critical activity of businessintelligence.
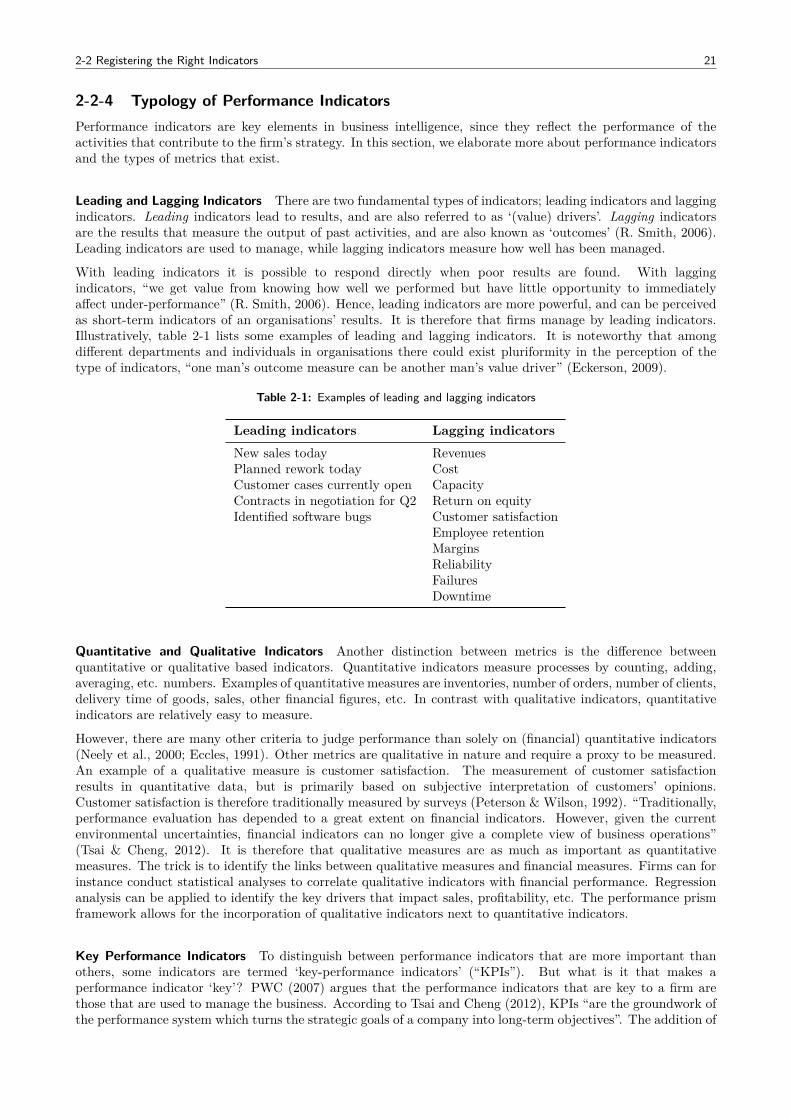
2-2 Registering the Right Indicators 21
2-2-4 Typology of Performance IndicatorsPerformance indicators are key elements in business intelligence, since they reflect the performance of theactivities that contribute to the firm’s strategy. In this section, we elaborate more about performance indicatorsand the types of metrics that exist.
Leading and Lagging Indicators There are two fundamental types of indicators; leading indicators and laggingindicators. Leading indicators lead to results, and are also referred to as ‘(value) drivers’. Lagging indicatorsare the results that measure the output of past activities, and are also known as ‘outcomes’ (R. Smith, 2006).Leading indicators are used to manage, while lagging indicators measure how well has been managed.
With leading indicators it is possible to respond directly when poor results are found. With laggingindicators, “we get value from knowing how well we performed but have little opportunity to immediatelyaffect under-performance” (R. Smith, 2006). Hence, leading indicators are more powerful, and can be perceivedas short-term indicators of an organisations’ results. It is therefore that firms manage by leading indicators.Illustratively, table 2-1 lists some examples of leading and lagging indicators. It is noteworthy that amongdifferent departments and individuals in organisations there could exist pluriformity in the perception of thetype of indicators, “one man’s outcome measure can be another man’s value driver” (Eckerson, 2009).
Table 2-1: Examples of leading and lagging indicators
Leading indicators Lagging indicatorsNew sales today RevenuesPlanned rework today CostCustomer cases currently open CapacityContracts in negotiation for Q2 Return on equityIdentified software bugs Customer satisfaction
Employee retentionMarginsReliabilityFailuresDowntime
Quantitative and Qualitative Indicators Another distinction between metrics is the difference betweenquantitative or qualitative based indicators. Quantitative indicators measure processes by counting, adding,averaging, etc. numbers. Examples of quantitative measures are inventories, number of orders, number of clients,delivery time of goods, sales, other financial figures, etc. In contrast with qualitative indicators, quantitativeindicators are relatively easy to measure.
However, there are many other criteria to judge performance than solely on (financial) quantitative indicators(Neely et al., 2000; Eccles, 1991). Other metrics are qualitative in nature and require a proxy to be measured.An example of a qualitative measure is customer satisfaction. The measurement of customer satisfactionresults in quantitative data, but is primarily based on subjective interpretation of customers’ opinions.Customer satisfaction is therefore traditionally measured by surveys (Peterson & Wilson, 1992). “Traditionally,performance evaluation has depended to a great extent on financial indicators. However, given the currentenvironmental uncertainties, financial indicators can no longer give a complete view of business operations”(Tsai & Cheng, 2012). It is therefore that qualitative measures are as much as important as quantitativemeasures. The trick is to identify the links between qualitative measures and financial measures. Firms can forinstance conduct statistical analyses to correlate qualitative indicators with financial performance. Regressionanalysis can be applied to identify the key drivers that impact sales, profitability, etc. The performance prismframework allows for the incorporation of qualitative indicators next to quantitative indicators.
Key Performance Indicators To distinguish between performance indicators that are more important thanothers, some indicators are termed ‘key-performance indicators’ (“KPIs”). But what is it that makes aperformance indicator ‘key’? PWC (2007) argues that the performance indicators that are key to a firm arethose that are used to manage the business. According to Tsai and Cheng (2012), KPIs “are the groundwork ofthe performance system which turns the strategic goals of a company into long-term objectives”. The addition of
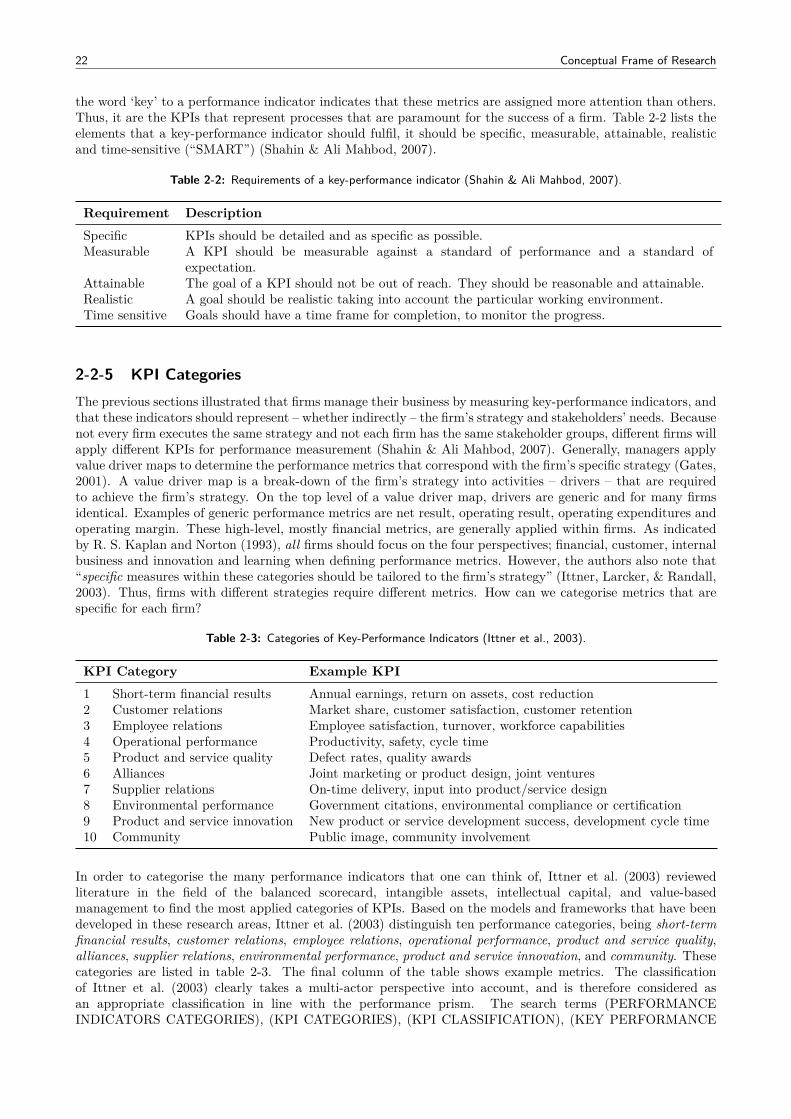
22 Conceptual Frame of Research
the word ‘key’ to a performance indicator indicates that these metrics are assigned more attention than others.Thus, it are the KPIs that represent processes that are paramount for the success of a firm. Table 2-2 lists theelements that a key-performance indicator should fulfil, it should be specific, measurable, attainable, realisticand time-sensitive (“SMART”) (Shahin & Ali Mahbod, 2007).
Table 2-2: Requirements of a key-performance indicator (Shahin & Ali Mahbod, 2007).
Requirement DescriptionSpecific KPIs should be detailed and as specific as possible.Measurable A KPI should be measurable against a standard of performance and a standard of
expectation.Attainable The goal of a KPI should not be out of reach. They should be reasonable and attainable.Realistic A goal should be realistic taking into account the particular working environment.Time sensitive Goals should have a time frame for completion, to monitor the progress.
2-2-5 KPI CategoriesThe previous sections illustrated that firms manage their business by measuring key-performance indicators, andthat these indicators should represent – whether indirectly – the firm’s strategy and stakeholders’ needs. Becausenot every firm executes the same strategy and not each firm has the same stakeholder groups, different firms willapply different KPIs for performance measurement (Shahin & Ali Mahbod, 2007). Generally, managers applyvalue driver maps to determine the performance metrics that correspond with the firm’s specific strategy (Gates,2001). A value driver map is a break-down of the firm’s strategy into activities – drivers – that are requiredto achieve the firm’s strategy. On the top level of a value driver map, drivers are generic and for many firmsidentical. Examples of generic performance metrics are net result, operating result, operating expenditures andoperating margin. These high-level, mostly financial metrics, are generally applied within firms. As indicatedby R. S. Kaplan and Norton (1993), all firms should focus on the four perspectives; financial, customer, internalbusiness and innovation and learning when defining performance metrics. However, the authors also note that“specific measures within these categories should be tailored to the firm’s strategy” (Ittner, Larcker, & Randall,2003). Thus, firms with different strategies require different metrics. How can we categorise metrics that arespecific for each firm?
Table 2-3: Categories of Key-Performance Indicators (Ittner et al., 2003).
KPI Category Example KPI1 Short-term financial results Annual earnings, return on assets, cost reduction2 Customer relations Market share, customer satisfaction, customer retention3 Employee relations Employee satisfaction, turnover, workforce capabilities4 Operational performance Productivity, safety, cycle time5 Product and service quality Defect rates, quality awards6 Alliances Joint marketing or product design, joint ventures7 Supplier relations On-time delivery, input into product/service design8 Environmental performance Government citations, environmental compliance or certification9 Product and service innovation New product or service development success, development cycle time10 Community Public image, community involvement
In order to categorise the many performance indicators that one can think of, Ittner et al. (2003) reviewedliterature in the field of the balanced scorecard, intangible assets, intellectual capital, and value-basedmanagement to find the most applied categories of KPIs. Based on the models and frameworks that have beendeveloped in these research areas, Ittner et al. (2003) distinguish ten performance categories, being short-termfinancial results, customer relations, employee relations, operational performance, product and service quality,alliances, supplier relations, environmental performance, product and service innovation, and community. Thesecategories are listed in table 2-3. The final column of the table shows example metrics. The classificationof Ittner et al. (2003) clearly takes a multi-actor perspective into account, and is therefore considered asan appropriate classification in line with the performance prism. The search terms (PERFORMANCEINDICATORS CATEGORIES), (KPI CATEGORIES), (KPI CLASSIFICATION), (KEY PERFORMANCE
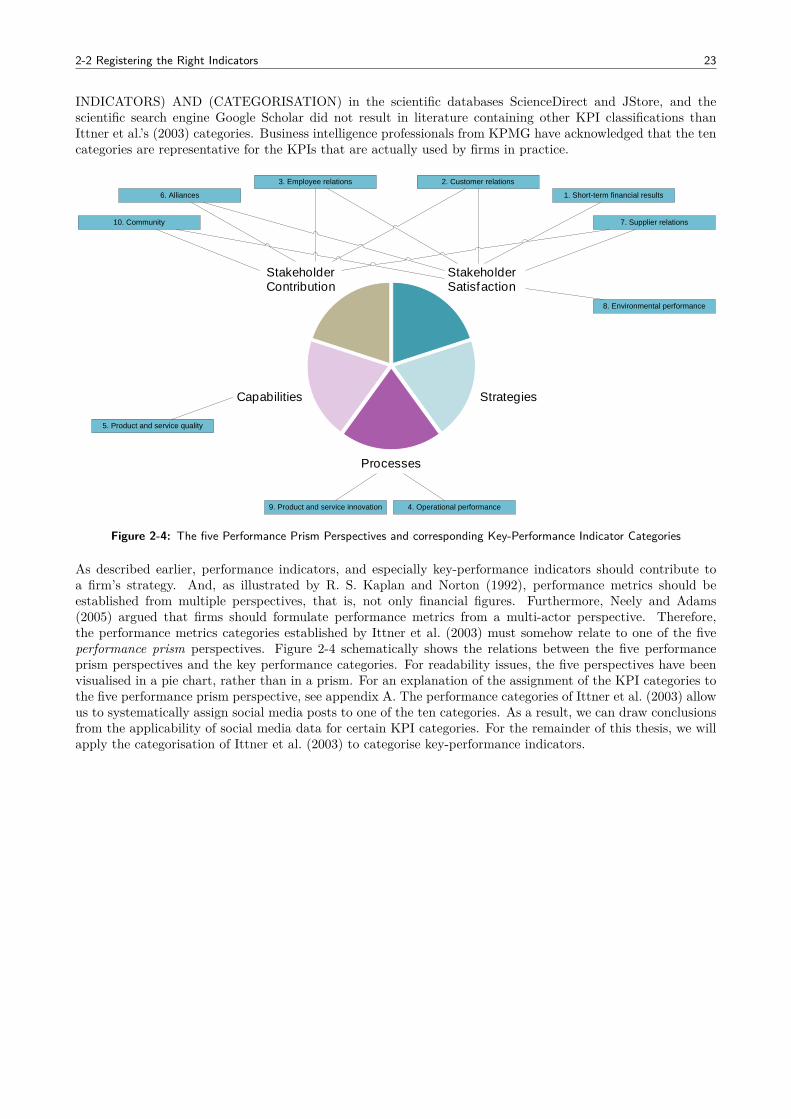
2-2 Registering the Right Indicators 23
INDICATORS) AND (CATEGORISATION) in the scientific databases ScienceDirect and JStore, and thescientific search engine Google Scholar did not result in literature containing other KPI classifications thanIttner et al.’s (2003) categories. Business intelligence professionals from KPMG have acknowledged that the tencategories are representative for the KPIs that are actually used by firms in practice.
Stakeholder Satisfaction
Strategies
Processes
Capabilities
Stakeholder Contribution
1. Short-term financial results
2. Customer relations3. Employee relations
4. Operational performance
5. Product and service quality
6. Alliances
7. Supplier relations
8. Environmental performance
9. Product and service innovation
10. Community
Figure 2-4: The five Performance Prism Perspectives and corresponding Key-Performance Indicator Categories
As described earlier, performance indicators, and especially key-performance indicators should contribute toa firm’s strategy. And, as illustrated by R. S. Kaplan and Norton (1992), performance metrics should beestablished from multiple perspectives, that is, not only financial figures. Furthermore, Neely and Adams(2005) argued that firms should formulate performance metrics from a multi-actor perspective. Therefore,the performance metrics categories established by Ittner et al. (2003) must somehow relate to one of the fiveperformance prism perspectives. Figure 2-4 schematically shows the relations between the five performanceprism perspectives and the key performance categories. For readability issues, the five perspectives have beenvisualised in a pie chart, rather than in a prism. For an explanation of the assignment of the KPI categories tothe five performance prism perspective, see appendix A. The performance categories of Ittner et al. (2003) allowus to systematically assign social media posts to one of the ten categories. As a result, we can draw conclusionsfrom the applicability of social media data for certain KPI categories. For the remainder of this thesis, we willapply the categorisation of Ittner et al. (2003) to categorise key-performance indicators.
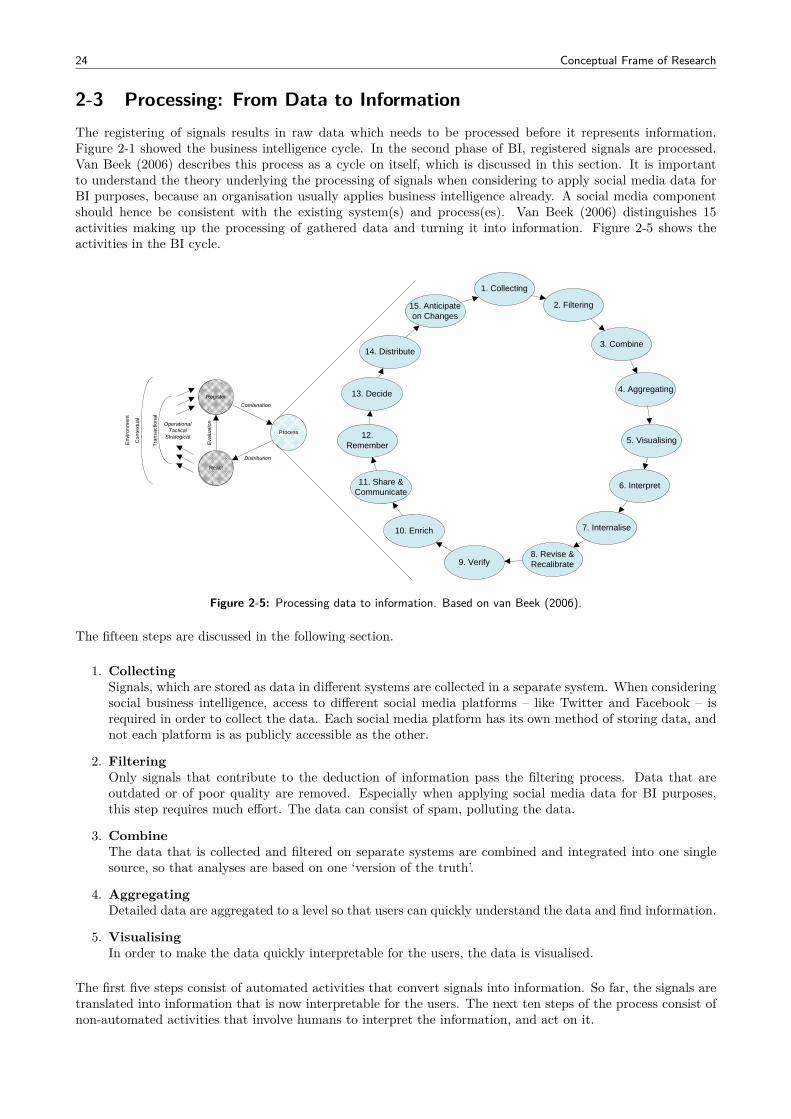
24 Conceptual Frame of Research
2-3 Processing: From Data to InformationThe registering of signals results in raw data which needs to be processed before it represents information.Figure 2-1 showed the business intelligence cycle. In the second phase of BI, registered signals are processed.Van Beek (2006) describes this process as a cycle on itself, which is discussed in this section. It is importantto understand the theory underlying the processing of signals when considering to apply social media data forBI purposes, because an organisation usually applies business intelligence already. A social media componentshould hence be consistent with the existing system(s) and process(es). Van Beek (2006) distinguishes 15activities making up the processing of gathered data and turning it into information. Figure 2-5 shows theactivities in the BI cycle.
Register
React
Process
Combination
Distribution
Eva
lua
tionOperational
TacticalStrategical
Con
text
ual
Tra
nsac
tiona
l
Env
iron
men
t
1. Collecting
2. Filtering
3. Combine
4. Aggregating
5. Visualising
6. Interpret
7. Internalise
8. Revise & Recalibrate9. Verify
10. Enrich
11. Share & Communicate
12. Remember
13. Decide
14. Distribute
15. Anticipate on Changes
Figure 2-5: Processing data to information. Based on van Beek (2006).
The fifteen steps are discussed in the following section.
1. CollectingSignals, which are stored as data in different systems are collected in a separate system. When consideringsocial business intelligence, access to different social media platforms – like Twitter and Facebook – isrequired in order to collect the data. Each social media platform has its own method of storing data, andnot each platform is as publicly accessible as the other.
2. FilteringOnly signals that contribute to the deduction of information pass the filtering process. Data that areoutdated or of poor quality are removed. Especially when applying social media data for BI purposes,this step requires much effort. The data can consist of spam, polluting the data.
3. CombineThe data that is collected and filtered on separate systems are combined and integrated into one singlesource, so that analyses are based on one ‘version of the truth’.
4. AggregatingDetailed data are aggregated to a level so that users can quickly understand the data and find information.
5. VisualisingIn order to make the data quickly interpretable for the users, the data is visualised.
The first five steps consist of automated activities that convert signals into information. So far, the signals aretranslated into information that is now interpretable for the users. The next ten steps of the process consist ofnon-automated activities that involve humans to interpret the information, and act on it.
2-4 Sub Conclusion: How Business Intelligence is Applied 25
6. InterpretingThe information generated by the first five steps are interpreted by humans. For example, the automatedprocess generated a graph showing the amount of sales in a given region over a given time span. Themeaning of the graph is interpreted by the user.
7. InternaliseIn this step, the information derived from the interpreting step is combined with other information in theproblem’s context. It is in this step that the real underlying trends and explanatory factors are analysedso that the information is embedded in one’s cognitive understanding of the system.
8. Revise & RecalibrateThe new information may affect existing information. This step ensures that existing information isrevised and adjusted based on the new information.
9. VerifyThis step verifies the new information with other mechanisms. For example, a decrease in market shareis compared with the companies’ turnover development. Whenever turnover increases while market sharedecreases, it may indicate an increase of the overall market. If such mechanisms contradict, the processof turning the data into information has to be checked for errors.
10. EnrichIn this step, the information – graphs, figures, numbers, etc. – are enriched by textual explanation of theinformation. A decrease in market share, which is visible in e.g. a pie chart, may be enriched by a textualexplanation of two new competitors on the market.
11. Share & CommunicateBy sharing and communicating about the information with other members of the organisation, theinformation is brought under submission of various perceptions and views.
12. RememberSome information do not require immediate action. However, the information may be relevant wheneverfuture information is acquired. It is therefore important that the information is remembered.
13. DecideThis step involves the reaction on the information. Managers decide how they act on the information, forinstance by launching an advertisement campaign, or to sell a part of the organisation.
14. DistributeThe decision in the previous step is generally taken by managers on higher levels of the organisation. Thenew information and decisions following from that information are distributed to the right persons in theorganisation in this step.
15. Anticipate on ChangesThe new information may be of a negative character, requiring (structural) organisational change. Anorganisation should adopt a positive attitude to change according to the new information.
These fifteen steps describe how a signal is generally translated into information at which managers can act.When an organisation intends to implement a (sub) system that extracts signals from social media platformsto derive information, it should be designed according to this method of processing signals.
2-4 Sub Conclusion: How Business Intelligence is AppliedWith the rise of a new data source – social media platforms – for firms to access customer perceptions, thequestion rises how a firm should process these data. The process should in any case correspond with existingbusiness intelligence processes in firms. Therefore, it is essential to understand the general business intelligenceprocess that firms adhere to. This chapter reviewed literature in the field of business intelligence, of which theconclusions are presented in this section.
Though there exist many views on business intelligence, the common aspect is that BI collects and translatesdata into information that supports managerial decision-making. BI can be regarded as a process of threesteps; registering data, processing the data into information and reacting on the conclusions derived from
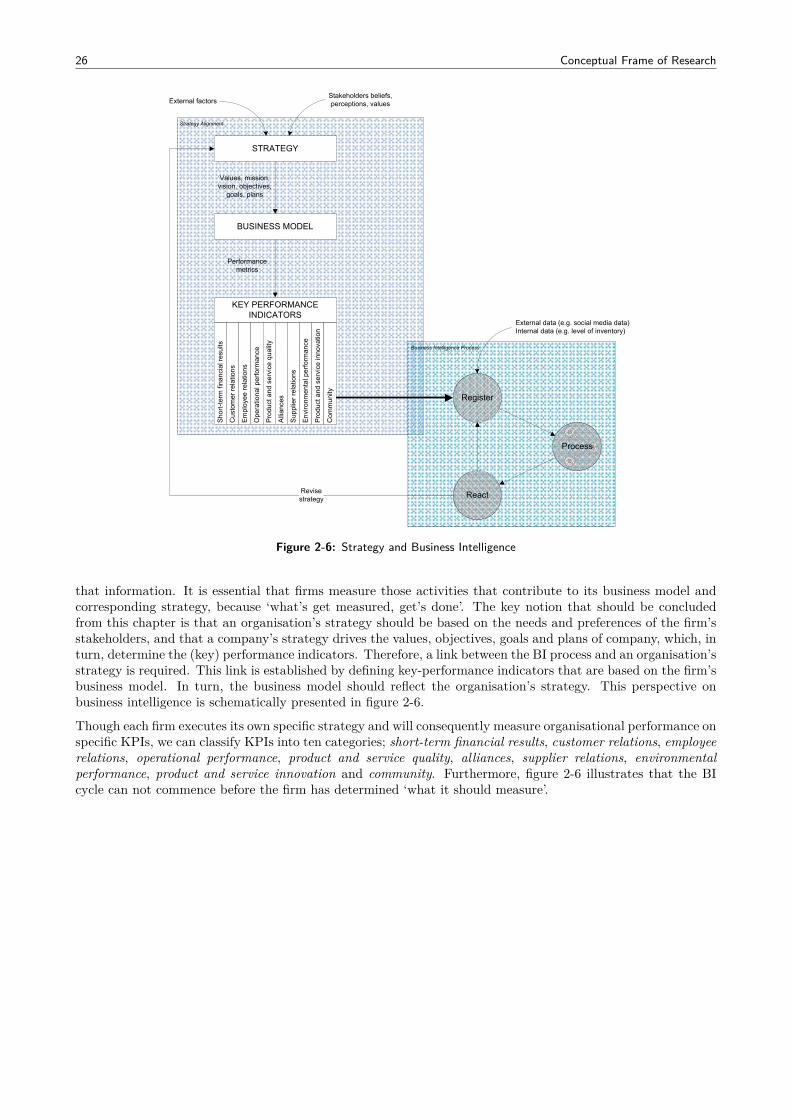
26 Conceptual Frame of Research
G
D
A
Register
React
Process
STRATEGY
BUSINESS MODEL
KEY PERFORMANCE INDICATORS
Values, mission, vision, objectives,
goals, plans
Performance metrics
Revisestrategy
External data (e.g. social media data)Internal data (e.g. level of inventory)
Stakeholders beliefs, perceptions, valuesExternal factors
Business Intelligence Process
Strategy Alignment
Shor
t-ter
m fi
nanc
ial r
esul
ts
Cus
tom
er re
latio
ns
Empl
oyee
rela
tions
Ope
ratio
nal p
erfo
rman
ce
Prod
uct a
nd s
ervi
ce q
ualit
y
Alli
ance
s
Sup
plie
r rel
atio
ns
Envi
ronm
enta
l per
form
ance
Prod
uct a
nd s
ervi
ce in
nova
tion
Com
mun
ity
Figure 2-6: Strategy and Business Intelligence
that information. It is essential that firms measure those activities that contribute to its business model andcorresponding strategy, because ‘what’s get measured, get’s done’. The key notion that should be concludedfrom this chapter is that an organisation’s strategy should be based on the needs and preferences of the firm’sstakeholders, and that a company’s strategy drives the values, objectives, goals and plans of company, which, inturn, determine the (key) performance indicators. Therefore, a link between the BI process and an organisation’sstrategy is required. This link is established by defining key-performance indicators that are based on the firm’sbusiness model. In turn, the business model should reflect the organisation’s strategy. This perspective onbusiness intelligence is schematically presented in figure 2-6.
Though each firm executes its own specific strategy and will consequently measure organisational performance onspecific KPIs, we can classify KPIs into ten categories; short-term financial results, customer relations, employeerelations, operational performance, product and service quality, alliances, supplier relations, environmentalperformance, product and service innovation and community. Furthermore, figure 2-6 illustrates that the BIcycle can not commence before the firm has determined ‘what it should measure’.
Chapter 3
Research Domain
The purpose of this chapter is to describe the research domain. As illustrated in chapter 1, this thesis intendsto develop a procedure that allows firms to process social media data for business intelligence purposes. It istherefore that this chapter explains what social media is, how firms currently apply social media, for whichpurposes, what social business intelligence is and what developments currently take place in the world of socialbusiness intelligence. Since social media is one of the many applications enabled by Web 2.0, we start with adescription of Web 2.0.
3-1 Web 2.0Web 2.0 is the generation of web pages that not only provide information, but additionally allow users to interactwith these web pages. In contradiction with the first phase of the web’s evolution, Web 2.0 allows anyone tocreate and share content. The content-creating feature makes it that Web 2.0 is also referred to as “the wisdomweb, people-centric web, participative web, and read/write web” (Murugesan, 2007). Web 2.0 allows users todo more than just retrieve information. Whereas the internet was traditionally applied to read, watch, and buyproducts in Web 1.0, it is increasingly utilised to create, modify, share, and discuss content in the Web 2.0 era.
It is the enabling of the creation of user-generated content that distinguishes Web 2.0 from Web 1.0. O’reilly(2007) – who sees Web 2.0 as “the web as platform” – indicates that the power of Web 2.0 is “collectiveintelligence”, and turns the web into a kind of global brain”. The best-known example is probably Wikipedia(launched in 2001), an online encyclopedia created by the Internet users that contains now 23 million (Wikipedia,2012) articles. The existence of Wikipedia illustrates that people are willing to share their knowledge with others.For example, people that searched for ‘Hasbro’s Easy-Bake Oven’ in Web 1.0 would have found a static webpage promoting the product, while in the Web 2.0 era, people also find in the top 5 of search results a warningthat the Easy-Bake Oven may lead to serious burns on hands due to a poorly-designed oven door (A. M. Kaplan& Haenlein, 2010). These warnings have been written by users feeling that they had to share their (negative)experiences and product knowledge. Other examples of collective intelligence are ask and answering sites,demonstration videos, and product reviewing sites. Not only knowledge is shared with the rest of the worldthrough Web 2.0 solutions, people also are willing to share their opinions about various topics, their favouritedining places, what they think about the new election candidate, etc. Especially these topics, that we canposition under the denominator of opinions and private events, are shared through means of social media.
3-2 Social MediaSocial media allow users to connect and share content with each other through Web 2.0 based platforms. Therise of social media in the first decade of the 21st century is a natural consequence of Web 2.0. The relationwith Web 2.0 is highlighted by Kaplan & Haenlein’s (2010) definition of social media, stating that “social mediais a group of internet-based applications that build on the ideological and technological foundations of Web 2.0,and that allow the creation and exchange of user-generated content”. However, with this definition we cannotdistinguish social media from Web 2.0 sites, since user-generated content is a fundamental element in Web 2.0
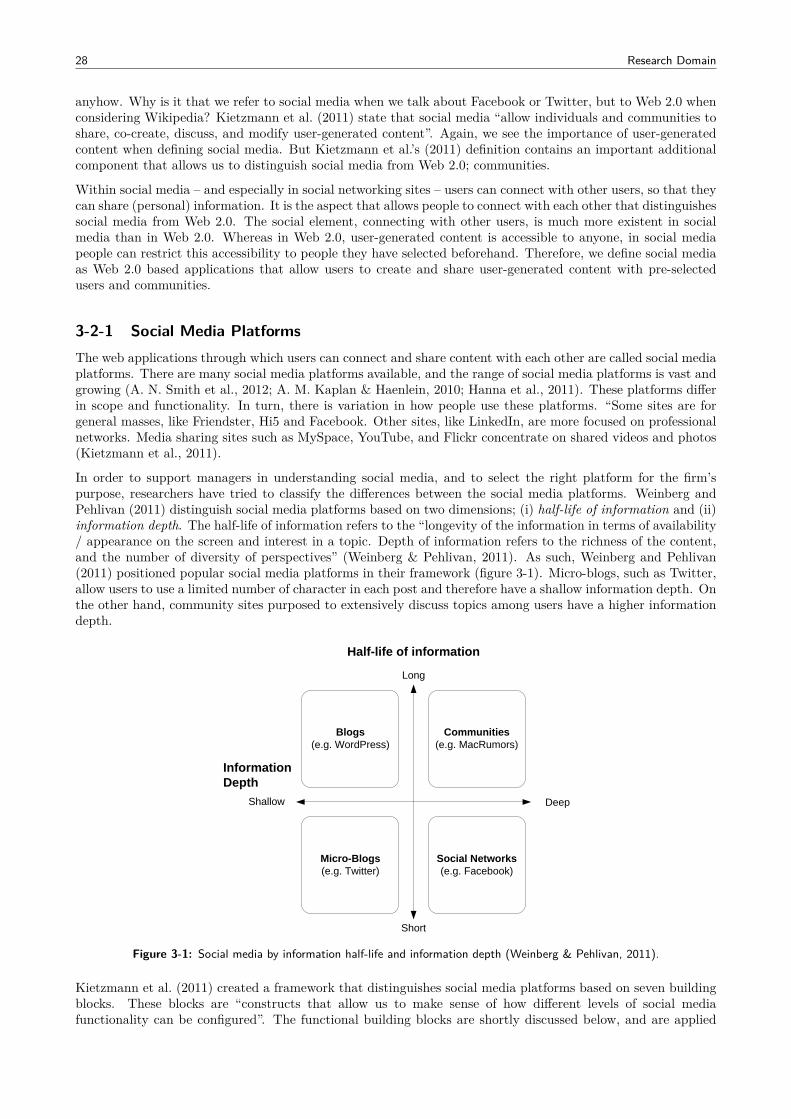
28 Research Domain
anyhow. Why is it that we refer to social media when we talk about Facebook or Twitter, but to Web 2.0 whenconsidering Wikipedia? Kietzmann et al. (2011) state that social media “allow individuals and communities toshare, co-create, discuss, and modify user-generated content”. Again, we see the importance of user-generatedcontent when defining social media. But Kietzmann et al.’s (2011) definition contains an important additionalcomponent that allows us to distinguish social media from Web 2.0; communities.
Within social media – and especially in social networking sites – users can connect with other users, so that theycan share (personal) information. It is the aspect that allows people to connect with each other that distinguishessocial media from Web 2.0. The social element, connecting with other users, is much more existent in socialmedia than in Web 2.0. Whereas in Web 2.0, user-generated content is accessible to anyone, in social mediapeople can restrict this accessibility to people they have selected beforehand. Therefore, we define social mediaas Web 2.0 based applications that allow users to create and share user-generated content with pre-selectedusers and communities.
3-2-1 Social Media PlatformsThe web applications through which users can connect and share content with each other are called social mediaplatforms. There are many social media platforms available, and the range of social media platforms is vast andgrowing (A. N. Smith et al., 2012; A. M. Kaplan & Haenlein, 2010; Hanna et al., 2011). These platforms differin scope and functionality. In turn, there is variation in how people use these platforms. “Some sites are forgeneral masses, like Friendster, Hi5 and Facebook. Other sites, like LinkedIn, are more focused on professionalnetworks. Media sharing sites such as MySpace, YouTube, and Flickr concentrate on shared videos and photos(Kietzmann et al., 2011).
In order to support managers in understanding social media, and to select the right platform for the firm’spurpose, researchers have tried to classify the differences between the social media platforms. Weinberg andPehlivan (2011) distinguish social media platforms based on two dimensions; (i) half-life of information and (ii)information depth. The half-life of information refers to the “longevity of the information in terms of availability/ appearance on the screen and interest in a topic. Depth of information refers to the richness of the content,and the number of diversity of perspectives” (Weinberg & Pehlivan, 2011). As such, Weinberg and Pehlivan(2011) positioned popular social media platforms in their framework (figure 3-1). Micro-blogs, such as Twitter,allow users to use a limited number of character in each post and therefore have a shallow information depth. Onthe other hand, community sites purposed to extensively discuss topics among users have a higher informationdepth.
Blogs(e.g. WordPress)
Communities(e.g. MacRumors)
Micro-Blogs(e.g. Twitter)
Social Networks(e.g. Facebook)
Long
Short
Shallow Deep
Half-life of information
InformationDepth
Figure 3-1: Social media by information half-life and information depth (Weinberg & Pehlivan, 2011).
Kietzmann et al. (2011) created a framework that distinguishes social media platforms based on seven buildingblocks. These blocks are “constructs that allow us to make sense of how different levels of social mediafunctionality can be configured”. The functional building blocks are shortly discussed below, and are applied
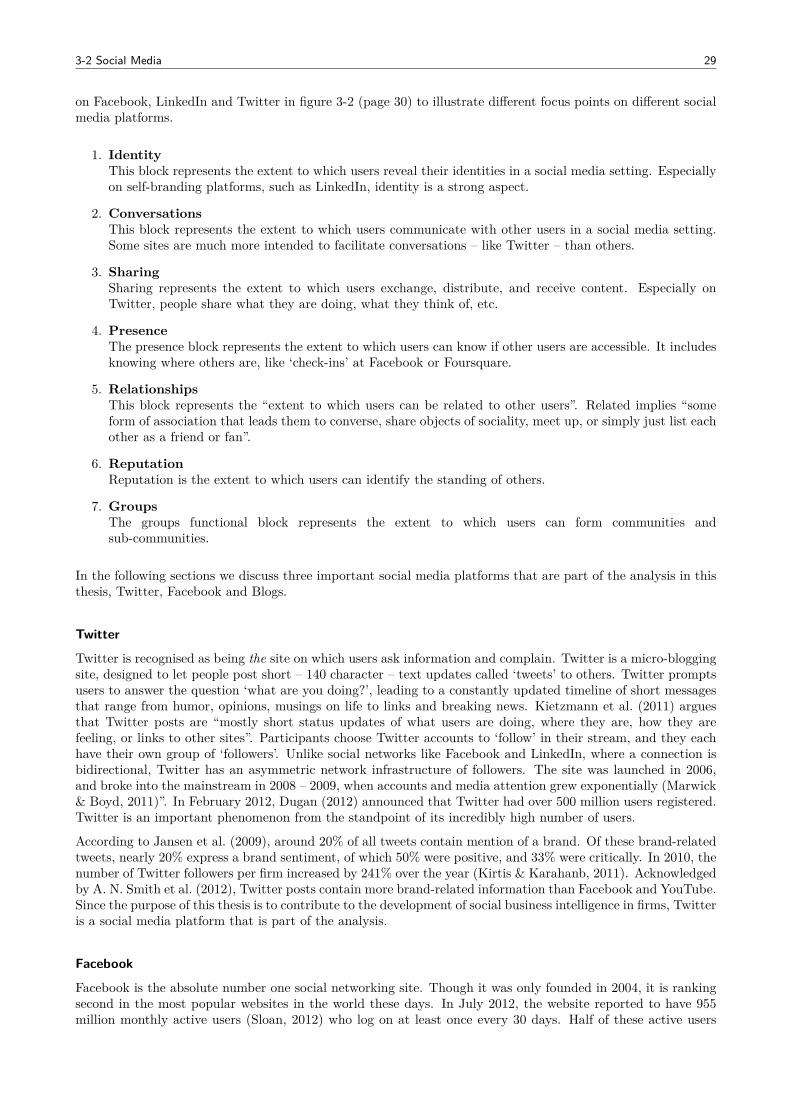
3-2 Social Media 29
on Facebook, LinkedIn and Twitter in figure 3-2 (page 30) to illustrate different focus points on different socialmedia platforms.
1. IdentityThis block represents the extent to which users reveal their identities in a social media setting. Especiallyon self-branding platforms, such as LinkedIn, identity is a strong aspect.
2. ConversationsThis block represents the extent to which users communicate with other users in a social media setting.Some sites are much more intended to facilitate conversations – like Twitter – than others.
3. SharingSharing represents the extent to which users exchange, distribute, and receive content. Especially onTwitter, people share what they are doing, what they think of, etc.
4. PresenceThe presence block represents the extent to which users can know if other users are accessible. It includesknowing where others are, like ‘check-ins’ at Facebook or Foursquare.
5. RelationshipsThis block represents the “extent to which users can be related to other users”. Related implies “someform of association that leads them to converse, share objects of sociality, meet up, or simply just list eachother as a friend or fan”.
6. ReputationReputation is the extent to which users can identify the standing of others.
7. GroupsThe groups functional block represents the extent to which users can form communities andsub-communities.
In the following sections we discuss three important social media platforms that are part of the analysis in thisthesis, Twitter, Facebook and Blogs.
Twitter is recognised as being the site on which users ask information and complain. Twitter is a micro-bloggingsite, designed to let people post short – 140 character – text updates called ‘tweets’ to others. Twitter promptsusers to answer the question ‘what are you doing?’, leading to a constantly updated timeline of short messagesthat range from humor, opinions, musings on life to links and breaking news. Kietzmann et al. (2011) arguesthat Twitter posts are “mostly short status updates of what users are doing, where they are, how they arefeeling, or links to other sites”. Participants choose Twitter accounts to ‘follow’ in their stream, and they eachhave their own group of ‘followers’. Unlike social networks like Facebook and LinkedIn, where a connection isbidirectional, Twitter has an asymmetric network infrastructure of followers. The site was launched in 2006,and broke into the mainstream in 2008 – 2009, when accounts and media attention grew exponentially (Marwick& Boyd, 2011)”. In February 2012, Dugan (2012) announced that Twitter had over 500 million users registered.Twitter is an important phenomenon from the standpoint of its incredibly high number of users.
According to Jansen et al. (2009), around 20% of all tweets contain mention of a brand. Of these brand-relatedtweets, nearly 20% express a brand sentiment, of which 50% were positive, and 33% were critically. In 2010, thenumber of Twitter followers per firm increased by 241% over the year (Kirtis & Karahanb, 2011). Acknowledgedby A. N. Smith et al. (2012), Twitter posts contain more brand-related information than Facebook and YouTube.Since the purpose of this thesis is to contribute to the development of social business intelligence in firms, Twitteris a social media platform that is part of the analysis.
Facebook is the absolute number one social networking site. Though it was only founded in 2004, it is rankingsecond in the most popular websites in the world these days. In July 2012, the website reported to have 955million monthly active users (Sloan, 2012) who log on at least once every 30 days. Half of these active users
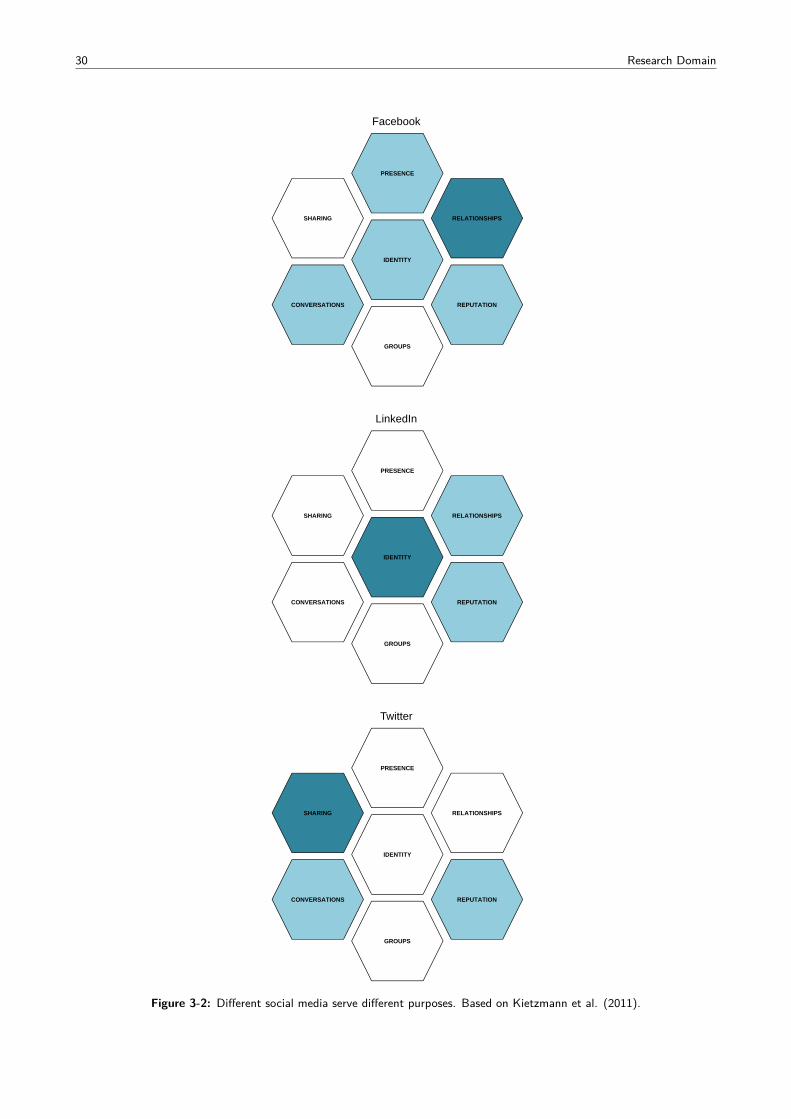
30 Research Domain
PRESENCE
RELATIONSHIPSSHARING
IDENTITY
REPUTATIONCONVERSATIONS
GROUPS
PRESENCE
RELATIONSHIPSSHARING
IDENTITY
REPUTATIONCONVERSATIONS
GROUPS
PRESENCE
RELATIONSHIPSSHARING
IDENTITY
REPUTATIONCONVERSATIONS
GROUPS
Figure 3-2: Different social media serve different purposes. Based on Kietzmann et al. (2011).
3-2 Social Media 31
log on every day (Laroche, Habibi, & Richard, 2012). Facebook users can “create profiles featuring personalinformation, interests, photos, and the like, and can “friend” other site users. They can also participate in a widerange of activities such as writing on friends’ walls, commenting on links, participating in forum discussions,and “liking” brands. Facebook allows people to build or maintain social capital, communicate with others, keepup with other peoples’ lives, and discover rumours and gossip” (A. N. Smith et al., 2012).
Over 2010, the percentage of corporations active on Facebook increased by 13%, with the number of ‘likes’per page rising by 115% globally (Kirtis & Karahanb, 2011). Where Twitter is considered as a platform forcompanies to communicate instantly with stakeholders, Facebook is suitable for creating communities amongstakeholders.
Blogs
While Twitter and Facebook conversations are often unstructured and brief, blogs may be a source fororganisations to discover structured customer opinions. After a slow start in the late 1990s, weblogs (“blogs”)– such as Blogspot and Wordpress based websites – have become very popular, because they are easy to createand to maintain (Kietzmann et al., 2011). Blogs are often designed as product review sites, where customerscan share their experiences with their products. Generally these blogs are publicly accessible and there are norestrictions to the amount of characters per post.
3-2-2 User-Generated Content on Social Media PlatformsSocial media platforms exist by the virtue of user-generated content (“UGC”). UGC is content that is “publiclyaccessible, created outside of professional practices and shows a certain amount of creative effort” (A. M. Kaplan& Haenlein, 2010). UGC can take many forms, such as pictures on Facebook, videos on YouTube, statementson Twitter, product experiences on blogs, etc. Without users that create and share content, social media sitesare like an empty shell. Therefore, UGC is considered as the fundamental element underlying social media(A. N. Smith et al., 2012; Boyd & Ellison, 2007). Enabled by Web 2.0, user-generated content has becomeincreasingly popular on the internet since the early 2000s: more and more users participate in content creation,rather than just consumption (Agichtein et al., 2008). In China, the percentage of internet content that isuser-produced now exceeds that what is professionally produced (A. N. Smith et al., 2012). According toA. M. Kaplan and Haenlein (2010) it are not only the technical developments of Web 2.0 and an “increasedbroadband availability and hardware capacity” that has contributed to the popularity of UGC on social mediathese days, but also “the rise of a generation of ‘digital natives’ and ‘screenagers’ with substantial technicalknowledge and willingness to engage online”.
Though UGC varies in nature between different social media platforms (Kietzmann et al., 2011), A. N. Smithet al. (2012) and Jansen et al. (2009) indicate that much user-generated content – around 20% – on the internetcontains a brand name. It is here where the opportunities for firms materialise, firms can inspect the posts thatcontain a brand name to discover customer opinions related to their brands. The internet’s accessibility, reach,and transparency have empowered firms that are interested in consumers opinions (Kozinets et al., 2010). Useropinions were not that easy to be gathered before the social media era, while they are now accessible at lowcosts (Kirtis & Karahanb, 2011).
As illustrated in the previous paragraph, UGC on social media contains opportunities for firms. However,user-generated content also contains disadvantages. Especially issues related to variance, cohesion andverification are at stake when processing user-generated content from social media sites. The three issuesare discussed in the following paragraphs.
Variance Firstly, the variance in the quality of UGC is high, “any data can contain information ranging fromexcellent to spam” (Agichtein et al., 2008). This makes the tasks of filtering and ranking the importance ofsocial media posts more complex than non user-generated content.
Cohesion Secondly, professionals that base decisions on social media content should be aware of the negativeeffects arising from cohesion; one negative message about a firm – which may not even be true – can snowballover the internet, reaching many people, and may eventually harm the performance of the company. “Cohesiondescribes the phenomenon that evaluations of cost and benefit associated with prospective behaviour arealigned via strong communication relationships. People thus become more homogeneous as a result of direct
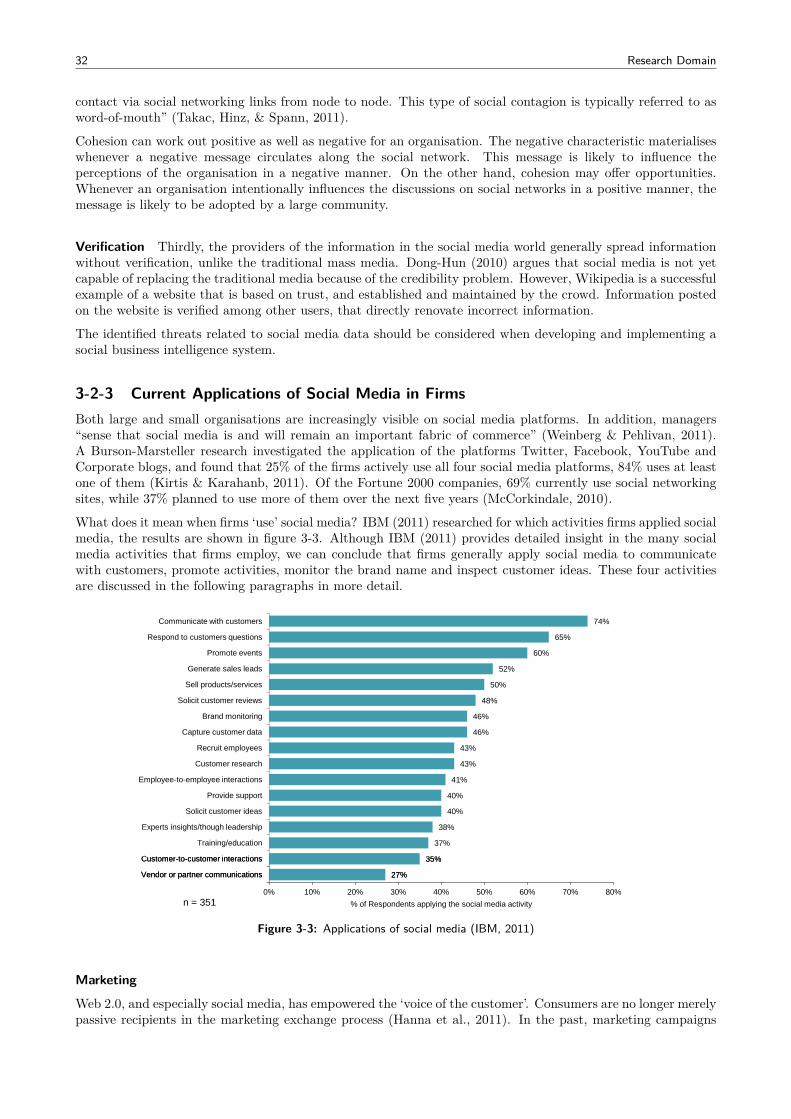
32 Research Domain
contact via social networking links from node to node. This type of social contagion is typically referred to asword-of-mouth” (Takac, Hinz, & Spann, 2011).
Cohesion can work out positive as well as negative for an organisation. The negative characteristic materialiseswhenever a negative message circulates along the social network. This message is likely to influence theperceptions of the organisation in a negative manner. On the other hand, cohesion may offer opportunities.Whenever an organisation intentionally influences the discussions on social networks in a positive manner, themessage is likely to be adopted by a large community.
Verification Thirdly, the providers of the information in the social media world generally spread informationwithout verification, unlike the traditional mass media. Dong-Hun (2010) argues that social media is not yetcapable of replacing the traditional media because of the credibility problem. However, Wikipedia is a successfulexample of a website that is based on trust, and established and maintained by the crowd. Information postedon the website is verified among other users, that directly renovate incorrect information.
The identified threats related to social media data should be considered when developing and implementing asocial business intelligence system.
3-2-3 Current Applications of Social Media in FirmsBoth large and small organisations are increasingly visible on social media platforms. In addition, managers“sense that social media is and will remain an important fabric of commerce” (Weinberg & Pehlivan, 2011).A Burson-Marsteller research investigated the application of the platforms Twitter, Facebook, YouTube andCorporate blogs, and found that 25% of the firms actively use all four social media platforms, 84% uses at leastone of them (Kirtis & Karahanb, 2011). Of the Fortune 2000 companies, 69% currently use social networkingsites, while 37% planned to use more of them over the next five years (McCorkindale, 2010).
What does it mean when firms ‘use’ social media? IBM (2011) researched for which activities firms applied socialmedia, the results are shown in figure 3-3. Although IBM (2011) provides detailed insight in the many socialmedia activities that firms employ, we can conclude that firms generally apply social media to communicatewith customers, promote activities, monitor the brand name and inspect customer ideas. These four activitiesare discussed in the following paragraphs in more detail.
27%
35%
37%
38%
40%
40%
41%
43%
43%
46%
46%
48%
50%
52%
60%
65%
74%
Vendor or partner communications
Customer-to-customer interactions
Training/education
Experts insights/though leadership
Solicit customer ideas
Provide support
Employee-to-employee interactions
Customer research
Recruit employees
Capture customer data
Brand monitoring
Solicit customer reviews
Sell products/services
Generate sales leads
Promote events
Respond to customers questions
Communicate with customers
27%
35%
0% 10% 20% 30% 40% 50% 60% 70% 80%
Vendor or partner communications
Customer-to-customer interactions
% of Respondents applying the social media activityn = 351
Figure 3-3: Applications of social media (IBM, 2011)
Marketing
Web 2.0, and especially social media, has empowered the ‘voice of the customer’. Consumers are no longer merelypassive recipients in the marketing exchange process (Hanna et al., 2011). In the past, marketing campaigns
3-2 Social Media 33
were typically developed by companies in-house, without interference of (potential) consumers. Campaigns hadthe character of ‘here is the advert, please absorb it’, or ‘here is the product, we hope you like it’. This ‘we talk,you listen’ approach has been replaced by ‘you talk, we listen’ as a result of the possibilities offered by socialmedia (e.g., Patterson, 2012; Klassen, 2009).
Research indicates that marketing through social media is effective for firms. “70% of the consumers that haveused social media websites to take product or brand information, 49% of these consumers made a purchasedecision based on the information they pound through social media sites” (Kirtis & Karahanb, 2011).
Firms are also turning into social media marketing to lower the firms’ expenditures. The cost reduction aspect ofonline marketing as compared to traditional marketing is one of the main reasons why companies are nowadaysapplying social media for marketing purposes (Kirtis & Karahanb, 2011). Cost reduction is mainly achieved bythe elimination of the distribution phase, which is required in traditional mass media. In addition, marketingthrough means of social media is less expensive than the regular channels because most social media applicationsare free of charge. As such, the biggest expenditures related to the execution of a social media strategy representsthe time employees spend on posting messages, responding to comments and blogging. Social media allowsmarketers to specifically target on client groups, and distinguish between products / services case by case. Incomparison with traditional marketing channels, social media shows also on this aspect lower costs. Driven bythe global recession, many firms are in a cost-reducing mode. Because of the economic turmoil social media isapplied as a survival tool by many firms, so the economic recession has increased the rate of shift change fromtraditional media to social media (Kietzmann et al., 2011).
For the beneficiary reasons of marketing through social media described in the previous, A. N. Smith et al.(2012) estimate that the percentage of companies using social media for marketing is expected to reach 88% by2012, up from 42% in 2008.
Customer Relations Management
Firms also use social media for customer relations management (“CRM”), also referred to as social CRM. Thanksto social media, “the nature of public relations and how organisations engage their public has changed a greatdeal in the past several years” (McCorkindale, 2010). “An environment in which control of the relationshiphas shifted to the customer, who has the power to influence his or her social network” (IBM, 2011) drivesorganisations willing to participate in the online conversations.
Social media platforms hold unprecedented opportunities for companies to get closer to customers, allowing firmsto communicate directly with customers, for instance to provide support when customers encounter problemswith products / services. According to Patterson (2012), firms “have made progress in conversing with theircustomers”.
A recent study by Laroche et al. (2012) indicates that it is beneficiary for firms to establish online communitiesin which both firms and customers communicate with each other, “brand communities established on socialmedia have effects on customer/product, customer/brand, customer/company and customer/other customerrelationships, which in turn have positive effects on brand trust, and trust has positive effects on brand loyalty”.
Reputation Management
A failing social media engagement strategy can significantly impact a firm’s reputation and sales (Kietzmannet al., 2011). The increased application of social media has serious consequences for an organisation’s exposureto its environment. It seems that the power has been taken from the corporate marketing departments byindividual consumers that create, share and discuss online blogs, tweets, Facebook entries, movies, pictures, etc.With or without permission, communication about brands will happen. In an environment where customers gainmore and more power, organisations need to carefully tread their actions and control its’ exposure. Therefore,companies more and more empower employees to talk, listen, and respond to what consumers post on socialmedia (A. N. Smith et al., 2012) in order to control the firm’s (online) reputation.
One negative message about an organisation – created by one single person – can snowball over the internet,reaching many people, and may eventually harm the performance of the company. In 2008, Canadian singerDave Caroll wrote a song about United Airlines’ luggage handling employees recklessly throwing his guitar,which caused a break in his guitar. Frustrated by bad customer experience, he uploaded his ‘United breaksguitars’ song on YouTube. Consequently, United Airlines experienced a 10% drop (Patterson, 2012) in its sharevalue and suffered damage to its reputation. The YouTube clip has been viewed over 12 million times. This is
34 Research Domain
one of the examples that show how powerful the force of social media can be, when a company does not actaccording to the preferences of the community. As such, social media platforms may be a source of both threatsand opportunities for brands experiencing unfavourable exposure (A. N. Smith et al., 2012).
Co-creation & Pro-sumers
Today, consumers “are taking an increasingly active role in co-creating everything from product design topromotional messages” (Berthon, Pitt, McCarthy, & Kates, 2007). This phenomenon is known as co-creation,and more recently termed as “prosuming” (DesAutels, 2011), illustrating that people are not only consumersbut at the same time producers. Firms are much more required to perceive consumers as partners in the processof creating products, whereas this was – before the social media era – formerly an activity for solely the firm.
An example of such a process is Lay’s recent campaign to decide the new flavour of their potato crisps. InLay’s campaign, consumers were stimulated to contemplate new flavours and to post these ideas on the web.Other users consequently rated the ideas that were send it. The winning flavours have actually been brought toproduction. Another example related to co-creation is Samsung, which ‘listened’ closely to the user-generatedcontent on blogs, and, after hearing complaints that the speakers on the side of the TV were too wide for manycustomers’ entertainment cabinets, it redesigned the product (Klassen, 2009).
The co-creation opportunities for firms offered by social media reach even further. A growing numberof organisations, among them 3M, AEGON, HCL Technologies, Red Hat and Rite-Solutions have recentlyexperienced with crowdsourcing their strategies (Gast & Zanini, 2012). The organisations offered the public thepossibility to provide input in the form of proposals for the company’s future directions. The effects resultingfrom strategy crowdsourcing is twofold. In the first place, the company gathers information from the externalenvironment, including perceptions from important actors that would normally be overlooked. An organisationcan consequently craft its strategy with a higher quality. Secondly, the organisation creates “enthusiasm andalignment behind a company’s direction” (Gast & Zanini, 2012).
Though the previous sections illustrate that social media is widely applied for different purposes in organisations,many executives eschew or ignore this form of media because they “don’t understand what it is, the variousforms it can take, and how to engage with it and learn” (Kietzmann et al., 2011). Also A. M. Kaplan andHaenlein (2010) state that the reluctant attitude of some managers towards social media is due to “a lackof understanding regarding what social media are”. Many organisations acknowledge the opportunities in theapplication of social media, while, on the other hand, there also exists a fair degree of uncertainty with respectto allocating effort and budget to social media, and “limited understanding of the distinctions between varioussocial media platforms” (Weinberg & Pehlivan, 2011).
3-3 Social Business Intelligence
Firms should measure the effects of social media activities on organisational performance. As illustrated inchapter 2, the process of business intelligence requires key-performance indicators to be defined so that theperformance of the firm can be measured against its strategy. This value-based management approach isgenerally applied within firms, implying that when a firm pursues to perform social media activities, it shouldmeasure the effects of these activities in relation with organisational performance.
Existing social media monitoring tools mainly reveal the performance of the organisation on social media(number of mentions, number of likes, % of positive mentions), and treat the social media component of a firmas a separate business unit executing its own strategy. However, the purpose of business intelligence is to revealthe underlying parameters that determine the performance of the organisation, that is, not limited to solelysocial media performance. In order to understand the influence of social media content on an organisation’sperformance, a link between the company’s key-performance indicators and clear social media parameters isrequired.
It is argued that the possibilities of social media for business intelligence purposes reaches further than what iscurrently offered by the social media analytics tools. The key benefits will be gained whenever the KPIs of anorganisation are linked to the parameters that are measured by social media tools. Only in that case, one canspeak about ‘social business intelligence’. In social business intelligence, the social media activities related to afirm are translated to organisational performance.
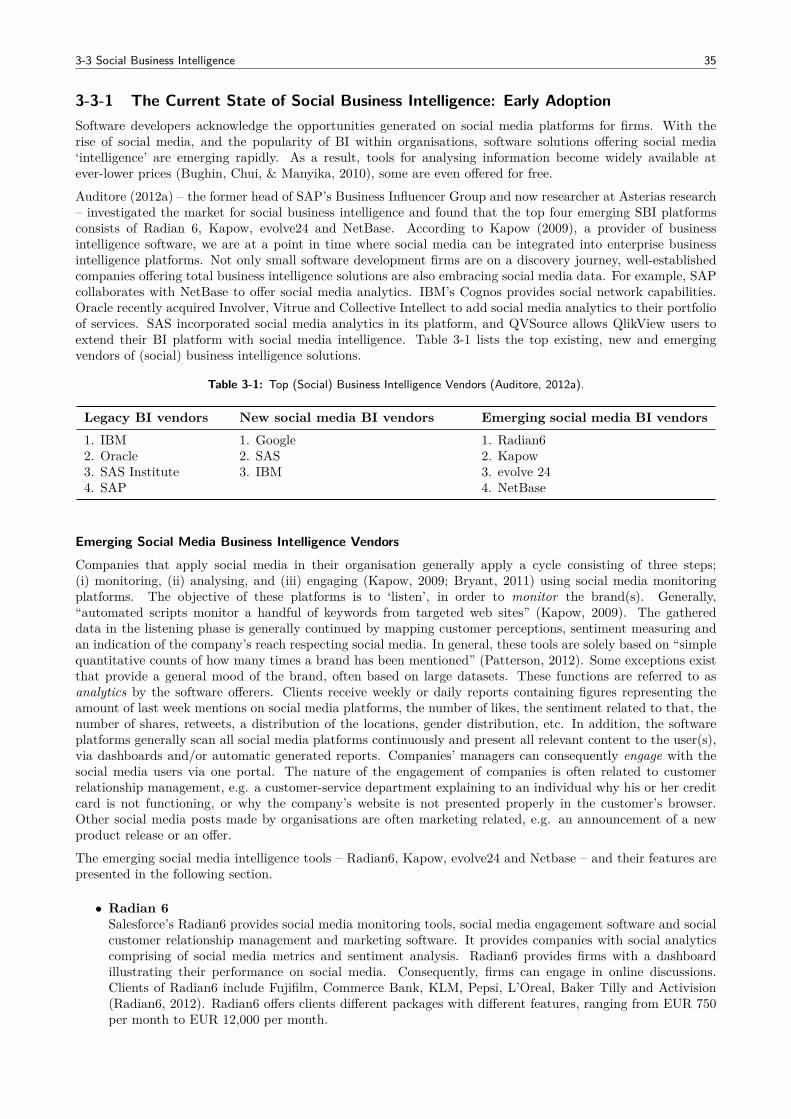
3-3 Social Business Intelligence 35
3-3-1 The Current State of Social Business Intelligence: Early AdoptionSoftware developers acknowledge the opportunities generated on social media platforms for firms. With therise of social media, and the popularity of BI within organisations, software solutions offering social media‘intelligence’ are emerging rapidly. As a result, tools for analysing information become widely available atever-lower prices (Bughin, Chui, & Manyika, 2010), some are even offered for free.
Auditore (2012a) – the former head of SAP’s Business Influencer Group and now researcher at Asterias research– investigated the market for social business intelligence and found that the top four emerging SBI platformsconsists of Radian 6, Kapow, evolve24 and NetBase. According to Kapow (2009), a provider of businessintelligence software, we are at a point in time where social media can be integrated into enterprise businessintelligence platforms. Not only small software development firms are on a discovery journey, well-establishedcompanies offering total business intelligence solutions are also embracing social media data. For example, SAPcollaborates with NetBase to offer social media analytics. IBM’s Cognos provides social network capabilities.Oracle recently acquired Involver, Vitrue and Collective Intellect to add social media analytics to their portfolioof services. SAS incorporated social media analytics in its platform, and QVSource allows QlikView users toextend their BI platform with social media intelligence. Table 3-1 lists the top existing, new and emergingvendors of (social) business intelligence solutions.
Table 3-1: Top (Social) Business Intelligence Vendors (Auditore, 2012a).
Legacy BI vendors New social media BI vendors Emerging social media BI vendors1. IBM 1. Google 1. Radian62. Oracle 2. SAS 2. Kapow3. SAS Institute 3. IBM 3. evolve 244. SAP 4. NetBase
Emerging Social Media Business Intelligence Vendors
Companies that apply social media in their organisation generally apply a cycle consisting of three steps;(i) monitoring, (ii) analysing, and (iii) engaging (Kapow, 2009; Bryant, 2011) using social media monitoringplatforms. The objective of these platforms is to ‘listen’, in order to monitor the brand(s). Generally,“automated scripts monitor a handful of keywords from targeted web sites” (Kapow, 2009). The gathereddata in the listening phase is generally continued by mapping customer perceptions, sentiment measuring andan indication of the company’s reach respecting social media. In general, these tools are solely based on “simplequantitative counts of how many times a brand has been mentioned” (Patterson, 2012). Some exceptions existthat provide a general mood of the brand, often based on large datasets. These functions are referred to asanalytics by the software offerers. Clients receive weekly or daily reports containing figures representing theamount of last week mentions on social media platforms, the number of likes, the sentiment related to that, thenumber of shares, retweets, a distribution of the locations, gender distribution, etc. In addition, the softwareplatforms generally scan all social media platforms continuously and present all relevant content to the user(s),via dashboards and/or automatic generated reports. Companies’ managers can consequently engage with thesocial media users via one portal. The nature of the engagement of companies is often related to customerrelationship management, e.g. a customer-service department explaining to an individual why his or her creditcard is not functioning, or why the company’s website is not presented properly in the customer’s browser.Other social media posts made by organisations are often marketing related, e.g. an announcement of a newproduct release or an offer.
The emerging social media intelligence tools – Radian6, Kapow, evolve24 and Netbase – and their features arepresented in the following section.
• Radian 6Salesforce’s Radian6 provides social media monitoring tools, social media engagement software and socialcustomer relationship management and marketing software. It provides companies with social analyticscomprising of social media metrics and sentiment analysis. Radian6 provides firms with a dashboardillustrating their performance on social media. Consequently, firms can engage in online discussions.Clients of Radian6 include Fujifilm, Commerce Bank, KLM, Pepsi, L’Oreal, Baker Tilly and Activision(Radian6, 2012). Radian6 offers clients different packages with different features, ranging from EUR 750per month to EUR 12,000 per month.
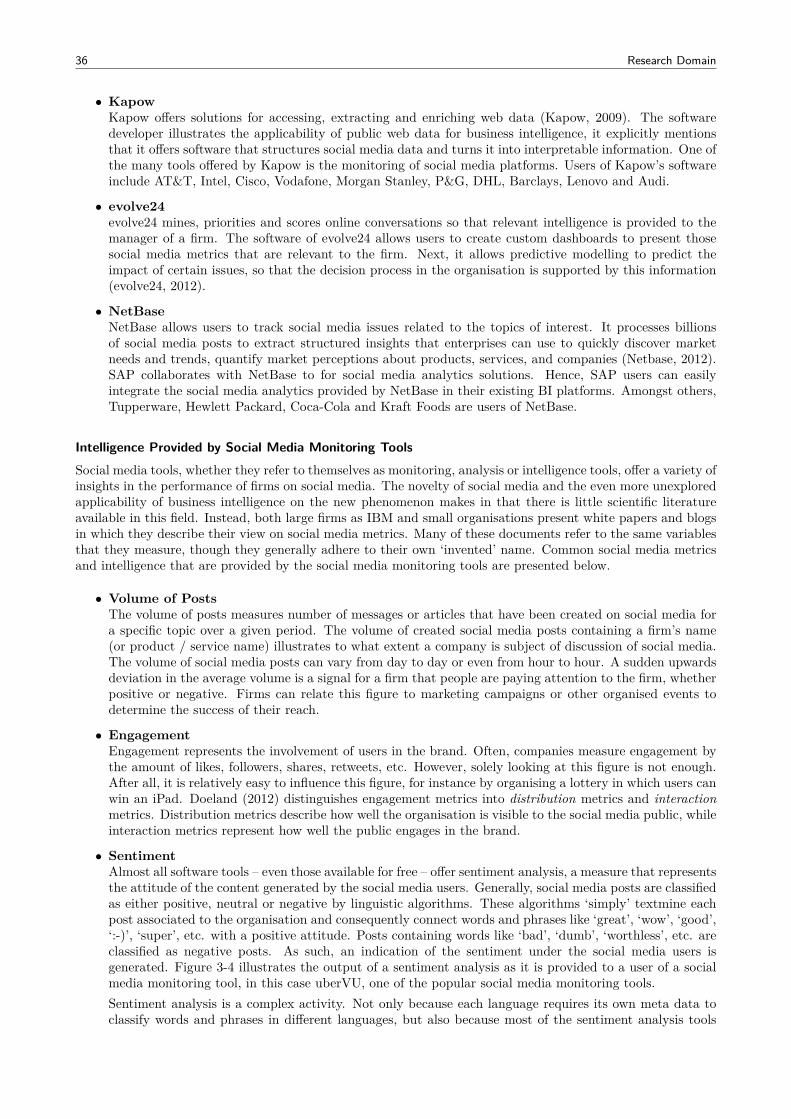
36 Research Domain
• KapowKapow offers solutions for accessing, extracting and enriching web data (Kapow, 2009). The softwaredeveloper illustrates the applicability of public web data for business intelligence, it explicitly mentionsthat it offers software that structures social media data and turns it into interpretable information. One ofthe many tools offered by Kapow is the monitoring of social media platforms. Users of Kapow’s softwareinclude AT&T, Intel, Cisco, Vodafone, Morgan Stanley, P&G, DHL, Barclays, Lenovo and Audi.
• evolve24evolve24 mines, priorities and scores online conversations so that relevant intelligence is provided to themanager of a firm. The software of evolve24 allows users to create custom dashboards to present thosesocial media metrics that are relevant to the firm. Next, it allows predictive modelling to predict theimpact of certain issues, so that the decision process in the organisation is supported by this information(evolve24, 2012).
• NetBaseNetBase allows users to track social media issues related to the topics of interest. It processes billionsof social media posts to extract structured insights that enterprises can use to quickly discover marketneeds and trends, quantify market perceptions about products, services, and companies (Netbase, 2012).SAP collaborates with NetBase to for social media analytics solutions. Hence, SAP users can easilyintegrate the social media analytics provided by NetBase in their existing BI platforms. Amongst others,Tupperware, Hewlett Packard, Coca-Cola and Kraft Foods are users of NetBase.
Intelligence Provided by Social Media Monitoring ToolsSocial media tools, whether they refer to themselves as monitoring, analysis or intelligence tools, offer a variety ofinsights in the performance of firms on social media. The novelty of social media and the even more unexploredapplicability of business intelligence on the new phenomenon makes in that there is little scientific literatureavailable in this field. Instead, both large firms as IBM and small organisations present white papers and blogsin which they describe their view on social media metrics. Many of these documents refer to the same variablesthat they measure, though they generally adhere to their own ‘invented’ name. Common social media metricsand intelligence that are provided by the social media monitoring tools are presented below.
• Volume of PostsThe volume of posts measures number of messages or articles that have been created on social media fora specific topic over a given period. The volume of created social media posts containing a firm’s name(or product / service name) illustrates to what extent a company is subject of discussion of social media.The volume of social media posts can vary from day to day or even from hour to hour. A sudden upwardsdeviation in the average volume is a signal for a firm that people are paying attention to the firm, whetherpositive or negative. Firms can relate this figure to marketing campaigns or other organised events todetermine the success of their reach.
• EngagementEngagement represents the involvement of users in the brand. Often, companies measure engagement bythe amount of likes, followers, shares, retweets, etc. However, solely looking at this figure is not enough.After all, it is relatively easy to influence this figure, for instance by organising a lottery in which users canwin an iPad. Doeland (2012) distinguishes engagement metrics into distribution metrics and interactionmetrics. Distribution metrics describe how well the organisation is visible to the social media public, whileinteraction metrics represent how well the public engages in the brand.
• SentimentAlmost all software tools – even those available for free – offer sentiment analysis, a measure that representsthe attitude of the content generated by the social media users. Generally, social media posts are classifiedas either positive, neutral or negative by linguistic algorithms. These algorithms ‘simply’ textmine eachpost associated to the organisation and consequently connect words and phrases like ‘great’, ‘wow’, ‘good’,‘:-)’, ‘super’, etc. with a positive attitude. Posts containing words like ‘bad’, ‘dumb’, ‘worthless’, etc. areclassified as negative posts. As such, an indication of the sentiment under the social media users isgenerated. Figure 3-4 illustrates the output of a sentiment analysis as it is provided to a user of a socialmedia monitoring tool, in this case uberVU, one of the popular social media monitoring tools.Sentiment analysis is a complex activity. Not only because each language requires its own meta data toclassify words and phrases in different languages, but also because most of the sentiment analysis tools
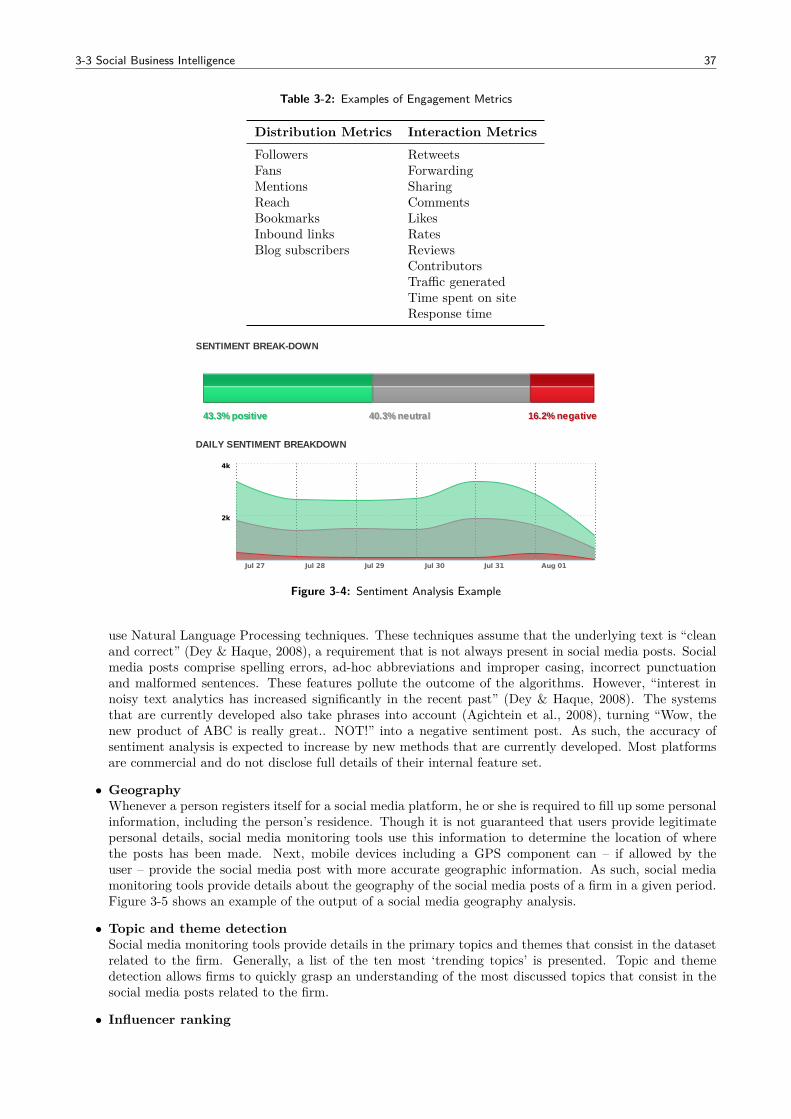
3-3 Social Business Intelligence 37
Table 3-2: Examples of Engagement Metrics
Distribution Metrics Interaction MetricsFollowers RetweetsFans ForwardingMentions SharingReach CommentsBookmarks LikesInbound links RatesBlog subscribers Reviews
ContributorsTraffic generatedTime spent on siteResponse time
SentimentSentiment refers to whether the tone of the conversation where the keyword was mentioned was positive, neutral or negative. As a simplified example, "I love Apple" is considered positive towards "Apple" whereas "I bought an IPad yesterday" is neutral. We use one of the most powerful fully automated sentiment engines on the market.Daily Sentiment breakdown shows the number of positive, neutral and negative mentions each day.Main Negative Themes are the topics that people talk about negatively when mentioning the keyword.So for the mention "I hate Apple support" a negative theme is "support"
AVERAGE SENTIMENT
Slightly POSITIVE
27% positive
SENTIMENT BREAK-DOWN
43.343.3% positive% positive 40.340.3% neutral% neutral 16.216.2% negative% negative
DAILY SENTIMENT BREAKDOWN
Jul 27 Jul 28 Jul 29 Jul 30 Jul 31 Aug 01
2k
4k
Figure 3-4: Sentiment Analysis Example
use Natural Language Processing techniques. These techniques assume that the underlying text is “cleanand correct” (Dey & Haque, 2008), a requirement that is not always present in social media posts. Socialmedia posts comprise spelling errors, ad-hoc abbreviations and improper casing, incorrect punctuationand malformed sentences. These features pollute the outcome of the algorithms. However, “interest innoisy text analytics has increased significantly in the recent past” (Dey & Haque, 2008). The systemsthat are currently developed also take phrases into account (Agichtein et al., 2008), turning “Wow, thenew product of ABC is really great.. NOT!” into a negative sentiment post. As such, the accuracy ofsentiment analysis is expected to increase by new methods that are currently developed. Most platformsare commercial and do not disclose full details of their internal feature set.
• GeographyWhenever a person registers itself for a social media platform, he or she is required to fill up some personalinformation, including the person’s residence. Though it is not guaranteed that users provide legitimatepersonal details, social media monitoring tools use this information to determine the location of wherethe posts has been made. Next, mobile devices including a GPS component can – if allowed by theuser – provide the social media post with more accurate geographic information. As such, social mediamonitoring tools provide details about the geography of the social media posts of a firm in a given period.Figure 3-5 shows an example of the output of a social media geography analysis.
• Topic and theme detectionSocial media monitoring tools provide details in the primary topics and themes that consist in the datasetrelated to the firm. Generally, a list of the ten most ‘trending topics’ is presented. Topic and themedetection allows firms to quickly grasp an understanding of the most discussed topics that consist in thesocial media posts related to the firm.
• Influencer ranking
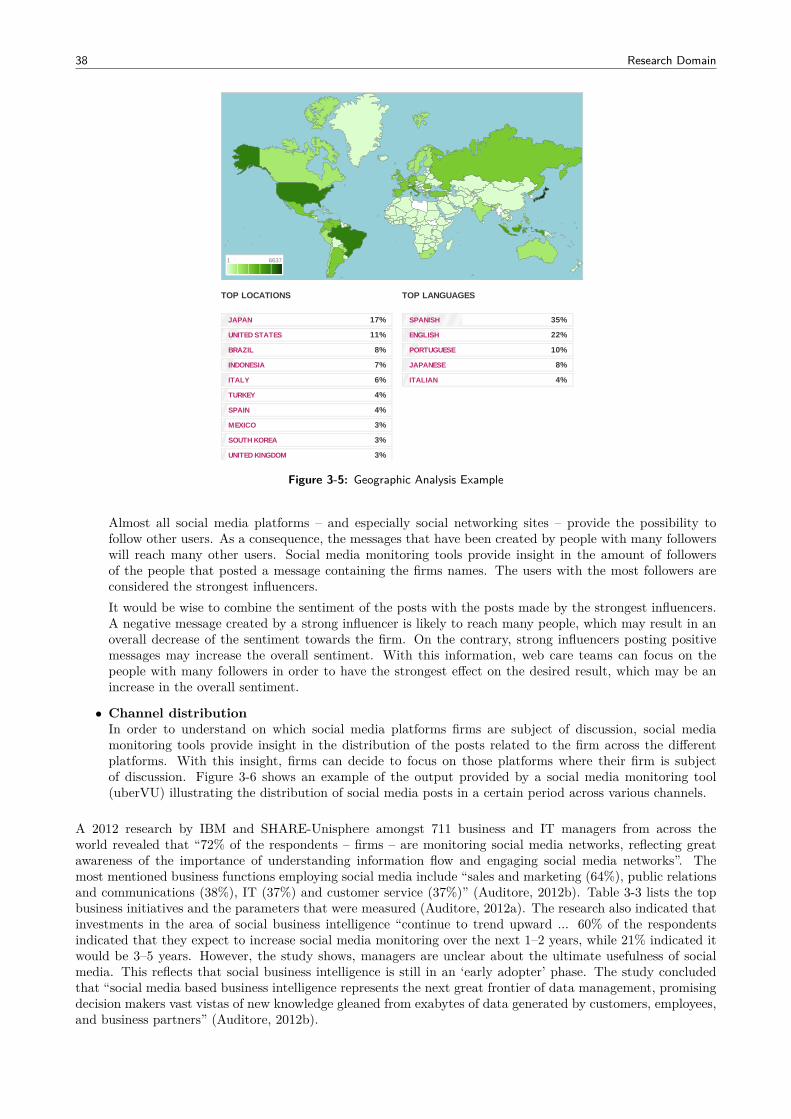
38 Research Domain
GeolocationGeolocation represents the countries where people talked about the keyword during the selected time period and the respective share of the conversation. The location of a person is determined by using mostly Twitter and Facebook data and other profile or location data where available. The darker the green, the more conversations have taken place about this keyword in that region of the world.
GEOLOCATION HEAT MAP
TOP LOCATIONS
JAPAN 17%
UNITED STATES 11%
BRAZIL 8%
INDONESIA 7%
ITALY 6%
TURKEY 4%
SPAIN 4%
MEXICO 3%
SOUTH KOREA 3%
UNITED KINGDOM 3%
TOP LANGUAGES
SPANISH 35%
ENGLISH 22%
PORTUGUESE 10%
JAPANESE 8%
ITALIAN 4%
1 6637
Figure 3-5: Geographic Analysis Example
Almost all social media platforms – and especially social networking sites – provide the possibility tofollow other users. As a consequence, the messages that have been created by people with many followerswill reach many other users. Social media monitoring tools provide insight in the amount of followersof the people that posted a message containing the firms names. The users with the most followers areconsidered the strongest influencers.It would be wise to combine the sentiment of the posts with the posts made by the strongest influencers.A negative message created by a strong influencer is likely to reach many people, which may result in anoverall decrease of the sentiment towards the firm. On the contrary, strong influencers posting positivemessages may increase the overall sentiment. With this information, web care teams can focus on thepeople with many followers in order to have the strongest effect on the desired result, which may be anincrease in the overall sentiment.
• Channel distributionIn order to understand on which social media platforms firms are subject of discussion, social mediamonitoring tools provide insight in the distribution of the posts related to the firm across the differentplatforms. With this insight, firms can decide to focus on those platforms where their firm is subjectof discussion. Figure 3-6 shows an example of the output provided by a social media monitoring tool(uberVU) illustrating the distribution of social media posts in a certain period across various channels.
A 2012 research by IBM and SHARE-Unisphere amongst 711 business and IT managers from across theworld revealed that “72% of the respondents – firms – are monitoring social media networks, reflecting greatawareness of the importance of understanding information flow and engaging social media networks”. Themost mentioned business functions employing social media include “sales and marketing (64%), public relationsand communications (38%), IT (37%) and customer service (37%)” (Auditore, 2012b). Table 3-3 lists the topbusiness initiatives and the parameters that were measured (Auditore, 2012a). The research also indicated thatinvestments in the area of social business intelligence “continue to trend upward ... 60% of the respondentsindicated that they expect to increase social media monitoring over the next 1–2 years, while 21% indicated itwould be 3–5 years. However, the study shows, managers are unclear about the ultimate usefulness of socialmedia. This reflects that social business intelligence is still in an ‘early adopter’ phase. The study concludedthat “social media based business intelligence represents the next great frontier of data management, promisingdecision makers vast vistas of new knowledge gleaned from exabytes of data generated by customers, employees,and business partners” (Auditore, 2012b).
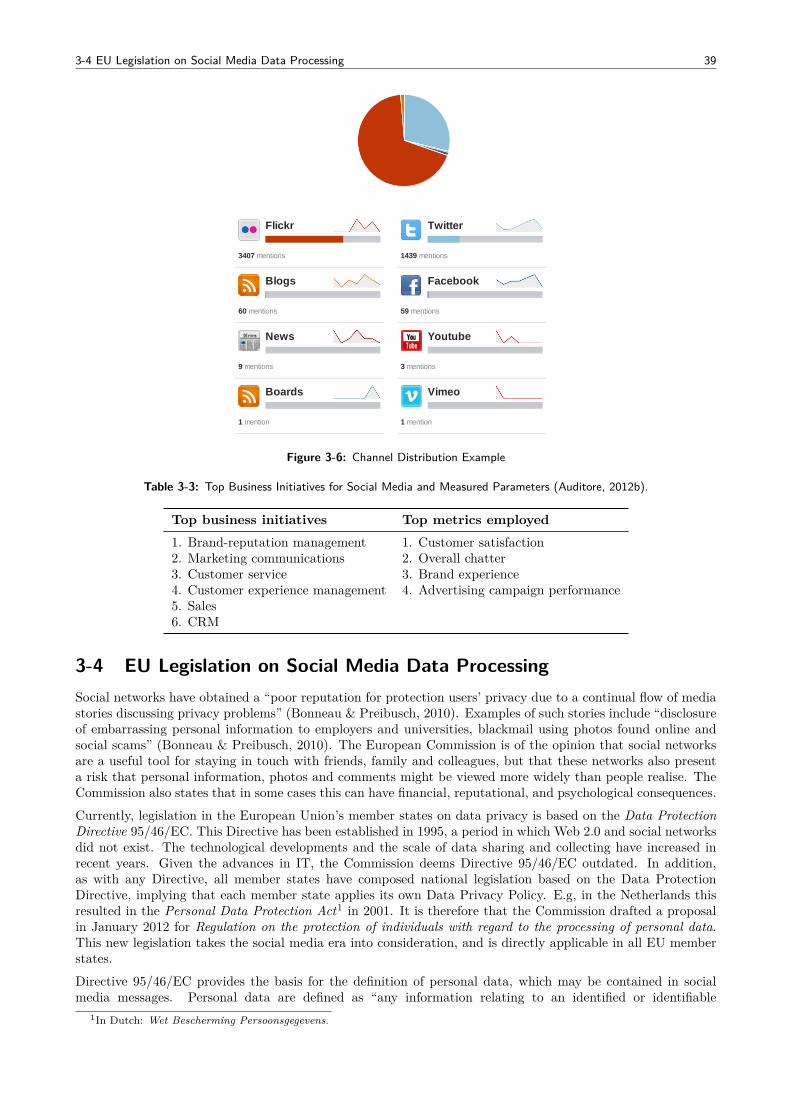
3-4 EU Legislation on Social Media Data Processing 39
Share of voiceThis metric represents the breakdown of mentions about the keyword by specific platforms. The breakdown is based on total number of mentions per platform. This is important when you're trying to figure out where most of the conversation is happening and where you should focus your listening and engagement efforts.Top stories on the top platforms provides a sense of what people are mostly talking about regarding the keyword on each individual platform.
PLATFORM DISTRIBUTION
Flickr
3407 mentions
1439 mentions
Blogs
60 mentions
59 mentions
News
9 mentions
Youtube
3 mentions
Boards
1 mention
Vimeo
1 mention
Figure 3-6: Channel Distribution Example
Table 3-3: Top Business Initiatives for Social Media and Measured Parameters (Auditore, 2012b).
Top business initiatives Top metrics employed1. Brand-reputation management 1. Customer satisfaction2. Marketing communications 2. Overall chatter3. Customer service 3. Brand experience4. Customer experience management 4. Advertising campaign performance5. Sales6. CRM
3-4 EU Legislation on Social Media Data ProcessingSocial networks have obtained a “poor reputation for protection users’ privacy due to a continual flow of mediastories discussing privacy problems” (Bonneau & Preibusch, 2010). Examples of such stories include “disclosureof embarrassing personal information to employers and universities, blackmail using photos found online andsocial scams” (Bonneau & Preibusch, 2010). The European Commission is of the opinion that social networksare a useful tool for staying in touch with friends, family and colleagues, but that these networks also presenta risk that personal information, photos and comments might be viewed more widely than people realise. TheCommission also states that in some cases this can have financial, reputational, and psychological consequences.Currently, legislation in the European Union’s member states on data privacy is based on the Data ProtectionDirective 95/46/EC. This Directive has been established in 1995, a period in which Web 2.0 and social networksdid not exist. The technological developments and the scale of data sharing and collecting have increased inrecent years. Given the advances in IT, the Commission deems Directive 95/46/EC outdated. In addition,as with any Directive, all member states have composed national legislation based on the Data ProtectionDirective, implying that each member state applies its own Data Privacy Policy. E.g, in the Netherlands thisresulted in the Personal Data Protection Act1 in 2001. It is therefore that the Commission drafted a proposalin January 2012 for Regulation on the protection of individuals with regard to the processing of personal data.This new legislation takes the social media era into consideration, and is directly applicable in all EU memberstates.Directive 95/46/EC provides the basis for the definition of personal data, which may be contained in socialmedia messages. Personal data are defined as “any information relating to an identified or identifiable
1In Dutch: Wet Bescherming Persoonsgegevens.
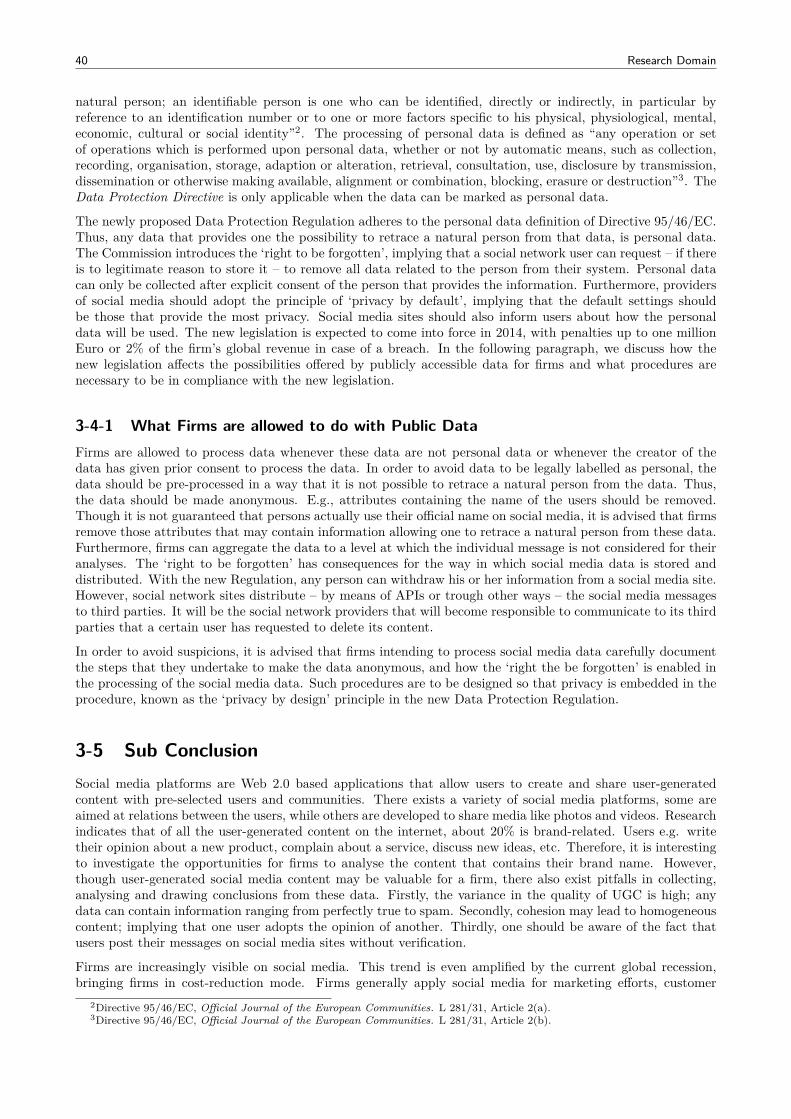
40 Research Domain
natural person; an identifiable person is one who can be identified, directly or indirectly, in particular byreference to an identification number or to one or more factors specific to his physical, physiological, mental,economic, cultural or social identity”2. The processing of personal data is defined as “any operation or setof operations which is performed upon personal data, whether or not by automatic means, such as collection,recording, organisation, storage, adaption or alteration, retrieval, consultation, use, disclosure by transmission,dissemination or otherwise making available, alignment or combination, blocking, erasure or destruction”3. TheData Protection Directive is only applicable when the data can be marked as personal data.
The newly proposed Data Protection Regulation adheres to the personal data definition of Directive 95/46/EC.Thus, any data that provides one the possibility to retrace a natural person from that data, is personal data.The Commission introduces the ‘right to be forgotten’, implying that a social network user can request – if thereis to legitimate reason to store it – to remove all data related to the person from their system. Personal datacan only be collected after explicit consent of the person that provides the information. Furthermore, providersof social media should adopt the principle of ‘privacy by default’, implying that the default settings shouldbe those that provide the most privacy. Social media sites should also inform users about how the personaldata will be used. The new legislation is expected to come into force in 2014, with penalties up to one millionEuro or 2% of the firm’s global revenue in case of a breach. In the following paragraph, we discuss how thenew legislation affects the possibilities offered by publicly accessible data for firms and what procedures arenecessary to be in compliance with the new legislation.
3-4-1 What Firms are allowed to do with Public DataFirms are allowed to process data whenever these data are not personal data or whenever the creator of thedata has given prior consent to process the data. In order to avoid data to be legally labelled as personal, thedata should be pre-processed in a way that it is not possible to retrace a natural person from the data. Thus,the data should be made anonymous. E.g., attributes containing the name of the users should be removed.Though it is not guaranteed that persons actually use their official name on social media, it is advised that firmsremove those attributes that may contain information allowing one to retrace a natural person from these data.Furthermore, firms can aggregate the data to a level at which the individual message is not considered for theiranalyses. The ‘right to be forgotten’ has consequences for the way in which social media data is stored anddistributed. With the new Regulation, any person can withdraw his or her information from a social media site.However, social network sites distribute – by means of APIs or trough other ways – the social media messagesto third parties. It will be the social network providers that will become responsible to communicate to its thirdparties that a certain user has requested to delete its content.
In order to avoid suspicions, it is advised that firms intending to process social media data carefully documentthe steps that they undertake to make the data anonymous, and how the ‘right the be forgotten’ is enabled inthe processing of the social media data. Such procedures are to be designed so that privacy is embedded in theprocedure, known as the ‘privacy by design’ principle in the new Data Protection Regulation.
3-5 Sub ConclusionSocial media platforms are Web 2.0 based applications that allow users to create and share user-generatedcontent with pre-selected users and communities. There exists a variety of social media platforms, some areaimed at relations between the users, while others are developed to share media like photos and videos. Researchindicates that of all the user-generated content on the internet, about 20% is brand-related. Users e.g. writetheir opinion about a new product, complain about a service, discuss new ideas, etc. Therefore, it is interestingto investigate the opportunities for firms to analyse the content that contains their brand name. However,though user-generated social media content may be valuable for a firm, there also exist pitfalls in collecting,analysing and drawing conclusions from these data. Firstly, the variance in the quality of UGC is high; anydata can contain information ranging from perfectly true to spam. Secondly, cohesion may lead to homogeneouscontent; implying that one user adopts the opinion of another. Thirdly, one should be aware of the fact thatusers post their messages on social media sites without verification.
Firms are increasingly visible on social media. This trend is even amplified by the current global recession,bringing firms in cost-reduction mode. Firms generally apply social media for marketing efforts, customer
2Directive 95/46/EC, Official Journal of the European Communities. L 281/31, Article 2(a).3Directive 95/46/EC, Official Journal of the European Communities. L 281/31, Article 2(b).
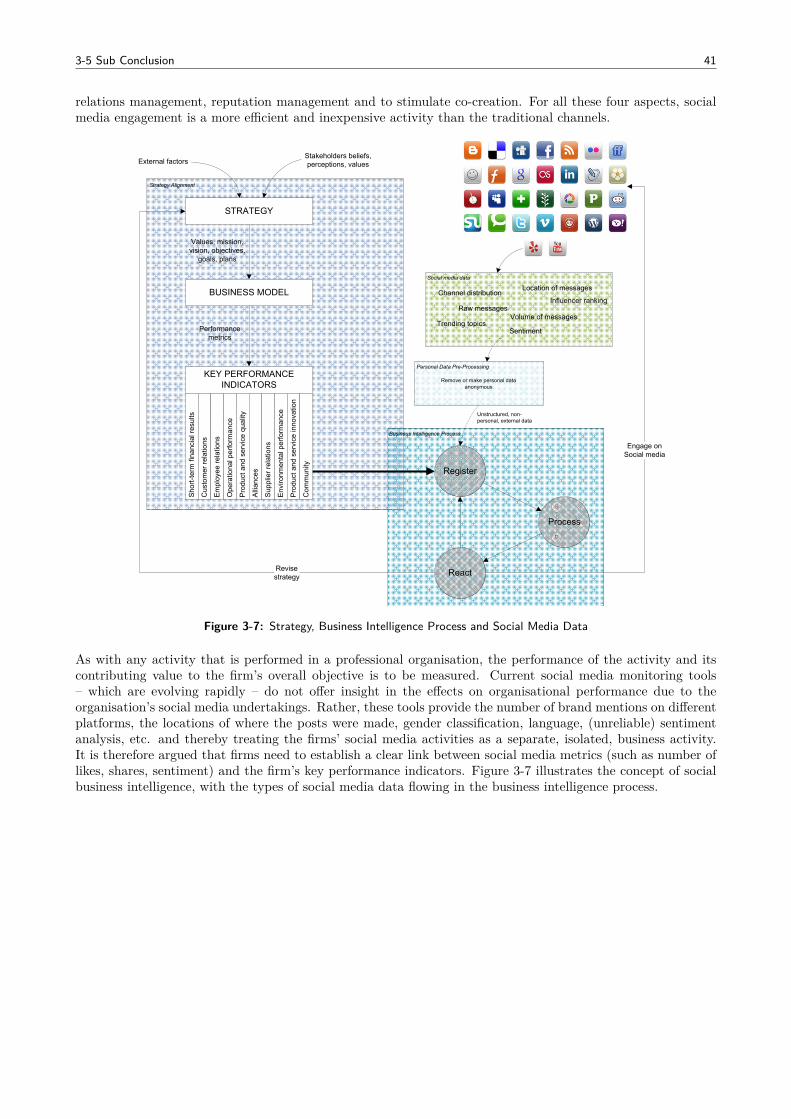
3-5 Sub Conclusion 41
relations management, reputation management and to stimulate co-creation. For all these four aspects, socialmedia engagement is a more efficient and inexpensive activity than the traditional channels.
G
D
A
Register
React
Process
STRATEGY
BUSINESS MODEL
KEY PERFORMANCE INDICATORS
Values, mission, vision, objectives,
goals, plans
Performance metrics
Revisestrategy
Stakeholders beliefs, perceptions, valuesExternal factors
Business Intelligence Process
Strategy AlignmentSh
ort-t
erm
fina
ncia
l res
ults
Cus
tom
er re
latio
ns
Empl
oyee
rela
tions
Ope
ratio
nal p
erfo
rman
ce
Prod
uct a
nd s
ervi
ce q
ualit
y
Alli
ance
s
Sup
plie
r rel
atio
ns
Envi
ronm
enta
l per
form
ance
Prod
uct a
nd s
ervi
ce in
nova
tion
Com
mun
ityRaw messages
Volume of messages
Sentiment
Location of messages
Trending topics
Influencer rankingChannel distribution
Multiple sources of social media data
Social media data
Unstructured, non-personal, external data
Engage onSocial media
Personal Data Pre-Processing
Remove or make personal data anonymous
Figure 3-7: Strategy, Business Intelligence Process and Social Media Data
As with any activity that is performed in a professional organisation, the performance of the activity and itscontributing value to the firm’s overall objective is to be measured. Current social media monitoring tools– which are evolving rapidly – do not offer insight in the effects on organisational performance due to theorganisation’s social media undertakings. Rather, these tools provide the number of brand mentions on differentplatforms, the locations of where the posts were made, gender classification, language, (unreliable) sentimentanalysis, etc. and thereby treating the firms’ social media activities as a separate, isolated, business activity.It is therefore argued that firms need to establish a clear link between social media metrics (such as number oflikes, shares, sentiment) and the firm’s key performance indicators. Figure 3-7 illustrates the concept of socialbusiness intelligence, with the types of social media data flowing in the business intelligence process.
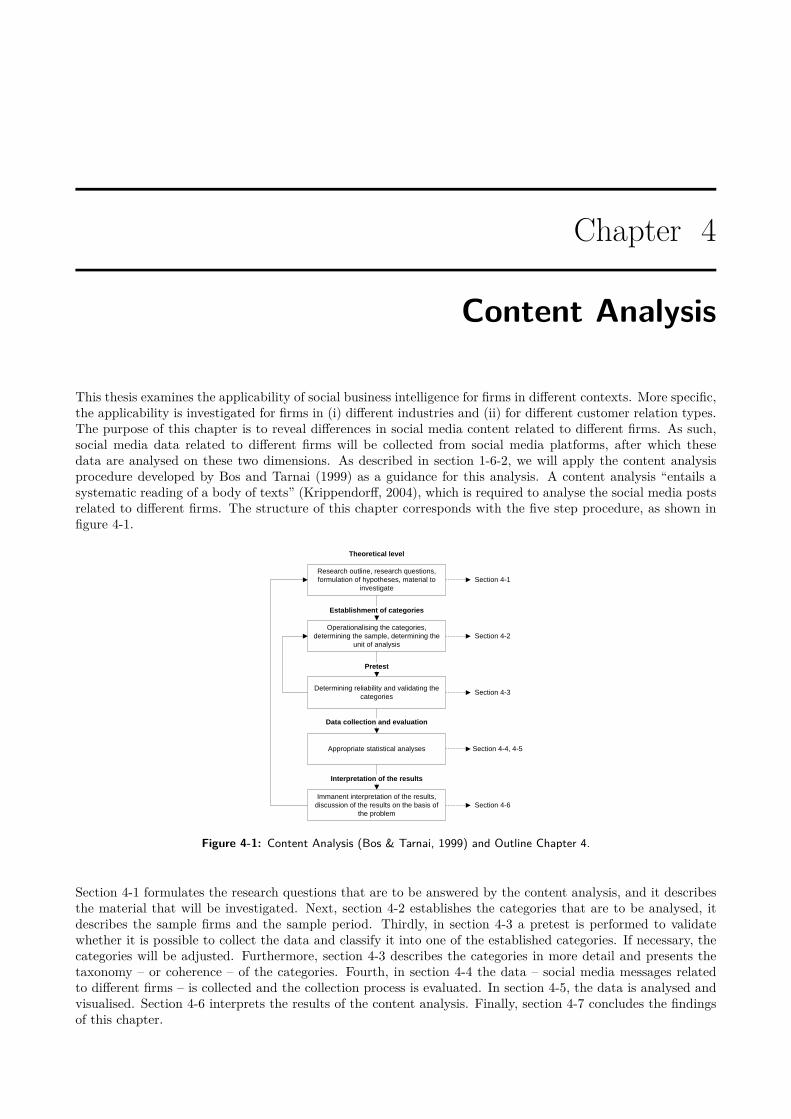
Chapter 4
Content Analysis
This thesis examines the applicability of social business intelligence for firms in different contexts. More specific,the applicability is investigated for firms in (i) different industries and (ii) for different customer relation types.The purpose of this chapter is to reveal differences in social media content related to different firms. As such,social media data related to different firms will be collected from social media platforms, after which thesedata are analysed on these two dimensions. As described in section 1-6-2, we will apply the content analysisprocedure developed by Bos and Tarnai (1999) as a guidance for this analysis. A content analysis “entails asystematic reading of a body of texts” (Krippendorff, 2004), which is required to analyse the social media postsrelated to different firms. The structure of this chapter corresponds with the five step procedure, as shown infigure 4-1.
Research outline, research questions, formulation of hypotheses, material to
investigate
Operationalising the categories, determining the sample, determining the
unit of analysis
Establishment of categories
Theoretical level
Determining reliability and validating the categories
Pretest
Appropriate statistical analyses
Data collection and evaluation
Immanent interpretation of the results, discussion of the results on the basis of
the problem
Interpretation of the results
Section 4-1
Section 4-2
Section 4-3
Section 4-4, 4-5
Section 4-6
Figure 4-1: Content Analysis (Bos & Tarnai, 1999) and Outline Chapter 4.
Section 4-1 formulates the research questions that are to be answered by the content analysis, and it describesthe material that will be investigated. Next, section 4-2 establishes the categories that are to be analysed, itdescribes the sample firms and the sample period. Thirdly, in section 4-3 a pretest is performed to validatewhether it is possible to collect the data and classify it into one of the established categories. If necessary, thecategories will be adjusted. Furthermore, section 4-3 describes the categories in more detail and presents thetaxonomy – or coherence – of the categories. Fourth, in section 4-4 the data – social media messages relatedto different firms – is collected and the collection process is evaluated. In section 4-5, the data is analysed andvisualised. Section 4-6 interprets the results of the content analysis. Finally, section 4-7 concludes the findingsof this chapter.
4-1 Theoretical Level 43
4-1 Theoretical LevelThe first step in the content analysis contains theoretic notions. Hypotheses and the material to be investigatedare determined. Hypotheses are established to explicitly specify what will be researched in the analysis. Thehypotheses and the material to investigate are described in this section.
4-1-1 Hypotheses FormulationThis thesis answers three sub research questions (see page 4), of which the second question will be answered inthis chapter. From the research questions that are to be answered by means of the content analysis, hypothesesare formulated. These hypotheses explicitly state what will be investigated. In total, four hypotheses areformulated that correspond to the second research question of this thesis, i.e. In which contexts are firms ableto acquire social media data for business intelligence? As discussed in chapter 1 we specify a firm’s context ontwo dimensions. Firstly, a firm’s context is described based on its customer relation type, consisting of eitherB2C or B2B. Secondly, a firm’s context is specified by the industry in which it is active. The specification of thefirm’s context is incorporated in the hypotheses that are established in this section. Two groups of hypothesesare established; volume-related and subject-related hypotheses.
Hypotheses related to the Volume of Social Media Messages
The first topic of investigation relates to the volume of firm-related social media messages. Particularly, thevolume of messages related to firms performing different customer relations are compared. Throughout thisthesis, we distinguish two types of customer relations; B2C and B2B. As illustrated in section 1-2, it is expectedthat firms performing B2C relations are more often subject of discussion on social media than B2B firms.Firms performing B2C relations generally have more customers than B2B firms and are more visible to theend-consumer than B2C firms. We expect that these aspects influence the amount of social media messagesrelated to a firm. The reason why the volume of social media messages related to different firms is importantto investigate is the fact that social business intelligence will only be possible for a firm in case that there areactually messages created that are related to the firm. Hence, the first hypothesis is formulated as:
H1: The volume of firm-related social media messages is higher for B2C firms than for B2B firms.
Secondly, it is expected that the volume of firm-related messages differs among firms active in different industries.As illustrated in section 1-2, the nature of the products and/or services traded in different industries affectsthe rate at which products/services are sold. Therefore, we expect that firms in some industries are more oftensubject of discussion on social media than firms in other industries. For instance, retail products are morefrequently bought by people than houses. Taken into account this rational reasoning, the second hypothesis isformulated as:
H2: The volume of firm-related social media messages differs between industries.
Whereas the customer relation types have yet been operationalised by two groups (B2B or B2C), the industrytypes have not yet been established. In section 4-2, the industry categories will be established based on a genericclassification.
Hypotheses related to the Subjects of Social Media Messages
The third aspect that is investigated in the content analysis relates to the subjects of social media messages.Whereas the first two hypotheses provide insight in the existence of firm-related social media messages, thisinsight is not sufficient to draw conclusions on the applicability of social business intelligence. The subjectsof social media messages are also to be included in the analysis. It is important to research the subjects ofsocial media messages related to firms since the subjects of the messages are used to assign the messages tokey-performance indicators. As such, the subjects contained in the messages determine – in combination withthe volume – the applicability of social business intelligence for firms.
The subjects of firm-related social media messages are investigated on the same two dimensions as the volumeof the messages. The contexts of B2C firms differ from B2B contexts. It is therefore likely that the subjects
44 Content Analysis
of the messages related to B2C firms differ from the subjects of B2B related messages. So far, we do nothave strong signals that certain subjects are more often discussed in one customer category than in the other.In order to understand which type of firms can find messages related to different KPIs, the third hypothesisinvestigates whether or not the subjects of firm-related social media messages differ between firms performingdifferent customer relation types. Hence, the third hypothesis is formulated as:
H3: The subjects of firm-related social media messages differ between firms performing B2B andB2C relations.
For similar reasons that are concerned with the second hypothesis, the subjects of messages related to firmsin different industries are expected to vary. For example, it is likely that messages related to user experiencesare more frequent created in an industry that creates electronic consumer products as compared to an industrythat delivers consulting services. The subjects contained in social media messages – combined with the volumeof these messages – affect the opportunities for social business intelligence for firms. Since this thesis examinesthe opportunities for social business intelligence for different firms, it is necessary to investigate variations inthe subjects related to firms in different industries. Consequently, the last hypothesis is formulated as:
H4: The subjects of firm-related social media messages differ between industries.
The content analysis will be designed according to these hypotheses, and the results of the content analysisallow us to confirm or reject the four hypotheses. As such, we can draw conclusions on the applicability of socialbusiness intelligence for firms in different contexts.
4-1-2 Material to InvestigateThe second step in the theoretical level consists of a description of the material to be investigated. In thisthesis, we investigate social media posts that are related to firms. As described in chapter 3, different socialmedia platforms serve different purposes, leading to different type of posts. A 140 character tweet has a lowerinformation depth than e.g. a product review site. Since this research is exploratory in nature, it is valuable togain as much understanding as possible from the content posted on different social media platforms. Therefore,the material to investigate is sourced from popular social media sites in Western Europe. The content in thedataset is sourced from Twitter, Facebook’s public pages, Flickr, Newssites, Google+ public pages, (Wordpress)Blogs, Picasa, YouTube and Friendfeed.
4-2 Establishment of CategoriesIn the second step of the content analysis, the categories to be analysed are established and the sample set isdetermined. Depending on the research, the categories will differ. In this thesis, the categories that are to beanalysed consist of firms in different industries and with different customer relations. Next, the content analysisof this thesis requires categories of social media posts to draw conclusions on the applicability of social mediaposts for business intelligence.
4-2-1 Operationalising the CategoriesWe examine differences in the volume and subjects of social media messages related to firms on two nominaldimensions; (i) industries and (ii) the customer relation type. The industry dimension is operationalised bycategorising firms in different industries. The relation with end-users dimension is operationalised throughmeans of a distinction between either Business-To-Business firms or Business-To-Consumer firms.
(i) Industry ClassificationCBS (2012) – Statistics Netherlands – provides a hierarchical classification of economic activities, called SBI1.The European Union also has a classification, called NACE2, on which SBI is based. SBI allows to classifyfirms based on their economic activities. SBI distinguishes multiple levels, of which the most aggregate leveldistinguishes twenty main activities. These activities are listed in table 4-1, and are engaged to classify thefirms that have been selected in the analysis of this thesis.
1Standard Industry Classification, in Dutch Standaard Bedrijfsindeling.2Statistical Classification of Economic Activities in the European Community, in French Nomenclature statistique des Activités
économiques dans la Communauté Européenne.
4-2 Establishment of Categories 45
Table 4-1: General Classification of Firms (CBS, 2012)
IndustryA Agriculture, forestry and fisheryB Mining and quarryingC IndustryD Production and distribution of and trade in electricity, gas, steam and airE Extraction and distribution of water, sewerage, waste management and remediationF ConstructionG Wholesale and retailH Transport and storageI Accommodation, meals and drink provisionJ Information and communicationK Financial institutionsL Real estateM Consultancy, research and other specialised business servicesO Public administrationP EducationQ Health and welfareR Culture, sport and recreationS Other servicesT Households as employersU Extraterritorial organisations and bodies
(ii) Customer Relation Type Classification
As illustrated in chapter 1, the type of customer relations is likely to have an effect on the availability of socialmedia data related to a firm. Therefore, a category describing the type of customer relation is established.Based on Turban et al.’s (1999) classification of e-commerce, we classify firms in either Business-To-Business(“B2B”) or Business-To-Consumer (“B2C”). This classification will provide insight in the availability of socialmedia data related to firms based on the customer relation type.
Categories of Key-Performance Indicators
The key purpose of this thesis is to link social media posts to organisational performance. As described inchapter 2, firms measure organisational performance based on key-performance indicators. In order to drawgeneric conclusions of the applicability of social media data for the purpose of organisational performance,a generic classification of key-performance indicators is required. Section 2-2-5 illustrated that KPIs can beclassified into ten categories. We will use these categories for the classification of social media posts based onthe subjects of the messages. Table 4-2 shows the categories that are pursued in this research. In section 4-3-1these categories are described.
4-2-2 Determining the SampleOne of the objectives of this research is to investigate possible differences in the user-generated content onsocial media related to different firms. In order to spot differences, our sample exists of firms that are active indifferent industries and take different positions regarding end-users. This section describes the sample and theindustries that are part of the sample.
Selection of Firms
Based on the industry classification presented in table 4-1, eighteen firms have been selected. The starting pointof the sample selection has been the list of firms that are part of the Amsterdam stock Exchange (“AEX”). Themain reason for this selection criterion is the fact that these firms are stock listed, and hence publicise annualreports containing information about strategic initiatives, financial figures, etc. In case the analysis shows interindustry differences – e.g. between two comparable financial institutions – the annual reports may providecompany specific information (e.g. amount of employees, attitude towards social media, etc.) clarifying these
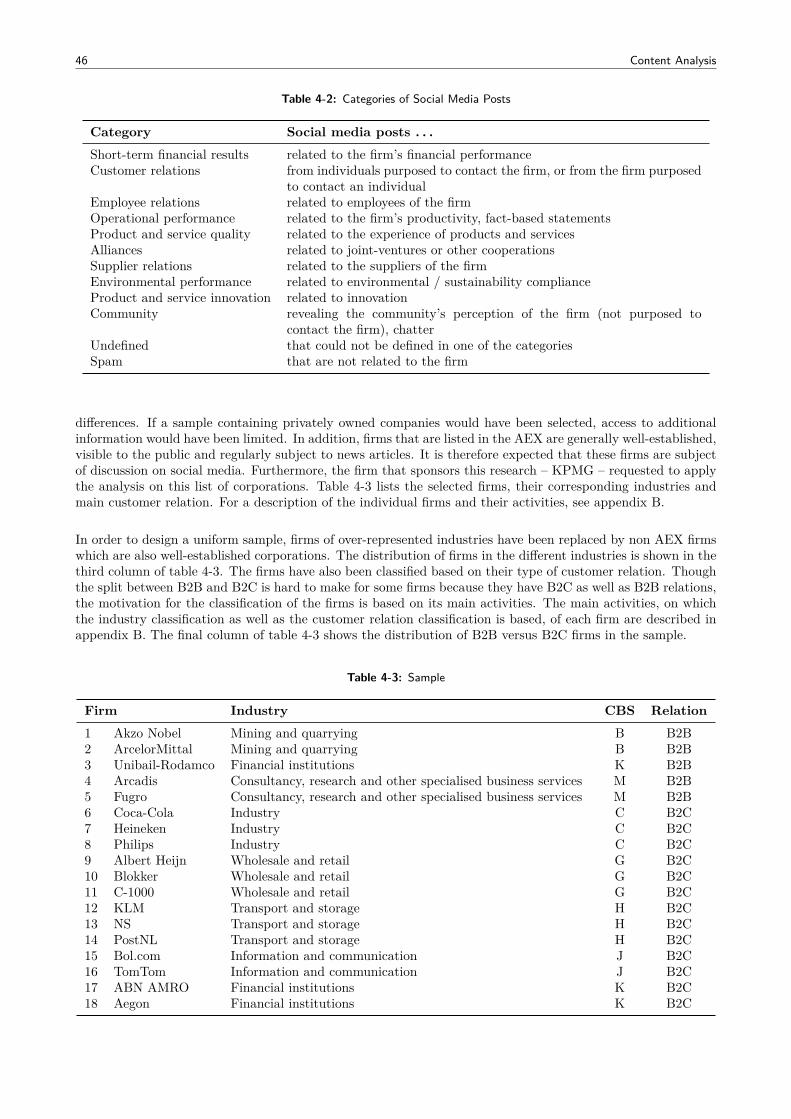
46 Content Analysis
Table 4-2: Categories of Social Media Posts
Category Social media posts . . .Short-term financial results related to the firm’s financial performanceCustomer relations from individuals purposed to contact the firm, or from the firm purposed
to contact an individualEmployee relations related to employees of the firmOperational performance related to the firm’s productivity, fact-based statementsProduct and service quality related to the experience of products and servicesAlliances related to joint-ventures or other cooperationsSupplier relations related to the suppliers of the firmEnvironmental performance related to environmental / sustainability complianceProduct and service innovation related to innovationCommunity revealing the community’s perception of the firm (not purposed to
contact the firm), chatterUndefined that could not be defined in one of the categoriesSpam that are not related to the firm
differences. If a sample containing privately owned companies would have been selected, access to additionalinformation would have been limited. In addition, firms that are listed in the AEX are generally well-established,visible to the public and regularly subject to news articles. It is therefore expected that these firms are subjectof discussion on social media. Furthermore, the firm that sponsors this research – KPMG – requested to applythe analysis on this list of corporations. Table 4-3 lists the selected firms, their corresponding industries andmain customer relation. For a description of the individual firms and their activities, see appendix B.
In order to design a uniform sample, firms of over-represented industries have been replaced by non AEX firmswhich are also well-established corporations. The distribution of firms in the different industries is shown in thethird column of table 4-3. The firms have also been classified based on their type of customer relation. Thoughthe split between B2B and B2C is hard to make for some firms because they have B2C as well as B2B relations,the motivation for the classification of the firms is based on its main activities. The main activities, on whichthe industry classification as well as the customer relation classification is based, of each firm are described inappendix B. The final column of table 4-3 shows the distribution of B2B versus B2C firms in the sample.
Table 4-3: Sample
Firm Industry CBS Relation1 Akzo Nobel Mining and quarrying B B2B2 ArcelorMittal Mining and quarrying B B2B3 Unibail-Rodamco Financial institutions K B2B4 Arcadis Consultancy, research and other specialised business services M B2B5 Fugro Consultancy, research and other specialised business services M B2B6 Coca-Cola Industry C B2C7 Heineken Industry C B2C8 Philips Industry C B2C9 Albert Heijn Wholesale and retail G B2C10 Blokker Wholesale and retail G B2C11 C-1000 Wholesale and retail G B2C12 KLM Transport and storage H B2C13 NS Transport and storage H B2C14 PostNL Transport and storage H B2C15 Bol.com Information and communication J B2C16 TomTom Information and communication J B2C17 ABN AMRO Financial institutions K B2C18 Aegon Financial institutions K B2C
4-2 Establishment of Categories 47
Description of the Industries
The sample consists of firms active in seven different industries. As indicated, the industry classification isbased on CBS’ (2012) Standard Industry Classification. A description of the industries that are part of thesample is presented in this section.
1. Mining and QuarryingThe activities of firms in the mining and quarrying industry are concerned with the extraction of oil, gasand/or minerals such as sand, gravel and clay.
2. IndustryIndustry firms are producers of food, beverages, tobacco, textile, chemical products, pharmaceutical rawmaterials, metal, electric products, machines, cars, other transport modes, furniture and other products.
3. Wholesale and RetailThe industry wholesale and retail consists of firms trading in cars, food, machinery, agricultural products,textile, books, and other consumer products. In addition, firms in this industry operate shops in whichconsumers can buy their products.
4. Transport and StorageThe activities of firms that are active in the transport and storage industry transport persons or productsacross land, water, air or other transport modes. Next, firms in this industry store products. Also, mailrelated activities belong to the transport and storage industry.
5. Information and CommunicationFirms in the information and communication industry are publishers of books, papers, magazines, softwareand computer games. In addition, the production and distribution of films, music and television showsare assigned to the information and communication industry. Also telecommunication activities, whetherthrough wires, wireless, satellite or other mediums are assigned to the information and communicationindustry. All software related activities required for telecommunications are part of the information andcommunication industry.
6. Financial InstitutionsThe industry financial institutions consists of banks, financial holdings, investment institutions, insurancecompanies, pension companies, asset management companies and other financial firms.
7. Consultancy, Research and Other Specialised Business ServicesThe activities of firms in the consultancy, research and other specialised business services relate to advisoryservices on different domains. Examples of firm types in this industry are law firms, accountancy firms,engineering firms, architects, marketing firms, research firms, etcetera.
4-2-3 Description of the Measuring PerioduberVU, one of the emerging social media monitoring and analysis tools has granted access to their tool for aperiod of 14 consecutive days, i.e. from Friday 20 July to Thursday 2 August. This tool is further described insection 4-4-2. During the measuring period the eighteen firms have been monitored, resulting in the collectionof 224.687 social media posts related to different firms. This amount of messages is deemed sufficient to analysewhat the subjects of social media messages related to firms are, and how these subjects differ in volume fromeach other, which is the purpose of this chapter. During 7 of the 14 days in the period, the 2012 Olympic Gamestook place. As a consequence, the social media posts of firms that are for some reason – e.g. as a sponsor –involved in the Olympic Games often have the Olympic Games as a subject of the post. It is common for firmsto sponsor events. In case the social media messages would have been collected during another period, it is likelythat some firms were sponsoring an event as well during the measurement period. Furthermore, the summerholidays took place during the measurement period. Though people undertake other activities during theirholidays, and hence may show different activities on social media as well, it is not likely that large corporations– i.e. the ones in our sample – are not subject of discussion during this period. On the contrary, some firms willprecisely be mentioned during this period. However, when interpreting the results after the analyses, one shouldbe aware of the fact that the social media messages at which the conclusions are based have been created duringa holiday period. Furthermore, conclusions related to the procedure of social business intelligence will not beaffected by the fact that the data are created during a holiday period, since the way of collecting, processingand analysing the data will be the same in any period.
48 Content Analysis
4-3 PretestIn step 3 of the content analysis – see figure 4-1 –, the data collection is tested to ensure that the establishedcategories can be filled with data from the selected sample. To validate the categories that were established toclassify social media posts, we pretest the categories that are presented in table 4-2 by classifying the first 100messages of each respondent. Each of the pretest social media posts have been read and consequently assignedto one of the categories. The sample illustrated that some of the categories were too generic. Therefore, weadded sub categories to some of main categories to gain more insight in the nature of the social media posts.The categories of social media posts are discussed in the following section.
4-3-1 Categories of Social Media PostsThe purpose of this thesis is to assign social media posts to key-performance indicators. To achieve this, weapply the classification scheme of Ittner et al. (2003) to distinguish key-performance indicators from each other.This classification scheme distinguishes ten key-performance indicator categories. Basically, we adhere to theseten categories. However, as we have experienced in the pretest, social media posts within one category are tooheterogeneous to simply assign the social media post to the high-level classification that distinguishes betweenten categories. Therefore, an additional level of detail has been assigned to some of the main categories. Thisadditional level of detail has been established based on the pretest of the categories. Thus, the empirical datahas driven the establishment of these categories. The naming of these – more detailed – sub categories representthe nature of the social media posts as well as possible. In the following section we discuss the categories of thesocial media posts, which are based on the the KPI classification of Ittner et al. (2003).
1. Short-term financial results
The first KPI category consists of indicators representing the (short-term) financial performance of the firm.Financial indicators are typically measured by firms using internal systems. In other words, there is no externalinfluence required to measure these metrics. Though the added value of the information of social media postsrelated to financial results may be of little value for the firm (management has financial results earlier availablethan the firm’s environment), it is wise to classify these social media posts nevertheless to provide an ascomplete overview as possible of the type of social media posts that are available for firms. Typical examples offinancial indicators are the number of sales in a certain period, amount of debt on a certain moment, operatingexpenditures in a certain period, etc. Social media posts that can be classified into this category relate to thefirm’s financial performance. As we have experienced in the pretest, social media posts related to financialaspects of a firm are either related to discussions of the performance of a firm, or related to the firm’s shareprices. Accordingly, these two categories have been added as sub categories. These two sub categories arediscussed in the following sections.
1.1 Financial performance discussions
Social media are used to discuss the financial performance of a firm. Often, posts related to financial performancecontain a factual statement of the firm’s performance, which is sometimes followed by an opinion of the creatorof the post. In addition, these type of social media posts often contain a hyperlink to a website at which thefinancial performance is further analysed. The following two example posts that consist in our sample illustratethe type of posts that are classified as financial performance discussions posts:
“Akzo Nobel Q2 Profit Takes 21.5% Hit on Restructuring Charges http://t.co/b1518IDQ”.
“STEEL RESULTS: #ArcelorMittal Flat Carbon #Europe reports Q2 earnings fall http://t.co/0nPq7VjM#steel”.
The existence of financial performance related discussions in our sample data is due to the selection of thefirms in our sample. As discussed in section 4-2-2, the sample firms are based on stock listed companies.These companies are public limited liability firms, hence required to publicise their financial performance on aregular basis by law. Since the financial performance is publicly available, it makes that these firms’ financialperformance are subject of discussion on social media. In case that our sample would have consisted of limitedcompanies, which are not required to publicise their financial position, we would probably not have found socialmedia posts related to financial performance in the dataset.
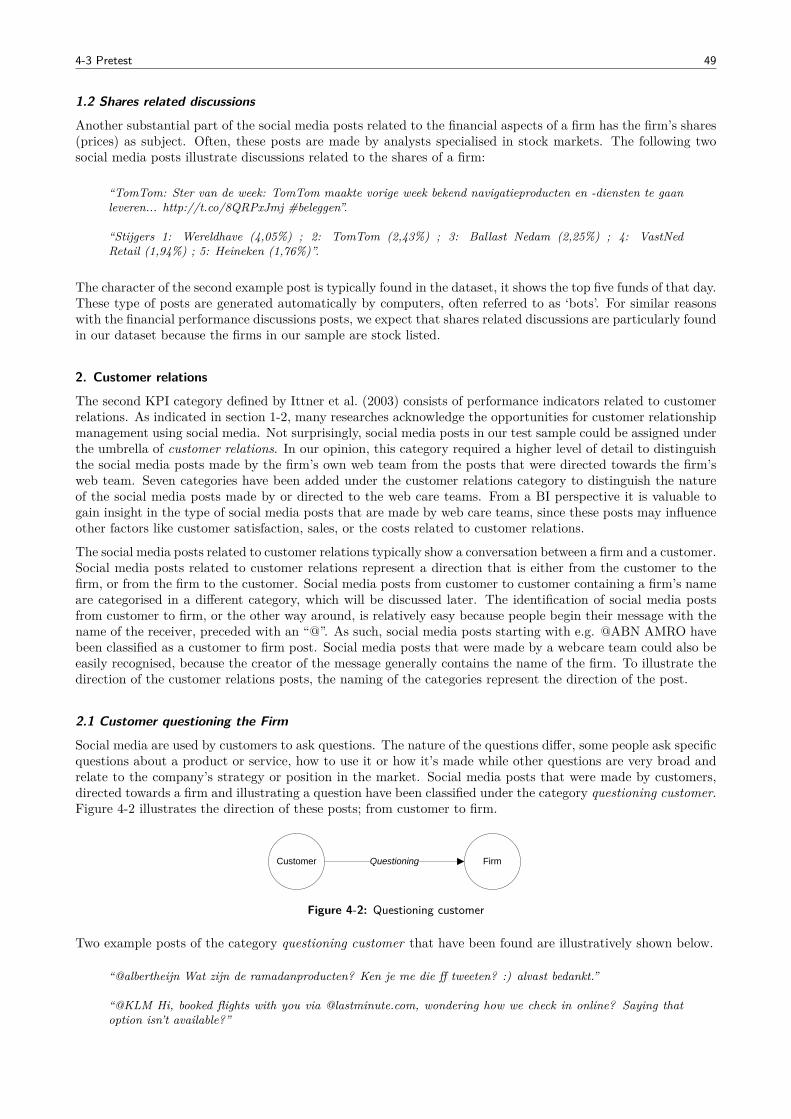
4-3 Pretest 49
1.2 Shares related discussions
Another substantial part of the social media posts related to the financial aspects of a firm has the firm’s shares(prices) as subject. Often, these posts are made by analysts specialised in stock markets. The following twosocial media posts illustrate discussions related to the shares of a firm:
“TomTom: Ster van de week: TomTom maakte vorige week bekend navigatieproducten en -diensten te gaanleveren... http://t.co/8QRPxJmj #beleggen”.
“Stijgers 1: Wereldhave (4,05%) ; 2: TomTom (2,43%) ; 3: Ballast Nedam (2,25%) ; 4: VastNedRetail (1,94%) ; 5: Heineken (1,76%)”.
The character of the second example post is typically found in the dataset, it shows the top five funds of that day.These type of posts are generated automatically by computers, often referred to as ‘bots’. For similar reasonswith the financial performance discussions posts, we expect that shares related discussions are particularly foundin our dataset because the firms in our sample are stock listed.
2. Customer relations
The second KPI category defined by Ittner et al. (2003) consists of performance indicators related to customerrelations. As indicated in section 1-2, many researches acknowledge the opportunities for customer relationshipmanagement using social media. Not surprisingly, social media posts in our test sample could be assigned underthe umbrella of customer relations. In our opinion, this category required a higher level of detail to distinguishthe social media posts made by the firm’s own web team from the posts that were directed towards the firm’sweb team. Seven categories have been added under the customer relations category to distinguish the natureof the social media posts made by or directed to the web care teams. From a BI perspective it is valuable togain insight in the type of social media posts that are made by web care teams, since these posts may influenceother factors like customer satisfaction, sales, or the costs related to customer relations.
The social media posts related to customer relations typically show a conversation between a firm and a customer.Social media posts related to customer relations represent a direction that is either from the customer to thefirm, or from the firm to the customer. Social media posts from customer to customer containing a firm’s nameare categorised in a different category, which will be discussed later. The identification of social media postsfrom customer to firm, or the other way around, is relatively easy because people begin their message with thename of the receiver, preceded with an “@”. As such, social media posts starting with e.g. @ABN AMRO havebeen classified as a customer to firm post. Social media posts that were made by a webcare team could also beeasily recognised, because the creator of the message generally contains the name of the firm. To illustrate thedirection of the customer relations posts, the naming of the categories represent the direction of the post.
2.1 Customer questioning the Firm
Social media are used by customers to ask questions. The nature of the questions differ, some people ask specificquestions about a product or service, how to use it or how it’s made while other questions are very broad andrelate to the company’s strategy or position in the market. Social media posts that were made by customers,directed towards a firm and illustrating a question have been classified under the category questioning customer.Figure 4-2 illustrates the direction of these posts; from customer to firm.
CustomerFirm Explaining
CustomerFirm Understanding
CustomerFirm Thanking
CustomersFirm Informing
FirmCustomer Questioning
FirmCustomer Complaining
FirmCustomer Thanking
Figure 4-2: Questioning customer
Two example posts of the category questioning customer that have been found are illustratively shown below.
“@albertheijn Wat zijn de ramadanproducten? Ken je me die ff tweeten? :) alvast bedankt.”
“@KLM Hi, booked flights with you via @lastminute.com, wondering how we check in online? Saying thatoption isn’t available?”
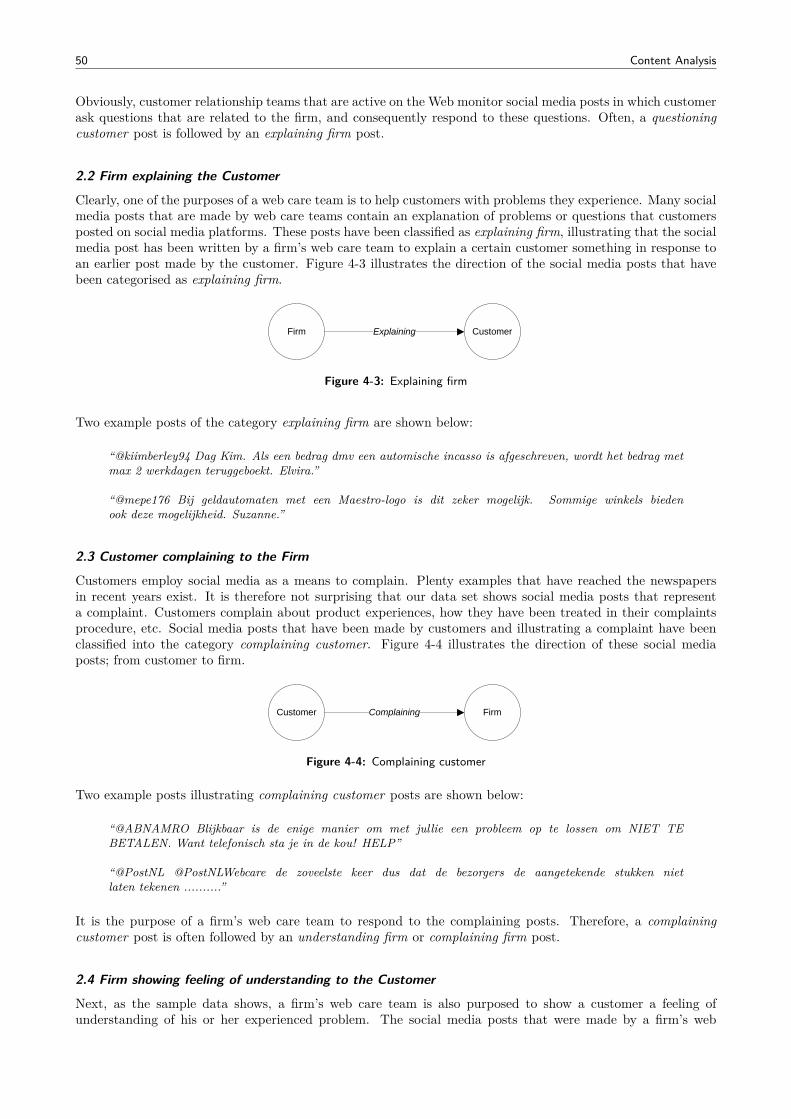
50 Content Analysis
Obviously, customer relationship teams that are active on the Web monitor social media posts in which customerask questions that are related to the firm, and consequently respond to these questions. Often, a questioningcustomer post is followed by an explaining firm post.
2.2 Firm explaining the Customer
Clearly, one of the purposes of a web care team is to help customers with problems they experience. Many socialmedia posts that are made by web care teams contain an explanation of problems or questions that customersposted on social media platforms. These posts have been classified as explaining firm, illustrating that the socialmedia post has been written by a firm’s web care team to explain a certain customer something in response toan earlier post made by the customer. Figure 4-3 illustrates the direction of the social media posts that havebeen categorised as explaining firm.
CustomerFirm Explaining
CustomerFirm Understanding
CustomerFirm Thanking
CustomersFirm Informing
FirmCustomer Questioning
FirmCustomer Complaining
FirmCustomer Thanking
Figure 4-3: Explaining firm
Two example posts of the category explaining firm are shown below:
“@kiimberley94 Dag Kim. Als een bedrag dmv een automische incasso is afgeschreven, wordt het bedrag metmax 2 werkdagen teruggeboekt. Elvira.”
“@mepe176 Bij geldautomaten met een Maestro-logo is dit zeker mogelijk. Sommige winkels biedenook deze mogelijkheid. Suzanne.”
2.3 Customer complaining to the Firm
Customers employ social media as a means to complain. Plenty examples that have reached the newspapersin recent years exist. It is therefore not surprising that our data set shows social media posts that representa complaint. Customers complain about product experiences, how they have been treated in their complaintsprocedure, etc. Social media posts that have been made by customers and illustrating a complaint have beenclassified into the category complaining customer. Figure 4-4 illustrates the direction of these social mediaposts; from customer to firm.
CustomerFirm Explaining
CustomerFirm Understanding
CustomerFirm Thanking
CustomersFirm Informing
FirmCustomer Questioning
FirmCustomer Complaining
FirmCustomer Thanking
Figure 4-4: Complaining customer
Two example posts illustrating complaining customer posts are shown below:
“@ABNAMRO Blijkbaar is de enige manier om met jullie een probleem op te lossen om NIET TEBETALEN. Want telefonisch sta je in de kou! HELP”
“@PostNL @PostNLWebcare de zoveelste keer dus dat de bezorgers de aangetekende stukken nietlaten tekenen ..........”
It is the purpose of a firm’s web care team to respond to the complaining posts. Therefore, a complainingcustomer post is often followed by an understanding firm or complaining firm post.
2.4 Firm showing feeling of understanding to the Customer
Next, as the sample data shows, a firm’s web care team is also purposed to show a customer a feeling ofunderstanding of his or her experienced problem. The social media posts that were made by a firm’s web
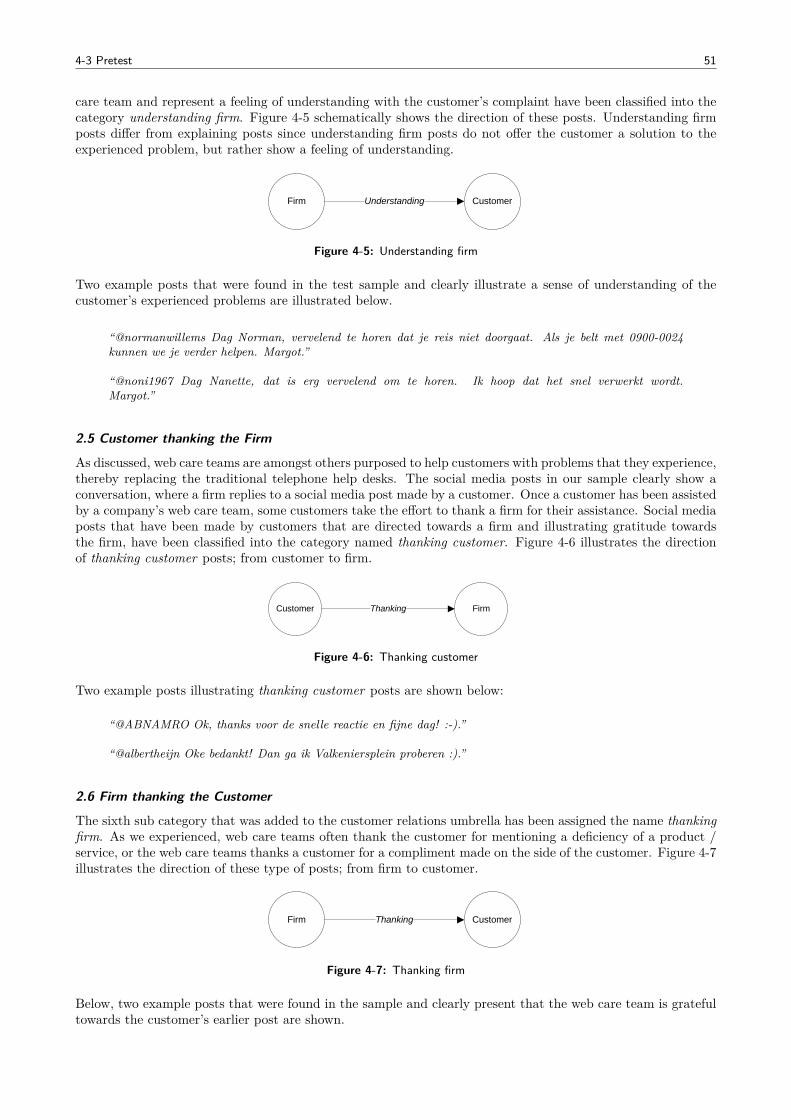
4-3 Pretest 51
care team and represent a feeling of understanding with the customer’s complaint have been classified into thecategory understanding firm. Figure 4-5 schematically shows the direction of these posts. Understanding firmposts differ from explaining posts since understanding firm posts do not offer the customer a solution to theexperienced problem, but rather show a feeling of understanding.
CustomerFirm Explaining
CustomerFirm Understanding
CustomerFirm Thanking
CustomersFirm Informing
FirmCustomer Questioning
FirmCustomer Complaining
FirmCustomer Thanking
Figure 4-5: Understanding firm
Two example posts that were found in the test sample and clearly illustrate a sense of understanding of thecustomer’s experienced problems are illustrated below.
“@normanwillems Dag Norman, vervelend te horen dat je reis niet doorgaat. Als je belt met 0900-0024kunnen we je verder helpen. Margot.”
“@noni1967 Dag Nanette, dat is erg vervelend om te horen. Ik hoop dat het snel verwerkt wordt.Margot.”
2.5 Customer thanking the Firm
As discussed, web care teams are amongst others purposed to help customers with problems that they experience,thereby replacing the traditional telephone help desks. The social media posts in our sample clearly show aconversation, where a firm replies to a social media post made by a customer. Once a customer has been assistedby a company’s web care team, some customers take the effort to thank a firm for their assistance. Social mediaposts that have been made by customers that are directed towards a firm and illustrating gratitude towardsthe firm, have been classified into the category named thanking customer. Figure 4-6 illustrates the directionof thanking customer posts; from customer to firm.
CustomerFirm Explaining
CustomerFirm Understanding
CustomerFirm Thanking
CustomersFirm Informing
FirmCustomer Questioning
FirmCustomer Complaining
FirmCustomer Thanking
Figure 4-6: Thanking customer
Two example posts illustrating thanking customer posts are shown below:
“@ABNAMRO Ok, thanks voor de snelle reactie en fijne dag! :-).”
“@albertheijn Oke bedankt! Dan ga ik Valkeniersplein proberen :).”
2.6 Firm thanking the Customer
The sixth sub category that was added to the customer relations umbrella has been assigned the name thankingfirm. As we experienced, web care teams often thank the customer for mentioning a deficiency of a product /service, or the web care teams thanks a customer for a compliment made on the side of the customer. Figure 4-7illustrates the direction of these type of posts; from firm to customer.
CustomerFirm Explaining
CustomerFirm Understanding
CustomerFirm Thanking
CustomersFirm Informing
FirmCustomer Questioning
FirmCustomer Complaining
FirmCustomer Thanking
Figure 4-7: Thanking firm
Below, two example posts that were found in the sample and clearly present that the web care team is gratefultowards the customer’s earlier post are shown.
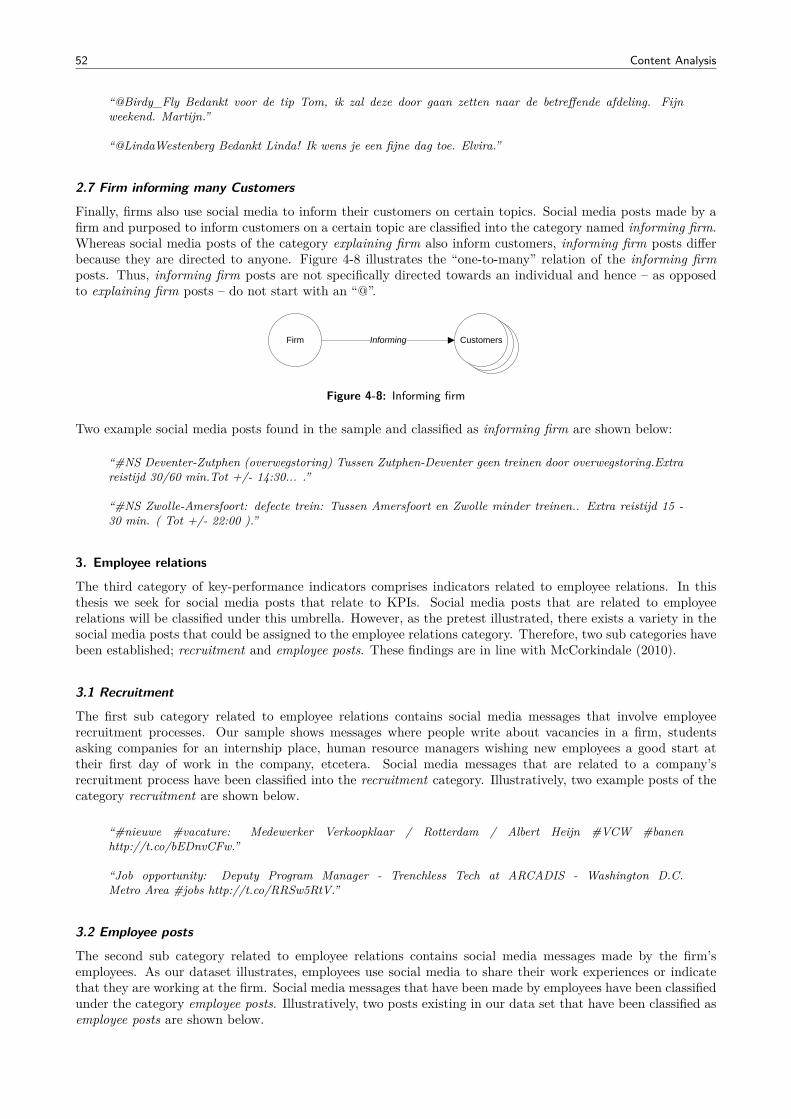
52 Content Analysis
“@Birdy_Fly Bedankt voor de tip Tom, ik zal deze door gaan zetten naar de betreffende afdeling. Fijnweekend. Martijn.”
“@LindaWestenberg Bedankt Linda! Ik wens je een fijne dag toe. Elvira.”
2.7 Firm informing many Customers
Finally, firms also use social media to inform their customers on certain topics. Social media posts made by afirm and purposed to inform customers on a certain topic are classified into the category named informing firm.Whereas social media posts of the category explaining firm also inform customers, informing firm posts differbecause they are directed to anyone. Figure 4-8 illustrates the “one-to-many” relation of the informing firmposts. Thus, informing firm posts are not specifically directed towards an individual and hence – as opposedto explaining firm posts – do not start with an “@”.
CustomerFirm Explaining
CustomerFirm Understanding
CustomerFirm Thanking
CustomersFirm Informing
FirmCustomer Questioning
FirmCustomer Complaining
FirmCustomer Thanking
Figure 4-8: Informing firm
Two example social media posts found in the sample and classified as informing firm are shown below:
“#NS Deventer-Zutphen (overwegstoring) Tussen Zutphen-Deventer geen treinen door overwegstoring.Extrareistijd 30/60 min.Tot +/- 14:30... .”
“#NS Zwolle-Amersfoort: defecte trein: Tussen Amersfoort en Zwolle minder treinen.. Extra reistijd 15 -30 min. ( Tot +/- 22:00 ).”
3. Employee relations
The third category of key-performance indicators comprises indicators related to employee relations. In thisthesis we seek for social media posts that relate to KPIs. Social media posts that are related to employeerelations will be classified under this umbrella. However, as the pretest illustrated, there exists a variety in thesocial media posts that could be assigned to the employee relations category. Therefore, two sub categories havebeen established; recruitment and employee posts. These findings are in line with McCorkindale (2010).
3.1 Recruitment
The first sub category related to employee relations contains social media messages that involve employeerecruitment processes. Our sample shows messages where people write about vacancies in a firm, studentsasking companies for an internship place, human resource managers wishing new employees a good start attheir first day of work in the company, etcetera. Social media messages that are related to a company’srecruitment process have been classified into the recruitment category. Illustratively, two example posts of thecategory recruitment are shown below.
“#nieuwe #vacature: Medewerker Verkoopklaar / Rotterdam / Albert Heijn #VCW #banenhttp://t.co/bEDnvCFw.”
“Job opportunity: Deputy Program Manager - Trenchless Tech at ARCADIS - Washington D.C.Metro Area #jobs http://t.co/RRSw5RtV.”
3.2 Employee posts
The second sub category related to employee relations contains social media messages made by the firm’semployees. As our dataset illustrates, employees use social media to share their work experiences or indicatethat they are working at the firm. Social media messages that have been made by employees have been classifiedunder the category employee posts. Illustratively, two posts existing in our data set that have been classified asemployee posts are shown below.
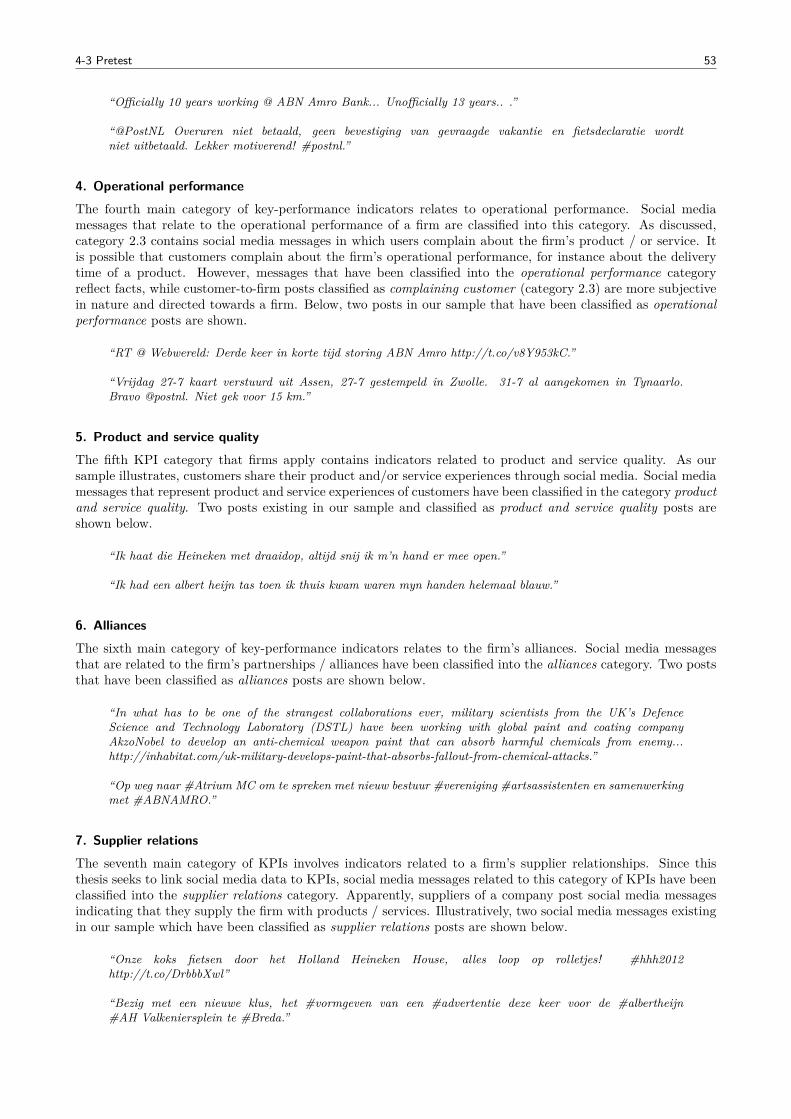
4-3 Pretest 53
“Officially 10 years working @ ABN Amro Bank... Unofficially 13 years.. .”
“@PostNL Overuren niet betaald, geen bevestiging van gevraagde vakantie en fietsdeclaratie wordtniet uitbetaald. Lekker motiverend! #postnl.”
4. Operational performanceThe fourth main category of key-performance indicators relates to operational performance. Social mediamessages that relate to the operational performance of a firm are classified into this category. As discussed,category 2.3 contains social media messages in which users complain about the firm’s product / or service. Itis possible that customers complain about the firm’s operational performance, for instance about the deliverytime of a product. However, messages that have been classified into the operational performance categoryreflect facts, while customer-to-firm posts classified as complaining customer (category 2.3) are more subjectivein nature and directed towards a firm. Below, two posts in our sample that have been classified as operationalperformance posts are shown.
“RT @ Webwereld: Derde keer in korte tijd storing ABN Amro http://t.co/v8Y953kC.”
“Vrijdag 27-7 kaart verstuurd uit Assen, 27-7 gestempeld in Zwolle. 31-7 al aangekomen in Tynaarlo.Bravo @postnl. Niet gek voor 15 km.”
5. Product and service qualityThe fifth KPI category that firms apply contains indicators related to product and service quality. As oursample illustrates, customers share their product and/or service experiences through social media. Social mediamessages that represent product and service experiences of customers have been classified in the category productand service quality. Two posts existing in our sample and classified as product and service quality posts areshown below.
“Ik haat die Heineken met draaidop, altijd snij ik m’n hand er mee open.”
“Ik had een albert heijn tas toen ik thuis kwam waren myn handen helemaal blauw.”
6. AlliancesThe sixth main category of key-performance indicators relates to the firm’s alliances. Social media messagesthat are related to the firm’s partnerships / alliances have been classified into the alliances category. Two poststhat have been classified as alliances posts are shown below.
“In what has to be one of the strangest collaborations ever, military scientists from the UK’s DefenceScience and Technology Laboratory (DSTL) have been working with global paint and coating companyAkzoNobel to develop an anti-chemical weapon paint that can absorb harmful chemicals from enemy...http://inhabitat.com/uk-military-develops-paint-that-absorbs-fallout-from-chemical-attacks.”
“Op weg naar #Atrium MC om te spreken met nieuw bestuur #vereniging #artsassistenten en samenwerkingmet #ABNAMRO.”
7. Supplier relationsThe seventh main category of KPIs involves indicators related to a firm’s supplier relationships. Since thisthesis seeks to link social media data to KPIs, social media messages related to this category of KPIs have beenclassified into the supplier relations category. Apparently, suppliers of a company post social media messagesindicating that they supply the firm with products / services. Illustratively, two social media messages existingin our sample which have been classified as supplier relations posts are shown below.
“Onze koks fietsen door het Holland Heineken House, alles loop op rolletjes! #hhh2012http://t.co/DrbbbXwl”
“Bezig met een nieuwe klus, het #vormgeven van een #advertentie deze keer voor de #albertheijn#AH Valkeniersplein te #Breda.”
54 Content Analysis
8. Environmental performanceThe next main category of key-performance indicators involves indicators reflecting the firm’s environmentalperformance. Social media messages relating to the environmental performance of firms have been classifiedinto this category. The dataset shows social media messages in which consumers discuss the environmentalresponsibility of the company. Below, two posts existing in our dataset that have been classified as environmentalperformance posts are shown.
“We kunnen heel veel bijdragen aan ontwikkelingen op het gebied van duurzaamheid... aldus Albert Heijn.Ze verkopen uien uit Australië #AH.”
“@GreenpeaceNL - olijfolie v @albertheijn zit tegenw. in plastic “samen meer doen voor het milieu”-> is t idd beter? http://t.co/2vLBda61.”
9. Product and service innovationThe ninth main category of key-performance indicators involves indicators related to product and serviceinnovation. As illustrated in section 3-2-3, social media are used by consumers to share product experiencesand to suggest innovations. The process of co-creation and prosuming is shown in our dataset as well. Socialmedia messages that reflect people’s attitude to new products or services or contain suggestions for innovationshave been classified as product and service innovations, of which two posts are illustratively shown below.
“Best Reviews - Philips Sonicare HX6732/02 HealthyWhite R732 Rechargeable Electric Toothbrush -http://maxtodaystore.info/today-p... .”
“Moe worden van #ABN-AMRO bank geld overmaken steeds weer die achterlijke reader nodig , neem eenvoorbeeld aan tan- codes van #ING!!”
10. CommunityThe tenth and final main category of key-performance indicators related to indicators related to the firm’scommunity. Social media posts belonging to the category community reveal how the community, that is,external actors, perceive the firm. Many social media posts in the pretest could be assigned under the communitycategory. However, to provide more detail in the type of social media posts related to the community category,we established five sub categories to the community category. These sub categories are discussed in the followingsections.
10.1 PromotionSome social media posts in our sample were created by firms themselves, and are hence not perceived asuser-generated content from a firm point of view. Social media messages that were made by firms themselvesand were purposed to promote the firm to the environment, were assigned to the sub category named promotion.The following two posts illustrate promotion activities of a firm:
“What do you want to do more of in retirement? Travel, spend time with family, pursue hobbies, or moreeducation? Check out the results from the quick poll here!”
“Albert Heijn - Kom op 18,19,25 en 26 aug. naar de Open Dagen van onze boeren en telers.http://t.co/Saiv2aWY http://t.co/bmP1CePw.”
10.2 NewsThe test sample illustrated that many social media posts are (simply) notifications of news articles. Wepositioned these posts under the category community since news messages determine the firm’s exposure tothe firm’s community. Posts belonging to the sub category news are written by professionals, which are mostlyjournalists promoting their news article. Below, two examples of news categorised social media posts are shown.
“En verder in de serie vakantiebaantjes vandaag: Gerrit Zalm, waarmee verdiende de baas van #abnamrozijn eerste centjes? #BNR.”
“@huizenprijzen: Han de Jong (Chief Economist ABN AMRO) : "Er is weinig in dit leven zo gevaarlijk alsschuld" : http://t.co/VOTreLdg via @youtube #schuld.”
4-3 Pretest 55
10.3 Public imageThirdly, the sample test illustrated that individuals share their attitude towards a firm through means of socialmedia. We classify these posts into a sub category named public image. Social media posts classified into thepublic image category are not directed towards a firm, or, not purposed to get in contact with the firm. Rather,social media messages assigned in the public image category represent discussions and “chatter” amongst thesocial media users, in which the topic of discussion is the firm or its products / services. Public image posts arewritten by non-professionals, while – as we will see in the next sub category – posts created by professionalsare assigned into a separate sub category. Below, two example posts that were found in the sample set andrepresent the public’s image towards the firm are shown.
“Even kijken of blokker kruimeltje de film heeft liggen want ik heb m alleen nog maar op video band!”
“Je moet staatsbanken ABNAMRO en ING 15% betalen als je rood staat op je betaalrekening en jekrijgt 2% als je + staat #Schurkenbanken.”
10.4 ProfessionalsFourth, our pretest indicated that there are social media messages created by professionals. Messages that havebeen created on social media by external professionals – not from the company – and talking about the firmhave been classified into the category labelled professionals. Two example posts of this category are:
“Presentatie @ jaccooudhof van #KPMGmkb op de "Kengetallenbijeenkomst" van @ FullFinance @ABNAMRO en NOVAK”
“Sarah Harding interviews Arcadis at the A&WMA conference in San Antonio.”
10.5 DistributorsFinally, the data showed that social media are also used to promote products. However, the firm that producesdoes not have to be necessarily the one that promotes the product. Our dataset contains social media postsmade by distributors of the product. These posts have been classified into the category labelled distributors.Two example posts of distributors are shown below.
“Macco Akzo Nobel Pai DWP24 Liquid Nails Drywall Construction Adhesive: Specially formulated latexproduct for in... http://t.co/Vk3PdXLR”
“Best Offer - Philips Norelco AT830 PowerTouch Rechargeable Cordless Razor, Gray/Silver/Black -http://maxtodaystore.info/weekly-...”
UndefinedBased on the 26 social media post categories (including main categories) that have been established in theprevious sections, we can not classify all social media posts. As discussed before, social media data isunstructured and the interpretation of a social media post is not always easy. Therefore, messages that –despite of the mentioning of the firm’s name in the post – could not be assigned to one of the categories havebeen assigned into the undefined category. Two examples of posts that were undefined are:
“Volg ons (Unicum) @ ABN AMRO bij zuidplein om 13 : 00 !!!!! RT RT.”
“Nu naar fietsenwinkel, blokker en c1000 met pap en mam!”
SpamUnfortunately, the search queries that were used to scrape the social media content did still result in thecollection of data that is totally unrelated to the firm. This is due to the fact that people’s names or IDs aresimilar to the firm’s name. Social media posts that were totally unrelated to the firm have been classified asspam, of which two examples are shown below:
“@Klm_babe Okay well maybe sometime next week then :)”
“@Jack_Heineken meen je dat nou? -_- :p een korte broek aan naar de zaak :p”
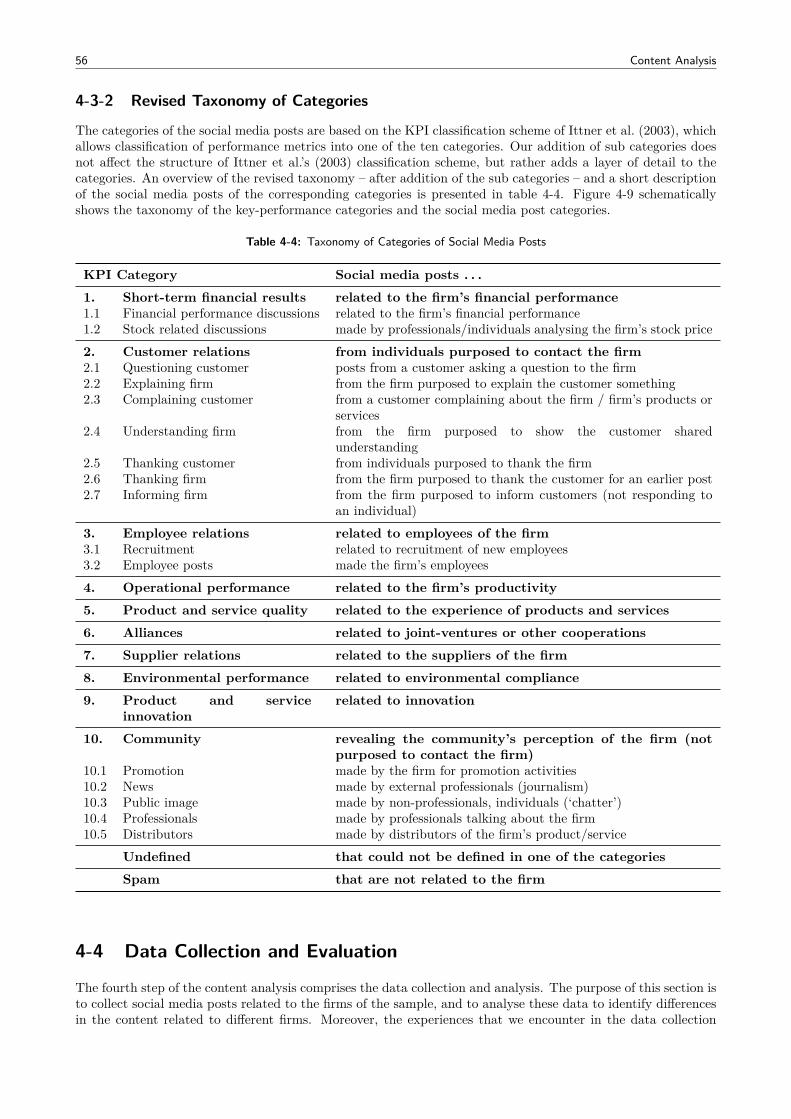
56 Content Analysis
4-3-2 Revised Taxonomy of Categories
The categories of the social media posts are based on the KPI classification scheme of Ittner et al. (2003), whichallows classification of performance metrics into one of the ten categories. Our addition of sub categories doesnot affect the structure of Ittner et al.’s (2003) classification scheme, but rather adds a layer of detail to thecategories. An overview of the revised taxonomy – after addition of the sub categories – and a short descriptionof the social media posts of the corresponding categories is presented in table 4-4. Figure 4-9 schematicallyshows the taxonomy of the key-performance categories and the social media post categories.
Table 4-4: Taxonomy of Categories of Social Media Posts
KPI Category Social media posts . . .1. Short-term financial results related to the firm’s financial performance1.1 Financial performance discussions related to the firm’s financial performance1.2 Stock related discussions made by professionals/individuals analysing the firm’s stock price2. Customer relations from individuals purposed to contact the firm2.1 Questioning customer posts from a customer asking a question to the firm2.2 Explaining firm from the firm purposed to explain the customer something2.3 Complaining customer from a customer complaining about the firm / firm’s products or
services2.4 Understanding firm from the firm purposed to show the customer shared
understanding2.5 Thanking customer from individuals purposed to thank the firm2.6 Thanking firm from the firm purposed to thank the customer for an earlier post2.7 Informing firm from the firm purposed to inform customers (not responding to
an individual)3. Employee relations related to employees of the firm3.1 Recruitment related to recruitment of new employees3.2 Employee posts made the firm’s employees4. Operational performance related to the firm’s productivity5. Product and service quality related to the experience of products and services6. Alliances related to joint-ventures or other cooperations7. Supplier relations related to the suppliers of the firm8. Environmental performance related to environmental compliance9. Product and service
innovationrelated to innovation
10. Community revealing the community’s perception of the firm (notpurposed to contact the firm)
10.1 Promotion made by the firm for promotion activities10.2 News made by external professionals (journalism)10.3 Public image made by non-professionals, individuals (‘chatter’)10.4 Professionals made by professionals talking about the firm10.5 Distributors made by distributors of the firm’s product/service
Undefined that could not be defined in one of the categoriesSpam that are not related to the firm
4-4 Data Collection and Evaluation
The fourth step of the content analysis comprises the data collection and analysis. The purpose of this section isto collect social media posts related to the firms of the sample, and to analyse these data to identify differencesin the content related to different firms. Moreover, the experiences that we encounter in the data collection
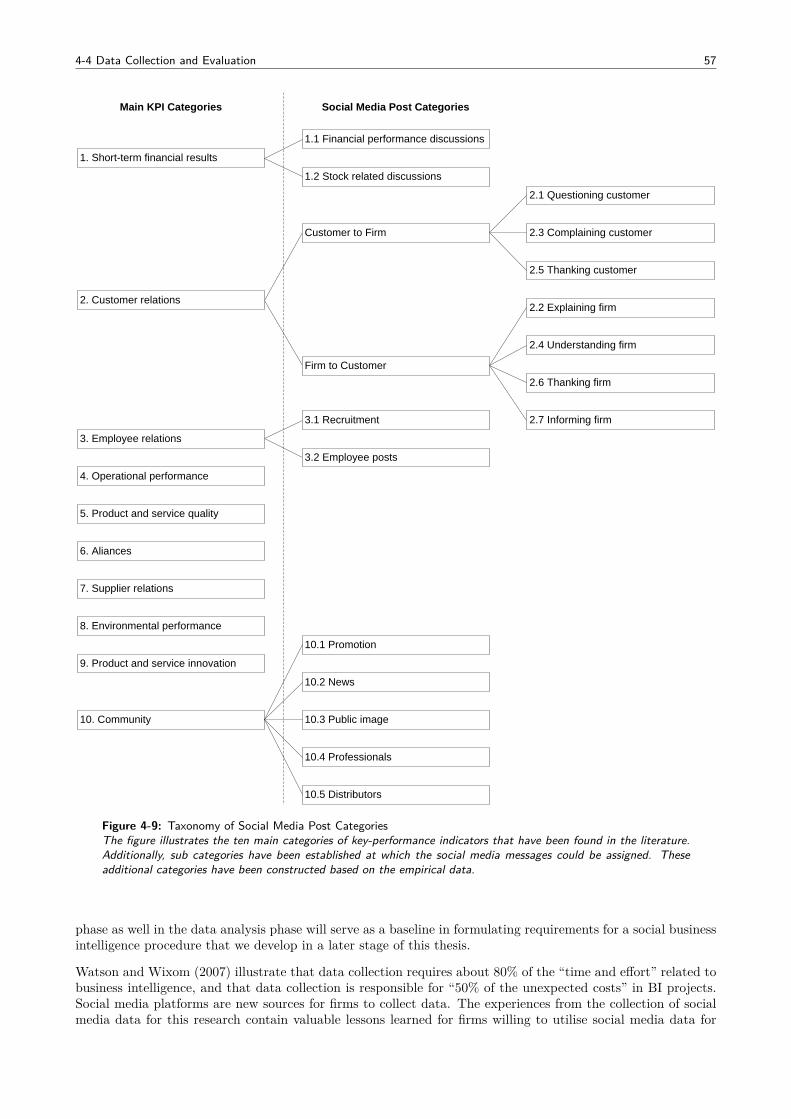
4-4 Data Collection and Evaluation 57
1. Short-term financial results
4. Operational performance
5. Product and service quality
6. Aliances
7. Supplier relations
8. Environmental performance
9. Product and service innovation
10. Community
10.2 News
10.1 Promotion
1.1 Financial performance discussions
10.3 Public image
2. Customer relations
Customer to Firm
Firm to Customer
2.3 Complaining customer
2.1 Questioning customer
2.5 Thanking customer
2.6 Thanking firm
2.4 Understanding firm
2.7 Informing firm
Main KPI Categories Social Media Post Categories
3. Employee relations
3.1 Recruitment
3.2 Employee posts
10.4 Professionals
10.5 Distributors
2.2 Explaining firm
1.2 Stock related discussions
Figure 4-9: Taxonomy of Social Media Post CategoriesThe figure illustrates the ten main categories of key-performance indicators that have been found in the literature.Additionally, sub categories have been established at which the social media messages could be assigned. Theseadditional categories have been constructed based on the empirical data.
phase as well in the data analysis phase will serve as a baseline in formulating requirements for a social businessintelligence procedure that we develop in a later stage of this thesis.
Watson and Wixom (2007) illustrate that data collection requires about 80% of the “time and effort” related tobusiness intelligence, and that data collection is responsible for “50% of the unexpected costs” in BI projects.Social media platforms are new sources for firms to collect data. The experiences from the collection of socialmedia data for this research contain valuable lessons learned for firms willing to utilise social media data for
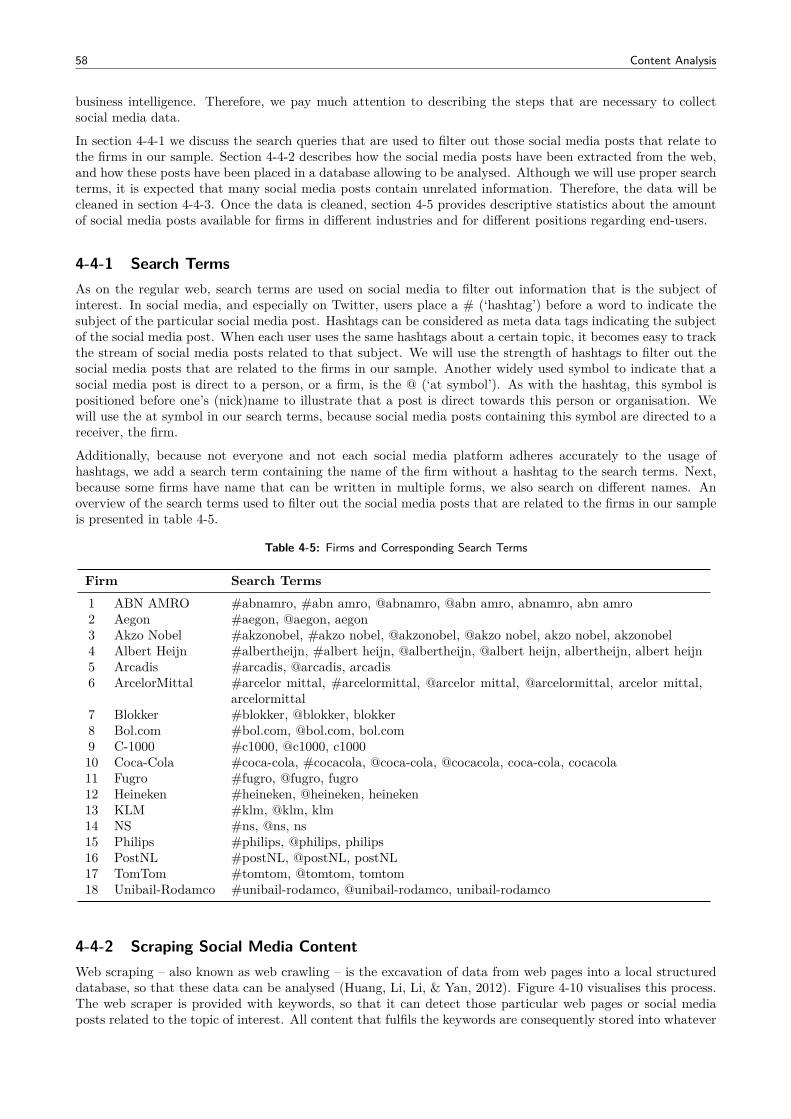
58 Content Analysis
business intelligence. Therefore, we pay much attention to describing the steps that are necessary to collectsocial media data.
In section 4-4-1 we discuss the search queries that are used to filter out those social media posts that relate tothe firms in our sample. Section 4-4-2 describes how the social media posts have been extracted from the web,and how these posts have been placed in a database allowing to be analysed. Although we will use proper searchterms, it is expected that many social media posts contain unrelated information. Therefore, the data will becleaned in section 4-4-3. Once the data is cleaned, section 4-5 provides descriptive statistics about the amountof social media posts available for firms in different industries and for different positions regarding end-users.
4-4-1 Search TermsAs on the regular web, search terms are used on social media to filter out information that is the subject ofinterest. In social media, and especially on Twitter, users place a # (‘hashtag’) before a word to indicate thesubject of the particular social media post. Hashtags can be considered as meta data tags indicating the subjectof the social media post. When each user uses the same hashtags about a certain topic, it becomes easy to trackthe stream of social media posts related to that subject. We will use the strength of hashtags to filter out thesocial media posts that are related to the firms in our sample. Another widely used symbol to indicate that asocial media post is direct to a person, or a firm, is the @ (‘at symbol’). As with the hashtag, this symbol ispositioned before one’s (nick)name to illustrate that a post is direct towards this person or organisation. Wewill use the at symbol in our search terms, because social media posts containing this symbol are directed to areceiver, the firm.
Additionally, because not everyone and not each social media platform adheres accurately to the usage ofhashtags, we add a search term containing the name of the firm without a hashtag to the search terms. Next,because some firms have name that can be written in multiple forms, we also search on different names. Anoverview of the search terms used to filter out the social media posts that are related to the firms in our sampleis presented in table 4-5.
Table 4-5: Firms and Corresponding Search Terms
Firm Search Terms1 ABN AMRO #abnamro, #abn amro, @abnamro, @abn amro, abnamro, abn amro2 Aegon #aegon, @aegon, aegon3 Akzo Nobel #akzonobel, #akzo nobel, @akzonobel, @akzo nobel, akzo nobel, akzonobel4 Albert Heijn #albertheijn, #albert heijn, @albertheijn, @albert heijn, albertheijn, albert heijn5 Arcadis #arcadis, @arcadis, arcadis6 ArcelorMittal #arcelor mittal, #arcelormittal, @arcelor mittal, @arcelormittal, arcelor mittal,
arcelormittal7 Blokker #blokker, @blokker, blokker8 Bol.com #bol.com, @bol.com, bol.com9 C-1000 #c1000, @c1000, c100010 Coca-Cola #coca-cola, #cocacola, @coca-cola, @cocacola, coca-cola, cocacola11 Fugro #fugro, @fugro, fugro12 Heineken #heineken, @heineken, heineken13 KLM #klm, @klm, klm14 NS #ns, @ns, ns15 Philips #philips, @philips, philips16 PostNL #postNL, @postNL, postNL17 TomTom #tomtom, @tomtom, tomtom18 Unibail-Rodamco #unibail-rodamco, @unibail-rodamco, unibail-rodamco
4-4-2 Scraping Social Media ContentWeb scraping – also known as web crawling – is the excavation of data from web pages into a local structureddatabase, so that these data can be analysed (Huang, Li, Li, & Yan, 2012). Figure 4-10 visualises this process.The web scraper is provided with keywords, so that it can detect those particular web pages or social mediaposts related to the topic of interest. All content that fulfils the keywords are consequently stored into whatever
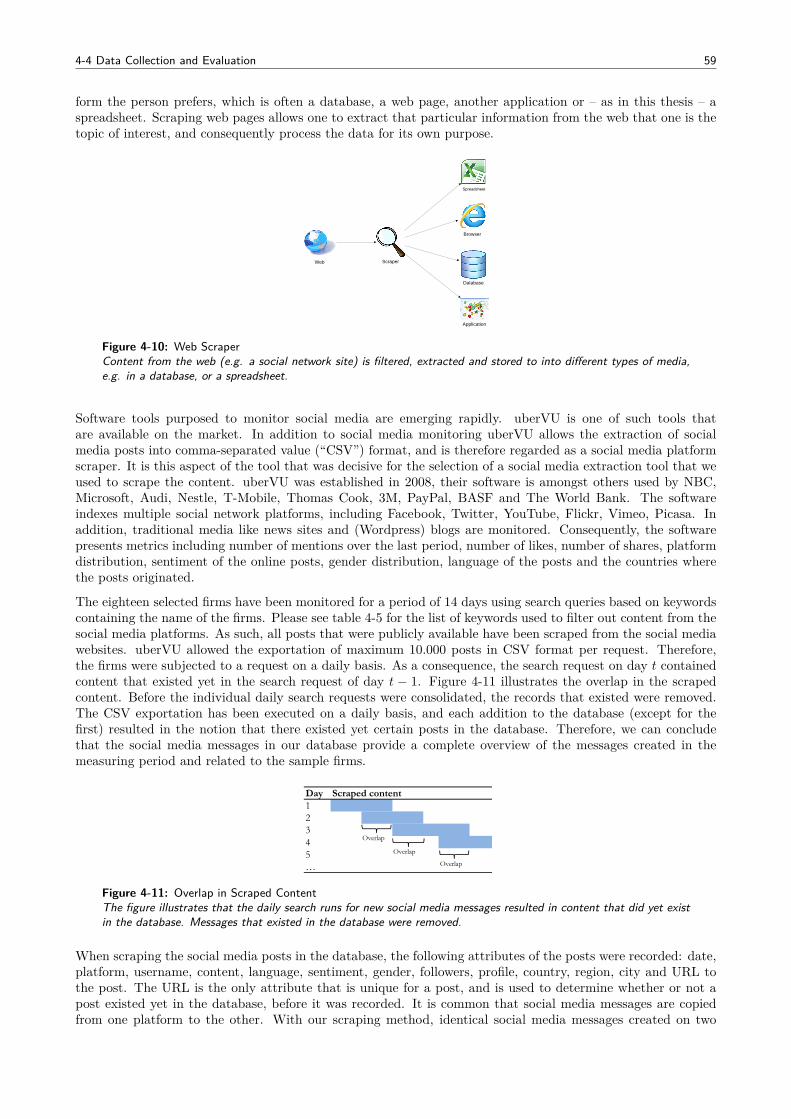
4-4 Data Collection and Evaluation 59
form the person prefers, which is often a database, a web page, another application or – as in this thesis – aspreadsheet. Scraping web pages allows one to extract that particular information from the web that one is thetopic of interest, and consequently process the data for its own purpose.
Web
Spreadsheet
Browser
Database
Application
Scraper
Figure 4-10: Web ScraperContent from the web (e.g. a social network site) is filtered, extracted and stored to into different types of media,e.g. in a database, or a spreadsheet.
Software tools purposed to monitor social media are emerging rapidly. uberVU is one of such tools thatare available on the market. In addition to social media monitoring uberVU allows the extraction of socialmedia posts into comma-separated value (“CSV”) format, and is therefore regarded as a social media platformscraper. It is this aspect of the tool that was decisive for the selection of a social media extraction tool that weused to scrape the content. uberVU was established in 2008, their software is amongst others used by NBC,Microsoft, Audi, Nestle, T-Mobile, Thomas Cook, 3M, PayPal, BASF and The World Bank. The softwareindexes multiple social network platforms, including Facebook, Twitter, YouTube, Flickr, Vimeo, Picasa. Inaddition, traditional media like news sites and (Wordpress) blogs are monitored. Consequently, the softwarepresents metrics including number of mentions over the last period, number of likes, number of shares, platformdistribution, sentiment of the online posts, gender distribution, language of the posts and the countries wherethe posts originated.
The eighteen selected firms have been monitored for a period of 14 days using search queries based on keywordscontaining the name of the firms. Please see table 4-5 for the list of keywords used to filter out content from thesocial media platforms. As such, all posts that were publicly available have been scraped from the social mediawebsites. uberVU allowed the exportation of maximum 10.000 posts in CSV format per request. Therefore,the firms were subjected to a request on a daily basis. As a consequence, the search request on day t containedcontent that existed yet in the search request of day t − 1. Figure 4-11 illustrates the overlap in the scrapedcontent. Before the individual daily search requests were consolidated, the records that existed were removed.The CSV exportation has been executed on a daily basis, and each addition to the database (except for thefirst) resulted in the notion that there existed yet certain posts in the database. Therefore, we can concludethat the social media messages in our database provide a complete overview of the messages created in themeasuring period and related to the sample firms.
Day Scraped content12345…
Overlap
Overlap
Overlap
Figure 4-11: Overlap in Scraped ContentThe figure illustrates that the daily search runs for new social media messages resulted in content that did yet existin the database. Messages that existed in the database were removed.
When scraping the social media posts in the database, the following attributes of the posts were recorded: date,platform, username, content, language, sentiment, gender, followers, profile, country, region, city and URL tothe post. The URL is the only attribute that is unique for a post, and is used to determine whether or not apost existed yet in the database, before it was recorded. It is common that social media messages are copiedfrom one platform to the other. With our scraping method, identical social media messages created on two
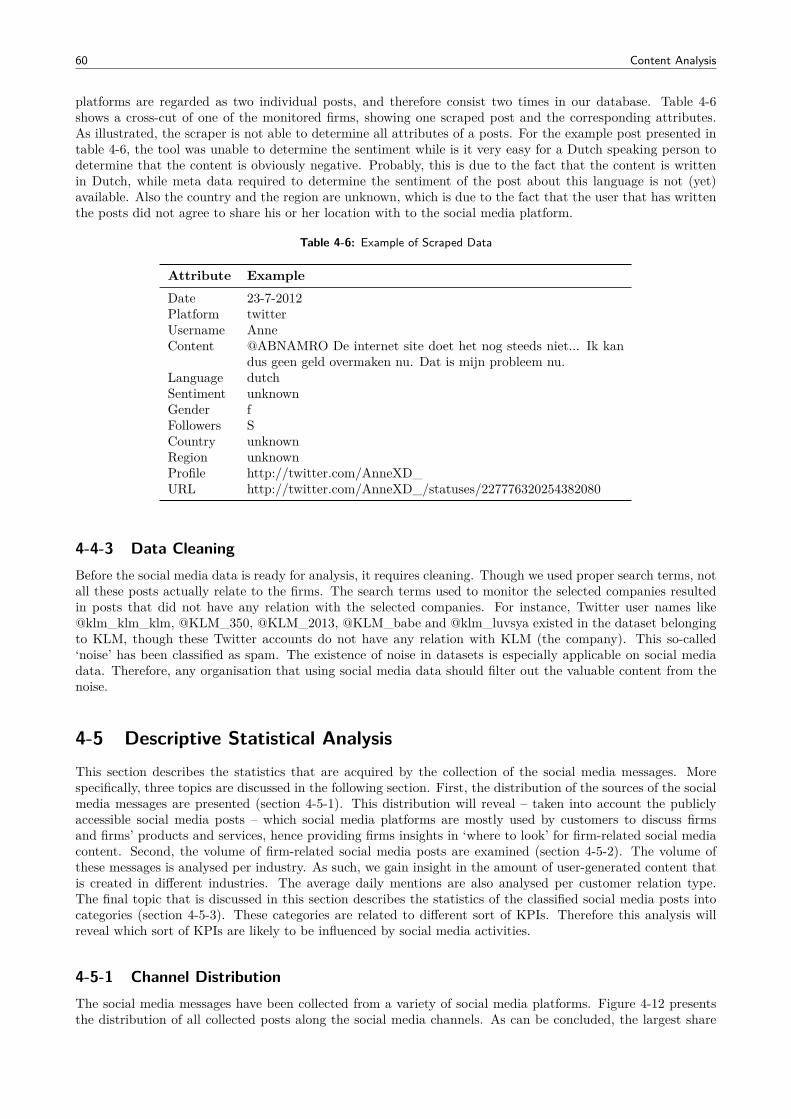
60 Content Analysis
platforms are regarded as two individual posts, and therefore consist two times in our database. Table 4-6shows a cross-cut of one of the monitored firms, showing one scraped post and the corresponding attributes.As illustrated, the scraper is not able to determine all attributes of a posts. For the example post presented intable 4-6, the tool was unable to determine the sentiment while is it very easy for a Dutch speaking person todetermine that the content is obviously negative. Probably, this is due to the fact that the content is writtenin Dutch, while meta data required to determine the sentiment of the post about this language is not (yet)available. Also the country and the region are unknown, which is due to the fact that the user that has writtenthe posts did not agree to share his or her location with to the social media platform.
Table 4-6: Example of Scraped Data
Attribute ExampleDate 23-7-2012Platform twitterUsername AnneContent @ABNAMRO De internet site doet het nog steeds niet... Ik kan
dus geen geld overmaken nu. Dat is mijn probleem nu.Language dutchSentiment unknownGender fFollowers SCountry unknownRegion unknownProfile http://twitter.com/AnneXD_URL http://twitter.com/AnneXD_/statuses/227776320254382080
4-4-3 Data CleaningBefore the social media data is ready for analysis, it requires cleaning. Though we used proper search terms, notall these posts actually relate to the firms. The search terms used to monitor the selected companies resultedin posts that did not have any relation with the selected companies. For instance, Twitter user names like@klm_klm_klm, @KLM_350, @KLM_2013, @KLM_babe and @klm_luvsya existed in the dataset belongingto KLM, though these Twitter accounts do not have any relation with KLM (the company). This so-called‘noise’ has been classified as spam. The existence of noise in datasets is especially applicable on social mediadata. Therefore, any organisation that using social media data should filter out the valuable content from thenoise.
4-5 Descriptive Statistical AnalysisThis section describes the statistics that are acquired by the collection of the social media messages. Morespecifically, three topics are discussed in the following section. First, the distribution of the sources of the socialmedia messages are presented (section 4-5-1). This distribution will reveal – taken into account the publiclyaccessible social media posts – which social media platforms are mostly used by customers to discuss firmsand firms’ products and services, hence providing firms insights in ‘where to look’ for firm-related social mediacontent. Second, the volume of firm-related social media posts are examined (section 4-5-2). The volume ofthese messages is analysed per industry. As such, we gain insight in the amount of user-generated content thatis created in different industries. The average daily mentions are also analysed per customer relation type.The final topic that is discussed in this section describes the statistics of the classified social media posts intocategories (section 4-5-3). These categories are related to different sort of KPIs. Therefore this analysis willreveal which sort of KPIs are likely to be influenced by social media activities.
4-5-1 Channel DistributionThe social media messages have been collected from a variety of social media platforms. Figure 4-12 presentsthe distribution of all collected posts along the social media channels. As can be concluded, the largest share
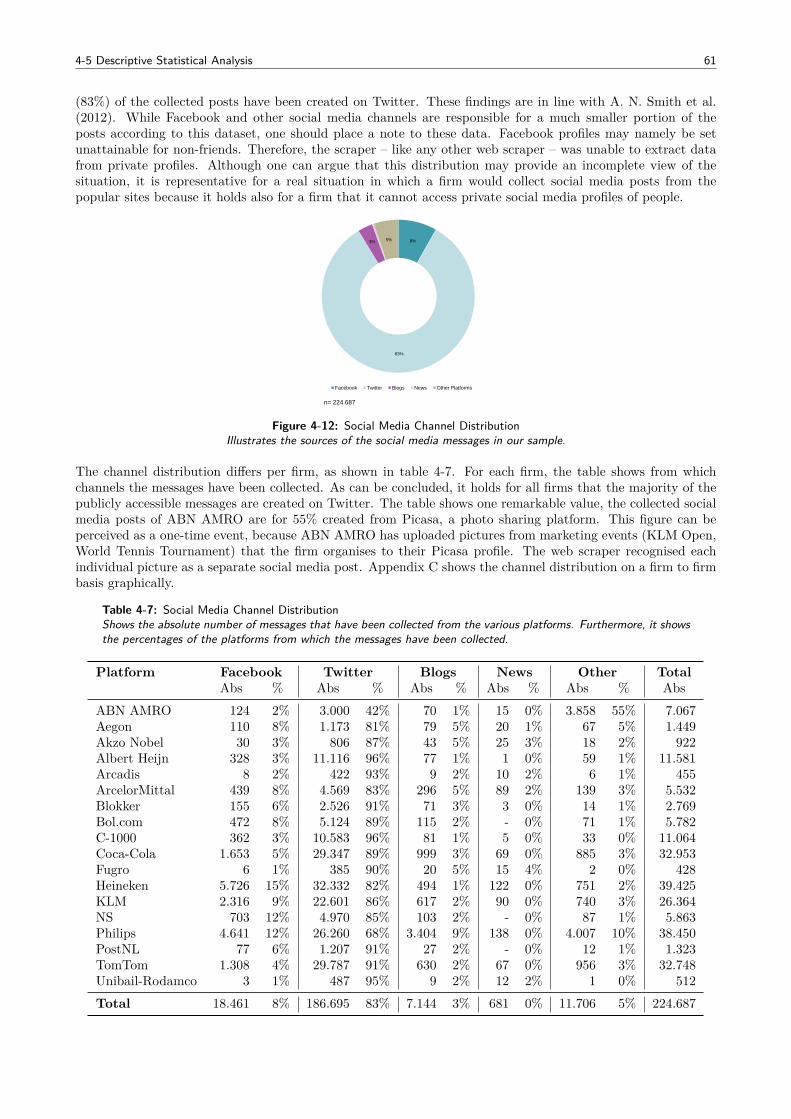
4-5 Descriptive Statistical Analysis 61
(83%) of the collected posts have been created on Twitter. These findings are in line with A. N. Smith et al.(2012). While Facebook and other social media channels are responsible for a much smaller portion of theposts according to this dataset, one should place a note to these data. Facebook profiles may namely be setunattainable for non-friends. Therefore, the scraper – like any other web scraper – was unable to extract datafrom private profiles. Although one can argue that this distribution may provide an incomplete view of thesituation, it is representative for a real situation in which a firm would collect social media posts from thepopular sites because it holds also for a firm that it cannot access private social media profiles of people.
8%3% 5%
n= 224.687
83%
Facebook Twitter Blogs News Other Platforms
Figure 4-12: Social Media Channel DistributionIllustrates the sources of the social media messages in our sample.
The channel distribution differs per firm, as shown in table 4-7. For each firm, the table shows from whichchannels the messages have been collected. As can be concluded, it holds for all firms that the majority of thepublicly accessible messages are created on Twitter. The table shows one remarkable value, the collected socialmedia posts of ABN AMRO are for 55% created from Picasa, a photo sharing platform. This figure can beperceived as a one-time event, because ABN AMRO has uploaded pictures from marketing events (KLM Open,World Tennis Tournament) that the firm organises to their Picasa profile. The web scraper recognised eachindividual picture as a separate social media post. Appendix C shows the channel distribution on a firm to firmbasis graphically.
Table 4-7: Social Media Channel DistributionShows the absolute number of messages that have been collected from the various platforms. Furthermore, it showsthe percentages of the platforms from which the messages have been collected.
Platform Facebook Twitter Blogs News Other TotalAbs % Abs % Abs % Abs % Abs % Abs
ABN AMRO 124 2% 3.000 42% 70 1% 15 0% 3.858 55% 7.067Aegon 110 8% 1.173 81% 79 5% 20 1% 67 5% 1.449Akzo Nobel 30 3% 806 87% 43 5% 25 3% 18 2% 922Albert Heijn 328 3% 11.116 96% 77 1% 1 0% 59 1% 11.581Arcadis 8 2% 422 93% 9 2% 10 2% 6 1% 455ArcelorMittal 439 8% 4.569 83% 296 5% 89 2% 139 3% 5.532Blokker 155 6% 2.526 91% 71 3% 3 0% 14 1% 2.769Bol.com 472 8% 5.124 89% 115 2% - 0% 71 1% 5.782C-1000 362 3% 10.583 96% 81 1% 5 0% 33 0% 11.064Coca-Cola 1.653 5% 29.347 89% 999 3% 69 0% 885 3% 32.953Fugro 6 1% 385 90% 20 5% 15 4% 2 0% 428Heineken 5.726 15% 32.332 82% 494 1% 122 0% 751 2% 39.425KLM 2.316 9% 22.601 86% 617 2% 90 0% 740 3% 26.364NS 703 12% 4.970 85% 103 2% - 0% 87 1% 5.863Philips 4.641 12% 26.260 68% 3.404 9% 138 0% 4.007 10% 38.450PostNL 77 6% 1.207 91% 27 2% - 0% 12 1% 1.323TomTom 1.308 4% 29.787 91% 630 2% 67 0% 956 3% 32.748Unibail-Rodamco 3 1% 487 95% 9 2% 12 2% 1 0% 512Total 18.461 8% 186.695 83% 7.144 3% 681 0% 11.706 5% 224.687
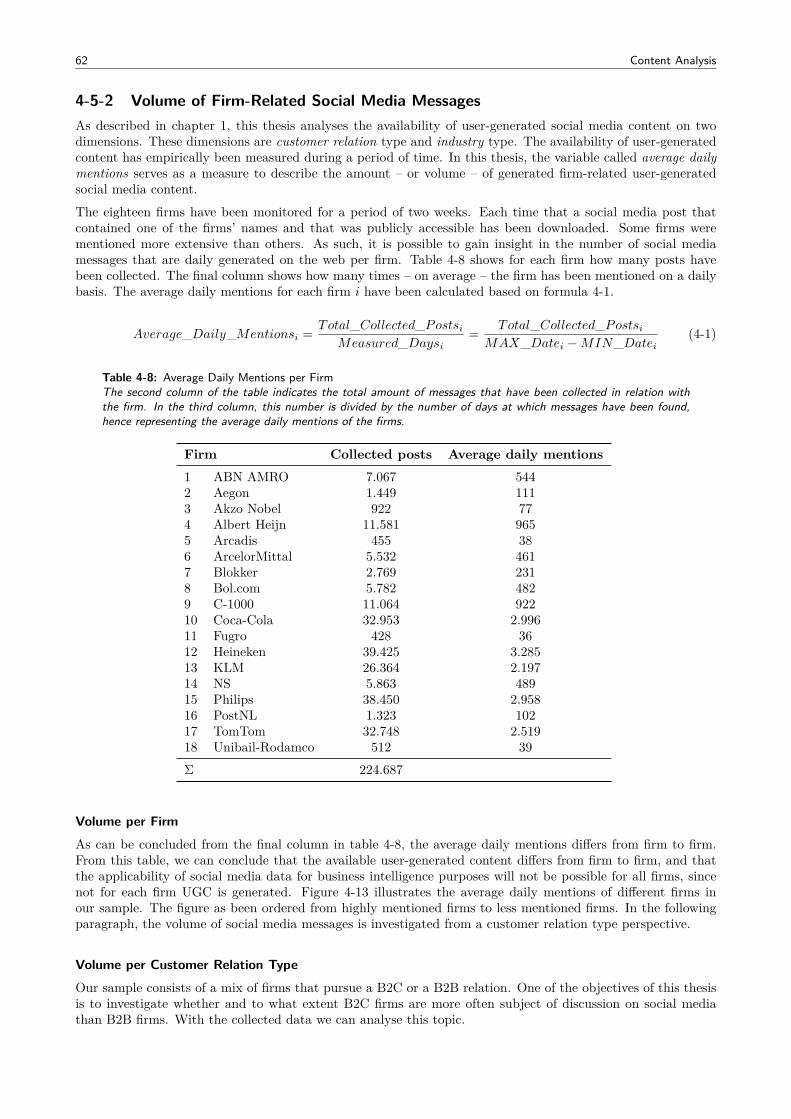
62 Content Analysis
4-5-2 Volume of Firm-Related Social Media MessagesAs described in chapter 1, this thesis analyses the availability of user-generated social media content on twodimensions. These dimensions are customer relation type and industry type. The availability of user-generatedcontent has empirically been measured during a period of time. In this thesis, the variable called average dailymentions serves as a measure to describe the amount – or volume – of generated firm-related user-generatedsocial media content.
The eighteen firms have been monitored for a period of two weeks. Each time that a social media post thatcontained one of the firms’ names and that was publicly accessible has been downloaded. Some firms werementioned more extensive than others. As such, it is possible to gain insight in the number of social mediamessages that are daily generated on the web per firm. Table 4-8 shows for each firm how many posts havebeen collected. The final column shows how many times – on average – the firm has been mentioned on a dailybasis. The average daily mentions for each firm i have been calculated based on formula 4-1.
Average_Daily_Mentionsi = Total_Collected_Postsi
Measured_Daysi= Total_Collected_Postsi
MAX_Datei −MIN_Datei(4-1)
Table 4-8: Average Daily Mentions per FirmThe second column of the table indicates the total amount of messages that have been collected in relation withthe firm. In the third column, this number is divided by the number of days at which messages have been found,hence representing the average daily mentions of the firms.
Firm Collected posts Average daily mentions1 ABN AMRO 7.067 5442 Aegon 1.449 1113 Akzo Nobel 922 774 Albert Heijn 11.581 9655 Arcadis 455 386 ArcelorMittal 5.532 4617 Blokker 2.769 2318 Bol.com 5.782 4829 C-1000 11.064 92210 Coca-Cola 32.953 2.99611 Fugro 428 3612 Heineken 39.425 3.28513 KLM 26.364 2.19714 NS 5.863 48915 Philips 38.450 2.95816 PostNL 1.323 10217 TomTom 32.748 2.51918 Unibail-Rodamco 512 39Σ 224.687
Volume per FirmAs can be concluded from the final column in table 4-8, the average daily mentions differs from firm to firm.From this table, we can conclude that the available user-generated content differs from firm to firm, and thatthe applicability of social media data for business intelligence purposes will not be possible for all firms, sincenot for each firm UGC is generated. Figure 4-13 illustrates the average daily mentions of different firms inour sample. The figure as been ordered from highly mentioned firms to less mentioned firms. In the followingparagraph, the volume of social media messages is investigated from a customer relation type perspective.
Volume per Customer Relation TypeOur sample consists of a mix of firms that pursue a B2C or a B2B relation. One of the objectives of this thesisis to investigate whether and to what extent B2C firms are more often subject of discussion on social mediathan B2B firms. With the collected data we can analyse this topic.
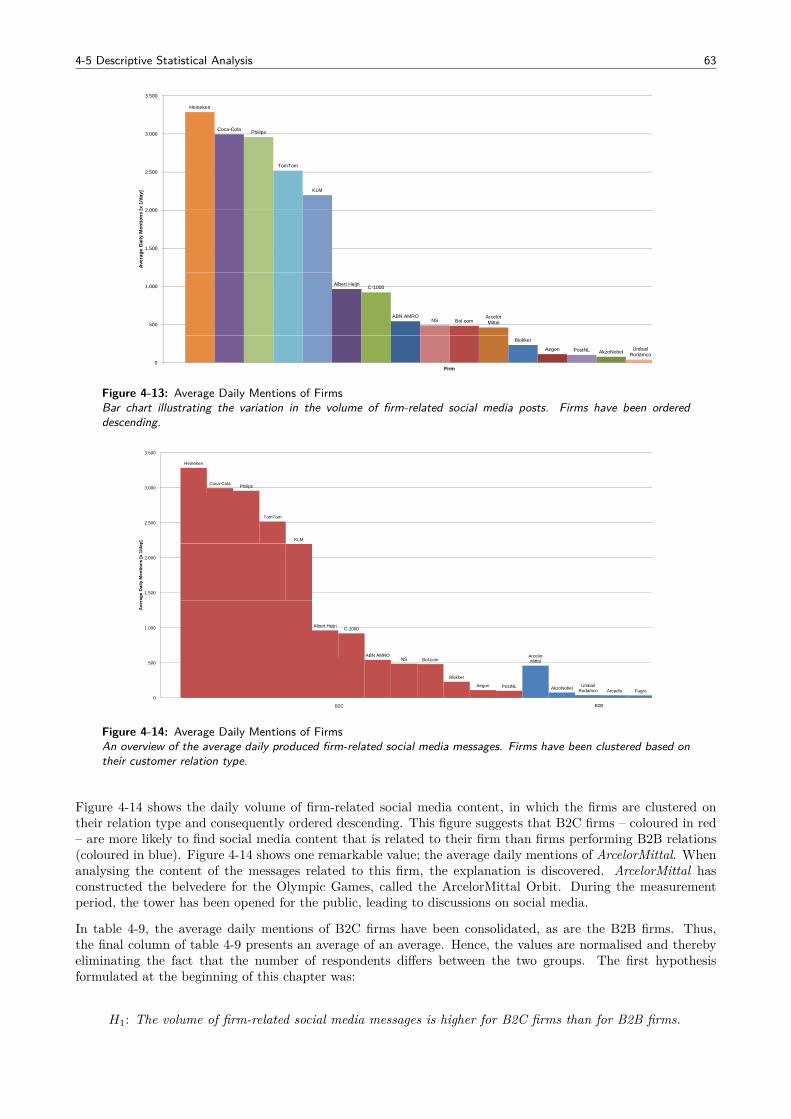
4-5 Descriptive Statistical Analysis 63
Heineken
Coca-Cola Philips3.000
3.500
TomTom
KLM
2.000
2.500
tions
[x 1
/day
]
Albert Heijn1 000
1.500
2.000
Aver
age
Dai
ly M
entio
ns [
Albert Heijn C-1000
ABN AMRONS Bol.com
ArcelorMittal
Blokker
Aegon P tNL Unibail
500
1.000
Blokker
Aegon PostNL AkzoNobel UnibailRodamco Arcadis Fugro
0 Firm
Figure 4-13: Average Daily Mentions of FirmsBar chart illustrating the variation in the volume of firm-related social media posts. Firms have been ordereddescending.
Heineken
Coca-Cola Philips3.000
3.500
TomTom
KLM
2.500
x 1/
day]
1.500
2.000
Ave
rage
Dai
ly M
entio
ns [x
1/d
ay
Bol.comNS
Albert HeijnC-1000
ABN AMRO ArcelorMittal500
1.000
Ave
r
Bol.comNS
PostNL
Blokker
Aegon UnibailRodamcoAkzoNobel
ArcelorMittal
Arcadis Fugro0
500
B2BB2C
Figure 4-14: Average Daily Mentions of FirmsAn overview of the average daily produced firm-related social media messages. Firms have been clustered based ontheir customer relation type.
Figure 4-14 shows the daily volume of firm-related social media content, in which the firms are clustered ontheir relation type and consequently ordered descending. This figure suggests that B2C firms – coloured in red– are more likely to find social media content that is related to their firm than firms performing B2B relations(coloured in blue). Figure 4-14 shows one remarkable value; the average daily mentions of ArcelorMittal. Whenanalysing the content of the messages related to this firm, the explanation is discovered. ArcelorMittal hasconstructed the belvedere for the Olympic Games, called the ArcelorMittal Orbit. During the measurementperiod, the tower has been opened for the public, leading to discussions on social media.
In table 4-9, the average daily mentions of B2C firms have been consolidated, as are the B2B firms. Thus,the final column of table 4-9 presents an average of an average. Hence, the values are normalised and therebyeliminating the fact that the number of respondents differs between the two groups. The first hypothesisformulated at the beginning of this chapter was:
H1: The volume of firm-related social media messages is higher for B2C firms than for B2B firms.
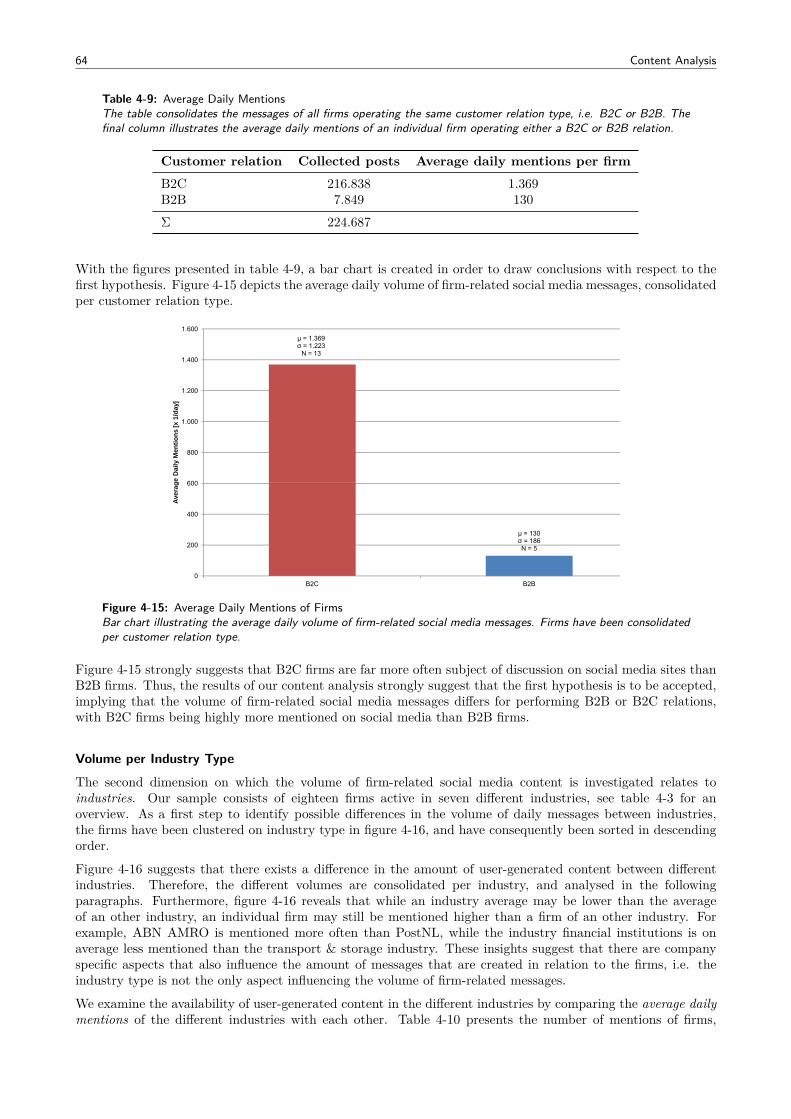
64 Content Analysis
Table 4-9: Average Daily MentionsThe table consolidates the messages of all firms operating the same customer relation type, i.e. B2C or B2B. Thefinal column illustrates the average daily mentions of an individual firm operating either a B2C or B2B relation.
Customer relation Collected posts Average daily mentions per firmB2C 216.838 1.369B2B 7.849 130Σ 224.687
With the figures presented in table 4-9, a bar chart is created in order to draw conclusions with respect to thefirst hypothesis. Figure 4-15 depicts the average daily volume of firm-related social media messages, consolidatedper customer relation type.
μ = 1.369σ = 1.223
N = 13
600
800
1.000
1.200
1.400
1.600
ge
Dai
ly M
enti
on
s [x
1/d
ay]
μ = 130σ = 186N = 5
0
200
400
600
B2C B2B
Ave
rag
Figure 4-15: Average Daily Mentions of FirmsBar chart illustrating the average daily volume of firm-related social media messages. Firms have been consolidatedper customer relation type.
Figure 4-15 strongly suggests that B2C firms are far more often subject of discussion on social media sites thanB2B firms. Thus, the results of our content analysis strongly suggest that the first hypothesis is to be accepted,implying that the volume of firm-related social media messages differs for performing B2B or B2C relations,with B2C firms being highly more mentioned on social media than B2B firms.
Volume per Industry Type
The second dimension on which the volume of firm-related social media content is investigated relates toindustries. Our sample consists of eighteen firms active in seven different industries, see table 4-3 for anoverview. As a first step to identify possible differences in the volume of daily messages between industries,the firms have been clustered on industry type in figure 4-16, and have consequently been sorted in descendingorder.
Figure 4-16 suggests that there exists a difference in the amount of user-generated content between differentindustries. Therefore, the different volumes are consolidated per industry, and analysed in the followingparagraphs. Furthermore, figure 4-16 reveals that while an industry average may be lower than the averageof an other industry, an individual firm may still be mentioned higher than a firm of an other industry. Forexample, ABN AMRO is mentioned more often than PostNL, while the industry financial institutions is onaverage less mentioned than the transport & storage industry. These insights suggest that there are companyspecific aspects that also influence the amount of messages that are created in relation to the firms, i.e. theindustry type is not the only aspect influencing the volume of firm-related messages.
We examine the availability of user-generated content in the different industries by comparing the average dailymentions of the different industries with each other. Table 4-10 presents the number of mentions of firms,
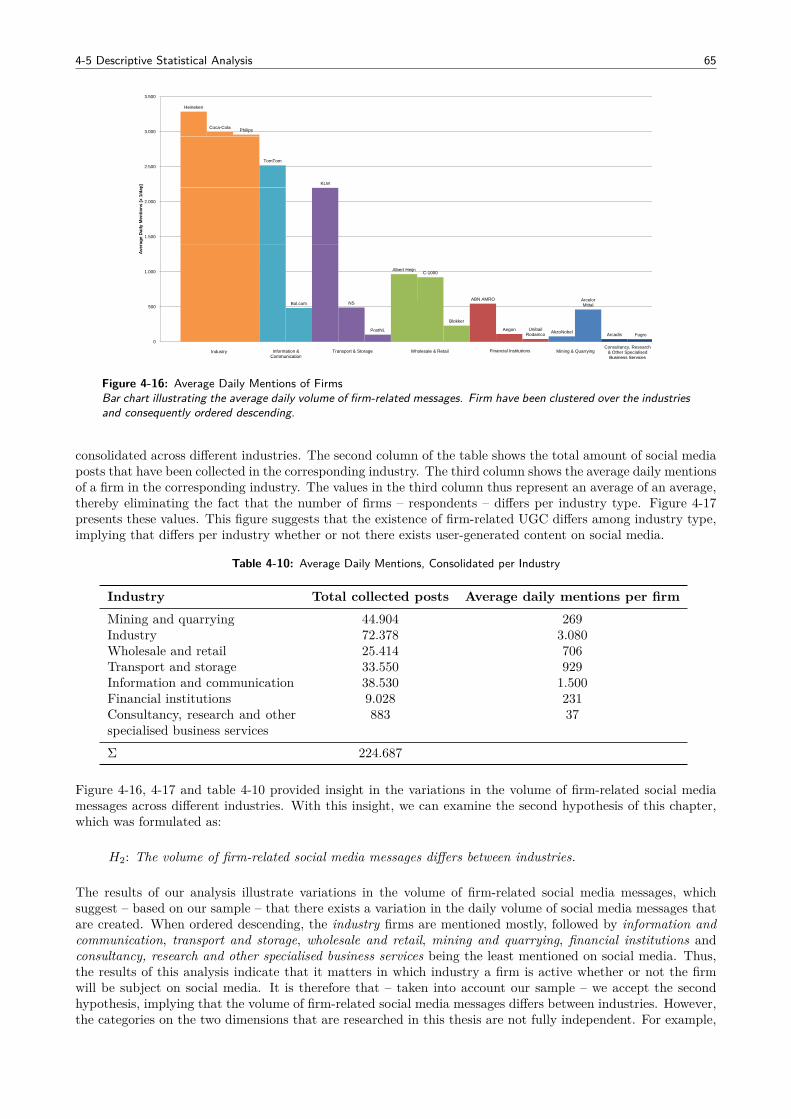
4-5 Descriptive Statistical Analysis 65
Heineken
Coca-Cola Philips3.000
3.500
TomTom
KLM
2.500
x 1/
day]
1.500
2.000
Ave
rage
Dai
ly M
entio
ns [x
1/d
ay
Albert HeijnC-1000
ABN AMRONSBol.com
ArcelorMittal500
1.000
Ave
r
NSBol.comArcelorMittal
Blokker
AegonPostNL AkzoNobelUnibailRodamco Arcadis Fugro
0
500
Information & Communication
Industry Transport & Storage Wholesale & Retail Financial Institutions Mining & QuarryingConsultancy, Research
& Other Specialised Business ServicesCommunication Business Services
Figure 4-16: Average Daily Mentions of FirmsBar chart illustrating the average daily volume of firm-related messages. Firm have been clustered over the industriesand consequently ordered descending.
consolidated across different industries. The second column of the table shows the total amount of social mediaposts that have been collected in the corresponding industry. The third column shows the average daily mentionsof a firm in the corresponding industry. The values in the third column thus represent an average of an average,thereby eliminating the fact that the number of firms – respondents – differs per industry type. Figure 4-17presents these values. This figure suggests that the existence of firm-related UGC differs among industry type,implying that differs per industry whether or not there exists user-generated content on social media.
Table 4-10: Average Daily Mentions, Consolidated per Industry
Industry Total collected posts Average daily mentions per firmMining and quarrying 44.904 269Industry 72.378 3.080Wholesale and retail 25.414 706Transport and storage 33.550 929Information and communication 38.530 1.500Financial institutions 9.028 231Consultancy, research and otherspecialised business services
883 37
Σ 224.687
Figure 4-16, 4-17 and table 4-10 provided insight in the variations in the volume of firm-related social mediamessages across different industries. With this insight, we can examine the second hypothesis of this chapter,which was formulated as:
H2: The volume of firm-related social media messages differs between industries.
The results of our analysis illustrate variations in the volume of firm-related social media messages, whichsuggest – based on our sample – that there exists a variation in the daily volume of social media messages thatare created. When ordered descending, the industry firms are mentioned mostly, followed by information andcommunication, transport and storage, wholesale and retail, mining and quarrying, financial institutions andconsultancy, research and other specialised business services being the least mentioned on social media. Thus,the results of this analysis indicate that it matters in which industry a firm is active whether or not the firmwill be subject on social media. It is therefore that – taken into account our sample – we accept the secondhypothesis, implying that the volume of firm-related social media messages differs between industries. However,the categories on the two dimensions that are researched in this thesis are not fully independent. For example,
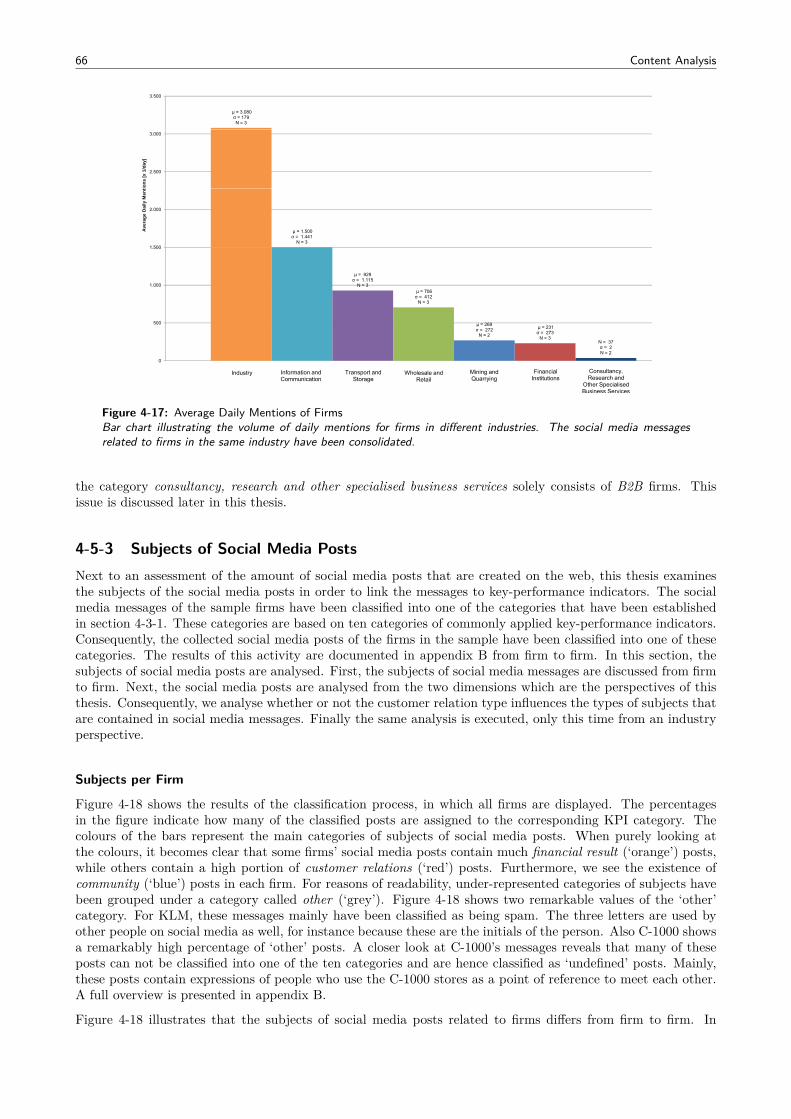
66 Content Analysis
μ = 3.080σ = 179N = 3
3.000
3.500
2.500
3.000
y M
entio
ns [x
1/d
ay]
μ = 1.500σ = 1.441
N = 3 1.500
2.000
Aver
age
Dai
ly M
ent
μ = 929 σ = 1.115
N = 3μ = 706 σ = 412
N = 3
500
1.000
1.500
μ = 269σ = 272
N = 2
μ = 231 σ = 273
N = 3N = 37σ = 2N = 2
0
500
Industry Information and Transport and Wholesale and Mining and Financial Consultancy,Industry Information and Communication
Transport and Storage
Wholesale and Retail
Mining and Quarrying
FinancialInstitutions
Consultancy, Research and
Other SpecialisedBusiness Services
Figure 4-17: Average Daily Mentions of FirmsBar chart illustrating the volume of daily mentions for firms in different industries. The social media messagesrelated to firms in the same industry have been consolidated.
the category consultancy, research and other specialised business services solely consists of B2B firms. Thisissue is discussed later in this thesis.
4-5-3 Subjects of Social Media PostsNext to an assessment of the amount of social media posts that are created on the web, this thesis examinesthe subjects of the social media posts in order to link the messages to key-performance indicators. The socialmedia messages of the sample firms have been classified into one of the categories that have been establishedin section 4-3-1. These categories are based on ten categories of commonly applied key-performance indicators.Consequently, the collected social media posts of the firms in the sample have been classified into one of thesecategories. The results of this activity are documented in appendix B from firm to firm. In this section, thesubjects of social media posts are analysed. First, the subjects of social media messages are discussed from firmto firm. Next, the social media posts are analysed from the two dimensions which are the perspectives of thisthesis. Consequently, we analyse whether or not the customer relation type influences the types of subjects thatare contained in social media messages. Finally the same analysis is executed, only this time from an industryperspective.
Subjects per Firm
Figure 4-18 shows the results of the classification process, in which all firms are displayed. The percentagesin the figure indicate how many of the classified posts are assigned to the corresponding KPI category. Thecolours of the bars represent the main categories of subjects of social media posts. When purely looking atthe colours, it becomes clear that some firms’ social media posts contain much financial result (‘orange’) posts,while others contain a high portion of customer relations (‘red’) posts. Furthermore, we see the existence ofcommunity (‘blue’) posts in each firm. For reasons of readability, under-represented categories of subjects havebeen grouped under a category called other (‘grey’). Figure 4-18 shows two remarkable values of the ‘other’category. For KLM, these messages mainly have been classified as being spam. The three letters are used byother people on social media as well, for instance because these are the initials of the person. Also C-1000 showsa remarkably high percentage of ‘other’ posts. A closer look at C-1000’s messages reveals that many of theseposts can not be classified into one of the ten categories and are hence classified as ‘undefined’ posts. Mainly,these posts contain expressions of people who use the C-1000 stores as a point of reference to meet each other.A full overview is presented in appendix B.
Figure 4-18 illustrates that the subjects of social media posts related to firms differs from firm to firm. In
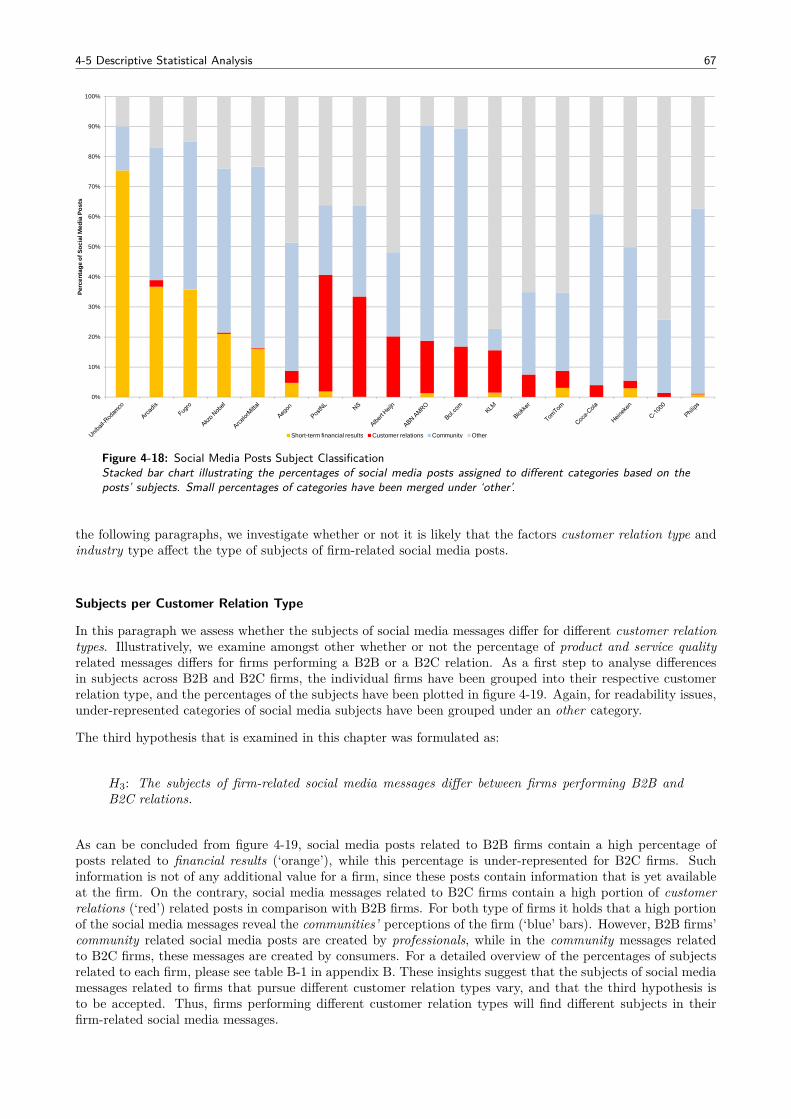
4-5 Descriptive Statistical Analysis 67
10%
20%
30%
40%
50%
60%
70%
80%
90%
100%
Perc
enta
ge o
f Soc
ial M
edia
Pos
ts
0%
10%
Short-term financial results Customer relations Community Other
Figure 4-18: Social Media Posts Subject ClassificationStacked bar chart illustrating the percentages of social media posts assigned to different categories based on theposts’ subjects. Small percentages of categories have been merged under ‘other’.
the following paragraphs, we investigate whether or not it is likely that the factors customer relation type andindustry type affect the type of subjects of firm-related social media posts.
Subjects per Customer Relation Type
In this paragraph we assess whether the subjects of social media messages differ for different customer relationtypes. Illustratively, we examine amongst other whether or not the percentage of product and service qualityrelated messages differs for firms performing a B2B or a B2C relation. As a first step to analyse differencesin subjects across B2B and B2C firms, the individual firms have been grouped into their respective customerrelation type, and the percentages of the subjects have been plotted in figure 4-19. Again, for readability issues,under-represented categories of social media subjects have been grouped under an other category.
The third hypothesis that is examined in this chapter was formulated as:
H3: The subjects of firm-related social media messages differ between firms performing B2B andB2C relations.
As can be concluded from figure 4-19, social media posts related to B2B firms contain a high percentage ofposts related to financial results (‘orange’), while this percentage is under-represented for B2C firms. Suchinformation is not of any additional value for a firm, since these posts contain information that is yet availableat the firm. On the contrary, social media messages related to B2C firms contain a high portion of customerrelations (‘red’) related posts in comparison with B2B firms. For both type of firms it holds that a high portionof the social media messages reveal the communities’ perceptions of the firm (‘blue’ bars). However, B2B firms’community related social media posts are created by professionals, while in the community messages relatedto B2C firms, these messages are created by consumers. For a detailed overview of the percentages of subjectsrelated to each firm, please see table B-1 in appendix B. These insights suggest that the subjects of social mediamessages related to firms that pursue different customer relation types vary, and that the third hypothesis isto be accepted. Thus, firms performing different customer relation types will find different subjects in theirfirm-related social media messages.
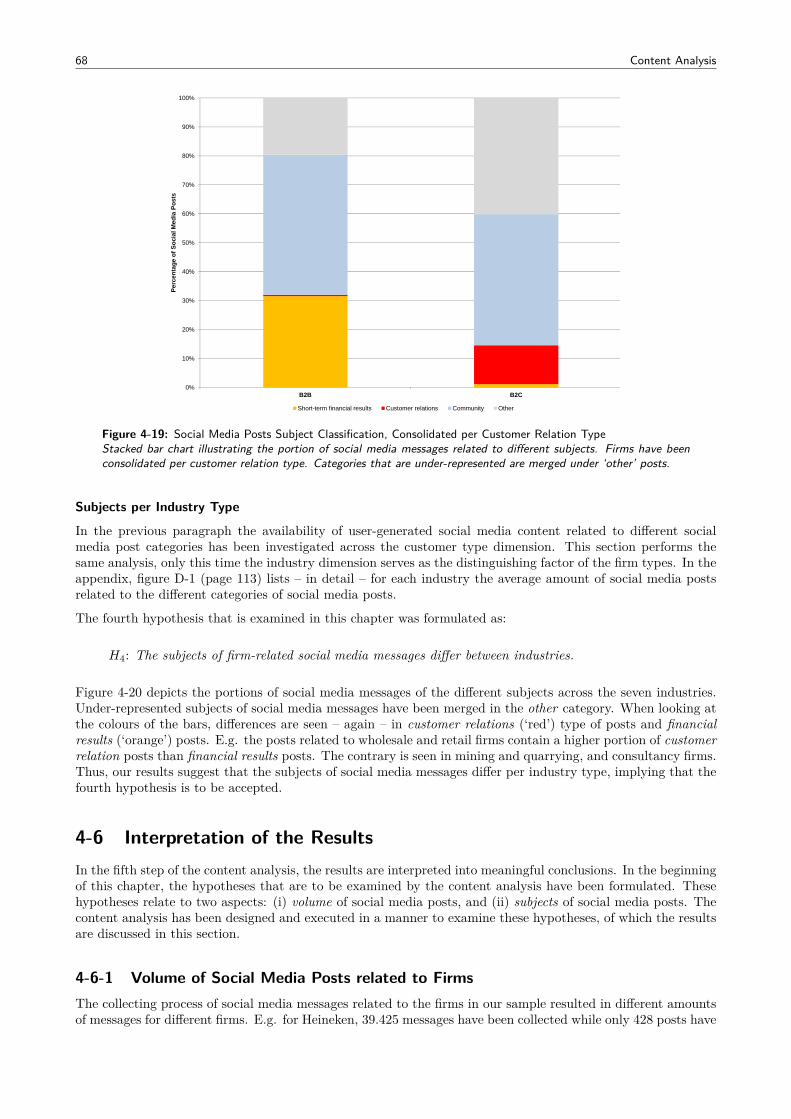
68 Content Analysis
40%
50%
60%
70%
80%
90%
100%
Perc
enta
ge o
f Soc
ial M
edia
Pos
ts
0%
10%
20%
30%
0%
B2B B2C
Perc
en
Short-term financial results Customer relations Community Other
Figure 4-19: Social Media Posts Subject Classification, Consolidated per Customer Relation TypeStacked bar chart illustrating the portion of social media messages related to different subjects. Firms have beenconsolidated per customer relation type. Categories that are under-represented are merged under ‘other’ posts.
Subjects per Industry Type
In the previous paragraph the availability of user-generated social media content related to different socialmedia post categories has been investigated across the customer type dimension. This section performs thesame analysis, only this time the industry dimension serves as the distinguishing factor of the firm types. In theappendix, figure D-1 (page 113) lists – in detail – for each industry the average amount of social media postsrelated to the different categories of social media posts.
The fourth hypothesis that is examined in this chapter was formulated as:
H4: The subjects of firm-related social media messages differ between industries.
Figure 4-20 depicts the portions of social media messages of the different subjects across the seven industries.Under-represented subjects of social media messages have been merged in the other category. When looking atthe colours of the bars, differences are seen – again – in customer relations (‘red’) type of posts and financialresults (‘orange’) posts. E.g. the posts related to wholesale and retail firms contain a higher portion of customerrelation posts than financial results posts. The contrary is seen in mining and quarrying, and consultancy firms.Thus, our results suggest that the subjects of social media messages differ per industry type, implying that thefourth hypothesis is to be accepted.
4-6 Interpretation of the ResultsIn the fifth step of the content analysis, the results are interpreted into meaningful conclusions. In the beginningof this chapter, the hypotheses that are to be examined by the content analysis have been formulated. Thesehypotheses relate to two aspects: (i) volume of social media posts, and (ii) subjects of social media posts. Thecontent analysis has been designed and executed in a manner to examine these hypotheses, of which the resultsare discussed in this section.
4-6-1 Volume of Social Media Posts related to FirmsThe collecting process of social media messages related to the firms in our sample resulted in different amountsof messages for different firms. E.g. for Heineken, 39.425 messages have been collected while only 428 posts have
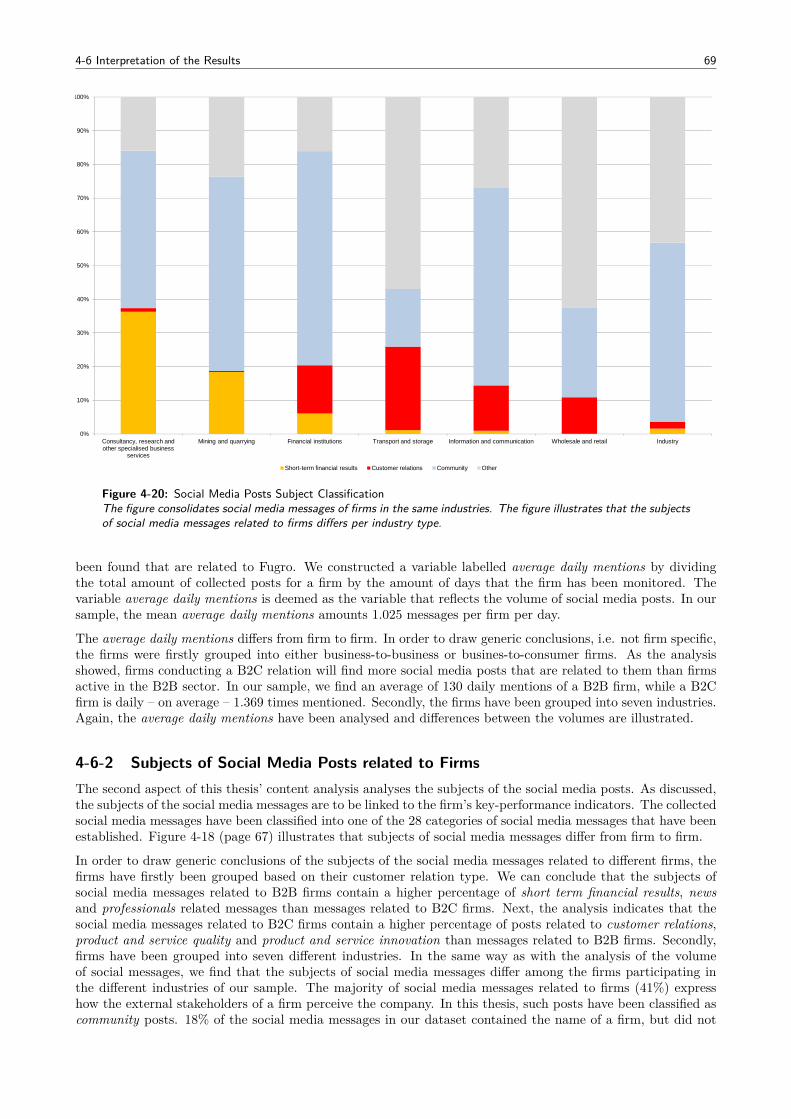
4-6 Interpretation of the Results 69
20%
30%
40%
50%
60%
70%
80%
90%
100%
Perc
enta
ge o
f Soc
ial M
edia
Pos
ts
0%
10%
20%
Consultancy, research and other specialised business
services
Mining and quarrying Financial institutions Transport and storage Information and communication Wholesale and retail Industry
Short-term financial results Customer relations Community Other
Figure 4-20: Social Media Posts Subject ClassificationThe figure consolidates social media messages of firms in the same industries. The figure illustrates that the subjectsof social media messages related to firms differs per industry type.
been found that are related to Fugro. We constructed a variable labelled average daily mentions by dividingthe total amount of collected posts for a firm by the amount of days that the firm has been monitored. Thevariable average daily mentions is deemed as the variable that reflects the volume of social media posts. In oursample, the mean average daily mentions amounts 1.025 messages per firm per day.
The average daily mentions differs from firm to firm. In order to draw generic conclusions, i.e. not firm specific,the firms were firstly grouped into either business-to-business or busines-to-consumer firms. As the analysisshowed, firms conducting a B2C relation will find more social media posts that are related to them than firmsactive in the B2B sector. In our sample, we find an average of 130 daily mentions of a B2B firm, while a B2Cfirm is daily – on average – 1.369 times mentioned. Secondly, the firms have been grouped into seven industries.Again, the average daily mentions have been analysed and differences between the volumes are illustrated.
4-6-2 Subjects of Social Media Posts related to FirmsThe second aspect of this thesis’ content analysis analyses the subjects of the social media posts. As discussed,the subjects of the social media messages are to be linked to the firm’s key-performance indicators. The collectedsocial media messages have been classified into one of the 28 categories of social media messages that have beenestablished. Figure 4-18 (page 67) illustrates that subjects of social media messages differ from firm to firm.
In order to draw generic conclusions of the subjects of the social media messages related to different firms, thefirms have firstly been grouped based on their customer relation type. We can conclude that the subjects ofsocial media messages related to B2B firms contain a higher percentage of short term financial results, newsand professionals related messages than messages related to B2C firms. Next, the analysis indicates that thesocial media messages related to B2C firms contain a higher percentage of posts related to customer relations,product and service quality and product and service innovation than messages related to B2B firms. Secondly,firms have been grouped into seven different industries. In the same way as with the analysis of the volumeof social messages, we find that the subjects of social media messages differ among the firms participating inthe different industries of our sample. The majority of social media messages related to firms (41%) expresshow the external stakeholders of a firm perceive the company. In this thesis, such posts have been classified ascommunity posts. 18% of the social media messages in our dataset contained the name of a firm, but did not
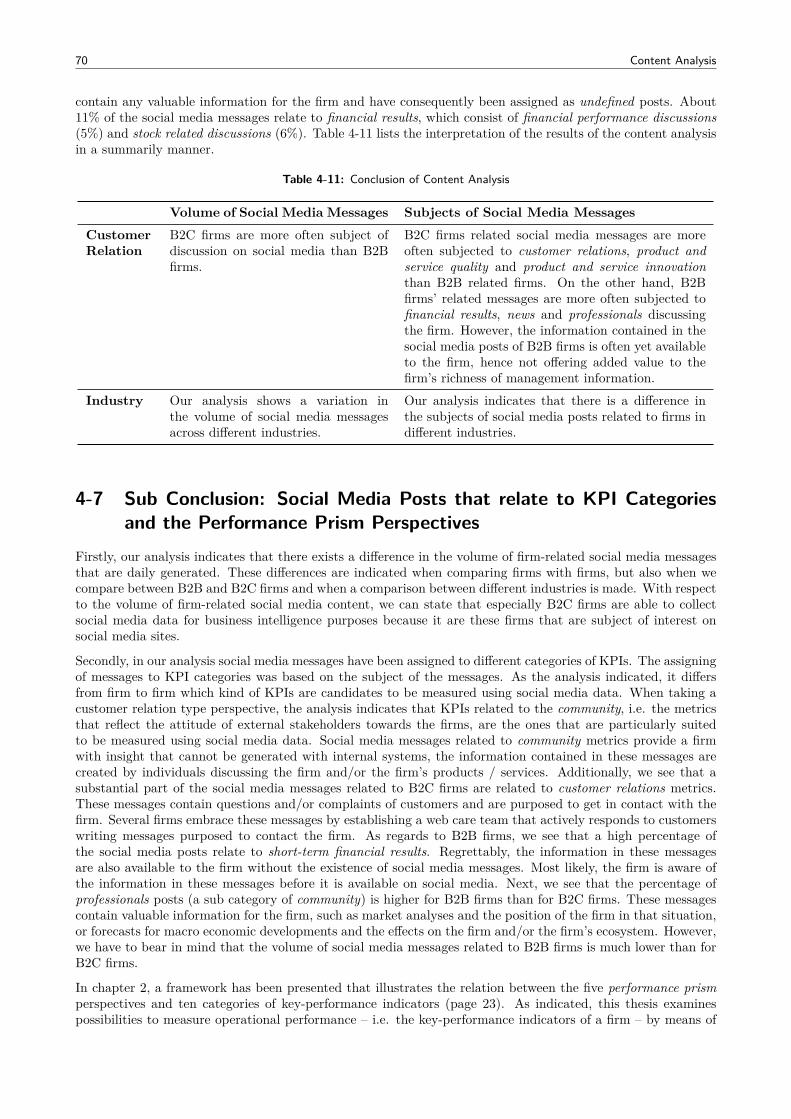
70 Content Analysis
contain any valuable information for the firm and have consequently been assigned as undefined posts. About11% of the social media messages relate to financial results, which consist of financial performance discussions(5%) and stock related discussions (6%). Table 4-11 lists the interpretation of the results of the content analysisin a summarily manner.
Table 4-11: Conclusion of Content Analysis
Volume of Social Media Messages Subjects of Social Media MessagesCustomerRelation
B2C firms are more often subject ofdiscussion on social media than B2Bfirms.
B2C firms related social media messages are moreoften subjected to customer relations, product andservice quality and product and service innovationthan B2B related firms. On the other hand, B2Bfirms’ related messages are more often subjected tofinancial results, news and professionals discussingthe firm. However, the information contained in thesocial media posts of B2B firms is often yet availableto the firm, hence not offering added value to thefirm’s richness of management information.
Industry Our analysis shows a variation inthe volume of social media messagesacross different industries.
Our analysis indicates that there is a difference inthe subjects of social media posts related to firms indifferent industries.
4-7 Sub Conclusion: Social Media Posts that relate to KPI Categoriesand the Performance Prism Perspectives
Firstly, our analysis indicates that there exists a difference in the volume of firm-related social media messagesthat are daily generated. These differences are indicated when comparing firms with firms, but also when wecompare between B2B and B2C firms and when a comparison between different industries is made. With respectto the volume of firm-related social media content, we can state that especially B2C firms are able to collectsocial media data for business intelligence purposes because it are these firms that are subject of interest onsocial media sites.
Secondly, in our analysis social media messages have been assigned to different categories of KPIs. The assigningof messages to KPI categories was based on the subject of the messages. As the analysis indicated, it differsfrom firm to firm which kind of KPIs are candidates to be measured using social media data. When taking acustomer relation type perspective, the analysis indicates that KPIs related to the community, i.e. the metricsthat reflect the attitude of external stakeholders towards the firms, are the ones that are particularly suitedto be measured using social media data. Social media messages related to community metrics provide a firmwith insight that cannot be generated with internal systems, the information contained in these messages arecreated by individuals discussing the firm and/or the firm’s products / services. Additionally, we see that asubstantial part of the social media messages related to B2C firms are related to customer relations metrics.These messages contain questions and/or complaints of customers and are purposed to get in contact with thefirm. Several firms embrace these messages by establishing a web care team that actively responds to customerswriting messages purposed to contact the firm. As regards to B2B firms, we see that a high percentage ofthe social media posts relate to short-term financial results. Regrettably, the information in these messagesare also available to the firm without the existence of social media messages. Most likely, the firm is aware ofthe information in these messages before it is available on social media. Next, we see that the percentage ofprofessionals posts (a sub category of community) is higher for B2B firms than for B2C firms. These messagescontain valuable information for the firm, such as market analyses and the position of the firm in that situation,or forecasts for macro economic developments and the effects on the firm and/or the firm’s ecosystem. However,we have to bear in mind that the volume of social media messages related to B2B firms is much lower than forB2C firms.
In chapter 2, a framework has been presented that illustrates the relation between the five performance prismperspectives and ten categories of key-performance indicators (page 23). As indicated, this thesis examinespossibilities to measure operational performance – i.e. the key-performance indicators of a firm – by means of
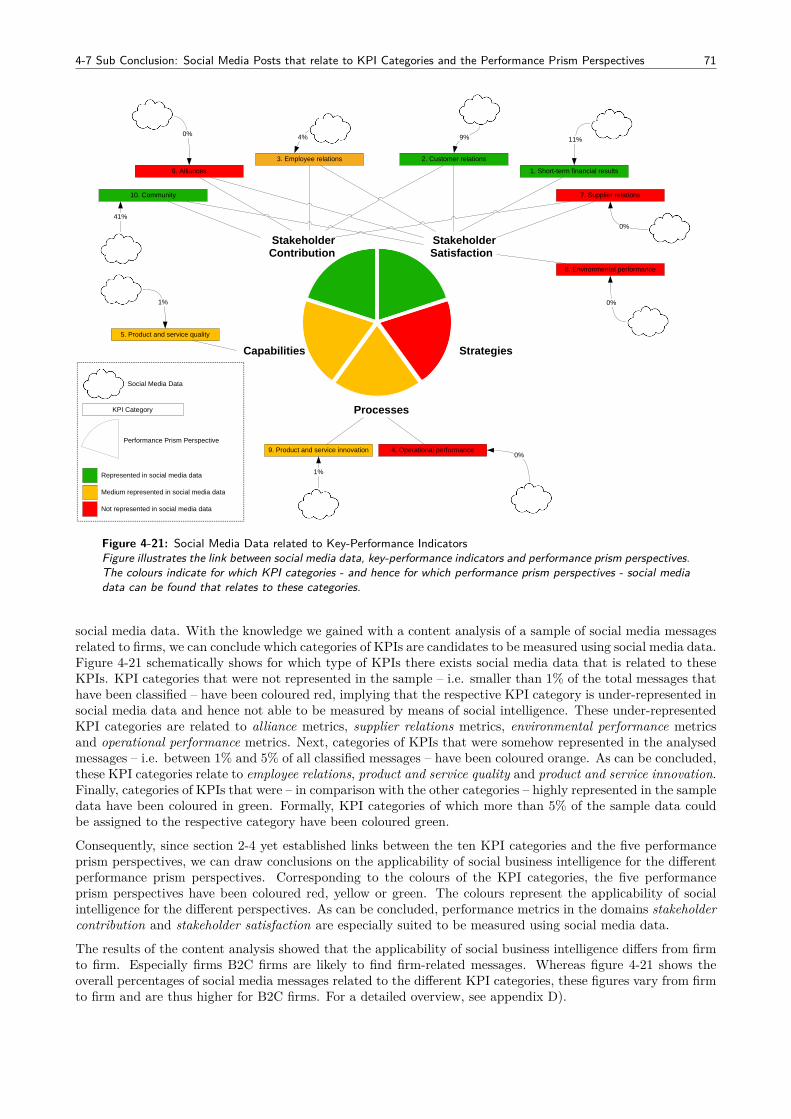
4-7 Sub Conclusion: Social Media Posts that relate to KPI Categories and the Performance Prism Perspectives 71
4%
Stakeholder Satisfaction
Strategies
Processes
Capabilities
Stakeholder Contribution
1. Short-term financial results
2. Customer relations3. Employee relations
4. Operational performance
5. Product and service quality
6. Alliances
7. Supplier relations
8. Environmental performance
9. Product and service innovation
10. Community
KPI Category
Performance Prism Perspective
Social Media Data
9% 11%
0%
0%
0%
1%
41%
0%
Represented in social media data 1%
Not represented in social media data
Medium represented in social media data
Figure 4-21: Social Media Data related to Key-Performance IndicatorsFigure illustrates the link between social media data, key-performance indicators and performance prism perspectives.The colours indicate for which KPI categories - and hence for which performance prism perspectives - social mediadata can be found that relates to these categories.
social media data. With the knowledge we gained with a content analysis of a sample of social media messagesrelated to firms, we can conclude which categories of KPIs are candidates to be measured using social media data.Figure 4-21 schematically shows for which type of KPIs there exists social media data that is related to theseKPIs. KPI categories that were not represented in the sample – i.e. smaller than 1% of the total messages thathave been classified – have been coloured red, implying that the respective KPI category is under-represented insocial media data and hence not able to be measured by means of social intelligence. These under-representedKPI categories are related to alliance metrics, supplier relations metrics, environmental performance metricsand operational performance metrics. Next, categories of KPIs that were somehow represented in the analysedmessages – i.e. between 1% and 5% of all classified messages – have been coloured orange. As can be concluded,these KPI categories relate to employee relations, product and service quality and product and service innovation.Finally, categories of KPIs that were – in comparison with the other categories – highly represented in the sampledata have been coloured in green. Formally, KPI categories of which more than 5% of the sample data couldbe assigned to the respective category have been coloured green.
Consequently, since section 2-4 yet established links between the ten KPI categories and the five performanceprism perspectives, we can draw conclusions on the applicability of social business intelligence for the differentperformance prism perspectives. Corresponding to the colours of the KPI categories, the five performanceprism perspectives have been coloured red, yellow or green. The colours represent the applicability of socialintelligence for the different perspectives. As can be concluded, performance metrics in the domains stakeholdercontribution and stakeholder satisfaction are especially suited to be measured using social media data.
The results of the content analysis showed that the applicability of social business intelligence differs from firmto firm. Especially firms B2C firms are likely to find firm-related messages. Whereas figure 4-21 shows theoverall percentages of social media messages related to the different KPI categories, these figures vary from firmto firm and are thus higher for B2C firms. For a detailed overview, see appendix D).
Chapter 5
Blueprint of a Social Business IntelligenceProcedure
Chapter 4 illustrated that firm-related social media messages contain information that can be linked to a firm’skey-performance indicators. However, chapter 4 also showed that not all categories of KPIs can be linked tothe content created on social media, simply because the user-generated social media content does not relateto all categories of key-performance indicators. For those KPIs that are related to the subjects of the socialmedia messages, a procedure is required that prescribes how a firm should acquire and process these socialmedia messages for business intelligence purposes. A blueprint for a procedure in which social media data arecollected and processed in a way that corresponds with companies’ general business intelligence processes isdeveloped in this chapter. We refer to such a procedure as a social business intelligence procedure. Given theinsights gained in chapter 4, we state that the following chapter is only relevant for certain firms; firms thatare mentioned on social media. Firms that are unable to find related social media data should not invest in thedevelopment of social business intelligence procedures.
Section 5-1 starts this chapter by formulating the requirements of a social business intelligence procedure.Next, section 5-2 provides the blueprint of the procedure, and discusses the necessary steps that form theprocedure. In section 5-3 the procedure is verified. In section 5-4, the real-time aspect of social businessintelligence is discussed. In section 5-5 traditional business intelligence procedures are compared with socialbusiness intelligence. Finally, section 5-6 concludes the findings of this chapter.
5-1 Requirements FormulationBased on the business intelligence concepts that are discussed in chapter 2, the possibilities of social mediamonitoring tools that are discussed in chapter 3, and the experience that we gained in chapter 4 by performinga content analysis on the social media messages related to different firms, nineteen requirements for a businessintelligence procedure have been formulated. Section 5-1-1 describes these requirements. In section 5-1-2 theformulated requirements are verified on consistency with general business intelligence procedures.
5-1-1 Description of RequirementsTable 5-1 lists the requirements for a social business intelligence procedure. These requirements are discussedin the following sections. A social business intelligence procedure should:
1. Have access to social media platformsObviously, to acquire intelligence from social media messages, a firm should have access to the platformswhere these messages are produced.
2. Identify the social media platforms at which the firm is discussedThe fundamental purpose of social intelligence is to acquire insight in the the perception of the firm’s
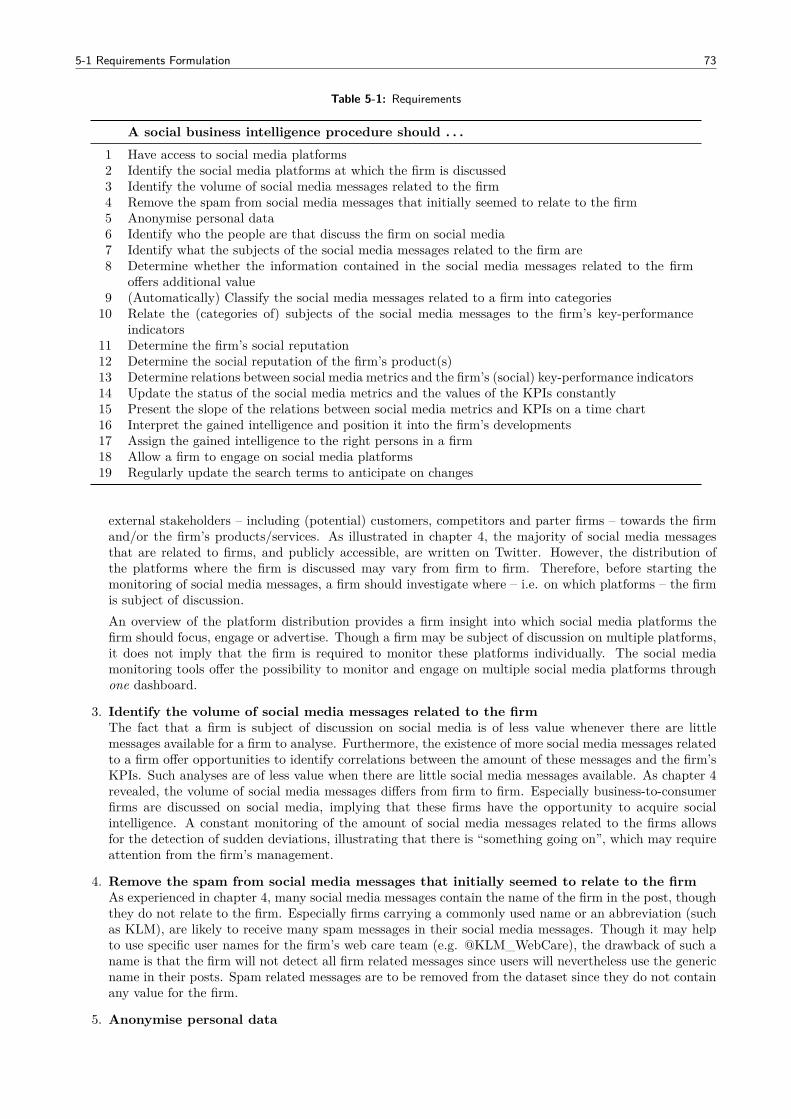
5-1 Requirements Formulation 73
Table 5-1: Requirements
A social business intelligence procedure should . . .1 Have access to social media platforms2 Identify the social media platforms at which the firm is discussed3 Identify the volume of social media messages related to the firm4 Remove the spam from social media messages that initially seemed to relate to the firm5 Anonymise personal data6 Identify who the people are that discuss the firm on social media7 Identify what the subjects of the social media messages related to the firm are8 Determine whether the information contained in the social media messages related to the firm
offers additional value9 (Automatically) Classify the social media messages related to a firm into categories
10 Relate the (categories of) subjects of the social media messages to the firm’s key-performanceindicators
11 Determine the firm’s social reputation12 Determine the social reputation of the firm’s product(s)13 Determine relations between social media metrics and the firm’s (social) key-performance indicators14 Update the status of the social media metrics and the values of the KPIs constantly15 Present the slope of the relations between social media metrics and KPIs on a time chart16 Interpret the gained intelligence and position it into the firm’s developments17 Assign the gained intelligence to the right persons in a firm18 Allow a firm to engage on social media platforms19 Regularly update the search terms to anticipate on changes
external stakeholders – including (potential) customers, competitors and parter firms – towards the firmand/or the firm’s products/services. As illustrated in chapter 4, the majority of social media messagesthat are related to firms, and publicly accessible, are written on Twitter. However, the distribution ofthe platforms where the firm is discussed may vary from firm to firm. Therefore, before starting themonitoring of social media messages, a firm should investigate where – i.e. on which platforms – the firmis subject of discussion.An overview of the platform distribution provides a firm insight into which social media platforms thefirm should focus, engage or advertise. Though a firm may be subject of discussion on multiple platforms,it does not imply that the firm is required to monitor these platforms individually. The social mediamonitoring tools offer the possibility to monitor and engage on multiple social media platforms throughone dashboard.
3. Identify the volume of social media messages related to the firmThe fact that a firm is subject of discussion on social media is of less value whenever there are littlemessages available for a firm to analyse. Furthermore, the existence of more social media messages relatedto a firm offer opportunities to identify correlations between the amount of these messages and the firm’sKPIs. Such analyses are of less value when there are little social media messages available. As chapter 4revealed, the volume of social media messages differs from firm to firm. Especially business-to-consumerfirms are discussed on social media, implying that these firms have the opportunity to acquire socialintelligence. A constant monitoring of the amount of social media messages related to the firms allowsfor the detection of sudden deviations, illustrating that there is “something going on”, which may requireattention from the firm’s management.
4. Remove the spam from social media messages that initially seemed to relate to the firmAs experienced in chapter 4, many social media messages contain the name of the firm in the post, thoughthey do not relate to the firm. Especially firms carrying a commonly used name or an abbreviation (suchas KLM), are likely to receive many spam messages in their social media messages. Though it may helpto use specific user names for the firm’s web care team (e.g. @KLM_WebCare), the drawback of such aname is that the firm will not detect all firm related messages since users will nevertheless use the genericname in their posts. Spam related messages are to be removed from the dataset since they do not containany value for the firm.
5. Anonymise personal data
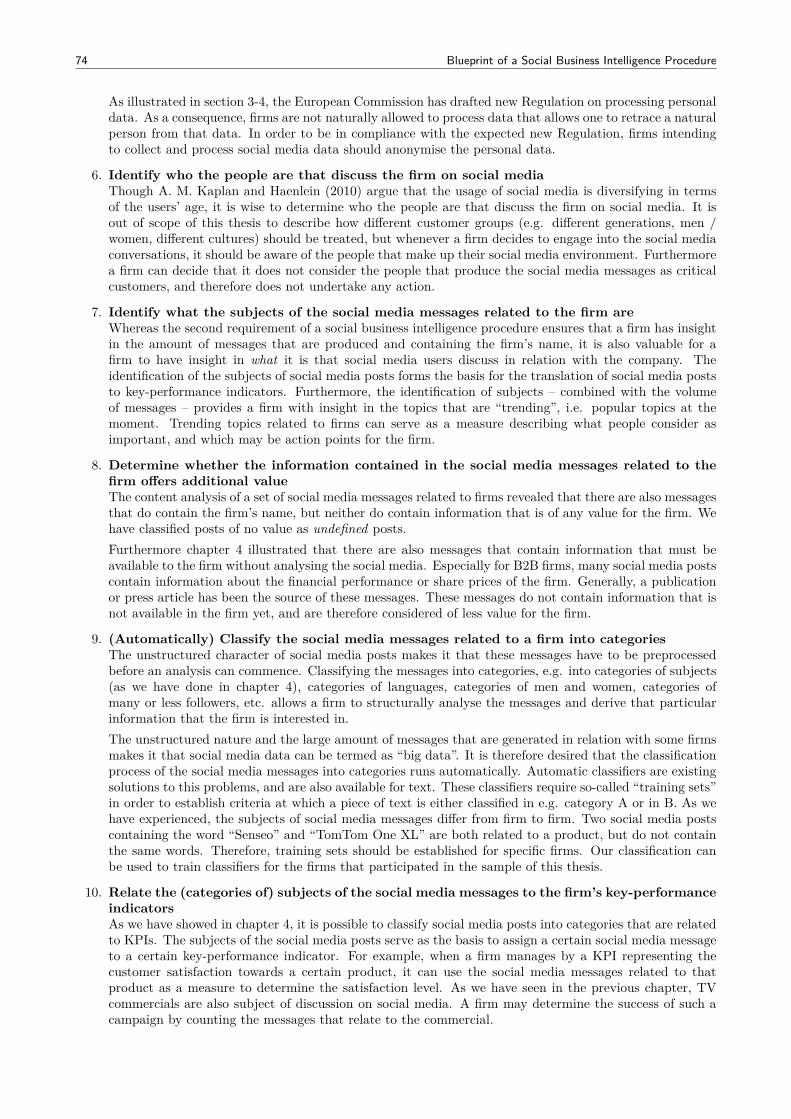
74 Blueprint of a Social Business Intelligence Procedure
As illustrated in section 3-4, the European Commission has drafted new Regulation on processing personaldata. As a consequence, firms are not naturally allowed to process data that allows one to retrace a naturalperson from that data. In order to be in compliance with the expected new Regulation, firms intendingto collect and process social media data should anonymise the personal data.
6. Identify who the people are that discuss the firm on social mediaThough A. M. Kaplan and Haenlein (2010) argue that the usage of social media is diversifying in termsof the users’ age, it is wise to determine who the people are that discuss the firm on social media. It isout of scope of this thesis to describe how different customer groups (e.g. different generations, men /women, different cultures) should be treated, but whenever a firm decides to engage into the social mediaconversations, it should be aware of the people that make up their social media environment. Furthermorea firm can decide that it does not consider the people that produce the social media messages as criticalcustomers, and therefore does not undertake any action.
7. Identify what the subjects of the social media messages related to the firm areWhereas the second requirement of a social business intelligence procedure ensures that a firm has insightin the amount of messages that are produced and containing the firm’s name, it is also valuable for afirm to have insight in what it is that social media users discuss in relation with the company. Theidentification of the subjects of social media posts forms the basis for the translation of social media poststo key-performance indicators. Furthermore, the identification of subjects – combined with the volumeof messages – provides a firm with insight in the topics that are “trending”, i.e. popular topics at themoment. Trending topics related to firms can serve as a measure describing what people consider asimportant, and which may be action points for the firm.
8. Determine whether the information contained in the social media messages related to thefirm offers additional valueThe content analysis of a set of social media messages related to firms revealed that there are also messagesthat do contain the firm’s name, but neither do contain information that is of any value for the firm. Wehave classified posts of no value as undefined posts.Furthermore chapter 4 illustrated that there are also messages that contain information that must beavailable to the firm without analysing the social media. Especially for B2B firms, many social media postscontain information about the financial performance or share prices of the firm. Generally, a publicationor press article has been the source of these messages. These messages do not contain information that isnot available in the firm yet, and are therefore considered of less value for the firm.
9. (Automatically) Classify the social media messages related to a firm into categoriesThe unstructured character of social media posts makes it that these messages have to be preprocessedbefore an analysis can commence. Classifying the messages into categories, e.g. into categories of subjects(as we have done in chapter 4), categories of languages, categories of men and women, categories ofmany or less followers, etc. allows a firm to structurally analyse the messages and derive that particularinformation that the firm is interested in.The unstructured nature and the large amount of messages that are generated in relation with some firmsmakes it that social media data can be termed as “big data”. It is therefore desired that the classificationprocess of the social media messages into categories runs automatically. Automatic classifiers are existingsolutions to this problems, and are also available for text. These classifiers require so-called “training sets”in order to establish criteria at which a piece of text is either classified in e.g. category A or in B. As wehave experienced, the subjects of social media messages differ from firm to firm. Two social media postscontaining the word “Senseo” and “TomTom One XL” are both related to a product, but do not containthe same words. Therefore, training sets should be established for specific firms. Our classification canbe used to train classifiers for the firms that participated in the sample of this thesis.
10. Relate the (categories of) subjects of the social media messages to the firm’s key-performanceindicatorsAs we have showed in chapter 4, it is possible to classify social media posts into categories that are relatedto KPIs. The subjects of the social media posts serve as the basis to assign a certain social media messageto a certain key-performance indicator. For example, when a firm manages by a KPI representing thecustomer satisfaction towards a certain product, it can use the social media messages related to thatproduct as a measure to determine the satisfaction level. As we have seen in the previous chapter, TVcommercials are also subject of discussion on social media. A firm may determine the success of such acampaign by counting the messages that relate to the commercial.
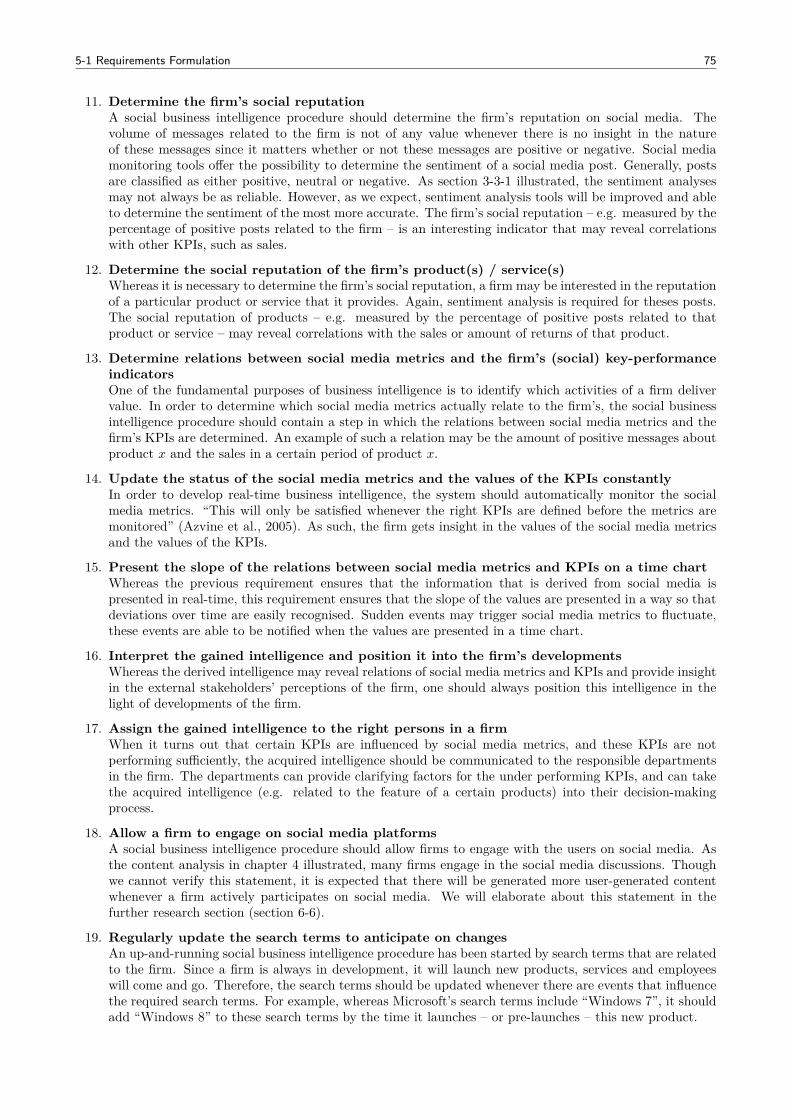
5-1 Requirements Formulation 75
11. Determine the firm’s social reputationA social business intelligence procedure should determine the firm’s reputation on social media. Thevolume of messages related to the firm is not of any value whenever there is no insight in the natureof these messages since it matters whether or not these messages are positive or negative. Social mediamonitoring tools offer the possibility to determine the sentiment of a social media post. Generally, postsare classified as either positive, neutral or negative. As section 3-3-1 illustrated, the sentiment analysesmay not always be as reliable. However, as we expect, sentiment analysis tools will be improved and ableto determine the sentiment of the most more accurate. The firm’s social reputation – e.g. measured by thepercentage of positive posts related to the firm – is an interesting indicator that may reveal correlationswith other KPIs, such as sales.
12. Determine the social reputation of the firm’s product(s) / service(s)Whereas it is necessary to determine the firm’s social reputation, a firm may be interested in the reputationof a particular product or service that it provides. Again, sentiment analysis is required for theses posts.The social reputation of products – e.g. measured by the percentage of positive posts related to thatproduct or service – may reveal correlations with the sales or amount of returns of that product.
13. Determine relations between social media metrics and the firm’s (social) key-performanceindicatorsOne of the fundamental purposes of business intelligence is to identify which activities of a firm delivervalue. In order to determine which social media metrics actually relate to the firm’s, the social businessintelligence procedure should contain a step in which the relations between social media metrics and thefirm’s KPIs are determined. An example of such a relation may be the amount of positive messages aboutproduct x and the sales in a certain period of product x.
14. Update the status of the social media metrics and the values of the KPIs constantlyIn order to develop real-time business intelligence, the system should automatically monitor the socialmedia metrics. “This will only be satisfied whenever the right KPIs are defined before the metrics aremonitored” (Azvine et al., 2005). As such, the firm gets insight in the values of the social media metricsand the values of the KPIs.
15. Present the slope of the relations between social media metrics and KPIs on a time chartWhereas the previous requirement ensures that the information that is derived from social media ispresented in real-time, this requirement ensures that the slope of the values are presented in a way so thatdeviations over time are easily recognised. Sudden events may trigger social media metrics to fluctuate,these events are able to be notified when the values are presented in a time chart.
16. Interpret the gained intelligence and position it into the firm’s developmentsWhereas the derived intelligence may reveal relations of social media metrics and KPIs and provide insightin the external stakeholders’ perceptions of the firm, one should always position this intelligence in thelight of developments of the firm.
17. Assign the gained intelligence to the right persons in a firmWhen it turns out that certain KPIs are influenced by social media metrics, and these KPIs are notperforming sufficiently, the acquired intelligence should be communicated to the responsible departmentsin the firm. The departments can provide clarifying factors for the under performing KPIs, and can takethe acquired intelligence (e.g. related to the feature of a certain products) into their decision-makingprocess.
18. Allow a firm to engage on social media platformsA social business intelligence procedure should allow firms to engage with the users on social media. Asthe content analysis in chapter 4 illustrated, many firms engage in the social media discussions. Thoughwe cannot verify this statement, it is expected that there will be generated more user-generated contentwhenever a firm actively participates on social media. We will elaborate about this statement in thefurther research section (section 6-6).
19. Regularly update the search terms to anticipate on changesAn up-and-running social business intelligence procedure has been started by search terms that are relatedto the firm. Since a firm is always in development, it will launch new products, services and employeeswill come and go. Therefore, the search terms should be updated whenever there are events that influencethe required search terms. For example, whereas Microsoft’s search terms include “Windows 7”, it shouldadd “Windows 8” to these search terms by the time it launches – or pre-launches – this new product.
76 Blueprint of a Social Business Intelligence Procedure
5-1-2 Requirements Check on Business Intelligence ConceptsChapter 2 described the business intelligence concept as it is applied within firms. Especially section 2-3elaborated about the activities that make up the business intelligence process. Van Beek (2006) argues that aBI process consists of three main tasks, being (i) registering, (ii) processing and (iii) reacting. Additionally, theprocessing task consists of 15 sub tasks required to process the registered data. In total, 17 (1+15+1) tasks canbe distinguished that are required for a business intelligence process. We verify the requirements for a socialbusiness intelligence procedure – that have been established in section 5-1-1 by controlling whether each of theBI steps are represented by at least one of the requirements that we have established.
As can be seen concluded from table 5-2 (page 77), each activity is represented by at least one requirement.This allows us to conclude that the requirements of the social business intelligence procedure are consistentwith existing BI procedures.
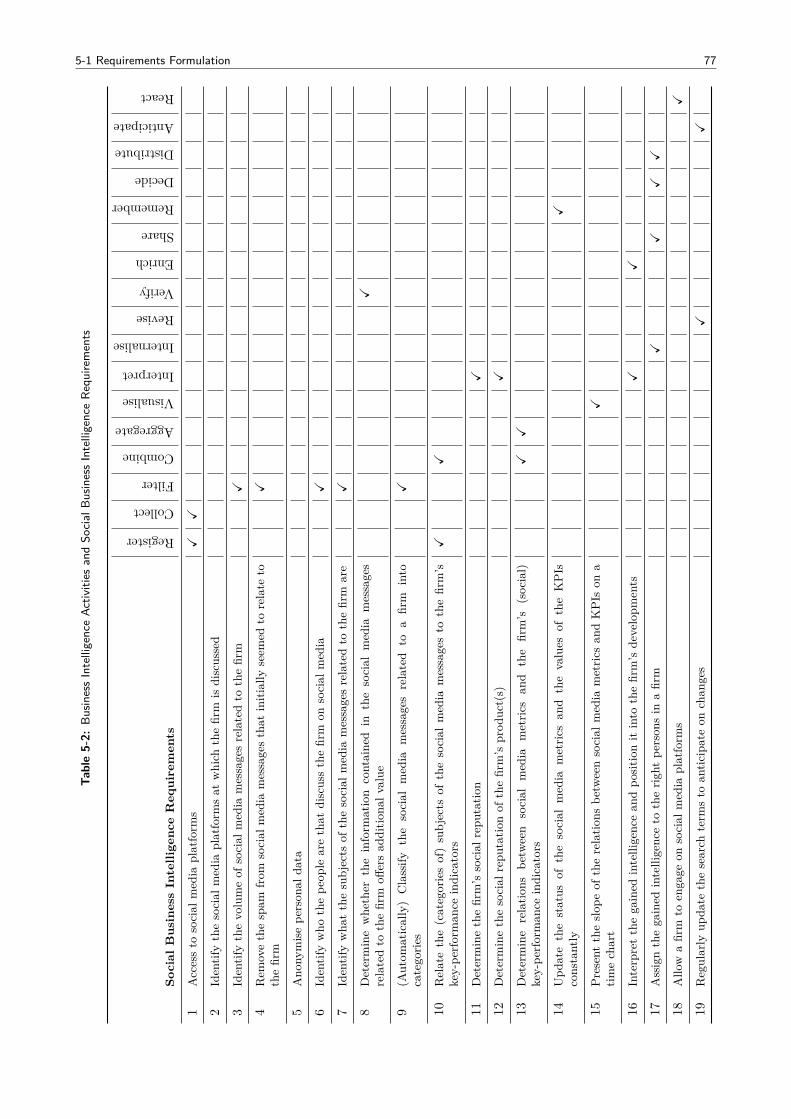
5-1 Requirements Formulation 77
Table5-2:
Busin
essIntelligenceAc
tivities
andSo
cial
Busin
essIntelligenceRe
quire
ments
Soci
alB
usin
ess
Inte
llige
nce
Req
uire
men
ts
Register
Collect
Filter
Combine
Aggregate
Visualise
Interpret
Internalise
Revise
Verify
Enrich
Share
Remember
Decide
Distribute
Anticipate
React
1Accessto
social
med
iaplatform
sX
X
2Identifythesocial
med
iaplatform
sat
which
thefirm
isdiscussed
3Identifythevolumeof
social
med
iamessagesrelatedto
thefirm
X
4Rem
ovethespam
from
social
med
iamessagesthat
initially
seem
edto
relate
tothefirm
X
5Ano
nymisepe
rson
alda
ta
6Identifywho
thepe
ople
arethat
discussthefirm
onsocial
med
iaX
7Identifywha
tthesubjects
ofthesocial
med
iamessagesrelatedto
thefirm
are
X
8Determinewhe
ther
theinform
ation
containe
din
thesocial
med
iamessages
relatedto
thefirm
offersad
ditio
nalv
alue
X
9(A
utom
atically)Classify
the
social
med
iamessagesrelated
toa
firm
into
categorie
sX
10Relatethe(categoriesof)subjects
ofthesocial
med
iamessagesto
thefirm’s
key-pe
rforman
ceindicators
XX
11Determinethefirm’s
social
repu
tatio
nX
12Determinethesocial
repu
tatio
nof
thefirm’s
prod
uct(s)
X
13Determine
relatio
nsbe
tween
social
media
metric
san
dthe
firm’s
(social)
key-pe
rforman
ceindicators
XX
14Upd
atethestatus
ofthesocial
med
iametric
san
dthevalues
oftheKPIs
constantly
X
15Present
theslop
eof
therelatio
nsbe
tweensocial
med
iametric
san
dKPIs
ona
timechart
X
16Interpretthegained
intelligencean
dpo
sitio
nit
into
thefirm’s
developm
ents
XX
17Assignthegained
intelligenceto
therig
htpe
rson
sin
afirm
XX
XX
18Allo
wafirm
toen
gage
onsocial
med
iaplatform
sX
19Regularly
upda
tethesearch
term
sto
antic
ipateon
chan
ges
XX
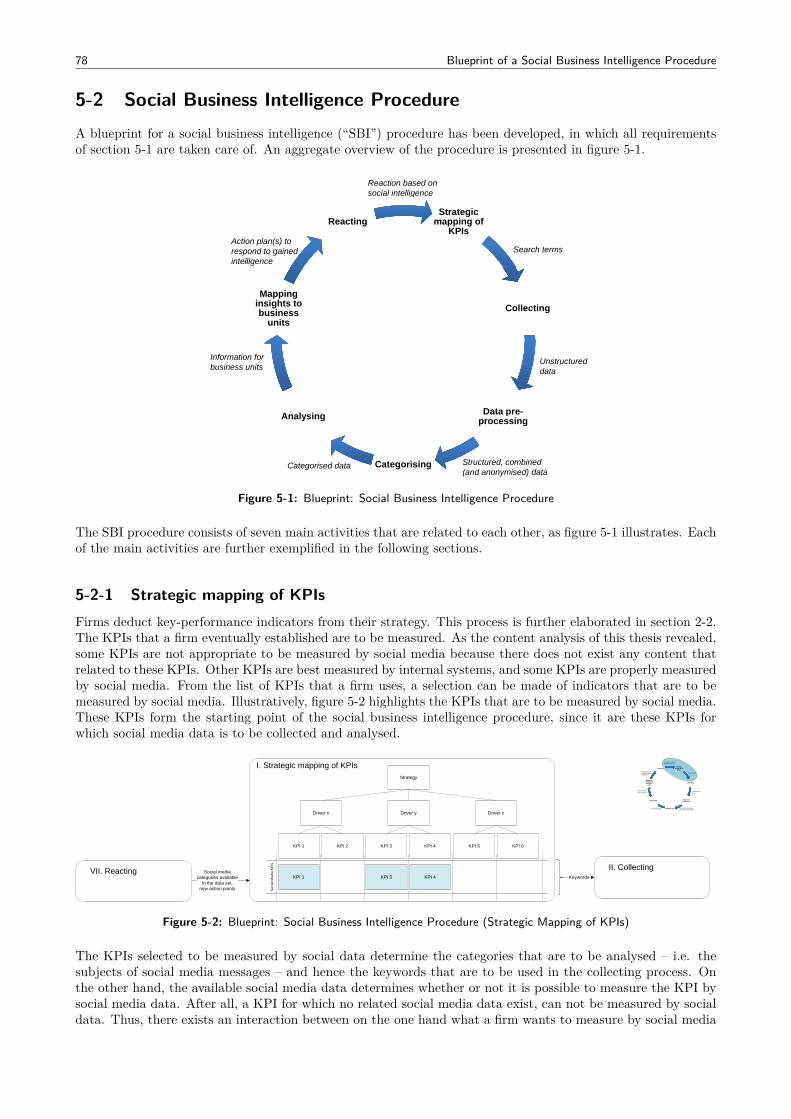
78 Blueprint of a Social Business Intelligence Procedure
5-2 Social Business Intelligence ProcedureA blueprint for a social business intelligence (“SBI”) procedure has been developed, in which all requirementsof section 5-1 are taken care of. An aggregate overview of the procedure is presented in figure 5-1.
Reaction based onsocial intelligence
Strategic mapping of
KPIsReacting
Search termsAction plan(s) to respond to gainedintelligence
g
CollectingMapping
insights to business
units
Data pre
Unstructureddata
Information forbusiness units
Data pre-processing
Categorising
Analysing
Structured, combined(and anonymised) data
Categorised data
Figure 5-1: Blueprint: Social Business Intelligence Procedure
The SBI procedure consists of seven main activities that are related to each other, as figure 5-1 illustrates. Eachof the main activities are further exemplified in the following sections.
5-2-1 Strategic mapping of KPIsFirms deduct key-performance indicators from their strategy. This process is further elaborated in section 2-2.The KPIs that a firm eventually established are to be measured. As the content analysis of this thesis revealed,some KPIs are not appropriate to be measured by social media because there does not exist any content thatrelated to these KPIs. Other KPIs are best measured by internal systems, and some KPIs are properly measuredby social media. From the list of KPIs that a firm uses, a selection can be made of indicators that are to bemeasured by social media. Illustratively, figure 5-2 highlights the KPIs that are to be measured by social media.These KPIs form the starting point of the social business intelligence procedure, since it are these KPIs forwhich social media data is to be collected and analysed.
Strategy
Driver zDriver yDriver x
KPI 4KPI 3KPI 2KPI 1 KPI 6KPI 5
KPI 1 KPI 4
I. Strategic mapping of KPIs
KPI 3
Soc
ial M
edia
KP
Is II. CollectingSocial media
categories availablein the data set,
new action points
KeywordsVII. Reacting
Strategic mapping of
KPIs
Collecting
Data pre-processing
Categorising
Analysing
Mapping insights to business
units
Reacting
Search terms
Unstructureddata
Structured, combined(and anonymised) data
Categorised data
Information forbusiness units
Action plan(s) to respond to gainedintelligence
Reaction based onsocial intelligence
Figure 5-2: Blueprint: Social Business Intelligence Procedure (Strategic Mapping of KPIs)
The KPIs selected to be measured by social data determine the categories that are to be analysed – i.e. thesubjects of social media messages – and hence the keywords that are to be used in the collecting process. Onthe other hand, the available social media data determines whether or not it is possible to measure the KPI bysocial media data. After all, a KPI for which no related social media data exist, can not be measured by socialdata. Thus, there exists an interaction between on the one hand what a firm wants to measure by social media
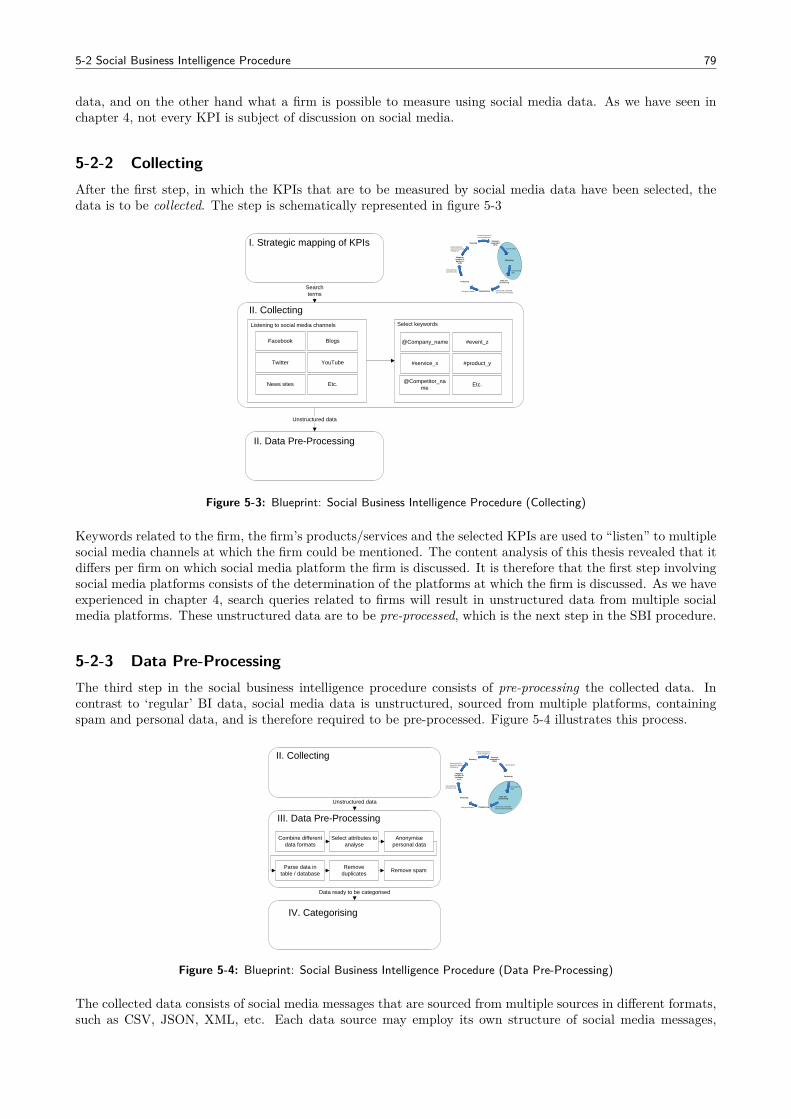
5-2 Social Business Intelligence Procedure 79
data, and on the other hand what a firm is possible to measure using social media data. As we have seen inchapter 4, not every KPI is subject of discussion on social media.
5-2-2 CollectingAfter the first step, in which the KPIs that are to be measured by social media data have been selected, thedata is to be collected. The step is schematically represented in figure 5-3
II. Collecting
Blogs
YouTube
News sites Etc.
Listening to social media channels
@Company_name
#service_x
#event_z
#product_y
@Competitor_name Etc.
Select keywords
I. Strategic mapping of KPIs
II. Data Pre-Processing
Unstructured data
Searchterms
Strategic mapping of
KPIs
Collecting
Data pre-processing
Categorising
Analysing
Mapping insights to business
units
Reacting
Search terms
Unstructureddata
Structured, combined(and anonymised) data
Categorised data
Information forbusiness units
Action plan(s) to respond to gainedintelligence
Reaction based onsocial intelligence
Figure 5-3: Blueprint: Social Business Intelligence Procedure (Collecting)
Keywords related to the firm, the firm’s products/services and the selected KPIs are used to “listen” to multiplesocial media channels at which the firm could be mentioned. The content analysis of this thesis revealed that itdiffers per firm on which social media platform the firm is discussed. It is therefore that the first step involvingsocial media platforms consists of the determination of the platforms at which the firm is discussed. As we haveexperienced in chapter 4, search queries related to firms will result in unstructured data from multiple socialmedia platforms. These unstructured data are to be pre-processed, which is the next step in the SBI procedure.
5-2-3 Data Pre-ProcessingThe third step in the social business intelligence procedure consists of pre-processing the collected data. Incontrast to ‘regular’ BI data, social media data is unstructured, sourced from multiple platforms, containingspam and personal data, and is therefore required to be pre-processed. Figure 5-4 illustrates this process.
III. Data Pre-Processing
Select attributes to analyse
Combine different data formats
IV. Categorising
II. Collecting
Unstructured data
Remove duplicates Remove spam
Data ready to be categorised
Anonymise personal data
Strategic mapping of
KPIs
Collecting
Data pre-processing
Categorising
Analysing
Mapping insights to business
units
Reacting
Search terms
Unstructureddata
Structured, combined(and anonymised) data
Categorised data
Information forbusiness units
Action plan(s) to respond to gainedintelligence
Reaction based onsocial intelligence
Parse data in table / database
Figure 5-4: Blueprint: Social Business Intelligence Procedure (Data Pre-Processing)
The collected data consists of social media messages that are sourced from multiple sources in different formats,such as CSV, JSON, XML, etc. Each data source may employ its own structure of social media messages,
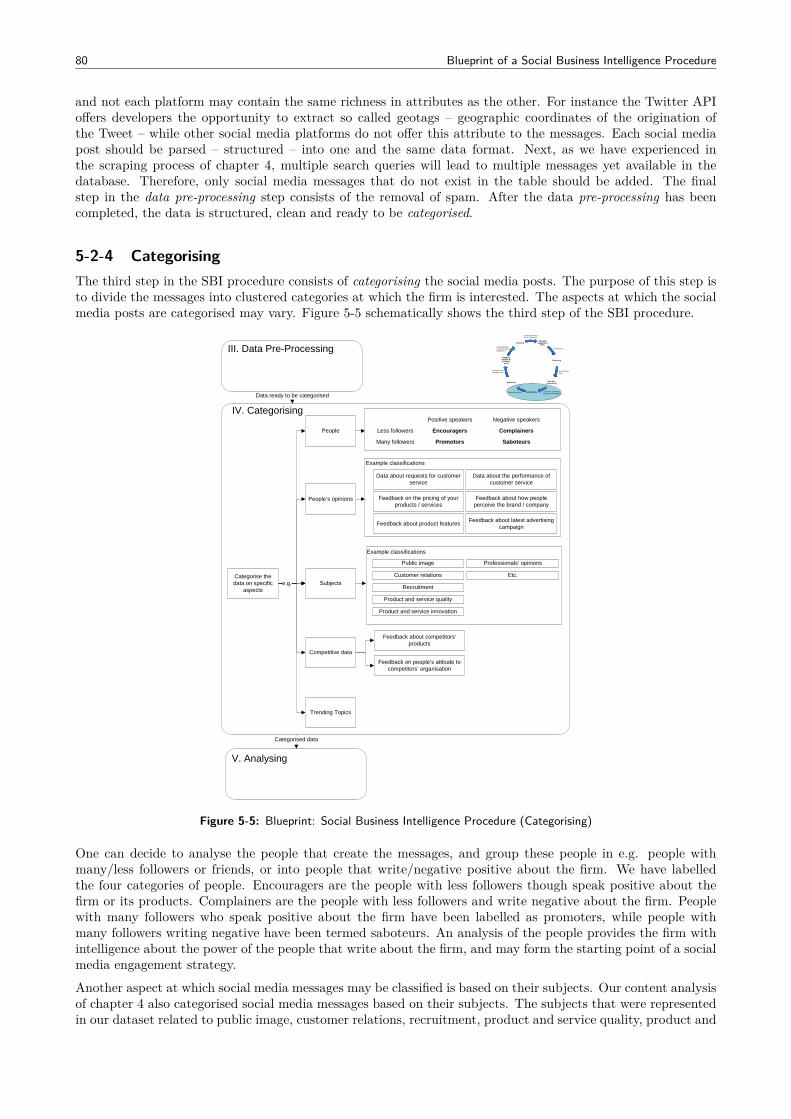
80 Blueprint of a Social Business Intelligence Procedure
and not each platform may contain the same richness in attributes as the other. For instance the Twitter APIoffers developers the opportunity to extract so called geotags – geographic coordinates of the origination ofthe Tweet – while other social media platforms do not offer this attribute to the messages. Each social mediapost should be parsed – structured – into one and the same data format. Next, as we have experienced inthe scraping process of chapter 4, multiple search queries will lead to multiple messages yet available in thedatabase. Therefore, only social media messages that do not exist in the table should be added. The finalstep in the data pre-processing step consists of the removal of spam. After the data pre-processing has beencompleted, the data is structured, clean and ready to be categorised.
5-2-4 CategorisingThe third step in the SBI procedure consists of categorising the social media posts. The purpose of this step isto divide the messages into clustered categories at which the firm is interested. The aspects at which the socialmedia posts are categorised may vary. Figure 5-5 schematically shows the third step of the SBI procedure.
IV. Categorising
Categorise the data on specific
aspects
People
Competitive data
Feedback about competitors’ products
Feedback on people’s attitude to competitors’ organisation
Feedback about latest advertising campaignFeedback about product features
Feedback about how people perceive the brand / company
People’s opinions
Data about requests for customer service
Data about the performance of customer service
Feedback on the pricing of your products / services
Example classifications
Less followers
Many followers
Positive speakers
Encouragers
Promotors
Negative speakers
Complainers
Saboteurs
Subjectse.g.
Example classifications
Public image
Customer relations
Recruitment
Product and service quality
Product and service innovation
Professionals’ opinions
Etc.
Trending Topics
III. Data Pre-Processing
Data ready to be categorised
V. Analysing
Categorised data
Strategic mapping of
KPIs
Collecting
Data pre-processing
Categorising
Analysing
Mapping insights to business
units
Reacting
Search terms
Unstructureddata
Structured, combined(and anonymised) data
Categorised data
Information forbusiness units
Action plan(s) to respond to gainedintelligence
Reaction based onsocial intelligence
Figure 5-5: Blueprint: Social Business Intelligence Procedure (Categorising)
One can decide to analyse the people that create the messages, and group these people in e.g. people withmany/less followers or friends, or into people that write/negative positive about the firm. We have labelledthe four categories of people. Encouragers are the people with less followers though speak positive about thefirm or its products. Complainers are the people with less followers and write negative about the firm. Peoplewith many followers who speak positive about the firm have been labelled as promoters, while people withmany followers writing negative have been termed saboteurs. An analysis of the people provides the firm withintelligence about the power of the people that write about the firm, and may form the starting point of a socialmedia engagement strategy.
Another aspect at which social media messages may be classified is based on their subjects. Our content analysisof chapter 4 also categorised social media messages based on their subjects. The subjects that were representedin our dataset related to public image, customer relations, recruitment, product and service quality, product and
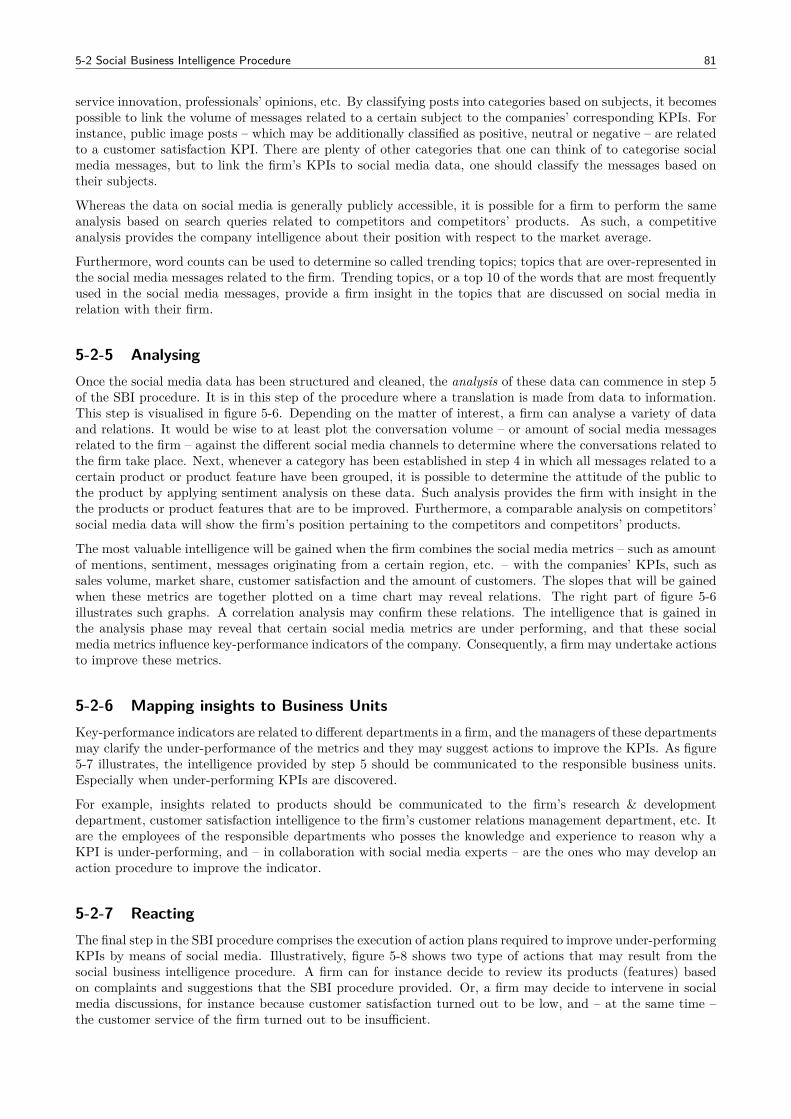
5-2 Social Business Intelligence Procedure 81
service innovation, professionals’ opinions, etc. By classifying posts into categories based on subjects, it becomespossible to link the volume of messages related to a certain subject to the companies’ corresponding KPIs. Forinstance, public image posts – which may be additionally classified as positive, neutral or negative – are relatedto a customer satisfaction KPI. There are plenty of other categories that one can think of to categorise socialmedia messages, but to link the firm’s KPIs to social media data, one should classify the messages based ontheir subjects.
Whereas the data on social media is generally publicly accessible, it is possible for a firm to perform the sameanalysis based on search queries related to competitors and competitors’ products. As such, a competitiveanalysis provides the company intelligence about their position with respect to the market average.
Furthermore, word counts can be used to determine so called trending topics; topics that are over-represented inthe social media messages related to the firm. Trending topics, or a top 10 of the words that are most frequentlyused in the social media messages, provide a firm insight in the topics that are discussed on social media inrelation with their firm.
5-2-5 AnalysingOnce the social media data has been structured and cleaned, the analysis of these data can commence in step 5of the SBI procedure. It is in this step of the procedure where a translation is made from data to information.This step is visualised in figure 5-6. Depending on the matter of interest, a firm can analyse a variety of dataand relations. It would be wise to at least plot the conversation volume – or amount of social media messagesrelated to the firm – against the different social media channels to determine where the conversations related tothe firm take place. Next, whenever a category has been established in step 4 in which all messages related to acertain product or product feature have been grouped, it is possible to determine the attitude of the public tothe product by applying sentiment analysis on these data. Such analysis provides the firm with insight in thethe products or product features that are to be improved. Furthermore, a comparable analysis on competitors’social media data will show the firm’s position pertaining to the competitors and competitors’ products.
The most valuable intelligence will be gained when the firm combines the social media metrics – such as amountof mentions, sentiment, messages originating from a certain region, etc. – with the companies’ KPIs, such assales volume, market share, customer satisfaction and the amount of customers. The slopes that will be gainedwhen these metrics are together plotted on a time chart may reveal relations. The right part of figure 5-6illustrates such graphs. A correlation analysis may confirm these relations. The intelligence that is gained inthe analysis phase may reveal that certain social media metrics are under performing, and that these socialmedia metrics influence key-performance indicators of the company. Consequently, a firm may undertake actionsto improve these metrics.
5-2-6 Mapping insights to Business UnitsKey-performance indicators are related to different departments in a firm, and the managers of these departmentsmay clarify the under-performance of the metrics and they may suggest actions to improve the KPIs. As figure5-7 illustrates, the intelligence provided by step 5 should be communicated to the responsible business units.Especially when under-performing KPIs are discovered.
For example, insights related to products should be communicated to the firm’s research & developmentdepartment, customer satisfaction intelligence to the firm’s customer relations management department, etc. Itare the employees of the responsible departments who posses the knowledge and experience to reason why aKPI is under-performing, and – in collaboration with social media experts – are the ones who may develop anaction procedure to improve the indicator.
5-2-7 ReactingThe final step in the SBI procedure comprises the execution of action plans required to improve under-performingKPIs by means of social media. Illustratively, figure 5-8 shows two type of actions that may result from thesocial business intelligence procedure. A firm can for instance decide to review its products (features) basedon complaints and suggestions that the SBI procedure provided. Or, a firm may decide to intervene in socialmedia discussions, for instance because customer satisfaction turned out to be low, and – at the same time –the customer service of the firm turned out to be insufficient.
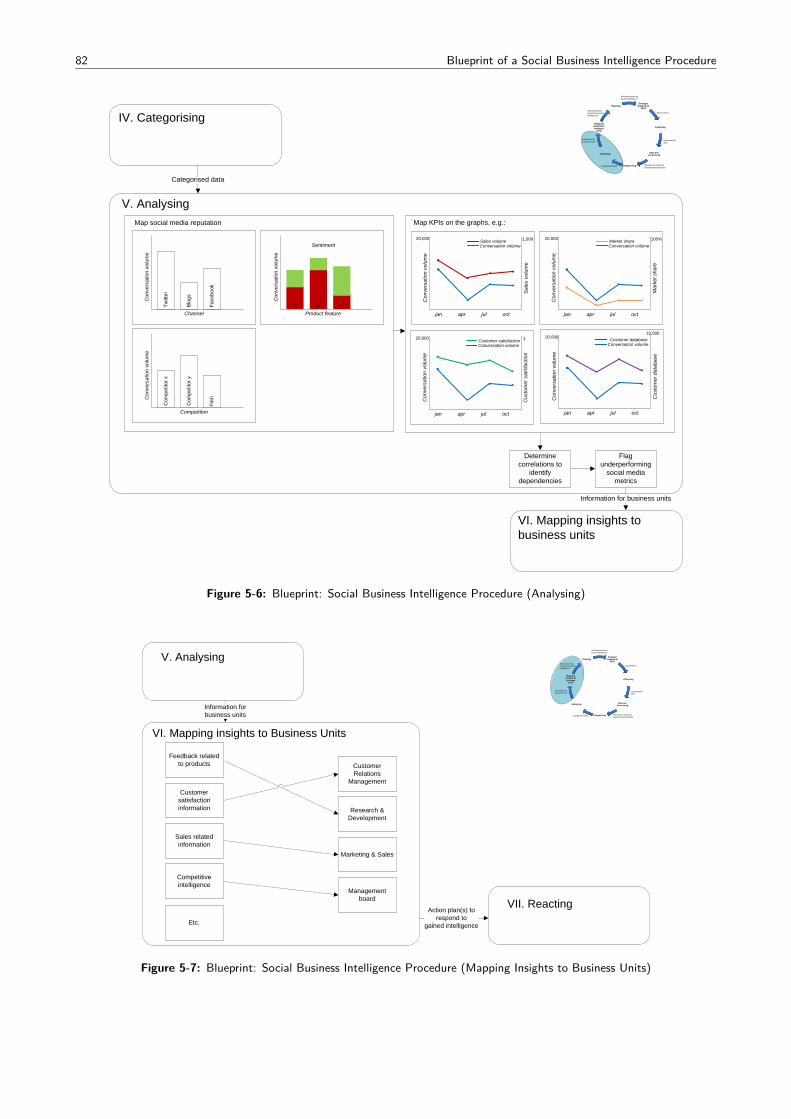
82 Blueprint of a Social Business Intelligence Procedure
V. Analysing
Com
petit
or x
Com
petit
or y
Firm
Competition
Con
vers
atio
n vo
lum
e
Twitt
er
Blo
gs
Face
book
Channel
Con
vers
atio
n vo
lum
e
Map KPIs on the graphs, e.g.:
jan apr jul oct
Con
vers
atio
n vo
lum
e
Sales volume
Sal
es v
olum
e
20,000 1,000Conversation volume
jan apr jul oct
Con
vers
atio
n vo
lum
e
Customer satisfaction
Cus
tom
er s
atis
fact
ion
20,000 1Conversation volume
jan apr jul oct
Con
vers
atio
n vo
lum
e
Market share
Mar
ket s
hare
20,000 100%Conversation volume
a b c
Product feature
Con
vers
atio
n vo
lum
e
Sentiment
Determine correlations to
identify dependencies
Map social media reputation
Flag underperforming
social media metrics
jan apr jul oct
Con
vers
atio
n vo
lum
e
Customer database
Cus
tom
er d
atab
ase
20,00010,000
Conversation volume
VI. Mapping insights to business units
IV. Categorising
Categorised data
Information for business units
Strategic mapping of
KPIs
Collecting
Data pre-processing
Categorising
Analysing
Mapping insights to business
units
Reacting
Search terms
Unstructureddata
Structured, combined(and anonymised) data
Categorised data
Information forbusiness units
Action plan(s) to respond to gainedintelligence
Reaction based onsocial intelligence
Figure 5-6: Blueprint: Social Business Intelligence Procedure (Analysing)
VII. ReactVII. Reacting
VI. Mapping insights to Business Units
Customer Relations
Management
Research & Development
Marketing & Sales
Customer satisfaction information
Feedback related to products
Sales related information
Management board
Competitive intelligence
Action plan(s) to respond to
gained intelligenceEtc.
V. AnalysisV. Analysing
Information forbusiness units
Strategic mapping of
KPIs
Collecting
Data pre-processing
Categorising
Analysing
Mapping insights to business
units
Reacting
Search terms
Unstructureddata
Structured, combined(and anonymised) data
Categorised data
Information forbusiness units
Action plan(s) to respond to gainedintelligence
Reaction based onsocial intelligence
Figure 5-7: Blueprint: Social Business Intelligence Procedure (Mapping Insights to Business Units)
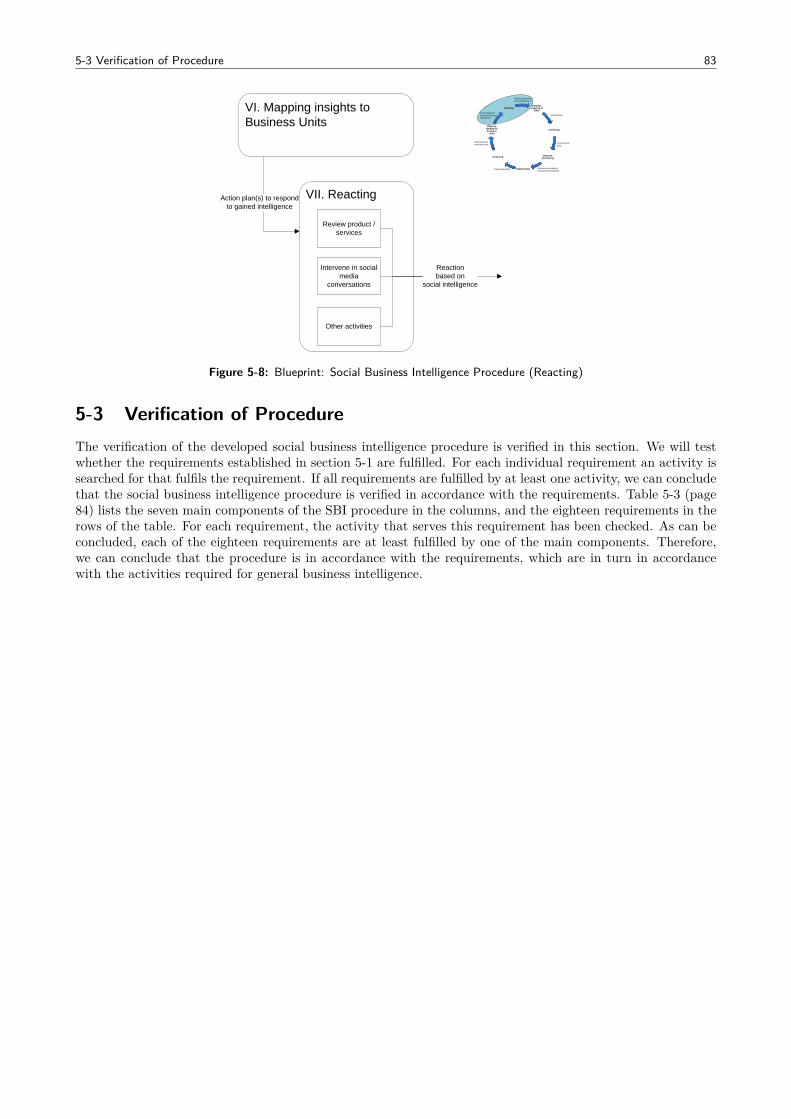
5-3 Verification of Procedure 83
VII. Reacting
Review product / services
Intervene in social media
conversations
Other activities
Reactionbased on
social intelligence
VI. Mapping insights to Business Units
Action plan(s) to respondto gained intelligence
Strategic mapping of
KPIs
Collecting
Data pre-processing
Categorising
Analysing
Mapping insights to business
units
Reacting
Search terms
Unstructureddata
Structured, combined(and anonymised) data
Categorised data
Information forbusiness units
Action plan(s) to respond to gainedintelligence
Reaction based onsocial intelligence
Figure 5-8: Blueprint: Social Business Intelligence Procedure (Reacting)
5-3 Verification of ProcedureThe verification of the developed social business intelligence procedure is verified in this section. We will testwhether the requirements established in section 5-1 are fulfilled. For each individual requirement an activity issearched for that fulfils the requirement. If all requirements are fulfilled by at least one activity, we can concludethat the social business intelligence procedure is verified in accordance with the requirements. Table 5-3 (page84) lists the seven main components of the SBI procedure in the columns, and the eighteen requirements in therows of the table. For each requirement, the activity that serves this requirement has been checked. As can beconcluded, each of the eighteen requirements are at least fulfilled by one of the main components. Therefore,we can conclude that the procedure is in accordance with the requirements, which are in turn in accordancewith the activities required for general business intelligence.
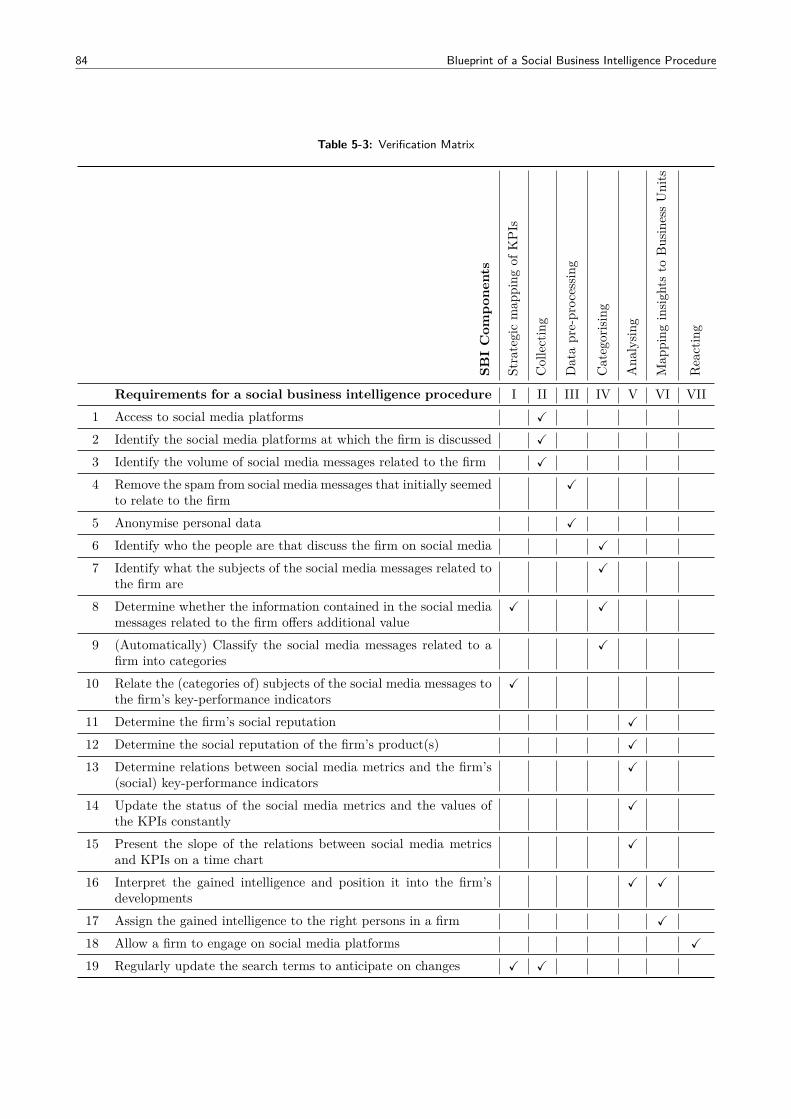
84 Blueprint of a Social Business Intelligence Procedure
Table 5-3: Verification Matrix
SBICom
pone
nts
Strategicmap
ping
ofKPI
s
Collecting
Datapre-processin
g
Categorising
Ana
lysin
g
Map
ping
insig
htsto
BusinessUnits
Reacting
Requirements for a social business intelligence procedure I II III IV V VI VII1 Access to social media platforms X
2 Identify the social media platforms at which the firm is discussed X
3 Identify the volume of social media messages related to the firm X
4 Remove the spam from social media messages that initially seemedto relate to the firm
X
5 Anonymise personal data X
6 Identify who the people are that discuss the firm on social media X
7 Identify what the subjects of the social media messages related tothe firm are
X
8 Determine whether the information contained in the social mediamessages related to the firm offers additional value
X X
9 (Automatically) Classify the social media messages related to afirm into categories
X
10 Relate the (categories of) subjects of the social media messages tothe firm’s key-performance indicators
X
11 Determine the firm’s social reputation X
12 Determine the social reputation of the firm’s product(s) X
13 Determine relations between social media metrics and the firm’s(social) key-performance indicators
X
14 Update the status of the social media metrics and the values ofthe KPIs constantly
X
15 Present the slope of the relations between social media metricsand KPIs on a time chart
X
16 Interpret the gained intelligence and position it into the firm’sdevelopments
X X
17 Assign the gained intelligence to the right persons in a firm X
18 Allow a firm to engage on social media platforms X
19 Regularly update the search terms to anticipate on changes X X
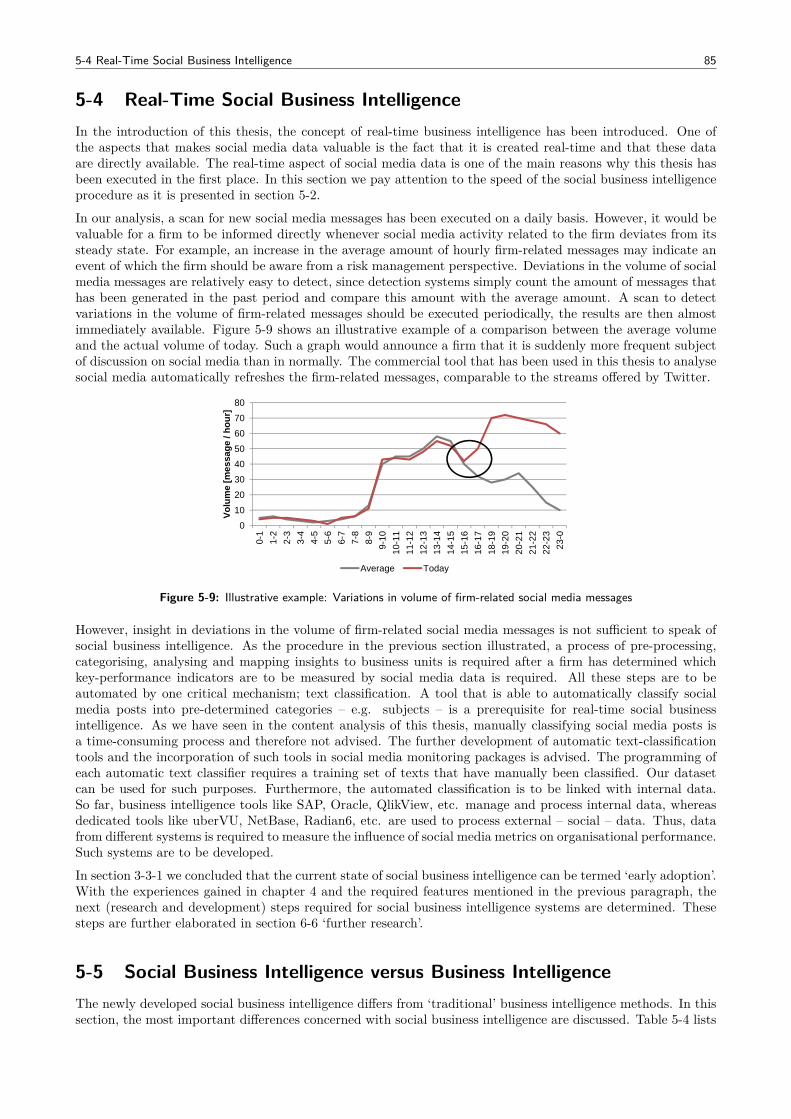
5-4 Real-Time Social Business Intelligence 85
5-4 Real-Time Social Business IntelligenceIn the introduction of this thesis, the concept of real-time business intelligence has been introduced. One ofthe aspects that makes social media data valuable is the fact that it is created real-time and that these dataare directly available. The real-time aspect of social media data is one of the main reasons why this thesis hasbeen executed in the first place. In this section we pay attention to the speed of the social business intelligenceprocedure as it is presented in section 5-2.
In our analysis, a scan for new social media messages has been executed on a daily basis. However, it would bevaluable for a firm to be informed directly whenever social media activity related to the firm deviates from itssteady state. For example, an increase in the average amount of hourly firm-related messages may indicate anevent of which the firm should be aware from a risk management perspective. Deviations in the volume of socialmedia messages are relatively easy to detect, since detection systems simply count the amount of messages thathas been generated in the past period and compare this amount with the average amount. A scan to detectvariations in the volume of firm-related messages should be executed periodically, the results are then almostimmediately available. Figure 5-9 shows an illustrative example of a comparison between the average volumeand the actual volume of today. Such a graph would announce a firm that it is suddenly more frequent subjectof discussion on social media than in normally. The commercial tool that has been used in this thesis to analysesocial media automatically refreshes the firm-related messages, comparable to the streams offered by Twitter.
0
10
20
30
40
50
60
70
80
0-1
1-2
2-3
3-4
4-5
5-6
6-7
7-8
8-9
9-1
0
10
-11
11
-12
12
-13
13
-14
14
-15
15
-16
16
-17
18
-19
19
-20
20
-21
21
-22
22
-23
23
-0
Vo
lum
e [
mes
sag
e /
ho
ur]
Average Today
Figure 5-9: Illustrative example: Variations in volume of firm-related social media messages
However, insight in deviations in the volume of firm-related social media messages is not sufficient to speak ofsocial business intelligence. As the procedure in the previous section illustrated, a process of pre-processing,categorising, analysing and mapping insights to business units is required after a firm has determined whichkey-performance indicators are to be measured by social media data is required. All these steps are to beautomated by one critical mechanism; text classification. A tool that is able to automatically classify socialmedia posts into pre-determined categories – e.g. subjects – is a prerequisite for real-time social businessintelligence. As we have seen in the content analysis of this thesis, manually classifying social media posts isa time-consuming process and therefore not advised. The further development of automatic text-classificationtools and the incorporation of such tools in social media monitoring packages is advised. The programming ofeach automatic text classifier requires a training set of texts that have manually been classified. Our datasetcan be used for such purposes. Furthermore, the automated classification is to be linked with internal data.So far, business intelligence tools like SAP, Oracle, QlikView, etc. manage and process internal data, whereasdedicated tools like uberVU, NetBase, Radian6, etc. are used to process external – social – data. Thus, datafrom different systems is required to measure the influence of social media metrics on organisational performance.Such systems are to be developed.
In section 3-3-1 we concluded that the current state of social business intelligence can be termed ‘early adoption’.With the experiences gained in chapter 4 and the required features mentioned in the previous paragraph, thenext (research and development) steps required for social business intelligence systems are determined. Thesesteps are further elaborated in section 6-6 ‘further research’.
5-5 Social Business Intelligence versus Business IntelligenceThe newly developed social business intelligence differs from ‘traditional’ business intelligence methods. In thissection, the most important differences concerned with social business intelligence are discussed. Table 5-4 lists
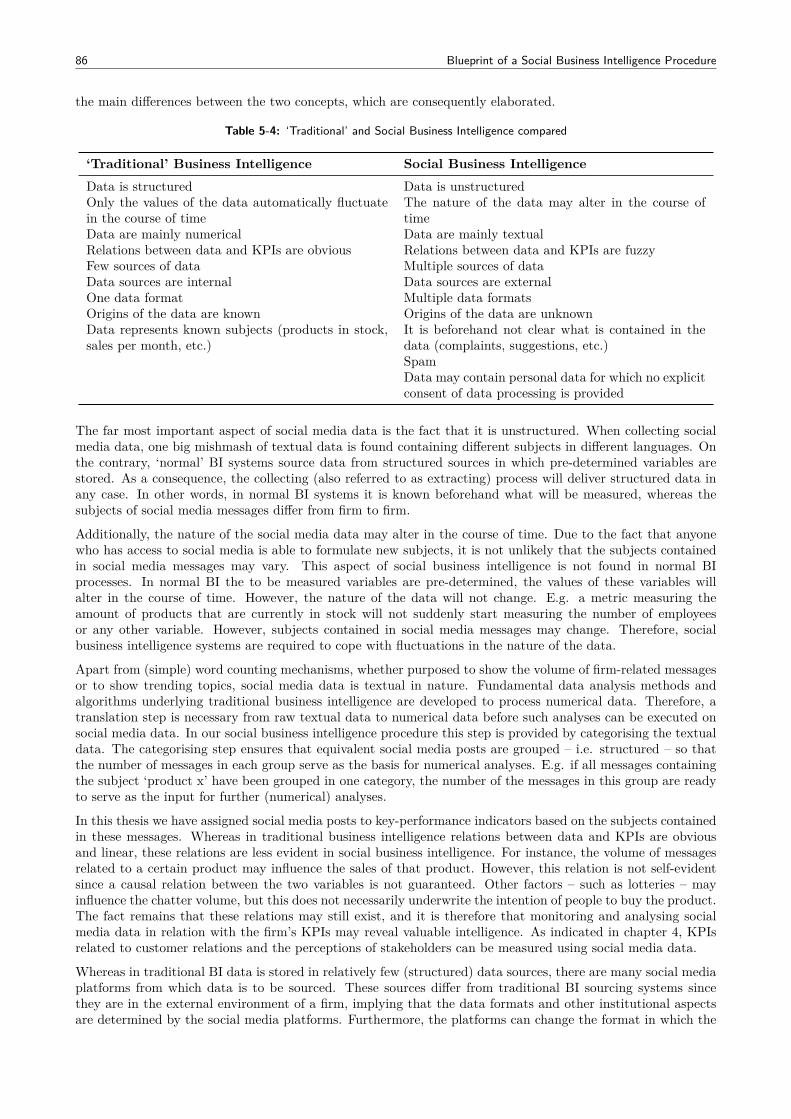
86 Blueprint of a Social Business Intelligence Procedure
the main differences between the two concepts, which are consequently elaborated.
Table 5-4: ‘Traditional’ and Social Business Intelligence compared
‘Traditional’ Business Intelligence Social Business IntelligenceData is structured Data is unstructuredOnly the values of the data automatically fluctuatein the course of time
The nature of the data may alter in the course oftime
Data are mainly numerical Data are mainly textualRelations between data and KPIs are obvious Relations between data and KPIs are fuzzyFew sources of data Multiple sources of dataData sources are internal Data sources are externalOne data format Multiple data formatsOrigins of the data are known Origins of the data are unknownData represents known subjects (products in stock,sales per month, etc.)
It is beforehand not clear what is contained in thedata (complaints, suggestions, etc.)SpamData may contain personal data for which no explicitconsent of data processing is provided
The far most important aspect of social media data is the fact that it is unstructured. When collecting socialmedia data, one big mishmash of textual data is found containing different subjects in different languages. Onthe contrary, ‘normal’ BI systems source data from structured sources in which pre-determined variables arestored. As a consequence, the collecting (also referred to as extracting) process will deliver structured data inany case. In other words, in normal BI systems it is known beforehand what will be measured, whereas thesubjects of social media messages differ from firm to firm.
Additionally, the nature of the social media data may alter in the course of time. Due to the fact that anyonewho has access to social media is able to formulate new subjects, it is not unlikely that the subjects containedin social media messages may vary. This aspect of social business intelligence is not found in normal BIprocesses. In normal BI the to be measured variables are pre-determined, the values of these variables willalter in the course of time. However, the nature of the data will not change. E.g. a metric measuring theamount of products that are currently in stock will not suddenly start measuring the number of employeesor any other variable. However, subjects contained in social media messages may change. Therefore, socialbusiness intelligence systems are required to cope with fluctuations in the nature of the data.
Apart from (simple) word counting mechanisms, whether purposed to show the volume of firm-related messagesor to show trending topics, social media data is textual in nature. Fundamental data analysis methods andalgorithms underlying traditional business intelligence are developed to process numerical data. Therefore, atranslation step is necessary from raw textual data to numerical data before such analyses can be executed onsocial media data. In our social business intelligence procedure this step is provided by categorising the textualdata. The categorising step ensures that equivalent social media posts are grouped – i.e. structured – so thatthe number of messages in each group serve as the basis for numerical analyses. E.g. if all messages containingthe subject ‘product x’ have been grouped in one category, the number of the messages in this group are readyto serve as the input for further (numerical) analyses.
In this thesis we have assigned social media posts to key-performance indicators based on the subjects containedin these messages. Whereas in traditional business intelligence relations between data and KPIs are obviousand linear, these relations are less evident in social business intelligence. For instance, the volume of messagesrelated to a certain product may influence the sales of that product. However, this relation is not self-evidentsince a causal relation between the two variables is not guaranteed. Other factors – such as lotteries – mayinfluence the chatter volume, but this does not necessarily underwrite the intention of people to buy the product.The fact remains that these relations may still exist, and it is therefore that monitoring and analysing socialmedia data in relation with the firm’s KPIs may reveal valuable intelligence. As indicated in chapter 4, KPIsrelated to customer relations and the perceptions of stakeholders can be measured using social media data.
Whereas in traditional BI data is stored in relatively few (structured) data sources, there are many social mediaplatforms from which data is to be sourced. These sources differ from traditional BI sourcing systems sincethey are in the external environment of a firm, implying that the data formats and other institutional aspectsare determined by the social media platforms. Furthermore, the platforms can change the format in which the
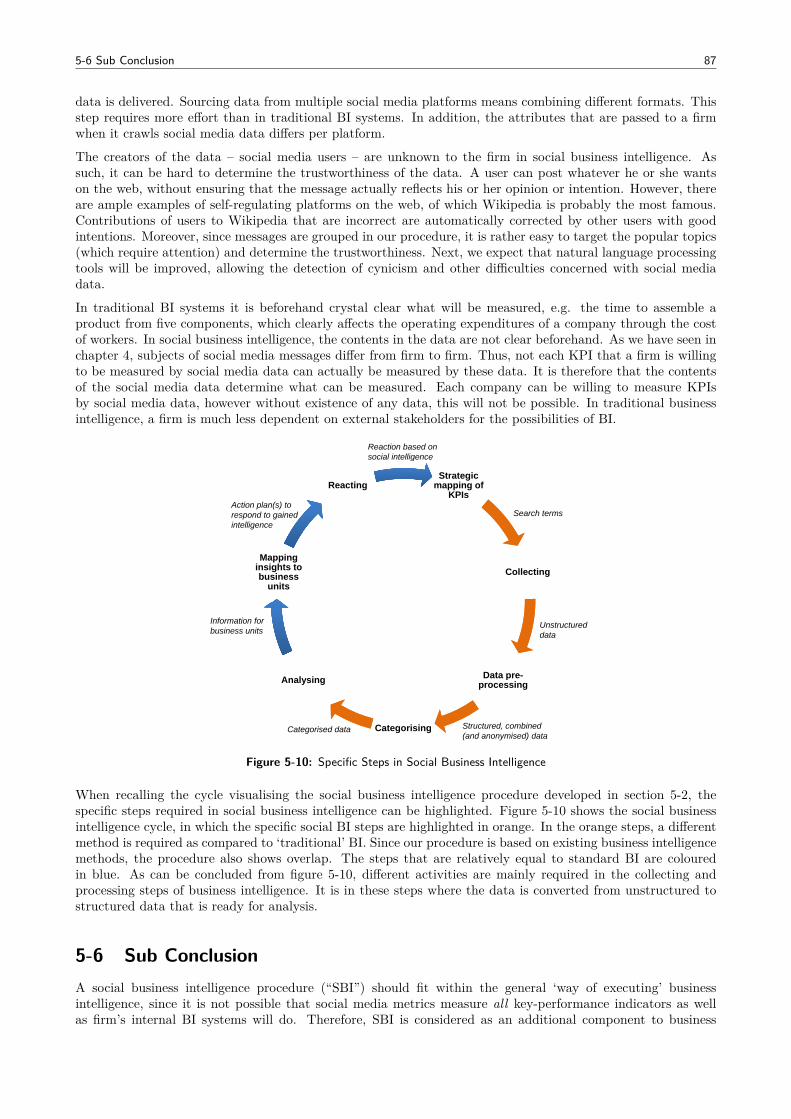
5-6 Sub Conclusion 87
data is delivered. Sourcing data from multiple social media platforms means combining different formats. Thisstep requires more effort than in traditional BI systems. In addition, the attributes that are passed to a firmwhen it crawls social media data differs per platform.
The creators of the data – social media users – are unknown to the firm in social business intelligence. Assuch, it can be hard to determine the trustworthiness of the data. A user can post whatever he or she wantson the web, without ensuring that the message actually reflects his or her opinion or intention. However, thereare ample examples of self-regulating platforms on the web, of which Wikipedia is probably the most famous.Contributions of users to Wikipedia that are incorrect are automatically corrected by other users with goodintentions. Moreover, since messages are grouped in our procedure, it is rather easy to target the popular topics(which require attention) and determine the trustworthiness. Next, we expect that natural language processingtools will be improved, allowing the detection of cynicism and other difficulties concerned with social mediadata.
In traditional BI systems it is beforehand crystal clear what will be measured, e.g. the time to assemble aproduct from five components, which clearly affects the operating expenditures of a company through the costof workers. In social business intelligence, the contents in the data are not clear beforehand. As we have seen inchapter 4, subjects of social media messages differ from firm to firm. Thus, not each KPI that a firm is willingto be measured by social media data can actually be measured by these data. It is therefore that the contentsof the social media data determine what can be measured. Each company can be willing to measure KPIsby social media data, however without existence of any data, this will not be possible. In traditional businessintelligence, a firm is much less dependent on external stakeholders for the possibilities of BI.
Reaction based onsocial intelligence
Strategic mapping of
KPIsReacting
Search termsAction plan(s) to respond to gainedintelligence
g
CollectingMapping
insights to business
units
Data pre
Unstructureddata
Information forbusiness units
Data pre-processing
Categorising
Analysing
Structured, combined(and anonymised) data
Categorised data
Figure 5-10: Specific Steps in Social Business Intelligence
When recalling the cycle visualising the social business intelligence procedure developed in section 5-2, thespecific steps required in social business intelligence can be highlighted. Figure 5-10 shows the social businessintelligence cycle, in which the specific social BI steps are highlighted in orange. In the orange steps, a differentmethod is required as compared to ‘traditional’ BI. Since our procedure is based on existing business intelligencemethods, the procedure also shows overlap. The steps that are relatively equal to standard BI are colouredin blue. As can be concluded from figure 5-10, different activities are mainly required in the collecting andprocessing steps of business intelligence. It is in these steps where the data is converted from unstructured tostructured data that is ready for analysis.
5-6 Sub ConclusionA social business intelligence procedure (“SBI”) should fit within the general ‘way of executing’ businessintelligence, since it is not possible that social media metrics measure all key-performance indicators as wellas firm’s internal BI systems will do. Therefore, SBI is considered as an additional component to business
88 Blueprint of a Social Business Intelligence Procedure
intelligence, rather than a replacing procedure. However, as the content analysis of chapter 4 illustrated, thereare certain categories of KPIs that are influenced by – or at least related to – a substantial amount of socialmedia messages that are related to the firm. For these type of KPIs, which differ from firm to firm, a procedurehas been developed that prescribes the necessary steps to acquire, process and finally gain intelligence fromfirm related social media messages. The procedure is based on general BI concepts, existing technologic socialmedia analysis solutions and the experience gained in the execution of a content analysis into the social mediamessages related to eighteen different firms.
A SBI procedure consists of seven main components, being (i) strategic mapping of KPIs, (ii) collecting, (iii)data pre-processing, (iv) categorising, (v) analysing, (vi) mapping insights to the business units, and (vii)reacting. The seven steps can be interpreted as a cycle, i.e. the output of the last step influences the first step.
(i) Strategic mapping of KPIs The very first step of social business intelligence sets the scene for the objectsthat are to be collected and analysed. Namely, in the first step the key-performance indicators that are tobe measured by social media data are selected. As we have seen in chapter 4, not each type of KPI is to bemeasured by social media data since there does simply not exist any related social media data to these typesof KPIs. Firms should mainly focus on KPIs related to customer relations, public image and – to a less extent– on product and service innovation when selecting KPIs that are to be measured using social media data.Whenever a firm has selected the social KPIs, it can start collecting the appropriate data.
(ii) Collecting The second step of the SBI procedure related to data collection. In contradiction to regular BIsystems, the data is to be sourced from external parties in social business intelligence. People create firm-relatedmessages on different platforms, of which the vast majority of publicly accessible messages are created on Twitter.The search terms that are used to filter out the content at which the firm is interested should be based on thesocial KPIs selected in the previous step.
(iii) Data pre-processing The social media data has been collected from multiple platforms which adhere totheir own data format. The different format are to be combined into one uniform database, so that – in alater step – data analysis can be applied on the complete dataset. Furthermore, the firm should select thoseattributes that are necessary for the analysis, not each platform offers the same richness of attributes to a socialmedia post. In addition, the data should be anonymised to be in compliance with new Regulations regardingdata privacy. Finally, spam – i.e. social media posts that do not relate to the firm – should be removed fromthe collected data.
(iv) Categorising The data pre-processing step resulted in a structured database in which the social mediamessages from multiple platforms are combined. In the categorising step, the messages are clustered on differentissues of interest, depending on the firm’s subject of interest. E.g., messages related to certain products can becategorised, or one can cluster the messages that are created by people with many followers, etc. Again, thecriteria at which the messages are categorised are determined by the selection of the social KPIs in the firststep.
(v) Analysing So far, the collected data has not provided any insights. It is in this step of the social businessintelligence procedure where data is transformed into information. The categories that were established in theprevious step are analysed in this step. For instance, sentiment analysis can be applied on the categories relatedto the firm’s products in order to acquire intelligence related to customer experiences of the products. However,the most valuable intelligence is gained when social media data is related to internal data. For instance, thevolume of social media messages related to a certain product may be correlated with the sales volume of thatproduct. It is in this phase of the SBI procedure where such relations are explored.
(vi) Mapping insights to business units In the first step of the procedure, KPIs have been selected. TheseKPIs typically relate to a certain function of the firm, and hence have an ‘owner’. The intelligence gained in theprevious step relates to KPIs, and should feed back to the owner of the KPI. Generally, it are the people in thefirm that are responsible for the KPI who are the ones that can reason how the KPI is influenced. Therefore,these people are the ones that can draft an action plan in case the KPI needs improvement.

5-6 Sub Conclusion 89
(vii) Reacting The final step of the social intelligence procedures consists of the execution of the action plansthat are developed in collaboration with people from the business lines that are responsible for the respectiveKPIs. Actions on the gained intelligence may involve revisions of internal processes or strategies, or externalinterventions such as social media engagement.
The developed social business intelligence procedure is based on general business intelligence processes, and therequirements of the social BI procedure have been derived from general BI processes. For the verification of theSBI procedure, all requirements have been checked on fulfilment by systematically tracking which requirementis fulfilled by which activity.
Chapter 6
Conclusions & Discussion
First of all, this chapter presents the conclusions of the research in section 6-1. In section 6-2 the contributionsof this work to existing and future research are discussed. Section 6-3 proceeds by discussing the implications ofthe findings in this thesis for practice. Section 6-4 consequently reflects on the thesis and the research process.In section 6-5 the research is critically reviewed, and limitations are discussed. Finally, section 6-6 providessuggestions for future research related to the subject of this thesis; social business intelligence.
6-1 ConclusionsFirms are increasingly using social media, while at the same time business intelligence systems are increasinglyapplied for performance measurement of business activities. Though these two concepts offer room for synthesis,it also raises questions related to the applicability and opportunities offered by combining social media andbusiness intelligence. So far, it is not clear which firms are able to find firm-related social media data and ifthey are able, how these data should be incorporated in the business intelligence processes of firms. As one ofthe first researches into the opportunities of leveraging social media data for BI purposes, this this was purposedto draw generic conclusions on the applicability of social business intelligence by distinguishing firms on genericaspects. Firms were distinguished on customer relation type – either B2C or B2B – and on industry type.Therefore, the main research question of this thesis has been formulated as:
How can firms use social media data for business intelligence, taking into account the firm’s specificindustry and relationship with end-users?
The main research question has been divided into three sub questions, which are answered in the followingsections. The first sub question was defined as:
1. What is the current state of social media in relation with business intelligence?
Social media is a natural consequence of Web 2.0, and can be defined as Web 2.0 based applications allowingusers to create and share user-generated content with pre-selected users and/or communities. The applicationsthrough which users are active are known as social media platforms. In 2012, there are many social mediaplatforms available, which differ in scope and functionality. Each platform adheres to its own policy regardingdata crawling and data format.
Social media is a topic on the agenda of many firms in 2012. Though many firms acknowledge the opportunitiesof social media, there also exists a degree of reluctance from managers towards social media. Research indicatesthat executives who avoid social media do not understand what social media is, how to engage with it and learnfrom it. On the other hand, firms that do embrace the world of social media particularly perform activities inthe field of marketing, customer relations management, reputation management and co-creation / prosumingactivities through the various social media platforms.
Business intelligence – irrespective of the variables to be measured – can be perceived as a cycle consistingof three main steps; (i) register, (ii) process and (iii) react. Before a BI cycle can commence, it has to be
6-1 Conclusions 91
determined ‘what to measure’. The variables that are to be registered are generally aligned with a firm’sstrategy and corresponding business model, termed key-performance indicators (“KPIs”). The three BI stepsare required when a firm intends to apply business intelligence on the firm’s social media activities. However,social media data differs from “regular” business information. Unlike internal business data, social media datais created by non-professionals and stored into a variety of databases that are owned by external parties whoemploy their own database structure and access limitations. Therefore, a different BI approach is required forsocial media data.
Firms employ different key-performance indicators. Especially lower level KPIs are firm specific, while top levelKPIs are generic and employed by many firms. Based on Adam & Neely’s (2001) generic performance prismperspectives, ten categories of key-performance indicators have been established. The ten categories are definedas (short-term) financial results, customer relations, employee relations, operational performance, product andservice quality, alliances, supplier relations, environmental performance, product and service innovation andcommunity. It are these categories of KPIs for which related social media data has been searched for.
In social business intelligence, a firm analyses the activities on social media related to the firm and determinesthe effect of these activities on the firm’s performance. Existing social media monitoring tools – which arebecoming increasingly available on the market – mainly reveal the performance of the firm on social media asa separate component of the firm. The intelligence that such monitoring tools provide relate to the volume ofposts, engagement of users, sentiment, geography, topics and themes in the social media messages, influencerranking, channel distribution, etc. However, the purpose of business intelligence is to reveal the underlyingparameters that determine the firm’s performance, that is, not limited to solely social media performance.In order to understand the influence of social media activities on the firm’s performance, a link between thecompany’s key-performance indicators and social media parameters is required. In social business intelligence,such links are required.
The second sub question was formulated as follows:
2. In which contexts are firms able to acquire social media data for business intelligence?
In this research, the context of a firm has been described based on two generic dimensions. Firstly, firmswere distinguished from each other based on the industry in which they operate. Secondly, firms’ contextswere described by distinguishing different customer relations types; i.e. B2B or B2C relations. The volume ofmessages that contain the name of a firm differs from firm to firm. E.g. in our sample 39.425 messages relatedto Heineken have been collected, while during the same period only 428 messages related to Fugro have beenfound. Our analysis indicates that there exists variation in the volume of firm-related social media posts acrossdifferent industries. Firms classified as industrials, information & communication were more frequently subjectof discussion on social media than consulting or mining & quarrying firms. Our analysis also illustrates thatthere exists variation in the volume of social media posts across B2B and B2C firms. B2C firms are far moreoften subject of discussion on social media than B2B firms.
Apart from an assessment of the volume of social media content related to firms, we analysed the subjects of themessages in order to gain an understanding of the type of information contained in the social media messages.Our analysis shows that the subjects of social media messages differ from firm to firm. The majority of socialmedia messages related to firms (41%) express how the external stakeholders of a firm perceive the company. Inthis thesis, such posts have been classified as community posts. 18% of the social media messages in our datasetcontained the name of a firm, but did not contain any valuable information for the firm and have consequentlybeen assigned as undefined posts. About 11% of the social media messages relate to financial results, whichconsist of financial performance discussions (5%) and stock related discussions (6%).
The content analysis of this research suggests that the subjects of social media messages related to B2Bfirms contain a higher percentage of short term financial results, news and professionals related messages thanmessages related to B2C firms. Unfortunately for B2B firms, such type of information is yet available internally.Acquiring social media data to gain additional management information is therefore of less value for B2B firms.Next, the analysis indicates that the social media messages related to B2C firms contain a higher percentageof posts related to customer relations, product and service quality and product and service innovation thanmessages related to B2B firms. It are these types of information that deliver additional value to the firm, sincethis information is not available at firms internally.
In addition, the content analysis of this research suggests that the subjects of social media posts differ betweenindustries, but that the majority of the subjects in each industry relates to community, i.e. social media posts
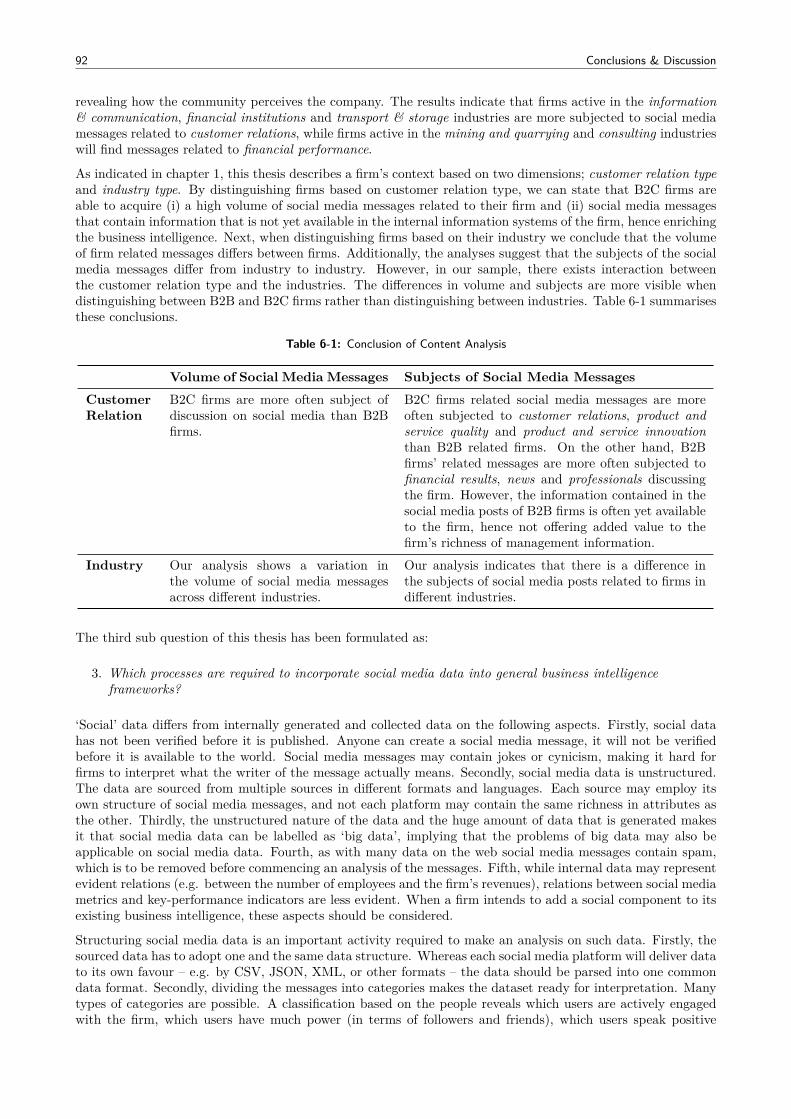
92 Conclusions & Discussion
revealing how the community perceives the company. The results indicate that firms active in the information& communication, financial institutions and transport & storage industries are more subjected to social mediamessages related to customer relations, while firms active in the mining and quarrying and consulting industrieswill find messages related to financial performance.
As indicated in chapter 1, this thesis describes a firm’s context based on two dimensions; customer relation typeand industry type. By distinguishing firms based on customer relation type, we can state that B2C firms areable to acquire (i) a high volume of social media messages related to their firm and (ii) social media messagesthat contain information that is not yet available in the internal information systems of the firm, hence enrichingthe business intelligence. Next, when distinguishing firms based on their industry we conclude that the volumeof firm related messages differs between firms. Additionally, the analyses suggest that the subjects of the socialmedia messages differ from industry to industry. However, in our sample, there exists interaction betweenthe customer relation type and the industries. The differences in volume and subjects are more visible whendistinguishing between B2B and B2C firms rather than distinguishing between industries. Table 6-1 summarisesthese conclusions.
Table 6-1: Conclusion of Content Analysis
Volume of Social Media Messages Subjects of Social Media MessagesCustomerRelation
B2C firms are more often subject ofdiscussion on social media than B2Bfirms.
B2C firms related social media messages are moreoften subjected to customer relations, product andservice quality and product and service innovationthan B2B related firms. On the other hand, B2Bfirms’ related messages are more often subjected tofinancial results, news and professionals discussingthe firm. However, the information contained in thesocial media posts of B2B firms is often yet availableto the firm, hence not offering added value to thefirm’s richness of management information.
Industry Our analysis shows a variation inthe volume of social media messagesacross different industries.
Our analysis indicates that there is a difference inthe subjects of social media posts related to firms indifferent industries.
The third sub question of this thesis has been formulated as:
3. Which processes are required to incorporate social media data into general business intelligenceframeworks?
‘Social’ data differs from internally generated and collected data on the following aspects. Firstly, social datahas not been verified before it is published. Anyone can create a social media message, it will not be verifiedbefore it is available to the world. Social media messages may contain jokes or cynicism, making it hard forfirms to interpret what the writer of the message actually means. Secondly, social media data is unstructured.The data are sourced from multiple sources in different formats and languages. Each source may employ itsown structure of social media messages, and not each platform may contain the same richness in attributes asthe other. Thirdly, the unstructured nature of the data and the huge amount of data that is generated makesit that social media data can be labelled as ‘big data’, implying that the problems of big data may also beapplicable on social media data. Fourth, as with many data on the web social media messages contain spam,which is to be removed before commencing an analysis of the messages. Fifth, while internal data may representevident relations (e.g. between the number of employees and the firm’s revenues), relations between social mediametrics and key-performance indicators are less evident. When a firm intends to add a social component to itsexisting business intelligence, these aspects should be considered.
Structuring social media data is an important activity required to make an analysis on such data. Firstly, thesourced data has to adopt one and the same data structure. Whereas each social media platform will deliver datato its own favour – e.g. by CSV, JSON, XML, or other formats – the data should be parsed into one commondata format. Secondly, dividing the messages into categories makes the dataset ready for interpretation. Manytypes of categories are possible. A classification based on the people reveals which users are actively engagedwith the firm, which users have much power (in terms of followers and friends), which users speak positive
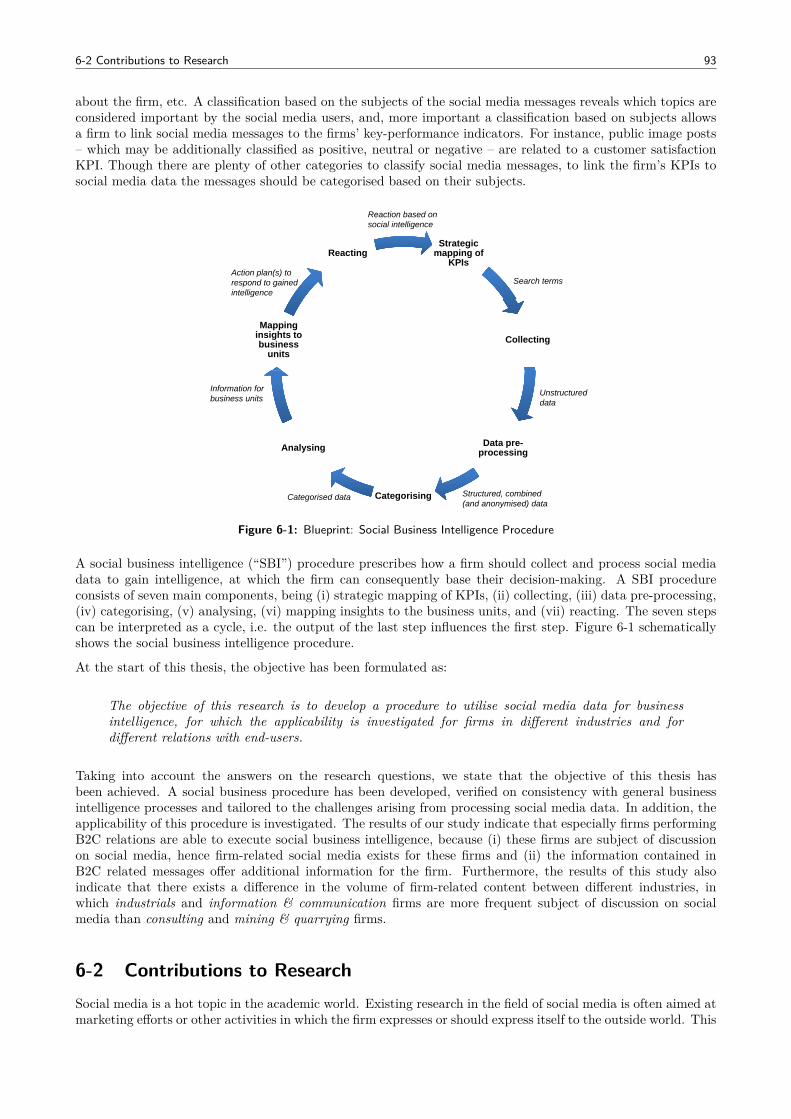
6-2 Contributions to Research 93
about the firm, etc. A classification based on the subjects of the social media messages reveals which topics areconsidered important by the social media users, and, more important a classification based on subjects allowsa firm to link social media messages to the firms’ key-performance indicators. For instance, public image posts– which may be additionally classified as positive, neutral or negative – are related to a customer satisfactionKPI. Though there are plenty of other categories to classify social media messages, to link the firm’s KPIs tosocial media data the messages should be categorised based on their subjects.
Reaction based onsocial intelligence
Strategic mapping of
KPIsReacting
Search termsAction plan(s) to respond to gainedintelligence
g
CollectingMapping
insights to business
units
Data pre
Unstructureddata
Information forbusiness units
Data pre-processing
Categorising
Analysing
Structured, combined(and anonymised) data
Categorised data
Figure 6-1: Blueprint: Social Business Intelligence Procedure
A social business intelligence (“SBI”) procedure prescribes how a firm should collect and process social mediadata to gain intelligence, at which the firm can consequently base their decision-making. A SBI procedureconsists of seven main components, being (i) strategic mapping of KPIs, (ii) collecting, (iii) data pre-processing,(iv) categorising, (v) analysing, (vi) mapping insights to the business units, and (vii) reacting. The seven stepscan be interpreted as a cycle, i.e. the output of the last step influences the first step. Figure 6-1 schematicallyshows the social business intelligence procedure.
At the start of this thesis, the objective has been formulated as:
The objective of this research is to develop a procedure to utilise social media data for businessintelligence, for which the applicability is investigated for firms in different industries and fordifferent relations with end-users.
Taking into account the answers on the research questions, we state that the objective of this thesis hasbeen achieved. A social business procedure has been developed, verified on consistency with general businessintelligence processes and tailored to the challenges arising from processing social media data. In addition, theapplicability of this procedure is investigated. The results of our study indicate that especially firms performingB2C relations are able to execute social business intelligence, because (i) these firms are subject of discussionon social media, hence firm-related social media exists for these firms and (ii) the information contained inB2C related messages offer additional information for the firm. Furthermore, the results of this study alsoindicate that there exists a difference in the volume of firm-related content between different industries, inwhich industrials and information & communication firms are more frequent subject of discussion on socialmedia than consulting and mining & quarrying firms.
6-2 Contributions to ResearchSocial media is a hot topic in the academic world. Existing research in the field of social media is often aimed atmarketing efforts or other activities in which the firm expresses or should express itself to the outside world. This
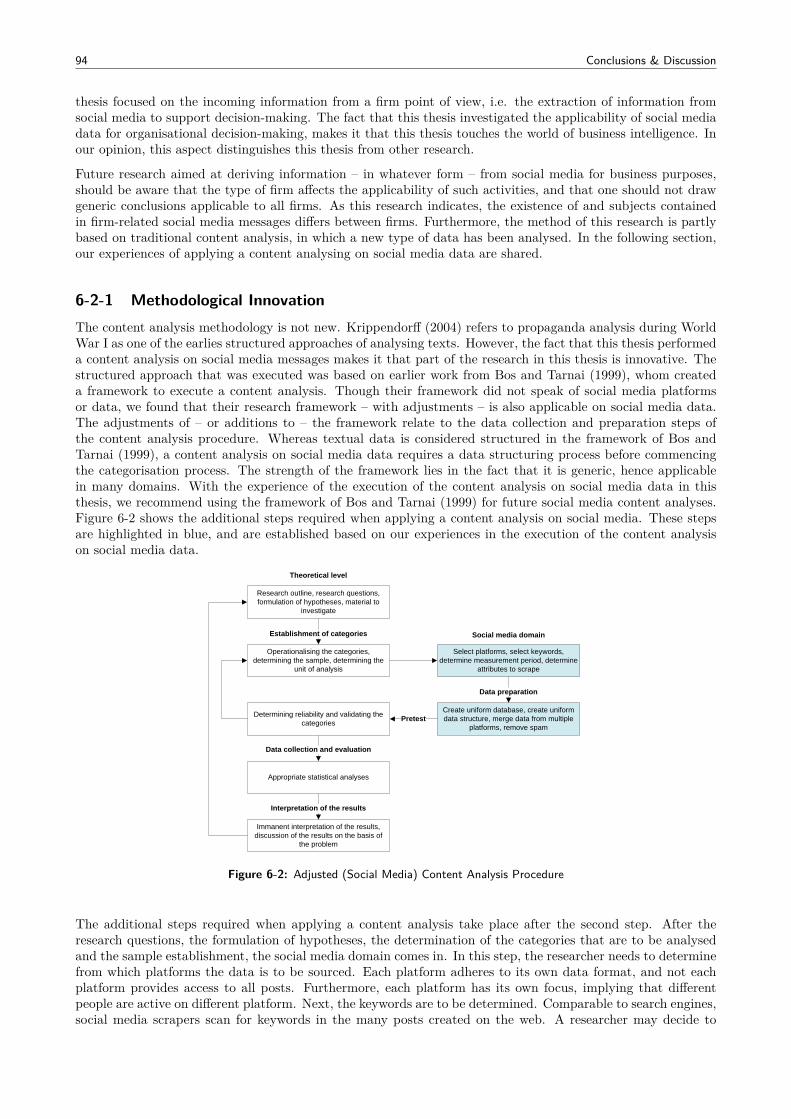
94 Conclusions & Discussion
thesis focused on the incoming information from a firm point of view, i.e. the extraction of information fromsocial media to support decision-making. The fact that this thesis investigated the applicability of social mediadata for organisational decision-making, makes it that this thesis touches the world of business intelligence. Inour opinion, this aspect distinguishes this thesis from other research.
Future research aimed at deriving information – in whatever form – from social media for business purposes,should be aware that the type of firm affects the applicability of such activities, and that one should not drawgeneric conclusions applicable to all firms. As this research indicates, the existence of and subjects containedin firm-related social media messages differs between firms. Furthermore, the method of this research is partlybased on traditional content analysis, in which a new type of data has been analysed. In the following section,our experiences of applying a content analysing on social media data are shared.
6-2-1 Methodological InnovationThe content analysis methodology is not new. Krippendorff (2004) refers to propaganda analysis during WorldWar I as one of the earlies structured approaches of analysing texts. However, the fact that this thesis performeda content analysis on social media messages makes it that part of the research in this thesis is innovative. Thestructured approach that was executed was based on earlier work from Bos and Tarnai (1999), whom createda framework to execute a content analysis. Though their framework did not speak of social media platformsor data, we found that their research framework – with adjustments – is also applicable on social media data.The adjustments of – or additions to – the framework relate to the data collection and preparation steps ofthe content analysis procedure. Whereas textual data is considered structured in the framework of Bos andTarnai (1999), a content analysis on social media data requires a data structuring process before commencingthe categorisation process. The strength of the framework lies in the fact that it is generic, hence applicablein many domains. With the experience of the execution of the content analysis on social media data in thisthesis, we recommend using the framework of Bos and Tarnai (1999) for future social media content analyses.Figure 6-2 shows the additional steps required when applying a content analysis on social media. These stepsare highlighted in blue, and are established based on our experiences in the execution of the content analysison social media data.
Research outline, research questions, formulation of hypotheses, material to
investigate
Operationalising the categories, determining the sample, determining the
unit of analysis
Establishment of categories
Theoretical level
Determining reliability and validating the categories
Appropriate statistical analyses
Data collection and evaluation
Immanent interpretation of the results, discussion of the results on the basis of
the problem
Interpretation of the results
Select platforms, select keywords, determine measurement period, determine
attributes to scrape
Social media domain
Create uniform database, create uniform data structure, merge data from multiple
platforms, remove spamPretest
Data preparation
Figure 6-2: Adjusted (Social Media) Content Analysis Procedure
The additional steps required when applying a content analysis take place after the second step. After theresearch questions, the formulation of hypotheses, the determination of the categories that are to be analysedand the sample establishment, the social media domain comes in. In this step, the researcher needs to determinefrom which platforms the data is to be sourced. Each platform adheres to its own data format, and not eachplatform provides access to all posts. Furthermore, each platform has its own focus, implying that differentpeople are active on different platform. Next, the keywords are to be determined. Comparable to search engines,social media scrapers scan for keywords in the many posts created on the web. A researcher may decide to
6-3 Implications for Practice 95
base its keywords on user names, hashtags (subject of message, assigned by the creator of the message), theresearcher may decide to scrape all posts in a certain area, or during a time. Other elements to select themessages that are to be analysed are also possible. Next, the attributes to scrape are to be determined. Eachsocial media post exists of various attributes, e.g. user name, time, location, content, hyperlink, etc. It differsper platform which attributes are shared.
Next, the data is to be prepared. In case that the research exists of data sourced from multiple platforms,the data is to be merged and structured into a uniform database. In addition, the data is likely to containspam. These messages are to be removed before commencing the analysis. The framework then proceeds in theoriginal steps of Bos and Tarnai (1999).
6-3 Implications for PracticeThe findings in this research have implications for (consulting) firms willing to use social media data for businessintelligence. First, the findings of this research indicate that B2B firms are less likely to find social media data.Furthermore, if a B2B firm will find messages related to the firm, these messages are likely to contain informationthat is yet available to the firm. Hence, the applicability of social business intelligence for B2B firms is limited.On the contrary, B2C firms are often subject of discussion, and the messages related to B2C firms containinformation that is not yet available to the firm internally. Taken into account the results of this research, theopportunities and promises of social media found in many reports and white papers are mainly applicable toB2C firms. Therefore, firms and firms offering consultancy on the domain of social business intelligence, shouldbe aware that the opportunities of social business intelligence are limited to B2C firms.
In addition, a stepwise procedure for social business intelligence has been developed. Such a procedure wasnecessary to be developed since the new data source – social media platforms – differs from the systems atwhich normally data is collected and stored. This procedure is applicable on firms for which social media datais available.
6-4 ReflectionIn this section, a reflection on the research process is presented. First, the developed Twitter scraper is discussed.Next, additional research steps that were executed whenever there was more time available are presented.Finally, a detailed stepwise approach of our data collection process is presented.
6-4-1 Twitter ScraperDuring the early stages of this Master thesis project, a software tool has been developed that scrapes messagescreated on Twitter. The tool has been written in PHP language and is designed to work with MySQL databases,which we managed using phpMyAdmin. At the same time that the tool was up and running, access to one ofthe commercial social media monitoring tools (uberVU) was granted to the author of this thesis, for which weare grateful. Clients of uberVU pay a monthly fee of at least $1.000 to access the software. The tool allowed usto scan a variety of social media platforms, whereas our own tool solely scraped Twitter. Therefore, the decisionwas made to use the commercial off-the-shelf software rather than our own to collect the data. In addition,uberVU offers additional features like sentiment analysis, influencer ranking, location of the message, etc. thatare not available in our tool. However, our own scraper – though it solely scrapes tweets – may serve researchprojects that are aimed at tweets.
6-4-2 If I had More TimeThis research has been executed during a period of six months, i.e. from July 2012 to December 2012. Thelimited time available for this research has implications for both the depth and the breadth of the research, henceon the conclusions and the applicability of the conclusions. In case that the research time would be longer, wewould have surveyed more firms so that the analysed categories (B2B/B2C and industries) would have consistedof more respondents, allowing for statistical analyses. Whereas the conclusions of this research are exploratory,the statistical testing of differences between groups of firms would allow for the generalisation of the statements.Furthermore, adding more respondents to the sample leads to more industries being represented in the sample,
96 Conclusions & Discussion
so that the conclusions of the research are also applicable on other industries. Next, we would have analysedmore messages in the content analysis. The social media messages in this research have been collected duringa period of two weeks. In case the messages would have been collected during a longer period of time, e.g. sixmonths, the sample would have existed of more messages. As such, it would be possible to gain insight in the‘steady volume’ of daily messages, and, more interestingly, deviations in the steady volume. Deviations mightbe due to the announcement of financial figures, marketing events, etc. However, to perform a content analysison many social media messages, an automatic classifier is required. Manually classifying the posts, as we didin this research, would then take too much time. To train such an automatic classifier, the manually classifiedposts in this research are suited. Furthermore, if we had more time, we would have investigated whether or notother factors, such as the number of employees, revenues, market capitalisation, etc. also affect the number ofsocial media messages that are related to a firm. With respect to the social business intelligence procedure thathas been developed, we would have validated the framework by pilot projects and the involvement of businessintelligence experts.
6-4-3 Stepwise Description of Data Collection ProcessIn this section we share our method of the data collection process. These steps are also incorporated in theadapted content analysis framework in section 6-2-1.
• Determine keywords / search termsAfter establishing the sample, the search terms required to filter out the related social media messageshave been determined. In this thesis we searched for the firm names. However, it is also possible to searchmore specific, e.g. on the name of a product or a specific event.
• Use search terms in social media monitoring toolThe search terms were consequently used in the social media monitoring tool.
• Export the search results into a databaseThis functionality is not offered by each social media monitoring tool, but vital for the data collectionprocess. Tools that do not offer the exportation of search results in whatever format are not suited forfurther analyses on the data because most analysis software requires the data to be stored on a localmachine.
• Structure the databaseDepending on the output of the export process, the database is to be structured. The social mediamonitoring tools used in this thesis exported the messages into comma-separated values, which couldeasily be loaded into MS Excel. The richness of attributes offered by the social media monitoring toolsdetermines the complexity of the structuring of the database.
• Daily search for new resultsIn order to collect a large dataset, daily runs for new messages were executed. The social media monitoringtools used in this thesis offered to possibility to export up to 10,000 messages per search run. Pre-testing thecollection process illustrated that this constraint was sufficient to get a complete picture of the firm-relatedmessages created on the social media platforms by daily searching for new results. Whenever a tool hasbeen used that offered a lower exporting capacity, e.g. 1,000 messages, the frequency of searching for newresults would have been higher.
• Verify that the new search results do not yet exist in the databaseA daily run for firm-related messages resulted in the collection of duplicates, i.e. messages that werealready collected yesterday. These messages have been identified based on their unique URL that wascontained as an attribute to each message using LOOKUP functions in MS Excel. More specifically, thevalue of each URL was LOOKED UP in the existing spreadsheet. The textual format of these lookupvalues required some computer power, but our 4GB RAM / i5 machine turned out to have sufficient powerfor these calculations. Whenever a message did found a match, this meant that the message did yet exist.The messages that did yet exist were not added to the database.
• Start analysesThe data collection process resulted in a structured database in a format so that MS Excel could handlethe data for analyses.
Whereas the above steps are described in detail, the underlying ideas will be applicable on each social mediadata collection process.
6-5 Limitations 97
6-5 LimitationsThis research and consequently its outcomes have limitations that should be taken into consideration whenadopting the conclusions of this thesis. The limitation are discussed in this section.
The first aspect of the research limitations, or aspects to consider when interpreting the conclusions related tothe population from which the social media messages are drawn. This aspect has been assigned by Krippendorff(2004) as an important issue to consider when performing a content analysis. Not everyone uses social media,and even less people actually create content on the platforms. Therefore, firms that analyse social media datashould be aware that these data do not represent the full (potential) client base. It is very likely that socialmedia users have other preferences than non-social media users. A firm should always place the conclusionsfrom social business intelligence in the light of their complete client base before it makes a decision to undertakeactions, because the actions may only serve those needs of the ones that engaged on social media. Nevertheless,anno 2012 social media is relatively young. The user groups – e.g. age groups or countries – that use socialmedia may increase in the coming years. We expect that social media will be further embedded in the lives ofpeople that grow up in the social media era.
Secondly, each social media platform has its own privacy policy. This implies that a user either has the possibilityto determine whether or not it shares its messages to the public, or that the platform determines the publiclyavailable messages. As a consequence, only messages that were publicly available have been analysed in ourdataset. It is likely that people who have not publicised their social media messages also discuss firms or firms’products / services, these messages are not available in our dataset. Still, the dataset is representative for firmsconducting social business intelligence, since they will not get access to private messages either.
Third, not all social media platforms have been part of our analysis. Platforms such as Sina Weibo – the Chinesecounterpart of Twitter –, Qzone, Renren, Habbo are not part of our analysis. However, the platforms that didexist in our sample are the ones used in the Western world. Therefore we state that the conclusions of ourreport are valid for Western world firms.
Fourth, the volume of messages, likes, shares, retweets, etc. can easily be influenced by a firm, though this doesnot necessarily mean that the user is actually engaged with the firm. For instance, a firm may decide to raffle aniPad or organise other lotteries. People can participate in the lottery by e.g. sharing a promotion message or by‘liking’ the firm’s page. Whereas such activities certainly lead to an increase in the number of likes, shares, etc.,the underlying reason why people pay attention to the firm is for the price, and not necessarily the engagementin the company or its products. We refer to content that is generated according to such mechanisms as biasedchatter, and doubt if such activities actually lead to an improvement of the firm’s KPIs, e.g. the number ofsales.
Fifth, one of the conclusions of this research is that the volume and the subjects of social media messages differamong industries. Due to time restrictions, we have not been able to analyse the social media messages of morethan eighteen firms. As a result, each industry consisted of two or three firms, which we deem a small sample.It is therefore that the conclusions of this research are to be perceived as exploratory rather than confirminghypotheses.
Sixth, our research grouped firms based on the industry type in which they are active. With respect to thevolume of firm-related messages, intra group difference have been spotted. These notable findings indicate thatthe industry aspect is not the only determining factor influencing the volume of firm-related messages. Otherfactors, such as (world-wide) brand awareness or the size of the company are likely to influence the amountof firm-related messages that are daily generated. These company specific aspects have deliberately not beentaken into account since the purpose of this thesis is to draw generic conclusions on the applicability of socialbusiness intelligence.
Next, this thesis analysed the applicability of social business intelligence on two dimensions; industry type andcustomer relation type. We did not correct for interaction effects between these two groups. It is e.g. likelythat there exist more B2B firms in the consulting industry. However, the results of this study are exploratoryand – from the insights we gained – future research containing larger samples should correct for such interactioneffects.
Next, this thesis mainly focused on the business perspective of social business intelligence. Less attention hasbeen paid to the technical perspective. For example, the question “What kind of database is best to storethe unstructured data that is captured in text form?” is unanswered. Though the developed social businessprocedure prescribes which components are required to collect and analyse social media data in relation withthe firm’s performance, the technical requirements related to these components are underexposed.
98 Conclusions & Discussion
Finally, the social business intelligence procedure that has been developed in this thesis is compliant with generalbusiness intelligence concepts that are adhered to in firms. However, the procedure has – due to time restrictions– not been validated, that is, tested on a real case. Nevertheless, the individual components of the procedureare tested. The general BI steps are yet used by firms, and the collection and classification processes of socialmedia messages have been performed in this thesis.
6-6 Future ResearchDuring the execution of this research, ideas for future research related to this thesis have been devised. Theseideas are presented in this section. The suggested researches build further on the conclusions of this thesis.
6-6-1 ClassifierWe have manually classified social media posts in categories. With these manually classified posts, it is possibleto create an automatic classification process. In automatic classifying, a classifier will be “trained” so thatit recognises which words and phrases relate to a certain category. The classified messages in this researchcan serve as the training set for an automatic classifier. As we have experienced, and which is also arguedby Gianfortoni, Adamson, and Rosé (2011), classification of social media posts, e.g. by gender, age, politicalaffiliation and sentiment analysis is difficult, and even more problems arise when models trained in one domainare applied in another domain. Therefore, a social media classifier should not be used generally on each domain.We even argue that each firm requires its own classifier, only because the product names of firms differ.
In the development of the social business intelligence procedure we argued that the categorising process is oneof the important steps in structurally analysing social media messages. This process is even more challengedby the increase of user-generated social media content showing big data characteristics. From a social businessintelligence view, it is desired that research in the field of automatic text classifying – tailored to firms – proceeds.
6-6-2 Social Media Posts CategoriesA part of this research required the establishment of social media posts categories. Whereas the starting point ofthe establishment of the categories in this thesis was based on former research, the social media messages in thedataset have driven the establishment of additional categories. Future research in the domain of social media,and more specifically the classification of social media messages can use the categories that were established inthis thesis.
6-6-3 The Real SourceMany messages are forwarded – retweetet and shared – from users to others. Thereby, messages do not staywithin one social media platform. It is interesting to investigate which platforms contains the most initialcreations of information. As such, firms can manage their reputation by actively following those platforms thatcreate the most initial messages, before the message goes viral and may harm the firm’s reputation.
6-6-4 Case Study: Relations of Social Media Metrics and Key-Performance IndicatorsThe social business intelligence procedure that has been developed in this thesis contains a component in whichsocial media messages are assigned to key-performance indicators based on the subject of the messages. Aresearch in which the relations between the social media messages and the actual values of various KPIs of afirm are investigated would reveal the strength of these relations. Thereby, the KPIs that have been assignedin this thesis as being able to be measured using social media data could be used for such an analysis.

Appendix A
Performance Prism Perspectives andKey-Performance Indicators Categories
Table A-1 on the next page assigns each KPI category defined by Ittner et al. (2003) to a performance prismperspective defined by Neely et al. (2001). Based on their subjects, social media posts will be assigned to KPIcategories in this thesis. With the assignment of KPI categories to performance prism perspectives, we canderive conclusions of the existence of social media data related to different performance prism perspectives.
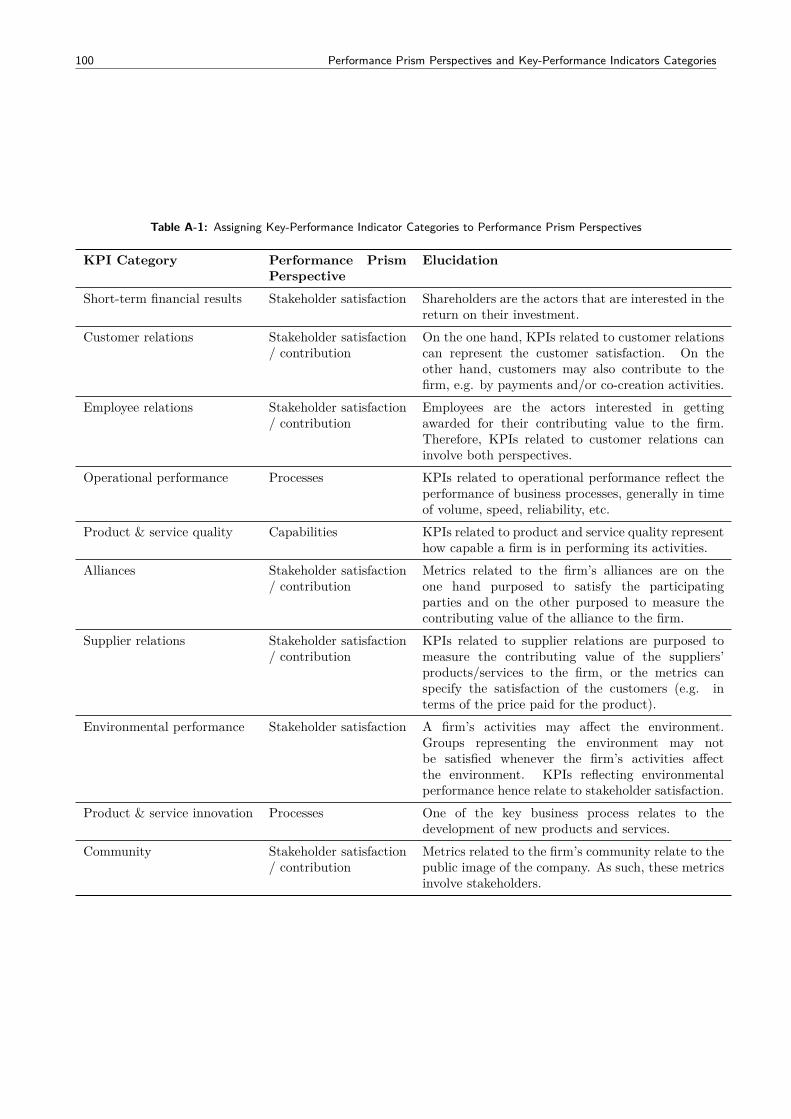
100 Performance Prism Perspectives and Key-Performance Indicators Categories
Table A-1: Assigning Key-Performance Indicator Categories to Performance Prism Perspectives
KPI Category Performance PrismPerspective
Elucidation
Short-term financial results Stakeholder satisfaction Shareholders are the actors that are interested in thereturn on their investment.
Customer relations Stakeholder satisfaction/ contribution
On the one hand, KPIs related to customer relationscan represent the customer satisfaction. On theother hand, customers may also contribute to thefirm, e.g. by payments and/or co-creation activities.
Employee relations Stakeholder satisfaction/ contribution
Employees are the actors interested in gettingawarded for their contributing value to the firm.Therefore, KPIs related to customer relations caninvolve both perspectives.
Operational performance Processes KPIs related to operational performance reflect theperformance of business processes, generally in timeof volume, speed, reliability, etc.
Product & service quality Capabilities KPIs related to product and service quality representhow capable a firm is in performing its activities.
Alliances Stakeholder satisfaction/ contribution
Metrics related to the firm’s alliances are on theone hand purposed to satisfy the participatingparties and on the other purposed to measure thecontributing value of the alliance to the firm.
Supplier relations Stakeholder satisfaction/ contribution
KPIs related to supplier relations are purposed tomeasure the contributing value of the suppliers’products/services to the firm, or the metrics canspecify the satisfaction of the customers (e.g. interms of the price paid for the product).
Environmental performance Stakeholder satisfaction A firm’s activities may affect the environment.Groups representing the environment may notbe satisfied whenever the firm’s activities affectthe environment. KPIs reflecting environmentalperformance hence relate to stakeholder satisfaction.
Product & service innovation Processes One of the key business process relates to thedevelopment of new products and services.
Community Stakeholder satisfaction/ contribution
Metrics related to the firm’s community relate to thepublic image of the company. As such, these metricsinvolve stakeholders.
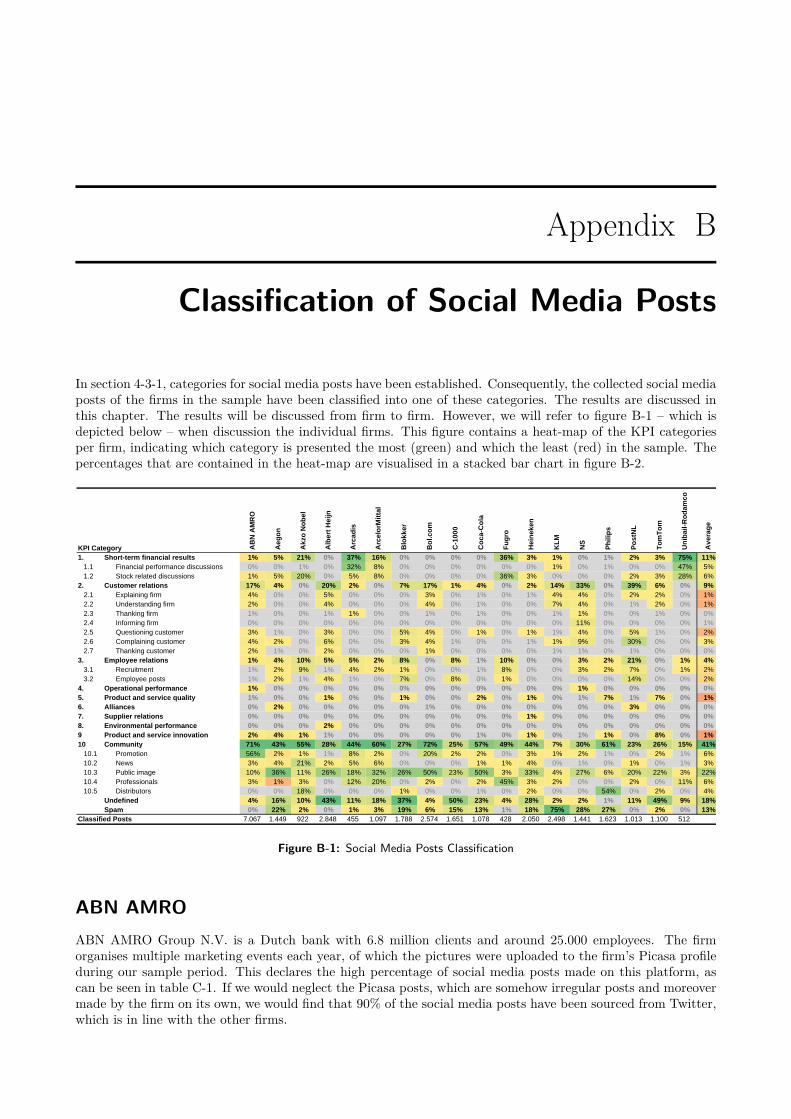
Appendix B
Classification of Social Media Posts
In section 4-3-1, categories for social media posts have been established. Consequently, the collected social mediaposts of the firms in the sample have been classified into one of these categories. The results are discussed inthis chapter. The results will be discussed from firm to firm. However, we will refer to figure B-1 – which isdepicted below – when discussion the individual firms. This figure contains a heat-map of the KPI categoriesper firm, indicating which category is presented the most (green) and which the least (red) in the sample. Thepercentages that are contained in the heat-map are visualised in a stacked bar chart in figure B-2.
KPI Category AB
N A
MR
O
Aeg
on
Akz
o N
obel
Alb
ert H
eijn
Arc
adis
Arc
elor
Mitt
al
Blo
kker
Bol
.com
C-1
000
Coc
a-C
ola
Fug
ro
Hei
neke
n
KLM
NS
Phi
lips
Pos
tNL
Tom
Tom
Uni
bail-
Rod
amco
Ave
rage
1. Short-term financial results 1% 5% 21% 0% 37% 16% 0% 0% 0% 0% 36% 3% 1% 0% 1% 2% 3% 75% 11%1.1 Financial performance discussions 0% 0% 1% 0% 32% 8% 0% 0% 0% 0% 0% 0% 1% 0% 1% 0% 0% 47% 5%1.2 Stock related discussions 1% 5% 20% 0% 5% 8% 0% 0% 0% 0% 36% 3% 0% 0% 0% 2% 3% 28% 6%
2. Customer relations 17% 4% 0% 20% 2% 0% 7% 17% 1% 4% 0% 2% 14% 33% 0% 39% 6% 0% 9%2.1 Explaining firm 4% 0% 0% 5% 0% 0% 0% 3% 0% 1% 0% 1% 4% 4% 0% 2% 2% 0% 1%2.2 Understanding firm 2% 0% 0% 4% 0% 0% 0% 4% 0% 1% 0% 0% 7% 4% 0% 1% 2% 0% 1%2.3 Thanking firm 1% 0% 0% 1% 1% 0% 0% 1% 0% 1% 0% 0% 1% 1% 0% 0% 1% 0% 0%2.4 Informing firm 0% 0% 0% 0% 0% 0% 0% 0% 0% 0% 0% 0% 0% 11% 0% 0% 0% 0% 1%2.5 Questioning customer 3% 1% 0% 3% 0% 0% 5% 4% 0% 1% 0% 1% 1% 4% 0% 5% 1% 0% 2%2.6 Complaining customer 4% 2% 0% 6% 0% 0% 3% 4% 1% 0% 0% 1% 1% 9% 0% 30% 0% 0% 3%2.7 Thanking customer 2% 1% 0% 2% 0% 0% 0% 1% 0% 0% 0% 0% 1% 1% 0% 1% 0% 0% 0%
3. Employee relations 1% 4% 10% 5% 5% 2% 8% 0% 8% 1% 10% 0% 0% 3% 2% 21% 0% 1% 4%3.1 Recruitment 1% 2% 9% 1% 4% 2% 1% 0% 0% 1% 8% 0% 0% 3% 2% 7% 0% 1% 2%3.2 Employee posts 1% 2% 1% 4% 1% 0% 7% 0% 8% 0% 1% 0% 0% 0% 0% 14% 0% 0% 2%
4. Operational performance 1% 0% 0% 0% 0% 0% 0% 0% 0% 0% 0% 0% 0% 1% 0% 0% 0% 0% 0%5. Product and service quality 1% 0% 0% 1% 0% 0% 1% 0% 0% 2% 0% 1% 0% 1% 7% 1% 7% 0% 1%6. Alliances 0% 2% 0% 0% 0% 0% 0% 1% 0% 0% 0% 0% 0% 0% 0% 3% 0% 0% 0%7. Supplier relations 0% 0% 0% 0% 0% 0% 0% 0% 0% 0% 0% 1% 0% 0% 0% 0% 0% 0% 0%8. Environmental performance 0% 0% 0% 2% 0% 0% 0% 0% 0% 0% 0% 0% 0% 0% 0% 0% 0% 0% 0%9 Product and service innovation 2% 4% 1% 1% 0% 0% 0% 0% 0% 1% 0% 1% 0% 1% 1% 0% 8% 0% 1%10 Community 71% 43% 55% 28% 44% 60% 27% 72% 25% 57% 49% 44% 7% 30% 61% 23% 26% 15% 41%
10.1 Promotion 56% 2% 1% 1% 8% 2% 0% 20% 2% 2% 0% 3% 1% 2% 1% 0% 2% 1% 6%10.2 News 3% 4% 21% 2% 5% 6% 0% 0% 0% 1% 1% 4% 0% 1% 0% 1% 0% 1% 3%10.3 Public image 10% 36% 11% 26% 18% 32% 26% 50% 23% 50% 3% 33% 4% 27% 6% 20% 22% 3% 22%10.4 Professionals 3% 1% 3% 0% 12% 20% 0% 2% 0% 2% 45% 3% 2% 0% 0% 2% 0% 11% 6%10.5 Distributors 0% 0% 18% 0% 0% 0% 1% 0% 0% 1% 0% 2% 0% 0% 54% 0% 2% 0% 4%
Undefined 4% 16% 10% 43% 11% 18% 37% 4% 50% 23% 4% 28% 2% 2% 1% 11% 49% 9% 18%Spam 0% 22% 2% 0% 1% 3% 19% 6% 15% 13% 1% 18% 75% 28% 27% 0% 2% 0% 13%
Classified Posts 7.067 1.449 922 2.848 455 1.097 1.788 2.574 1.651 1.078 428 2.050 2.498 1.441 1.623 1.013 1.100 512
Figure B-1: Social Media Posts Classification
ABN AMROABN AMRO Group N.V. is a Dutch bank with 6.8 million clients and around 25.000 employees. The firmorganises multiple marketing events each year, of which the pictures were uploaded to the firm’s Picasa profileduring our sample period. This declares the high percentage of social media posts made on this platform, ascan be seen in table C-1. If we would neglect the Picasa posts, which are somehow irregular posts and moreovermade by the firm on its own, we would find that 90% of the social media posts have been sourced from Twitter,which is in line with the other firms.
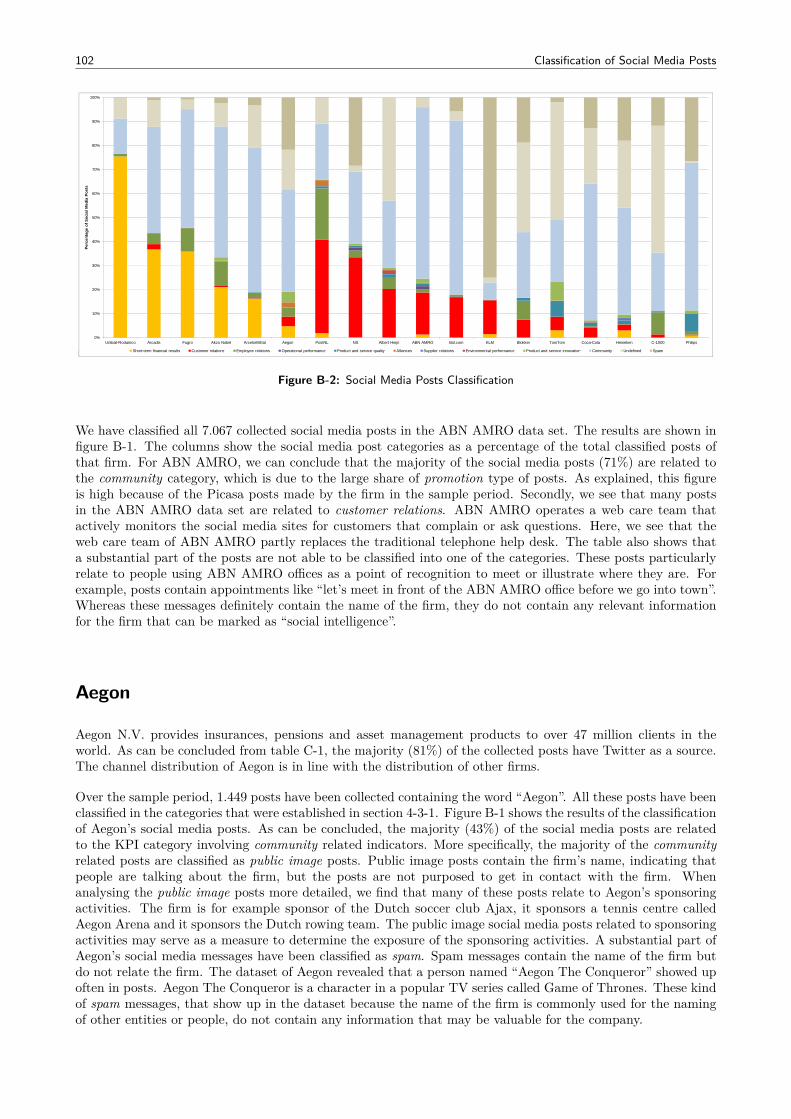
102 Classification of Social Media Posts
0%
10%
20%
30%
40%
50%
60%
70%
80%
90%
100%
Unibail-Rodamco Arcadis Fugro Akzo Nobel ArcelorMittal Aegon PostNL NS Albert Heijn ABN AMRO Bol.com KLM Blokker TomTom Coca-Cola Heineken C-1000 Philips
Perc
enta
ge o
f Soc
ial M
edia
Pos
ts
Short-term financial results Customer relations Employee relations Operational performance Product and service quality Alliances Supplier relations Environmental performance Product and service innovation Community Undefined SpamShort-term financial results Customer relations Employee relations Operational performance Product and service quality Alliances Supplier relations Environmental performance Product and service innovation Community Undefined Spam
Figure B-2: Social Media Posts Classification
We have classified all 7.067 collected social media posts in the ABN AMRO data set. The results are shown infigure B-1. The columns show the social media post categories as a percentage of the total classified posts ofthat firm. For ABN AMRO, we can conclude that the majority of the social media posts (71%) are related tothe community category, which is due to the large share of promotion type of posts. As explained, this figureis high because of the Picasa posts made by the firm in the sample period. Secondly, we see that many postsin the ABN AMRO data set are related to customer relations. ABN AMRO operates a web care team thatactively monitors the social media sites for customers that complain or ask questions. Here, we see that theweb care team of ABN AMRO partly replaces the traditional telephone help desk. The table also shows thata substantial part of the posts are not able to be classified into one of the categories. These posts particularlyrelate to people using ABN AMRO offices as a point of recognition to meet or illustrate where they are. Forexample, posts contain appointments like “let’s meet in front of the ABN AMRO office before we go into town”.Whereas these messages definitely contain the name of the firm, they do not contain any relevant informationfor the firm that can be marked as “social intelligence”.
Aegon
Aegon N.V. provides insurances, pensions and asset management products to over 47 million clients in theworld. As can be concluded from table C-1, the majority (81%) of the collected posts have Twitter as a source.The channel distribution of Aegon is in line with the distribution of other firms.
Over the sample period, 1.449 posts have been collected containing the word “Aegon”. All these posts have beenclassified in the categories that were established in section 4-3-1. Figure B-1 shows the results of the classificationof Aegon’s social media posts. As can be concluded, the majority (43%) of the social media posts are relatedto the KPI category involving community related indicators. More specifically, the majority of the communityrelated posts are classified as public image posts. Public image posts contain the firm’s name, indicating thatpeople are talking about the firm, but the posts are not purposed to get in contact with the firm. Whenanalysing the public image posts more detailed, we find that many of these posts relate to Aegon’s sponsoringactivities. The firm is for example sponsor of the Dutch soccer club Ajax, it sponsors a tennis centre calledAegon Arena and it sponsors the Dutch rowing team. The public image social media posts related to sponsoringactivities may serve as a measure to determine the exposure of the sponsoring activities. A substantial part ofAegon’s social media messages have been classified as spam. Spam messages contain the name of the firm butdo not relate the firm. The dataset of Aegon revealed that a person named “Aegon The Conqueror” showed upoften in posts. Aegon The Conqueror is a character in a popular TV series called Game of Thrones. These kindof spam messages, that show up in the dataset because the name of the firm is commonly used for the namingof other entities or people, do not contain any information that may be valuable for the company.
103
Akzo NobelAkzo Nobel N.V. is a Dutch firm active in paint, lacquer, coatings and other specialised chemical products. Thecompany operates in 80 countries and employs around 55.000 people. As can be concluded from table C-1, the922 posts that have been collected are for the majority sourced from Twitter.
Figure B-1 shows the results of the classification process of the 922 social media messages that have beencollected. As can be concluded, around 21% of the social media messages that are related to Akzo Nobel referto news articles. Around 18% of the social media posts are made by distributors of Akzo Nobel’s productswho promote their products on retail websites like Amazon. Another substantial part – 20% – of the messagesrelates to stock related discussions. A remarkable phenomenon in the classification of Akzo Nobel’s social mediamessages is the fact that there are almost no messages related to customer relations, whereas we have seencustomer related messages in the social media posts of other companies.
Albert HeijnAlbert Heijn is a Dutch supermarket, which is a subsidiary of Royal Ahold N.V. Albert Heijn operates around850 stores in the Netherlands, and is with 34% market share the market leader in the Netherlands. The companyalso operates stores in Belgium, Germany and Curacao. Table C-1 illustrates that almost all of the collectedsocial media messages containing Albert Heijn have been sourced from Twitter.
As figure B-1 shows, a substantial part (20%) of the social media messages of Albert Heijn involve customerrelations management. On the one hand customers are responsible for many complaints (6% of the classifiedposts), while Albert Heijn’s web care team actively responses to these messages by either showing anunderstanding (4% of the classified posts) of the customer’s complaint, or even explaining (5% of the classifiedposts) the customer something that they asked. Here, we clearly see that the firm’s help desk moves to socialmedia. Another substantial part (26%) of social media messages involving Albert Heijn relate to the firm’spublic image. These messages contain customer’s opinions about e.g. the latest Albert Heijn commercial orabout the products that they bought in the store.
ArcadisArcadis N.V. is a Dutch engineering consultancy, offering solutions in the field of infrastructure, civilised areasand environmental projects. The company is active in more than 70 countries and employing around 18.000people. During the period of monitoring the companies, we collected 455 posts related to Arcadis. This figureis substantially lower than the number of posts that we collected from other firms. Of the 455 social mediaposts that have been collected and are related to Arcadis, around 93% has been derived from Twitter.
Shown by figure B-1 on page 101, 32% of the collected messages involve Arcadis’ financial performancediscussions. These posts particularly involve professionals discussing the financial performance of the companyand talking about future projections of the company’s financial position. Next, 18% of the Arcadis’ posts havebeen classified as public image posts. These posts particularly refer to publicised articles or news messages thathave been spread by the company. Presumably, the company has spread these articles / news messages to gainexposure. The firm could use the amount of public image messages that refer to the articles as a measure todetermine the exposure as a result of the publicised articles.
ArcelorMittalArcelorMittal is the world’s largest steel producer, active in 27 countries and employing 320.000 people. Duringthe period of monitoring, we collected 5.532 social media posts related to ArcelorMittal. Of these posts, around83% have been derived from Twitter. Other sources involved blogs (5%), news sites (2%) and other platforms.
As can be seen in figure B-1, social media messages related to ArcelorMittal do not involve customer relations.Rather, the social media messages relate to the firm’s public image (32% of the posts) and professionals (20%of the posts) talking about the company. The posts classified as public image involve marketing activities of thefirm. Especially the “ArcelorMittal Orbit”, a steel tower constructed by the firm on the 2012 London Olympics,was subject of discussion. This category of social media messages is the only one that involves non-professional
104 Classification of Social Media Posts
people, because all other social media messages related to ArcelorMittal involve professionals. 20% of thesample posts have been classified as professionals, in which professionals discuss joint-ventures or the industries’outlook. Finally, a substantial amount of the posts (16%) relate to the companies financial results.
BlokkerBlokker is a Dutch store selling products related to household. The Blokker stores are subsidiaries of BlokkerHolding B.V., which operates over 2.900 stores in 11 countries, thereby employing 25.000 people. In total, 2.769social media messages related to Blokker have been collected, of which the majority (91%) has been derivedfrom Twitter. Please see table C-1 on page 108 for a distribution of the sources of the social media posts.
Figure B-1 (page 101) shows that 27% of the classified social media posts are related to the community category.The community category comprises messages that reveal the community’s perception of the firm. Of these 27%community related posts, the vast majority consists of social media posts that have been classified as publicimage posts. Public image posts are messages that are made by individuals and contain the firm’s name, withoutexplicitly seeking contact with the firm. In the case of Blokker, many messages involve statements of peopleannouncing to their followers that they are planning to visit one of the stores, or people referring to articles thatare sold by the firm. As can be concluded, customer also ask questions to the firm and also complain about thefirm. However, no messages of the company have been found in the sample that respond to these messages.
Bol.comBol.com is an online web-shop selling a variety of products, such as books, DVDs, games, blu-rays, electronics,computers, etcetera. Since the foundation of the company in 1999, it has shown solely growth percentages of18% y-o-y and above in terms of revenues. As of 2012, Bol.com is a subsidiary of Royal Ahold N.V. We havecollected 5.782 social media posts that are related to Bol.com, of which 89% has been derived from Twitter.
Of the classified posts related to Bol.com, around 50% are related to the firm’s public image. For Bol.com, thesepublic image posts particularly involve people who share to their followers their recent purchase of a productthrough Bol.com or people illustrating to other people that a certain product can be bought at Bol.com. Next,a substantial amount of the posts consists of promotion activities. These posts are made by the firm or byfirm’s selling products through Bol.com’s website for marketing purposes. Finally, 17% of the Bol.com classifiedsocial media posts relate to customer relations. We clearly see that people ask questions or complain, and thatBol.com’s web care team is consequently responsible for the social media posts that have been classified aseither explaining firm (3%) or understanding firm (4%).
C1000C1000 is a Dutch supermarket organisation with a market share of 11,5%, employing around 7.000 people andoperating 425 stores in the Netherlands. In the future, many C1000 stores will be turned into Jumbo storesas Jumbo Supermarkten acquired C1000 in 2012. Allmost all of the 5.782 social media posts that have beencollected in relation with C1000 have been derived from Twitter.
The majority of the social media posts (50%) of C1000 have been classified as undefined, implying that thesemessages cannot be classified into one of the categories that have been established. When taking a closer lookat the undefined messages, we see that many users refer to C1000 as a location to meet each other, or usersshare that they are heading for or just returned from C1000. These messages do not contain any managementinformation, and are therefore classified as undefined. The other portion of the classified social media messagesrelated to C1000 are classified as public image posts. These messages contain statements of customers sharingtheir followers what they have bought or seen at a C1000 store. Next, marketing campaigns are discussed bypeople.
Coca-ColaCoca-Cola is one of the many drinks offered by The Coca-Cola Company, selling Coca-Cola all over the world(except for North-Korea and Cuba). As expected, Coca-Cola is one of the company’s in our sample that
105
delivered the most messages because it is one of the most famous brands of the world. During the monitoringperiod, 32.953 messages containing the word Coca-Cola have been collected. In line with other companies inour sample, 89% of the collected Coca-Cola social media messages have been derived from Twitter.
As figure B-1 illustrates, half of the classified posts of Coca-Cola can be positioned under the category labelledpublic image. These posts contain perceptions of customers to the company, to marketing campaigns of the firmor are made by people talking about the firm’s sponsorships. Next, a substantial part of the classified socialmedia posts of coca-cola are classified as undefined. These messages to not contain any valuable managementinformation, and contain for instance statements of people that they are drinking Coca-Cola right now, or thatthey wish that they were drinking one now.
FugroFugro N.V. is a Dutch company that collects and interprets data related to the earth’s surface. The companyprovides advice to firms active in the oil- and gas industry, the mining industry and the construction industry.Fugro is active in over 50 countries, operating 275 offices and employing around 14.000 employees. During themonitoring period, merely 428 social media posts related to Fugro have been collected. Of all firms in oursample, there is no firm with less search results. Though the sample of Fugro is small, it shows a channeldistribution that is comparable to the other firms in our sample; around 90% of the derived post are sourcedfrom Twitter.
As indicated by figure B-1 on page 101, the vast majority (45%) of the social media posts related to Fugroare classified as posts made by professionals. These posts consists of professionals talking about new vesselsthat Fugro either ordered or received, or how macro trends are effecting the market in which Fugro operates.Furthermore, automated messages creating tools post a message each time that a Fugro vessel leaves or arrivesat a harbour. These posts are also classified as professionals. Another substantial part of the social media postsrelated to Fugro have been assigned to the category labelled stock related discussions. Unfortunately the twocategories that are responsible for the majority of the social media post categories do not offer any informationto the company that is not available at the company internally.
HeinekenHeineken N.V. is a Dutch multinational providing beer and other drinks. The company is active in 178 countries,employing 70.000 people. During our period of monitoring 39.425 social media posts have been collected by thesearch terms related to Heineken, making Heineken the firm with the most mentions of our sample. As can beconcluded from table C-1, 82% of these social media posts have been sourced from Twitter, while Facebook isresponsible for 15% of the messages.
Of the 2.050 posts that have been classified, 33% have been classified as public image posts (see table B-1). Manyof these posts relate to Heineken commercials seen by people on the television, or other ways that Heinekenpursues to expose itself such as the Holland Heineken House at the 2012 London Olympics. The number ofpublic image posts can serve as a measure to determine the success of the desired exposure by these kind ofmarketing events. Another substantial part of Heineken’s posts are considered as spam, because they refer toother entities, people naming themselves Heineken on the web or people that are actually named Heineken.
KLMKLM – Koninklijke Luchtvaart Maatschappij – N.V. is a Dutch airliner that operates 116 airplanes across theglobe. The firm has three subsidiaries – KLM Cityhopper, Martinair and Transavia.com – while the parentcompany is Air France-KLM. The search terms used to filter out the social media posts related to KLM (seetable 4-5 on page 58) resulted in 26.364 messages which have been scraped. 86% of these messages have beensourced from Twitter, while Facebook is responsible for 9% of the posts. These figures are in line with thechannel distribution of other firms in the sample.
10% of the collected posts – i.e. 2.498 posts – have been classified into one of the social media categories thathave been established in section 4-3-1. Figure B-1 shows that an astonishing 75% of these posts have beenclassified as being spam. A closer look at the spam classified posts shows that the letters K, L and M are
106 Classification of Social Media Posts
used by many people in their username, e.g. @Klm_babe, @DaOne_KLM, @klm_klm_klm, @klm_nico, and@miyu_klm. Probably, the initials of these people correspond with the name of the firm. However, the datasetof KLM also shows a substantial amount of posts classified as customer relations. KLM operates a webcare teamthat actively monitors the messages directed to KLM, at which the employees of the webcare team consequentlyrespond. Again – as we have seen with ABN AMRO and Albert Heijn – we see that the traditional customerhelp-desk is (partly) moving to the social media.
NS
Nederlandse Spoorwegen N.V. (“NS”) is a Dutch railway company operating the main rail network in theNetherlands. During the monitoring period, 5.863 social media posts related to NS have been collected. 85%of the NS posts have been sourced from Twitter, while Facebook is responsible for 12% of these posts.
Figure B-1 shows that 33% of the classified posts are related to customer relations. Especially the categoryinforming firm is over-represented in the dataset, this is due to the firm that uses social media to informcustomers that certain tracks of the network are subject to delays. These posts do not contain any informationthat is not available internally, because the nature of the direction of these messages is outgoing; from firm tocustomers. Next, 9% of the classified posts are complaining customers, while 4% of the posts are questioningcustomers. These posts contain information that may not be available to the firm. The firm operates a webcare team that answers questions and shows understanding for the experienced problems (4% and 4% of theposts respectively).
Philips
Koninklijke Philips Electronics N.V. is a Dutch electronics firm active in more than 60 countries and employing122.000 people. The firm is organised into three main divisions: Philips Consumer Lifestyle, Philips Healthcareand Philips Lighting. Philips is the largest manufacturer of lighting in the world. During the monitoring period32.748 posts have been collected using the Philips search queries of table 4-5, corresponding to almost 3.000daily posts. Philips is the second largest firm in our sample in terms of collected social media messages. 68%of the messages have been sourced from Twitter, 12% from Facebook, 9% from Blogs and 10% from otherplatforms including Friendfeed and YouTube.
As indicated by figure B-1, the vast majority (54%) of the social media messages related to Philips are classifiedas distributors posts. The distributors posts are made by professionals that are selling Philips products toconsumers. Often, distributors use Amazon.com as a site to sell the products, while they use social media toannounce the public their offers. Philips is a common surname. As a result, many posts in the Philips samplehave been classified as spam as they do contain the name Philips, but do not relate to the firm. 7% of theclassified posts are labelled as product and service quality posts. These posts comprise product- reviews andexperiences of users, containing valuable information for R&D related activities.
PostNL
PostNL N.V. is a mail and parcel company operating in the Netherlands, Germany, Italy and the UnitedKingdom. In total, 1.323 social media messages have been collected using the search terms related to PostNL.91% of these posts have been collected from Twitter, which is in line with other firms in the sample.
More than in any other dataset of the firms, 30% of PostNL’s social media messages have been classified ascomplaining customers. The messages contain statements of customers who are complaining about the serviceof the firm, about broken parcels, late deliveries, etc. The firm operates a web care team, though it doesonly respond to a limited amount of complaining and questioning customers. 20% of the PostNL posts havebeen classified as public image posts, posts made by individuals talking about the firm. A surprising figure inPostNL’s social media classification overview is the high percentage – 14% – of employee posts. Apparently,PostNL’s employees – and especially postmen – share that they are working at the firm.
107
TomTomTomTom N.V. is a Dutch producer of automotive navigation systems. TomTom is Europe’s leading manufacturerof navigation systems. The firm employs around 3.500 people. During the monitoring period, 32.748 social mediamessages have been collected using the search queries related to TomTom. In line with other firms, 91% ofthese messages have been derived from Twitter.
Of all classified TomTom messages, 49% has been labelled undefined, implying that these messages could notbe assigned to any of the other categories. These messages relate to the firm, although people use TomTom intheir message, though these messages do not contain any valuable information for the firm. The high percentageof undefined posts is due to the fact that people use the word TomTom as a term for navigation systems ingenerally, or to refer to anyone who is navigating. Apparently, TomTom has become a word in the generalvocabulary used by the society, though the relation to the firm TomTom is not always present. 7% of theposts are related to product and service quality, in which users share experiences of the usage of TomTom’sproducts. Another 8% of the posts are classified as product and service innovation posts, in which users eithermake innovative suggestions for future products, or share their opinion towards new products / services. Thesetwo categories contain valuable information for R&D departments, on the one hand to measure the success ofexisting products and on the other hand to develop new products.
Unibail-RodamcoUnibail-Rodamco is a firm specialised in commercial property investments. It is the largest commercial realestate company in Europe, managing three types of assets; shopping centers, convention centers and officeproperties. Unibail-Rodamco employs around 1.500 people. Only 512 social media messages related toUnibail-Rodamco have been collected, i.e. 39 daily posts on average. 95% of these posts have been sourcedfrom Twitter.
More than in any other firm in our sample, as illustrated by figure B-1 75% of the posts related toUnibail-Rodamco relate to financial results. These posts are either related to financial performance discussionsof the firm or to stock related discussions. Furthermore, 11% of the classified posts are messages classified asprofessionals; people writing about the firm from a professional point of view.
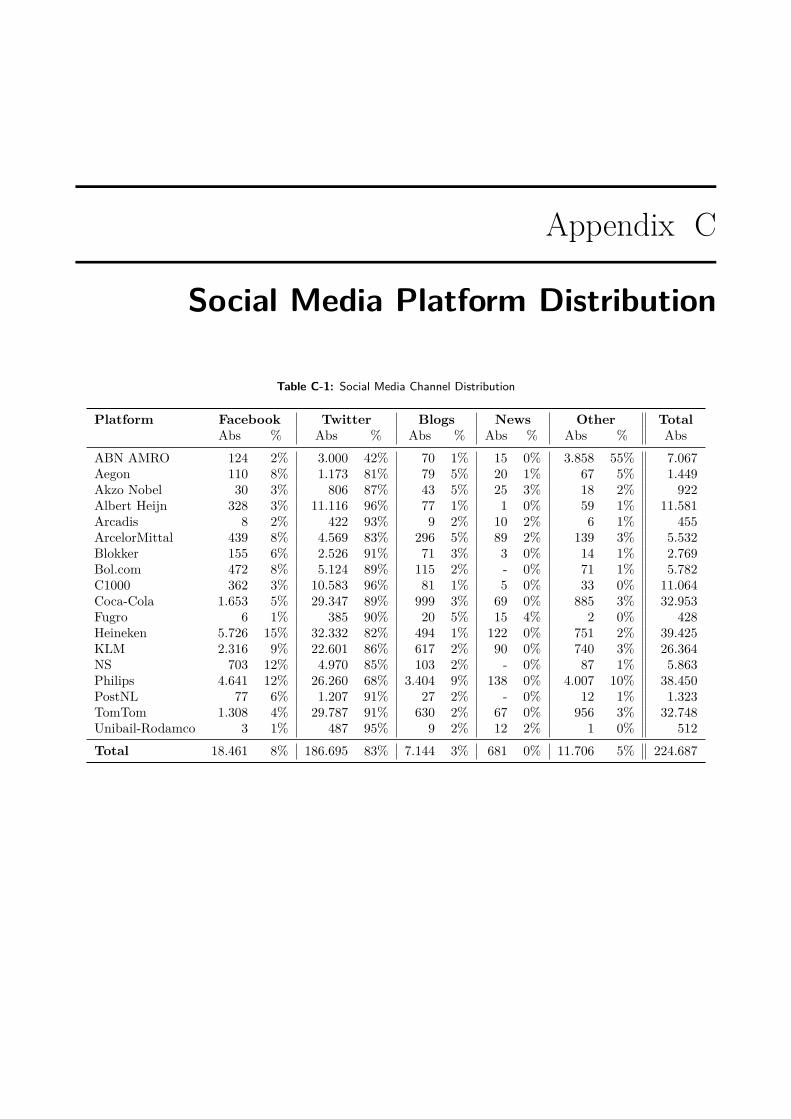
Appendix C
Social Media Platform Distribution
Table C-1: Social Media Channel Distribution
Platform Facebook Twitter Blogs News Other TotalAbs % Abs % Abs % Abs % Abs % Abs
ABN AMRO 124 2% 3.000 42% 70 1% 15 0% 3.858 55% 7.067Aegon 110 8% 1.173 81% 79 5% 20 1% 67 5% 1.449Akzo Nobel 30 3% 806 87% 43 5% 25 3% 18 2% 922Albert Heijn 328 3% 11.116 96% 77 1% 1 0% 59 1% 11.581Arcadis 8 2% 422 93% 9 2% 10 2% 6 1% 455ArcelorMittal 439 8% 4.569 83% 296 5% 89 2% 139 3% 5.532Blokker 155 6% 2.526 91% 71 3% 3 0% 14 1% 2.769Bol.com 472 8% 5.124 89% 115 2% - 0% 71 1% 5.782C1000 362 3% 10.583 96% 81 1% 5 0% 33 0% 11.064Coca-Cola 1.653 5% 29.347 89% 999 3% 69 0% 885 3% 32.953Fugro 6 1% 385 90% 20 5% 15 4% 2 0% 428Heineken 5.726 15% 32.332 82% 494 1% 122 0% 751 2% 39.425KLM 2.316 9% 22.601 86% 617 2% 90 0% 740 3% 26.364NS 703 12% 4.970 85% 103 2% - 0% 87 1% 5.863Philips 4.641 12% 26.260 68% 3.404 9% 138 0% 4.007 10% 38.450PostNL 77 6% 1.207 91% 27 2% - 0% 12 1% 1.323TomTom 1.308 4% 29.787 91% 630 2% 67 0% 956 3% 32.748Unibail-Rodamco 3 1% 487 95% 9 2% 12 2% 1 0% 512Total 18.461 8% 186.695 83% 7.144 3% 681 0% 11.706 5% 224.687
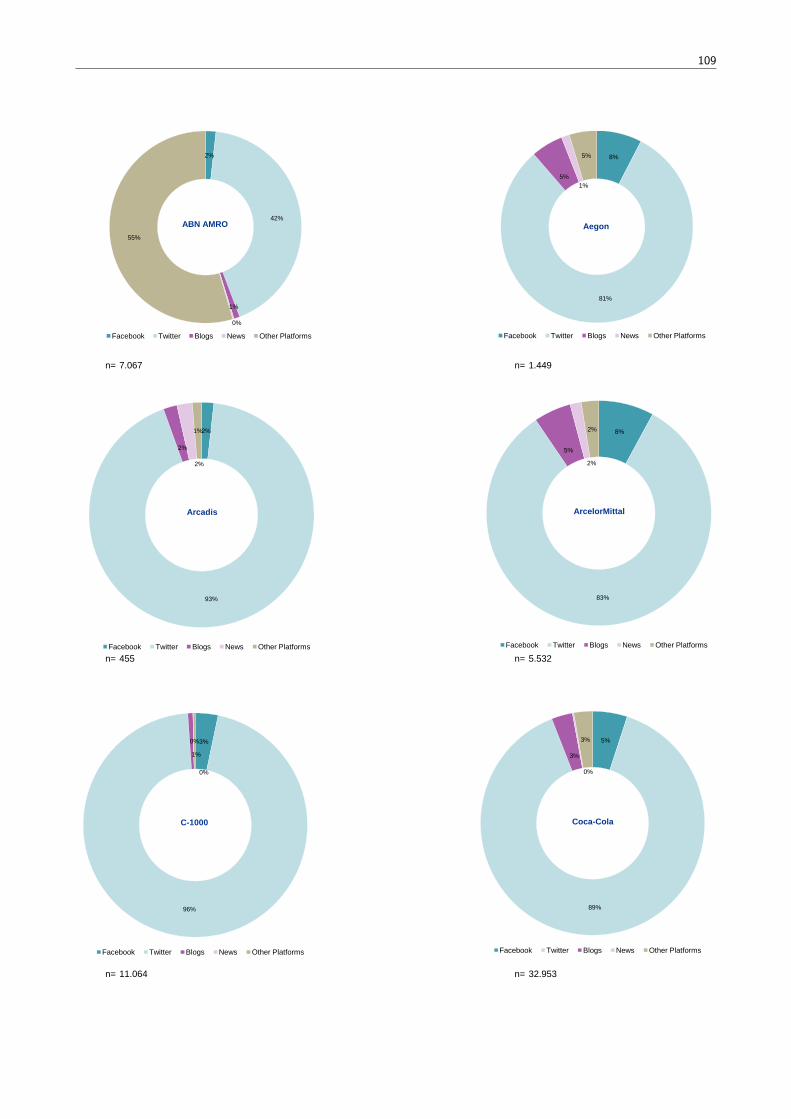
109
2%
42%
55%
ABN AMRO
8%
81%
5%1%
5%
Aegon
n= 7.067 n= 1.449
1%
0%
Facebook Twitter Blogs News Other Platforms
81%
Facebook Twitter Blogs News Other Platforms
2%
2%
2%
1%
Arcadis
8%
5%
2%
2%
ArcelorMittal
n= 455 n= 5.532
93%
Facebook Twitter Blogs News Other Platforms
83%
Facebook Twitter Blogs News Other Platforms
3%
1%
0%
0% 5%
3%
0%
3%
n= 11.064 n= 32.953
96%
C-1000
Facebook Twitter Blogs News Other Platforms
89%
Coca-Cola
Facebook Twitter Blogs News Other Platforms
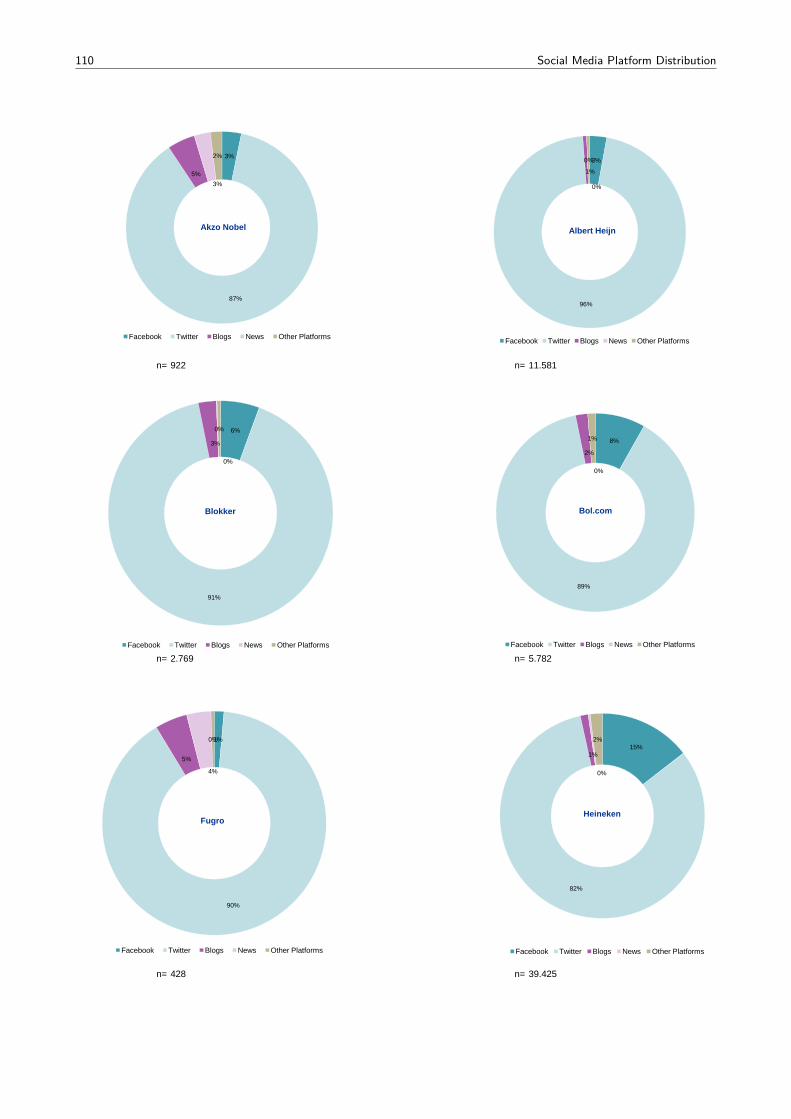
110 Social Media Platform Distribution
3%
87%
5%
3%
2%
Akzo Nobel
3%
1%
0%
0%
Albert Heijn
n= 922 n= 11.581
87%
Facebook Twitter Blogs News Other Platforms
96%
Facebook Twitter Blogs News Other Platforms
6%
3%
0%
0%
Blokker
8%
2%
0%
1%
Bol.com
n= 2.769 n= 5.782
91%
Facebook Twitter Blogs News Other Platforms
89%
Facebook Twitter Blogs News Other Platforms
1%
5%
4%
0%15%
1%
0%
2%
n= 428 n= 39.425
90%
Fugro
Facebook Twitter Blogs News Other Platforms
82%
Heineken
Facebook Twitter Blogs News Other Platforms
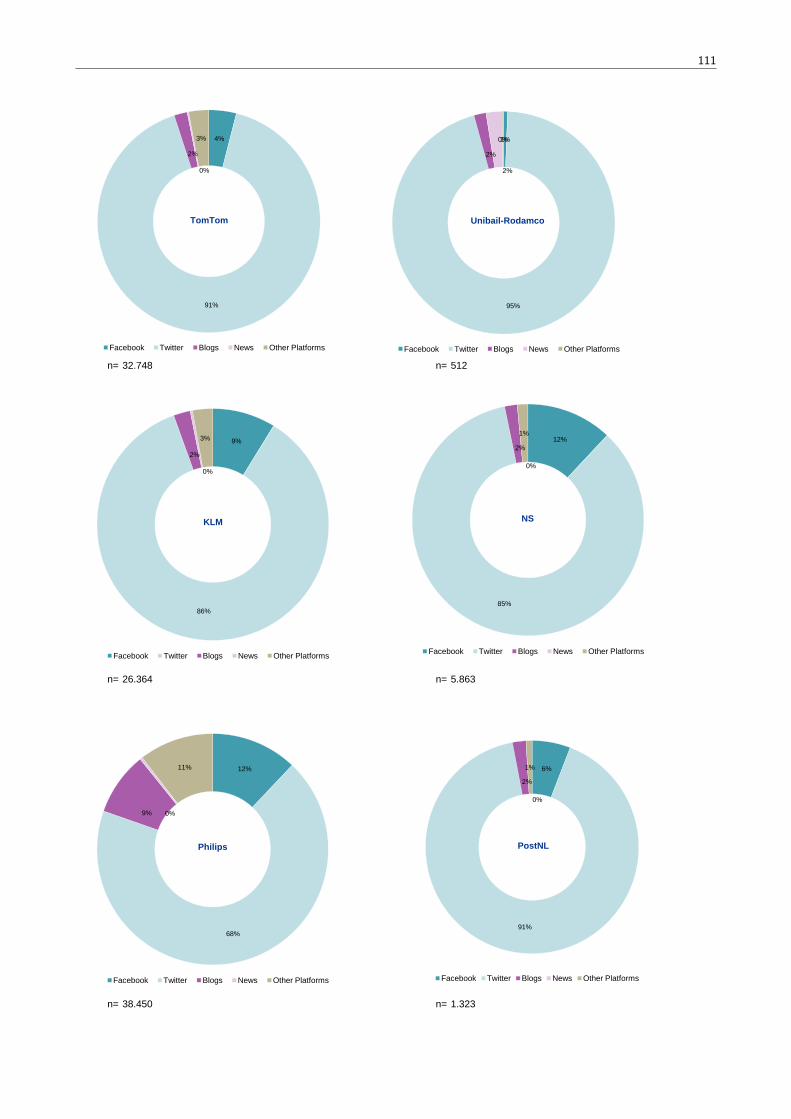
111
4%
2%
0%
3%
TomTom
1%
2%
2%
0%
Unibail-Rodamco
n= 32.748 n= 512
9%
2%
0%
3%
KLM
12%2%
0%
1%
NS
91%
Facebook Twitter Blogs News Other Platforms
95%
Facebook Twitter Blogs News Other Platforms
n= 26.364 n= 5.863
86%
Facebook Twitter Blogs News Other Platforms
85%
Facebook Twitter Blogs News Other Platforms
12%
9% 0%
11% 6%
2%
0%
1%
n= 38.450 n= 1.323
68%
Philips
Facebook Twitter Blogs News Other Platforms
91%
PostNL
Facebook Twitter Blogs News Other Platforms
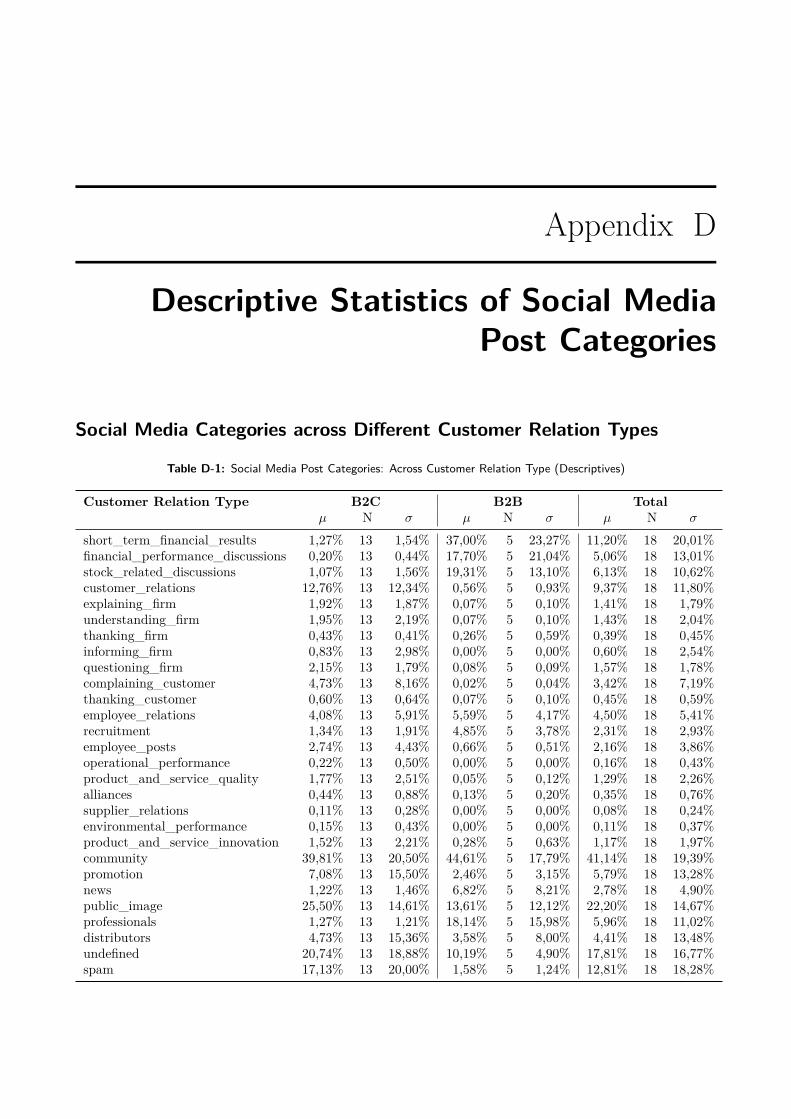
Appendix D
Descriptive Statistics of Social MediaPost Categories
Social Media Categories across Different Customer Relation Types
Table D-1: Social Media Post Categories: Across Customer Relation Type (Descriptives)
Customer Relation Type B2C B2B Totalµ N σ µ N σ µ N σ
short_term_financial_results 1,27% 13 1,54% 37,00% 5 23,27% 11,20% 18 20,01%financial_performance_discussions 0,20% 13 0,44% 17,70% 5 21,04% 5,06% 18 13,01%stock_related_discussions 1,07% 13 1,56% 19,31% 5 13,10% 6,13% 18 10,62%customer_relations 12,76% 13 12,34% 0,56% 5 0,93% 9,37% 18 11,80%explaining_firm 1,92% 13 1,87% 0,07% 5 0,10% 1,41% 18 1,79%understanding_firm 1,95% 13 2,19% 0,07% 5 0,10% 1,43% 18 2,04%thanking_firm 0,43% 13 0,41% 0,26% 5 0,59% 0,39% 18 0,45%informing_firm 0,83% 13 2,98% 0,00% 5 0,00% 0,60% 18 2,54%questioning_firm 2,15% 13 1,79% 0,08% 5 0,09% 1,57% 18 1,78%complaining_customer 4,73% 13 8,16% 0,02% 5 0,04% 3,42% 18 7,19%thanking_customer 0,60% 13 0,64% 0,07% 5 0,10% 0,45% 18 0,59%employee_relations 4,08% 13 5,91% 5,59% 5 4,17% 4,50% 18 5,41%recruitment 1,34% 13 1,91% 4,85% 5 3,78% 2,31% 18 2,93%employee_posts 2,74% 13 4,43% 0,66% 5 0,51% 2,16% 18 3,86%operational_performance 0,22% 13 0,50% 0,00% 5 0,00% 0,16% 18 0,43%product_and_service_quality 1,77% 13 2,51% 0,05% 5 0,12% 1,29% 18 2,26%alliances 0,44% 13 0,88% 0,13% 5 0,20% 0,35% 18 0,76%supplier_relations 0,11% 13 0,28% 0,00% 5 0,00% 0,08% 18 0,24%environmental_performance 0,15% 13 0,43% 0,00% 5 0,00% 0,11% 18 0,37%product_and_service_innovation 1,52% 13 2,21% 0,28% 5 0,63% 1,17% 18 1,97%community 39,81% 13 20,50% 44,61% 5 17,79% 41,14% 18 19,39%promotion 7,08% 13 15,50% 2,46% 5 3,15% 5,79% 18 13,28%news 1,22% 13 1,46% 6,82% 5 8,21% 2,78% 18 4,90%public_image 25,50% 13 14,61% 13,61% 5 12,12% 22,20% 18 14,67%professionals 1,27% 13 1,21% 18,14% 5 15,98% 5,96% 18 11,02%distributors 4,73% 13 15,36% 3,58% 5 8,00% 4,41% 18 13,48%undefined 20,74% 13 18,88% 10,19% 5 4,90% 17,81% 18 16,77%spam 17,13% 13 20,00% 1,58% 5 1,24% 12,81% 18 18,28%
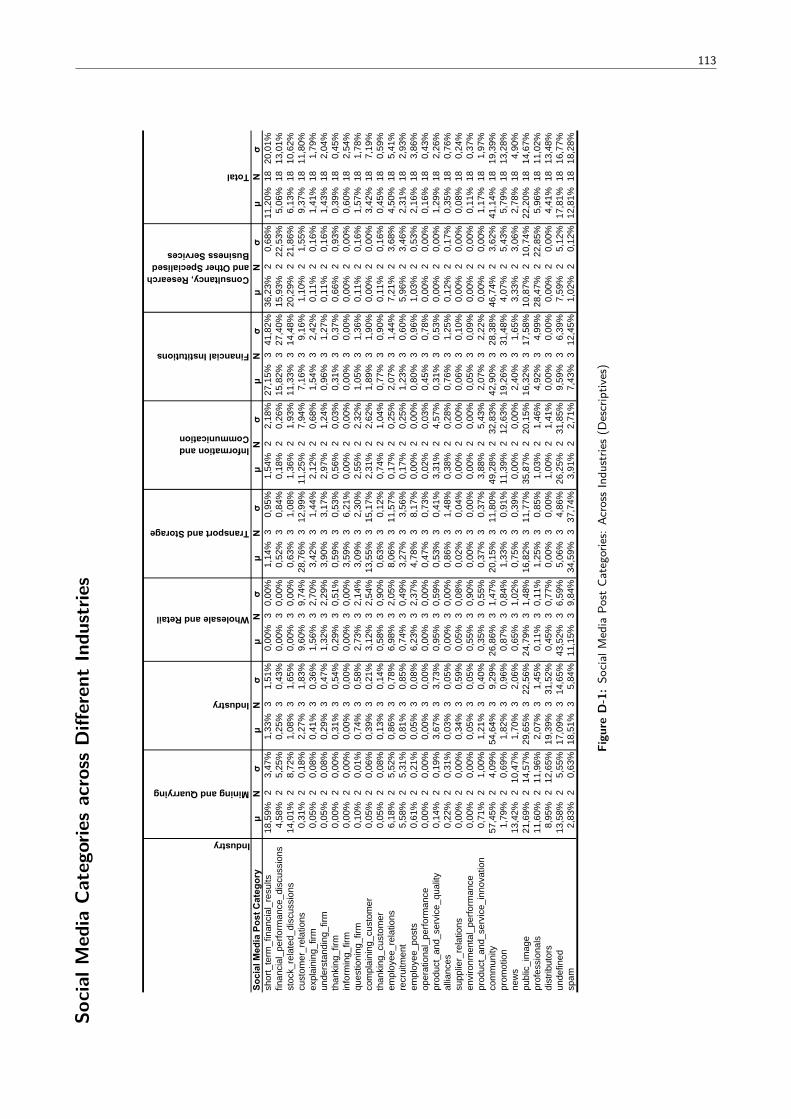
113
Social
Media
Categoriesacross
DifferentIndu
strie
s
IndustrySo
cial
Med
ia P
ost C
ateg
ory
μN
σμ
Nσ
μN
σμ
Nσ
μN
σμ
Nσ
μN
σμ
Nσ
shor
t_te
rm_f
inan
cial
_res
ults
18,5
9%2
3,47
%1,
33%
31,
51%
0,00
%3
0,00
%1,
14%
30,
95%
1,54
%2
2,18
%27
,15%
341
,82%
36,2
3%2
0,68
%11
,20%
1820
,01%
finan
cial
_per
form
ance
_dis
cuss
ions
4,58
%2
5,25
%0,
25%
30,
43%
0,00
%3
0,00
%0,
52%
30,
84%
0,18
%2
0,26
%15
,82%
327
,40%
15,9
3%2
22,5
3%5,
06%
1813
,01%
stoc
k_re
late
d_di
scus
sion
s14
,01%
28,
72%
1,08
%3
1,65
%0,
00%
30,
00%
0,63
%3
1,08
%1,
36%
21,
93%
11,3
3%3
14,4
8%20
,29%
221
,86%
6,13
%18
10,6
2%cu
stom
er_r
elat
ions
0,31
%2
0,18
%2,
27%
31,
83%
9,60
%3
9,74
%28
,76%
312
,99%
11,2
5%2
7,94
%7,
16%
39,
16%
1,10
%2
1,55
%9,
37%
1811
,80%
expl
aini
ng_f
irm0,
05%
20,
08%
0,41
%3
0,36
%1,
56%
32,
70%
3,42
%3
1,44
%2,
12%
20,
68%
1,54
%3
2,42
%0,
11%
20,
16%
1,41
%18
1,79
%un
ders
tand
ing_
firm
0,05
%2
0,08
%0,
29%
30,
47%
1,32
%3
2,29
%3,
90%
33,
17%
2,97
%2
1,24
%0,
96%
31,
27%
0,11
%2
0,16
%1,
43%
182,
04%
than
king
_firm
0,00
%2
0,00
%0,
31%
30,
54%
0,29
%3
0,51
%0,
59%
30,
53%
0,56
%2
0,03
%0,
31%
30,
37%
0,66
%2
0,93
%0,
39%
180,
45%
info
rmin
g_fir
m0,
00%
20,
00%
0,00
%3
0,00
%0,
00%
30,
00%
3,59
%3
6,21
%0,
00%
20,
00%
0,00
%3
0,00
%0,
00%
20,
00%
0,60
%18
2,54
%qu
estio
ning
_firm
0,10
%2
0,01
%0,
74%
30,
58%
2,73
%3
2,14
%3,
09%
32,
30%
2,55
%2
2,32
%1,
05%
31,
36%
0,11
%2
0,16
%1,
57%
181,
78%
com
plai
ning
_cus
tom
er0,
05%
20,
06%
0,39
%3
0,21
%3,
12%
32,
54%
13,5
5%3
15,1
7%2,
31%
22,
62%
1,89
%3
1,90
%0,
00%
20,
00%
3,42
%18
7,19
%th
anki
ng_c
usto
mer
0,05
%2
0,08
%0,
13%
30,
14%
0,58
%3
0,90
%0,
63%
30,
12%
0,74
%2
1,04
%0,
77%
30,
90%
0,11
%2
0,16
%0,
45%
180,
59%
empl
oyee
_rel
atio
ns6,
18%
25,
52%
0,86
%3
0,78
%6,
98%
32,
05%
8,06
%3
11,5
7%0,
17%
20,
25%
2,07
%3
1,44
%7,
21%
23,
68%
4,50
%18
5,41
%re
crui
tmen
t5,
58%
25,
31%
0,81
%3
0,85
%0,
74%
30,
49%
3,27
%3
3,56
%0,
17%
20,
25%
1,23
%3
0,60
%5,
96%
23,
46%
2,31
%18
2,93
%em
ploy
ee_p
osts
0,61
%2
0,21
%0,
05%
30,
08%
6,23
%3
2,37
%4,
78%
38,
17%
0,00
%2
0,00
%0,
80%
30,
96%
1,03
%2
0,53
%2,
16%
183,
86%
oper
atio
nal_
perfo
rman
ce0,
00%
20,
00%
0,00
%3
0,00
%0,
00%
30,
00%
0,47
%3
0,73
%0,
02%
20,
03%
0,45
%3
0,78
%0,
00%
20,
00%
0,16
%18
0,43
%pr
oduc
t_an
d_se
rvic
e_qu
ality
0,14
%2
0,19
%3,
67%
33,
73%
0,95
%3
0,59
%0,
53%
30,
41%
3,31
%2
4,57
%0,
31%
30,
53%
0,00
%2
0,00
%1,
29%
182,
26%
allia
nces
0,22
%2
0,31
%0,
03%
30,
05%
0,00
%3
0,00
%0,
86%
31,
48%
0,38
%2
0,28
%0,
76%
31,
25%
0,12
%2
0,17
%0,
35%
180,
76%
supp
lier_
rela
tions
0,00
%2
0,00
%0,
34%
30,
59%
0,05
%3
0,08
%0,
02%
30,
04%
0,00
%2
0,00
%0,
06%
30,
10%
0,00
%2
0,00
%0,
08%
180,
24%
envi
ronm
enta
l_pe
rform
ance
0,00
%2
0,00
%0,
05%
30,
05%
0,55
%3
0,90
%0,
00%
30,
00%
0,00
%2
0,00
%0,
05%
30,
09%
0,00
%2
0,00
%0,
11%
180,
37%
prod
uct_
and_
serv
ice_
inno
vatio
n0,
71%
21,
00%
1,21
%3
0,40
%0,
35%
30,
55%
0,37
%3
0,37
%3,
88%
25,
43%
2,07
%3
2,22
%0,
00%
20,
00%
1,17
%18
1,97
%co
mm
unity
57,4
5%2
4,09
%54
,64%
39,
29%
26,8
6%3
1,47
%20
,15%
311
,80%
49,2
8%2
32,8
3%42
,90%
328
,38%
46,7
4%2
3,62
%41
,14%
1819
,39%
prom
otio
n1,
79%
20,
69%
1,82
%3
0,96
%0,
87%
30,
84%
1,33
%3
0,91
%11
,39%
212
,63%
19,2
6%3
31,4
8%4,
07%
25,
43%
5,79
%18
13,2
8%ne
ws
13,4
2%2
10,4
7%1,
70%
32,
06%
0,65
%3
1,02
%0,
75%
30,
39%
0,00
%2
0,00
%2,
40%
31,
65%
3,33
%2
3,06
%2,
78%
184,
90%
publ
ic_i
mag
e21
,69%
214
,57%
29,6
5%3
22,5
6%24
,79%
31,
48%
16,8
2%3
11,7
7%35
,87%
220
,15%
16,3
2%3
17,5
8%10
,87%
210
,74%
22,2
0%18
14,6
7%pr
ofes
sion
als
11,6
0%2
11,9
6%2,
07%
31,
45%
0,11
%3
0,11
%1,
25%
30,
85%
1,03
%2
1,46
%4,
92%
34,
99%
28,4
7%2
22,8
5%5,
96%
1811
,02%
dist
ribut
ors
8,95
%2
12,6
5%19
,39%
331
,52%
0,45
%3
0,77
%0,
00%
30,
00%
1,00
%2
1,41
%0,
00%
30,
00%
0,00
%2
0,00
%4,
41%
1813
,48%
unde
fined
13,5
8%2
5,55
%17
,09%
314
,65%
43,5
2%3
6,59
%5,
06%
34,
86%
26,2
5%2
31,8
5%9,
59%
36,
39%
7,59
%2
5,12
%17
,81%
1816
,77%
spam
2,83
%2
0,63
%18
,51%
35,
84%
11,1
5%3
9,84
%34
,59%
337
,74%
3,91
%2
2,71
%7,
43%
312
,45%
1,02
%2
0,12
%12
,81%
1818
,28%
Wholesale and Retail
Transport and Storage
Information and Communication
Financial Institutions
Consultancy, Research and Other Specialised Business Services
Total
Mining and Quarrying
Industry
Figu
reD-1:So
cial
Media
Post
Categorie
s:Ac
ross
Indu
strie
s(D
escriptiv
es)
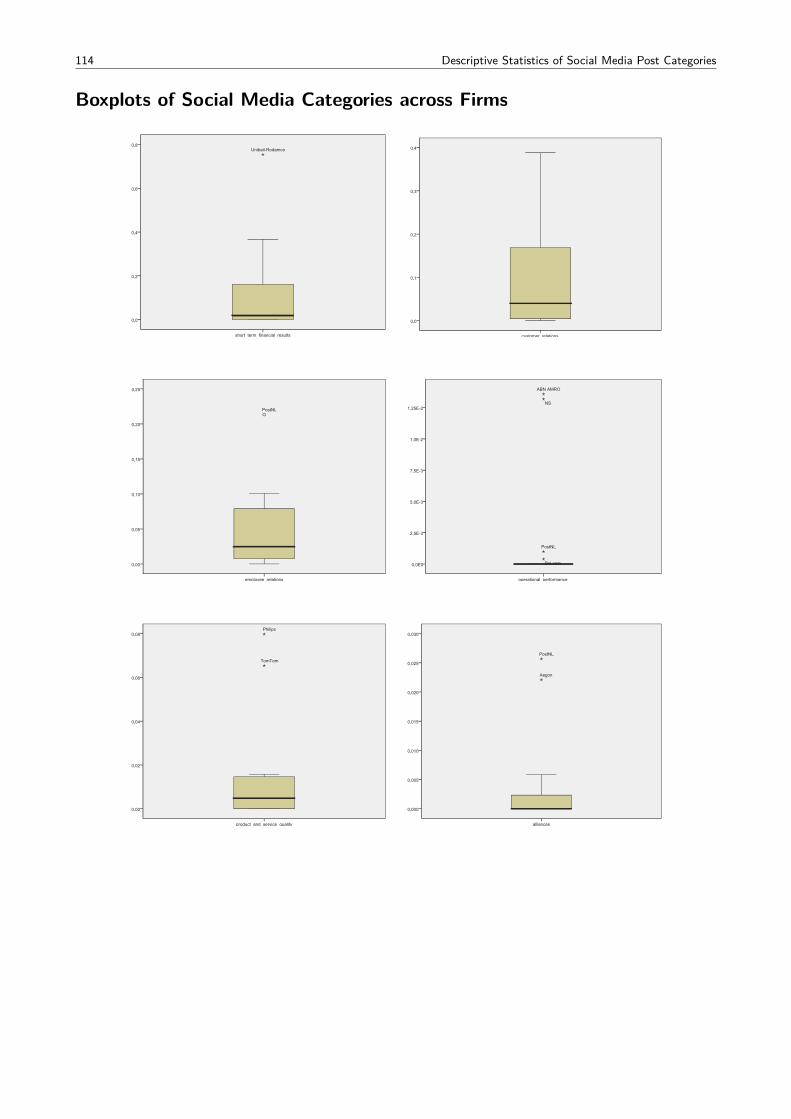
114 Descriptive Statistics of Social Media Post Categories
Boxplots of Social Media Categories across Firms
Case Processing Summary
Cases
Valid Missing Total
N Percent N Percent N Percentalliances
supplier_relationsenvironmental_performance
product_and_service_innovation
community
promotion
news
public_image
professionals
distributors
undefined
spam
18 100,0% 0 0,0% 18 100,0%
18 100,0% 0 0,0% 18 100,0%
18 100,0% 0 0,0% 18 100,0%
18 100,0% 0 0,0% 18 100,0%
18 100,0% 0 0,0% 18 100,0%
18 100,0% 0 0,0% 18 100,0%
18 100,0% 0 0,0% 18 100,0%
18 100,0% 0 0,0% 18 100,0%
18 100,0% 0 0,0% 18 100,0%
18 100,0% 0 0,0% 18 100,0%
18 100,0% 0 0,0% 18 100,0%
18 100,0% 0 0,0% 18 100,0%
short_term_financial_results
short_term_financial_results
0,8
0,6
0,4
0,2
0,0
Unibail-Rodamco
Page 2
customer_relations
0,4
0,3
0,2
0,1
0,0
explaining_firm
Page 5
employee_relations
0,25
0,20
0,15
0,10
0,05
0,00
PostNL
recruitment
Page 13
operational_performance
1,25E-2
1,0E-2
7,5E-3
5,0E-3
2,5E-3
0,0E0
ABN AMRO
NS
PostNL
Bol.com
product_and_service_quality
Page 16
product_and_service_quality
0,08
0,06
0,04
0,02
0,00
Philips
TomTom
alliances
Page 17
alliances
0,030
0,025
0,020
0,015
0,010
0,005
0,000
PostNL
Aegon
supplier_relations
Page 18
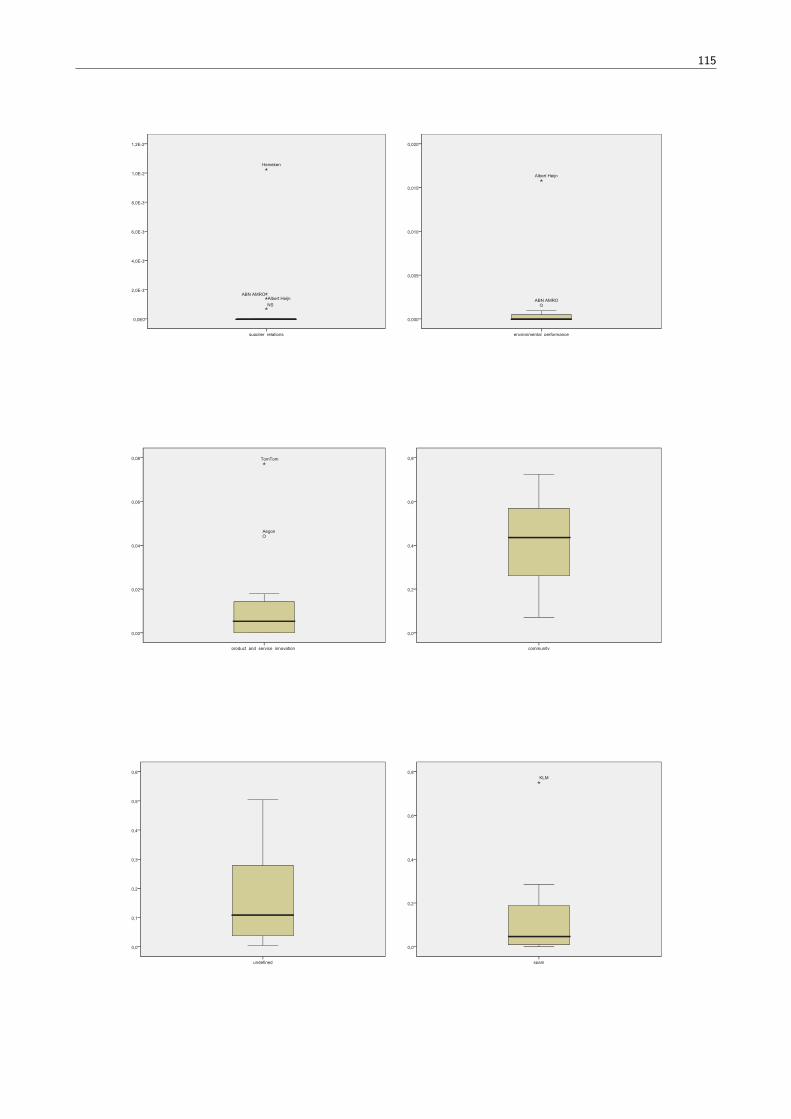
115
supplier_relations
1,2E-2
1,0E-2
8,0E-3
6,0E-3
4,0E-3
2,0E-3
0,0E0
Heineken
ABN AMROAlbert HeijnNS
environmental_performance
Page 19
environmental_performance
0,020
0,015
0,010
0,005
0,000
Albert Heijn
ABN AMRO
product_and_service_innovation
Page 20
product_and_service_innovation
0,08
0,06
0,04
0,02
0,00
TomTom
Aegon
community
Page 21
community
0,8
0,6
0,4
0,2
0,0
promotion
Page 22
undefined
0,6
0,5
0,4
0,3
0,2
0,1
0,0
spam
Page 28
spam
0,8
0,6
0,4
0,2
0,0
KLM
Page 29
Appendix E
Corporate Engagement
The next page lists the user names of firms that have been found in our dataset. These user names have beenused to assign social media messages in the category ‘firm-to-customer’.
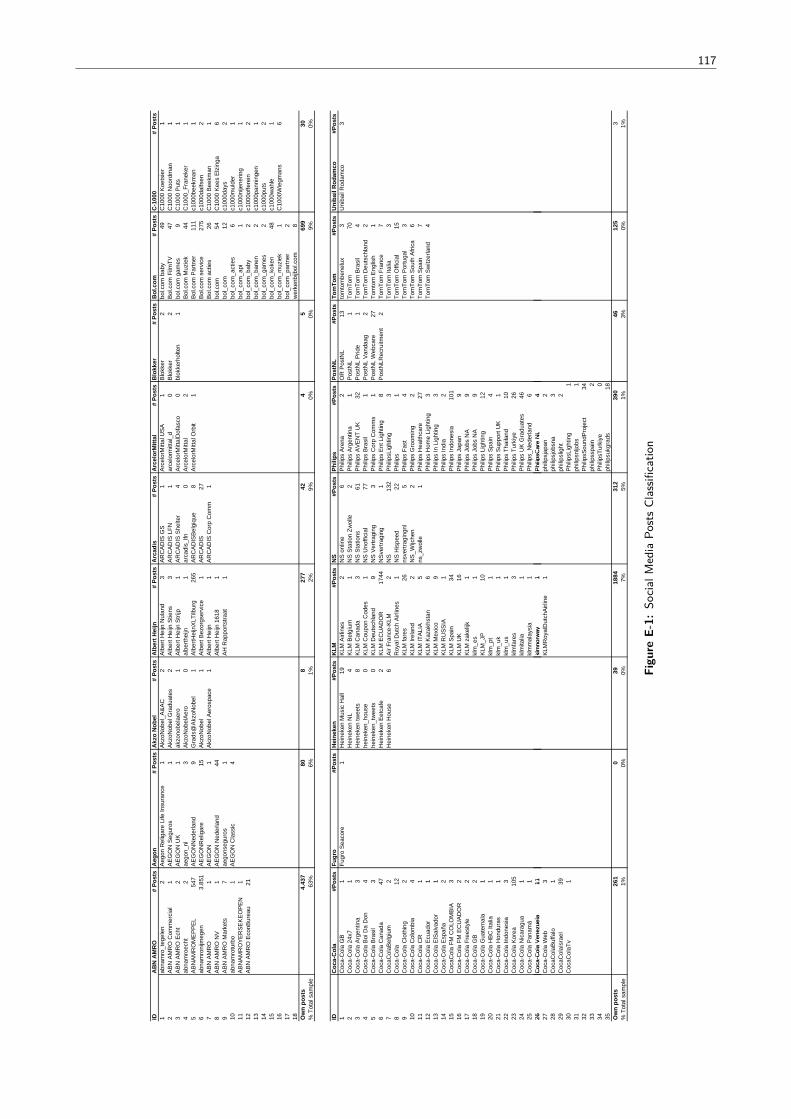
117
IDA
BN
AM
RO
# Po
sts
Aeg
on#
Post
sA
kzo
Nob
el#
Post
sA
lber
t Hei
jn#
Post
sA
rcad
is#
Post
sA
rcel
orM
ittal
# Po
sts
Blo
kker
# Po
sts
Bol
.com
# Po
sts
C-1
000
# Po
sts
1ab
nam
ro_t
egel
en2
Aeg
on R
elig
are
Life
Insu
ranc
e1
Akz
oNob
el_A
&A
C2
Alb
ert H
eijn
Nul
and
3A
RC
AD
IS G
S1
Arc
elor
Mitt
al U
SA
1B
lokk
er2
bol.c
om b
aby
49C
1000
Koe
tsie
r1
2A
BN
AM
RO
Com
mer
cial
1A
EG
ON
Seg
uros
1A
kzoN
obel
Gra
duat
es2
Alb
ert H
eijn
Stie
ns3
AR
CA
DIS
LFN
1ar
celo
rmitt
al_d
0B
lokk
er2
Bol
.com
Film
TV47
C10
00 N
oord
man
13
AB
N A
MR
O E
cht
2A
EG
ON
UK
1ak
zono
bela
ero
1A
lber
t Hei
jn S
trijp
1A
RC
AD
IS S
helte
r4
Arc
elor
Mitt
alD
ofas
co0
blok
kerh
olte
n1
bol.c
om g
ames
9C
1000
Put
s1
4ab
nam
roec
ht2
aego
n_nl
3A
kzoN
obel
Aer
o0
albe
rthei
jn1
arca
dis_
lfn0
Arc
elor
Mitt
al2
Bol
.com
Muz
iek
44C
1000
_Fra
neke
r1
5A
BN
AM
RO
ME
PP
EL
547
AE
GO
NN
eder
land
9G
rads
@A
kzoN
obel
1A
lber
tHei
jnX
LTilb
urg
265
AR
CA
DIS
Bel
giqu
e8
Arc
elor
Mitt
al O
rbit
1B
ol.c
om P
artn
er11
1c1
000b
eekm
an1
6ab
nam
roni
jmeg
en3.
851
AE
GO
NR
elig
are
15A
kzoN
obel
1A
lber
t Bez
orgs
ervi
ce1
AR
CA
DIS
27B
ol.c
om s
ervi
ce27
5c1
000d
alfs
en2
7A
BN
AM
RO
1A
EG
ON
1A
kzoN
obel
Aer
ospa
ce1
Alb
ert H
eijn
1A
RC
AD
IS C
orp
Com
m1
Bol
.com
act
ies
26C
1000
Bee
kman
18
AB
N A
MR
O N
V1
AE
GO
N N
eder
land
44A
lber
t Hei
jn 1
618
1bo
l.com
54C
1000
Kee
s E
lzin
ga6
9A
BN
AM
RO
Mar
kets
7ae
gons
egur
os1
AH
Rap
ports
traat
1bo
l_co
m12
c100
0day
s2
10ab
nam
rotu
rbo
1A
EG
ON
Cla
ssic
4bo
l_co
m_a
ctie
s6
c100
0mul
der
111
AB
NA
MR
OY
ER
SE
KE
OP
EN
1bo
l_co
m_a
pi1
c100
0nije
nerin
g1
12A
BN
AM
RO
Eco
nBur
eau
21bo
l_co
m_b
aby
2c1
000o
ffere
in2
13bo
l_co
m_b
anen
2c1
000p
anni
ngen
114
bol_
com
_gam
es2
c100
0put
s2
15bo
l_co
m_k
oken
48c1
000w
ahle
116
bol_
com
_muz
iek
1C
1000
Wie
gman
s6
17bo
l_co
m_p
artn
er2
18w
erke
nbijb
ol.c
om8
Ow
n po
sts
4.43
780
827
742
45
699
30%
Tot
al s
ampl
e63
%6%
1%2%
9%0%
0%9%
0%
IDC
oca-
Col
a#P
osts
Fugr
o#P
osts
Hei
neke
n#P
osts
KLM
#Pos
tsN
S#P
osts
Phili
ps#P
osts
Post
NL
#Pos
tsTo
mTo
m#P
osts
Uni
bail
Rod
amco
#Pos
ts1
Coc
a-C
ola
GB
1Fu
gro
Sea
core
1H
eine
ken
Mus
ic H
all
19K
LM A
irlin
es2
NS
onl
ine
6P
hilip
s A
rena
2
OR
Pos
tNL
13to
mto
mbe
nelu
x3
Uni
bail
Rod
amco
32
Coc
a-C
ola
24x7
1H
eine
ken
NL
4K
LM B
elgi
um1
NS
Sta
tion
Zwol
le2
Phi
lips
Arg
entin
a1
Pos
tNL
1To
mTo
m70
3C
oca-
Col
a A
rgen
tina
3H
eine
ken
twee
ts8
KLM
Can
ada
3N
S S
tatio
ns61
Phi
lips
AV
EN
T U
K32
Pos
tNL
Prid
e1
Tom
Tom
Bra
sil
44
Coc
a-C
ola
Boi
Da
Don
4he
inek
en_h
ouse
0K
LM C
oupo
n C
odes
1N
S U
noffi
cial
77P
hilip
s B
rasi
l1
Pos
tNL
Van
daag
2To
mTo
m D
euts
chla
nd2
5C
oca-
Col
a B
rasi
l3
hein
eken
_tw
eets
0K
LM D
euts
chla
nd9
NS
Ver
tragi
ng3
Phi
lips
Cor
p C
omm
s1
Pos
tNL
Web
care
27To
mto
m E
nglis
h1
6C
oca-
Col
a C
anad
a47
Hei
neke
n E
etca
fe2
KLM
EC
UA
DO
R17
44N
Sve
rtrag
ing
1P
hilip
s E
nt L
ight
ing
8P
ostN
LRec
ruitm
ent
2To
mTo
m F
ranc
e7
7C
ocaC
olaB
elgi
um2
Hei
neke
n H
ouse
6A
ir Fr
ance
-KLM
2
NS
132
Phi
lipsL
ight
ing
3To
mTo
m It
alia
38
Coc
a-C
ola
12R
oyal
Dut
ch A
irlin
es1
NS
His
peed
22P
hilip
s1
Tom
Tom
Offi
cial
159
Coc
a-C
ola
Clo
thin
g2
KLM
fare
s26
nsve
rtrag
ingn
l5
Phi
lips
Fast
4To
mTo
m P
ortu
gal
310
Coc
a-C
ola
Col
ombi
a4
KLM
Irel
and
2N
S_W
ijche
n2
Phi
lips
Gro
omin
g2
Tom
Tom
Sou
th A
frica
611
Coc
a-C
ola
CR
1K
LM IT
ALI
A5
ns_z
wol
le1
Phi
lips
Hea
lthca
re27
Tom
Tom
Spa
in7
12C
oca-
Col
a E
cuad
or1
KLM
Kaz
akhs
tan
6P
hilip
s H
ome
Ligh
ting
3To
mTo
m S
witz
erla
nd4
13C
oca-
Col
a E
lSal
vado
r1
KLM
Mex
ico
9P
hilip
s In
Lig
htin
g3
14C
oca-
Col
a E
spañ
a2
KLM
RU
SS
IA1
Phi
lips
Indi
a2
15C
ocaC
ola
FM C
OLO
MB
IA3
KLM
Spa
in34
Phi
lips
Indo
nesi
a10
116
Coc
a-C
ola
FM E
CU
AD
OR
2K
LM U
K16
Phi
lips
Japa
n9
17C
oca-
Col
a Fr
eest
yle
2K
LM z
akel
ijk1
Phi
lips
Jobs
NA
918
Coc
a-C
ola
GB
2kl
m_e
s1
Phi
lips
Jobs
NA
919
Coc
a-C
ola
Gua
tem
ala
1K
LM_J
P10
Phi
lips
Ligh
ting
1220
Coc
a-C
ola
HB
C It
alia
1kl
m_p
t1
Phi
lips
Spa
in4
21C
oca-
Col
a H
ondu
ras
1kl
m_u
k1
Phi
lips
Sup
port
UK
122
Coc
a-C
ola
Indo
nesi
a3
klm
_us
1P
hilip
s Th
aila
nd10
23C
oca-
Col
a K
orea
105
klm
fare
s3
Phi
lips
Turk
iye
2624
Coc
a-C
ola
Nic
arag
ua1
klm
italia
1P
hilip
s U
K G
radu
ates
4625
Coc
a-C
ola
Pan
amá
1kl
mm
alay
sia
1P
hilip
s_N
eder
land
626
Coc
a-C
ola
Ven
ezue
la11
klm
norw
ay1
Phi
lipsC
are
NL
426
Coc
a-C
ola
Ven
ezue
la11
klm
norw
ay1
Phi
lipsC
are
NL
427
Coc
a-C
ola
Web
3K
LMR
oyal
Dut
chA
irlin
e1
phili
psja
pan
228
Coc
aCol
aBuf
falo
1ph
ilips
jobs
na3
29C
ocaC
olaI
srae
l39
phili
pslig
ht2
30C
ocaC
olaT
v1
Phi
lipsL
ight
ing
131
phili
psnl
jobs
132
Phi
lipsS
ound
Pro
ject
3433
phili
pssp
ain
234
Phi
lipsT
urki
ye0
35ph
ilips
ukgr
ads
18O
wn
post
s26
10
3918
8431
239
046
125
3%
Tot
al s
ampl
e1%
0%0%
7%5%
1%3%
0%1%
Figu
reE-1:
Social
Media
PostsClassifi
catio
n

Bibliography
Agichtein, E., Castillo, C., Donato, D., Gionis, A., & Mishne, G. (2008). Finding high-quality content in socialmedia. In Proceedings of the international conference on web search and web data mining (pp. 183–194).Association for Computing Machinery.
Araujo, T., & Neijens, P. (2012). Friend me: Which factors influence top global brands participation in socialnetwork sites. Internet Research, 22 , 626 – 640.
Auditore, P. J. (2012a). The market for social media and business intelligence tools. Asteria Research.Retrieved July 31, 2012, from http://sandhill.com/article/the-market-for-social-media-and-business-intelligence-tools/
Auditore, P. J. (2012b). Share-unisphere research study: Adoption of social media bi on the rise.SHARE-Unisphere. Retrieved July 31, 2012, from http://www.dbta.com/Articles/Editorial/Trends-and-Applications/SHARE-Unisphere-Research-Study-Adoption-of-Social-Media-BI-on-the-Rise-83119.aspx
Azvine, B., Cui, Z., & Nauck, D. D. (2005). Towards real-time business intelligence. BT Technology Journal,23 , 214–225.
Berthon, P. R., Pitt, L. F., McCarthy, I., & Kates, S. M. (2007). When customers get clever: Managerialapproaches to dealing with creative consumers. Business Horizons, 50 (1), 39–47.
Bonneau, J., & Preibusch, S. (2010). The privacy jungle: On the market for data protection in social networks.In T. Moore, D. Pym, & C. Ioannidis (Eds.), Economics of information security and privacy (pp. 121–167).Springer US.
Bos, W., & Tarnai, C. (1999). Content analysis in empirical social research. International Journal of EducationalResearch, 31 (8), 659–671.
Bouwman, H., Faber, E., Haaker, T., Kijl, B., & de Reuver, M. (2008). Conceptualizing the stof model. InH. Bouwman, H. de Vos, & T. Haaker (Eds.), Mobile service innovation and business models (pp. 31 –69). Berlin, Heidelberg: Springer.
Boyd, D. M., & Ellison, N. B. (2007). Social network sites: Definition, history, and scholarship. Journal ofComputer-Mediated Communication, 13 (1), 210–230.
Bryant, L. (2011). Moving from social media monitoring to social business intelligence. Headshift, Dachis Group.Retrieved July 25, 2012, from http://www.headshift.com/our-blog/2011/06/15/from-social-media-monitoring-to-social-business-intelligence/
Bughin, J., Chui, M., & Manyika, J. (2010). Clouds, big data, and smart assets: Ten tech-enabled businesstrends to watch. McKinsey & Co. Quarterly. (White Paper).
CBS. (2012). Standaard bedrijfsindeling 2008. versie 2012. Centraal Bureau voor de Statistiek.Chaffey, D. (2009). E-business and e-commerce management (4th edition). Upper Saddle River, NJ, USA:
Prentice-Hall, Inc.Chen, D.-N., Jeng, B., Lee, W.-P., & Chuang, C.-H. (2008). An agent-based model for consumer-to-business
electronic commerce. Expert Systems with Applications, 34 (1), 469–481.DesAutels, P. (2011). Ugis: Understanding the nature of user-generated information systems. Business Horizons,
54 (3), 185 - 192.Dey, L., & Haque, S. K. M. (2008). Opinion mining from noisy text data. In Proceedings of the second workshop
on analytics for noisy unstructured text data (pp. 83–90). New York, NY, USA: ACM.Dhar, V., & Chang, E. A. (2009). Does chatter matter? the impact of user-generated content on music sales.
Journal of Interactive Marketing, 23 (4), 300–307.
Bibliography 119
Doeland, D. (2012). Social media & internet key performance indicators. Retrieved August 10,2012, from http://ddmca.nl/diensten/social-media-and-internet-monitoring/social-media-key-performance-indicators/
Dong-Hun, L. (2010). Growing popularity of social media and business strategy. Korean Consumer & Society.,112–117.
Dugan, L. (2012). Twitter to surpass 500 million registered users on wednesday. Retrieved August 15, 2012,from http://www.mediabistro.com/alltwitter/500-million-registered-users_b18842
Eccles, R. (1991). The performance measurement manifesto. Harvard Business School, 69 , 131–137.Eckerson, W. W. (2009). Performance management strategies. how to create and deploy effective metrics. The
Data Warehousing Institute. (White Paper).Elbashir, M. Z., Collier, P. A., & Davern, M. J. (2008). Measuring the effects of business intelligence systems:
The relationship between business process and organizational performance. International Journal ofAccounting Information Systems, 9 (3), 135–153.
evolve24. (2012). Website. Retrieved September 26, 2012, from http://www.evolve24.com/Fortuin, L. (1988). Performance indicators – why, where and how? European Journal of Operational Research,
34 , 1–9.Gartner. (2009). Gartner reveals five business intelligence predictions for 2009 and beyond. Retrieved June 17,
2012, from http://www.gartner.com/it/page.jsp?id=856714Gast, A., & Zanini, M. (2012). The social side of strategy. McKinsey Quarterly.Gates, S. (2001). Aligning strategic performance measures and results. The Conference Board. Balanced
Scorecard Interest Group.Gessner, G. H., & Volonio, L. (2005). Quick response improves returns on business intelligence investments.
Information Systems Management, 22 (3), 66–74.Ghose, A., & Panagiotos, I. (2010). The economining project at nyu: Studying the economic value of
user-generated content on the internet. Journal of Revenue and Pricing Management, 8 , 241–246.Gianfortoni, P., Adamson, D., & Rosé, C. P. (2011, July). Modeling of stylistic variation in social media with
stretchy patterns. In Proceedings of the first workshop on algorithms and resources for modelling of dialectsand language varieties (pp. 49–59). Edinburgh, Scotland: Association for Computational Linguistics.
Guo, J., Zhang, P., Tan, J., & Guo, L. (2012). Mining hot topics from twitter streams. Procedia ComputerScience, 9 , 2008–2011.
Hanna, R., Rohm, A., & Crittenden, V. L. (2011). We’re all connected: The power of the social mediaecosystem. Business Horizons, 54 (3), 265–273.
Huang, Q., Li, Q., Li, H., & Yan, Z. (2012). An approach to incremental deep web crawling based on incrementalharvest model. Procedia Engineering, 29 (0), 1081–1087.
IBM. (2011). From social media to social crm. reinventing the customer relationship. IBM Institute for BusinessValue analysis. (White Paper).
Ittner, C., Larcker, D., & Randall, T. (2003). Performance implications of strategic performance measurementin financial services firms. Accounting, Organizations and Society, 28 , 715–741.
Jansen, B. J., Zhang, M., Sobel, K., & Chowdury, A. (2009). Twitter power: Tweets as electronic word ofmouth. Journal of the American Society for Information Science, 60 (11), 2169–2188.
Kaplan, A. M., & Haenlein, M. (2010). Users of the world, unite! the challenges and opportunities of socialmedia. Business Horizons, 53 (1), 59–68.
Kaplan, A. M., & Haenlein, M. (2012). The britney spears universe: Social media and viral marketing at itsbest. Business Horizons, 55 (1), 27–31.
Kaplan, R. S., & Norton, D. P. (1992). The balanced scorecard – measures that drive performance. HarvardBusiness Review(5), 71–79.
Kaplan, R. S., & Norton, D. P. (1993). Putting the balanced scorecard to work. Harvard Business Review,71 (5), 134–147.
Kaplan, R. S., & Norton, D. P. (1996). Using the balanced scorecard as a strategic management system.Harvard Business Review(5), 1–13.
Kapow. (2009). Five key lessons for converting social media data into business intelligence. Kapow Software(White Paper).
Kennerley, M., & Neely, A. (2003). Measuring performance in a changing business environment. InternationalJournal of Operations and Production Management, 23 (2), 213–229.
Kietzmann, J. H., Hermkens, K., McCarthy, I. P., & Silvestre, B. S. (2011). Social media? get serious!understanding the functional building blocks of social media. Business Horizons, 54 (3), 241–251.
Kirtis, A. K., & Karahanb, F. (2011). To be or not to be in social media arena as the most cost-efficientmarketing strategy after the global recession. Procedia Social and Behavioral Sciences, 24 , 260–268.
120 Bibliography
Klassen, A. (2009). Forget twitter; your best online marketing tool is the humble product review. Ad Age, 1 .Kozinets, R. V., de Valck, K., Wojnicki, A. C., & Wilner, S. J. (2010). Networked narratives: Understanding
word-of-mouth marketing in online communities. Journal of Marketing, 74 (2), 71–89.KPMG. (2009). Does your business intelligence tell you the whole story?Krippendorff, K. (2004). Content analysis: An introduction to its methodology. (2nd, Ed.). Thousand Oaks,
CA: Sage.Laroche, M., Habibi, M. R., & Richard, M.-O. (2012). To be or not to be in social media: How brand loyalty
is affected by social media? International Journal of Information Management(0), -.Lee, C.-H. (2012). Unsupervised and supervised learning to evaluate event relatedness based on content mining
from social-media streams. Expert Systems with Applications, 39 , 13338–13356.Lonnqvist, A., & Pirttimaki, V. (2006). The measurement of business intelligence. Information Systems
Management, 23 (1), 32–40.Lovejoy, K., Waters, R., & Saxton, G. D. (2012). Engaging stakeholders through twitter: How nonprofit
organizations are getting more out of 140 characters or less. Public Relations Review, 38 , 313–318.Marwick, A. E., & Boyd, D. (2011). I tweet honestly, i tweet passionately: Twitter users, context collapse, and
the imagined audience. New Media & Society, 13 (1), 114–133.McCorkindale, T. (2010). Can you see the writing on my wall? a content analysis of the fortune 50’s facebook
social networking sites. Public Relations, 4 , 1–13.Molloy, J. C. (2011). The open knowledge foundation: Open data means better science. Public Libary of
Science, 9 (12).Murdough, C. (2009). Social media measurement: It’s not impossible. Journal of Interactive Advertising, 10 ,
94–99.Murugesan, S. (2007). Understanding web 2.0. IT Professional, 8 , 34–41.Neely, A., & Adams, C. (2005). Performance prism. In E. in Chief: Kimberly Kempf-Leonard (Ed.), Encyclopedia
of social measurement (pp. 41–48). New York: Elsevier.Neely, A., Adams, C., & Crowe, P. (2001). The performance prism in practice. In Measuring business excellence
(Vol. 5, pp. 6–12). MCB University Press.Neely, A., Bourne, B., & Kennerley, M. (2000). Performance measurement system design: Developing and
testing a process-based approach. International Journal of Operations and Production Management, 20 ,1119–1145.
Neely, A., Gregory, M., & Platts, K. (1995). Performance measurement system dsign: A literature review andresearch agenda. International Journal of Operations and Production Management, 15 , 80 – 116.
Netbase. (2012). Website. Retrieved September 26, 2012, from http://www.netbase.com/our-network/partners/sap-social-media-analytics/
Neuendorf, K. A. (2002). The content analysis guidebook. Thousand Oaks, CA: Sage.O’reilly, T. (2007). What is web 2.0: Design patterns and business models for the next generation of software.
Communications & Strategies, 65 , 17–37.Osterwalder, A., & Pigneur, Y. (2010). Business model generation. Hoboken, New Jersey: John Wiley & Sons,
Ltd.Patterson, A. (2012). Social-networkers of the world, unite and take over: A meta-introspective perspective on
the facebook brand. Journal of Business Research, 65 (4), 527–534.Peterson, R. A., & Wilson, W. R. (1992). Measuring customer satisfaction: Fact and artifact. Journal of the
Academy of Marketing Science, 20 , 61–71.Pirttimäki, V., & Hannula, M. (2003). Process models of business intelligence. Frontiers of E-Business Research,
250–260.PWC. (2007). Guide to key performance indicators. communicating the measures that matter. Price Waterhouse
Coopers. (White Paper).Radian6. (2012). Website. Retrieved September 26, 2012, from http://www.radian6.com/Ramakrishnan, T., Jones, M. C., & Sidorova, A. (2012). Factors influencing business intelligence (bi) data
collection strategies: An empirical investigation. Decision Support Systems, 52 (2), 486–496.Ratner, B. (2003). Statistical modeling and analysis for database marketing: effective techniques for mining big
data. Chapman & Hall / CRC Press.Reinhold, O., & Alt, R. (2011). Analytical social crm: Concept and tool support. BLED 2011 Proceedings,
Paper 50 .Rouibah, K., & Ould-ali, S. (2002). Puzzle: a concept and prototype for linking business intelligence to business
strategy. The Journal of Strategic Information Systems, 11 (2), 133–152.Shahin, A., & Ali Mahbod, M. (2007). Prioritization of key performance indicators: An integration of analytical
hierarchy process and goal setting. International Journal of Productivity and Performance Management,
Bibliography 121
56 , 226 – 240.Sloan, P. (2012). Facebook earnings match estimates; 955 million users. Retrieved August 15,
2012, from http://news.cnet.com/8301-1023_3-57480865-93/facebook-earnings-match-estimates-955-million-users/
Smith, A. N., Fischer, E., & Yongjian, C. (2012). How does brand-related user-generated content differ acrossyoutube, facebook, and twitter? Journal of Interactive Marketing, 26 (2), 102–113.
Smith, R. (2006). Key performance indicators. the basics of maintenance and reliability. Chapter 6.Stephens, W. (2012). Research and social media: Why & how to do a content analysis. Retrieved
July 20, 2012, from http://www.accountplanningblog.com/2012/05/research-and-social-media-why-how-to-do.html
Takac, C., Hinz, O., & Spann, M. (2011). The social embeddedness of decision making: opportunities andchallenges. Electronic Markets, 21 , 185-195.
Tirunillai, S., & Tellis, G. (2012). Does chatter really matter? dynamics of user-generated content and stockperformance. Marketing Science, 31 , 198–215.
Tsai, Y., & Cheng, Y. (2012). Analyzing key performance indicators (kpis) for e-commerce and internetmarketing of elderly products: A review. Archives of Gerontology and Geriatrics, 55 (1), 126 - 132.
Turban, E., Lee, J., King, D., & Chung, H. (1999). Electronic commerce: A managerial perspective.Prentice-Hall, Inc., New Jersey, USA.
Twitter. (2012). Twitter turns six. Retrieved June 17, 2012, from http://blog.twitter.com/2012/03/twitter-turns-six.html
Van Beek, D. (2006). De intelligente organisatie. prestatieverbetering en organisatie-ontwikkeling met businessintelligence. Tutein Nolthenius: ’s Hertogenbosch.
Watson, H., & Wixom, B. (2007). The current state of business intelligence. Computer , 40 (9), 96–99.Weinberg, B. D., & Pehlivan, E. (2011). Social spending: Managing the social media mix. Business Horizons,
54 (3), 275–282.Wikipedia. (2012). Wikipedia. Retrieved September 13, 2012, from http://en.wikipedia.org/wiki/
WikipediaWisner, J., & Fawcett, S. (1991). Linking firm strategy to operating decisions through performance
measurement. Production and Inventory Management Journal, Third Quarter , 5 – 11.You, W., Xia, M., Liu, L., & Liu, D. (2012). Customer knowledge discovery from online reviews. Electronic
Markets, 1–12.Zeng, D., Chen, H., Lusch, R., & Li, S.-H. (2010). Social media analytics and intelligence. Intelligent Systems,
IEEE , 25 (6), 13–16.Zhang, M., Jansen, B. J., & Chowdhury, A. (2011). Business engagement on twitter: a path analysis. Electronic
Markets, 21 (3), 161–175.

122 Bibliography
Related Documents