MASTERS OF ENGINEERING QUALITY IMPROVEMENT IN GARMENT FACTORY THROUGH TQM APPROACH MD. MIJANUR RAHMAN DEPARTMENT OF INDUSTRIAL & PRODUCTION ENGINEERING BANGLADESH UNIVERSITY OF ENGINEERING & TECHNOLOGY (BUET), DHAKA-1000, BANGLADESH December, 2013

Welcome message from author
This document is posted to help you gain knowledge. Please leave a comment to let me know what you think about it! Share it to your friends and learn new things together.
Transcript

MASTERS OF ENGINEERING
QUALITY IMPROVEMENT IN GARMENT FACTORY THROUGH
TQM APPROACH
MD. MIJANUR RAHMAN
DEPARTMENT OF INDUSTRIAL & PRODUCTION ENGINEERING
BANGLADESH UNIVERSITY OF ENGINEERING & TECHNOLOGY
(BUET), DHAKA-1000, BANGLADESH
December, 2013

i
QUALITY IMPROVEMENT IN GARMENT FACTORY THROUGH
TQM APPROACH
A thesis has been submitted in the partial fulfillment of the requirement for the degree
Master of Engineering in Industrial and Production Engineering.
December, 2013
DEPARTMENT OF INDUSTRIAL & PRODUCTION ENGINEERING
BANGLADESH UNIVERSITY OF ENGINEERING & TECHNOLOGY
DHAKA-1000, BANGLADESH

ii
CERTIFICATE OF APPROVAL
The thesis titled “QUALITY IMPROVEMENT IN A GARMENT FACTORY THROUGH
TQM APPROACH” submitted by Md. Mijanur Rahman, Roll No. 1009082012, Session-
October, 2009 has been accepted as satisfactory in partial fulfillment of the requirements for
the degree of Master of Engineering in Industrial and Production Engineering on December
17, 2013.
BOARD OF EXAMINERS
1. Dr. A. K. M. Masud Chairman
Professor (Supervisor)
Department of IPE, BUET, Dhaka
2. Dr. Abdullahil Azeem Member
Professor
Department of IPE, BUET, Dhaka
3. Dr. Nafis Ahmad Member
Professor
Department of IPE, BUET, Dhaka

iii
CANDIDATE’S DECLARATION
It is hereby declared that this thesis or any part of this has not been submitted elsewhere for
the award of any degree or diploma except for publication.
_______________________
Md. Mijanur Rahman

iv
ACKNOWLEDGEMENT
I acknowledge my profound indebtedness and express sincere gratitude to my supervisor Dr.
A. K. M Masud, Professor, Department of Industrial & Production Engineering (IPE), BUET,
Dhaka. He provided proper guidance, supervision and valuable suggestions at all stages to
carry out this research work. I am proud to have him as my supervisor for Master’s thesis.
I would also like to thank Masco Industries Limited for providing necessary support,
information and data for the analysis part of my project.
Finally, I wish to express my heartiest gratitude to my respected teachers at the Department
of Industrial & Production Engineering (IPE), BUET and to all my colleagues, friends and
family members who helped me directly or indirectly in this work.
__________________
Md. Mijanur Rahman

v
ABSTRACT
Total Quality Management (TQM) is one of the important tools to improve quality and
reduce manufacturing cost by reducing rework and scrape. There has a great applicability of
TQM method in RMG sector. Several implementations have proven that the TQM approach
really works in practice and improves of even 90% and more quality level in some situations.
As RMG sector is a large industrial sector in Bangladesh; Quality Improvement can play a
vital role for improving productivity as well as economic development for the country. We
have used the tools of TQM such as Flow chart, Check sheet, Pareto Chart, Cause and effect
diagram in a garment industry of Bangladesh and it is found that a significant amount of
rework and scrape per style, per month has minimized by applying this method. The
implementation has enabled to reduction in rework and cost of poor quality, through proper
utilization of company's internal resources without the need for significant investment.
Key Words: TQM, RMG, Rework, Quality Improvement, Cost of Poor quality

vi
TABLE OF CONTENTS Certificate of Approval ii
Candidate’s Declaration iii
Acknowledgement iv
Abstract v
Table of Contents vi
List of Tables xi
List of Figures xiii
Chapter 1: Introduction 1
1.1 Introduction 1
1.2 Background of the study 2
1.3 Significance of the study 3
1.4 Objectives of the study 4
Chapter 2: Literature Review 5
2.1 Quality 5
2.2 Evolution of Quality 5
2.2.1 Inspection 6
2.2.2 Quality Control 7
2.2.3 Quality Assurance 7
2.2.4 Total Quality Management 7
2.3 Quality Tools 9
vii
2.3.1 Check Sheet 9
2.3.2 Pareto Chart 10
2.3.2.1 Description of Pareto chart 11
2.3.2.2 Application of Pareto chart 12
2.3.2.3 Procedure of preparing a Pareto chart 12
2.3.3 Process Flow Chart 13
2.3.4 Cause-Effect Diagram 14
2.3.4.1 Procedure of constructing a Cause-Effect (CE) diagram 15
2.3.4.2 Types of CE analysis 16
2.3.4.2.1 Cause enumeration 16
2.3.4.2.2 Process analysis 17
2.4 Pillars of TQM Implementation 18
2.5 Management of Quality in Garment Industry 19
2.5.1 Preproduction Quality Assurance 19
2.5.2 Quality Assurance during Production 19
2.5.3 Postproduction Quality Assurance 20
2.6 Quality Improvement 20
2.7 Garment Production Process 21
2.7.1 Pattern Making 21
2.7.2 Pattern Grading 21

viii
2.7.3 Marker Making 21
2.7.4 Garment Cutting 21
2.7.5 Garment Sewing 21
2.7.6 Pressing and Finishing 22
Chapter 3: Research Methodology 23
3.1 Introduction 23
3.2 Research Process Flow Chart 23
3.3 Steps Involved in Research 24
Chapter 4: Finding and Analysis 26
4.1 Findings with TQM pillars 26
4.2 Defect Find out 27
4.3 Check Sheet 27
4.3.1 Defect in Cutting section 30
4.3.2 Defects in Sewing Section 31
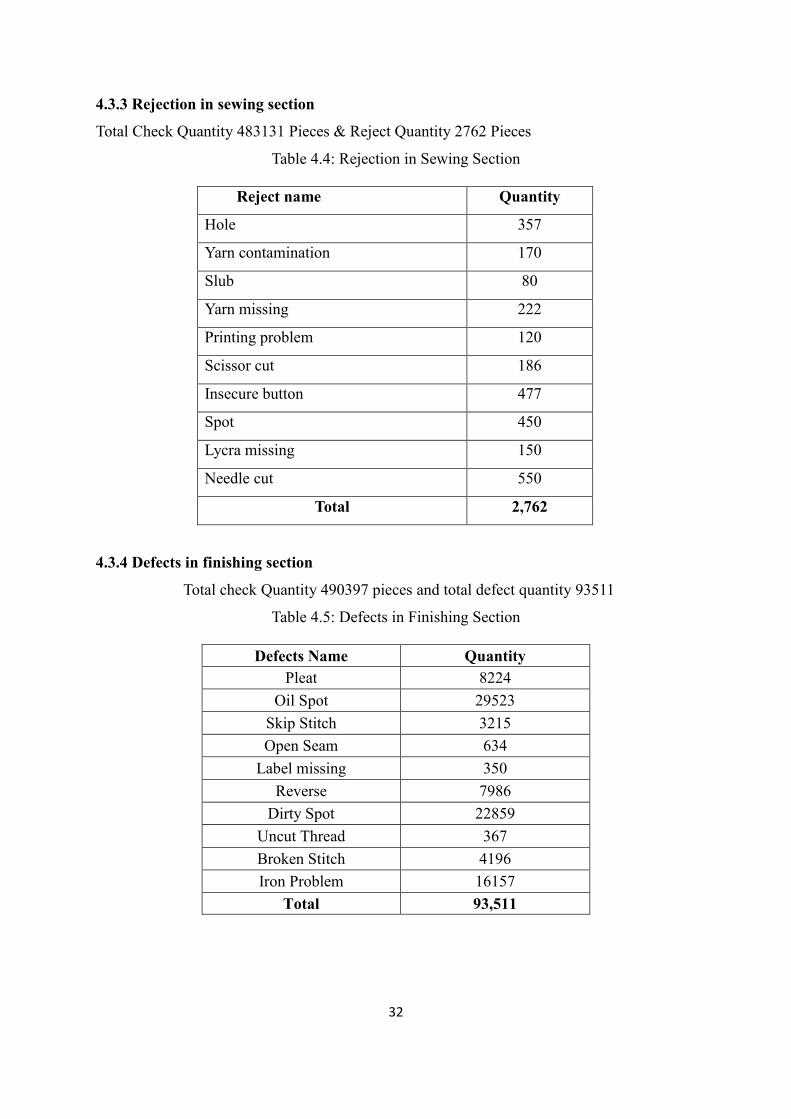
4.3.3 Rejection in sewing section 32
4.3.4 Defects in finishing section 32
4.3.5 Rejection in Finishing 33
4.4 Process Flowchart 33
4.4.1 Process Flowchart in Cutting Section 34
4.4.2 Process Flowchart in Sewing Section 35

ix
4.4.3 Process Flowchart in Finishing Section 35
4.5 Pareto Chart 36
4.5.1 Pareto analysis for Cutting Defects 36
4.5.2 Pareto analysis for Sewing Defects 37
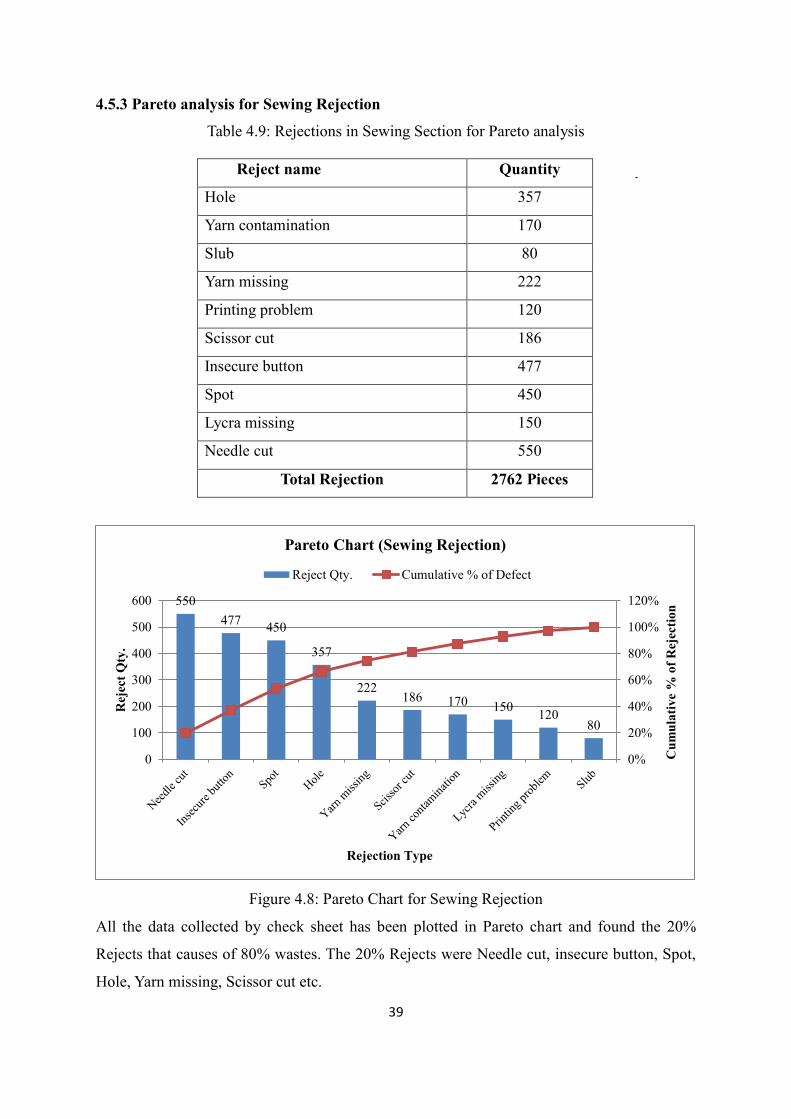
4.5.3 Pareto analysis for Sewing Rejection 39
4.5.4 Pareto analysis for Finishing Defects 40
4.5.5 Pareto analysis for Rejection in finishing section 41
4.6 Cause-Effect Diagram 42
Chapter 5: Implementations 46
5.1 Implementation 46
5.2 Implementation with TQM pillars 47
5.3 Action taken against root cause 52
5.3.1 Countermeasures of Oil/Dirty Spot 53
5.3.2 Countermeasures of Skip Stitch 54
5.3.3 Countermeasures of Uneven Stitch 54
5.3.4 Countermeasures of Raw edge 55
5.3.5 Countermeasures of Pleat 55
5.3.6 Countermeasures for Other defects 56
5.3.7 Countermeasures in Cutting Section 56
5.3.7.1 Spreading of Fabric for relaxation 56
x
5.3.7.2 Cutting of Pilot Run 57
5.3.7.3 Shade Controlling in cutting section 57
5.3.8 Quality Specification Sheet (QSS) 58
5.4 Process Flow modification 58
5.4.1 Modified Process Flow chart of Cutting section 58
5.4.2 Modified Process Flow chart of Sewing Section 59
5.4.3 Modified Process Flow chart of Finishing Section 59
Chapter 6: Result and Discussion 61
6.1 Result 61
6.2 Discussion 62
6.2.1 Sewing Quality Result 62
6.2.2 Finishing Quality Result 64
6.2.3 Efficiency 65
6.2.4 Team Work 66
6.2.5 Reward System 66
6.2.6 TQM Knowledge of workers 66
Chapter 7: Conclusion and Recommendation 67
7.1 Conclusion 67
7.2 Recommendation for the future study 67
References 68

xi
LIST OF TABLES
Table 2.1: An example of check sheet for data collection … 10
Table 2.2: Frequency of defects in finishing section ……. 11
Table 2.3: Pillars of TQM implementation 19
Table 4.1: Current Practices of TQM Pillars 26
Table 4.2: Defects in Cutting Section 30
Table 4.3: Defects in Sewing Section 31
Table 4.4: Rejection in Sewing Section 32
Table 4.5: Defects in Finishing Section 32
Table 4.6: Rejection in Finishing 33
Table 4.7: Defects in Cutting Section for Pareto analysis 36
Table 4.8: Defects in Sewing Section for Pareto analysis 37
Table 4.9: Rejections in Sewing Section for Pareto analysis 39
Table 4.10: Defects in Finishing Section for Pareto analysis 40
Table 4.11: Rejections in Finishing Section for Pareto analysis 41
Table 5.1: Quality Trilogy 50
Table 5.2: Countermeasures of Spot 53
Table 5.3: Countermeasures of Skip Stitch 54
Table 5.4: Countermeasures of Uneven Stitch 54
Table 5.5: Countermeasures of Raw edge 55

xii
Table 5.6: Countermeasures of Pleat 55
Table 6.1: Results in different Matrix 61
Table 6.2: Data of Sewing Section (Before Implementation) 62
Table 6.3: Data of Sewing Section (After Implementation) 63
Table 6.4: Data of Finishing Section (Before Implementation) 64
Table 6.5: Data of Finishing Section (After Implementation) 65

xiii
LIST OF FIGURES
Figure 2.1: Quality Evaluation 6
Figure 2.2: Pareto diagram for defects in finishing section 12
Figure 2.3: A process flow chart 14
Figure 2.4: Cause enumeration 16
Figure 2.5: Process type CE diagram 17
Figure 2.6: Quality and Competitiveness 20
Figure 2.7: Garment Production Process 22
Figure-3.1: Research Process in Flow chart 23
Figure 4.1: Check sheet for Cutting Section 28
Figure 4.2: Check sheet for Sewing Section 29
Figure 4.3: Process Flowchart of Cutting Section 34
Figure 4.4: Process Flowchart of Sewing Section 35
Figure 4.5: Process Flowchart of Finishing Section 35
Figure 4.6: Pareto Chart for cutting Defects 36
Figure 4.7: Pareto Chart for Sewing Defects 38
Figure 4.8: Pareto Chart for Sewing Rejection 39
Figure 4.9: Pareto Chart for Finishing Defects 40
Figure 4.10: Pareto Chart for Finishing Rejection 41
Figure 4.11: Cause-Effect diagram for Spot 42

xiv
Figure 4.12: Cause and Effect diagram of Skip Stitch 42
Figure 4.13: Cause and Effect diagram of Uneven Stitch 43
Figure 4.14: Cause and Effect diagram of Raw edge 43
Figure 4.15: Cause and Effect diagram of Pleat 44
Figure 4.16: Cause and Effect diagram of Twisting 44
Figure 4.17: Cause and Effect diagram of Scissoring 45
Figure 5.1: Garments Inspection Sequence 46
Figure 5.2: Defect Library 47
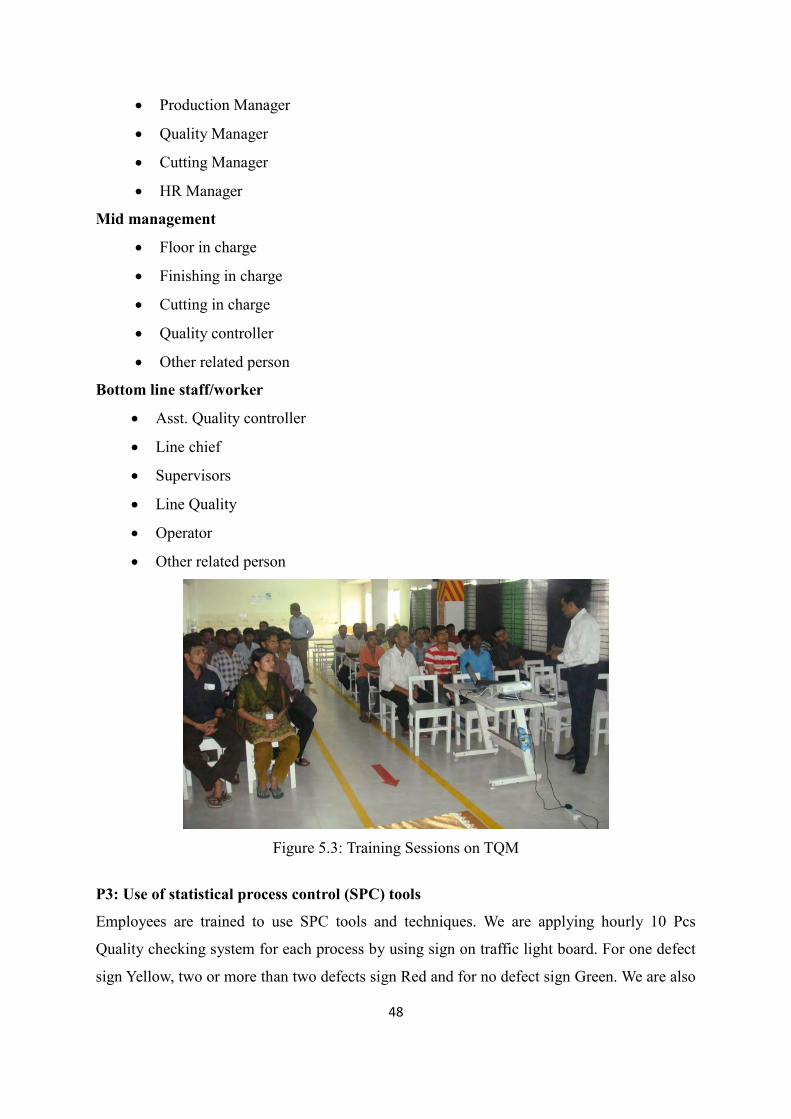
Figure 5.3: Training Sessions on TQM 48
Figure 5.4: Prize giving ceremony for best performance 51
Figure 5.5: Quality Specification Sheet 58
Figure 5.6: Modified Process Flow Chart of Cutting Section 58
Figure 5.7: Modified Process Flow Chart of Sewing Section 59
Figure 5.8: Modified Process Flow Chart of Finishing Section 60

1
Chapter One Introduction 1.1 INTRODUCTION
Quality holds significant importance in the world trade in garments [1]. After phase out of
MFA (multi-fiber agreement) Bangladesh is competing with other countries for the market
share in the world without quotas. Quality as the number one source of competitive
advantage for garments exports. Therefore, a smart garment manufacturer will not
underestimate the significance of quality for his business [1].
Garment manufacturing is a complex industry for many reasons. The product line is a
complex array of styles, seasons, varying life cycles, and multidimensional sizing. Many
apparel firms are upgrading their quality control procedure to be more competitive in the
world market. In general, better-quality garments cost more to produce than budget-quality
products [2].
Total Quality Management (TQM) refers to organization wide effort to achieve quality. It can
accurately be described as a philosophy about quality that suggest for involving everyone in
the organization in a quest for quality. It extends to suppliers as well as to customers. If fact,
in TQM, the customer is the focal point, as the business is driven by customers. As such,
customer’s satisfaction is the main driving force. Everyone in the organization, form the top
most chief executive, up to the bottom most workers, has to take part in this endeavor.
Achieving world class quality is not just another program; it is an ongoing process [3]. Total
Quality Management requires all employees of the organization for improving the products,
processes and services. All employees, no matter what role, are responsible for quality and
quality assurance. When done correctly, the entire business culture is TQM [4]. In practical
business settings, implementation of TQM requires a great deal of change in most
organizations. For these change, some factors or associated activities are involved to
implement TQM in organizations.
There are seven basic Tools of Quality which can be used to analyze and subsequently
intervene to eliminate the problems from the production system. Based on long experience in
quality issues, a renowned quality expert Dr. Kaoru Ishikawa stated, “As much as 95% of
quality related problems can be solved with seven fundamental quality tools” [3].
2
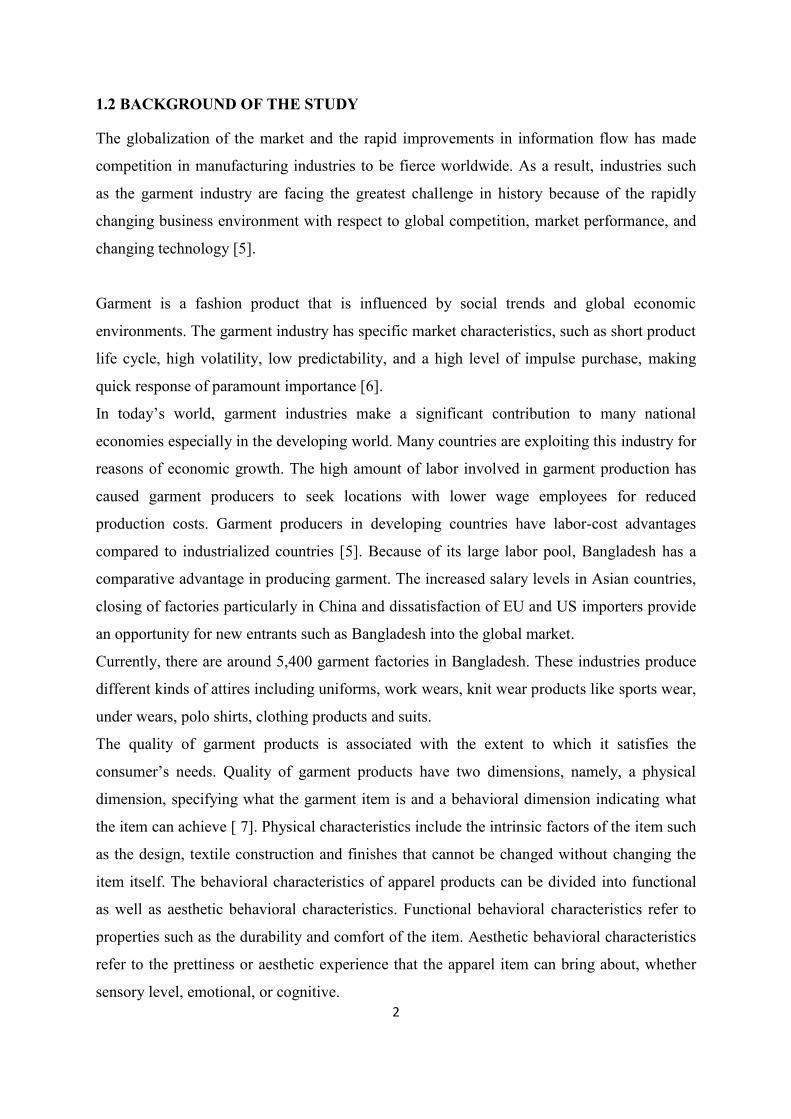
1.2 BACKGROUND OF THE STUDY
The globalization of the market and the rapid improvements in information flow has made
competition in manufacturing industries to be fierce worldwide. As a result, industries such
as the garment industry are facing the greatest challenge in history because of the rapidly
changing business environment with respect to global competition, market performance, and
changing technology [5].
Garment is a fashion product that is influenced by social trends and global economic
environments. The garment industry has specific market characteristics, such as short product
life cycle, high volatility, low predictability, and a high level of impulse purchase, making
quick response of paramount importance [6].
In today’s world, garment industries make a significant contribution to many national
economies especially in the developing world. Many countries are exploiting this industry for
reasons of economic growth. The high amount of labor involved in garment production has
caused garment producers to seek locations with lower wage employees for reduced
production costs. Garment producers in developing countries have labor-cost advantages
compared to industrialized countries [5]. Because of its large labor pool, Bangladesh has a
comparative advantage in producing garment. The increased salary levels in Asian countries,
closing of factories particularly in China and dissatisfaction of EU and US importers provide
an opportunity for new entrants such as Bangladesh into the global market.
Currently, there are around 5,400 garment factories in Bangladesh. These industries produce
different kinds of attires including uniforms, work wears, knit wear products like sports wear,
under wears, polo shirts, clothing products and suits.
The quality of garment products is associated with the extent to which it satisfies the
consumer’s needs. Quality of garment products have two dimensions, namely, a physical
dimension, specifying what the garment item is and a behavioral dimension indicating what
the item can achieve [ 7]. Physical characteristics include the intrinsic factors of the item such
as the design, textile construction and finishes that cannot be changed without changing the
item itself. The behavioral characteristics of apparel products can be divided into functional
as well as aesthetic behavioral characteristics. Functional behavioral characteristics refer to
properties such as the durability and comfort of the item. Aesthetic behavioral characteristics
refer to the prettiness or aesthetic experience that the apparel item can bring about, whether
sensory level, emotional, or cognitive.

3
According to David Garvin, a Harvard expert on quality, there are eight dimensions of
quality: performance, features, reliability, conformance, durability, serviceability, aesthetics
and perceived quality [8]. Another commonly used definitions of quality that originated from
one of the quality pioneers; Juran uses the idea of fitness for use. Fitness for use should be
judged from the customer’s point of view and not from either the manufacturer’s or seller’s
perspective. This concept can be applied for garments as well.
For a garment to be fit for use, provided that the style is acceptable it must be [9]:
Free from defects such as stains, fabric defects, open seams, untrimmed threads,
misaligned buttons and buttonholes and defective zippers
Fit properly for the labeled size
Perform satisfactory in normal use, meaning that a garment must be able to withstand
like normal laundering, dry-cleaning, pressing cycles without color loss or shrinkage.
Seams must not come apart and fabric must not tear
Customer needs are a moving target and it is widely recognized that quality goals must keep
shifting to respond to the changes that keep coming over the horizon [10]. As a result,
continuous improvement of quality is needed in the garment industry since there is
competition pressure.
1.3 SIGNIFICANCE OF THE STUDY
In order for an apparel company to survive in today’s global environment, it must be
responsive to its target market. Defining product quality criteria and establishing effective
controls are among a company’s most important policy decisions. When an apparel company
focuses all its activities to deliver a quality product that satisfies the needs of its target market
by creating a culture or philosophy of management in which all personnel are involved in
identifying and resolving quality problems, it is practicing total quality management [11]
Garments manufacturing industries are playing an important role in the growth of the national
economy. To gain competitive advantage, to sustain the market share and to cope with the
newest competitors it is necessary to deliver quality products in time with reasonable price to
the customer. If the garment factories continuously support with quality product
implementation TQM approach can play a vital role for the improvement. TQM philosophy
helps to achieve quality objective because it focuses on all employee involvement including
management people, operational people, purchasing people and marketing people. The trend

4
of implementing total quality management (TQM) is growing on a worldwide scale. In order
to view quality as a source of competitive advantage a company must build on the belief that
implementing TQM can enable superior quality. 1.4 OBJECTIVES OF THE STUDY There are varieties of problems related to quality and productivity in the garment factories
due to varying degrees of abnormality, inefficiency and lack of proper training of mid-level
management, which ultimately causes the poor quality, defects and rejection of garments.
The implementation of TQM tools for quality-related problems is a key and necessary step in
the operations of manufacturing processes, especially in the mass production like garments
factory. This is predominantly true for the multistage manufacturing processes, which is
defined as a process that produces the products under multiple setups. The quality
information flow of the product in a multistage manufacturing system and the interaction
between the process faults and the product quality characteristics are very complicated. In
multistage process, the identification of process root cause is also not simple. It has been
observed that the implementation of TQM tools in a particular single individual setup has
simplified the problem.
The objective of the study is:
To improve the quality of garments by implementing TQM tools (Check sheet, Pareto
analysis, Process flow chart, Cause-Effect diagram)
The major possible outcomes of this study are:
a) Quality of garments can be improved by solving the problems behind poor quality
using TQM tools (Check sheet, Pareto analysis, Process flow chart, Cause-Effect
diagram)
b) Productivity can be improved by reducing rework

5
Chapter Two Literature Review 2.1 QUALITY
There are hosts of opinions as to how to define quality. Traditionally producers think about
quality as a determinant of producer, more specifically determinant of engineers and
marketing professionals. But the new concept of quality differs here. It defines quality as a
determinant of customer, more specifically level of customer satisfaction determines level of
quality. Broadly speaking, customers want to see a result from the product or service what
they pay for.
Crosby defines quality as, “Quality is conformance to requirements or specification” [12].
Juran defines quality as, “Quality is fitness for use” [12].
Moreover the notion of quality has been defined in different ways by various authors. So
mainly quality is customer satisfaction. For ensuring quality in organization, it is supported
by management of that organization. Management of quality is discussing in the next session.
2.2 EVOLUTION OF QUALITY
The quality movement can trace its roots back to medieval Europe, when craftsmen began
organizing into unions called guilds in the late 13th century [13]. In the early 1950’s, quality
management practices developed rapidly in Japanese plants, and become a major theme in
Japanese management philosophy, such that, by 1960, quality control and management had
become a national preoccupation. By the early 1970’s Japan’s imports into the USA and
Europe increased significantly, due to its cheaper, higher quality products, compared to the
Western counterparts. The quality revolution in the West was slow to follow, and did not
begin until the early 1980’s, when companies introduced their own quality programs and
initiatives to counter the Japanese success [14].
Since the turn of the century quality improvement has matured significantly. New quality
systems have evolved from the foundations of Deming, Juran and the early Japanese
practitioners of quality, and quality has moved beyond manufacturing into service,
distribution, healthcare, education and government sectors. During the last three decades,
simple inspection activities have been replaced or supplemented by quality control, quality

6
assurance and now most companies are working towards Total Quality Management (TQM)
[15]. In this progression, four fairly discrete stages can be identified: inspection, quality
control, quality assurance, and TQM as shown in Figure 2.1.
Figure 2.1: Quality Evaluation [15]
2.2.1 Inspection
At one time inspection was thought to be the only way of ensuring quality. Inspection with
reference to the garment industry can be defined as the examination or review of raw
materials (like fabric, buttons, zippers and sewing threads), in-process components and
completely finished garment in relation to some standard specifications, or requirements. The
inspection activity can be carried out by staff employed specifically for the purpose or by
self-inspection. Products which do not conform to specification may be scrapped, reworked,
modified or passed on concession. In some cases inspection is used to grade the finished
product. The system is an after-the event screening process with no prevention content.
Simple inspection based systems usually do not directly involve suppliers or customers in the
activity.
TQM Policy development, involve supplier and customers, involve all operations, process
management, performance measurement, team work, employee involvement
Quality Assurance Quality system development, advance quality planning, comprahensive quality manuals, use of quality costs, involvement of non conformance operations, failur mode and effect
analysis, SPC
Quality Control Develop quality manual, process performance data, self inspection, product testing,
basic quality planning, use of basic statistics, paper work control
Inspection Salvage, sorting, grading, blending, corrective actions, identify sources of non-
conformance

7
2.2.2 Quality Control
Quality control is concerned with the operational techniques for detecting, recording, and
taking actions to eliminate quality problems. Quality control focuses on finding and
eliminating sources of defects and monitoring the manufacturing process. With quality
control there is some development from the basic inspection activity in terms of the
sophistication of methods, systems, tools and techniques employed. While the main
mechanism for preventing off-specification products and services from being delivered to a
customer is again screening inspection. Quality control measures help increase process
control and to lower incidence of non-conformances. Quality control will not improve quality
but just highlight when products and services do not conform to requirements. An over
emphasis on quality control will result in people relying on their work to be checked and
tends to stop them from taking responsibility for improving the processes for which they are
responsible.
2.2.3 Quality Assurance
Finding and solving a problem after a non-conformance has been created is not an effective
means of eliminating the root cause of a problem. Continuous improvement can only be
achieved by directing organizational efforts towards planning and preventing problems
occurring at source. This concept leads to the third stage of quality management development
which is quality assurance. In short, more emphasis is placed on advanced quality planning,
improving the design of the product, process and services, improving control over the
process, and involving and motivating people.
2.2.4 Total Quality Management
The fourth and highest level of quality management is TQM. TQM is a management
philosophy, a paradigm, a continuous improvement approach to doing business through a
new management model. TQM expands beyond statistical process control to embrace a wider
scope of management activities of how to manage people and organizations by focusing on
the entire process, not just simple measurements. This involves the application of quality
management principles, these are: continuous improvement, customer focus, honesty,
sincerity and care to all aspects of the business, including customers and suppliers. TQM is
composed of three paradigms:

8
Total: Involving the entire organization
Quality: conformance to requirements (meeting customer requirements)
Management: Science and art or manner of planning, controlling, directing and the
like
There are Seven Basic Tools of Quality which can be used to analyze and subsequently
intervene to eliminate the problems from the production system. Despite a lofty title, such as
Statistical Quality Control or Statistical Process Control (SQC/SPC), understanding and using
does not require advanced knowledge of statistics. Rather, the seven basic tools of quality
and formalized body of techniques involve tabulating, depicting, and describing data
sets. Once the system is visible, the describing and identifying appropriate actions to
improve the processes and systems are generally self-evident.
The seven tools are listed below:
1. Check sheet
2. Histogram
3. Pareto analysis
4. Process flow chart
5. Cause-Effect diagram
6. Scatter diagram
7. Control Chart
In this research we will use only four tools out of these seven. These four tools are as below:
1. Check sheet
2. Pareto analysis
3. Process flow chart
4. Cause-Effect diagram
9
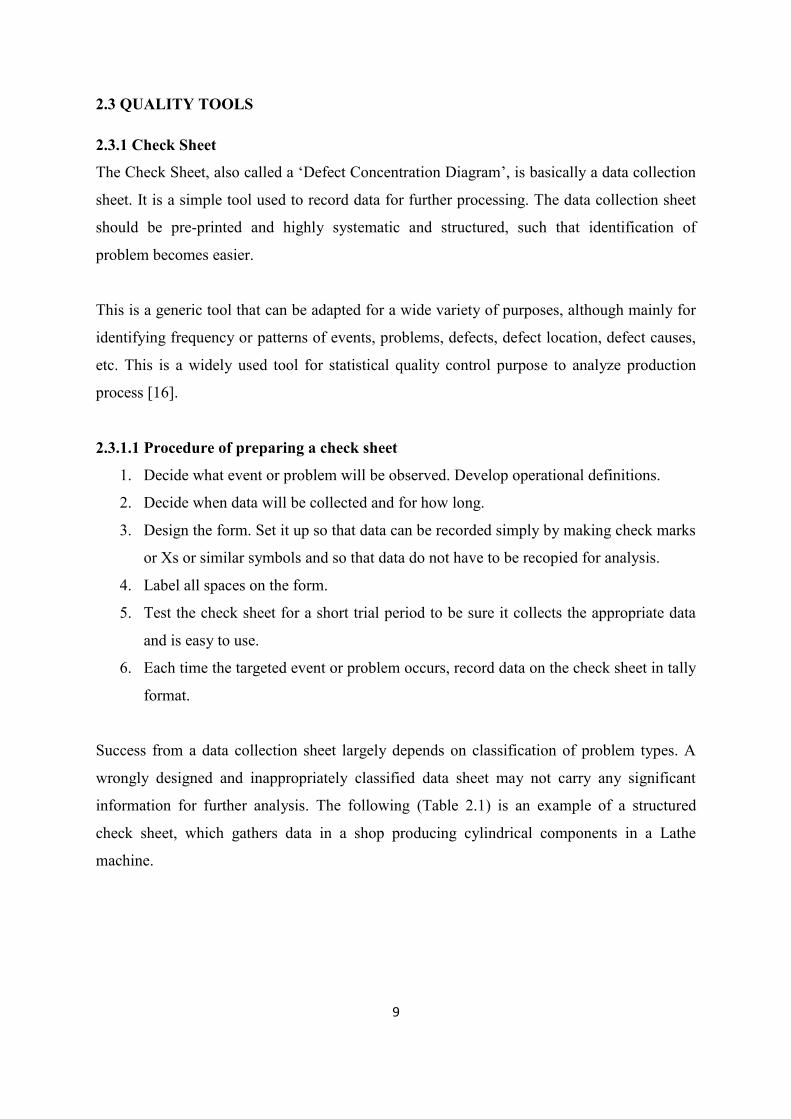
2.3 QUALITY TOOLS
2.3.1 Check Sheet
The Check Sheet, also called a ‘Defect Concentration Diagram’, is basically a data collection
sheet. It is a simple tool used to record data for further processing. The data collection sheet
should be pre-printed and highly systematic and structured, such that identification of
problem becomes easier.
This is a generic tool that can be adapted for a wide variety of purposes, although mainly for
identifying frequency or patterns of events, problems, defects, defect location, defect causes,
etc. This is a widely used tool for statistical quality control purpose to analyze production
process [16].
2.3.1.1 Procedure of preparing a check sheet
1. Decide what event or problem will be observed. Develop operational definitions.
2. Decide when data will be collected and for how long.
3. Design the form. Set it up so that data can be recorded simply by making check marks
or Xs or similar symbols and so that data do not have to be recopied for analysis.
4. Label all spaces on the form.
5. Test the check sheet for a short trial period to be sure it collects the appropriate data
and is easy to use.
6. Each time the targeted event or problem occurs, record data on the check sheet in tally
format.
Success from a data collection sheet largely depends on classification of problem types. A
wrongly designed and inappropriately classified data sheet may not carry any significant
information for further analysis. The following (Table 2.1) is an example of a structured
check sheet, which gathers data in a shop producing cylindrical components in a Lathe
machine.

10
Table 2.1: An example of check sheet for data collection. [16]
Check Sheet
Product Name:
Dept.:
Inspectors Name:
Approved by:
Product ID:
Shift In-Charge:
Lot No.:
Date:
Type of defects Checks Frequency
Wrong Specifications //// //// //// // 17
Cracks //// //// / 11
Surface scars //// // 7
Broken //// 4
Others // 2
Total defects //// //// //// //// //// //// //// //// / 41
Data can be collected randomly, on different days, at different times, in different shops or
work places, of different workers or processes or machines, etc., in order to clearly point out
the exact location or source of and reasons for defects. Thus, it can be an extensive data
collection form, which must be standardized.
Information from this data collection sheet is generally used for further analysis in
Histogram, another important tool of TQM.
2.3.2 Pareto Chart
This is a simple statistical chart, also known as Pareto diagram or Pareto analysis, but very
useful in quality control.
In the early nineteenth century, the famous Italian Economist Vilfredo Pareto observed and
stated that about 80% of the country’s wealth is occupied by about 20% of the population.
This famous observation was later on named as ‘80-20’ rule. Although the observation was
concentrated on only wealth distribution in the society, later on it was found by the
researchers in other fields that this is equally applicable to other knowledge areas too. This is

11
now applied to materials management, more specifically to materials grading, or
classification, which is popularly known as ABC analysis.
This is also applied to quality control, to mean many things, one being: about 20 percent
causes/reasons are responsible for 80% defects in a shop. Although, initially this was
classified as 80-20 distribution, it is not that strict in numerical values. It can well be 15-85
distribution, or something else. It can be generalized as – only a few causes are responsible
for majority of the problems. These ‘few’ (say, 20% causes) are known as ‘vital few’,
whereas the rest ‘many’ (say, 80% causes) are known as ‘Trivial Many’. While vital few
occurs frequently, trivial many occurs infrequently. Thus, one should concentrate on vital
few, not on trivial many [16].
2.3.2.1 Description of Pareto chart
A Pareto chart looks like a cumulative bar graph. The lengths of the bars represent frequency
or cost (time or money), and are arranged with longest bars on the left and the shortest to the
right. The longest bar represents the most vital cause.
This is graphical tool for ranking causes from most significant to least significant. It depicts a
series of vertical bars lined up in a descending order - from high to low - to reflect frequency,
importance, or priority. The following is an example (Table 2.2 and Figure 2.2) of a Pareto
analysis of defects that occurred in products from finishing section in a garment factory.
Table 2.2: Frequency of defects in finishing section.
Defect Name Frequency Percent Oil Spot 29523 31.57%
Dirty Spot 22859 56.02% Iron Problem 16157 73.30%
Pleat 8224 82.09% Reverse 7986 90.63%
Broken Stitch 4196 95.12% Skip Stitch 3215 98.56% Open Seam 634 99.23%
Uncut Thread 367 99.63% Label missing 350 100.00%
Based on this table, a Pareto chart is prepared, as given in Figure 2.2.

12
Figure 2.2: Pareto diagram for defects in finishing section.
2.3.2.2 Application of Pareto chart
When analyzing data about the frequency of problems or causes in a process.
When there are many problems or causes and the quality analyst wants to focus on the
most significant.
When analyzing broad causes by looking at their specific components.
When analyzing the characteristics of the shop, or production process.
2.3.2.3 Procedure of preparing a Pareto chart
1. Decide what categories you will use to group items.
2. Decide what measurement is appropriate. Common measurements are frequency,
quantity, cost and time.
3. Decide what period of time the chart will cover: One work cycle? One full day? A
week?
4. Collect the data, recording the category each time. (Or assemble data that already
exist.)
5. Subtotal the measurements for each category.
29523
22859
16157
8224 7986 4196 3215
634 367 350 0%
20%
40%
60%
80%
100%
120%
0
5000
10000
15000
20000
25000
30000
35000
Defects Name
Cum
ulat
ive
% o
f Def
ect
Def
ect Q
ty.
Pareto Chart (Finishing Defects)
Defect Qty Cumulative % of Defect

13
6. Determine the appropriate scale for the measurements you have collected. The
maximum value will be the largest subtotal from step 5. (If you will do optional steps
8 and 9 below, the maximum value will be the sum of all subtotals from step 5.) Mark
the scale on the left side of the chart.
7. Construct and label bars for each category. Place the tallest at the far left, then the
next tallest to its right and so on. If there are many categories with small
measurements, they can be grouped as “other.”
Steps 8 and 9 are optional but are useful for analysis and communication.
8. Calculate the percentage for each category: the subtotal for that category divided by
the total for all categories. Draw a right vertical axis and label it with percentages. Be
sure the two scales match: For example, the left measurement that corresponds to one-
half should be exactly opposite 50% on the right scale.
9. Calculate and draw cumulative sums: Add the subtotals for the first and second
categories, and place a dot above the second bar indicating that sum. To that sum add
the subtotal for the third category, and place a dot above the third bar for that new
sum. Continue the process for all the bars. Connect the dots, starting at the top of the
first bar. The last dot should reach 100 percent on the right scale.
2.3.3 Process Flow Chart
Process flow chart is a graphical tool that shows the major steps in a process. This is
alternatively known as Run chart, or Route Sheet, Process Map. Flowcharts are a useful tool
for examining how various steps are related to each other. By studying these charts
individuals and teams can often uncover potential sources of trouble and/or identify steps to
be taken to improve or error-proof a process.
Process flow chart focuses on the specific processes that raw materials, parts and sub-
assemblies follow as they move through the plant. This chart is a useful diagnosis tool and
can be used to improve the performances at each step in the operations. Indeed the standard
first step in analyzing any production is to map the flows.
This is equally applicable to service organizations as well. The flow of papers and
information, flow of service may well require a flow chart as an aid to diagnosis.

14
A complete diagnosis of a sub-system certainly requires information on its input side and
output side, because, the sub-system may interact with or may be affected by the preceding
part or operations and requirements/constraints in the succeeding operations. Thus, a
complete view of a process flow helps an analyst to pin point the exact location, or source of
disturbance. The following figure (Figure 2.3) shows a brief schematic view of a process flow
chart.
Figure 2.3: A process flow chart.
The American Production and Inventory Control Society (APICS) have suggested using pre-
defined standard symbols for depicting such process flow chart. However, this is not
mandatory. A company may define its own symbols, or a normal graphical schematic graph,
like in Figure 2.3, may also be used. But in any case, symbols must be standardized in a
company, even though it is their own. Different analyst in a company must not use different
symbols of his/her own.
This tool, though highly useful, has not been suggested by large majority of the quality
experts as the eighth tool of TQM. This is widely prescribed for use as a good analysis tool,
not exactly a TQM tool. Thus, a large cross section of quality related papers do not cover this
topic in their TQM chapter, rather it is most commonly found in the literature of operations
management. However, a small cross section of papers does suggest this as a tool of TQM
[16].
2.3.4 Cause-Effect (CE) Diagram
There are must be many potential reasons, or “Causes”, which ultimately lead to create an
adverse “Effect”. Here, the ‘Effect’ is the quality problem. Cause-Effect (CE) analysis is a
tool for analyzing and illustrating a process by showing the main causes and sub-causes
leading to an effect (symptom). It is sometimes referred to as the "Ishikawa diagram”,
Cutting Sewing Finishing Fabrics/Raw
materials
Complete
Garments

15
because Kaoru Ishikawa developed it, and the "fishbone diagram," because the complete
diagram resembles a fish skeleton. The fishbone is easy to construct and invites interactive
participation.
2.3.4.1 Procedure of constructing a Cause-Effect (CE) diagram
The following materials are needed, for gathering information from a brainstorming session:
a flipchart or whiteboard, marking pens.
The following step-by-step procedure may be followed to construct a CE diagram:
1. Agree on a problem statement (effect). Write it at the center right of the flipchart or
whiteboard. Draw a box around it and draw a horizontal arrow running to it.
2. Brainstorm the major categories of causes of the problem. If this is difficult use
generic headings:
o Methods
o Machines (equipment)
o People (manpower)
o Materials
o Measurement
o Management
o Environment
3. Write the categories of causes as branches from the main arrow. These branches are
known as Twigs.
4. Brainstorm all the possible causes of the problem. Ask: “Why does this happen?” As
each idea is given, the facilitator writes it as a branch from the appropriate category.
Causes can be written in several places if they relate to several categories.
5. Again ask “why does this happen?” about each cause. Write sub-causes branching off
the causes. The sub-branches are known as Twiglets. Continue to ask “Why?” and
generate deeper levels of causes. Layers of branches indicate causal relationships.
6. When the group runs out of ideas, focus attention to places on the chart where ideas
are few.

16
2.3.4.2 Types of Cause-Effect (CE) analysis
There are many different types of CE diagrams, of which the following two are more widely
used:
1. Cause Enumeration
2. Process Analysis
2.3.4.2.1 Cause enumeration
This is the most commonly used CE diagrams in industries. This identifies one-by-one all
possible causes from brainstorming sessions and then classifies into groups. Specialists from
concerned departments, like engineering and design, procurement, quality assurance,
maintenance, production, etc. form the group. Participants in the brainstorming session are
encouraged to think freely and suggest from experience, judgment, anticipation, etc. The
following (Figure 2.4) is an example of a general form of cause enumeration diagram.
Figure 2.4: Cause enumeration.
Effect
(Problem)
Man Machine Material
Method Measurement Environment
Tooling Composition
ratio Composition
uniformity
Setup
Management
Power
Type/grade
Accuracy
Hardness Commitment
Support
System
Rules Skill
Training
Motivation
SOP Appropriatenes
s
Calibration
Accuracy
Update
Vibration Noise
Temperature Humidity
Dust

17
2.3.4.2.2 Process analysis
A simple cause enumeration may not identify exact location of occurrence in the complete
process. A process analysis type CE diagram can do that.
Its structure is totally different from the earlier type of CE analysis. It follows the process
step-by-step and causes are listed as per process step. Thus, prior to developing a CE
diagram, process flow chart is a must. Additionally, participation of the process owners is
also a must in the brainstorming session. The main advantage of creating this type of CE
diagram is its ability in pinpointing the exact location of occurrence.
The following figure (Figure 2.5) shows a process type CE diagram for production of bread
in a bakery shop.
Figure 2.5: Process type CE diagram.
Bread
production
Recipe Packaging
Method Environment
Carton size
Ingredient list
Oven
Expiry Label
Material
Temperature
Pot
Placement
Quality
Amount or
ratio
Source
Mixing Skill
Sequence of
mixing
Pot size
Pot
material
Timing
Location Hygiene
Temperature Humidity
Dust
Flour
dough and
Ingredients
Mixing Cooking
Timing Air flow
Utensils
Method
selection
Storage

18
It is not a question as to which CE diagram should be used; rather the main strategic issue in
quality control is to combine the ideas of both types. Finding out a cause and pinpointing its
location may require use of both CE diagrams at a time [16].
2.4 PILLARS OF TQM IMPLEMENTATION
The definition of TQM may sound simple, but the implementation of it in practice requires an
organizational culture and climate. It takes time and patience to complete the process. The
process does not occur overnight, the results may not see for a long period of time. Some
experts say that it takes up to ten years to fully realize the results of implementing quality
management. There are several steps that must be taken in the process of shifting to quality
management in an organization. Jablonski identified six attributes for successful
implementation of TQM program [17]. Those are: Customer focus, Process focus, Prevention
verses inspection, Employee empowerment and compensation, Fact-based decision making,
Receptiveness to feedback. Another perception about TQM are: Customer Defined Quality;
Top Management Leadership; Primary focus on strategic planning; Employee responsibility
at all levels of the organization; Focus on continuous quality improvement to achieve
strategic goals; Cooperative efforts between Employees and Management; Utilization of
Statistical Process Control (SPC); and Continuous improvement through training and
education of the whole workforce [18]. Ahsan Akhtar Hasin [16] identifies some
distinguishing characteristics about TQM, which are: Continual improvement; Customer
focus; Organization-wide activity; Employee empowerment; Team approach; Competitive
benchmarking; Knowledge of quality control tools; Internal and external customers; and
Long term relationship with suppliers Other perceptions about TQM implementation are:
Provide a QM environment, Modify reward systems, Prepare workers for TQM, Prepare
employees to measure quality, Identify the appropriate starting place, Share information with
everyone, Include quality as an element of design, Make error prevention the norm,
Encourage cooperation and teamwork, Make continuous improvement the goal [19].
From the above literature, it is found that some authors propose six pillars, while the others
propose nine pillars, eleven pillars for a successful implementation of TQM. However,
adopting the scholars’ guidelines in identifying pillars of TQM implementation, we have

19
selected 11 pillars, which are presented in Table-2.3. Note that the order of the pillars placed
in the table does not represent the relative importance of the pillars.
Table-2.3: Pillars of TQM implementation
I. Creation of Quality Management (QM) environment P1
II. Introduction of employees to total quality management (TQM) P2
III. Using of statistical control technique for measuring quality P3
IV. Identification of the appropriate starting place P4
V. Sharing information with everyone for decision taking P5
VI. Encouraging cooperation and teamwork P6
VII. Customer focus as an element of design P7
VIII. Modification of reward systems P8
IX. Selection of right raw materials P9
X. Benchmarking P10
XI. Building continuous improvement the goal P11
2.5 MANAGEMENT OF QUALITY IN GARMENT INDUSTRY
Quality management involves integrated systems checks and balances among a firm’s
suppliers and customers and within the firm’s areas of specialization to assure that finished
products meet quality standards. A combination of visual inspection, measurements,
laboratory tests, and wear tests may be used to evaluate conformance to standards. Goods are
accepted or rejected based on the evaluation. Results are recorded, analyzed, and reported to
management. Sources of defects are identified and steps are taken to reduce variation,
including evaluating materials before production, evaluating products during production, and
evaluating post production results.
2.5.1 Preproduction Quality Assurance:
Preproduction planning for quality assurance requires the cooperation of designers,
merchandisers, production managers, and quality specialists. Decisions are made that
determine aesthetic appeal, performance, and intrinsic quality of garments.
2.5.2 Quality Assurance during Production: Assuring quality during the production
process requires additional strategies. Quality management personnel may evaluate outgoing

20
specification sheets and incoming production samples. Some apparel firms uses quality
inspection system that depends on 100% inspection of finished products.
2.5.3 Postproduction Quality Assurance:
Quality Assurance programs continue while goods are stored at production plants, in
manufacturers’ distribution centers, and in retailers’ distribution centers. Important means of
quality assurance of finished goods include quality audits and analysis of finished goods [2].
2.6 QUALITY IMPROVEMENT
Inspecting every product is costly and inefficient, but the consequences of shipping
nonconforming product can be significant in terms of customer dissatisfaction [20]. As a
result, the underlying aim of quality improvement is to ensure in a cost efficient manner that
the product shipped to customers meets their specifications. Higher product quality is
required for a company to become more competitive, both locally and in international trade
as shown in Figure 2.6. Improved quality increases productivity, hence, many world-class
firms and nations use quality as a powerful competitive tool [21].
Figure 2.6: Quality and Competitiveness [19]
Continuous improvement of quality is needed since there are competition pressures and
customer needs are a moving target. Therefore, quality goals must keep shifting to respond to
the changes that keep coming over the horizon i.e. new technology, new competition, threats,
and opportunities [22]. The TQM tools are the most widely used tools for continuous
improvement for quality.

21
2.7 GARMENT PRODUCTION PROCESS
Garment production process is fragmented and labor-intensive. With low capital and skill
requirements, it is ideally suited to the early stages of industrialization [23].
The production of a final garment consists of the consecutive steps shown in Figure 2.7[24]
2.7.1 Pattern Making: Patternmaking is the process of creating all the correctly sized pieces
needed to make a complete garment. The traditional method of pattern making includes
creation of hard paper patterns. The modern garment making system has adopted the
digitization of pattern making process. Most of Ethiopian garment industries are still using
the traditional method because the cost of computerized systems is prohibitive.
2.7.2 Pattern Grading: Pattern pieces must be increased or decreased geometrically to create
a complete range of sizes. The process of resizing the initial pattern is called grading. The
grade rules are developed keeping in view the market segment for which the product is
intended such as men, women, youth, children, etc.
2.7.3 Marker Making: Fabric is the most important basic material for apparel making and it
accounts for around 50 per cent of the cost of a garment. Thus, material optimization or
maximizing fabric utilization is the fundamental factor for every garment firm. Marking
refers to the process of placing pattern pieces to maximize the number of patterns that can be
cut out of a given piece of fabric. Marker making considers fabric width, length, fabric type
and subsequent cutting method used. Although markers can be made manually or using CAD
software, the computerized method is more efficient.
2.7.4 Garment Cutting: Once the marker is made, pattern pieces must be cut out of the
specified fabric. Apart from using traditional tools, nowadays, computerized cutting systems
are widely used for garment cutting. Pattern specifications are kept into consideration while
cutting which ensure that the constructed garment is exactly similar to the sample produced.
2.7.5 Garment Sewing: This is the main assembly stage of the production process where
fabric is stitched together and a garment is assembled. Computerized sewing machines can be
programmed to sew a specific number of stitches. However, sewing remains largely labor-
intensive.

22
2.7.6 Pressing and Finishing: After the sewing operation, the constructed garments are
examined, pressed, tagged and bagged. Special detailing such as pleats, embroidery and
screen printing to a garment are also added.
Figure 2.7: Garment Production Process [24]
Garment production techniques are divided into make through, assembly line and modular
methods [25]. The method used depends on the product type, quality level, order quantity,
level of technology and skills available.
In make through method a single operator undertakes the whole process. Therefore, little
supervision and organization are required. In addition, this method has a very low throughput
time because only one unit has to be finished at a time to complete the ord The disadvantage
of this system is that operator needs to conduct all the operations required to produce the
finished good and cannot learn any specialization.
Assembly line method is based on extreme division of labor. Its major advantage is that both
workers and machines are specialized, allowing for dramatic increase productivity. In
addition, the individual skills required by operators are greatly reduced. However, this
method of production needs excellent organizational ability so as to avoid idle time. Factors
like variations in individual operator performance, absenteeism machine breakdowns can
easily upset the working schedule. In addition, this makes it harder to handle style variations
and dramatically increases the lead time associated a finished batch of products.
Finishing
Trim Inspect Wash Press Pack
Assemble
Sew Ensure the pieces fit together at the end of sewing process
Pre-Assembly
Pattern making (determine layout of pattern on fabric)
Spread (Lay cloth on the table) Cut Buddle (ensure a pattern pieces
from same ply on fabric)
Production Planning
Order Fabric/Accessories Schedule production process
Garment Design
Creating Pattern

23
Chapter Three Research Methodology 3.1 INTRODUCTION This research has been carried out in a selected garments factory located in Gazipur from July
2011 to November 2011. The main product of this factory is knit based garments like t-shirt,
polo shirt, ladies tops etc. The reasons behind select this factory; the management of this
factory was trying to improve the quality but they did not get the optimum results. Check
Sheet is used in cutting, sewing and finishing section to count the number of defect of the
selected garments factory then analyzed with Pareto analysis to identify the defect groups
which can give the maximum advantages. After getting these defect groups we find out the
root cause by using Cause & Effect diagram. We defined the counter measure against the root
causes. We implemented the countermeasures to improve the quality as well as to reduce the
rework. This chapter presents the methodology of data collection and steps required to
perform the case study with flow diagram.
3.2 RESEARCH PROCESS IN FLOW CHART
We followed the following process to conduct our research.
Figure-3.1: Research Process in Flow chart
Result and Discussion
Implementation
Conduct Training on TQM
Data Processing and Analysis
Data Collection
Finding the Literature
Conducting Primary Observation

24
3.3 STEPS INVOLVED IN THE RESEARCH Step-1: Conducting primary Observation
A primary observation was conducted in different sections such as cutting, sewing, and
finishing section of the production floor of the selected garment industry in order to
understand the overall manufacturing & quality process including materials flow. This study
helps to understand the plants, what method they follows, how it works.
Step-2: Finding literature review
The selected topic was found by searching the internet, some papers related to TQM and
quality improvement garments industry, different books. Based on this materials we prepared
the literature review.
Step 3: Data collection
In this step, we collected data from the selected garment factory by direct observation. To
collect the data from production floor the quality department of factory helps to do this by
using the researcher’s prepared check sheet.
Step 4: Data processing and analysis
Data itself cannot tell the actual fact rather than analyzed, thus it has to be interpreted by the
researchers. Collected data were gathered and arranged in such a way so it has a good
structure and becomes easy to understand. Pareto analysis and cause-effect diagram is used
to analyze the data.
Step 5: Conduct Trainings on TQM
To implement any tools in manufacturing related factory the knowledge on these tools is a
must to get the optimum result. Employees are trained with the tools and techniques that are
needed to upgrade the company's quality. Workers understand the philosophy of quality
management (QM). Everyone in the organization is trained in the use of Quality control and
improvement tools.
25
Step 6: Implementation
The implementation phase is divided in two steps: one is implement the pillars of TQM from
literature review and another is action taken against the root causes analyzed the product
quality by TQM tools.
Step 7: Results & Discussion In this step, results from the overall analysis are given with the help of descriptive and tabular form.
26
Chapter Four Findings and Analysis
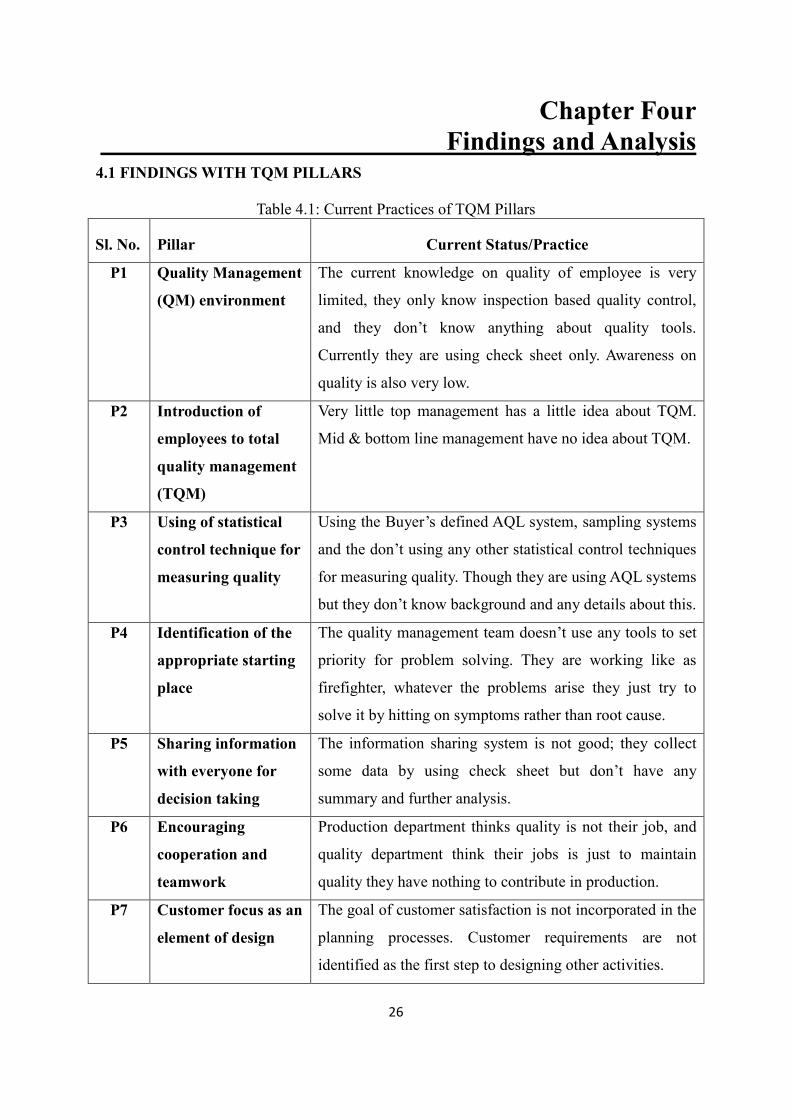
4.1 FINDINGS WITH TQM PILLARS
Table 4.1: Current Practices of TQM Pillars
Sl. No. Pillar Current Status/Practice
P1 Quality Management
(QM) environment
The current knowledge on quality of employee is very
limited, they only know inspection based quality control,
and they don’t know anything about quality tools.
Currently they are using check sheet only. Awareness on
quality is also very low.
P2 Introduction of
employees to total
quality management
(TQM)
Very little top management has a little idea about TQM.
Mid & bottom line management have no idea about TQM.
P3 Using of statistical
control technique for
measuring quality
Using the Buyer’s defined AQL system, sampling systems
and the don’t using any other statistical control techniques
for measuring quality. Though they are using AQL systems
but they don’t know background and any details about this.
P4 Identification of the
appropriate starting
place
The quality management team doesn’t use any tools to set
priority for problem solving. They are working like as
firefighter, whatever the problems arise they just try to
solve it by hitting on symptoms rather than root cause.
P5 Sharing information
with everyone for
decision taking
The information sharing system is not good; they collect
some data by using check sheet but don’t have any
summary and further analysis.
P6 Encouraging
cooperation and
teamwork
Production department thinks quality is not their job, and
quality department think their jobs is just to maintain
quality they have nothing to contribute in production.
P7 Customer focus as an
element of design
The goal of customer satisfaction is not incorporated in the
planning processes. Customer requirements are not
identified as the first step to designing other activities.

27
P8 Reward systems There is no special reward or incentive system based on
performance only traditional pay plans available; based on
seniority, not on quality and performance.
P9 Selection of right
raw materials
Management tries to select right raw material but they
don’t focus to build up long term trust-based relationship
with supplies.
P10 Benchmarking The Benchmarking procedure to measures products,
service, and process against those of industry leaders is not
in practiced.
P11 Building continuous
improvement the
goal
Concept of continues improvement is not in practice even
there is no goal for improvement.
4.2 DEFECT FIND OUT
There are some common defects which occur frequently during manufacturing the garments.
We got some common defects by using check sheet. These defects are as below
Oil spot
Dirty spot
Skip stitch
Point up down
Open seam
Pleat
Puckering
Uneven stitch
Broken stitch
Raw edge
Needle Cut
Needle mark
Join stitch
Insecure stitch
Shading
Reverse
Label missing
Uncut thread
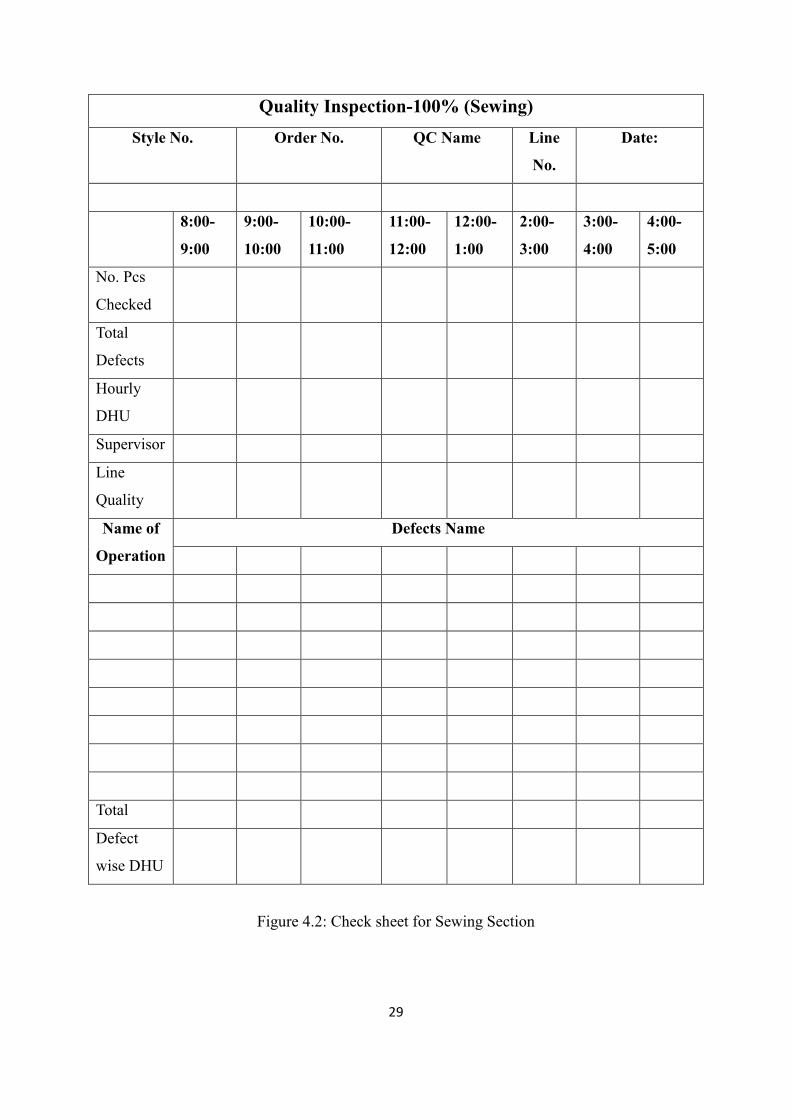
4.3 CHECK SHEET
Check sheet is the basic tool for the analysis of SQC. The management of Quality Control
department in Masco Industries Ltd was using a check sheet; we modified a little to collect
data in more structured way. Some data which is taken on the basis of reject. And some data,
we have taken which is considered for rework. From the above defect list, we found that

28
some defect is happened continuously. From the below check list, we see the defect
frequency and the defect name.
Figure 4.1: Check sheet for Cutting Section
29
Quality Inspection-100% (Sewing)
Style No. Order No. QC Name Line
No.
Date:
8:00-
9:00
9:00-
10:00
10:00-
11:00
11:00-
12:00
12:00-
1:00
2:00-
3:00
3:00-
4:00
4:00-
5:00
No. Pcs
Checked
Total
Defects
Hourly
DHU
Supervisor
Line
Quality
Name of
Operation
Defects Name
Total
Defect
wise DHU
Figure 4.2: Check sheet for Sewing Section
30
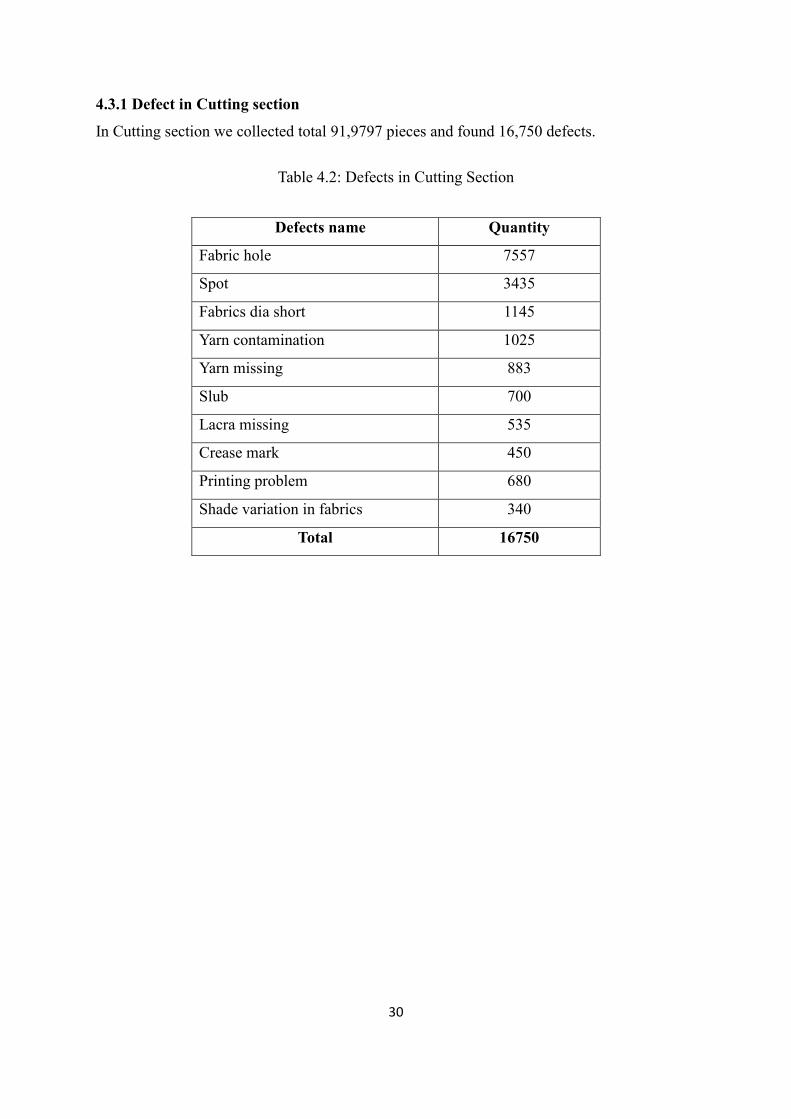
4.3.1 Defect in Cutting section
In Cutting section we collected total 91,9797 pieces and found 16,750 defects.
Table 4.2: Defects in Cutting Section
Defects name Quantity
Fabric hole 7557
Spot 3435
Fabrics dia short 1145
Yarn contamination 1025
Yarn missing 883
Slub 700
Lacra missing 535
Crease mark 450
Printing problem 680
Shade variation in fabrics 340
Total 16750

31
4.3.2 Defects in Sewing Section
Total check Quantity 483,131 Pcs and Total number of defects 34,890
Table 4.3: Defects in Sewing Section
Defect name with code Defect Qty.
Oil Spot (324) 7571
Dirty Spot (305) 5609
Skip stitch (334) 7089
Pleat (326) 3009
Open seam (325) 1826
Point up down (327) 1441
Uncut thread (339) 1413
Uneven stitch (340) 250
Reverse (331) 1246
Broken stitch (301) 67
Tack missing (344) 20
Button attach(301) 495
Tension bad (336) 207
Raw edge (330) 977
Down stitch (307) 106
Dyeing spot (308) 59
Label missing (318) 80
Puckering (329) 58
Others 3359
Total 34,890
32
4.3.3 Rejection in sewing section
Total Check Quantity 483131 Pieces & Reject Quantity 2762 Pieces
Table 4.4: Rejection in Sewing Section
Reject name Quantity
Hole 357
Yarn contamination 170
Slub 80
Yarn missing 222
Printing problem 120
Scissor cut 186
Insecure button 477
Spot 450
Lycra missing 150
Needle cut 550
Total 2,762
4.3.4 Defects in finishing section
Total check Quantity 490397 pieces and total defect quantity 93511
Table 4.5: Defects in Finishing Section
Defects Name Quantity Pleat 8224
Oil Spot 29523 Skip Stitch 3215 Open Seam 634
Label missing 350 Reverse 7986
Dirty Spot 22859 Uncut Thread 367 Broken Stitch 4196 Iron Problem 16157
Total 93,511

33
4.3.5 Rejection in Finishing
Total Check quantity 490,397 pieces & Reject quantity 5,957 pieces
Table 4.6: Rejection in Finishing Section
Rejection Name Quantity Fabric hole 1424 Needle cut 1133
Foreign Yarn 896 Insecure button 680
Scissor cut 545 Wash fell 425
Color shade 410 Print Fault 230
Yarn missing 124 Lycra missing 90
Total 5,957
4.4 PROCESS FLOW CHART
Process flow chart is a graphical tool that shows the major steps in a process. This is
alternatively known as Run chart, or Route Sheet, Process Map. Flowcharts are a useful tool
for examining how various steps are related to each other. By studying these charts
individuals and teams can often uncover potential sources of trouble and/or identify steps to
be taken to improve or error-proof a process.
Process flow chart focuses on the specific processes that raw materials, parts and sub-
assemblies follow as they move through the plant. This chart is a useful diagnosis tool and
can be used to improve the performances at each step in the operations. Indeed the standard
first step in analyzing any production is to map the flows.

34
4.4.1 Process Flowchart in Cutting Section
Figure 4.3: Process Flowchart of Cutting Section
Fabrics Receive from Store
Quality Inspection
Cutting
Fabric Laying
Set up Marker Paper
Numbering at panel
Bundle tight
Final Inspection
Send to sewing section

35
4.4.2 Process Flowchart in Sewing Section
Figure 4.4: Process Flowchart of Sewing Section
4.4.3 Process Flowchart in Finishing Section
Figure 4.5: Process Flowchart of Finishing Section
Dressing/
Measurement
Getup Quality
Carton
Sizewise
arranging (2)
Sucker Bundling Ironing Final QualitySizewise
arranging (1)
Hanger foldingShading
ConfirmLabel check Price Tagging
Separate (Size
& Country)Poly
Input Cut Panel to
sewing line
Sewing
Quality Inspection
Quali
ty
Pass
Send Finishing Section
Not OK
OK
Random Inspection by
Quality inspector
(Irregular)

36
4.5 PARETO CHART
4.5.1 Pareto analysis for Cutting Defects
Table 4.7: Defects in Cutting Section for Pareto analysis
Figure 4.6: Pareto Chart for cutting Defects
All the data collected by check sheet has been plotted in Pareto chart and found the 20%
defects that cause 80% problems. The 20% defects are Fabric hole, Spot, Fabrics dia short,
Yarn contamination, Yarn missing etc.
7557
3435
1145 1025 883 700 680 535 450 340 00.10.20.30.40.50.60.70.80.91
0
2000
4000
6000
8000
10000
12000
14000
16000
Cum
ulat
ive%
of D
efec
t
Def
ect Q
ty
Defect name
Pareto Chart (Cutting Section)
Defects name Quantity
Fabric hole 7557
Spot 3435
Fabrics dia short 1145
Yarn contamination 1025
Yarn missing 883
Slub 700
Lacra missing 535
Crease mark 450
Printing problem 680
Shade variation in fabrics 340
Total Defects 16750

37
4.5.2 Pareto analysis for Sewing Defects
Table 4.8: Defects in Sewing Section for Pareto analysis
Defect name with code Defect Qty.
Oil Spot (324) 7571
Dirty Spot (305) 5609
Skip stitch (334) 7089
Pleat (326) 3009
Open seam (325) 1826
Point up down (327) 1441
Uncut thread (339) 1413
Uneven stitch (340) 250
Reverse (331) 1246
Broken stitch (301) 67
Tack missing (344) 20
Button attach(301) 495
Tension bad (336) 207
Raw edge (330) 977
Down stitch (307) 106
Dyeing spot (308) 59
Label missing (318) 80
Puckering (329) 58
Others 3359
Total Defects 34,890

38
Figure 4.7: Pareto Chart for Sewing Defects
All the data collected by check sheet has been plotted in Pareto chart and found the 20%
defects that causes of 80% problems. The 20% defects are Oil Spot, Skip Stitch, Dirty Spot,
Pleat, Open Seam, Point updown.
7571 7089
5609
3009
1826 1441 1413 1246 977 495 250 207 106 80 67 59 59 27
3359
0102030405060708090100
0
1000
2000
3000
4000
5000
6000
7000
8000
Cum
ulat
ive
perc
enta
ge o
f def
ect
Def
ect Q
'ty
Defect name
Pareto chart (Sewing Defects)
Defect Q'ty Cumulative percentage of defect
39
4.5.3 Pareto analysis for Sewing Rejection
Table 4.9: Rejections in Sewing Section for Pareto analysis
Reject name Quantity
Hole 357
Yarn contamination 170
Slub 80
Yarn missing 222
Printing problem 120
Scissor cut 186
Insecure button 477
Spot 450
Lycra missing 150
Needle cut 550
Total Rejection 2762 Pieces
Figure 4.8: Pareto Chart for Sewing Rejection
All the data collected by check sheet has been plotted in Pareto chart and found the 20%
Rejects that causes of 80% wastes. The 20% Rejects were Needle cut, insecure button, Spot,
Hole, Yarn missing, Scissor cut etc.
550 477 450
357
222 186 170 150 120
80
0%
20%
40%
60%
80%
100%
120%
0
100
200
300
400
500
600
Rejection Type
Cum
ulat
ive
% o
f Rej
ectio
n
Rej
ect Q
ty.
Pareto Chart (Sewing Rejection)
Reject Qty. Cumulative % of Defect

40
4.5.4 Pareto analysis for Finishing Defects
Table 4.10: Defects in Finishing Section for Pareto analysis
Defects Name Quantity Pleat 8224
Oil Spot 29523 Skip Stitch 3215 Open Seam 634
Label missing 350 Reverse 7986
Dirty Spot 22859 Uncut Thread 367 Broken Stitch 4196 Iron Problem 16157 Total Defects 93,511
Figure 4.9: Pareto Chart for Finishing Defects
All the data collected by check sheet has been plotted in Pareto chart and found the 20%
defects that causes of 80% problems. The 20% defects are Oil Spot, Dirty Spot, Iron problem,
Pleat etc.
29523
22859
16157
8224 7986
4196 3215 634 367 350
0%
20%
40%
60%
80%
100%
120%
0
5000
10000
15000
20000
25000
30000
35000
Oil Spot DirtySpot
IronProblem
Pleat Reverse BrokenStitch
SkipStitch
OpenSeam
UncutThread
Labelmissing
Defects Name
Cum
ulat
ive
% o
f Def
ect
Def
ect Q
ty.
Pareto Chart (Finishing Defects)
Defect Qty Cumulative % of Defect

41
4.5.5 Pareto analysis for Rejection in finishing section
Table 4.11: Rejections in Finishing Section for Pareto analysis
Rejection Name Quantity Fabric hole 1424 Needle cut 1133
Foreign Yarn 896 Insecure button 680
Scissor cut 545 Wash fell 425
Color shade 410 Print Fault 230
Yarn missing 124 Lycra missing 90
Total 5,957
Figure 4.10: Pareto Chart for Finishing Rejection
All the data collected by check sheet has been plotted in Pareto chart and found the 20%
Rejects that causes of 80% wastes. The 20% Rejects were Fabric hole, Needle cut, Yarn
contamination, insecure button etc.
1424
1133
896
680 545
425 410
230 124 90
0%
20%
40%
60%
80%
100%
120%
0
200
400
600
800
1000
1200
1400
1600
Fabrichole
Needlecut
ForeignYarn
Insecurebutton
Scissorcut
Washfell
Colorshade
PrintFault
Yarnmissing
Lycramissing
Rejection Type
Cum
ulat
ive
% o
f Rej
ectio
n
Rej
ect Q
ty.
Pareto Chart (Finishing Rejection)
Reject Qty. Cumulative % of Defect

42
4.6 CAUSE-EFFECT DIAGRAM
Figure 4.12: Cause and Effect diagram of Skip Stitch
Figure 4.11: Cause-Effect diagram for Spot

43
Figure 4.13: Cause and Effect diagram of Uneven Stitch
Fig-5: Cause and Effect diagram of Uneven Stitch
Figure 4.14: Cause and Effect diagram of Raw edge

44
Figure 4.15: Cause and Effect diagram of Pleat
Figure 4.16: Cause and Effect diagram of Twisting

45
Figure 4.17: Cause and Effect diagram of Scissoring

46
Chapter Five Implementation
5.1 IMPLEMENTATION
The implementation phase is divided in two steps: one is implement the pillars of TQM from
literature review and another is action taken against the root causes analyzed the product
quality by TQM tools.
5.2 STEP-1: IMPLEMENT THE TQM PILLARS
P1: Creation of Quality Management (QM) environment
We arranged so many trainings on basic knowledge of quality, safety issue, use of safety
devices etc for the employees dividing them into different groups such as Top management,
Mid management and lower management. This training covers all levels of employees from
top management to workers. We have arranged training on Check list or defect concentration
diagram, Process flow chart, Root cause analysis based on Cause & effect Diagram. We have
also prepared seminar on TQM (Total Quality Management) from Top management
(Executive Director) to worker.
Garments Inspection Procedure
Figure 5.1: Garments Inspection Sequence

47
Checking Sequence 1. Left Sleeve Area 2. Neck Area 3. Right Sleeve 4. Side seam & Front Part 5. Bottom Area 6. Back Part 7. Inside Check & Stickering
Figure 5.2: Defect Library
P2: Introduction of Employees with TQM
Employees are trained with the tools and techniques that are needed to upgrade the company's
quality. Workers understand the philosophy of quality management (QM). Everyone in the
organization is trained in the use of Quality control and improvement tools. Regular training
programs on various knowledge tools are required for building not only knowledge base, but
also raise the motivation levels of the employees. Training need identification is thus
necessary. We divided the employees in three categories based on level and arranged the
customized training for them. The level and employees under the particular level is below:
Top Management
Executive Director
General Manager
Industrial Engineering Dept.
48
Production Manager
Quality Manager
Cutting Manager
HR Manager
Mid management
Floor in charge
Finishing in charge
Cutting in charge
Quality controller
Other related person
Bottom line staff/worker
Asst. Quality controller
Line chief
Supervisors
Line Quality
Operator
Other related person
Figure 5.3: Training Sessions on TQM
P3: Use of statistical process control (SPC) tools
Employees are trained to use SPC tools and techniques. We are applying hourly 10 Pcs
Quality checking system for each process by using sign on traffic light board. For one defect
sign Yellow, two or more than two defects sign Red and for no defect sign Green. We are also

49
preparing measurement report by randomly measuring complete garments. Again we also
follow Quality Audit report for sewing, finishing & cutting. Final Quality of garments are
controlled by AQL (Acceptable Quality level) 1.5, 2.5, 4.5 etc.
P4: Identification of starting point As our concern is to improve quality of a garment industry so we start from product quality.
Product quality improvement means reduction of defect and rework to do so we applied
Pareto analysis to define the start point of reducing defect. We have find out 20% causes of
defect for each floor by Pareto analysis. We made a root cause analysis report for 20% defect
& solution procedures for that’s defect. We also applied TQM Concept for reducing Repair,
Rejection etc.
P5: Information sharing in decision taking
We have started the team approach; teams are formed among employees to solve the quality
related problems. Giving workers the responsibility for improvements, and the authority to
make changes to accomplish them, provides strong motivation for employees, and puts
decision making into the hands of those who are closest to the job and have considerable
insight into problems and solutions.
Now employees are involved in the decision-making process. We have made check list,
Needle control report, Measurement report, Quality Audit report, Root cause report, DHU
(Defect per hundred unit), Final inspection report by AQL 1.5, 2.5, 4.5 etc. All reports are
visible to relevant persons who are involved in production from top management to worker.
Some reports are also present in front of each Floor or work station. So easily everybody can
take decision & share knowledge to each other.
P6: Encouraging cooperation and teamwork
The approach of encouraging cooperation and teamwork has started and the blaming culture
has eliminated. This environment creates encourages innovative thoughts and practices of
employees. The combination of a team approach and QM means seeking to improve the
system when problems arise. The use of teams for problem solving, and to achieve consensus,
takes advantage of group dynamics, gets people involved, and promotes a spirit of
cooperation and shared values among employees.
We developed a team with multi skilled people which are interfacing of management and

50
production floor. We have also developed interlink among the team, Pro-active attitude,
working area of team, how job is done in the absence of team member & Causes of failure is
identified by investigating team work. This type of team creates healthy stress and
encourages innovative thoughts and practices of employees. Team work also reduces bottle
neck in production floor. We arranged daily, weekly & monthly meeting on Quality
development purposes.
P7: Customer focus as an element of design
We trained the employees about the customer satisfaction and now it is considered that
customer satisfaction is the focal point of the quality management system. This means that
the goal of customer satisfaction must be incorporated in the planning processes and then
maintained day in and day out. Customer focus is the main focal point and thus customer
satisfaction is the ultimate driving force of business. For higher customer satisfaction,
customer requirements should be identified as the first step to designing other activities.
We are very much conscious about customer requirements and built manufacturing process
along with customer needs. We presented Buyer requirements, their needs on Pre-production
comments by arranging preproduction meeting. W followed the major points of Dr. Juran’s
Quality management ideas, popularly known as ‘Quality Trilogy’:
Table 5.1: Quality Trilogy
Quality Planning
Identify who are the customers
Determine the needs of those customers
Translate those needs into our language.
Develop a product that can respond to those needs.
Optimize the product features so as to meet our needs
and customer needs.
Quality improvement
Develop a process which is able to produce the
product.
Optimize the process
Quality Control
Prove that the process can produce the product under
operating conditions with minimal inspection
Transfer the process to operations

51
P8: Modification of reward systems
We have started the reward system to encourage teamwork and innovation. Traditional pay
plans are often based on seniority, not on quality and performance. We modified traditional
pay plans which focus on team incentives. Incentive is an inducement or a Reward which is
given to a worker for efficiency, effectiveness and hard work. Incentives motivate and
encourage a worker to produce more and better Quality production.
We declared best employer & operator based on their performance & Quality in each month.
We consider their key performance indicator like as Efficiency, Target achievement, DHU
(Defect per hundred unit), Behavior/ Discipline/5S/Attitude. DHU is an important issue for
Quality. We define Green, Yellow & Red if DHU level respectively are <=5, 5 to 7 and above
7. Our best employee were Floor in charge, Supervisor & operator who receive incentives
respectively 2000 Tk, 1500 Tk & 1000 Tk. We also showed their picture on board in front of
Floor.
Figure 5.4: Prize giving ceremony for best performance
P9: Selection of right raw materials
Achievement of product quality needs to collect right raw materials at due time. We always
try to select right raw material and we encouraged to build up long term trust-based
relationship with supplies and engage combined effort to ensure the quality and availability of
raw materials. Suppliers were regarded as partners in the process and long-term relationships
are encouraged. This gave suppliers a vital stake in providing quality goods and services. We
inspired to supplier for providing quality at the source, thereby reduced or eliminated the
need to inspect deliveries from suppliers. We ensured fabrics by inspecting 4 point system &
other trims and accessories by visually inspecting. We always tried to follow Right time,
Right Quantity, Right place & Right Quality.

52
P10: Benchmarking
Designing and implementing an efficient new production or management system and
improving the performance of existing systems require adoption of best practices and
improvement in existing practices. Both adoption of new practices and improvement in
existing system require an efficient and dynamic change management system.
Many dynamic and progressive companies are now using benchmarking to assess their
postures against potential competitors and learn from others for continuous improvements in
business operations and processes.
We started the Benchmarking procedure to measures our products, service, and process
against those of industry leaders. We also compared our internal Quality status of Knitting,
Dyeing, Cutting, and Sewing & Finishing.
P11: Building continuous improvement goal
The quest for Quality and better service to the customer should be a continual, never-ending
journey. Quality has no finish-line, unlike a 100 meter sprint race. Competitors will seek to
provide better service, and customers will come to expect better service. Continuous
improvement is true for even the best of the best companies. For this organization needs to up
to date with upcoming technology, variation in product design and its employee should be
innovative and staying with continuous learning.
We set an improvement goal for every two month to continual improvement of processes and
products. We always tried to continuous improvement by addition of new technology,
variation in product design & staying employee with learning & providing opportunity is
innovative for better.
5.3 STEP-2: ACTION TAKEN AGAINST ROOT CAUSE After defining what problems are appears frequently and causing 80% defect by Pareto
analysis, then we find out the root cause of these problems. We take action against the root
cause to reduce or eliminate the problems. We take the following initiative to solve the
problems.

53
5.3.1 Countermeasures of Oil/Dirty Spot
Table 5.2: Countermeasures of Spot
Causes Action Taken/Countermeasure
Operator/Man Wash hands before starting work and after lunch, arrange
garments parts/complete garments properly, don’t let the garments
fall down at floor or kept in machine parts.
Machine Clean machine properly twice in a day, Sincerity or alertness for
each section has increased by proper training & increase
awareness on spot, oil leakages are of machine maintained
properly.
Method Establish preventive maintenance; improve oil control system of
machines, practicing 5S in work place. Machine cleaned specially
needle teeth, needle bar, pressure fit bar, head cover, back cover,
inside parts of back cover. All screw, gasket edge, oil protector or
rubber bush tightened, neat and clean. We ensured no garments or
garments part keep in floor, idle section, on machine & running
work kept on center table with well arranged. WIP reduced.
Fabrics Informed the fabric mill to take care about spot on fabric, fabric is
carried on ploy bag; which was not before.
Accessories Make sure accessories don’t contain any dust.
Environment Use exhaust fan on sewing floor, keep floor clean and tidy, fan
and celling cleans regularly.

54
5.3.2 Countermeasures of Skip Stitch
Table 5.3: Countermeasures of Skip Stitch
Causes Action Taken/Countermeasure
Machine Repair damage machine parts, Reduce gap between presser foot and the
hole of needle plate
Needle Use needle which design to facilitate loop formation, Adjust the needle
height and testing before bulk sewing, Check needle is properly
mounted on the sewing machines with right eye position.
Operation Seam instruction was followed properly, material handling is improved,
proper threading.
Sewing thread Choice of sewing thread in accordance with the needle size, Select good
quality thread which is free from flaws.
Quality Control Proper inspection system, training to operator, training to quality
inspector.
5.3.3 Countermeasures of Uneven Stitch
Table 5.4: Countermeasures of Uneven Stitch
Causes Action Taken/Countermeasure
Machine Control the speed of machine, use right needle, correct feed control
Operator Improve the skill of operator, accurate handling of operator.
Operation We ensured accurate position of pressure feed, Feed dog, upper thread
tension, revolution speed
Accessories Use good quality sewing thread
Quality Control Provide standard quality specification

55
5.3.4 Countermeasures of Raw edge
Table 5.5: Countermeasures of Raw edge
Causes Action Taken/Countermeasure
Machine Use proper knife at machine, for stripe fabric use auto trimming
machine.
Operator Improve the skill of operator, concentration during operation, use cutter
in case of raw edge, accurate handling of operator.
Method Prepared proper specification for operation, maintain the optimum
allowance at hemming operation.
Measurement Ensure the measurement from cutting section, the right measurement
folder is used.
Quality Control Proper inspection system, training to operator, training to quality
inspector.
5.3.5 Countermeasures of Pleat
Table 5.6: Countermeasures of Pleat
Causes Action Taken/Countermeasure
Machine Use right presser feed to pass the upper and lower part of fabrics
uniformly
Operator Correct the material handling system of operator; observe the
pressure feed to ensure there is no dust or foreign material etc.
Working with appropriate speed, followed cutting mark & ensured
accurate handling of operator to reduce operator.
Method Prepared proper specification for operation, maintain the right
machine speed
Measurement Ensure the measurement from cutting section

56
5.3.6 Countermeasures for Other defects
Uncut Thread:
Provide thread cutter to every operator and make used to; to cut thread properly, start
regularly checking system to check the auto trimming machine is properly functioning or not,
improve quality inspection system.
Open seam:
It means stitch gap or missing during joining. Taken corrective action of two parts matching,
no missing of lower part during joining, checking during working & followed mark during
working.
Open seam:
It means stitch gap or missing during joining. Taken corrective action of two parts matching,
no missing of lower part during joining, checking during working & followed mark during
working.
Puckering/ Sharing/ Loose:
It means fabrics loose, shrinkage, gathering or uneven at joining process. Providing proper
training on operator, control the speed of work, revolution speed, accurate matching of two
parts, following cut mark & avoid pulling tendency of body, middle part for sleeve joining.
Tension Bad:
It means stitch loose or not form in accurate shape. Ensure good quality of thread, smooth
way of thread moving, accurate placement of thread and same flow of thread in each tension
bar.
5.3.7 Countermeasures in Cutting Section 5.3.7.1 Spreading of Fabric for relaxation The fabric received in the roll form should be relaxed for at least 12 hours under standard
conditions before spreading. This is done in order to take out any tension in the fabric
imparted during finishing or winding so as to avoid any distortion while spreading or cutting.
The procedure is below-

57
1. Unroll the fabric from rolls & lay on table/flat area in concentric folds
2. Allow for free relaxation without any obstruction
3. Record the time of unrolling and ready time laying of each roll
5.3.7.2 Cutting of Pilot Run
Objective: Carried out in order to make the necessary amendments in patterns/laying
procedure/cutting procedure /cutting allowance/ marker changes/panel inspection/numbering
area/bundling size.
1. Cutting incharge, production manager & IE shall plan for the pilot & bulk cutting.
2. Pilot run cutting shall be done as per the colour/size/quantity advised by FM/PM/IE.-
the selection of the rolls should cover all the shades and shrinkage groups
3. Make a report of observations, comments, suggestions, amendments, simplification,
risk analysis, corrective action plan based on the above analysis.
4. Obtain feedback from the sewing & buying QA and then act upon the necessary
corrective action.
5.3.7.3 Shade Controlling in cutting section
Controlling Rejects:
Control of rejects or defectives is an important element of ensuring quality of goods. A full
consignment of goods may be rejected at the last moment due to improper handling of
defectives. Some people do not understand the consequence of mingling of rejects with the
quality goods. Careless handling of rejects cannot prevent some of the defective goods
mixing up with the first Quality garments & thus end up with stock lots huge loss to the
company in term of money, reputation, repeat order etc. We implement the below procedures
of reject control-
Kept rejects in some easily identifiable fixed baskets. Wrote it “Rejects” on the
basket.
Keep rejects under a responsible person Quality Manager & Quality controller until
the shipment.
Sorted of reject Garments on the basis of problem.
We made awareness on reject body to the operator, Line chief, Floor in charge,
Quality people by arranging daily meeting, training & sharing information from

58
each section to another section i.e Knitting, Dyeing, Cutting, Printing, Sewing ,
Finishing etc.
5.3.8 Quality Specification Sheet (QSS)
We introduced the quality specification sheet (QSS) for the critical operations so that all
related person can understand the quality requirements. The specification sheet is displayed in
front of operator. When production starts for a new style; operator is trained on the quality
requirements. During checking by inspector, he also knows the requirements from the QSS. It
helps to ensure the quality at the sources.
Figure 5.5: Quality Specification Sheet
5.4 PROCESS FLOW MODIFICATION
5.4.1 Modified Process Flow chart of Cutting section
Figure 5.6: Modified Process Flow Chart of Cutting Section
Fabrics
receive
from store
Fabric
Inspection
Fabric
Laying
Setup
Marker
Paper
Cutting
Send to
Sewing
Section
Final
Inspection
Bundle
Tight
Numberin
g at Panel
Quality
Inspection
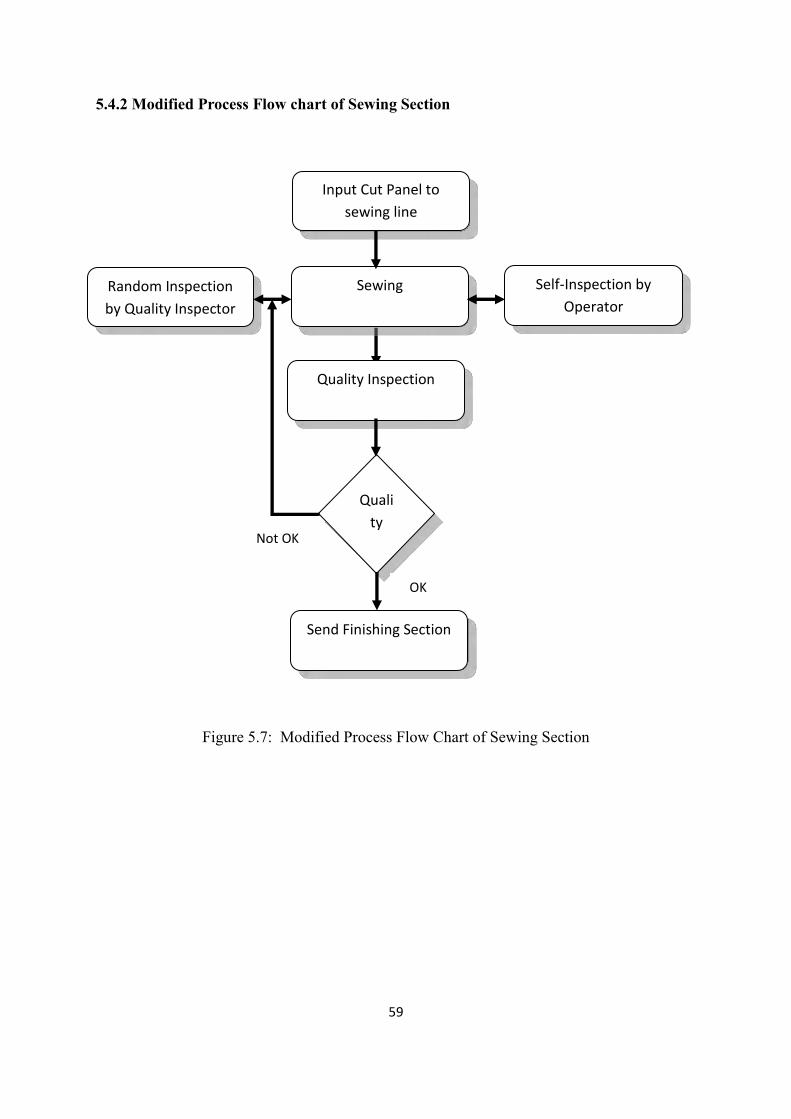
59
5.4.2 Modified Process Flow chart of Sewing Section
Figure 5.7: Modified Process Flow Chart of Sewing Section
Input Cut Panel to
sewing line
Sewing
Quality Inspection
Quali
ty
Pass
Send Finishing Section
Not OK
OK
Self-Inspection by
Operator
Random Inspection
by Quality Inspector

60
5.4.3 Modified Process Flow chart of Finishing Section
Figure 5.8: Modified Process Flow Chart of Finishing Section
Carton Poly
Dressing/
Measurement
Hanger
foldingLabel check Price Tagging Getup Quality
Sucker Bundling Ironing Final QualitySizewise
arranging

61
Chapter Six Result and Discussion
6.1 RESULT
After applying TQM tools, especially Pareto Chart, Cause & Effect analysis and taking
actions against causes of poor quality we get a very good result. The team working approach
also helps a lot to solve the problem.
Table 6.1: Results in different Matrix
Sl. No. Matrix Before Implementation
After Implementation
Improvement
1 Defects per Hundred
Unit (DHU) (Sewing
Section)
7.22 5.17 28.33%
2 Reject/Scrap %
(Sewing Section)
0.57 0.42 26.32%
3 Defects per Hundred
Unit (DHU)
(Finishing Section)
19.07 8.92 53.22%
4 Reject/Scrap %
(Finishing Section)
1.21 0.80 34%
5 Efficiency % 44.2 57.5 30%
6 Team Work Not Strong Stronger than
previous
Improved
7 Reward System No Yes Improved
8 TQM Knowledge of
workers
No Yes Improved

62
6.2 DISCUSSION
6.2.1 Sewing Quality Result
Table 6.2: Data of Sewing Section (Before Implementation)
Date Total
Checked Total
Defects Rejection Quantity
DHU Rejection %
2-Jul-11 14027 1106 106 7.88 0.76%
3-Jul-11 16643 1017 119 6.11 0.72%
4-Jul-11 17122 1169 98 6.83 0.57%
5-Jul-11 15885 1236 105 7.78 0.66%
6-Jul-11 17865 1332 127 7.46 0.71%
7-Jul-11 19073 1325 113 6.95 0.59%
9-Jul-11 17622 1306 128 7.41 0.73%
10-Jul-11 15570 1147 96 7.37 0.62%
11-Jul-11 17996 1322 103 7.35 0.57%
12-Jul-11 15577 1294 89 8.31 0.57%
13-Jul-11 17807 1447 104 8.13 0.58%
14-Jul-11 18810 1987 99 10.56 0.53%
16-Jul-11 20377 1790 103 8.78 0.51%
17-Jul-11 17562 1477 92 8.41 0.52%
19-Jul-11 20418 1404 98 6.88 0.48%
20-Jul-11 22129 1330 105 6.01 0.47%
21-Jul-11 23507 1652 132 7.03 0.56%
23-Jul-11 26531 1779 122 6.71 0.46%
24-Jul-11 21909 1549 119 7.07 0.54%
25-Jul-11 22711 1453 115 6.40 0.51%
26-Jul-11 19418 1340 114 6.90 0.59%
27-Jul-11 21185 1240 128 5.85 0.60%
28-Jul-11 21970 1397 126 6.36 0.57%
30-Jul-11 20993 1420 108 6.76 0.51%
31-Jul-11 20424 1371 113 6.71 0.55%
Total 483,131 34,890 2,762 7.22 0.57%
Defects per Hundred Units (Sewing)
Total Check Quantity 483131 Pieces and Total defects quantity 34890 [Table 6.2]
DHU= (Number of Defect/Checked Quantity) X 100
DHU= (34890/483131) X 100
= 7.22

63
Reject/Scrap % (Sewing Section)
Total Check Quantity 483131 Pieces & Reject Quantity 2762 Pieces [Table 6.2]
Reject % = (Number of Reject Quantity / Number of Check Quantity) X 100
Reject % = (2762/483131) X 100
Reject% = 0.57%
Table 6.3: Data of Sewing Section (After Implementation)
Date Total
Checked Total
Defects Rejection Quantity
DHU Rejection %
1-Nov-11 16449 811 56 4.93 0.34%
2-Nov-11 17859 928 64 5.20 0.36%
3-Nov-11 15895 820 49 5.16 0.31%
12-Nov-11 10257 707 41 6.89 0.40%
13-Nov-11 14780 959 62 6.49 0.42%
14-Nov-11 14783 956 64 6.47 0.43%
15-Nov-11 17477 957 77 5.48 0.44%
16-Nov-11 17218 1015 80 5.89 0.46%
17-Nov-11 16059 786 58 4.89 0.36%
19-Nov-11 13562 885 52 6.53 0.38%
20-Nov-11 13289 1019 50 7.67 0.38%
21-Nov-11 15843 1159 49 7.32 0.31%
22-Nov-11 19130 1217 99 6.36 0.52%
23-Nov-11 22930 1035 126 4.51 0.55%
24-Nov-11 25354 1035 135 4.08 0.53%
26-Nov-11 27311 968 131 3.54 0.48%
27-Nov-11 27579 961 127 3.48 0.46%
30-Nov-11 28456 1077 92 3.78 0.32%
Total 334,231 17,295 1,412 5.17 0.42%
All machining process of garment manufacturing in sewing section and to get quality product
sewing can play the vital role. In table 6.2 & table 6.3 we can see the data from sewing
section before and after the project. As our objective of this study was to improve the quality,
from the above two tables we can say our objective has fulfilled. DHU went down from 7.22
to 5.17 and the improvement is 28.33%. And rejection went down from 0.57 % to 0.42% and
the improvement is 26.32%. Which is a good improvement in the short span of time, as TQM
is an ongoing process so the further improvement will come over the time.
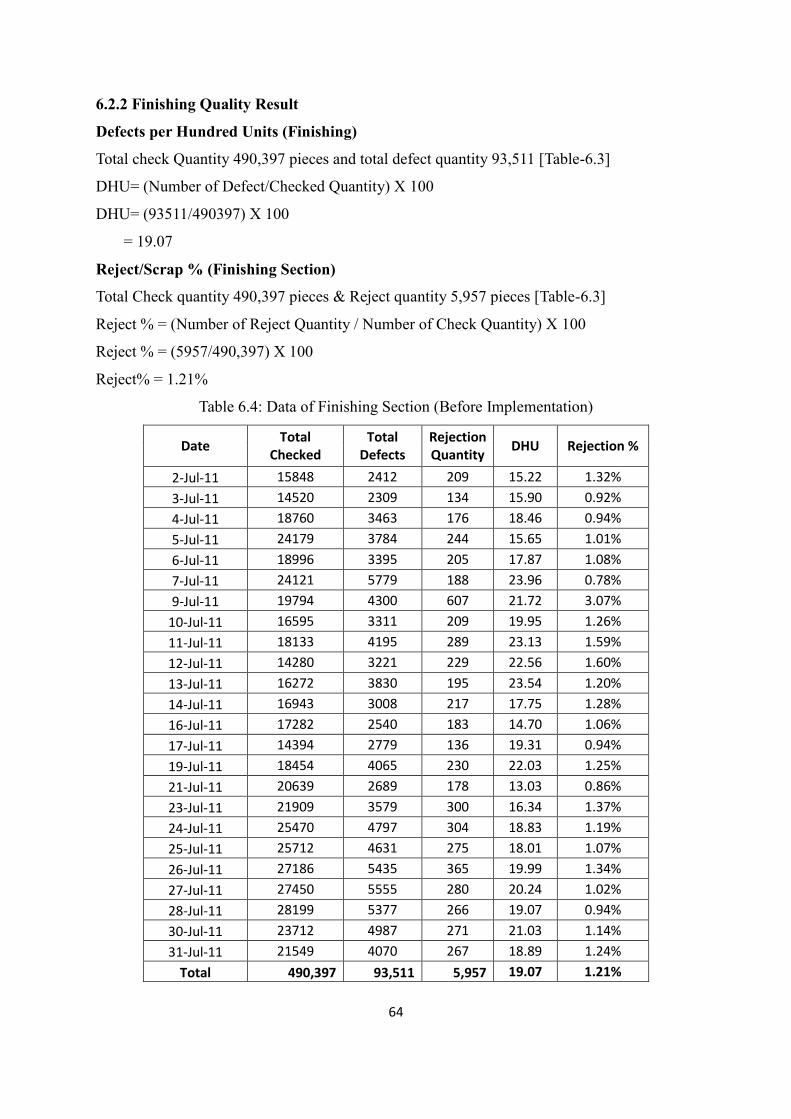
64
6.2.2 Finishing Quality Result
Defects per Hundred Units (Finishing)
Total check Quantity 490,397 pieces and total defect quantity 93,511 [Table-6.3]
DHU= (Number of Defect/Checked Quantity) X 100
DHU= (93511/490397) X 100
= 19.07
Reject/Scrap % (Finishing Section)
Total Check quantity 490,397 pieces & Reject quantity 5,957 pieces [Table-6.3]
Reject % = (Number of Reject Quantity / Number of Check Quantity) X 100
Reject % = (5957/490,397) X 100
Reject% = 1.21%
Table 6.4: Data of Finishing Section (Before Implementation)
Date Total
Checked Total
Defects Rejection Quantity
DHU Rejection %
2-Jul-11 15848 2412 209 15.22 1.32%
3-Jul-11 14520 2309 134 15.90 0.92%
4-Jul-11 18760 3463 176 18.46 0.94%
5-Jul-11 24179 3784 244 15.65 1.01%
6-Jul-11 18996 3395 205 17.87 1.08%
7-Jul-11 24121 5779 188 23.96 0.78%
9-Jul-11 19794 4300 607 21.72 3.07%
10-Jul-11 16595 3311 209 19.95 1.26%
11-Jul-11 18133 4195 289 23.13 1.59%
12-Jul-11 14280 3221 229 22.56 1.60%
13-Jul-11 16272 3830 195 23.54 1.20%
14-Jul-11 16943 3008 217 17.75 1.28%
16-Jul-11 17282 2540 183 14.70 1.06%
17-Jul-11 14394 2779 136 19.31 0.94%
19-Jul-11 18454 4065 230 22.03 1.25%
21-Jul-11 20639 2689 178 13.03 0.86%
23-Jul-11 21909 3579 300 16.34 1.37%
24-Jul-11 25470 4797 304 18.83 1.19%
25-Jul-11 25712 4631 275 18.01 1.07%
26-Jul-11 27186 5435 365 19.99 1.34%
27-Jul-11 27450 5555 280 20.24 1.02%
28-Jul-11 28199 5377 266 19.07 0.94%
30-Jul-11 23712 4987 271 21.03 1.14%
31-Jul-11 21549 4070 267 18.89 1.24%
Total 490,397 93,511 5,957 19.07 1.21%

65
Table 6.5: Data of Finishing Section (After Implementation)
Date Total
Checked Total
Defects Rejection Quantity
DHU Rejection %
1-Nov-11 19481 1657 147 8.51 0.75%
2-Nov-11 2020 320 99 15.84 4.90%
3-Nov-11 7840 834 46 10.64 0.59%
12-Nov-11 6260 766 41 12.24 0.65%
13-Nov-11 6260 716 122 11.44 1.95%
14-Nov-11 18693 2121 166 11.35 0.89%
15-Nov-11 17932 1670 137 9.31 0.76%
16-Nov-11 21983 1728 169 7.86 0.77%
17-Nov-11 17910 1609 149 8.98 0.83%
19-Nov-11 20321 1906 162 9.38 0.80%
20-Nov-11 21235 1299 185 6.12 0.87%
21-Nov-11 24757 1944 184 7.85 0.74%
22-Nov-11 26769 2475 167 9.25 0.62%
23-Nov-11 29612 2490 206 8.41 0.70%
24-Nov-11 19466 1783 154 9.16 0.79%
26-Nov-11 23976 2256 187 9.41 0.78%
27-Nov-11 27117 2134 208 7.87 0.77%
30-Nov-11 23481 2185 158 9.31 0.67%
Total 335,113 29,893 2,687 8.92 0.80%
In finishing section there is no machining process, in this section garment is pressed by iron
and there may create few defects during pressing but most of the defects are visualized in this
section which was occurred in sewing section. In table 6.4 & table 6.5 we can see the data
from finishing section before and after the project. DHU went down from 19.07 to 8.92 and
the improvement is 53.22%. And rejection went down from 1.21% to 0.80% and the
improvement is 34%. Which is a good improvement in the short span of time, as TQM is an
ongoing process so the further improvement will come over the time.
6.2.3 Efficiency
Efficiency % = {(Production Pieces X SMV)/(Total Manpower X Working Hour X60)}X 100
In table 6.1, we can see the efficiency has improved from 44.2% to 57.5% and the
improvement is 30%. Under this study we don’t calculate the efficiency. As quality has a
direct impact on efficiency, we take this data from Industrial Engineering department. One of
possible outcome of this study was efficiency improvement by reducing rework.

66
6.2.4 Team Work Among three main department-production, quality & merchandising was working almost
independently before the implementation of this project. Especially the production and
quality department was fighting each other and there was blaming culture for mistake in
responsibilities. But after introduced with TQM they work as team, quality problem solving is
the only quality departments job only. Production and quality department solves problem
together.
6.2.5 Reward System Reward system has started to encourage teamwork and innovation. Incentive is an
inducement or a Reward which is given to a worker for efficiency, effectiveness and hard
work. Incentives motivate and encourage a worker to produce more and better Quality
production.
6.2.6 TQM Knowledge of workers Workers introduced with the basic knowledge of quality and quality tools. They understand
the philosophy of quality management (QM). Everyone in the organization is trained in the
use of Quality control and improvement tools.
67
Chapter Seven Conclusion and Recommendation
7.1 CONCLUSION
This study has extracted an overall scenario of the cutting, sewing and finishing section of the
selected garments factory in the context of improving quality. By analyzing the product
quality with help of TQM tools it has been found that the quality level is not up the mark and
there is lot of scope of improvement the quality which is the most significant area for overall
improvement. The study found that there are some common and repetitive defects which
happen almost every day during production. These repetitive defects gave an opportunity to
implement cause & effect analysis. To separate the vital few from trivial many we used the
Pareto chart and found oil spot, dirty spot, skip stitch, pleat etc are the vital few defects. It is
found that by implementing tools and the pillars of TQM a garment factory can improve
quality, efficiency, satisfied the employee by providing a good approach in creation of QM
environment, introduction of employees to TQM, encouraging cooperation and teamwork.
Analyzing the product quality and process by using the TQM tools can give a remarkable
improvement by reducing defect and rework. After applying the TQM approach and taking
actions against root causes we achieved up to 53% improvement in DHU and also in some
other matrix we achieved very good result.
7.2 RECOMMENDATION FOR FUTURE STUDY
Based on the current research work, further study can be done on the garments industry in
different dimensions. Some of them are presented below:
TQM tools can also be implemented in knitting, dying, printing section.
Other TQM tools which are not used in this study (Histogram, Scattered Diagram and
Control Chart) can be implemented to improved quality and customer satisfaction.
This research work is done in a knit composite industry, so further study can be done
in woven and other types of apparel industries.
Proper implementation of TQM in pre-production area like in development stage can
helps a lot in the improvement of product quality in final production.
Other Philosophies and Tools of TQM; for example- Kaizen, PDCA cycle, QFD,
Quality Circle can be implement.

68
References
[1] Metha, Pradip V. and Bhardwaj, Satish K., (1998), Managing Quality in the Apparel Industry; New Age International (P) Ltd., New Delhi, India.
[2] Glock, Ruth E. and Kunz, Grace I., (2005), Apparel Manufacturing: Sewn Product Analysis; Pearson Education Inc., USA.
[3] Hasin, Ahsan Akhtar, (2007), Quality Control and Management; Bangladesh Business Solutions, Dhaka, Bangladesh.
[4] Anonymous, what is the definition of TQM, web: http://www.quality-assurance-solutions.com/definition-of-TQM.html; 02 Jan, 2010. [5] Shu-Hwa Lin, 1994, Productivity and Production in the Apparel Industry, International Journal of Clothing Science and Technology, Vol. 6 No. 1, pp. 20-27 [6] Y.Y. Huang and Bertram Tan, 2007, Applications of quality function deployment to apparel design in Taiwan, Journal of Fashion Marketing and Management, Vol. 11 No. 2, pp. 215-237 [7] Klerk, Helena M.De and Lubbe Stephna, 2008, Female consumers’ evaluation of apparel quality: exploring the importance of aesthetics, Journal of Fashion Marketing and Management, Vol. 12 No. 1, pp. 36-50 [8] G. Raj Kumar and V. Krishnaveni, 2009, Coimbatore, Apparel Quality Inspection, Kumaraguru College of Technology [9] ] Metha, Pradip V. and Bhardwaj, Satish K., 1992, New Delhi, Managing Quality in the Apparel Industry, National Institute of Fashion Technology [10] Joseph M. Juran and A.Blanton Godfrey, 1999, USA, Juran’s Quality Handbook, MCGraw-Hill [11] Rosenau, Jeremy A., Wilson, David L.,(2001), Apparel Merchandising; Fairchild Publications, Inc, USA [12] Kolarik, J. William, (1995), Creating Quality- Concepts, Systems, Strategies, and Tools, International Editions, McGraw-Hill, [13] http://www.asq.org, The History of Quality – Overview [14] http://www.dti.gov,uk/quality/evolution, The Evolution of quality, Department of Trade and Industry

69
[15] A van der Wiele, 1997, ISO 9000 series registration to total quality management: the transformation journey, International Journal of Quality Science, Vol. 2 No. 4, pp. 236-252 [16] Hasin, Ahsan Akhtar, (2007), Quality Control and Management; Bangladesh Business Solutions, Dhaka, Bangladesh.
[17] Jablonski, MAKING TQM WORK; web: http://www.referenceforbusiness.com/encyclopedia/Thir-Val/Total-Quality Management-TQM.html, 03 Jan, 2010. [18] Greg Bounds, Lyle Yorks, Mel Adams and Gipsie Ranney (1994), Beyond Total Quality
Management- toward the emerging paradigm, International Editions, Tata McGraw Hill. [19] Md.Fauzi Bin Ahmad, Sha’ri Mohd Yusof, Noordin Mohd Yusof; Comparative study of quality practices between Japanese and non-Japanese based electrical and electronics companies in Malaysia: a survey; Web: http://www.penerbit.utm.my/onlinejournal/47/inpress/JTA200709_shari.doc, on 18 May 2010. [20] Joseph M. Juran and A.Blanton Godfrey, 1999, USA, Juran’s Quality Handbook, MCGraw-Hill [21] Adedeji B.Bandiru and Babatunde J.Ayeni, 1993, London, Practitioner’s Guide to Quality and Process Improvement, Chapman & Hall [22] Daniel Kitaw and Fasika Bete, 2003, Addis Ababa, Quality Management: Efforts and problems in Ethiopian Manufacturing Industries, Journal of EEA, Vol. 20, pp 55-73 [23] Veeri Arumugam and Keng-Boon Ooi, 2008, TQM practices and quality management performance, The TQM Magazine Vol. 20 No. 6, pp. 636-650 [24] Dan and JoCeal Urbaniak, 2002 , Introduction to the Apparel Industry, Fashion Forward, Los Angeles [25] www.indiantextilejournal.com, Garment production systems: An Overview
Related Documents