UCLA UCLA Electronic Theses and Dissertations Title Quantitative Analysis of 3-Dimensional Facial Soft Tissue Photographic Images: Technical Methods and Clinical Application Permalink https://escholarship.org/uc/item/6f8123wh Author Nanda, Vikrum Publication Date 2014 Peer reviewed|Thesis/dissertation eScholarship.org Powered by the California Digital Library University of California

Welcome message from author
This document is posted to help you gain knowledge. Please leave a comment to let me know what you think about it! Share it to your friends and learn new things together.
Transcript
UCLAUCLA Electronic Theses and Dissertations
TitleQuantitative Analysis of 3-Dimensional Facial Soft Tissue Photographic Images: Technical Methods and Clinical Application
Permalinkhttps://escholarship.org/uc/item/6f8123wh
AuthorNanda, Vikrum
Publication Date2014 Peer reviewed|Thesis/dissertation
eScholarship.org Powered by the California Digital LibraryUniversity of California
UNIVERSITY OF CALIFORNIA
Los Angeles
Quantitative Analysis of 3-Dimensional Facial Soft Tissue Photographic Images: Technical
Methods and Clinical Application
A thesis submitted in partial satisfaction of the requirements
for the degree Master of Science in Oral Biology
by
Vikrum Singh Nanda
2014

! ii!
ABSTRACT OF THE THESIS
Quantitative Analysis of 3-Dimensional Facial Soft Tissue Photographic Images: Technical
Methods and Clinical Application
by
Vikrum Nanda
Master of Science in Oral Biology
University of California Los Angeles, 2014
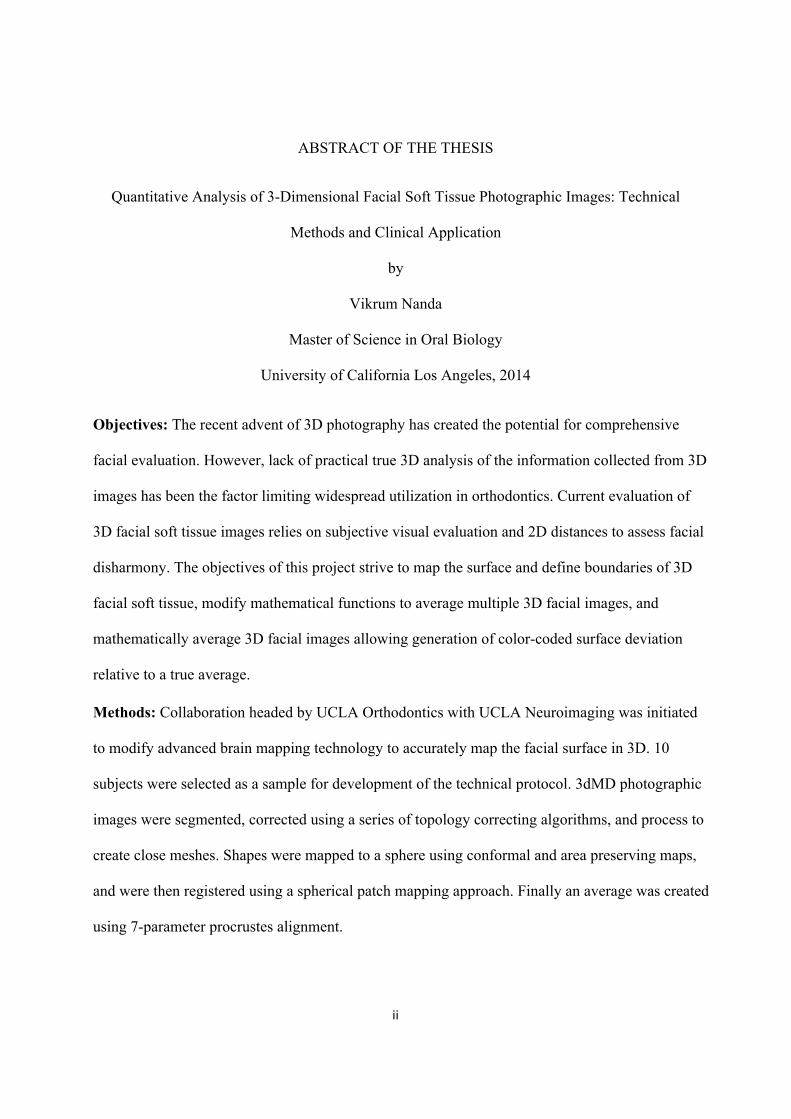
Objectives: The recent advent of 3D photography has created the potential for comprehensive
facial evaluation. However, lack of practical true 3D analysis of the information collected from 3D
images has been the factor limiting widespread utilization in orthodontics. Current evaluation of
3D facial soft tissue images relies on subjective visual evaluation and 2D distances to assess facial
disharmony. The objectives of this project strive to map the surface and define boundaries of 3D
facial soft tissue, modify mathematical functions to average multiple 3D facial images, and
mathematically average 3D facial images allowing generation of color-coded surface deviation
relative to a true average.
Methods: Collaboration headed by UCLA Orthodontics with UCLA Neuroimaging was initiated
to modify advanced brain mapping technology to accurately map the facial surface in 3D. 10
subjects were selected as a sample for development of the technical protocol. 3dMD photographic
images were segmented, corrected using a series of topology correcting algorithms, and process to
create close meshes. Shapes were mapped to a sphere using conformal and area preserving maps,
and were then registered using a spherical patch mapping approach. Finally an average was created
using 7-parameter procrustes alignment.

Results: Size-standardized average facial images were generated for the sample population. A
single patient was then superimposed on the average and color-coded displacement maps were
generated to demonstrate the clinical applicability of this protocol. Further confirmation of the
methods through 3D superimposition of the initial (T0) average to the 4 week (T4) average was
completed and analyzed.
Conclusions: The results of this investigation suggest that it is possible to average multiple facial
images of highly variable topology. The immediate application of this research will be rapid and
detailed diagnostic imaging analysis for orthodontic and surgical treatment planning. There is great
potential for application to anthropometrics and genomics. This investigation resulted in
establishment of a protocol for mapping the surface of the human face in three dimensions.
iii!

The thesis of Vikrum Nanda is approved.
Sotirios Tetradis, Committee Chair Reuben Kim Won Moon
Ki-Hyuk Shin
University of California, Los Angeles
2014 iv!
! v!
TABLE OF CONTENTS
Abstract..........................................................................................................................................ii
Introduction…………....................................................................................................................1
Overall Objectives and Specific Aims...............................................................................2 Background / Significance.................................................................................................5 Preliminary Studies .........................................................................................................10
Materials and Methods ................................................................................................................11
3dMD Imaging Protocol ..................................................................................................11 Quantification and Averaging Methods............................................................................13 Collection of 3D face models...........................................................................................14 Surface topology correction and spherical mapping ........................................................15 Shape Registration ...........................................................................................................18 Average and Distance Map Creation ...............................................................................21 Proof of Methods..............................................................................................................23
Results..........................................................................................................................................24
3D Facial Photographic Average.....................................................................................24 3D Superimposition of Individual Sample to Average....................................................29 3D Superimposition of 10 Subject Average T0 to 10 Subject Average T4….................31
Discussion…………………………………………………………..…….………………….…32
Clinical Applications........................................................................................................32 Limitations ......................................................................................................................34 Conclusions......................................................................................................................35
References....................................................................................................................................37
Introduction
Facial soft tissue analysis has evolved over time, and with the latest advancements in
technology, 3D photographic imaging has created the potential for comprehensive facial
evaluation. However, lack of practical true 3D analysis of the information collected from 3D
photographic images has been the limiting factor holding back widespread utilization in the
orthodontic profession. Current evaluation of these 3D facial soft tissue images relies largely on
subjective visual evaluation and 2D point to point distances to assess aesthetics and facial
disharmony. Those that have attempted 3D averaging and analysis have failed to
comprehensively and accurately describe the 3D facial surface with respect to size, color, and
morphologic difference.
In 2013, the UCLA Orthodontic department completed a project entitled “Craniofacial
Surface Mapping: Moving Toward a 3-Dimensional Normative Model of the Human Skull”.
Collaboration headed by UCLA Orthodontics with the Neuroimaging Department (LONI) was
initiated to modify advanced brain mapping technology to accurately map the human skull
surface in 3D. The success and impact of this project has motivated our department to pursue
further collaboration with LONI. The immediate objectives of this project strive to map the
surface and define boundaries of 3D facial soft tissue, modify and apply mathematical functions
to average multiple 3D facial soft tissue photographic images, and mathematically average 3D
facial soft tissue images allowing generation of color-coded surface deviation relative to a true
average.
Accomplishing our immediate goal would result in a protocol for mapping the surface of
the human face in three dimensions using 3D photographic images. Application of this
1
! 2!
technology would allow rapid soft tissue diagnostics for treatment planning in various health
care specialties (i.e. orthodontics, oral/maxillofacial and plastic surgery). The ultimate multi-
year vision of this collaboration, once the facial soft tissue analysis is completed, would be
correlation of 3D facial soft tissue photographic images to their corresponding 3D cone beam
computed tomography images essentially allowing creation and 3D analysis of a virtual patient.
As this vision is realized, the ability to analyze patients or groups of patients in three dimensions
would shift the diagnostic and normative paradigms currently used in craniofacial analysis
towards an ever progressive direction.
Overall Objectives and Specific Aims
Our overall objective focuses on an innovative vision to further the field of orthodontics
by creating a method to describe and analyze hard and soft tissues of orthodontic patients in three
dimensions. Dr. Ryan McComb was able to complete the first step of our vision for application
of 3D diagnostics in orthodontics by successfully accomplishing his landmark project. The
project, headed by the UCLA Section of Orthodontics, involved collaboration with the
neuroimaging department to apply and modify advanced technology used in brain mapping
research to accurately and efficiently map the skull surface in 3D; to apply and modify existing
mathematical functions to find the average of multiple skull surfaces; and to develop protocol for
superimposing sample skulls on the averaged skull model, yielding a color-coded map of surface
deviation and dysmorphology.
The success and impact of this project has spurred the motivation to establish productive
collaboration between the UCLA neuroimaging department (LONI) and UCLA Department of
Orthodontics. The grand vision of this collaboration is to analyze three dimensional data
! 3!
routinely collected in orthodontic practice (i.e. CBCT, 3D Intraoral Scanning, 3D Photographic
Systems) and integrate the data essentially allowing vast application and creation of a virtual
patient. Our immediate goal, currently being initiated, is to employ the use of the orthodontic
department’s newly acquired 3dMD Imaging System to map, define, and mathematically average
3D facial soft tissue photographic images.
Soft tissue analysis employed for orthodontic diagnostics and treatment is broadly
recognized as a critical factor leading to successful orthodontic treatment outcomes. With the
advent of three-dimensional photography systems (i.e. 3dMD), it has become easy to capture
three-dimensional facial photographs of patients for use in orthodontic practice. The current
obstacle yet to be resolved is devising and integrating practical three-dimensional analyses and
applications to utilize the wealth of information acquired when photographically tracking our
patients in three dimensions.
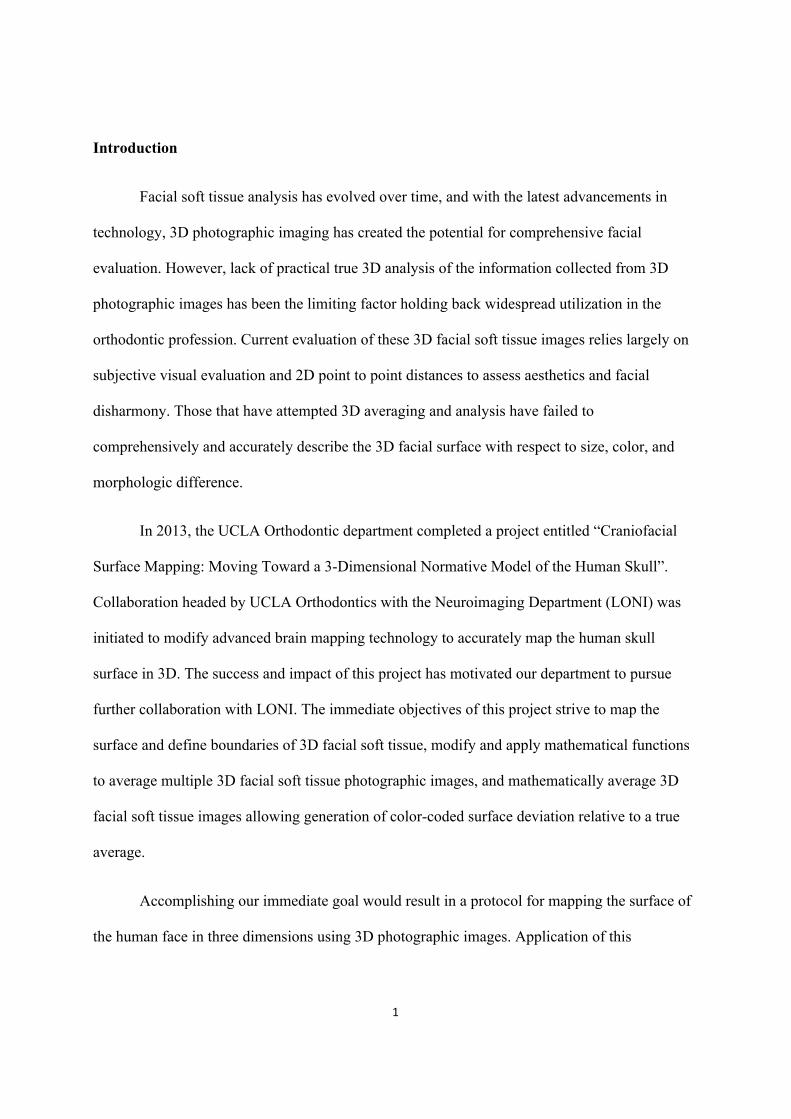
Three dimensional facial photographic imaging was introduced to orthodontics during the
early years of the millennium. Research has demonstrated the value and increased accuracy of
three-dimensional photography compared to traditional imaging modalities and has sought to
develop new analyses for their application to clinical use [1] [2] (Figure 1). Most current
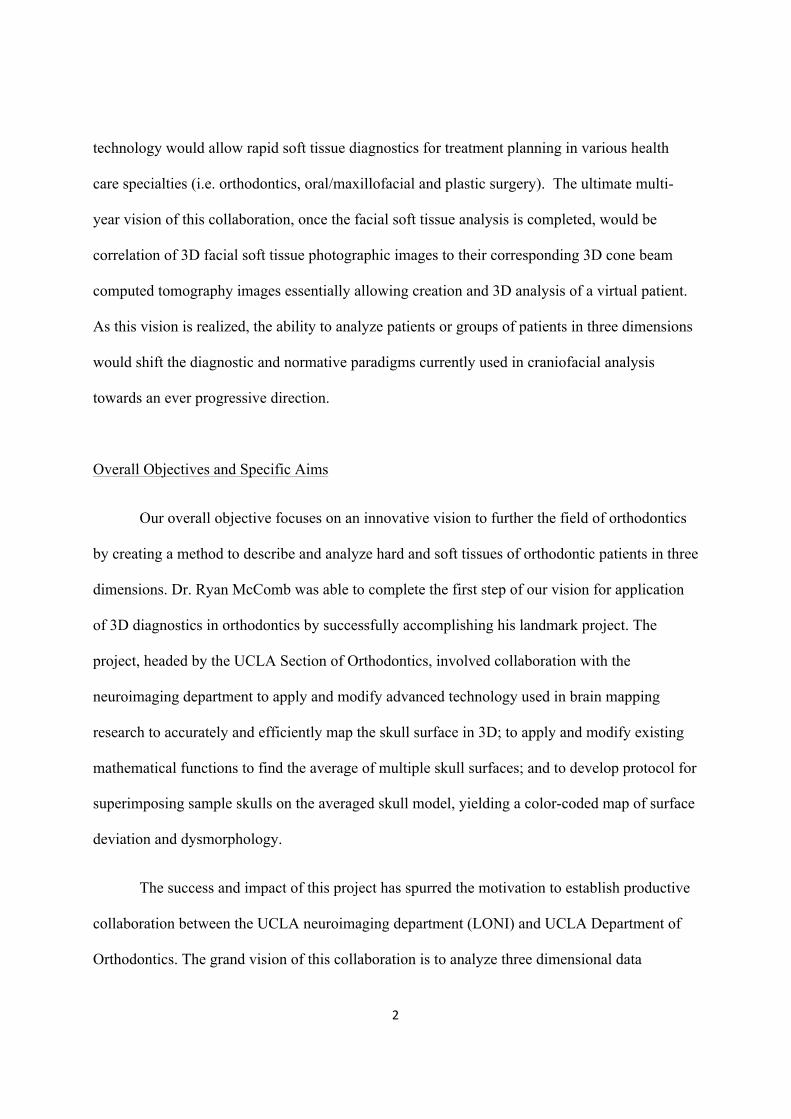
methods for analysis of 3D photographic images involve simple visual evaluation or linear and
angular measures between various point landmarks to evaluate facial aesthetics and proportions
(Figure 2). The objective for this project is to develop and verify a protocol for mapping the
surface of the human face in three dimensions using three-dimensional photography.
! 4!
Figure 1: (Adapted from Cavalcanti et al. [1]) Three-dimensional computed tomography in
frontal view of soft tissue measurement of N–Ns (55.30 mm).
Figure 2: (Adapted from Nam-Kug Kim et al. [3]) Three-dimensional computed tomography grid projected on facial soft tissue demonstrating use of point to point measurements.
Ultimately, this project will contribute to the creation of a true three-dimensional
craniofacial analysis and establishment of a database of 3D photographic images for generation
! 5!
of age, gender, and race specific normative models of the human face. Overall, this study seeks
to advance 3D imaging analysis technology by aiming to:
1. Apply and modify advanced technology used in brain mapping research to accurately and
efficiently map the facial surface in 3D.
2. Apply and modify existing mathematical functions to find the average of multiple facial
surfaces.
3. Develop protocol for superimposing sample faces on the averaged facial model, yielding
a color-coded map of surface deviation and dysmorphology.
4. Superimpose and compare the average facial models of same patients before (T1) and
after (T2) a particular treatment protocol (orthognathic surgery, MARPE/SARPE, RPE,
etc.)
The most immediate application of this technology will be rapid and detailed diagnostic
imaging for orthodontic and surgical treatment planning, visualization and 3D quantification of
the human face with unprecedented detail, and generation of normative data across various
strata.
Background / Significance
The orthodontic profession is a specialty founded on the analysis and interpretation of
geometries representing facial proportions. Dimensions and ratios are translated into
representations of ideals and applied to facial aesthetics. Whether dealing with the representation
of facial aesthetics using Andrew’s Goal Anterior-Limit Line (GALL) [4], the ideal smile arc
analyzed by Sarver [5], or the Facial Anthropometric Measurements cited by Proffit [6], all
contain elements of measured proportions used to represent a larger ideal. The traditional
! 6!
foundation of orthodontics has relied on two-dimensional imaging to recreate the three-
dimensional facial intricacies that exist in human anatomy. In the past decade, technological
advancements have allowed visualization of bony anatomy and even more recently the soft
tissues of the face. The orthodontic profession now has access to more information in three-
dimensions than ever before. It is our professional responsibility to utilize this information and
apply these advancements in imaging towards patient care. There is a strong need for
investigations which analyze progress and change in three dimensions to supplement and
enhance traditional treatment modalities.
Cephalometric analysis has been used to evaluate and predict changes in facial profile
after orthodontic treatment and orthognathic surgery. [7] [8] However, this conventional two-
dimensional method is limited to evaluation of the soft tissues of the mid-sagittal area. [9] [10] In
order to more accurately analyze and evaluate the soft tissues in the paranasal, zygomatic, cheek,
and other facial areas, three-dimensional imaging methods such as 3D computerized tomography
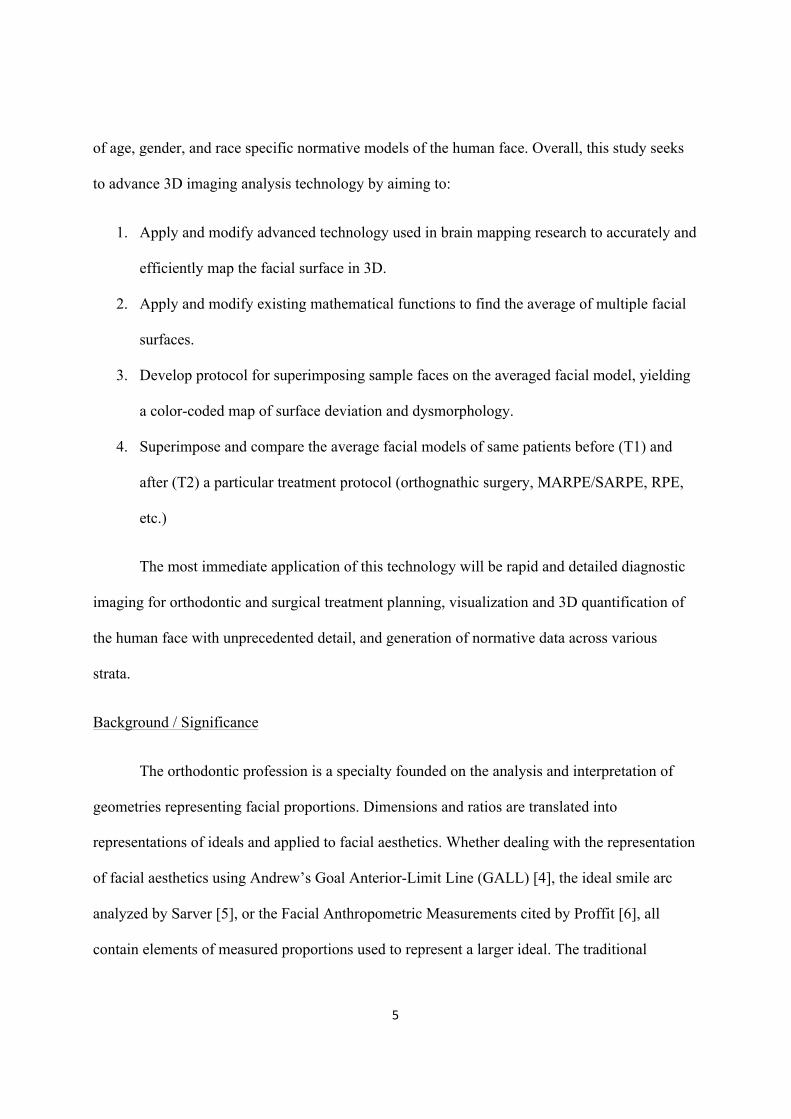
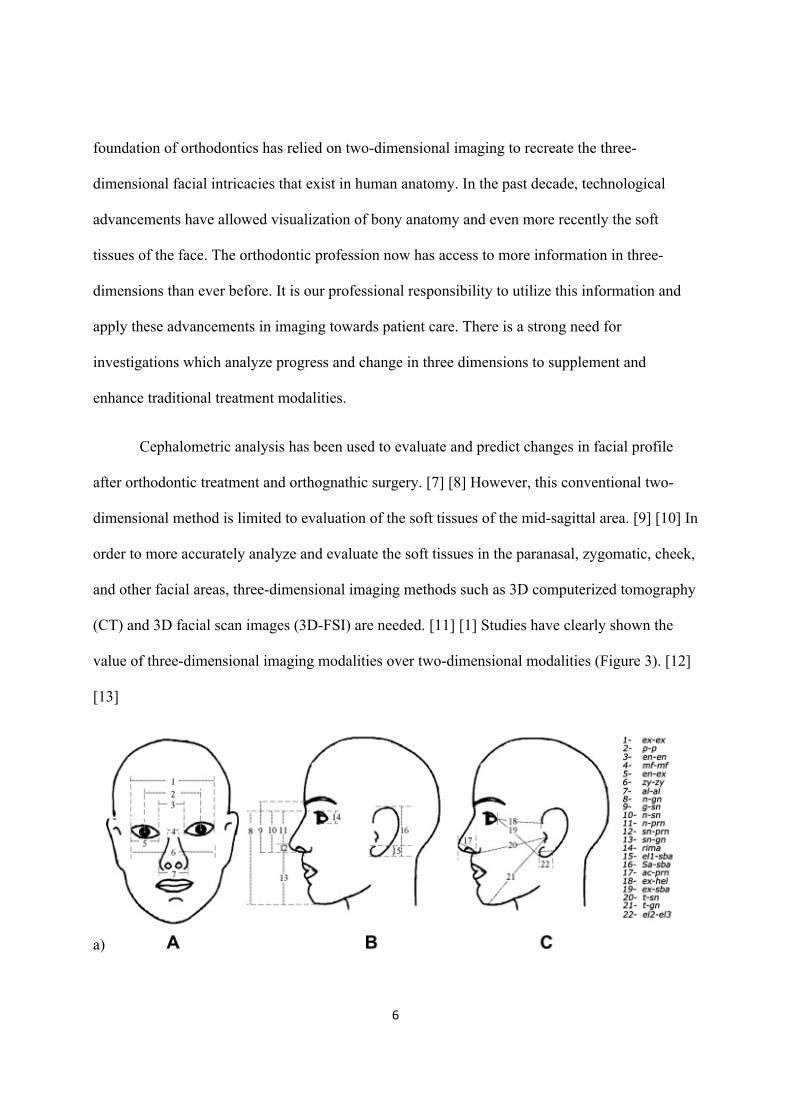
(CT) and 3D facial scan images (3D-FSI) are needed. [11] [1] Studies have clearly shown the
value of three-dimensional imaging modalities over two-dimensional modalities (Figure 3). [12]
[13]
a)
! 7!
b)
Figure 3(a)(b): (Adapted from Umut Ozsoy [12]) Difference in mean distances using three methods of measurement.
Although frontal and lateral cephalometric radiographs, panoramic radiographs, and
intraoral and extra- oral photographs are still used, more emphasis has been placed on the 3D
virtual image and soft-tissue esthetics. [14] [15] The paradigm shift in treatment philosophies
also means that many clinicians have started to plan from the external profile, placing
importance on the soft tissues of the face largely to determine the limitations of orthodontic
treatment. From the perspectives of function, stability, and esthetics, the orthodontist must plan
treatment within the patient’s limits of soft-tissue adaptation and contours. [16]
Furthermore, major orthodontic textbooks currently cite facial soft tissue normative data
largely based on studies established over 30 years ago. [17] [18] The advent of efficient and
accurate averaging of craniofacial structures will provide appropriate revisions to current
normative data. Past researchers have recognized the need for updating and categorizing
normative data to improve accuracy and application to appropriate demographics.
! 8!
A further review of past literature, specifically seeking previous attempts to 3-
dimensionally average and quantify facial soft tissue, reveals a strong deficiency in accurate and
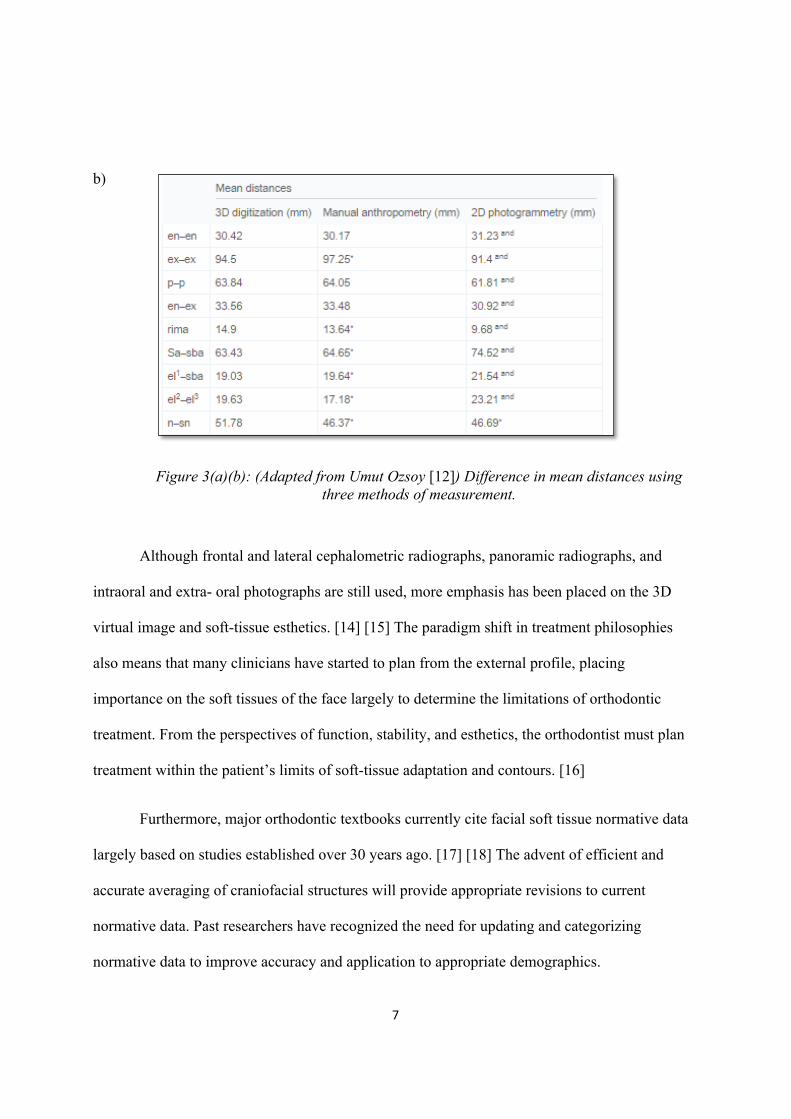
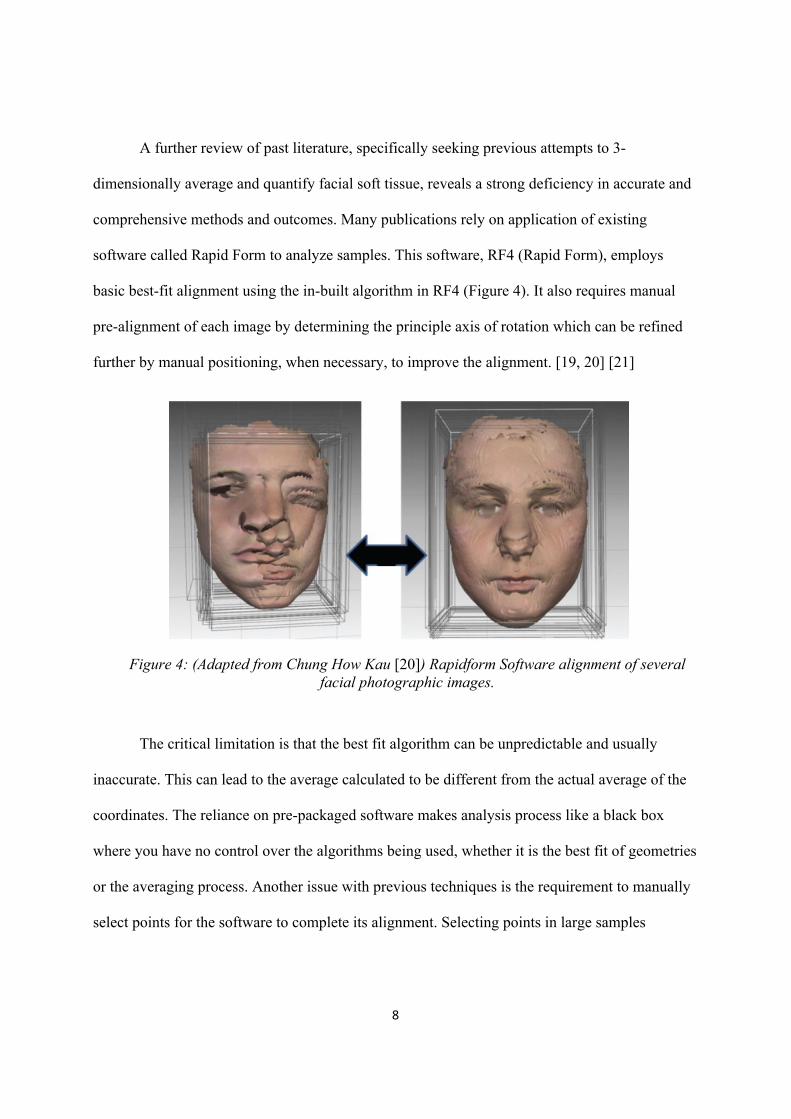
comprehensive methods and outcomes. Many publications rely on application of existing
software called Rapid Form to analyze samples. This software, RF4 (Rapid Form), employs
basic best-fit alignment using the in-built algorithm in RF4 (Figure 4). It also requires manual
pre-alignment of each image by determining the principle axis of rotation which can be refined
further by manual positioning, when necessary, to improve the alignment. [19, 20] [21]
!!!!! !!!!!!!!! !
Figure 4: (Adapted from Chung How Kau [20]) Rapidform Software alignment of several facial photographic images.
The critical limitation is that the best fit algorithm can be unpredictable and usually
inaccurate. This can lead to the average calculated to be different from the actual average of the
coordinates. The reliance on pre-packaged software makes analysis process like a black box
where you have no control over the algorithms being used, whether it is the best fit of geometries
or the averaging process. Another issue with previous techniques is the requirement to manually
select points for the software to complete its alignment. Selecting points in large samples
! 9!
becomes highly inaccurate from image to image, especially in dealing with soft tissue landmarks
and impractical to complete for large numbers of samples in attempts to create normative data.
The basic methodology of 3D facial analysis utilized in other studies carries greater
limitations for the reason that they rely on using the Z-coordinate of the facial points to create the
average along the Z-axis. [22] This approach lacks accurate analysis because although the points
of the face are initially recorded in three-dimensional space, their average is calculated only in
linear space. This leaves great voids in the data with structures that overlap. In the case of the
face, these areas include but are not limited to the nose, lips, eyes, and labiomental area.
Another issue lies in the fact that the landmarks of facial soft tissue were not aligned
between different faces prior to the averaging. The nose was the sole reference used to align
different faces in previous samples. This methodology for creating a soft tissue average is limited
because all the major facial landmarks across different records were not aligned together before
averaging.
In the AJODO, another group of investigators studied facial morphology in 5 distinct
populations. Their methods for determining surface deviation was using 5 registration points on
the facial soft tissue and relying on best fit alignment to generate their average. The limitations
of this method come from the incredible variation of manual selection of points along with the
inability to consider size, color, and shapes. [20]
Even the most recent being literature published relies on linear measures from set points
to generate averages. In one such study published in 2013, “soft tissue nasion was set as the
‘zeroed’ reference landmark. Twenty landmark distances were constructed and evaluated within
3 dimensions of space. Six angles, 4 proportions, and 1 construct were also calculated”. [21]
! 10!
Our unique collaboration will allow for the generation of three-dimensional methods not
before accomplished in creation of facial averages and analysis. It will offer a practical and
automated pipeline to quickly and accurately generate averages of the human face.
We feel that this collaboration is a critical part of progress in the field of orthodontics and
that this project’s application can transcend to other fields of medicine (i.e. oral/maxillofacial
and plastic surgery) as well as the physical anthropological sciences.
Preliminary Studies
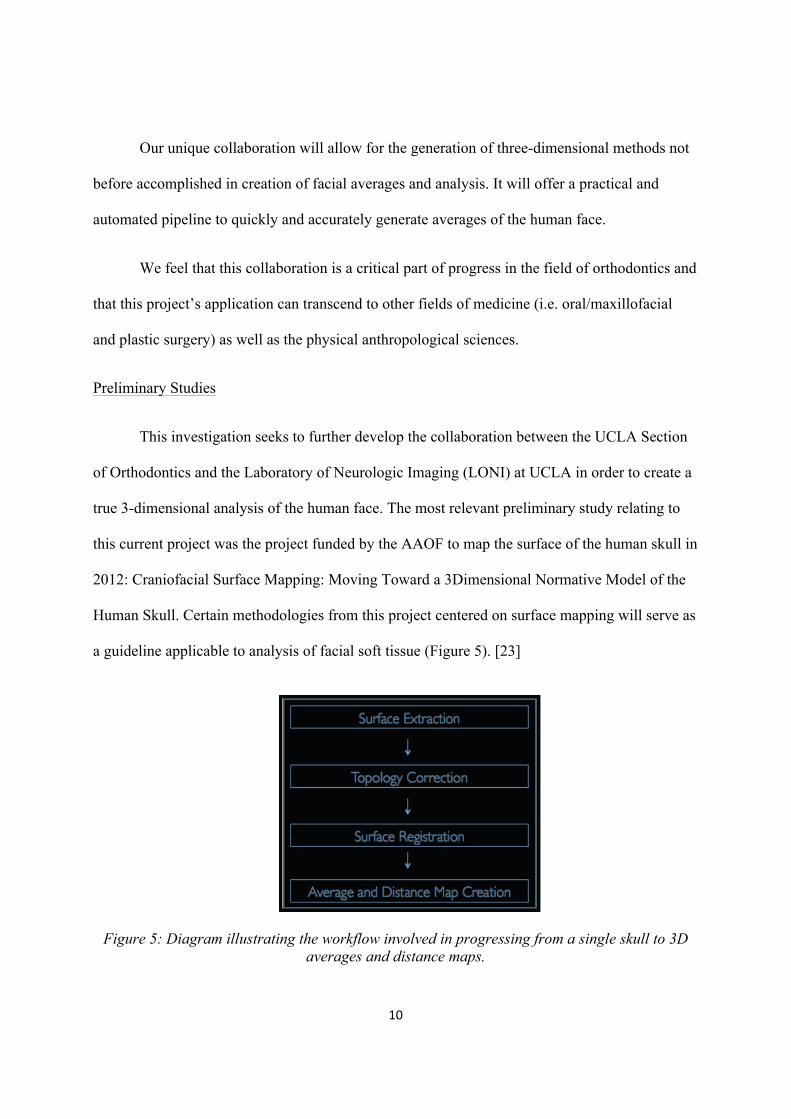
This investigation seeks to further develop the collaboration between the UCLA Section
of Orthodontics and the Laboratory of Neurologic Imaging (LONI) at UCLA in order to create a
true 3-dimensional analysis of the human face. The most relevant preliminary study relating to
this current project was the project funded by the AAOF to map the surface of the human skull in
2012: Craniofacial Surface Mapping: Moving Toward a 3Dimensional Normative Model of the
Human Skull. Certain methodologies from this project centered on surface mapping will serve as
a guideline applicable to analysis of facial soft tissue (Figure 5). [23]
Figure 5: Diagram illustrating the workflow involved in progressing from a single skull to 3D averages and distance maps.
! 11!
The topic of surface mapping is one that has been explored in great detail by
neuroimaging but has been relatively unnoticed by the orthodontic/craniofacial community. The
Laboratory of Neuroimaging (LONI) at UCLA has developed population!based brain atlases to
demonstrate brain anatomical variation with age, gender, and genetics (see methods). This atlas
allows researchers to explore how diseases such as Alzheimer’s affect brain structure. The
advanced computational anatomy tools used in neuroimaging research have not yet been applied
to the human face. The ultimate goal of this project is to translate those tools that have been
developed in neuroimaging research so that they are applicable to the field of orthodontics and
can be utilized by researchers and clinicians to better diagnose and treat patients. [24]
Our proposed methods of averaging the human face addresses those problems found in
previous studies and will be discussed in the next section.
Materials and Methods
3dMD Imaging Protocol
There are specific considerations to take into account when considering soft tissue analysis. Soft
tissue is dynamic and capable of varying highly depending on acquisition methods. This means
individuals are capable of producing a range of data. For this reason it was critical to formulate a
method of standardizing image acquisition. We have developed a protocol specifically for this
investigation that will achieve consistent 3D photographic images.
a. Room Setup
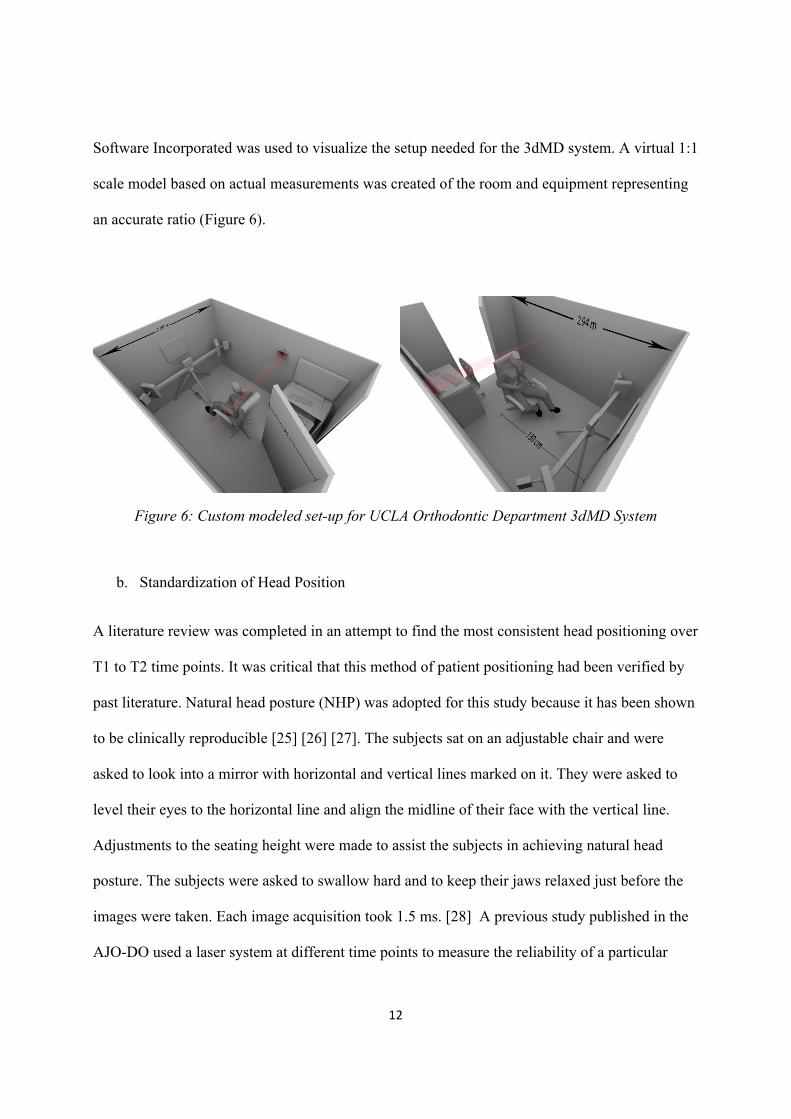
The space available for the setup of our 3dMD system was a rectangular room with dimensions
of 2.09m x 2.94m. A 3D animation and modeling software called HoudiniTM by Side Effects
! 12!
Software Incorporated was used to visualize the setup needed for the 3dMD system. A virtual 1:1
scale model based on actual measurements was created of the room and equipment representing
an accurate ratio (Figure 6).
Figure 6: Custom modeled set-up for UCLA Orthodontic Department 3dMD System
b. Standardization of Head Position
A literature review was completed in an attempt to find the most consistent head positioning over
T1 to T2 time points. It was critical that this method of patient positioning had been verified by
past literature. Natural head posture (NHP) was adopted for this study because it has been shown
to be clinically reproducible [25] [26] [27]. The subjects sat on an adjustable chair and were
asked to look into a mirror with horizontal and vertical lines marked on it. They were asked to
level their eyes to the horizontal line and align the midline of their face with the vertical line.
Adjustments to the seating height were made to assist the subjects in achieving natural head
posture. The subjects were asked to swallow hard and to keep their jaws relaxed just before the
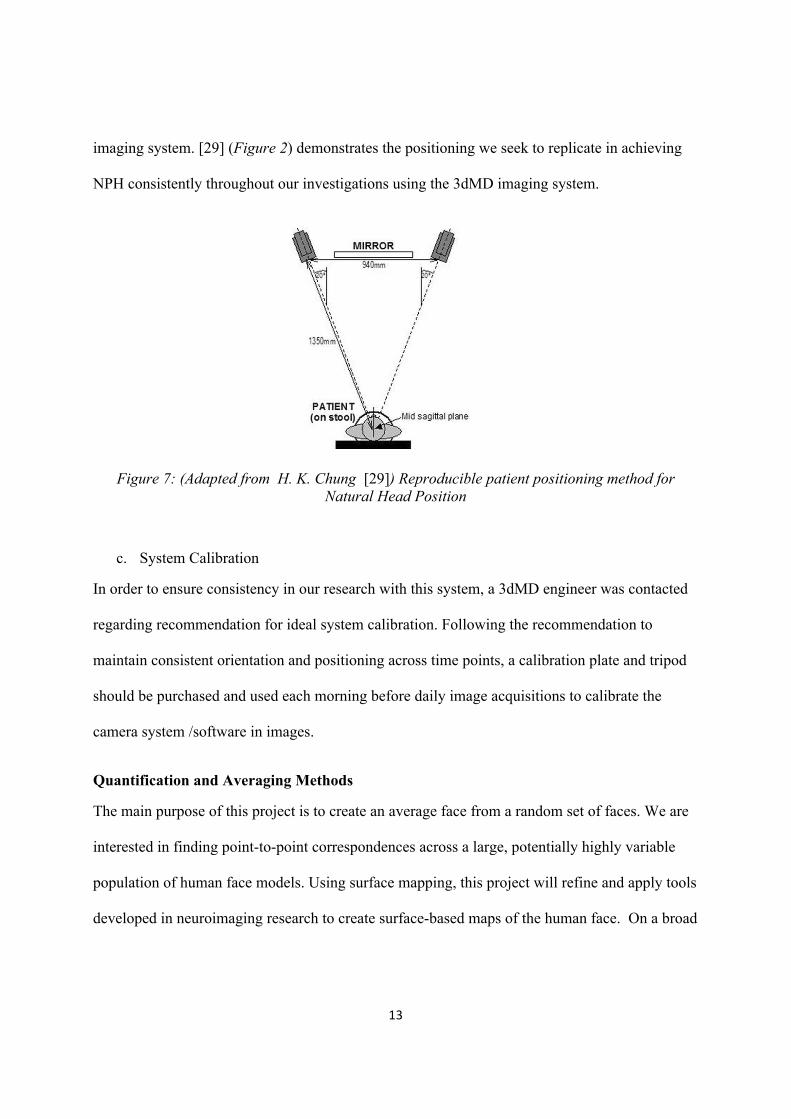
images were taken. Each image acquisition took 1.5 ms. [28] A previous study published in the
AJO-DO used a laser system at different time points to measure the reliability of a particular
! 13!
imaging system. [29] (Figure 2) demonstrates the positioning we seek to replicate in achieving
NPH consistently throughout our investigations using the 3dMD imaging system.
Figure 7: (Adapted from H. K. Chung [29]) Reproducible patient positioning method for Natural Head Position
c. System Calibration
In order to ensure consistency in our research with this system, a 3dMD engineer was contacted
regarding recommendation for ideal system calibration. Following the recommendation to
maintain consistent orientation and positioning across time points, a calibration plate and tripod
should be purchased and used each morning before daily image acquisitions to calibrate the
camera system /software in images.
Quantification and Averaging Methods
The main purpose of this project is to create an average face from a random set of faces. We are
interested in finding point-to-point correspondences across a large, potentially highly variable
population of human face models. Using surface mapping, this project will refine and apply tools
developed in neuroimaging research to create surface-based maps of the human face. On a broad
! 14!
level, the project can be divided into five parts, summarized below, and described in more detail
in this section:
1. Collection of sample 3D Face models
2. Surface topology correction and spherical mapping !!
a. Non-manifold polygon correction
b. Boundary closure and Smoothing
c. Spherical Mapping
3. Shape registration
a. Initial Spherical Matching
b. Texture Matching
c. Geometry Matching and Registration Model
4. Average and distance map creation
a. Procrustes alignment/ Tensor Based Morphometry
b. Average and distance map creation, shape statistics analysis
5. Pilot study
a. Evaluation of individual shape morphology compared to averaged face
1. Collection of 3D face models
The novel nature of this investigation requires the formulation of a standard protocol for
consistent image acquisition using the 3dMD imaging system. Our goal was to create an ideal
environment and maintain consistent image acquisition for individual subjects over the duration
of comprehensive treatment time.
! 15!
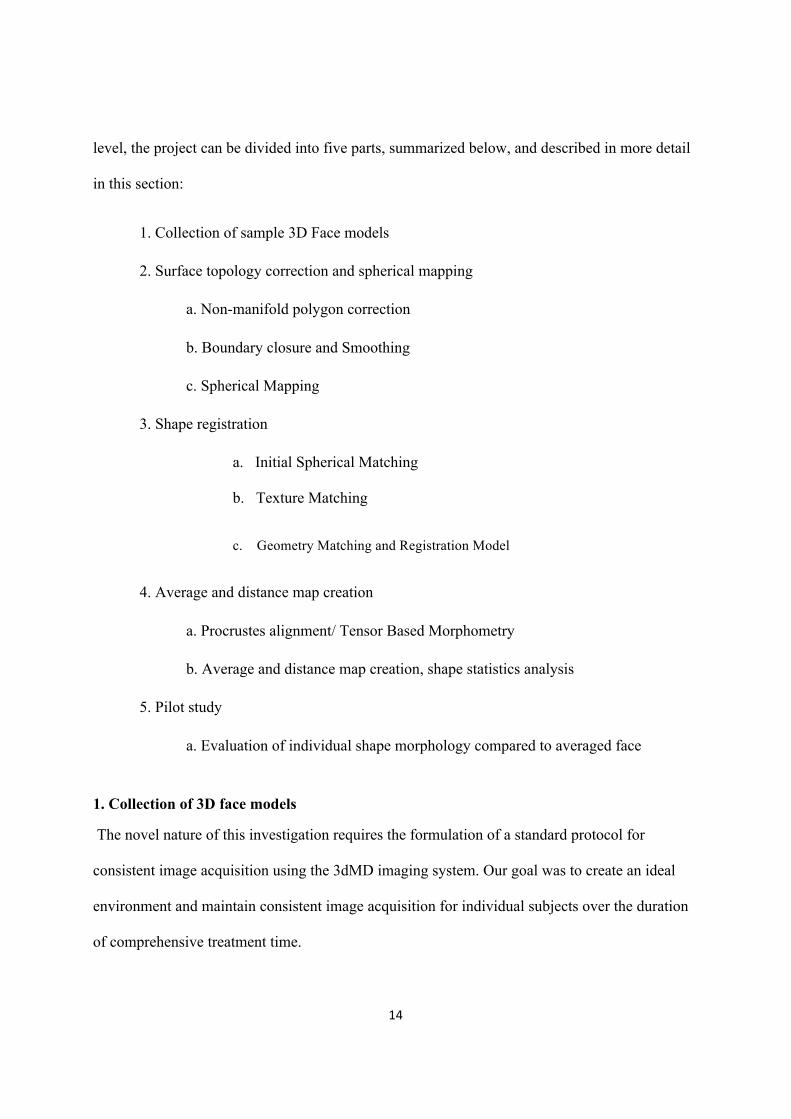
3dMD face system (3dMD, Atlanta, Ga) is a structured light system combining stereo-
photogrammetry and the structured light technique. This system uses a multi- camera
configuration, with 3 cameras on each side (1 color, 2 infrared) that capture photorealistic quality
pictures. A random light pattern is projected onto a subject, and an image is captured with
multiple synchronized digital cameras set at various angles in an optimum configuration. This
system can capture full facial images from ear to ear and under the chin in 1.5 ms at the highest
resolution.
Figure 8: Demonstration of 3 frontal views taken from 3dMD Imaging System.
2. Surface topology correction and spherical mapping
While many methods for morphometric surface mapping have been proposed, in particular for
cortical surface and subcortical structure mapping [30] [31] [32] [33] in brain imaging as well as
our own work adapting these methods to human skull mapping, developing similar methods for
face data presents a different set of challenges.
In non-technical terms, "topology" essentially refers to the number of handles, islands and
boundaries of the surface. Since no well-defined correspondence between surfaces of different
topologies is theoretically possible, one must perform a topological correction of each facial
! 16!
model before computing a dense correspondence. The simplest and most common approach is to
make each surface topologically equivalent to a sphere.
Topological variability of neuroimaging data is typically manifested in subtle alterations of
spherical topology such as small handles and islands, and fixing it does not generally lead to
serious changes in the geometry of the shape. On the other hand, skull models produced from
conical CT exhibit wildly variable topology and require a more drastic correction. Fortunately,
the natural topology of the face is that of a simple sheet with a single boundary. Spherical
correction for this type of shape is relatively straight-forward. Real 3D models of the face may
exhibit additional small boundaries due to reconstruction error, but filling these does not reduce
the accuracy of the representation, since no original data is altered. However, the method of 3D
mesh generation, Delaunay triangulation, often leads to polygon representation of non-manifold
topology which requires a separate set of correction techniques.
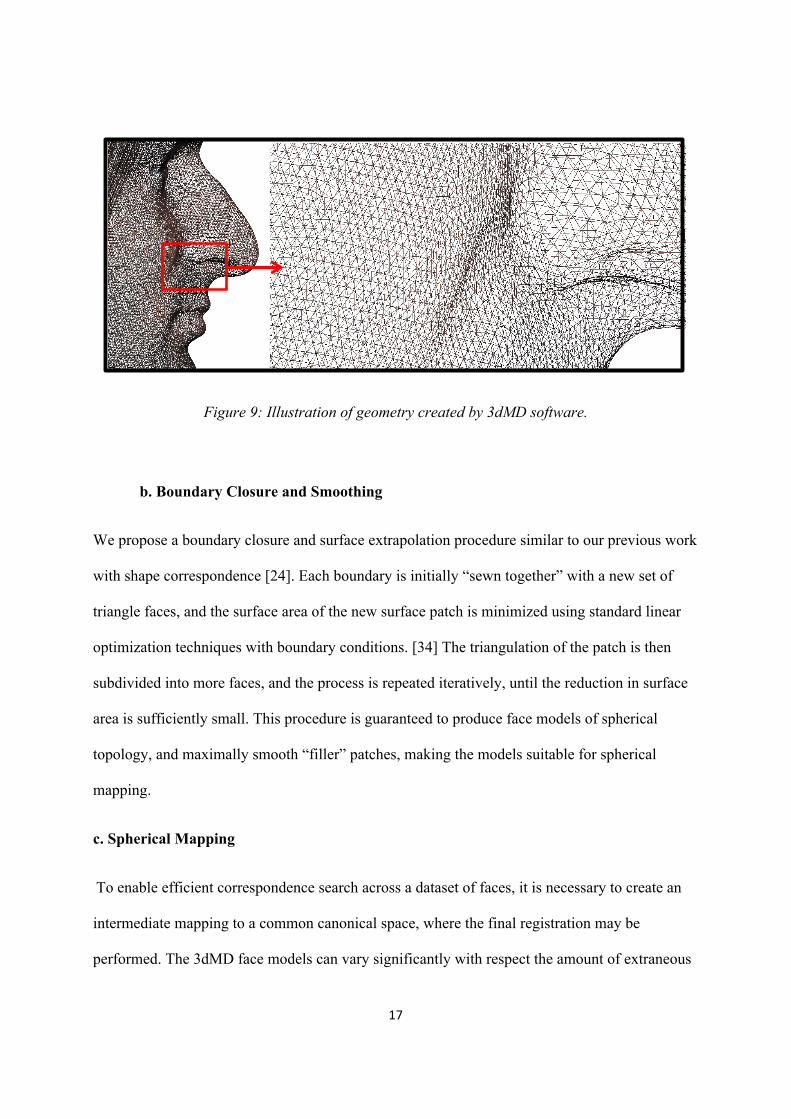
a. Non-manifold polygon correction
Removing triangles (“faces”) and vertices of non-manifold nature from polygon models is a
fairly common problem in 3D modeling. Several standard software packages exist that purport to
do this for general polygonal meshes. However, our experience has shown that these packages
fail on meshes generated by 3dMD software. We have expended considerable effort to create our
own in-house non-manifold correction tool targeted specifically at the difficult mesh models
created by 3dMD.!
! 17!
Figure 9: Illustration of geometry created by 3dMD software.
b. Boundary Closure and Smoothing
We propose a boundary closure and surface extrapolation procedure similar to our previous work
with shape correspondence [24]. Each boundary is initially “sewn together” with a new set of
triangle faces, and the surface area of the new surface patch is minimized using standard linear
optimization techniques with boundary conditions. [34] The triangulation of the patch is then
subdivided into more faces, and the process is repeated iteratively, until the reduction in surface
area is sufficiently small. This procedure is guaranteed to produce face models of spherical
topology, and maximally smooth “filler” patches, making the models suitable for spherical
mapping.
c. Spherical Mapping!
!To enable efficient correspondence search across a dataset of faces, it is necessary to create an
intermediate mapping to a common canonical space, where the final registration may be
performed. The 3dMD face models can vary significantly with respect the amount of extraneous
! 18!
geometry, especially the chest area. Thus, matching a pair of models with only one of the models
containing a section of the neck and chest would introduce serious distortion, as the chin of one
model would have to be “glued” to the middle of the chest in the other. Thus, it is preferable to
perform a correspondence search on the sphere, where all points may move around freely
matching geometry appropriately, and matching extraneous tissue in some models to filler
regions in others, as appropriate.
Our spherical mapping of choice is the state of the art fast unconstrained mapping with
controllable angle and area distortion, based on the article entitled “Unconstrained spherical
parameterization in ACM SIGGRAPH.” [35] Our implementation has been used on a variety of
shapes, including cortical, subcortical, skull and face models. It is arguably the most robust
spherical mapping tool to date.
3. Shape registration
Several shape registration techniques exist for genus zero shapes (shapes of spherical topology),
including those based on spherical parameterization. Among these are the rigid spherical cross-
correlation [36], spherical demons [37], Laplace-Beltrami Eigen-function registration [31], just
to name a few. The unique challenge for 3D face models, not addressed by existing methods, lies
in the need to combine texture information from the coloring of the face and face geometry. Our
proposed method would find dense correspondence across a set of faces using both texture and
geometry information, while maintaining sufficient flexibility to deal with non-face regions of
the model.
! 19!
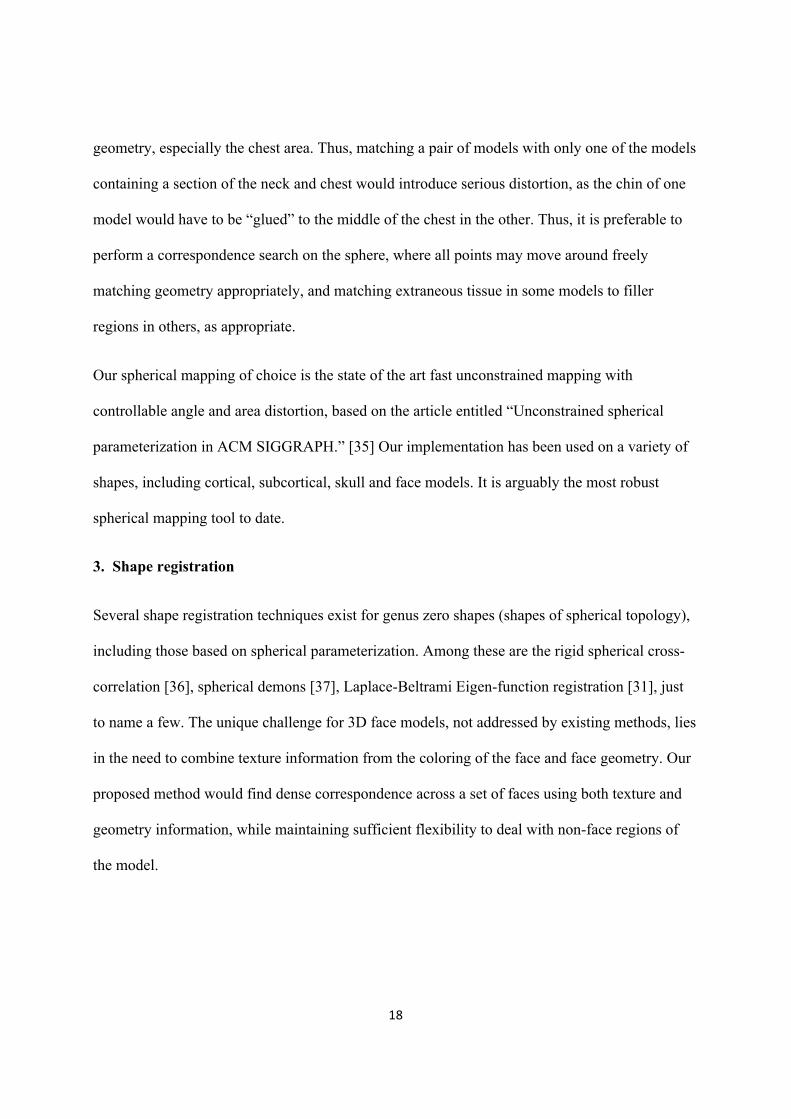
Figure 10: (Skull image is adapted from McComb [23]) Images show the mapping process as
facial 3dMD images are mapped to a sphere for shape registration using similar methodologies
to past research in mapping of the human skull.
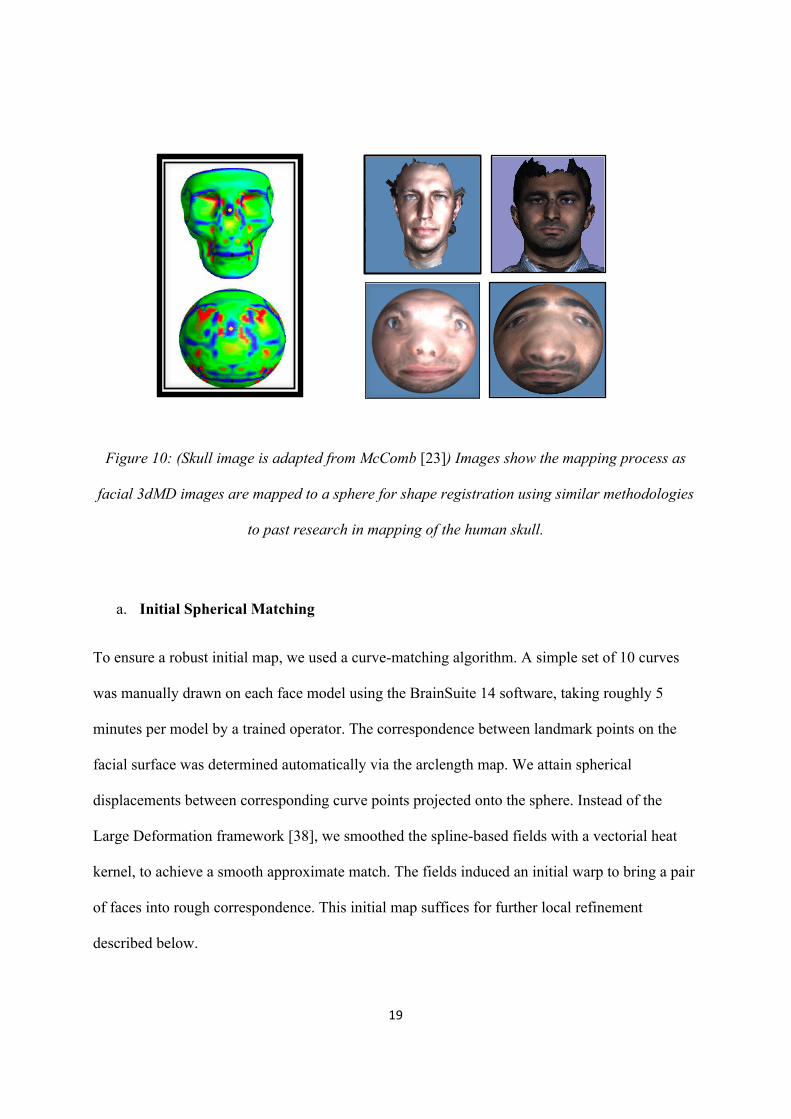
a. Initial Spherical Matching!
To ensure a robust initial map, we used a curve-matching algorithm. A simple set of 10 curves
was manually drawn on each face model using the BrainSuite 14 software, taking roughly 5
minutes per model by a trained operator. The correspondence between landmark points on the
facial surface was determined automatically via the arclength map. We attain spherical
displacements between corresponding curve points projected onto the sphere. Instead of the
Large Deformation framework [38], we smoothed the spline-based fields with a vectorial heat
kernel, to achieve a smooth approximate match. The fields induced an initial warp to bring a pair
of faces into rough correspondence. This initial map suffices for further local refinement
described below.
! 20!
Figure 11: Illustration of the curves used in the curve-matching algorithm.
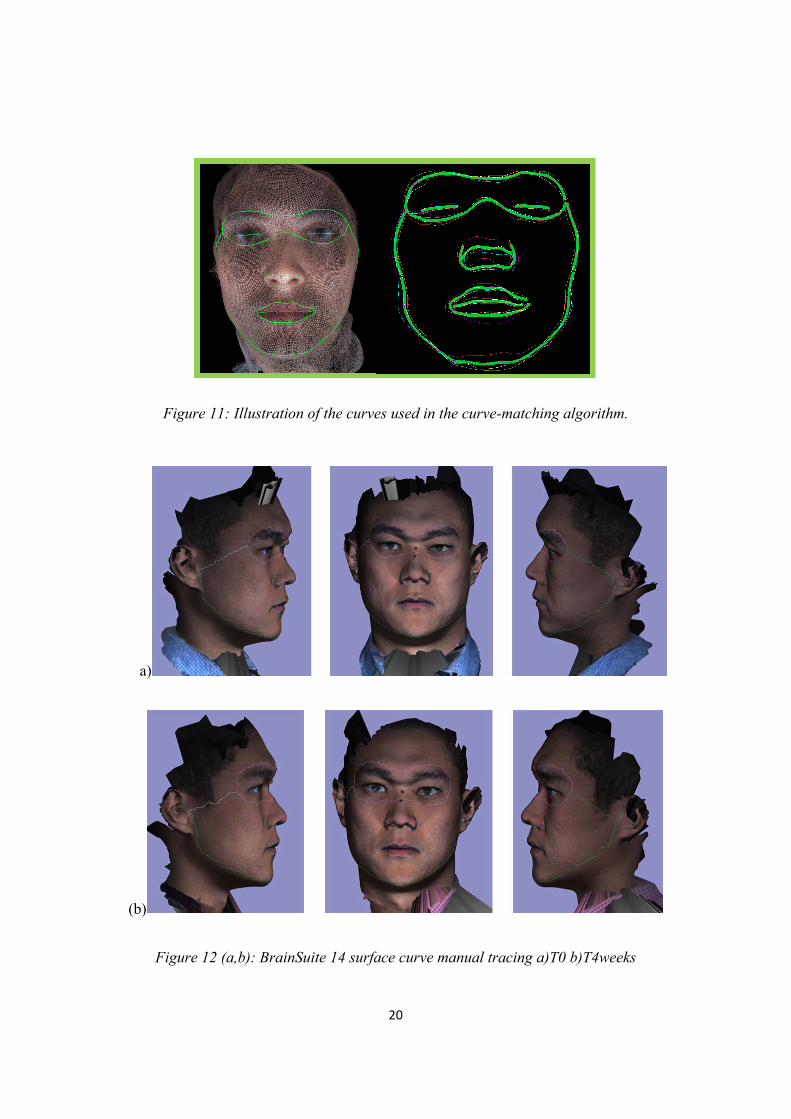
a)
(b)
Figure 12 (a,b): BrainSuite 14 surface curve manual tracing a)T0 b)T4weeks
! 21!
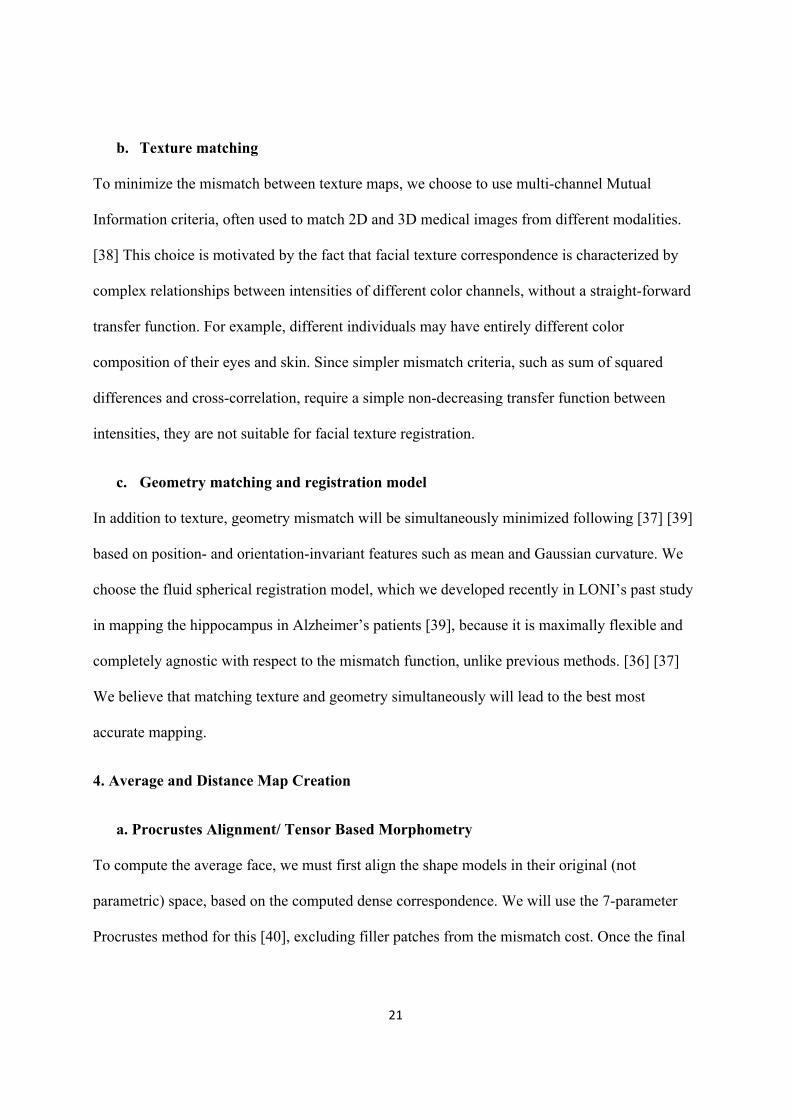
b. Texture matching
To minimize the mismatch between texture maps, we choose to use multi-channel Mutual
Information criteria, often used to match 2D and 3D medical images from different modalities.
[38] This choice is motivated by the fact that facial texture correspondence is characterized by
complex relationships between intensities of different color channels, without a straight-forward
transfer function. For example, different individuals may have entirely different color
composition of their eyes and skin. Since simpler mismatch criteria, such as sum of squared
differences and cross-correlation, require a simple non-decreasing transfer function between
intensities, they are not suitable for facial texture registration.
c. Geometry matching and registration model
In addition to texture, geometry mismatch will be simultaneously minimized following [37] [39]
based on position- and orientation-invariant features such as mean and Gaussian curvature. We
choose the fluid spherical registration model, which we developed recently in LONI’s past study
in mapping the hippocampus in Alzheimer’s patients [39], because it is maximally flexible and
completely agnostic with respect to the mismatch function, unlike previous methods. [36] [37]
We believe that matching texture and geometry simultaneously will lead to the best most
accurate mapping.
4. Average and Distance Map Creation
a. Procrustes Alignment/ Tensor Based Morphometry
To compute the average face, we must first align the shape models in their original (not
parametric) space, based on the computed dense correspondence. We will use the 7-parameter
Procrustes method for this [40], excluding filler patches from the mismatch cost. Once the final
! 22!
dense mapping has been computed, each source mesh is re-sampled to reflect the connectivity of
the target mesh. An alternative measure of face morphometry, called Tensor Based
Morphometry, has gained popularity in recent years. [41] Unlike distance-based features above,
the TBM features invariant to the position and orientation of the shapes, making accurate
Procrustes alignment a non-issue. The simplest in the family of TBM measures is the Jacobian
determinant, meaning simply the dilation/contraction ratio of the corresponding patches in pair
of face models. Such a measure is intuitive and invariant to misalignment in space, depending
only on the intrinsic correspondence between the models.
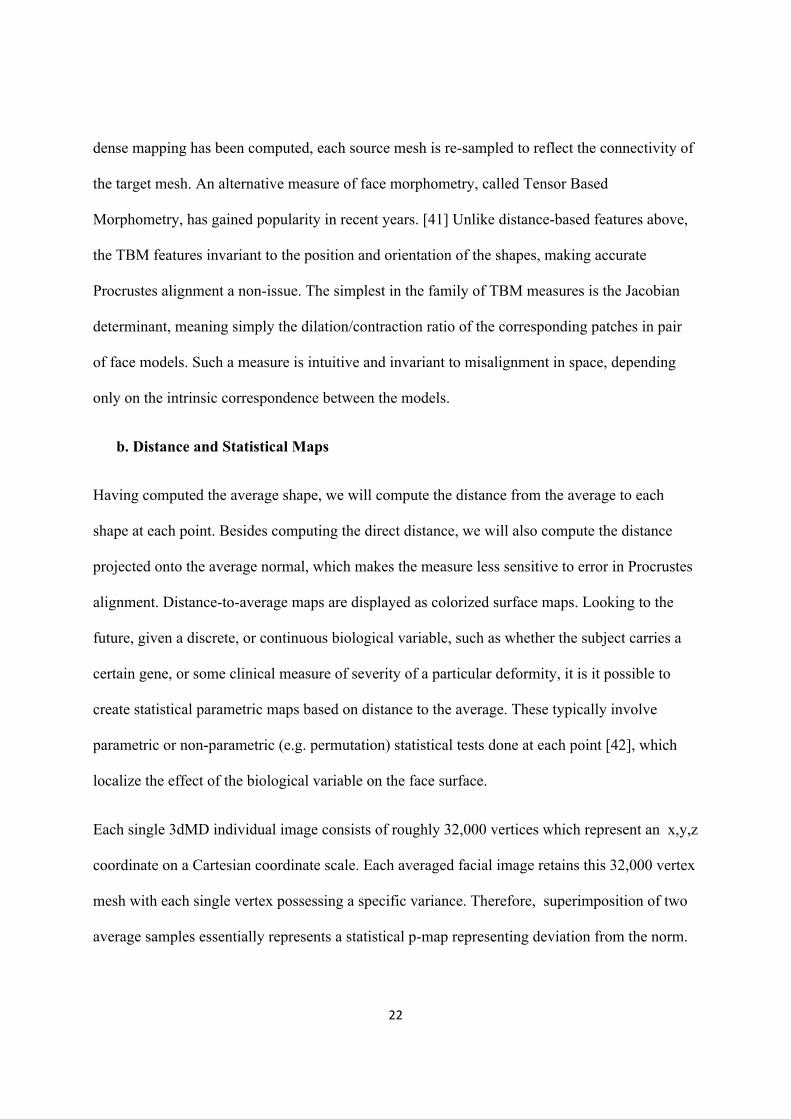
b. Distance and Statistical Maps
Having computed the average shape, we will compute the distance from the average to each
shape at each point. Besides computing the direct distance, we will also compute the distance
projected onto the average normal, which makes the measure less sensitive to error in Procrustes
alignment. Distance-to-average maps are displayed as colorized surface maps. Looking to the
future, given a discrete, or continuous biological variable, such as whether the subject carries a
certain gene, or some clinical measure of severity of a particular deformity, it is it possible to
create statistical parametric maps based on distance to the average. These typically involve
parametric or non-parametric (e.g. permutation) statistical tests done at each point [42], which
localize the effect of the biological variable on the face surface.
Each single 3dMD individual image consists of roughly 32,000 vertices which represent an x,y,z
coordinate on a Cartesian coordinate scale. Each averaged facial image retains this 32,000 vertex
mesh with each single vertex possessing a specific variance. Therefore, superimposition of two
average samples essentially represents a statistical p-map representing deviation from the norm.
! 23!
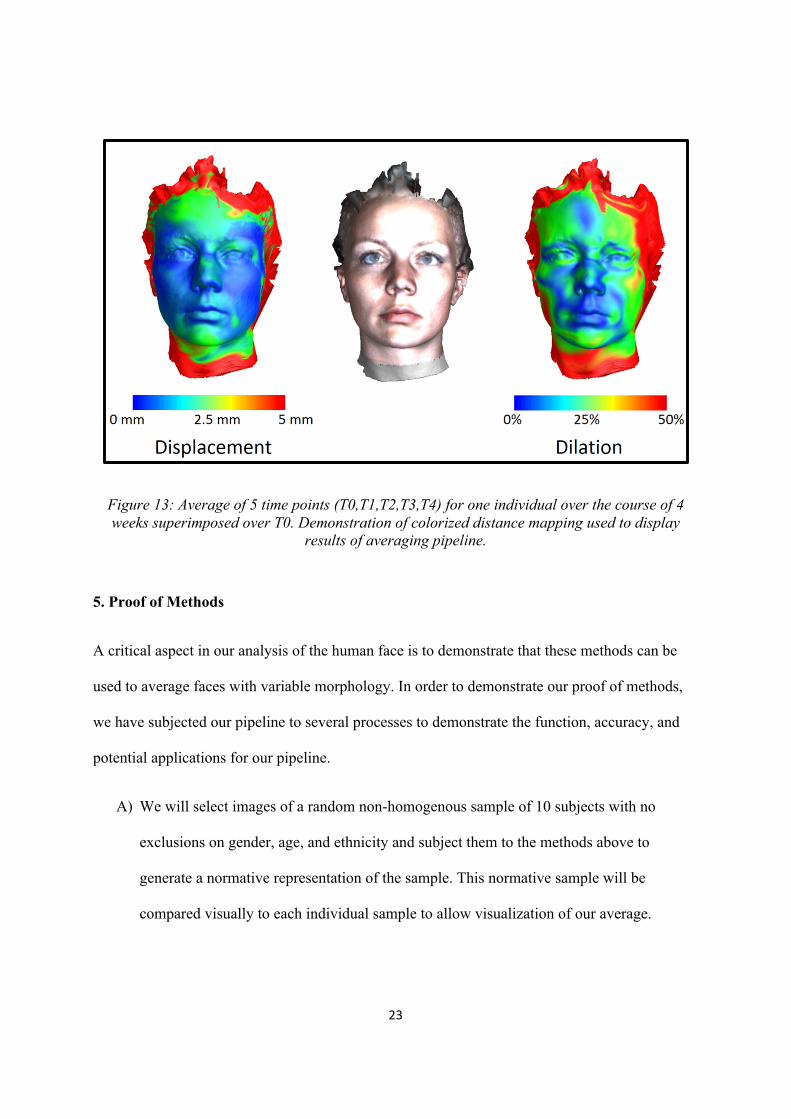
Figure 13: Average of 5 time points (T0,T1,T2,T3,T4) for one individual over the course of 4 weeks superimposed over T0. Demonstration of colorized distance mapping used to display
results of averaging pipeline.
5. Proof of Methods
A critical aspect in our analysis of the human face is to demonstrate that these methods can be
used to average faces with variable morphology. In order to demonstrate our proof of methods,
we have subjected our pipeline to several processes to demonstrate the function, accuracy, and
potential applications for our pipeline.
A) We will select images of a random non-homogenous sample of 10 subjects with no
exclusions on gender, age, and ethnicity and subject them to the methods above to
generate a normative representation of the sample. This normative sample will be
compared visually to each individual sample to allow visualization of our average.
! 24!
B) Furthermore, we will create 3D distance!to!average maps displayed as colorized surface
maps which will show individual deviation from our normative 10 sample average. This
is a key feature that will allow for comparison of individual facial morphology to age,
gender and race specific normative models for specific populations.
C) Another critical aspect to application of our methodologies involves comparison of
average samples over multiple time points (allowing pre and post treatment
comparisons). In order to demonstrate viability of the pipeline to average samples
accurately over multiple time points, we will compare the T0 (initial) average of our 10
non-homogenous samples to their corresponding T4 (4 week) average. No treatment or
change was expected as this sample was not undergoing treatment or notable physiologic
change. This comparison will be validated with a colorized p-map visually showing the
variance among the 32,000 vertices that make up the 3D facial structures. This will
clearly illustrate the significance and accuracy of our average T0 to average T4
superimpositions and serve as a clear proof of methods.
Results
A) 3D Facial Photographic Average
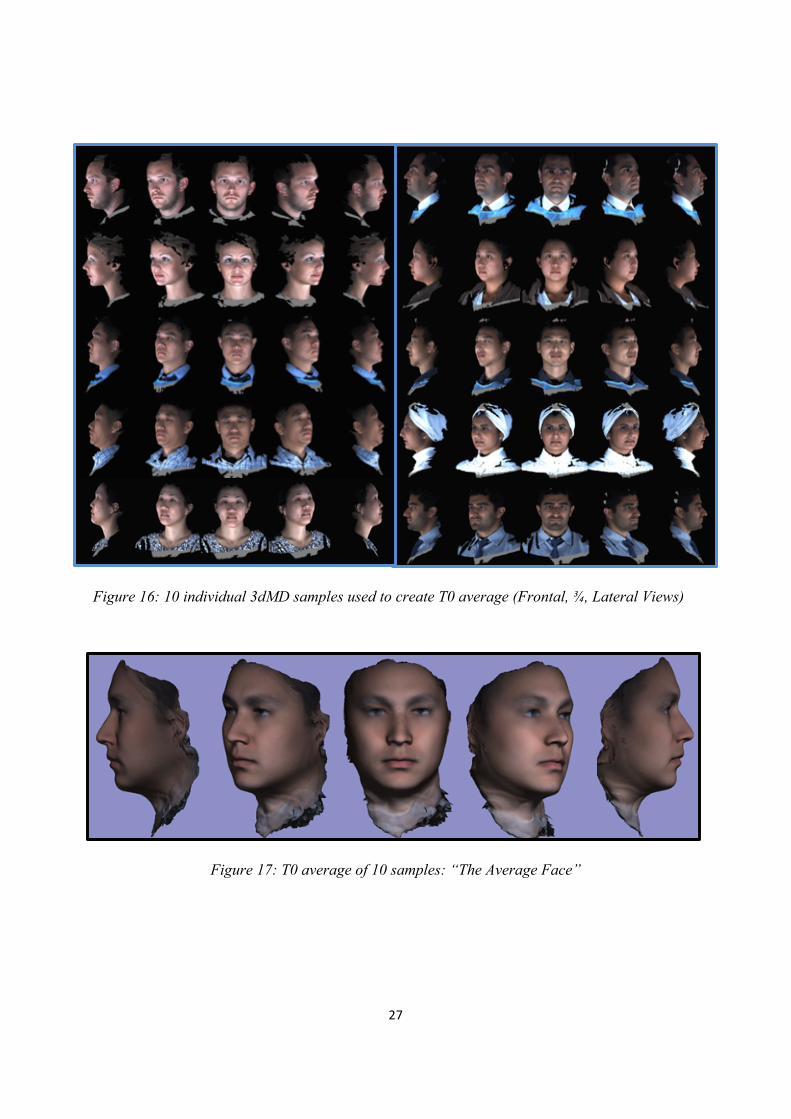
A review of 3dMD clinical records resulted in a decision to use 10 3D photographic
images to demonstrate proof of methods (Figure 16). The sample population consisted of
individuals with varying demographics, including ethnicity, gender, age, and skeletal/dental type.
The purpose of using such a highly diverse sample was to demonstrate the power of these
methods in generating a clean average model even with a population showing high topological
! 25!
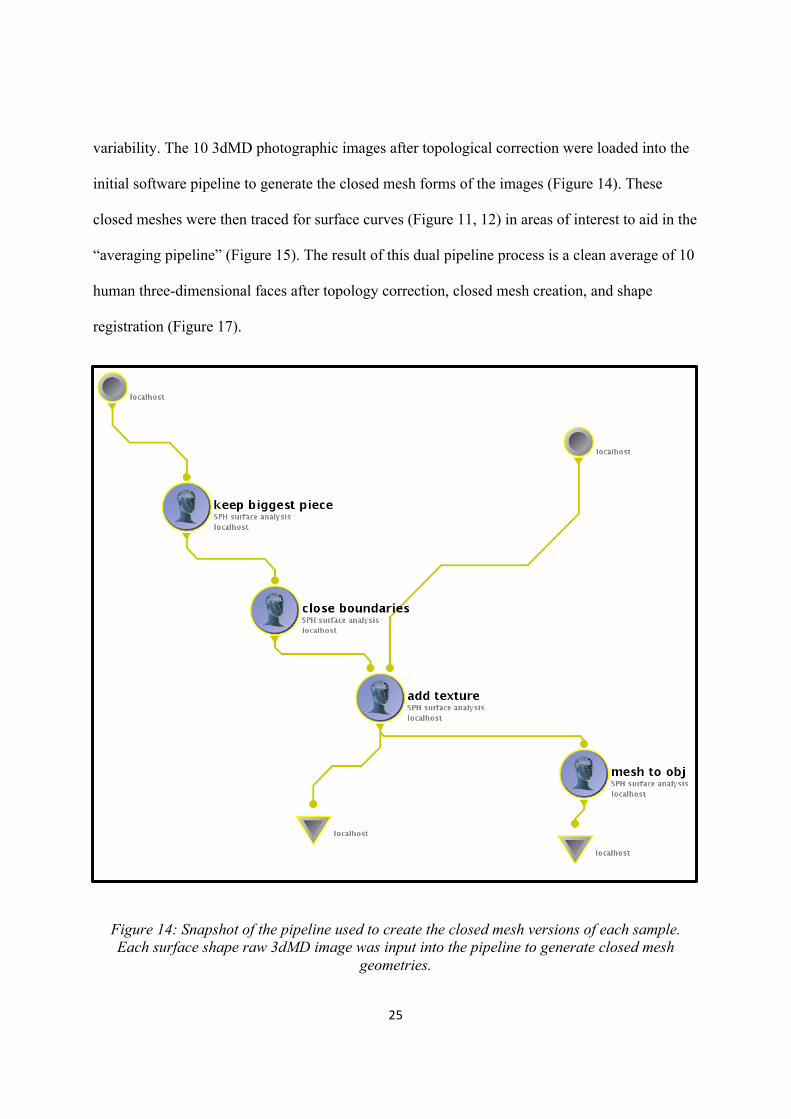
variability. The 10 3dMD photographic images after topological correction were loaded into the
initial software pipeline to generate the closed mesh forms of the images (Figure 14). These
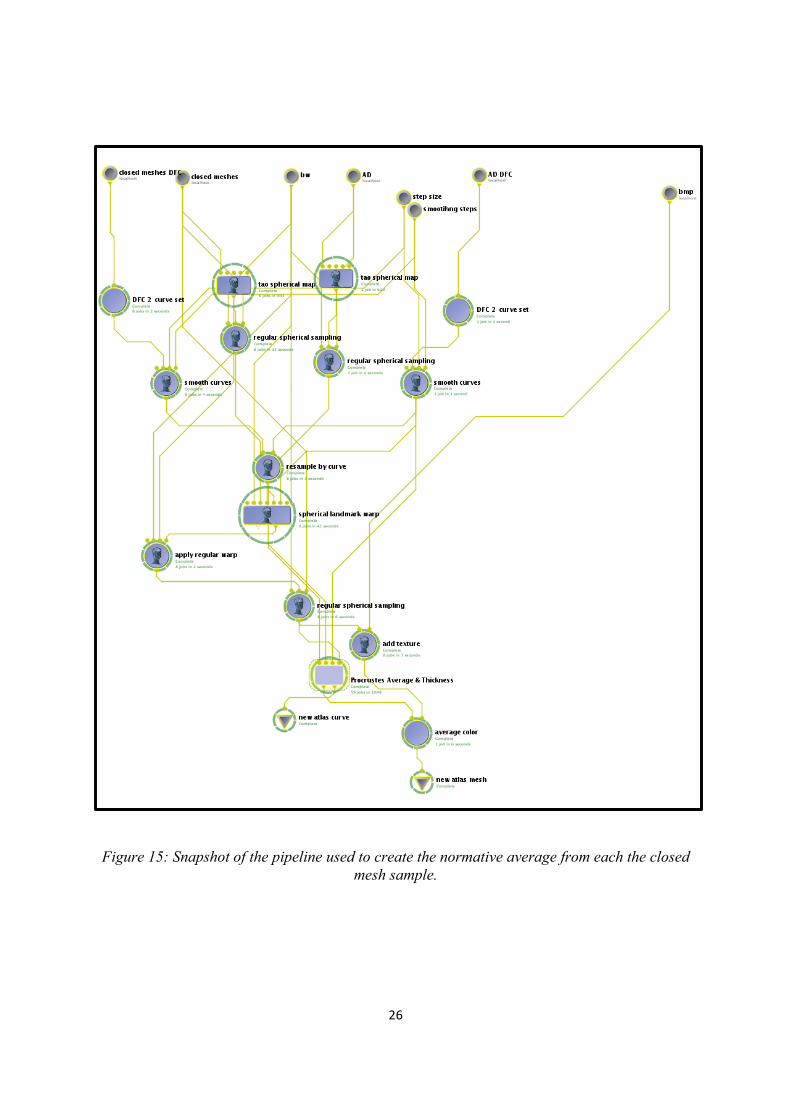
closed meshes were then traced for surface curves (Figure 11, 12) in areas of interest to aid in the
“averaging pipeline” (Figure 15). The result of this dual pipeline process is a clean average of 10
human three-dimensional faces after topology correction, closed mesh creation, and shape
registration (Figure 17).
Figure 14: Snapshot of the pipeline used to create the closed mesh versions of each sample. Each surface shape raw 3dMD image was input into the pipeline to generate closed mesh
geometries.
! 26!
Figure 15: Snapshot of the pipeline used to create the normative average from each the closed mesh sample.
! 27!
Figure 16: 10 individual 3dMD samples used to create T0 average (Frontal, ¾, Lateral Views)
!Figure 17: T0 average of 10 samples: “The Average Face”
!
! 28!
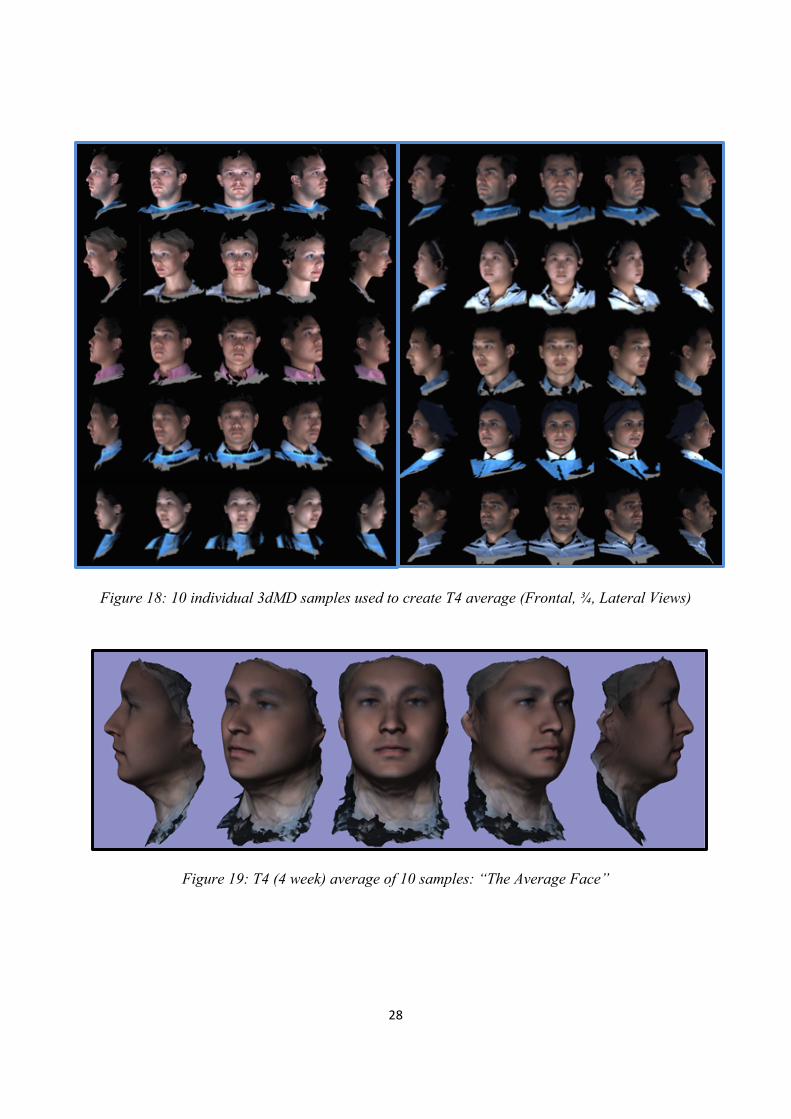
Figure 18: 10 individual 3dMD samples used to create T4 average (Frontal, ¾, Lateral Views)!
!
!Figure 19: T4 (4 week) average of 10 samples: “The Average Face”
!
!
!
! 29!
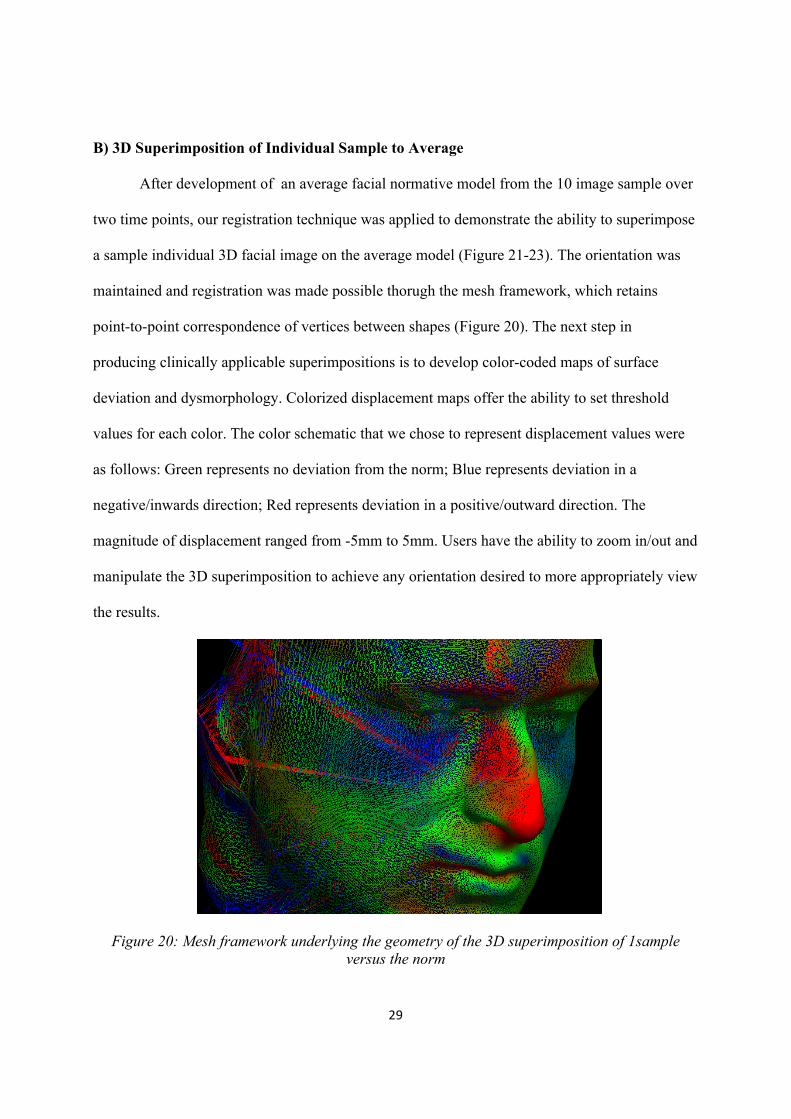
B) 3D Superimposition of Individual Sample to Average
After development of an average facial normative model from the 10 image sample over
two time points, our registration technique was applied to demonstrate the ability to superimpose
a sample individual 3D facial image on the average model (Figure 21-23). The orientation was
maintained and registration was made possible thorugh the mesh framework, which retains
point-to-point correspondence of vertices between shapes (Figure 20). The next step in
producing clinically applicable superimpositions is to develop color-coded maps of surface
deviation and dysmorphology. Colorized displacement maps offer the ability to set threshold
values for each color. The color schematic that we chose to represent displacement values were
as follows: Green represents no deviation from the norm; Blue represents deviation in a
negative/inwards direction; Red represents deviation in a positive/outward direction. The
magnitude of displacement ranged from -5mm to 5mm. Users have the ability to zoom in/out and
manipulate the 3D superimposition to achieve any orientation desired to more appropriately view
the results.
Figure 20: Mesh framework underlying the geometry of the 3D superimposition of 1sample
versus the norm
! 30!
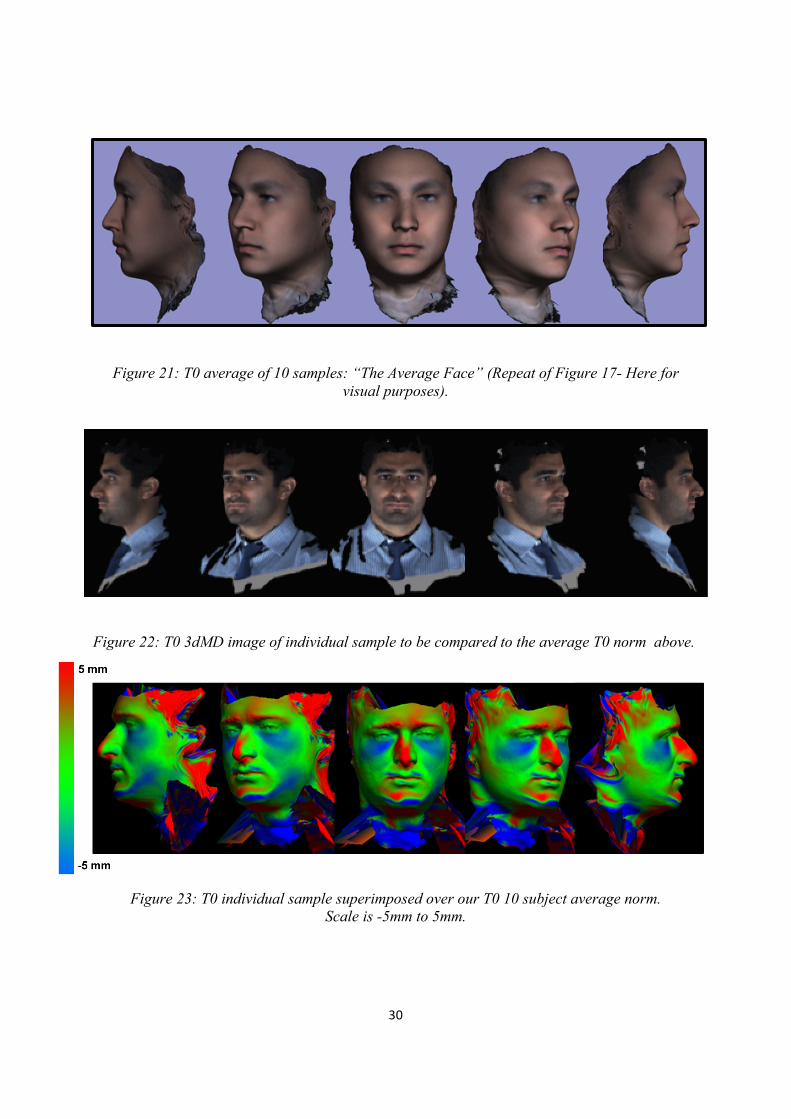
!
Figure 21: T0 average of 10 samples: “The Average Face” (Repeat of Figure 17- Here for visual purposes).
!
Figure 22: T0 3dMD image of individual sample to be compared to the average T0 norm above.!!
Figure 23: T0 individual sample superimposed over our T0 10 subject average norm. Scale is -5mm to 5mm.
!
! 31!
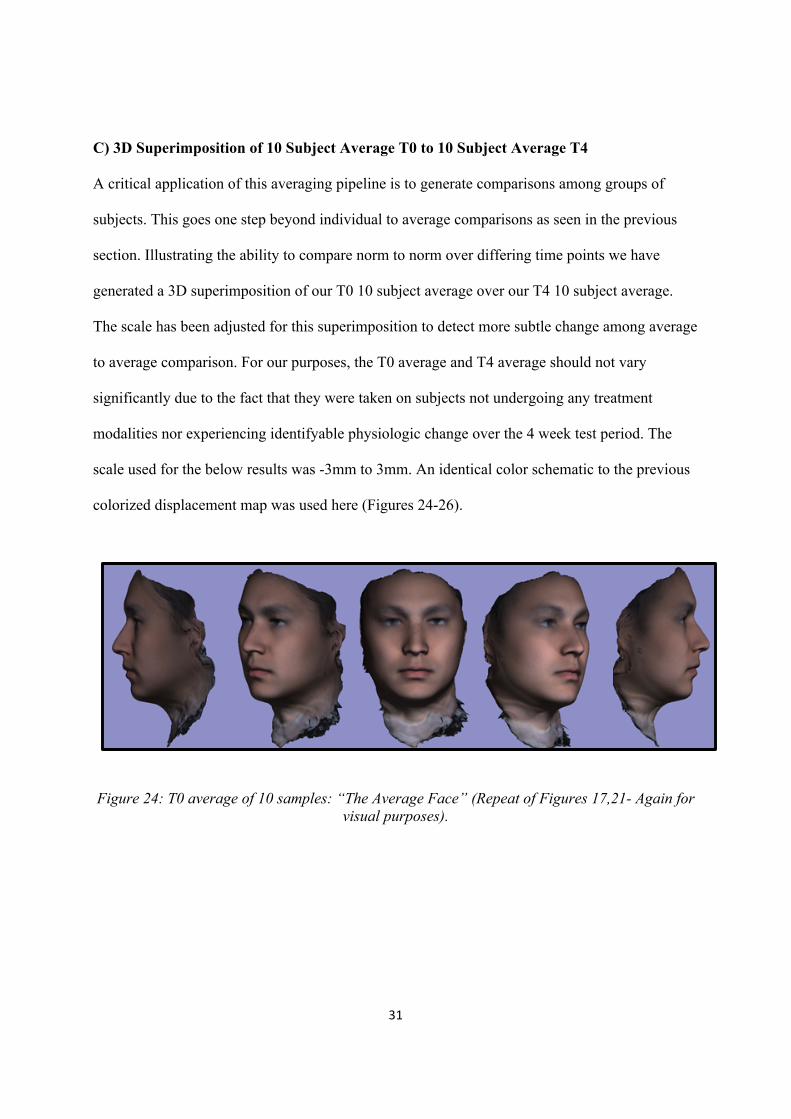
C) 3D Superimposition of 10 Subject Average T0 to 10 Subject Average T4
A critical application of this averaging pipeline is to generate comparisons among groups of
subjects. This goes one step beyond individual to average comparisons as seen in the previous
section. Illustrating the ability to compare norm to norm over differing time points we have
generated a 3D superimposition of our T0 10 subject average over our T4 10 subject average.
The scale has been adjusted for this superimposition to detect more subtle change among average
to average comparison. For our purposes, the T0 average and T4 average should not vary
significantly due to the fact that they were taken on subjects not undergoing any treatment
modalities nor experiencing identifyable physiologic change over the 4 week test period. The
scale used for the below results was -3mm to 3mm. An identical color schematic to the previous
colorized displacement map was used here (Figures 24-26).
Figure 24: T0 average of 10 samples: “The Average Face” (Repeat of Figures 17,21- Again for visual purposes).
! 32!
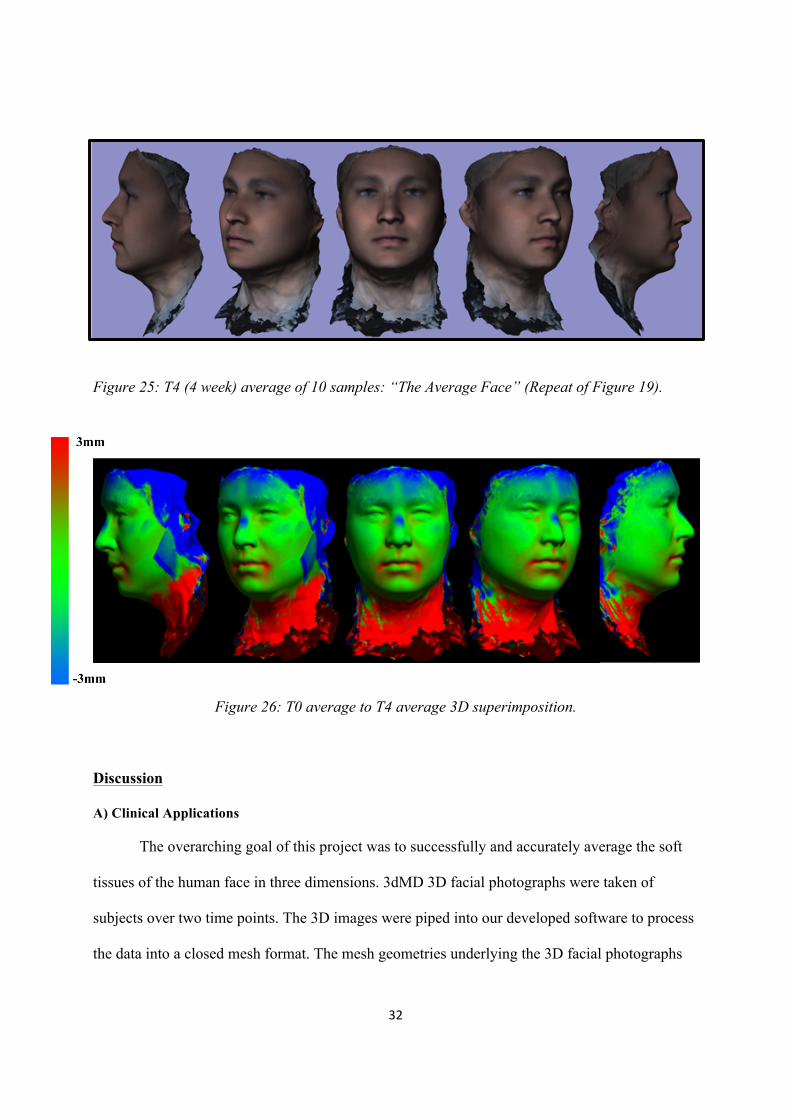
Figure 25: T4 (4 week) average of 10 samples: “The Average Face” (Repeat of Figure 19).
!
Figure 26: T0 average to T4 average 3D superimposition.
Discussion
A) Clinical Applications
The overarching goal of this project was to successfully and accurately average the soft
tissues of the human face in three dimensions. 3dMD 3D facial photographs were taken of
subjects over two time points. The 3D images were piped into our developed software to process
the data into a closed mesh format. The mesh geometries underlying the 3D facial photographs
! 33!
were topologically corrected to create a more continuous three dimensional mesh structure.
Surface curves were traced using Brainsuite 14a software to identify areas of interest for the
registration process. The geometries were then mapped to a sphere and aligned/registered to
create an overall multi-subject average.
Creation of a true three dimensional average of the human face opens the doors to a
variety of significant and novel applications. An immediate application of the basic average of a
specific inclusion of samples may yield normative data for a specific demographic. This could be
applied to anthropologic and genetic sciences. The ability to compare an individual to a
generated average yields further potential to compare individual subjects against groups to
determine detailed deviation and dysmorphology. This would prove to be invaluable in
medical/dental specialties to determine appropriate treatment for correction of facial deviation
from the norm.
One can imagine that comparison of norms at different time points could prove quite
useful and informative when dealing with various aspects of longitudinal change. Examples
include but are not limited to orthodontic treatment, plastic/ maxillofacial surgical outcomes,
longitudinal change with aging, and data collection for surgical simulations. Comparisons using
this technology can be made on a macro scale involving large populations and ethnicities.
Acquisition of this data poses no risk to the patient of any kind and given one 3D photographic
imaging machine allows acquisition of unlimited images relying only on digital storage capacity.
The impact to orthodontics will be speedy quantitative 3D comparison of patients relative
to their 3-dimensional norms in diagnostics and treatment planning. Various research
opportunities will arise as a direct result of our project as 3-dimensional normative soft tissue
data using our pipeline can be readily generated for ethnic, race, and gender specific populations.
! 34!
The immediate objective leading to possible future publication seeks to demonstrate our
project’s impact to clinical orthodontics. We will follow patients over pre-treatment and post-
treatment time points. We will generate a norm for the samples and create a colorized
displacement map comparing the average norm pre-treatment in contrast with post-treatment.
The methodologies described previously will intake individual 3-dimensional photographic
patient records and output a generated average with quantifiable data allowing visualization and
verification of treatment outcomes in the orthodontic profession.
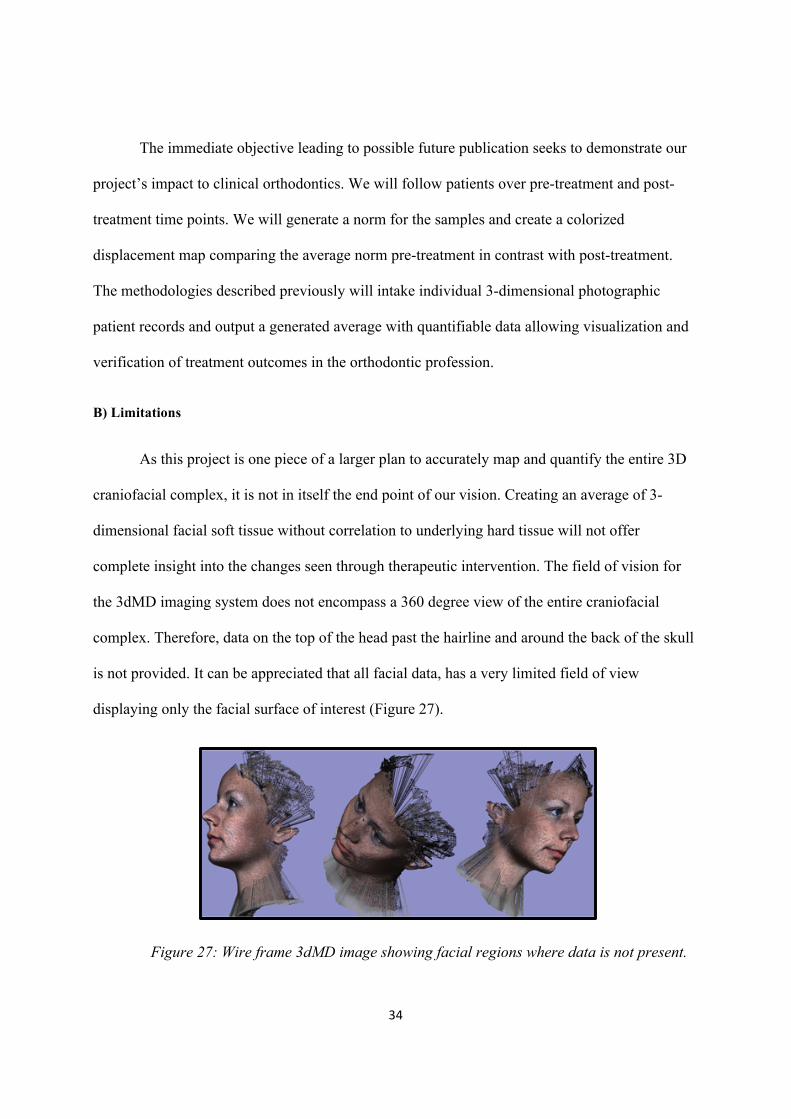
B) Limitations
As this project is one piece of a larger plan to accurately map and quantify the entire 3D
craniofacial complex, it is not in itself the end point of our vision. Creating an average of 3-
dimensional facial soft tissue without correlation to underlying hard tissue will not offer
complete insight into the changes seen through therapeutic intervention. The field of vision for
the 3dMD imaging system does not encompass a 360 degree view of the entire craniofacial
complex. Therefore, data on the top of the head past the hairline and around the back of the skull
is not provided. It can be appreciated that all facial data, has a very limited field of view
displaying only the facial surface of interest (Figure 27).
!!
Figure 27: Wire frame 3dMD image showing facial regions where data is not present.
! 35!
Additional limitations to these methods are the lack of automation of the protocol. Due
the complex intricacies and variations in facial structures, 3D curve tracing is required to allow
the software to recognize specific areas of the facial morphology. Without this manual tracing,
registration of facial geometries would not be consistently aligned. Automation of this process is
possible in the future, but would require considerable investment into the pipeline protocol.
C) Conclusion/ Future Directions
This project will allow for the revisions of existing 2-dimensional norms which are
currently being used to educate the future orthodontists of our generation.
As completion of this project is realized, we will set our sights towards correlation of the
hard and soft tissues of the craniofacial complex. Our anticipated objectives following this
project involve:
1. Overlay of facial soft tissue maintaining color and texture data on their corresponding
skull CBCT data
2. Generate functions to allow comprehensive averaging of multiple skulls with their
corresponding facial soft tissue
3. Create accurate methods to quantify and demonstrate differences in the craniofacial
complex of an individual compared to a norm
4. Allow accurate manipulation of combined hard and soft tissue essentially creating the
most accurate virtual patient known to our profession
We believe that the strength of our investigation is in the application to our profession. A
software pipeline generated to create true and accurate 3D averages of facial soft tissue will
attract interest from orthodontic software corporations. However, the likely impact of our

! 36!
methods may transcend orthodontics. Physical anthropologists and fields of surgery (such as
Plastics and OMFS) would have interest in the information of norms and surface deviations of
individuals which would carry applications to their respective fields.
! 37!
References !
[1]!! M.!G.!Cavalcanti,!S.!S.!Rocha!and!M.!W.!Vannier,!"Craniofacial!measurements!based!on!3DJCT!volume!rendering:!implications!for!clinical!applications.,"!Dentomaxillofacial!Radiology,!vol.!33,!pp.!170J176,!2004.!!
[2]!! J.!Wirthlin,!C.!Kau,!J.!English,!F.!Pan!and!H.!Zhou,!"Comparison!of!facial!morphologies!between!adult!Chinese!and!Houstonian!Caucasian!populations!using!threeJdimensional!imaging,"!Int.!J.!Oral!Maxillofac.!Surg.,!vol.!42,!pp.!1100J1107,!2013.!!
[3]!! N.JK.!Kim,!C.!Lee,!S.JH.!Kang,!J.JW.!Park,!M.JK.!Kim!and!Y.JI.!Chang,!"A!threeJdimensional!analysis!of!soft!and!hard!tissue!changes!after!a!mandibular!setback!surgery.,"!Computer!Methods!and!Programs!in!Biomedicine,!vol.!83,!pp.!178J187,!2006.!!
[4]!! L.!F.!Andrews!and!W.!A.!Andrews,!Syllabus!of!the!Andrews!Orthodontic!Philosophy,!9th!ed.!ed.,!San!Diego,!California:!Lawrence!F.!Andrews,!2001.!!
[5]!! D.!Sarver,!"The!importance!of!incisor!positioning!in!the!esthetic!smile:!the!smile!arc.,"!American!Journal!of!Orthodontics!and!Dentofacial!Orthopedics,!vol.!120,!pp.!98J111,!2001.!!
[6]!! W.!R.!Proffit,!Contemporary!Orthodontics!4/e,!vol.!67,!St.!Louis,!Missouri:!Mosby,!2007,!pp.!125J138.!
[7]!! H.!Gjorup!and!A.!E.!Athanasiou,!"SoftJtissue!and!dentoskeletal!profile!changes!associated!with!mandibular!setback!osteotomy.,"!AJOBDO,!vol.!100,!pp.!312J323,!1991.!!
[8]!! C.!Johnston,!D.!Burden,!D.!Kennedy,!N.!Harradine!and!M.!Stevenson,!"Class!III!surgicalJorthodontic!treatment:!a!cephalometric!study.,"!AJOBDO,!vol.!130,!pp.!300J309,!2006.!!
[9]!! J.!Hu,!D.!Wang!and!Y.!Chen,!"Differences!in!soft!tissue!profile!changes!following!mandibular!setback!in!Chinese!men!and!women.,"!Journal!of!Oral!Maxillofacial!Surgery,!vol.!57,!pp.!1182J1186,!1999.!!
[10]!!A.!Enacar,!T.!Taner!and!S.!Torog!lu,!"Analysis!of!soft!tissue!profile!changes!associated!with!mandibular!setback!and!doubleJjaw!surgeries.,"!International!Journal!of!Adult!Orthodontics!and!Orthognathic!Surgery,!vol.!14,!pp.!27J35,!1999.!!
[11]!!A.!M.!McCance,!J.!P.!Moss,!W.!R.!Fright,!D.!R.!James!and!A.!D.!Linney,!"A!three!dimensional!analysis!of!soft!and!hard!tissue!changes!folJ!lowing!bimaxillary!orthognathic!surgery!in!skeletal!III!patients.,"!British!Journal!of!Oral!Maxillofacial!Surgery,!vol.!30,!pp.!305J312,!1992.!!
! 38!
[12]!!U.!Ozsoy,!B.!Demirel,!F.!B.!Yildirim,!O.!Tosun!and!L.!Sarikcioglu,!"Method!selection!in!craniofacial!measurments:!advantages!and!disadvantages!of!3D!digitization!method.,"!Journal!of!Craniomaxillofacial!Surgery!2009,!vol.!37,!pp.!285J290,!2009.!!
[13]!!H.!Ghoddousi,!R.!Edler,!P.!Haers,!D.!Wertheim!and!D.!Greenhill,!"Comparison!of!three!methods!of!facial!measurement.,"!International!Journal!of!Oral!Maxillofacial!Surgery,!vol.!36,!pp.!250J258,!2007.!!
[14]!!C.!H.!Kau!,!S.!Richmond,!C.!Savio!and!C.!Mallorie,!"Measuring!adult!facial!morphology!in!three!dimensions.,"!Angle!Orthodontics,!vol.!76,!pp.!771J776,!2006.!!
[15]!!D.!M.!Sarver,!W.!R.!Proffit!and!J.!Ackerman,!"Diagnosis!and!treatment!planning!in!orthodontics,"!in!Orthodontics:!current!principles!and!techniques,!R.!Vanarsdall!and!T.!M.!Graber,!Eds.,!St.!Louis,!Mosby,!2000.!!
[16]!!J.!Ackerman!,!W.!R.!Proffit!and!D.!M.!Sarver,!"The!emerging!soft!tissue!paradigm!in!orthodontic!diagnosis!and!treatment!planning.,"!Clin!Orthod!Res!,!vol.!2,!pp.!49J52,!1999.!!
[17]!!L.!Farkas,!Anthropometry!of!the!Head!and!Face!in!Medicine,!New!York:!Elsevier!Science!Publishing!Co.,!1981.!!
[18]!!R.!Vig!and!G.!Brundo,!"Kinetics!of!Anterior!Tooth!Display,"!J!Prosthetic!Dentistry,!vol.!39,!pp.!502J504,!1978.!!
[19]!!C.!H.!Kau,!A.!Zhurov!and!et!al,!"The!3JDimensional!Construction!of!the!Average!11JYearJOld!Child!Face:!A!Clinical!Evaluation!and!Application,"!Journal!Oral!Maxillofacial!Surgery,!vol.!64,!pp.!1086J1092,!2009.!!
[20]!!H.!K.!Chung,!S.!Richmond!and!A.!Zhurov,!"Use!of!3Jdimensional!surface!acquisition!to!study!facial!morphology!in!5!populations.,"!Am!J!Orthod!Dentofacial!Orthop,!vol.!137,!pp.!1J9,!2010.!!
[21]!!Y.!Liu!and!C.!Kau,!"A!3Jdimensional!anthropometric!evaluation!of!facial!morphology!among!Chinese!and!Greek!population,"!The!Journal!of!craniofacial!surgery,!vol.!24,!no.!4,!pp.!353J358,!2013.!!
[22]!!T.!Gor,!K.!H.!Chung,!J.!D.!English,!R.!P.!Lee!and!P.!Borbely,!"ThreeJdimensional!comparison!of!facial!morphology!in!white!populations!in!Budapest,!Hungary,!and!Houston,!Texas,"!American!Journal!of!Orthodontics!and!Dentofacial!Orthopedics,!March!2010.!!
[23]!!R.!McComb,!"An!Exploratory!Approach!for!Mapping!the!Surface!of!the!Human!Skull!in!Three!Dimensions:!Technical!Methods!and!Clinical!Application,"!2012.!!
[24]!!B.!A.!Gutman,!R.!McComb,!J.!Sung,!W.!Moon!and!P.!Thompson,!"Robust!Shape!Correspondence!via!Spherical!Patch!Matching!for!Atlases!of!Partical!Skull!Models,"!Mesh!Processing!in!Medical!Image!
! 39!
Analysis,!vol.!7599,!pp.!89J100,!2012.!!
[25]!!C.!S.!Chiu!and!R.!K.!Clark,!"Reproducibility!of!Natural!Head!Position!in!Standing!Subjects.,"!Journal!of!Dentistry,!vol.!19,!pp.!130J131,!1991.!!
[26]!!B.!Solow!and!A.!Tallgen,!"Natural!head!postition!in!standing!subjects.,"!Acta!Odontol!Scand,!vol.!29,!pp.!591J607,!1971.!!
[27]!!A.!Lundstorm,!F.!Lundstorm,!L.!M.!Lebret!and!C.!F.!Moorrees,!"Natural!Head!Position!and!Natural!Head!Orientation:!Basic!Considerations!in!Cephalometric!Analysis!and!Research,"!European!Jornal!of!Orthodontics,!vol.!17,!pp.!111J120,!1995.!!
[28]!!G.!Troy,!H.!K.!Chung,!J.!D.!English,!R.!P.!Lee!and!P.!Borbelye,!"ThreeJdimensional!comparison!of!facial!morphology!in!white!populations!in!Budapest,!Hungary,!and!Houston,!Texas,"!AJOBDO!,!vol.!137,!no.!3,!pp.!424J433,!2010.!!
[29]!!H.!K.!Chung,!S.!Richmond,!A.!I.!Zhurov,!J.!Knox,!I.!Chestnutt,!F.!Hartles!and!R.!Playle,!"Reliability!of!measuring!facial!morphology!with!a!3Jdimensional!laser!scanning!system.,"!American!Journal!of!Orthodontics!and!Dentofacial!Orthopedics,!vol.!128,!no.!4,!pp.!424J431,!2005.!!
[30]!!P.!Thompson!and!et!al,!"Mapping!cortical!change!in!Alzheimer's!disease,!brain!development,!and!schizophrenia.,"!Neuroimage!,!vol.!23,!no.!Suppl!1,!pp.!S2J18,!2004.!!
[31]!!Y.!Shi!and!et!al,!"InverseJconsistent!surface!mapping!with!LapaceJBeltrami!eigenJfeatures.,"!Inf!Process!Med!Imaging,!vol.!21,!pp.!476J478,!2009.!!
[32]!!M.!Styner!and!et!al,!"Framework!for!the!Statistical!Shape!Analysis!of!Brain!Structures!Using!SHARMJPDM.,"!Insight!J,!vol.!1071,!pp.!242J250,!2006.!!
[33]!!B.!Fischl!and!et!al,!"HighJresolution!intersubject!averaging!and!a!coordinate!system!for!the!cortical!surface.,"!Hum!Brain!Mapp,!vol.!8,!no.!4,!pp.!272J284,!1999.!!
[34]!!Y.!Saad,!"Iterative!methods!for!sparse!linear!systems,"!Siam,!2003.!!
[35]!!I.!P.!Friedel,!P.!Schroeder!and!M.!Desbrun,!Unconstrained!spherical!parameterization!in!ACM!SIGGRAPH,!Los!Angeles:!ACM,!2005.!!
[36]!!B.!Gutman,!W.!Chan,!P.!Thompson!and!A.!Toga,!"Shape!Registration!with!Shperical!Cross!Correlations,"!Mathematical!Foundations!of!Computational!Anatomy,!pp.!56J67,!2008.!!
[37]!!B.!T.!YEO!and!et!al,!"Spherical!demons:Fast!diffeomorphic!landmarkJfree!surface!registration,"!IEEE!Trans!Med!Imaging,!vol.!29,!no.!3,!pp.!650J658,!2010.!!
! 40!
[38]!!E.!D'Agostino!and!et!al,!"A!viscous!fluid!model!for!multimodal!nonJrigid!image!registration!using!mutual!information.,"!Medical!Image!Analysis,!vol.!7,!no.!4,!pp.!565J575,!2003.!!
[39]!!B.!Gutman!and!et!al,!"A!family!of!fast!Spherical!registration!algorithms!for!cortical!shapes,"!Multimodal!Brain!Image!Analysis,!2013.!!
[40]!!R.!Everson,!"Orthogonal,!but!not!Orthonormal!Procrustes!Problems,"!Advances!in!Comptutations!Mathematics,!1997.!!
[41]!!Y.!Wang!and!et!al,!"SurfaceJBased!TBM!Boosts!Power!to!Detect!Disease!Effecs!on!the!Brain:!an!N=804!ADNI!Study,"!Neuroimage,!vol.!56,!no.!4,!pp.!1993J2010,!2011.!!
[42]!!P.!M.!Thompson!and!a.!et,!"Mapping!Hippocampal!and!Ventricular!Change!in!Alzheimer!Disease,"!Neuroimage,!vol.!22,!no.!4,!pp.!1754J1766,!2004.!!
[43]!!A.!Jacobson,!"The!Wits!Appraisal!of!Jaw!Disharmony,"!American!Journal!of!Orthodontics,!vol.!67,!pp.!125J138,!1975.!!
[44]!!C.!H.!Kau,!L.!M.!Hunter!and!E.!J.!Hingston,!"A!different!look:!3JdimenJ!sional!facial!imaging!of!a!child!with!Binder!syndrome.,"!American!Journal!of!Orthodontics!and!Dentofacial!Orthopedics,!vol.!132,!pp.!704J709,!2007.!!
[45]!!K.!Aldridge,!S.!A.!Boyadjiev,!G.!T.!Capone,!V.!B.!DeLeon!and!J.!T.!Richtmeier,!"Precision!and!error!of!threeJdimensional!phenoJ!typic!measures!acquired!from!3dMD!photogrammetric!images.,"!Am!J!Med!Genet!A,!vol.!138A,!pp.!247J253,!2005.!!
[46]!!C.!H.!Kau,!A.!Zhurov,!S.!Richmond,!A.!Cronin,!C.!Savio!and!C.!Mallorie,!"Precision!and!error!of!threeJdimensional!phenoJ!typic!measures!acquired!from!3dMD!photogrammetric!images.,"!Orthod!Cranio!Res,!vol.!9,!pp.!10J17,!2006.!!
[47]!!R.!Everson,!"Orthogonal,!but!not!orthonormal,!Procrustes!problems,"!Advances!in!Computational!Mathematics,!1998.!!
!
!
Related Documents