5/8/2008 1 Dr. Amitha Hewavitharana University of Queensland Ph: 07 3365 8853 E-mail: [email protected] 1 In a mass spectrometer -The chemical substance undergo ionization to produce charged particles (ions – in the gas phase) -Then the mass of the charged ions are measured using electrical and/or magnetic fields Mass spectrometers are used for - characterization of unknown compounds, - quantitative analysis of known compounds (detection of very small quantities of material-10 -12 g) 2 Example: H 2 O Total mass of a water molecule is mass of two hydrogens (approx. I Da per hydrogen) and one oxygen (approx. 16 Da per oxygen). Total = 18 Da If we put some water vapour into the high vacuum chamber of a mass spectrometer and pass a beam of electrons through the water vapour, some of the electrons will hit the water molecules and remove an electron → [H 2 O] + Ions are produced…….compound must be ionised 3 Some of the collisions will produce other ions and fragments. Generally, for water, the only fragments are [OH] + , O + and H + . The mass spectrum of water will show peaks that can be assigned to masses of 1 – H + , 16 -O + , 17 – [OH] +, 18 – [H 2 O] + The "mass-to-charge" ratio (m/z) of an ion is the mass of the ion divided by the charge on the ion. 4 Relative Intensity 0 100 m/z 20 0 5 MS Instrumentation Mass Spectrometer INLET SYSTEM ION SOURCE: form gas-phase ions from sample, ANALYSER: separate ions based on their mass-to-charge ratio (m/z), DETECTOR: measure the abundance of the ions according to m/z. DATA OUTPUT: mass spectrum m/z Relative abundance 6 Ionisation Molecules gain or lose electrons such that they acquire a positive or negative charge ionisation process can produce molecular ion: same molecular weight and elemental composition of the starting analyte fragment ion: corresponds to smaller piece of the analyte molecule Common molecular ion products of ionisation Molecular ions (“parent ions”) M + or M - Protonated molecules [M + H] + Simple adduct ions [M + Na] + Different ionisation techniques depending on chemical & physical properties of molecule of interest

Welcome message from author
This document is posted to help you gain knowledge. Please leave a comment to let me know what you think about it! Share it to your friends and learn new things together.
Transcript

5/8/2008
1
Dr. Amitha HewavitharanaUniversity of Queensland
Ph: 07 3365 8853E-mail: [email protected]
1
In a mass spectrometer
-The chemical substance undergo ionization to produce charged particles (ions – in the gas phase)
-Then the mass of the charged ions are measured using electrical and/or magnetic fields
Mass spectrometers are used for
- characterization of unknown compounds,
- quantitative analysis of known compounds
(detection of very small quantities of material-10-12g)
2
Example:H2O
Total mass of a water molecule is mass of two hydrogens (approx. I Da per hydrogen) and one oxygen (approx. 16 Da per oxygen). Total = 18 Da
If we put some water vapour into the high vacuum chamber of a mass spectrometer and pass a beam of electrons through the water vapour, some of the electrons will hit the water molecules and remove an electron → [H2O]+
Ions are produced…….compound must be ionised
3
Some of the collisions will produce other ions and fragments. Generally, for water, the only fragments are [OH]+, O+ and H+.
The mass spectrum of water will show peaks that can be assigned to masses of 1 – H+, 16 - O+, 17 –[OH]+, 18 – [H2O]+
The "mass-to-charge" ratio (m/z) of an ion is the mass of the ion divided by the charge on the ion.
4R
ela
tive
In
ten
sity
0
100
m/z 200
5
MS Instrumentation Mass Spectrometer
INLET SYSTEM
ION SOURCE: form gas-phase ions from sample,
ANALYSER: separate ions based on their mass-to-charge ratio (m/z),
DETECTOR: measure the abundance of the ions according to m/z.
DATA OUTPUT: mass spectrum
m/z
Rela
tive a
bundance
6
Ionisation Molecules gain or lose electrons such that they acquire a
positive or negative charge
ionisation process can produce
molecular ion: same molecular weight and elemental composition of the starting analyte
fragment ion: corresponds to smaller piece of the analyte molecule
Common molecular ion products of ionisation
Molecular ions (“parent ions”) M+ or M-
Protonated molecules [M + H]+
Simple adduct ions [M + Na]+
Different ionisation techniques depending on chemical & physical properties of molecule of interest
5/8/2008
2
Ionisation Range of methods are used:
Electron Impact Ionisation (EI)-(also known as Electron Bombardment and Electron Ionisation)
Electrospray Ionisation (ESI)
Atmospheric Pressure Chemical Ionisation (APCI)
Fast Atom Bombardment (FAB)
Matrix Assisted Laser Desorption Ionisation (MALDI)
Inductively Coupled Plasma (ICP)
Look at four in more detail
7
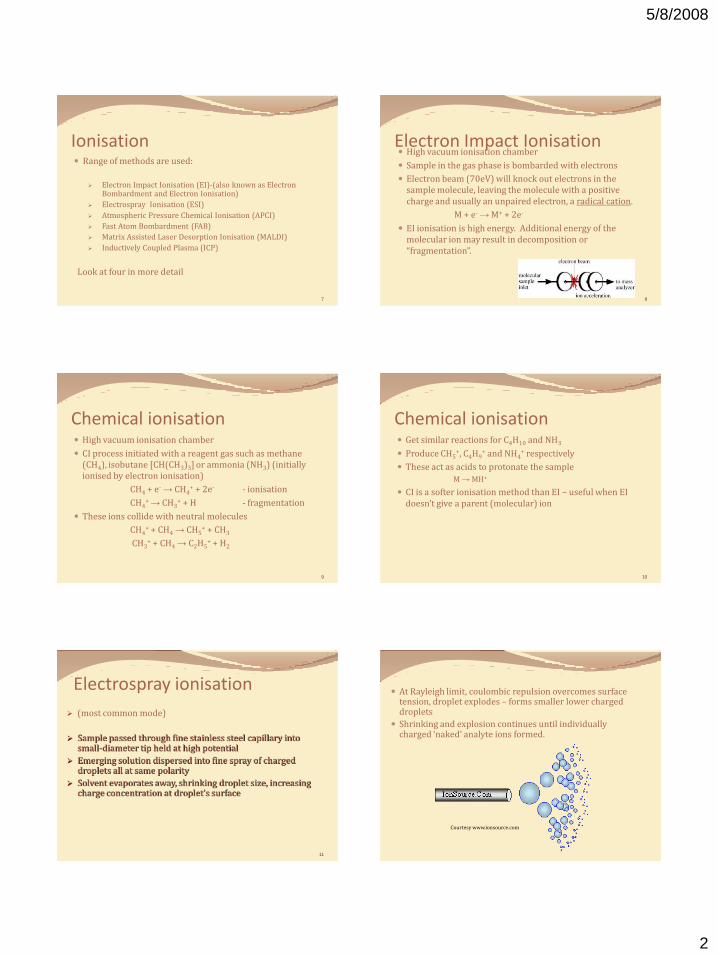
Electron Impact Ionisation High vacuum ionisation chamber
Sample in the gas phase is bombarded with electrons
Electron beam (70eV) will knock out electrons in the sample molecule, leaving the molecule with a positive charge and usually an unpaired electron, a radical cation.
M + e- →M+ + 2e-
EI ionisation is high energy. Additional energy of the molecular ion may result in decomposition or “fragmentation”.
8
Chemical ionisation High vacuum ionisation chamber
CI process initiated with a reagent gas such as methane (CH4), isobutane [CH(CH3)3] or ammonia (NH3) (initially ionised by electron ionisation)
CH4 + e- → CH4+ + 2e- - ionisation
CH4+ → CH3
+ + H - fragmentation
These ions collide with neutral molecules
CH4+ + CH4 → CH5
+ + CH3
CH3+ + CH4 → C2H5
+ + H2
9
Chemical ionisation Get similar reactions for C4H10 and NH3
Produce CH5+, C4H9
+ and NH4+ respectively
These act as acids to protonate the sample
M → MH+
CI is a softer ionisation method than EI – useful when EI doesn’t give a parent (molecular) ion
10
Electrospray ionisation
(most common mode)
Sample passed through fine stainless steel capillary into small-diameter tip held at high potential
Emerging solution dispersed into fine spray of charged droplets all at same polarity
Solvent evaporates away, shrinking droplet size, increasing charge concentration at droplet’s surface
11
Courtesy www.ionsource.com
At Rayleigh limit, coulombic repulsion overcomes surface tension, droplet explodes – forms smaller lower charged droplets
Shrinking and explosion continues until individually charged ‘naked’ analyte ions formed.

5/8/2008
3
Electrospray ionisation This is the softest ionisation method, normally no
fragmentation occurs
Multiply charged ions are often formed for large molecules – hence useful for large proteins and DNA molecules
m/z = [M + H]+ = mass +1
[M + 2H]2+ = mass + 2
2
13
MALDI Matrix Assisted Laser Desorption/Ionisation sample mixed with a matrix material which absorbs laser light
strongly. mixture spotted onto metal (or polymer) plate allowed to dry. sample molecules become incorporated into the crystallized
matrix. plate inserted into the sample target region of the mass
spectrometer under high vacuum matrix/sample spot bombarded with pulsed laser beam laser excitation results in localized sublimation of portions of the
matrix/sample spot, Matrix absorbs laser pulse energy transferred to sample Desorption of gaseous plume of matrix and sample ions.
Mass Analysers Following ionisation, ions in the gas phase enter
the mass analyser.
Separates ions on the basis of their mass/charge ratio.
Ions are separated by magnetic fields, electric fields or by the time taken by the ion to travel a fixed distance
15
Analysers Measure mass-to-charge ratio rather than mass alone
Different types:
Time-of-flight
Ion trap
quadrupole mass filters
magnetic sectors
Fourier transform ion cyclotron resonance spectrometers
Time-of-flight analyser Electric field in source extracts and accelerates the ions Accelerated ions (with same kinetic energy) pass into field-free drift
tubeKinetic energy = ½mv2
The lower the mass, the greater the velocity and the shorter the flight time
Ions separated in time and collected by the detector. Travel time converted into m/z value
17
Quadrupole Analyser Uses two electric fields
applied at 90 to separate ions
One field is DC, the other is AC oscillating at radiofrequency
Effect of the two fields is to produce a resonance frequency for each m/zvalue.
Ions which resonate can pass through and be detected.
18
From
http://elchem.kaist.ac.kr/vt/chem-ed/ms/quadrupo.htm

5/8/2008
4
Ion trap analyser Consist of 3 electrodes
Ring electrode
Entrance endcap electrode
Exit endcap electrode
Form cavity to trap ions
Ions enter trap through inlet focusing system
Various voltages applied to trap and eject ions according to m/z values
Magnetic Sector Analyser Ions are accelerated (electric field) and pass into a
magnetic field.
Charged particle travelling through a magnetic field will experience a force and tend to travel in a circular motion depending on the m/z and speed of the ion.
Only ions of a particular m/zwill reach the detector at a particular magnetic field
20
From
http://elchem.kaist.ac.kr/vt/chem-ed/ms/quadrupo.htm
Mass Spectrometer
21
=>http://faculty.smu.edu/ebiehl/Wade12.ppt#290,35,Mass Spectrometer
Detectors
allows mass spectrometer to generate a signal current from ions by generating secondary electrons, which are further amplified
Electron multiplier
Photomultiplier
Detector Ion detector allows a mass spectrometer to generate a
signal current from incident ions
Ions generate secondary electrons which are then further amplified
23
From: http://masspec.scripps.edu
Electron multiplier and the cascade of electrons
that results in a factor of one million fold signal
amplification
Faraday cup converts the striking
ion into a current
Summary
Sample must be volatilised before analysis
Ions are formed using several techniques (EI, CI, Electrospray) – may produce fragments (also ionised)
Ions are accelerated in high vacuum using electric fields
Ions are deflected (analysed) using either magnetic or electrical fields
24
5/8/2008
5
Combinations of technologies: MALDI-TOF-MS ESI-ion trap-MS (QTrap) ESI-triple Q-MS (Tandem MS) – most comon ESI-Q-TOF-MS
Analysis:
select single ions/fragments(Q) (SI monitoring, SIM)
MRM (multiple reaction monitoring):
Q1 filters the analyte mass (= precursor ion)
Q2 fragments this mass
Q3 filters the mass of one of its fragments (= product ion)
26
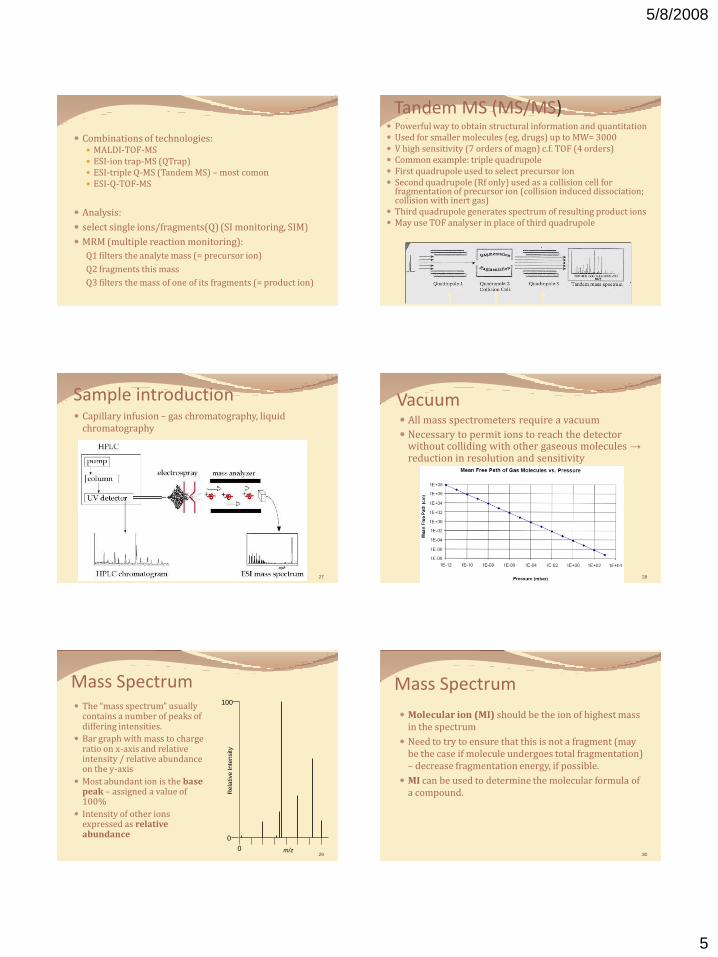
Tandem MS (MS/MS) Powerful way to obtain structural information and quantitation Used for smaller molecules (eg, drugs) up to MW= 3000 V high sensitivity (7 orders of magn) c.f. TOF (4 orders) Common example: triple quadrupole First quadrupole used to select precursor ion Second quadrupole (Rf only) used as a collision cell for
fragmentation of precursor ion (collision induced dissociation; collision with inert gas)
Third quadrupole generates spectrum of resulting product ions May use TOF analyser in place of third quadrupole
Sample introduction Capillary infusion – gas chromatography, liquid
chromatography
27
Vacuum All mass spectrometers require a vacuum
Necessary to permit ions to reach the detector without colliding with other gaseous molecules →reduction in resolution and sensitivity
28
Mass Spectrum The “mass spectrum” usually
contains a number of peaks of differing intensities.
Bar graph with mass to charge ratio on x-axis and relative intensity / relative abundance on the y-axis
Most abundant ion is the base peak – assigned a value of 100%
Intensity of other ions expressed as relative abundance
29
Re
lative
In
ten
sity
0
100
m/z0
Mass Spectrum
Molecular ion (MI) should be the ion of highest mass in the spectrum
Need to try to ensure that this is not a fragment (may be the case if molecule undergoes total fragmentation) – decrease fragmentation energy, if possible.
MI can be used to determine the molecular formula of a compound.
30

5/8/2008
6
Mass SpectrumMasses are graphed or tabulated according to their relative abundance.
31
Mass Spectrum - Isotopes
A chemically pure sample will produce a mass spectrum with a mixture of ions
The elements are often not isotopically pure
Exact masses are not integers due to the slight mass difference between a proton (1.67262 x 10⁻²⁷kg) and a neutron (1.67493 x 10-
27kg and the fact that electrons have mass (9.10956 x 10⁻³¹kg)
32
Isotopes Many elements with heavier isotopes of
appreciable abundance
MI and fragments are accompanied by a cluster of peaks – low abundance and higher mass
Useful for providing information
Classification
A – atoms with only one natural isotope e.g. F, P, I
A+1 – atoms with isotopes 1 mass unit higher e,g. C, H, N
A+2 – atoms with isotopes 2 mass units higher e.g. Cl, Br, O, S
33
Isotopes – A+1 elements
13C is most useful
Abundance is small but the greater the number of C atoms the greater is the probability of a 13C
e.g. For CH4 (m/z 16) the 13C isotope at m/z 17 is about 1.1% of the 12C intensity
For a larger hydrocarbon (e.g. C30H62) the contribution is much greater.
Ratio of M+1/M gives an estimate of number of carbons – M+1 peak will be 1.1% of the parent for every carbon atom
34
Isotopes – A+2 elements Easier to recognise due to higher abundance of
ions for Br, Cl and S → characteristic patterns
Prediction should be easier
e.g. HCl is a 3:1 mixture of H35Cl at m/z 36 and H37Cl at m/z 38
A+2 isotope clusters
can provide information
about presence of
halogens
35
Isotopes – A+2 elements
e.g. CH3Cl Molecular ion peaks
Mol Wt Predicted
abundance
35Cl-12CH3 50 10035Cl-13CH3 51 1.137Cl-12CH3 52 32.5
37Cl-13CH3 53 0.4
36
Re
lative
In
ten
sity
0
100
50 51 52 53
5/8/2008
7
Examples
37
Examples
38
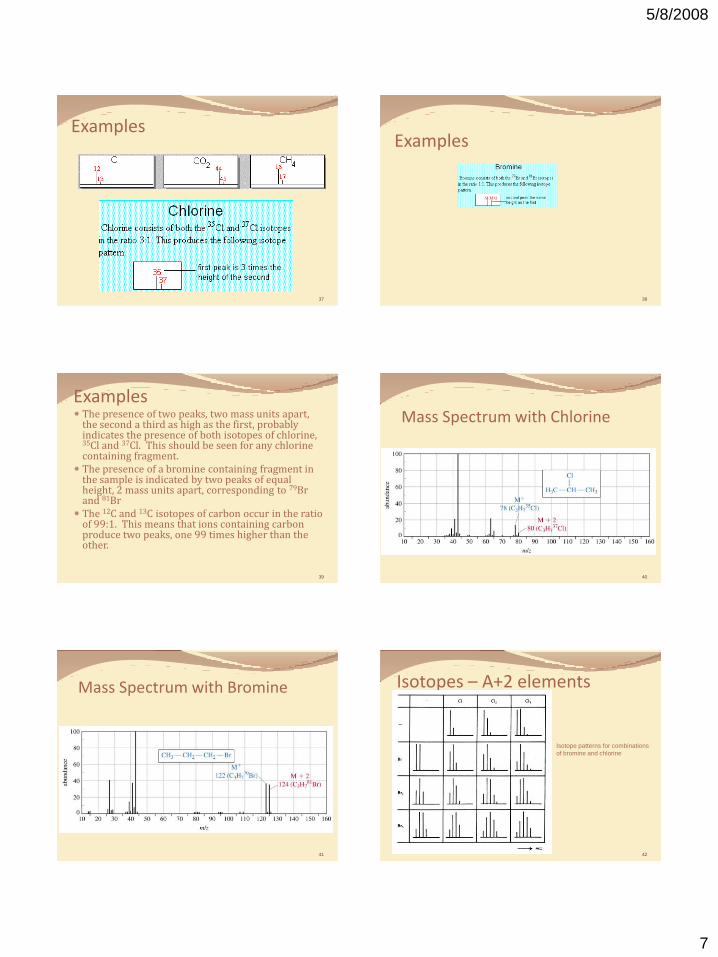
Examples The presence of two peaks, two mass units apart,
the second a third as high as the first, probably indicates the presence of both isotopes of chlorine, 35Cl and 37Cl. This should be seen for any chlorine containing fragment.
The presence of a bromine containing fragment in the sample is indicated by two peaks of equal height, 2 mass units apart, corresponding to 79Br and 81Br
The 12C and 13C isotopes of carbon occur in the ratio of 99:1. This means that ions containing carbon produce two peaks, one 99 times higher than the other.
39
Mass Spectrum with Chlorine
40
Mass Spectrum with Bromine
41
Isotopes – A+2 elements
42
Isotope patterns for combinations
of bromine and chlorine
5/8/2008
8
Isotopes – unknown compounds Mass spectra and isotope distribution gives information on
elemental composition
Molecular ion:
M (monoisotopic ion) – where all elements are of “lowest isotope”
M+1 from the +1 isotope of one A+1 element
M+2 from the +2 isotope of one A+2 element or from two +1 isotopes of A+1 elements
M+3…….
Can get overlap of different isotope combinations and also overlap from other ions e.g. loss of hydrogen radical →M-1; fragment may then overlap with the M and M+1
43
Fragmentation Electron impact (EI)
Molecule is bombarded with highly energetic electrons –knock weakly bound electrons out of molecule
→ radical cation: an unpaired electron and a positive charge
Usually not a bonding electron – therefore likely from a lone pair
e.g. NH3 →NH3+
Ketone → R2C=O+
Unknown molecule → Radical cation → Radical + cation
M → M+ → X + Y+
↑ ↑
not detectable detectable
44
Examples – EI fragmentation
O
45
Largest peak – base peak is at 43
Peak at 58 (50%)
Highest mass at 114 – molecular ion (C7H14O)
Pheromone is heptan-2-one
From: Organic Chemistry (Clayden et al.)
Examples – EI fragmentation
46
C7H14O
Main fragmentation is to a C5H11.
radical (not observed as it isn’t charged)
and a cation C2H3O+, which forms the base peak.
From: Organic Chemistry (Clayden et al.)
Examples – EI fragmentation
Br
N
O
47
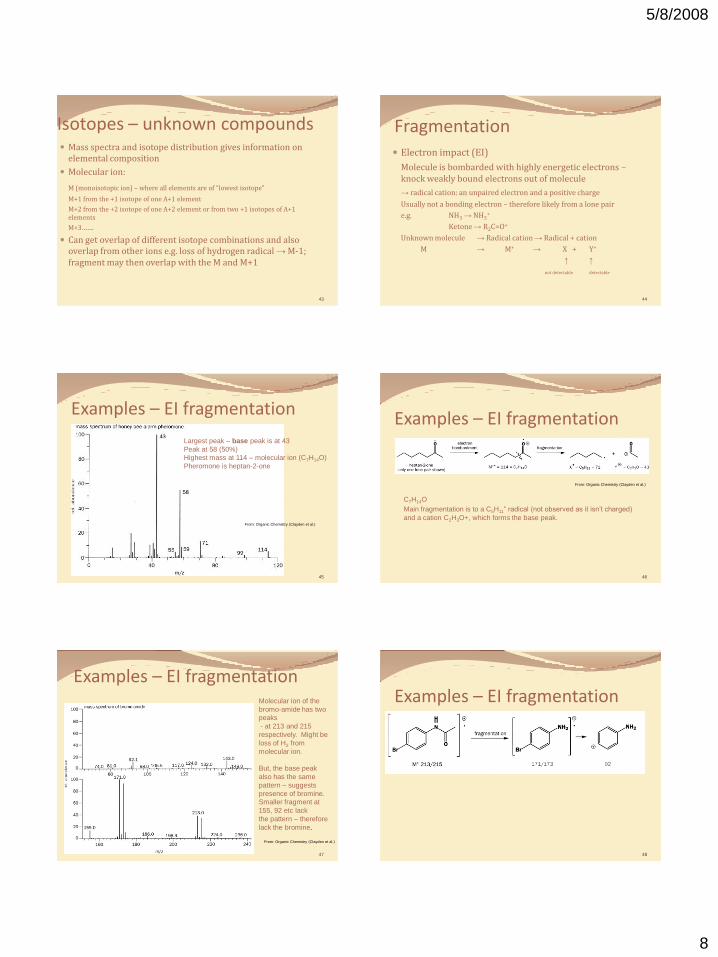
Molecular ion of the
bromo-amide has two
peaks
- at 213 and 215
respectively. Might be
loss of H2 from
molecular ion.
But, the base peak
also has the same
pattern – suggests
presence of bromine.
Smaller fragment at
155, 92 etc lack
the pattern – therefore
lack the bromine.
From: Organic Chemistry (Clayden et al.)
Examples – EI fragmentation
48

5/8/2008
9
Fragmentation
49
Chloroquine:
A: EI mass spectrum – double molecular ion peak at 319 and 321 – arises
from the presence of chlorine.
B: CI mass spectrum – little or no fragmentation – double molecular ion
peak at 319 and 321.
From: Pharmaceutical Analysis (D G Watson)
EI Mass Spectra of Alkanes
More stable carbocations will be more abundant.
50
Simple alkanes tend to undergo fragmentation by the initial loss of a methyl group to form a (m-15) species. This carbocation can then undergo stepwise cleavage down the alkyl chain, expelling neutral two-carbon units (ethene). Branched hydrocarbons form more stable secondary and tertiary carbocations, and these peaks will tend to dominate the mass spectrum.
51
Mass Spectra of Alcohols Alcohols usually lose a water molecule.
M+ may not be visible.
52
The molecular ion represents loss of an electron and the peaks above the molecular ion are due to isotopic abundance. The base peak in toluene is due to loss of a hydrogen atom to form the relatively stable benzyl
cation. 53 54
The benzyl cation is thought to
undergo rearrangement to form the
very stable tropylium cation, and
this strong peak at m/z = 91 is a
hallmark of compounds containing
a benzyl unit. The minor peak at
m/z = 65 represents loss of neutral
acetylene from the tropylium ion
and the minor peaks below this
arise from more complex
fragmentation.
5/8/2008
10
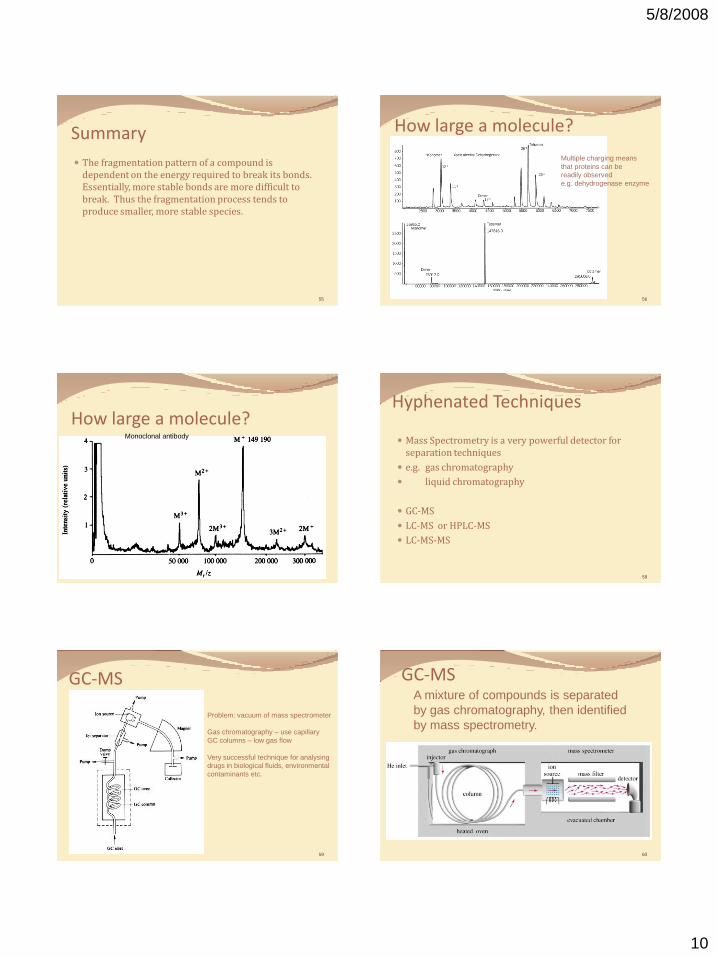
Summary
The fragmentation pattern of a compound is dependent on the energy required to break its bonds. Essentially, more stable bonds are more difficult to break. Thus the fragmentation process tends to produce smaller, more stable species.
55
How large a molecule?
56
Multiple charging means
that proteins can be
readily observed
e.g. dehydrogenase enzyme
How large a molecule?
57
Monoclonal antibody
Hyphenated Techniques
58
Mass Spectrometry is a very powerful detector for separation techniques
e.g. gas chromatography
liquid chromatography
GC-MS
LC-MS or HPLC-MS
LC-MS-MS
GC-MS
59
Problem: vacuum of mass spectrometer
Gas chromatography – use capillary
GC columns – low gas flow
Very successful technique for analysing
drugs in biological fluids, environmental
contaminants etc.
GC-MS
60
A mixture of compounds is separated
by gas chromatography, then identified
by mass spectrometry.

5/8/2008
11
LC-MS
61
Liquid chromatography – produces large amounts of
solvent vapour when converted to gas phase.
- Must be removed
In electrospray ionisation heat and drying gas are
needed to increase the rate of droplet evaporation
as the sample solution is sprayed from a needle
held at high voltage → ions
MS2 Chromatogram
0.E+00
5.E+05
1.E+06
0 10 20
Time, min
Inte
nsity
, cps
2.7
Fragmentation at 2.7 min
1.E+03
7.E+03
1.E+04
100 300 500 700 900
m/z
Inte
nsity
, cps
273
697
755
Fragmentation at 4.3 min
1.E+03
8.E+03
2.E+04
100 200 300 400 500 600 700 800
m/z
Inte
nsity
, cps
697
273
LC-MS Application
LC-MS Application
O
NH
OH OH
OH
O
OHO
2C
O
OO
O
OH
OMe
O
NH
OH OH
OH
O
OH
O
OO
O
OH
OMe
O
NH
OH OH
O
O
O
OO
O
OH
OMe
O
HNOH
OH
O
O
OH
rifamycin B755.8
rifamycin S695.8
rifamycin SV697.8
naphthofuran system274.3
• Most common ionization is the electro-spray
• When other ions co-elute the analyte molecules don’t
ionise as much due to competition (ion-suppression)
• This is a major problem in quantitative analysis using LC-MS
• Solution: use an internal standard with the same retention time to
estimate this reduction and correct
• Use isotopically labelled compound as an internal standard
(common approach in both GC-MS and LC-MS unlike GC and LC
with other detectors. Why?
Eg. Analyte: D-Glucose (C6 H12 O6 ) (M.Wt – 180)
Internal standard: D-Glucose- 13C6 (M.Wt -186) or
D-Glucose- d12 (M.Wt -192)
LC-MS Application
Related Documents


![J org Pretz arXiv:2005.12203v1 [physics.class-ph] 25 May 2020 › pdf › 2005.12203.pdf · (t)/ m mass 1 mass 2 mass 3 mass 4 mass 5 mass 6 mass 7 mass 8 mass 9 mass 10 Figure 2.](https://static.cupdf.com/doc/110x72/5f1ec529f26656179f60ee75/j-org-pretz-arxiv200512203v1-25-may-2020-a-pdf-a-200512203pdf-t.jpg)