Mass spectrometry as a tool for the selective profiling of destruxins; their first identification in Lecanicillium longisporum Tariq M. Butt 1 , Noomen Ben El Hadj 2y , Anke Skrobek 1z , Willem J. Ravensberg 4 , Chengshu Wang 1 § , Catherine M. Lange 3 , Alain Vey 2 , Umi-Kulsoom Shah 1 and Ed Dudley 1 * 1 Department of Environmental and Molecular Biosciences,SOTEAS, Swansea University, Singleton Park, Swansea SA2 8PP, UK 2 Institut National de la Recherche Agronomique (I.N.R.A.), Unite ´ de Recherche de Pathologie Compare ´e, 30380 St Christol les Ale `s, France 3 Laboratoire de Spectrometrie de Masse Bio-Organique, CNRS-UMR 6014, Universite ´ of Rouen, 76821 Mont-Saint-Aignan-cedex, France 4 Koppert Biological Systems, P.O. Box 155, 2650 AD Berkel en Rodenrijs, The Netherlands Received 4 February 2009; Revised 4 March 2009; Accepted 6 March 2009 Mass spectrometry was applied to the identification of the destruxins (dtxs), cyclic peptides that are commonly produced by the fungal insect-pathogen, Metarhizium anisopliae. The aim of the study was to optimise a methodology in order to firstly determine whether these compounds were present in other species and to determine the effect of differing growth conditions upon the dtx content detected. Matrix-assisted laser desorption/ionisation time-of-flight mass spectrometry (MALDI-ToF- MS) was initially used to analyse the dtxs, but limitations were indicated. Nano-scale high- performance liquid chromatography/electrospray ionisation mass spectrometry (HPLC/ESI-MS) and automated ‘data-dependent’ tandem mass spectrometric (MS/MS) analysis were also applied, utilising characteristic neutral losses during fragmentation to confirm the presence of the dtxs. This latter approach distinguished the dtx E and B isoforms by retention time and diagnostic neutral losses during fragmentation allowing extraction of the destruxin data from a complex dataset. This process revealed the presence of a number of dtxs in the fungal species Lecanicillium longisporum,a species previously not known to produce dtxs, and dtx production in this species was shown to be significantly higher in aerated cultures compared with still cultures. Copyright # 2009 John Wiley & Sons, Ltd. Destruxins (dtxs) are cyclic peptides composed of an a- hydroxy acid and five amino acid residues joined by amide and ester linkages. 1 Many dtxs have been identified to date and these are placed in five major groups (A–E) and several sub-groups with dtxs A, B and E usually being the predominant ones (Fig. 1). Most dtxs and their analogues have been isolated from cultures of the insect-pathogenic fungus Metarhizium anisopliae; their production is less well documented in other fungi. Dtx B, desmethyldtx B and homodtx B have been reported as being produced by the plant pathogen Alternaria brassicae 2 whilst Ophiosphaerella herpotricha, a plant pathogen on Bermuda grass, produces dtx B. 3 Dtx A4, A5 and homodtx B are found in cultures of the insect-pathogen Aschersonia sp., 4 while the coprophilous fungus Nigrosabulum globosum is known to produce pseu- dodtxs A and B. 5 The exact role of dtxs produced by insect and plant pathogenic fungus has not been fully elucidated; however, they are considered to be important determinants of pathogenicity. 6,7 The toxicity of dtxs to insects is well documented, 8 with low concentrations being sufficient to temporarily paralyse an insect host 6 and to suppress its cellular defences. 9 Dtxs exhibit other biological activities which make them interesting tools that may be used to study cellular processes and possibly as lead compounds for the development of novel pharmaceuticals to treat cancer, osteoporosis, and hepatitis B. 8,10–13 The level and type of dtxs secreted by M. anisopliae are dependent on the species, strain and culture conditions such as pH, substrate and aeration. 14–16 Despite many previous studies that have identified these compounds in different species and utilised mass spectrometry to study their occur- rence 17,18 and breakdown products, 19 a robust and reliable method for the selective analysis of these compounds from the complete metabolite profile of such organisms has yet to be developed. Therefore, in the study reported this paper we investigated two mass spectrometric protocols for the determination of dtxs from organisms and compared their RAPID COMMUNICATIONS IN MASS SPECTROMETRY Rapid Commun. Mass Spectrom. 2009; 23: 1426–1434 Published online in Wiley InterScience (www.interscience.wiley.com) DOI: 10.1002/rcm.4018 *Correspondence to: E. Dudley, Department of Environmental and Molecular Biosciences, SOTEAS, Swansea University, Singleton Park, Swansea SA2 8PP, UK. E-mail: [email protected] y Present address: Faculte ´ des Sciences de Ga `bes; Universite ´ du Sud. Tunisia, Tunisia. z Present address: School of Engineering, Swansea University, Singleton Park, Swansea, UK. x Present address: Institute of Plant Physiology and Ecology, Shanghai Institutes for Biology Sciences, Chinese Academy of Science, Shanghai 200032, China. Contract/grant sponsor: European Commission, Quality of Life and Management of Living Resources Programme (QoL), Key Action 1 on Food, Nutrition and Health; contract/grant number: QLK1-2001-01391. Copyright # 2009 John Wiley & Sons, Ltd.

Welcome message from author
This document is posted to help you gain knowledge. Please leave a comment to let me know what you think about it! Share it to your friends and learn new things together.
Transcript

RAPID COMMUNICATIONS IN MASS SPECTROMETRY
Rapid Commun. Mass Spectrom. 2009; 23: 1426–1434
) DOI: 10.1002/rcm.4018
Published online in Wiley InterScience (www.interscience.wiley.comMass spectrometry as a tool for the selective profiling of
destruxins; their first identification in Lecanicilliumlongisporum
Tariq M. Butt1, Noomen Ben El Hadj2y, Anke Skrobek1z, Willem J. Ravensberg4,
Chengshu Wang1§, Catherine M. Lange3, Alain Vey2, Umi-Kulsoom Shah1and Ed Dudley1*1Department of Environmental and Molecular Biosciences, SOTEAS, Swansea University, Singleton Park, Swansea SA2 8PP, UK2Institut National de la Recherche Agronomique (I.N.R.A.), Unite de Recherche de Pathologie Comparee, 30380 St Christol les Ales, France3Laboratoire de Spectrometrie de Masse Bio-Organique, CNRS-UMR 6014, Universite of Rouen, 76821 Mont-Saint-Aignan-cedex, France4Koppert Biological Systems, P.O. Box 155, 2650 AD Berkel en Rodenrijs, The Netherlands
Received 4 February 2009; Revised 4 March 2009; Accepted 6 March 2009
*CorrespoMoleculaPark, SwE-mail: eyPresentSud. TunzPresentSingletonxPresentShanghaiScience, SContract/and ManAction 1 oQLK1-200
Mass spectrometry was applied to the identification of the destruxins (dtxs), cyclic peptides that are
commonly produced by the fungal insect-pathogen, Metarhizium anisopliae. The aim of the study
was to optimise a methodology in order to firstly determine whether these compounds were present
in other species and to determine the effect of differing growth conditions upon the dtx content
detected. Matrix-assisted laser desorption/ionisation time-of-flight mass spectrometry (MALDI-ToF-
MS) was initially used to analyse the dtxs, but limitations were indicated. Nano-scale high-
performance liquid chromatography/electrospray ionisation mass spectrometry (HPLC/ESI-MS)
and automated ‘data-dependent’ tandem mass spectrometric (MS/MS) analysis were also applied,
utilising characteristic neutral losses during fragmentation to confirm the presence of the dtxs. This
latter approach distinguished the dtx E and B isoforms by retention time and diagnostic neutral
losses during fragmentation allowing extraction of the destruxin data from a complex dataset. This
process revealed the presence of a number of dtxs in the fungal species Lecanicillium longisporum, a
species previously not known to produce dtxs, and dtx production in this species was shown to
be significantly higher in aerated cultures comparedwith still cultures. Copyright# 2009 JohnWiley
& Sons, Ltd.
Destruxins (dtxs) are cyclic peptides composed of an a-
hydroxy acid and five amino acid residues joined by amide
and ester linkages.1 Many dtxs have been identified to date
and these are placed in five major groups (A–E) and several
sub-groups with dtxs A, B and E usually being the
predominant ones (Fig. 1). Most dtxs and their analogues
have been isolated from cultures of the insect-pathogenic
fungus Metarhizium anisopliae; their production is less well
documented in other fungi. Dtx B, desmethyldtx B and
homodtx B have been reported as being produced by the
plant pathogen Alternaria brassicae 2 whilst Ophiosphaerella
herpotricha, a plant pathogen on Bermuda grass, produces
ndence to: E. Dudley, Department of Environmental andr Biosciences, SOTEAS, Swansea University, Singletonansea SA2 8PP, [email protected]: Faculte des Sciences de Gabes; Universite duisia, Tunisia.address: School of Engineering, Swansea University,Park, Swansea, UK.address: Institute of Plant Physiology and Ecology,Institutes for Biology Sciences, Chinese Academy ofhanghai 200032, China.grant sponsor: European Commission, Quality of Lifeagement of Living Resources Programme (QoL), Keyn Food, Nutrition and Health; contract/grant number:1-01391.
dtx B.3 Dtx A4, A5 and homodtx B are found in cultures of the
insect-pathogen Aschersonia sp.,4 while the coprophilous
fungus Nigrosabulum globosum is known to produce pseu-
dodtxs A and B.5 The exact role of dtxs produced by insect
and plant pathogenic fungus has not been fully elucidated;
however, they are considered to be important determinants
of pathogenicity.6,7 The toxicity of dtxs to insects is well
documented,8 with low concentrations being sufficient to
temporarily paralyse an insect host6 and to suppress its
cellular defences.9 Dtxs exhibit other biological activities
which make them interesting tools that may be used to study
cellular processes and possibly as lead compounds for the
development of novel pharmaceuticals to treat cancer,
osteoporosis, and hepatitis B.8,10–13
The level and type of dtxs secreted by M. anisopliae are
dependent on the species, strain and culture conditions such
as pH, substrate and aeration.14–16 Despite many previous
studies that have identified these compounds in different
species and utilised mass spectrometry to study their occur-
rence17,18 and breakdown products,19 a robust and reliable
method for the selective analysis of these compounds from
the complete metabolite profile of such organisms has yet to
be developed. Therefore, in the study reported this paper we
investigated two mass spectrometric protocols for the
determination of dtxs from organisms and compared their
Copyright # 2009 John Wiley & Sons, Ltd.

Figure 1. Structures of common destruxins.
Mass spectrometric analysis of destruxins 1427
effectiveness. This optimised technique was then used to
study whether the entomopathogenic fungus Lecanicillium
longisporum, formerly known as Verticillium lecanii,20 pro-
duces dtxs and whether these compounds are produced in
higher levels in aerated cultures compared to still cultures.
This report details the first identification of these compounds
produced by L. longisporum and describes the analytical
process used to selectively study the dtxs. This optimised
and selective analytical protocol can now be utilised for the
further selective study of these compounds in this and other
species.
EXPERIMENTAL
MaterialsAll reagents were obtained from Sigma unless stated
otherwise. Dichloromethane (CH2Cl2) and ethyl acetate
(EtOAc) were of analytical grade while acetonitrile (MeCN)
and methanol (MeOH) were of HPLC grade. Ultra-pure
analytical grade water (r> 18MV/cm) was produced by a
Milli-Q Plus1 water system (Millipore, UK). Standards for
dtxs E and Bwere purified fromM. anisopliae culture broth as
described by Pais et al.21
Organisms and cultivationThe fungiM. anisopliae and L. longisporum KV71 (IMI 179172;
HRI 1-72, Ve2), active ingredient of the commercial agent
Vertalec1 (Koppert, NL), were grown in Czapek Dox liquid
Copyright # 2009 John Wiley & Sons, Ltd.
medium (30 g sucrose, 2 g sodium nitrate, 1 g dipotassium
phosphate, 0.5 g magnesium sulphate, 0.5 g potassium
chloride, 0.01 g ferrous sulphate and 20 g yeast extract/L
deionised water). A starter culture was initiated by
inoculating 50mL medium in a 250mL conical flask with
100mL spore suspension (107 spores/mL deionised water)
and incubating for 3 days on an orbital shaker (Sanyo
Gallenkamp, UK) at 25� 38C and 100 rpm. Themain cultures
(100mL medium in 500mL conical flasks) were inoculated
with 1.5mL of starter culture and incubated for 16 days at
25� 38C as still (no shaking) and shake cultures (100 rpm).
Metabolite extractionCulture filtrate from shaken and still cultures was separated
by filtration through a Whatman No. 1 filter paper under
vacuum and extraction of the culture filtrate was based on
themethodology of Starratt and Loschiavo.22 Briefly, a separat-
ing funnel was charged with culture filtrate and CH2Cl2 (1:4,
v/v) and left for 5 h. The solvent phase was washed with
deionised water before evaporation of the solvent in a fume
cupboard and the residues re-dissolved in CH2Cl2/MeOH
(1:1, v/v). Extracts were stored at �208C until required for
analysis.
Mass spectrometry
Matrix-assisted laser desorption/ionisation time-of-flightmass spectrometry (MALDI-ToF-MS)MALDI-ToF-MS analysis was performed using a Voyager
DE-STR MALDI mass spectrometer (Applied Biosystems,
Warrington, UK) equipped with a nitrogen laser (emission
wavelength 337 nm, pulse duration 4 ns). Spectra were
recorded in positive ion mode using 20 kV acceleration
voltage, delayed extraction (100 ns) and reflectron mode.
External calibration was carried out using the protonated
molecules of leucine-enkephalin, substance P, neurotensin
and ACTH (fragment 18-39). MALDI targets were prepared
using cyano-4-hydroxycinnamic acid (CHCA) as matrix and
the dried-droplet method was used for sample/matrix co-
crystallisation. Briefly, 1mL of a 100-fold diluted sample was
mixed with 1mL of the matrix solution (10mg/mL in
MeOH/MeCN); then 1mL of the mixture was deposited on
the MALDI target and allowed to dry under vacuum.
Nano-scale high-performance liquid chromatography/electrospray ionisation mass spectrometry(nano-HPLC/ESI-MS)A reversed-phase C18 HPLC column (75mm� 10 cm,
Pepmap C18 stationary phase; Dionex, Camberley, UK)
was prepared in-house by loading a piece of fused silica with
a pulled tip with the packing slurry until the desired length
of silica had been packed. An Ultimate pump and a FAMOS
autosampler (Dionex, Camberlay, UK) were used to pump
mobile phase over the column at a flow rate of 200 nL/min
and inject 5mL of the culture extract onto the column. The
mobile phases usedwere 2%MeCN/98%water/0.1% formic
acid (A) and MeCN with 0.1% formic acid (B). After sample
loading, the mobile phase was maintained at 100% A for
10min, a gradient between 100% A and 40:60A/B was then
applied over 1 h; following this the gradient was increased to
Rapid Commun. Mass Spectrom. 2009; 23: 1426–1434
DOI: 10.1002/rcm

Figure 2. MALDI-ToF mass spectrum of dtxs E (or B – m/z 594) and E-diol (m/z 612) from
M. anisopliae.
1428 T. M. Butt et al.
100% B over 20min, held at 100% B for 15min before being
returned to 100% A over 15min. The HPLC column also
acted as the nano-ESI tip in the source of the mass
spectrometer for an LCQ-XP plus ion trapmass spectrometer
(Thermo Finnigan, Hemel Hempstead, UK). The ion trapwas
operated in positive ion mode with a spray voltage of 1.6 kV,
a capillary temperature of 1658C and a capillary voltage of
10V. The mass spectrometer was utilised in a ‘data-
dependent scanning mode’ in which the most abundant
ion in the initial full scan mass spectra was automatically
isolated and fragmented in order to generate tandem mass
(MS/MS) spectra. From these MS/MS spectra, the two most
abundant product ions were automatically isolated and
further fragmented generating data-dependent MS3 spectra.
A dynamic exclusion parameterwas appliedwhich excluded
any product ion that had been analysed twice in 1min from
further analysis for a period of 2min in order to allow low-
abundance compounds to be examined. This detailed
analysis afforded structurally relevant information on the
precursor ions that were present, without the prerequisite of
knowing from which compounds they were isolated. The
data was analysed using the Xcalibur software package
594.23
100 200 300 400 500 600 700 800 900 1000 1100m/z
0
10
20
30
40
50
60
70
80
90
100
Rel
ativ
e A
bund
ance
Figure 3. Full scan HPLC mass spectrum at 68.5 min indi-
cating the protonated molecule of dtx E from M. anisopliae.
Figure 4. Data acquired by data-dependent fragmentation
analysis of dtx E from M. anisopliae: (A) MS/MS of m/z 594;
(B) MS3 analysis of the m/z 481 product ion of MS/MS of m/z
594; and (C) MS3 analysis of the m/z 453 product ion of MS/
MS of m/z 594.
Copyright # 2009 John Wiley & Sons, Ltd. Rapid Commun. Mass Spectrom. 2009; 23: 1426–1434
DOI: 10.1002/rcm

Mass spectrometric analysis of destruxins 1429
(Thermo Finnigan, Hemel Hempstead, UK) with the neutral
loss facility being utilised in order to monitor characteristic
losses post-acquisition. The output generated by the analysis
presented total ion current (TIC)-like chromatograms for all
precursor ions that, under fragmentation conditions, exhib-
ited the loss of the masses under study in any given
experiment. Such chromatograms mimic those generated by
multiple reaction monitoring (MRM) analyses.
RESULTS
MALDI-ToF-MS was first applied for the dtx determination.
Figure 2 indicates the MALDI spectrum obtained from the
analysis of dtxs purified from a culture extract of
M. anisopliae. Dtx E or B (m/z 594) and E (or B)-diol (m/z
612) are the only dxts detected by the analysis and the
spectrum obtained is further complicated by the presence of
sodium and potassium adducts of both ions. For example,
the [MþH]þ ion at m/z 594 also exhibits the sodium adduct
[MþNa]þ atm/z 616 and a potassium adduct [MþK]þ atm/z
632. Further study using metastable decomposition, in a
post-source decay (PSD) mode, generated data that was not
informative enough to determine the structural identity of
the dtxs present and in many cases indicated low mass
accuracy. A further disadvantage of MALDI-ToF-MS
analysis of the dtxs became apparent in that isobaric dtxs,
such as dtx E and B (m/z 594) and their derivatives (primarily
dxt E2, B2, DesMeE and DesMeB all with m/z 580), could not
be distinguished. Hence, despite MALDI-ToF-MS being a
very rapid analytical technique, it was not capable of
CHOC N
CHO
OCOC
H2C
H2C
OCNH
NOC
CH CHCON
R4
CH
R1
H3C
C
Ring opening
HN
CH3
HC
OC
HN
H2C
H2C
OCHOC
OC
R1
CH3
Internal
m/z
Figure 5. Fragmentat
Copyright # 2009 John Wiley & Sons, Ltd.
determining the relative quantities of these isobaric dtxs.
Therefore, the application of nano-HPLC/ESI-MS was
undertaken as an alternative approach to the study of dtxs.
As expected, from previously unpublished data under-
taken by the group, for theM. anisopliae extract, the dxt E ion
represented the most abundant dxt ion present in the sample
during HPLC/MS analysis. The full scan ESI mass spectrum
at 68.5min clearly shows an abundant protonated molecule
(dxt E), [MþH]þ at m/z 594 (Fig. 3), and without any other
adducts. The collision-induced dissociation (CID) fragmen-
tation data, generated by the data-dependent analysis
procedure, is shown for the m/z 594 ion (dtx E, Figs. 4(A)–
4(C)) and an overview of this fragmentation data in relation
to the structural fragmentation of the protonated molecule of
dtx E is shown in Fig. 5. The CID-MSn fragmentation data
was used to determine its potential to selectively quantify the
isobaric dtxs from complex mixtures. The main consider-
ation was whether the combined HPLC separation and data-
dependent fragmentation data collection could overcome
some of the problems represented by the initial MALDI-ToF-
MS data. The first challenge to this studywas that some of the
dtxs (such as dtx E and B) are isobaric and hence would
generate identical m/z ions in this HPLC/ESI-MS system.
Furthermore, the fragmentation data generated for these two
precursor ions is also identical, sine they only differ in a side
chain (referred to here as R1) present on the cyclic peptide
structure. This side chain is not lost during fragmentation of
the cyclic peptide and henceforth does not interfere with the
CID fragmentation. However, due to the differences in
polarity of the various R1 side chains present in dtxs E and B,
NH
CH
R3
CH
H3
CH3
CH3
H2C R2
CHNOC
HN CH
OCO+CHNC
CH
CH3H3C
R3CH
CH3H2C
R2
a6b5
a5
b4
Fragment
m/z 566m/z 481m/z 368
194
m/z 453
a4
m/z 340
ion map of dtx E.
Rapid Commun. Mass Spectrom. 2009; 23: 1426–1434
DOI: 10.1002/rcm
0 10 20 30 40 50 60 70 80 90 100 110 120Time (min)
0
20
40
60
80
100
Rel
ativ
e A
bund
ance
68.54
60.40
Figure 6. Extracted ion chromatogram from HPLC/MS analysis of m/z 594 (dtx E or B)
from M. anisopliae.
1430 T. M. Butt et al.
the two dtxs exhibit different retention times on a reversed-
phase C18 HPLC column with dtx B isomers always eluting
before the dtx E isomer (observed in unpublished data).
Figure 6 shows an extracted ion chromatogram (generated
post-acquisition from full scan ESI data) of m/z 594 for the
M. anisopliae sample in which both dtx E and B can be seen (E
at 68.5min and B at 60min) and dtx E is found at a more
elevated level than dtx B. Therefore, the application of the
HPLC separation prior to on-line MS analysis allows the
distinction of dtx E and B isoforms.
From the data obtained from the analysis of dtx E, it could
be seen that ring opening of these cyclic peptides is followed
200 300 400 500 600m
0102030405060708090
100
Rel
ativ
e A
bund
ance
552.13
481.12
453.13
194.00
200 300 400 500 6000
102030405060708090
100
Rel
ativ
e A
bund
ance
467.07
439.00552.05
200 300 400 500 6000
102030405060708090
100552.13
481.12
453.13
194.00
200 300 400 500 6000
102030405060708090
100552.13
481.12
453.13
194.00
200 300 400 500 6000
102030405060708090
100 467.07
439.00552.05
200 300 400 500 6000
102030405060708090
100 467.07
439.00552.05
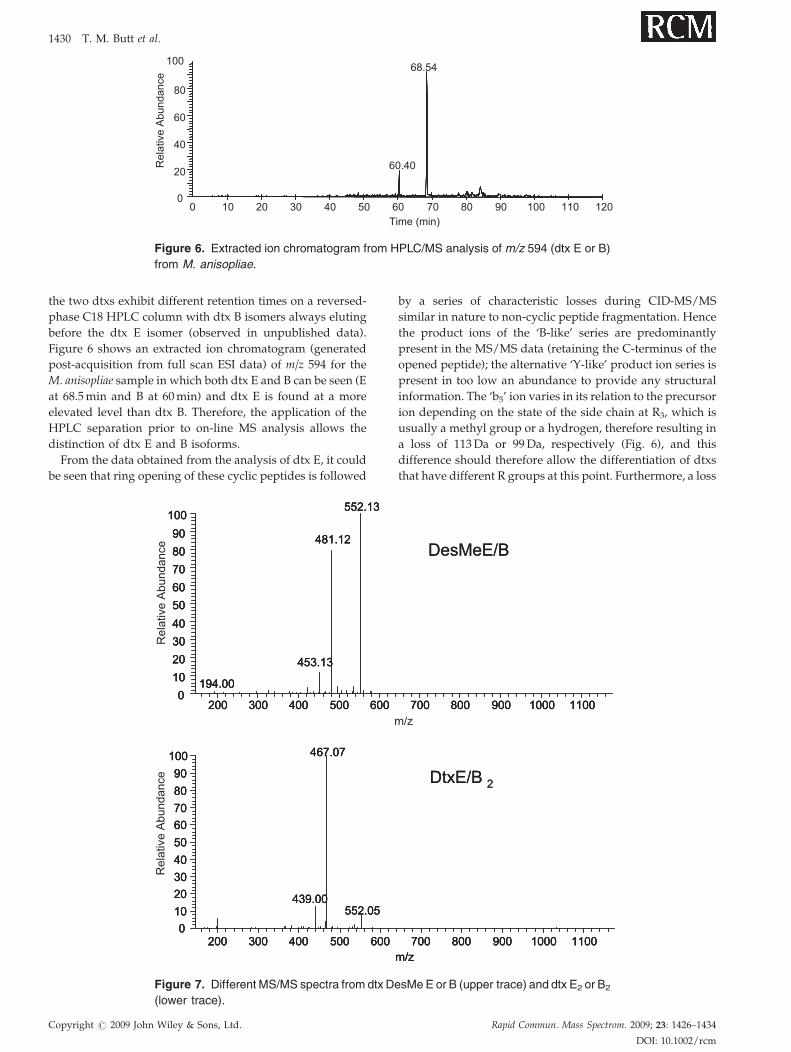
Figure 7. Different MS/MS spectra from dtx De
(lower trace).
Copyright # 2009 John Wiley & Sons, Ltd.
by a series of characteristic losses during CID-MS/MS
similar in nature to non-cyclic peptide fragmentation. Hence
the product ions of the ‘B-like’ series are predominantly
present in the MS/MS data (retaining the C-terminus of the
opened peptide); the alternative ‘Y-like’ product ion series is
present in too low an abundance to provide any structural
information. The ‘b5’ ion varies in its relation to the precursor
ion depending on the state of the side chain at R3, which is
usually a methyl group or a hydrogen, therefore resulting in
a loss of 113Da or 99Da, respectively (Fig. 6), and this
difference should therefore allow the differentiation of dtxs
that have different R groups at this point. Furthermore, a loss
700 800 900 1000 1100/z
700 800 900 1000 1100m/z
DesMeE/B
DtxE/B 2
700 800 900 1000 1100700 800 900 1000 1100
700 800 900 1000 1100m/z
700 800 900 1000 1100m/z
DesMeE/B
DtxE/B 2
sMe E or B (upper trace) and dtx E2 or B2
Rapid Commun. Mass Spectrom. 2009; 23: 1426–1434
DOI: 10.1002/rcm

Mass spectrometric analysis of destruxins 1431
of 28Da (loss of CO) is commonly detected in the CID-MS/
MS fragmentation of these cyclic peptides. The next
challenge in studying the dtxs was therefore to determine
if the fragmentation profiles were able to distinguish the E/
B2 isoforms from the DesMeE/B isoforms (isobaric yet
differing in R2 and R3 side chains). During MS/MS analysis,
the differing losses of 99Da from the DesMeE isoform (m/z
580 to 481) and 113Da from the E/B2 isoforms (m/z 580 to
467), due to the nature of the R3 side chain, can easily
distinguish the two dtx types (Fig. 7). Again the different
retention times, due to side-chain polarity, offer the only
distinction between the specific dtx E and B isomers due to
Figure 8. (a) Base peak (most abundant ion –
analysis, ions that undergo loss of 113 D
mode (second trace), ions that undergo loss
MS mode (third trace), ions that undergo loss o
mode (bottom trace). (b) Zoom-in of ions that u
HPLC/DDA-MS mode (upper trace), ions tha
in HPLC/DDA-MS mode (second trace), ions th
in HPLC/DDA-MS mode (bottom trace). Full lin
broken lines represent accurate identifications
99 or 113 Da.
Copyright # 2009 John Wiley & Sons, Ltd.
the lack of fragmentation within the side-chain groups.
However, this difference in retention time is more than
sufficient to separately identify and quantitate the two
isomers. It was concluded that the combination of the nano-
HPLC separation with ESI-MS/MS and the study of the
characteristic neutral losses produced during fragmentation
(loss of 28, 99 and 113Da) should allow the selective and
detailed study of the dtxs from the secreted metabolome of
the fungi under study. Therefore, this technique was applied
to the study of the species L. longisporum in order to study
whether it also produced dtxs. Figure 8(a) indicates the base
peak (representing the most abundant ion at each retention
upper trace) from HPLC/DDA-MS mode
a during analysis in HPLC/DDA-MS
of 99 Da during analysis in HPLC/DDA-
f 28 Da during analysis in HPLC/DDA-MS
ndergo loss of 113 Da during analysis in
t undergo loss of 99 Da during analysis
at undergo loss of 28 Da during analysis
es represent ‘false’ identifications whilst
with �28 Da loss and also either loss of
Rapid Commun. Mass Spectrom. 2009; 23: 1426–1434
DOI: 10.1002/rcm

1432 T. M. Butt et al.
time point) and those compounds that exhibited the loss of
113, 99 and 28Da during data-dependent fragmentation
analysis of the secreted metabolome from L. longisporum.
Firstly, from the upper trace of Fig. 8(a) (the base peak), it can
be seen that the purification process is non-selective and that
a large number of compounds are extracted by the
methodology used for purification, hence demonstrating
the requirement for selective MS/MS analysis. The analysis
of compounds which exhibited the selected characteristic
losses indicated a number of peaks and these peaks and their
confirmed identifications are shown in Fig. 8(b). Although
the highlighting of these losses improves the detection of the
dtxs above the background signal or base peak, it can be seen
that the loss of CO (28Da) is not diagnostic for dtxs (Fig. 8(a))
because a large number of ions (other than dtxs) exhibiting
this loss were determined. Therefore, a more detailed study
was made of the peaks indicating the loss of 99 and 113Da
during fragmentation. Studying these losses, a number of
dtxs were identified for the first time as being produced by
the Vertalec sample (a commercial fungus, L. longisporum).
For these compounds the m/z of the protonated molecular
ion, the retention time and the fragmentation data due to
fragmentation from both the MS/MS and MSn data
confirmed the identification of the dtxs that are summarised
in Table 1. Closer examination of the data (Fig. 8(b)) however
identified a number of chromatographic peaks in the TIC
Table 1. Dtxs identified by HPLC/MS and the ions that confirmed
Destruxin Rt R1 R2 R3 R4 m/z
E 68.5 C3H5O CH3 CH3 CH3 5D 56 C4H7O2 CH3 CH3 CH3 6B 60.2 C4H9 CH3 CH3 CH3 5A 60.2 C3H5 CH3 CH3 CH3 5E2 66.6 C3H5O H CH3 CH3 5B2 64.7 C3H5O H CH3 CH3 5desMeE 63.7 C3H5O CH3 H CH3 5A2 57.2 C3H5 H CH3 CH3 5
Table 2. Relative peak areas for the dtxs under shaken culture con
versus levels detected in M. anisopliae
Destruxin MW Rt
E 593 68.5B 593 60.2A 577 60.2D 623 56.0Ediol 611 51.8E2 579 66.6B2 579 64.7A2 563 57.2DesMeE 579 63.7DesMeB 579 57.0ProtoB 565 60.0
n.d.: not detected.
Copyright # 2009 John Wiley & Sons, Ltd.
profiles of ions which exhibited the required loss of either 99
or 113Da but which were shown, by examining the full MS/
MS and MSn spectra generated by data-dependent analysis,
to not be dtxs. Therefore, it was considered whether the loss
of 28Da taken in conjunction with the other two losses might
be diagnostic for identification of dtxs. The 28Da loss,
although not unique to dtxs, is always determined as a
neutral loss in dtx fragmentation and hence any dtx-derived
ion, identified by the loss of 113 or 99Da, should also give a
response in the �28Da post-acquisition analysis. The
application of this approach to the data confirms the
presence of the previously identified dxts (by the loss of
113 or 99Da), and also eliminates other product ions that also
lose 113 or 99Da (Fig. 8(b)). Alternative diagnostic losses
were considered; however, none indicated the specificity or
required intensity to allow low levels of dtxs to be identified.
Such analysis requires good HPLC resolution of the
individual components of the extract (Fig. 8(b)) where the
peaks obtained are approximately 12 s wide peaks. There-
fore, if the loss of 28Da and the retention time do not
precisely match that of the other specified loss (either 99 or
113Da), the peak can be discounted. For example, the loss of
113Da at 64.7min co-elutes with a loss of 28Da, indicated by
a dotted line, and this peak matches exactly the retention
time of dtx B2. However, the peak that indicates a loss of
99Da at 64.85min does not precisely co-elute with a signal
their presence
MHþ
Fragment ions detected in MS/MS and MSn analysis
a6 b5 a5 b4 a4 Internal fragment
94 H H H H H H24 H H H H H H94 H H H H H X78 H H H H H H80 H H H H H H80 H H H H X H80 H H H H X H64 H H H H H H
ditions and still culture conditions of Vertalec (L. longisporum)
Comparative peak areas
M. anisopliae
Vertalec
Shaken Still
58391 28232 15548128 2762 48851866 11176 7986068 3486 18313585 n.d. n.d.7646 3814 30011120 7005 3695972 1306 11011061 6425 225963 n.d. n.d.1200 n.d. n.d.
Rapid Commun. Mass Spectrom. 2009; 23: 1426–1434
DOI: 10.1002/rcm

Mass spectrometric analysis of destruxins 1433
representing the loss of 28Da and hence this 99Da loss peak,
despite being very close in retention time to the 28Da loss
peak, is not defined as a dtx in this analysis. This small
difference in retention time is sufficient to be diagnostic for
the identification of dtx signals from ‘false’ signals and these
findings were substantiated by studying in detail the
fragmentation data obtained.
This optimised HPLC/ESI-MS analysis was next used in
order to study the levels of dtxs produced with differing
growth conditions and if this affected the production of the
dtxs in fungi where they were previously undetected. The
MS-derived chromatographic peak areas due to the ident-
ified cyclic peptides fromM. anisopliae compared to the levels
produced by L. longisporum in the aerated and still cultures
are represented in Table 2. The first conclusion is that the
production of the dtxs by L. longisporum is much reduced
compared to that of M. anisopliae, with some dtxs being
absent from the analysis of the L. longisporum samples (e.g.
dtx E-diol). Furthermore, without exception, the dtxs are
found to be elevated in the aerated culture compared to the
still culture for L. longisporum. The increase in levels between
the two culture types varies between 5.7- and 28.6-fold. The
difference in levels is not consistent across all the dtxs
determined suggesting that certain dtxs may, as a percentage
of the total dtxs present, be produced preferentially in still
cultures. Repeated extraction and analysis of dxts from
L. longisporum indicated that the production of dxts by this
species is more variable compared to production by
M. anisopliae, suggesting that other factors also play a role
in the levels of the dtxs produced (data not shown). The
methodology for the MS analysis we developed may allow
the study of the various growth parameters (media
conditions, number of sub-cultures, etc.) leading to more
fully understanding all the factors that affect production of
dtxs in the different fungal species.
CONCLUSIONS
The utilisation of two mass spectrometric techniques,
MALDI-ToF-MS/MS (with PSD analysis) and nano-scale
HPLC/ESI-MS/MS, were evaluated in order to determine
the levels of the biologically important group of insecticidal
cyclic peptides, the dtxs. The sensitivity and potential
specificity of this optimised MS process was then used to
determine if these compounds were present in a strain of
fungus from which they had not been previously identified.
MALDI-ToF-MS analysis can identify ions that are charac-
teristic of some common dtxs; however, the analyses could
not distinguish between isobaric dtxs and PSD analysis of
these structures gave little information. Nano-scale HPLC/
ESI-MS and data-dependent analysis (as described in the
Experimental section) was also used for the characterisation
and quantification of dtxs.Whilst in the case of the dtxs E and
B (and their derivatives) the isomers could still not be
distinguished by MS/MS and MSn analysis (due to the lack
of fragmentation of the isobaric side chain), the differing
retention characteristics of the two isomers allowed their
separation and thus provided their determination and
comparative quantitation. The nano-scale HPLC/ESI-MS
with data-dependent fragmentation analysis also allowed
Copyright # 2009 John Wiley & Sons, Ltd.
the metabolomic data produced to be ‘mined’ for dtx-specific
data. This took advantage of the fact that the dtxs prefe-
rentially undergo ring opening at a specific point in the cyclic
structure and this forms a linear peptide intermediate which
then fragments in a specific fashion generating fragment
ions that are characteristic for the dtxs. Whilst the loss of CO
(a characteristic neutral loss) was rather non-specific for the
dtxs, the losses of 99 and 113Da were more useful in
extracting dtx-specific information. The combination of the
loss of 99 and 113Da as a first screen and the second screen
with loss of 28Da allowed the removal of any false-positive
peaks detected by this process. A final consideration is the
time taken for each analysis; whilst the nano-HPLC/ESI-MS
experiment produced more informative information, it
required a lengthy HPLC separation in order to distinguish
certain isobaric dtxs. In contrast, the MALDI-ToF-MS
analysis gave less information regarding the nature and
quantity of the isobaric dtxs and is thought to be realistically
only semi-quantitative in nature. However, the analysis time
for the MALDI analysis is markedly reduced (minutes for
multiple samples). Therefore, MALDI-ToF-MS, for the
purpose of an initial screening of a large number of samples
for dtxs, does have an advantage and may be used as a ‘first-
pass’ analysis in order to determine which samples of a large
set requires further detailed analysis. HPLC/ESI-MS could
then be used for the quantitation of dtxs. These techniques
were utilised here in order to show, for the first time, that
dtxs are produced by the genus L. longisporum and that the
dtxs identified were produced at elevated levels under
aerated conditions compared to the same species grown
under still conditions. Previously, aeration has generally
been shown to be important for optimal production of
biomass and secondary metabolites,23 although the role of
aeration in the production of such metabolites remains
ambiguous.16 The optimised MS investigation of dtxs,
outlined in this report, therefore affords the identification
of dtxs from different fungal species, and permits the
relationship between this class of organisms to be studied at
the metabolomic level. It also permits the investigation of the
produced toxins and their specific target organisms.
AcknowledgementsThis work was supported by the European Commission,
Quality of Life and Management of Living Resources Pro-
gramme (QoL), Key Action 1 on Food, Nutrition and Health
QLK1-2001-01391 (RAFBCA).
REFERENCES
1. Roberts DW, St Leger RJ. In Advances in Applied Microbiology.Elsevier Inc.: London, 2004.
2. Ayer WA, Pena-Rodriguez LM. J. Nat. Prod. 1987; 50: 408.3. Ventatasubbaiah P, Tisserat NA, Chilton WS. Mycopatholo-
gica 1994; 128: 155.4. Krasnoff SB, Gibson DM, Belofsky GN, Gloer KB, Gloer JB.
J. Nat. Prod. 1996; 59: 485.5. Che Y, Swenson DC, Gloer JB, Koster B, Malloch D. J. Nat.
Prod. 2001; 64: 555.6. Amiri-Besheli B, Khambay B, Cameron S, Deadman ML,
Butt TM. Mycol. Res. 2000; 104: 447.7. Zabka M, Drastichova K, Jegorov A, Soukupova J, Nedbal L.
Mycopathologica 2006; 162: 65.
Rapid Commun. Mass Spectrom. 2009; 23: 1426–1434
DOI: 10.1002/rcm

1434 T. M. Butt et al.
8. Vey A, Hoagland R, Butt TM. In Fungus as Biocontrol Agents:Progress, Problems and Potential, Butt T, Jackson C, Magan N(eds). CAB International: Wallingford, UK, 2001.
9. Vey A, Matha V, Dumas C. J. Invert. Pathol. 2002; 80: 177.10. Bandani AR, Amiri-Besheli B, Butt TM, Gordon-Weekes R.
Biochim. Biophys. Acta 2001; 1510: 367.11. Chen HC, Chou CK, Sun CM, Yeh SF. Antiviral Res. 1997; 34:
137.12. Vazquez MJ, Albarran MI, Espada A, Rivera-Sagredo A,
Diez E, Hueso-Rodrigues JA. Chem. Biodiv. 2005; 2: 123.13. Yoshimoto Y, Imoto M. Exp. Cell Res. 2002; 279: 118.14. Hsiao YM, Ko JL. Toxicon 2001; 39: 837.15. Liu BL, Tzeng YM. Biotech. Lett. 1999; 21: 657.
Copyright # 2009 John Wiley & Sons, Ltd.
16. Wang CS, Skrobek A, Butt TM. J. Invert. Pathol. 2004; 85:168.
17. Loutelier C, Marcual A, Lange C, Cherton J-C, Cassier C.Rapid Commun. Mass Spectrom. 1995; 9: 408.
18. Hubert M, Cherton J-C, Vey A, Lange C. Rapid Commun.Mass Spectrom. 1999; 13: 179.
19. Dudley E, Wang C, Skrobek A, Newton RP, Butt TM. RapidCommun. Mass Spectrom. 2004; 18: 2577.
20. Gams W, Zare R. Nova Hedwigia 2001; 72: 329.21. Pais M, Das BC, Ferron P. Phytochemistry 1981; 20: 715.22. Starratt AN, Loschiavo SR. Can. J. Microbiol. 1974; 20: 416.23. Feng KC, Rou TM, Lui TL, Tzeng YM, Chang YN. Enzyme.
Microb. Technol. 1997; 34: 22.
Rapid Commun. Mass Spectrom. 2009; 23: 1426–1434
DOI: 10.1002/rcm
Related Documents