1 Maryland’s State Health Improvement Process A Community Health Improvement Plan _____________________________________________ Prepared by Public Health Services, September 2014 Martin O’Malley, Governor Joshua M. Sharfstein, M.D., Secretary Anthony G. Brown, Lt. Governor Dept. of Health and Mental Hygiene 201 West Preston Street, 5th Floor. Baltimore, Maryland 21201 410-767-6500 or 1-877-463-3464

Welcome message from author
This document is posted to help you gain knowledge. Please leave a comment to let me know what you think about it! Share it to your friends and learn new things together.
Transcript

1
Maryland’s State Health Improvement Process
A Community Health Improvement Plan
_____________________________________________
Prepared by Public Health Services, September 2014
Martin O’Malley, Governor Joshua M. Sharfstein, M.D., Secretary
Anthony G. Brown, Lt. Governor Dept. of Health and Mental Hygiene
201 West Preston Street, 5th Floor. Baltimore, Maryland 21201
410-767-6500 or 1-877-463-3464
2
Table of Contents
Maryland’s State Health Improvement Process (SHIP) 3
SHIP Vision Areas and Measures 4
The Significance of SHIP in Maryland 5
Mechanics of SHIP 5
SHIP Report Card 8
SHIP Users: Local Action to Change Health Outcomes 9
The Future of SHIP 11
Appendices 12
A: SHIP Partners 12
B: SHIP Data Information 16
C: SHIP Newsletter 24
D: SHIP Website 27
E: LHIC Priority Matrix 28

3
Maryland’s State Health Improvement Process (SHIP)
A Community Health Improvement Plan creates a long-term, systematic process to address state
and community public health needs through focused policies, programs and strategies.1 In
Maryland the State Health Improvement Process (SHIP) functions as the state’s Community
Health Improvement Plan. SHIP is a planned approach to community health improvement that
builds on a thirty year history of engaging stakeholders to collaboratively analyze and use data to
inform health improvement strategies.2 The purpose of SHIP is to enable communities to
identify critical health needs, provide evidence-based strategies for change and allow for a
common platform to measure success.
Maryland’s SHIP is a national best-practice3 in health improvement planning that consist of 41
data measures organized in five Vision Areas that represent what it means to be healthy.4 It is a
living process designed to accommodate the complex and ever changing health drivers and
communities in the state. Since launching in 2012, new measures have been added to the SHIP
data dashboard that better reflect the social determinants of health while other measures have
been removed or modified as better data has become available. Subsequently, the SHIP Vision
Areas have been reorganized to better align with Healthy People 2020 and reflect how Maryland
communities approach health improvement.
The ability to incorporate stakeholder feedback into the mechanics of SHIP reflects the critical
stakeholder input SHIP continuously seeks in order to provide a useful, accurate and timely
community health planning tool. Over 100 state and community organizations created, support
and align efforts with SHIP (Appendix A). Maryland communities use SHIP every day to inform
grant applications, make policy decisions and guide leaders in understanding the state of
Maryland health.
This document explains what SHIP is, how the state is measuring up to target goals, details the
state infrastructure required to keep SHIP functioning and provides examples of how Maryland
communities use SHIP. It concludes with a discussion on the future directions of SHIP and
health improvement planning in Maryland.
1 Definitions of Community Health Needs Assessments and Community Health Improvement Plans. National Association of County and City
Health Officials. Accessed July 7, 2014. Available at www.naccho.org. 2 The selection of SHIP data points and the ongoing community use of SHIP mirrors the Mobilizing for Action through Planning and
Partnerships (MAPP) process developed by the National Association of County and City Health Officials (NACCHO). 3 State Health Assessment Examples, Association of State and Territorial Health Officials. Available at
http://www.astho.org/Programs/Accreditation-and-Performance/Accreditation/PHAB-Pre-requisites. Accessed September 5, 2014. 4 For a complete list of SHIP measures and their associated data sources see Appendix B: SHIP Data Information.

4
Maryland State Health Improvement Process
Vision Areas and Objectives
Vision Areas SHIP Objectives
Healthy
Beginnings
1. Reduce infant deaths
2. Reduce the percent of low birth weight births
3. Reduce sudden unexpected infant deaths (SUIDs)
4. Reduce the teen birth rate
5. Increase the % of pregnancies starting care in the 1st trimester
6. Increase the proportion of children who receive blood lead screenings (new measure)
7. Increase the % entering kindergarten ready to learn
8. Increase the percent of students who graduate high school
Healthy Living
9. Increase the % of adults who are physically active (new measure)
10. Increase the % of adults who are at a healthy weight
11. Reduce the % of children who are considered obese
12. Reduce the % of adults who are current smokers
13. Reduce the % of youths using any kind of tobacco product
14. Decrease the rate of alcohol-impaired driving fatalities
15. Reduce new HIV infections among adults and adolescents
16. Reduce Chlamydia trachomatis infections
17. Increase life expectancy
Healthy
Communities
18. Reduce child maltreatment
19. Reduce the suicide rate
20. Reduce domestic violence
21. Reduce the % of young children with high blood lead levels
22. Decrease fall-related deaths
23. Reduce pedestrian injuries on public roads
24. Reduce Salmonella infections transmitted through food
25. Reduce the number of unhealthy air days
26. Increase the number of affordable housing options (new measure)
Access to
Health Care
27. Increase the proportion of persons with health insurance
28. Increase the % of adolescents receiving an annual wellness checkup
29. Increase the % of individuals receiving dental care
30. Reduce % of individuals unable to afford to see a doctor
Quality
Preventive
Care
31. Reduce deaths from heart disease
32. Reduce the overall cancer death rate
33. Reduce diabetes-related emergency department visits
34. Reduce hypertension-related emergency department visits
35. Reduce drug-induced deaths
36. Reduce emergency department visits related to mental health conditions (new measure)
37. Reduce emergency department visits for addictions-related conditions (new measure)
38. Reduce the number of hospitalizations related to Alzheimer’s disease
39. Increase the % of children with recommended vaccinations
40. Increase the % vaccinated annually for seasonal influenza
41. Reduce hospital emergency department visits for asthma

5
The Significance of SHIP in Maryland
For over 20 years the Department has prioritized engaging communities and partners to use
public health and clinical data to identify the strengths and needs of their populations. The first
collaborative public health assessment and identification of priorities for improvement was
conducted in 1993, laying the foundation for a process to unite Maryland stakeholders in a
collaborative, sustainable effort to improve the health of all Maryland residents.5
The current State Health Improvement Process is the fifth and most comprehensive iteration of
assessments conducted by Public Health Services (PHS). SHIP is the result of over 100
organizations contributing to the selection of common performance measures used by 20 Local
Health Improvement Coalitions (LHICs) and 24 Local Health Departments (LHDs) covering the
entire state of Maryland. The key difference from pervious assessments, and perhaps the most
significant SHIP contribution to public health in Maryland, is the expansion of SHIP
communications through the revised website to provide evidence-based strategies for
improvement directly to change makers at the community level.6
Mechanics of SHIP
The mechanics and maintenance of SHIP are housed in the Public Health Services (PHS) branch
of the Department of Health and Mental Hygiene (the Department). PHS works to improve the
health status of individuals, families and communities in Maryland through prevention, early
intervention, surveillance and treatment. Four full-time staff coordinate the data analysis,
communications and technical assistance of SHIP.
Data Analysis
SHIP data points come from the Department, other state agencies and federal sources. Data sets
themselves are typically not analyzed as part of SHIP, but the data sources and technicalities
must be understood to ensure validity when creating historic trends and comparing across
geographic areas and populations. A continuously updated SHIP Data Operations Manual
contains data details for all previous and current SHIP measures.
SHIP data analysis aligns and supports StateStat, a state level performance management system.
StateStat is a nationally recognized performance measurement and management tool to make
state government more accountable and more efficient. It provides aggregate performance data
across state systems as a means of reinforcing transparency of government. The StateStat
process involves frequent submission, review, and discussion of data and strategies to achieve
improved performance.
The Department uses StateStat performance management to emphasize results, accountability,
strategy, and transparency. StateStat links biweekly, monthly and quarterly measures of program
5 Healthy Maryland 2000 – Volume 1, Maryland Department of Health and Mental Hygiene, 1993. 6 For more information on the SHIP website, see page 6.

6
performance with core outcomes in critical public health areas, and brings together disparate
parts of the agency to work on common problems. Through StateStat the Department is able to
track progress on some of the most complex public health challenges facing Maryland. The
Department currently reports on 22 subject areas in StateStat, of which 22 measures align
directly with SHIP. Click here for the Department’s StateStat web page and here for the overall
Maryland StateStat web page.
Communications
SHIP is supported by four communication platforms that allow PHS to continuously engage
partners, receive feedback and further align SHIP with other local and state efforts.
1. Community Leadership Engagement: The Department hosts monthly Health Officer
Roundtable meetings attended by the Health Officers of all 24 Local Health Departments
(LHDs). Health Officers are a leading driver of their Local Health Improvement
Coalition (LHIC). SHIP is a regular discussion item at roundtable meetings and provides
PHS direct access to the pulse of how communities use SHIP.
2. SHIP Website: The SHIP web platform is embedded in the Department’s main website
and functions as a venue for communities to view and explore SHIP data measures,
research national evidence-based strategies for health improvement (SHIP Toolbox) and
connect to other local partners using SHIP to improve health (Maryland Innovations).
The website is maintained through Trilogy Network of Care, providing continuously
updated Maryland data and comparisons to national reports including the Robert Wood
Johnson Foundation County Health Rankings. A major communications vehicle of the
SHIP website is the inclusion of 20 Maryland Local Health Improvement Coalition
(LHIC) web pages that allow communities to customize data reports and disseminate
their selected strategies for improvement. Click here for the SHIP website.7
3. Media: SHIP utilizes a social media management tool to coordinate and time Facebook,
Twitter and a weekly newsletter. SHIP’s social media presence reaches over 1,000
followers/subscribers and typically communicates new resources, funding opportunities
community success stories. See Appendix C for a copy of the weekly SHIP newsletter.
4. Community Reports: A major component of understanding how communities use SHIP is
regular input and feedback from LHICs. To inform the infrastructure and mechanics of
SHIP, LHICs submit quarterly activity reports to PHS. These reports identify the
community’s current priority areas, successes and challenges. PHS uses this information
to create the SHIP Annual Report and to identify communities that may require
additional resources and assistance.
7 State Health Improvement Process (SHIP) website: http://dhmh.maryland.gov/ship/SitePages/Home.aspx
7
5. Annual Meetings: SHIP hosts annual meetings every fall for community and state
partners to discuss the functionality and use of data measures, identify potential new
measures and share community strategies for improvement. The SHIP Annual Meeting
typically reaches 100 partners representing all 20 Local Health Improvement Coalitions
(LHICs). An Annual Report is disseminated at the meeting that highlights LHIC activity
over the past year.
Technical Assistance
PHS provides technical assistance to community and state partners to align health improvement
efforts with SHIP. Technical Assistance is provided at the community level by customizing SHIP
data and facilitating meetings to help communities identify policy and program solutions. The
general public can also request technical assistance regarding SHIP data by completing a data
request form on the SHIP website. At the state level, SHIP provides technical assistance to other
Department offices and programs in understanding how communities use SHIP and how to best
align funding resources with the locally identified health needs.
SHIP Report Card
An annual Report Card communicates how well Maryland is doing in reaching target goals. The
Report Card is posted on the SHIP website and distributed through social media platforms. The
2013 report shows that while Maryland is moving in the right direction towards meeting many of
the 2014 goals, there are five measures that indicate a lack of progress and the need for more
focused resources and efforts:
1. Adults who are at a healthy weight
2. Fall-related deaths
3. Individuals unable to afford to see a doctor
4. Diabetes-related emergency department visits
5. Emergency department visits related to mental health conditions

8
Maryland State Health Improvement Process (SHIP) 2013
Category Measure SHIP 2013 Update
Healthy Beginnings
Reduce infant deaths Reduce the percent of low birth weight births Reduce sudden unexpected infant deaths (SUIDs) Reduce the teen birth rate Increase the % of pregnancies starting care in the 1
st trimester
Increase the proportion of children who receive blood lead screenings* Increase the % entering kindergarten ready to learn Increase the percent of students who graduate high school
Healthy Living
Increase the % of adults who are physically active Increase the % of adults who are at a healthy weight Reduce the % of children who are considered obese Reduce the % of adults who are current smokers Reduce the % of youths using any kind of tobacco product Decrease the rate of alcohol-impaired driving fatalities Reduce new HIV infections among adults and adolescents Reduce Chlamydia trachomatis infections Increase life expectancy
Healthy Communities
Reduce child maltreatment Reduce the suicide rate Reduce domestic violence Reduce the % of young children with high blood lead levels Decrease fall-related deaths Reduce pedestrian injuries on public roads Reduce Salmonella infections transmitted through food Reduce the number of unhealthy air days Increase the number of affordable housing options*
Access to Health Care
Increase the proportion of persons with health insurance Increase the % of adolescents receiving an annual wellness checkup Increase the % of individuals receiving dental care Reduce % of individuals unable to afford to see a doctor
Quality Preventive
Care
Reduce deaths from heart disease Reduce the overall cancer death rate Reduce diabetes-related emergency department visits Reduce hypertension-related emergency department visits Reduce drug-induced deaths Reduce emergency department visits related to mental health conditions* Reduce emergency department visits for addictions-related conditions* Reduce the number of hospitalizations related to Alzheimer’s disease Increase the % of children with recommended vaccinations Increase the % vaccinated annually for seasonal influenza Reduce hospital emergency department visits for asthma
The updated measure on track to meet/ met the Maryland 2014 Target
The updated measure is moving toward the Maryland 2014 Target
Updated measure is not moving toward the Maryland 2014 Target
Data for update is pending

9
SHIP Users: Local Action to Change Health Outcomes
SHIP informs 20 Local Health Improvement Coalitions (LHICs) that represent Maryland’s 24
jurisdictions (23 counties and Baltimore City). LHICs provide a common forum for open
discourse on health improvement among the local players in social services, clinical health and
public health. LHICs leverage SHIP and membership resources to:
Use data to identify health needs and priority areas for action
Collaboratively select evidence-based strategies for implementing programs and
policies to address priorities
Assign community responsibility to partners who have the ability work
collaboratively to implement and evaluate solutions
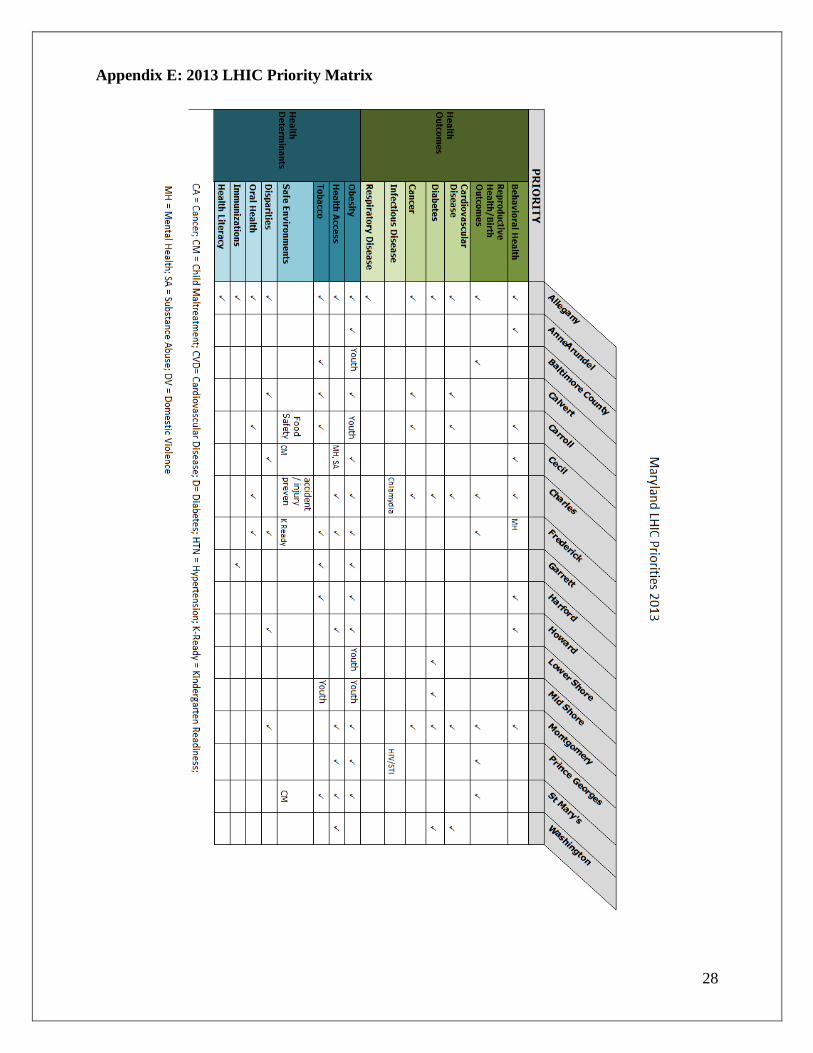
LHIC Priority Areas
LHICs use SHIP to set priorities and create Action Plans focusing on health issues relevant to
their community needs. Most LHIC priorities mirror SHIP vision areas and measures, although
some LHICs have selected outlying priorities based on other critical community health needs.8
The most common LHIC SHIP priorities are obesity, behavioral health, access to health care and
smoking cessation. LHIC Action Plans identify strategies ranging from health systems analysis
and asset mapping to expanding health screening services in community settings. Many LHICs
also provide their own annual report cards similar to the SHIP Report Card.
8 See Appendix E for a complete statewide LHIC Priority matrix.
10
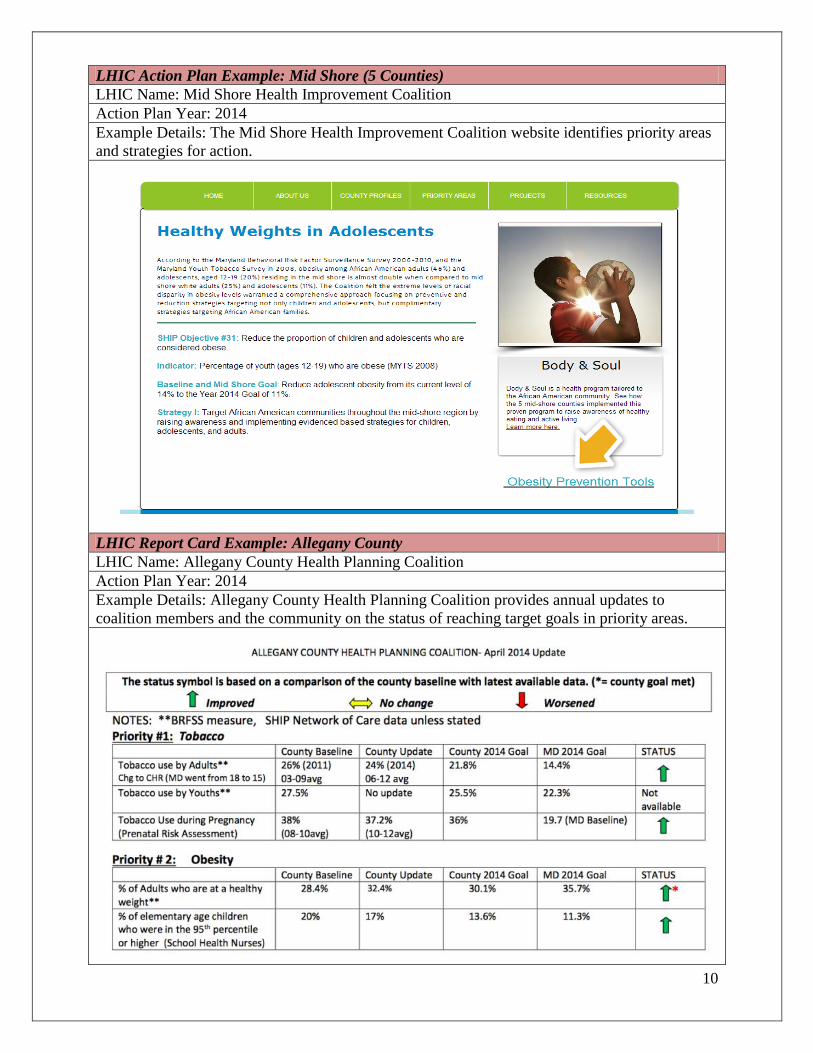
LHIC Action Plan Example: Mid Shore (5 Counties)
LHIC Name: Mid Shore Health Improvement Coalition
Action Plan Year: 2014
Example Details: The Mid Shore Health Improvement Coalition website identifies priority areas
and strategies for action.
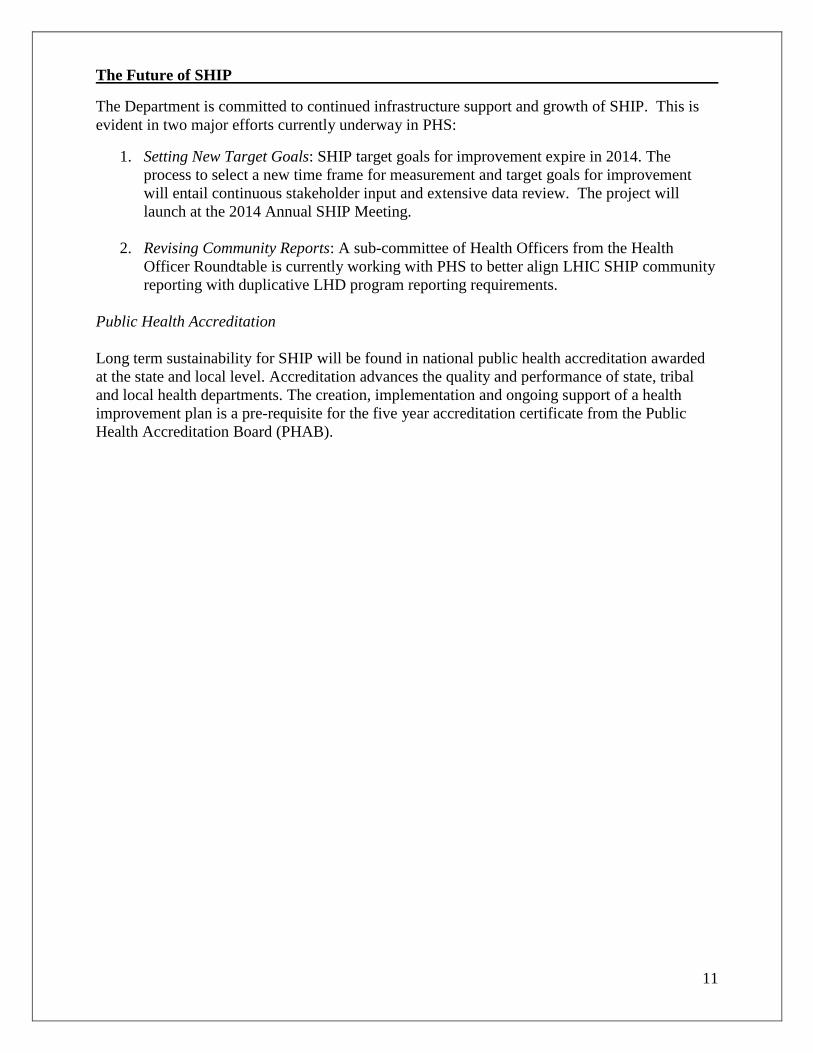
LHIC Report Card Example: Allegany County
LHIC Name: Allegany County Health Planning Coalition
Action Plan Year: 2014
Example Details: Allegany County Health Planning Coalition provides annual updates to
coalition members and the community on the status of reaching target goals in priority areas.
11
The Future of SHIP
The Department is committed to continued infrastructure support and growth of SHIP. This is
evident in two major efforts currently underway in PHS:
1. Setting New Target Goals: SHIP target goals for improvement expire in 2014. The
process to select a new time frame for measurement and target goals for improvement
will entail continuous stakeholder input and extensive data review. The project will
launch at the 2014 Annual SHIP Meeting.
2. Revising Community Reports: A sub-committee of Health Officers from the Health
Officer Roundtable is currently working with PHS to better align LHIC SHIP community
reporting with duplicative LHD program reporting requirements.
Public Health Accreditation
Long term sustainability for SHIP will be found in national public health accreditation awarded
at the state and local level. Accreditation advances the quality and performance of state, tribal
and local health departments. The creation, implementation and ongoing support of a health
improvement plan is a pre-requisite for the five year accreditation certificate from the Public
Health Accreditation Board (PHAB).
12
Appendix A: SHIP Partners
State Government Agencies and Offices
Department of Health and Mental Hygiene
Center for Cancer Prevention and Control
Community Health Resources Commission
Department of Human Resources
Developmental Disabilities Administration
Health Care Financing
Health Services Cost Review Commission
Infectious Disease and Environmental Health Administration
Maryland Board of Pharmacy
Maternal and Child Health
Medicaid Office of Planning and Finance
Mental Hygiene
Office of Information Technology
Office of Minority Health and Health Disparities
Office of Oral Health
Office of Preparedness and Response
Office of the Chief Medical Examiner
Office of the Secretary
Public Health Services
Public Relations
Vital Statistics Administration
Other State Government Participants
Governor's Workforce Investment Board
Maryland Community Health Resources Commission
Maryland Department of Aging
Maryland Department of Human Resources
Maryland Health Care Commission
Maryland Health Services Cost Review Commission
Maryland State Council on Child Abuse and Neglect
Maryland State Department of Education
Maryland Statewide Advisory Commission on Immunization
Office of the Governor
Local Health Departments
Allegany County Health Department
Anne Arundel County Health Department
Baltimore City County Health Department
Baltimore County Health Department
Calvert County Health Department
Caroline County Health Department

13
Carroll County Health Department
Cecil County Health Department
Charles County Health Department
Dorchester County Health Department
Frederick County Health Department
Garrett County Health Department
Harford County Health Department
Howard County Health Department
Kent County Health Department
Montgomery County Health Department
Queen Anne County Health Department
Prince George’s County Health Department
Somerset County Health Department
St. Mary’s County Health Department
Talbot County Health Department
Washington County Health Department
Wicomico County Health Department
Worcester County Health Department
Local Health Improvement Coalitions
Allegany County Health Planning Coalition
Baltimore County Health Coalition
Calvert Community Health Improvement Roundtable
Cecil County Community Health Advisory Committee
Garrett County Health Planning Council
Harford County Local Health Improvement Process
Healthy Anne Arundel
Healthy Howard, Inc.
Healthy Montgomery
Healthy Saint Mary's Partnership
Partnerships for a Healthier Charles County
Prince George's Healthcare Action Coalition
Somerset County Local Health Improvement Coalition
The Healthy St. Mary's Partnership
The Partnership for a Healthier Carroll County
Tri County Health Improvement Plan (T-CHIP)
Washington County Health Improvement Coalition
Wicomico County Local Health Improvement Coalition
Worcester County Local Health Improvement Coalition
Academic Institutions
Johns Hopkins University Bloomberg School of Public Health
Johns Hopkins University School of Medicine
Towson University
University of Maryland Baltimore County, Hilltop Institute

14
University of Maryland Institute for Healthiest Maryland
University of Maryland School of Law
University of Maryland School of Medicine
University of Maryland School of Social Work
Hospitals and Hospital Systems
Adventist Health Care
Anne Arundel Health System
Atlantic General Hospital
Baltimore Washington Medical Center
Choptank Community Health System
Holy Cross Health
Howard County General Hospital
Johns Hopkins Hospital
Lifebridge Health
Medstar Health
Mercy Medical Center
Suburban Hospital
Western Maryland Health System
Non-Profit & Other Community Organizations
Advocates for Children and Youth
Baltimore Buprenorphine Initiative
Baltimore Child Abuse Center
Baltimore Community Health Action Team / BCHAT
The Center For Children (MD)
Chesapeake Regional Information System for our Patients (CRISP)
Commonhealth ACTION
Community Clinic, Inc. (CCI)
Delmarva Foundation
EcoCityFarms - Prince George's
Family Health Centers of Baltimore
Garvey Associates
Health Policy Research Consortium (HPRC)
HealthCare Access Maryland
Health Care for the Homeless – Baltimore and Maryland
Maryland Association of County Health Officers
Maryland Citizen's Health Initiative
Maryland Health Care for All
Maryland Hospital Association
Maryland Rural Health Association
Maryland Women's Coalition for Health Care Reform
Maryland Physicians Care
Maryland Catholic Conference
Maryland State Medical Society (MedChi)

15
Mosaic Community Services
Network of Public Health Law
Physician Associates of Maryland
Primary Care Coalition of Montgomery County
Public Policy Partners
Tri-State Community Health Center
United Way of Calvert County

16
Appendix B: SHIP Data Information
SHIP Vision Area 1: Healthy Beginnings
Data Point Data Description Data Source Data Notes
Infant Death
Rate
Infant mortality
per 1,000 live
births
Maryland
Department of
Health and
Mental
Hygiene Vital
Statistics
Administration
Rates not reported if number of
deaths was less than 20.
Babies with
Low Birth
Weight
Percent of live
births that are low
birth weight
(2500 grams or
less)
Maryland
Department of
Health and
Mental
Hygiene Vital
Statistics
Administration
Percentage not reported if number
of births was less than 20.
Sudden
Unexpected
Infant Death
Rate (SUIDS)
Rate of sudden
unexpected infant
deaths (SUIDS)
per 1,000 live
births.
Maryland
Department of
Health and
Mental
Hygiene Vital
Statistics
Administration
Rate of sudden unexpected infant
deaths (SUIDs) per 1,000 live
births. Sudden unexpected infant
deaths (SUIDs) include deaths
from Sudden Infant Death
Syndrome (SIDS), unknown
cause, accidental suffocation and
strangulation in bed. Rates not
reported if number of deaths was
less than 20.
Teen Birth
Rate
Rate of births to
teens ages 15-19
years (per 1,000
population).
Maryland
Department of
Health and
Mental
Hygiene Vital
Statistics
Administration
Due to the difficulty in
determining the local levels of
pregnancy incidence using the
Maryland Pregnancy Risk
Assessment Monitoring System
(PRAMS), the indicator was
changed from percentage of
pregnancies that were intended in
SHIP 2011 to the rate of births to
teens age 15-19 in SHIP 2012. A
new 5% improvement target has
been set using 2009 teen birth
data as the baseline.
Early Prenatal
Care
Percent of
pregnant women
who receive
prenatal care
beginning in the
first trimester
Maryland
Department of
Health and
Mental
Hygiene Vital
Statistics
Administration
Due to the change in
methodology for collecting
information on the Maryland birth
certificate, data collected in 2010
and after are not comparable to
data collected in earlier years.

17
Students
Entering
Kindergarten
Ready to Learn
Percent of
students who
enter Kinder -
garten ready to
learn
Maryland State
Department of
Education
Percentages not reported where
number of children was less than
five.
High School
Graduation
Rate
Percent of
students who
graduate high
school in four
years
Maryland State
Department of
Education
SHIP currently uses the four-year
adjusted cohort graduation rate
which calculates the percentage
of students who graduate in four
years in an adjusted cohort which
includes the group of students
who enter 9th grade for the first
time, and adjusts for transfers in
and out of the cohort. SHIP
previously used the Leaver Rate
to measure high school
graduation.
Children
Receiving
Blood Lead
Screening
Percent of
children (aged 12-
35 months)
enrolled in
Medicaid (90+
days) who had
received a blood
lead screening
Maryland
Medicaid
Service
Utilization
Percent not reported if count was
less than seven.
Ship Vision Area 2: Healthy Living
Data Point Data Description Data Source Data Notes
Adults Who
Are At A
Healthy
Weight
Percent of adults
who are at a
healthy weight
Maryland
Behavioral
Risk Factor
Surveillance
System
In 2011 BRFSS began collecting
data via cell phone. Data
collected from 2011 forward is
not comparable to data collected
prior to 2011.
Children and
Adolescents
Who Are
Obese
Percent of
children and
adolescents who
are obese
Maryland
Youth Tobacco
and Risk
Behavior
Survey
Rates not reported where the total
number of students was less than
50.
Adults Who
Currently
Smoke
Percent of adults
who currently
smoke
Maryland
Behavioral
Risk Factor
Surveillance
System
In 2011 BRFSS began collecting
data via cell phone. Data
collected from 2011 forward is
not comparable to data collected
prior to 2011.
Adolescents
Who Use
Tobacco
Percent of
adolescents who
used any tobacco
Maryland
Youth Tobacco
Survey
Percent not reported where the
total number of students was less
than 50.

18
Products product in the last
30 days
Alcohol
Related
Driving
Fatalities
Rate of alcohol-
impaired driving
fatalities (per 100
million vehicle
miles traveled)
Maryland State
Highway
Administration
Rates not reported if number of
deaths was less than 20.
HIV Incidence
Rate
Rate of
adult/adolescent
cases (age 13+)
diagnosed with
HIV (per 100,000
population)
Maryland
Department of
Health and
Mental
Hygiene
Center for HIV
Surveillance
and
Epidemiology
The number of reported HIV
diagnoses among persons age 13
and older during a calendar year
is not a precise measure of new
HIV infections. Although new
technology can now distinguish
recent from longstanding HIV
infections, many HIV infections
are not diagnosed until years after
they occur9. Until DHMH is able
to obtain data on new infections
the measure will remain new
diagnoses.
Chlamydia
Infection Rate
Rate of
Chlamydia
infections per
100,000
population.
Maryland
Department of
Health and
Mental
Hygiene
Prevention and
Health
Promotion
Administration
Rates not reported where number
of incidences was less than 20.
Life
Expectancy
Life expectancy
from birth, in
years
Maryland
Department of
Health and
Mental
Hygiene Vital
Statistics
Administration
None
Increase
Physical
Activity
Number of
persons who
reported at least
150 minutes of
moderate physical
activity or at least
75 minutes of
vigorous physical
activity per week
Maryland
Behavioral
Risk Factor
Surveillance
System
In 2011 BRFSS began collecting
data via cell phone. Data
collected from 2011 forward is
not comparable to data collected
prior to 2011.
9 Estimates of New HIV Infections in the United States. Centers for Disease Control and Prevention. August 2008.
19
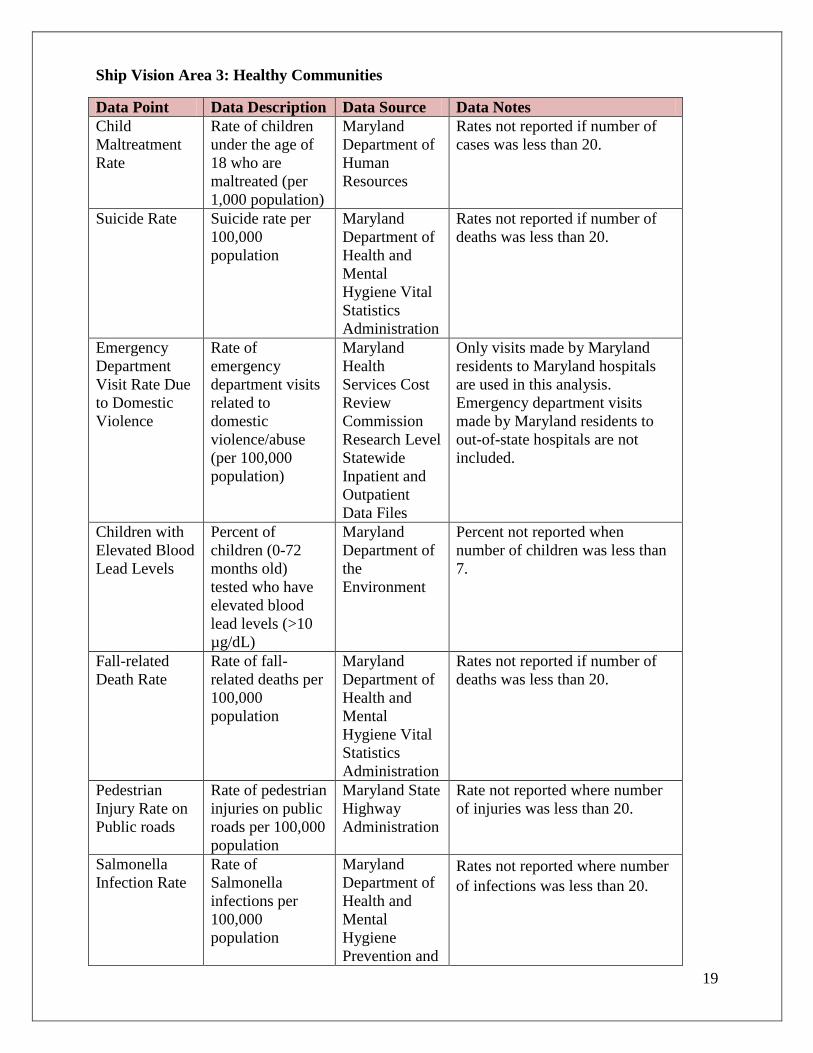
Ship Vision Area 3: Healthy Communities
Data Point Data Description Data Source Data Notes
Child
Maltreatment
Rate
Rate of children
under the age of
18 who are
maltreated (per
1,000 population)
Maryland
Department of
Human
Resources
Rates not reported if number of
cases was less than 20.
Suicide Rate Suicide rate per
100,000
population
Maryland
Department of
Health and
Mental
Hygiene Vital
Statistics
Administration
Rates not reported if number of
deaths was less than 20.
Emergency
Department
Visit Rate Due
to Domestic
Violence
Rate of
emergency
department visits
related to
domestic
violence/abuse
(per 100,000
population)
Maryland
Health
Services Cost
Review
Commission
Research Level
Statewide
Inpatient and
Outpatient
Data Files
Only visits made by Maryland
residents to Maryland hospitals
are used in this analysis.
Emergency department visits
made by Maryland residents to
out-of-state hospitals are not
included.
Children with
Elevated Blood
Lead Levels
Percent of
children (0-72
months old)
tested who have
elevated blood
lead levels (>10
µg/dL)
Maryland
Department of
the
Environment
Percent not reported when
number of children was less than
7.
Fall-related
Death Rate
Rate of fall-
related deaths per
100,000
population
Maryland
Department of
Health and
Mental
Hygiene Vital
Statistics
Administration
Rates not reported if number of
deaths was less than 20.
Pedestrian
Injury Rate on
Public roads
Rate of pedestrian
injuries on public
roads per 100,000
population
Maryland State
Highway
Administration
Rate not reported where number
of injuries was less than 20.
Salmonella
Infection Rate
Rate of
Salmonella
infections per
100,000
population
Maryland
Department of
Health and
Mental
Hygiene
Prevention and
Rates not reported where number
of infections was less than 20.

20
Health
Promotion
Administration
Average
Number of
Days Air
Quality Index
Exceeds 100
Average number
of days the Air
Quality Index
exceeds 100
United States
Environmental
Protection
Agency
Baseline measurement for the
State of Maryland is the average
of the unhealthy air quality days
for all counties for which air
quality is recorded.
Affordable
Housing
Percent of
housing units sold
that are affordable
on the median
teacher’s salary
Maryland
Department of
Planning
None
Ship Vision Area 4: Access to Healthcare
Data Point Data Description Data Source Data Notes
Adolescents
Who Receive
an Annual
Wellness
Checkup in the
Last Year
Percent of
adolescents (ages
13-20 years old)
enrolled in
Medicaid (320+
days) who
received a
wellness visit
during the past
year
Maryland
Medicaid
Service
Utilization
Percent not recorded if cell count
was less than 7.
Children
Receiving
Dental Care in
the Last Year
Percent of
children (aged 0-
20 years) enrolled
in Medicaid
(320+ days) who
had a dental visit
during the past
year
Maryland
Medicaid
Service
Utilization
Percent not recorded if cell count
was less than 7.
People Who
Cannot Afford
to See a Doctor
Percent of people
who were unable
to see a doctor
due to costs in the
past year
Maryland
Behavioral
Risk Factor
Surveillance
System
In 2011 BRFSS began collecting
data via cell phone. Data
collected from 2011 forward is
not comparable to data collected
prior to 2011.
Adults With
Health
Insurance
Percent of
persons aged 18-
64 with health
(medical)
insurance
Small Area
Health
Insurance
Estimates
(SAHIE),
United State
Census Bureau
SAHIE estimates are based on
data from the following sources:
American Community Survey
(ACS), demographic population
estimates, aggregated federal tax
returns, participation records for
the Supplemental Nutrition
Assistance Program (SNAP,
formerly known as the Food

21
Stamp program), County
Business Patterns, Medicaid and
Children's Health Insurance
Program (CHIP) participation
records, and Census 2000.
Ship Vision Area 5: Quality Preventative Care
Data Point Data Description Data Source Data Notes
Age Adjusted
Mortality Rate
from Cancer
Age-adjusted
mortality rate
from cancer (per
100,000
population)
Maryland
Department of
Health and
Mental
Hygiene Vital
Statistics
Administration
Rates not reported where the
number of deaths was less than
20. Data are age adjusted to the
2000 U.S. standard population.
Emergency
Department
Visit Rate Due
to Diabetes
Emergency
department visit
rate due to
diabetes (per
100,000
population)
Maryland
Health
Services Cost
Review
Commission
Research Level
Statewide
Inpatient and
Outpatient
Data Files
Only visits made by Maryland
residents to Maryland hospitals
are used in this analysis.
Emergency department visits
made by Maryland residents to
out-of-state hospitals are not
included. Data are coded by the
patient county of residence. The
methodology used to identify
Maryland residents in HSCRC
data files changed in 2014.
Therefore, data reports released in
2014 and beyond may not be
comparable to data reports
released in earlier years.
Emergency
Department
Visit Rate Due
to
Hypertension
Rate of
emergency
department visits
due to
hypertension (per
100,000
population)
Maryland
Health
Services Cost
Review
Commission
Research Level
Statewide
Inpatient and
Outpatient
Data Files
Only visits made by Maryland
residents to Maryland hospitals
are used in this analysis.
Emergency department visits
made by Maryland residents to
out-of-state hospitals are not
included.
Drug Induced
Death Rate
Drug-induced
death rate per
100,000
population
Maryland
Department of
Health and
Mental
Hygiene Vital
Statistics
Administration
Rates not reported where the
number of deaths was less than
20.

22
Emergency
Department
Visits Related
to Behavioral
Health
Rate of
emergency
department visits
related to
behavioral
health* (per
100,000
population)
Maryland
Health
Services Cost
Review
Commission
Research Level
Statewide
Inpatient and
Outpatient
Data Files
Rates not reported where number
of emergency department visits
was less than 20.
Only visits made by Maryland
residents to Maryland hospitals
are used in this analysis.
Emergency department visits
made by Maryland residents to
out-of-state hospitals are not
included. Data are coded by the
patient county of residence. The
methodology used to identify
Maryland residents in HSCRC
data files changed in 2014.
Therefore, data reports released in
2014 and beyond may not be
comparable to data reports
released in earlier years.
Hospitalization
Rate Related to
Alzheimer’s or
Dementia
Rate of
hospitalizations
related to
Alzheimer's or
other dementias
(per 100,000
population)
Maryland
Health
Services Cost
Review
Commission
Research Level
Statewide
Inpatient and
Outpatient
Data Files
Rates not reported where number
of hospital admissions was less
than 20. Only visits made by
Maryland residents to Maryland
hospitals are used in this analysis.
Emergency department visits
made by Maryland residents to
out-of-state hospitals are not
included. Data are coded by the
patient county of residence. The
methodology used to identify
Maryland residents in HSCRC
data files changed in 2014.
Therefore, data reports released in
2014 and beyond may not be
comparable to data reports
released in earlier years.
Children 19-35
Months Old
Who Receive
Recommended
Vaccines
Percent of
children (19-35
months) who
received the
recommended
vaccines
Centers for
Disease
Control
National
Immunization
Survey
Data published in Morbidity and
Mortality Weekly Report
Annually.
Children and
Adults Who
Are Vaccinated
Annually
Against
Seasonal
Influenza
The percentage of
children and
adults who are
vaccinated
annually against
seasonal
influenza
Centers for
Disease
Control
Behavioral
Risk Factor
Surveillance
System and
National
Coverage estimates are for all
persons over 6 months of age.
Estimates are for persons
interviewed September through
June of the next year who
reported being vaccinated August
through May. Estimates are
weighted to the age-specific

23
Immunization
Survey
population.
Emergency
Department
Visit Rate Due
to Asthma
Rate of
emergency
department visits
due to asthma per
10,000 population
Maryland
Health
Services Cost
Review
Commission
Research Level
Statewide
Inpatient and
Outpatient
Data Files
Only visits made by Maryland
residents to Maryland hospitals
are used in this analysis.
Emergency department visits
made by Maryland residents to
out-of-state hospitals are not
included. Data are coded by the
patient county of residence. The
methodology used to identify
Maryland residents in HSCRC
data files changed in 2014.
Therefore, data reports released in
2014 and beyond may not be
comparable to data reports
released in earlier years.
Age-Adjusted
Mortality Rate
from Heart
Disease
Age-adjusted
mortality rate
from heart disease
(per 100,000
population)
Maryland
Department of
Health and
Mental
Hygiene Vital
Statistics
Administration
Rates not reported when number
of deaths was less than 20.

24
Appendix C: Maryland SHIP Newsletter

25
26

27
Appendix D: Screenshot of SHIP Website
28
Appendix E: 2013 LHIC Priority Matrix
Related Documents