January 28, 2019 ICICI Securities Ltd | Retail Equity Research Result Update Muted growth to limit valuation multiples… Maruti Suzuki (MSIL) reported a dismal Q3FY19 performance Total operating income in Q3FY19 was at | 19,668 crore, up 2.0% YoY. ASP for the quarter came in at | 4.42 lakh/unit, up 0.5% YoY. However, discounting was aggressive at | 24,300/unit, up 30% QoQ Volumes for Q3FY19 were at 428,643 units, down 0.6% YoY. Of this, domestic volumes grew 1.3% YoY to 405,597 units while exports were down 25.0% YoY to 23,046 units. MSIL had to push extra 90,000 units at the retail level due to higher channel inventory with consequent inventory levels now normalising at December 2018 end EBITDA in Q3FY19 was at | 1,931 crore with corresponding EBITDA margins at 9.8%. EBITDA margins came in subdued primarily tracking higher raw material costs, adverse foreign exchange rate as well as higher sales & marketing expenses including launch cost of new Ertiga. Employee costs came in higher tracking execution of new wage bill as well as one-time actuarial valuation (~| 48 crore) PAT in Q3FY19 was at | 1,489 crore, down 17.0% YoY New facelifts to help revive sales, retain market leadership! In the recent past, MSIL has launched two new facelifts of its top selling models i.e. Ertiga and WagonR. MSIL has come out with a refreshed version loaded with all new age technology and consumer friendly features bundled at the right price thereby giving strong competition to upcoming models in the marketplace in the similar segment. We expect this to help Maruti retain its market leadership with the company already outperforming the industry in 9MFY19. Total domestic sales growth for MSIL was at 7.2% vs. 4.4% for the industry, leading to 165 bps gain in market share to 51.65% as of December 2018 vs. 50% as of FY18. Maruti still remains the preferred choice for first time buyers and is poised to benefit from low penetration of passenger vehicles domestically. The company commands strong support from its nationwide dealer network of ~3000 dealers with rural slate at ~39%.+. Single digit volume growth, P/E multiple’s mean reversion to follow! Purely considering the financials, past study of volume growth and one year forward P/E multiple at MSIL throws up an interesting insight. MSIL has never commanded one year forward P/E multiples significantly higher than 20x while clocking volume growth at <10%. It exactly symbolises the present times wherein the company is expected to post overall volume growth of 6.2% in FY19E & 7.2% in FY20E. This is expected to lead its one year forward P/E multiple to revert back to its mean. Capital efficiency to the core, healthy B/S, retain HOLD! MSIL has a capital efficiency business model wherein it realises ~3x asset turnover, operates with negative working capital cycle as well as realises ~13-15% EBITDA margins thereby realising core RoIC at ~50%+. It also has a debt free, cash rich B/S with surplus cash at ~| 34,000 crore. Going forward, however, the demand scenario is expected to be subdued, amid customers postponing their purchase and increasing penetration of shared mobility. It is also expected to be muted given peaking penetration of PVs in metro cities, which have high purchasing power. We expect volume growth to be muted at MSIL with FY18-20E overall volume CAGR growth pegged at 6.7%. Consequent net sales & PAT CAGR is expected at 8.0% & 5.5%, respectively. We value MSIL at | 6000 i.e. 21x P/E on FY20E EPS of | 284 and maintain our HOLD rating on the stock. We draw comfort from healthy cash flow generation at MSIL with average CFO yield at ~6% and consequent FCF yield at ~4%. Rating matrix Rating : Hold Target : | 6000 Target Period : 12 months Potential Upside : -8% What’s Changed? Target Changed from | 7250 to | 6000 EPS FY19E Changed from | 291 to | 250 EPS FY20E Changed from | 330 to | 284 Rating Unchanged Quarterly Performance (| Crore) Q3FY19 Q3FY18 YoY (%) Q1FY18 QoQ (%) Revenue 19,668.3 19,283.2 2.0 22,433.2 -12.3 EBITDA 1,931.1 3,037.8 -36.4 3,431.3 -43.7 EBITDA (%) 9.8 15.8 -594 bps 15.3 -548 bps Reported PAT 1,489.3 1,799.0 -17.2 2,240.4 -33.5 Key Financials | Crore FY17 FY18 FY19E FY20E Revenue 68,035 79,763 86,851 93,113 EBITDA 10,353.0 12,061.5 11,602.8 13,250.2 Net Profit 7,337.7 7,721.8 7,561.0 8,592.6 EPS (|) 242.9 255.6 250.3 284.4 Valuation summary FY17 FY18 FY19E FY20E P/E (x) 26.8 25.5 26.0 22.9 Target P/E (x) 24.7 23.5 24.0 21.1 EV/EBITDA (x) 16.4 13.5 13.8 11.8 P/BV (x) 5.4 4.7 4.2 3.8 RoNW (%) 20.3 18.5 16.3 16.6 RoCE (%) 20.3 21.1 17.8 18.8 Stock data Particular Amount Market Capitalization (| Crore) | 196956.2 Crore Total Debt | 110.8 Crore Cash & Investment | 34153.1 Crore EV | 162913.9 Crore 52 week H/L (|) 9923 / 6502 Equity capital (| crore) | 151 Crore Face value (|) | 5 Price performance (%) 1M 3M 6M 12M M&M Ltd -13.3 -6.8 -24.9 -9.8 Maruti Suzuki India -13.5 -3.1 -33.3 -29.8 Tata Motors 0.4 4.8 -32.8 -56.7 Maruti Suzuki India (MARUTI) | 6520 Research Analyst Shashank Kanodia, CFA [email protected] Jaimin Desai [email protected]

Welcome message from author
This document is posted to help you gain knowledge. Please leave a comment to let me know what you think about it! Share it to your friends and learn new things together.
Transcript
January 28, 2019
ICICI Securities Ltd | Retail Equity Research
Result Update
Muted growth to limit valuation multiples…
Maruti Suzuki (MSIL) reported a dismal Q3FY19 performance
Total operating income in Q3FY19 was at | 19,668 crore, up 2.0%
YoY. ASP for the quarter came in at | 4.42 lakh/unit, up 0.5% YoY.
However, discounting was aggressive at | 24,300/unit, up 30% QoQ
Volumes for Q3FY19 were at 428,643 units, down 0.6% YoY. Of this,
domestic volumes grew 1.3% YoY to 405,597 units while exports
were down 25.0% YoY to 23,046 units. MSIL had to push extra
90,000 units at the retail level due to higher channel inventory with
consequent inventory levels now normalising at December 2018 end
EBITDA in Q3FY19 was at | 1,931 crore with corresponding EBITDA
margins at 9.8%. EBITDA margins came in subdued primarily
tracking higher raw material costs, adverse foreign exchange rate as
well as higher sales & marketing expenses including launch cost of
new Ertiga. Employee costs came in higher tracking execution of
new wage bill as well as one-time actuarial valuation (~| 48 crore)
PAT in Q3FY19 was at | 1,489 crore, down 17.0% YoY
New facelifts to help revive sales, retain market leadership!
In the recent past, MSIL has launched two new facelifts of its top selling
models i.e. Ertiga and WagonR. MSIL has come out with a refreshed
version loaded with all new age technology and consumer friendly
features bundled at the right price thereby giving strong competition to
upcoming models in the marketplace in the similar segment. We expect
this to help Maruti retain its market leadership with the company already
outperforming the industry in 9MFY19. Total domestic sales growth for
MSIL was at 7.2% vs. 4.4% for the industry, leading to 165 bps gain in
market share to 51.65% as of December 2018 vs. 50% as of FY18. Maruti
still remains the preferred choice for first time buyers and is poised to
benefit from low penetration of passenger vehicles domestically. The
company commands strong support from its nationwide dealer network
of ~3000 dealers with rural slate at ~39%.+.
Single digit volume growth, P/E multiple’s mean reversion to follow!
Purely considering the financials, past study of volume growth and one
year forward P/E multiple at MSIL throws up an interesting insight. MSIL
has never commanded one year forward P/E multiples significantly higher
than 20x while clocking volume growth at <10%. It exactly symbolises
the present times wherein the company is expected to post overall
volume growth of 6.2% in FY19E & 7.2% in FY20E. This is expected to
lead its one year forward P/E multiple to revert back to its mean.
Capital efficiency to the core, healthy B/S, retain HOLD!
MSIL has a capital efficiency business model wherein it realises ~3x asset
turnover, operates with negative working capital cycle as well as realises
~13-15% EBITDA margins thereby realising core RoIC at ~50%+. It also
has a debt free, cash rich B/S with surplus cash at ~| 34,000 crore. Going
forward, however, the demand scenario is expected to be subdued, amid
customers postponing their purchase and increasing penetration of
shared mobility. It is also expected to be muted given peaking penetration
of PVs in metro cities, which have high purchasing power. We expect
volume growth to be muted at MSIL with FY18-20E overall volume CAGR
growth pegged at 6.7%. Consequent net sales & PAT CAGR is expected at
8.0% & 5.5%, respectively. We value MSIL at | 6000 i.e. 21x P/E on FY20E
EPS of | 284 and maintain our HOLD rating on the stock. We draw
comfort from healthy cash flow generation at MSIL with average CFO
yield at ~6% and consequent FCF yield at ~4%.
Rating matrix
Rating : Hold
Target : | 6000
Target Period : 12 months
Potential Upside : -8%
What’s Changed?
Target Changed from | 7250 to | 6000
EPS FY19E Changed from | 291 to | 250
EPS FY20E Changed from | 330 to | 284
Rating Unchanged
Quarterly Performance
(| Crore) Q3FY19 Q3FY18 YoY (%) Q1FY18 QoQ (%)
Revenue 19,668.3 19,283.2 2.0 22,433.2 -12.3
EBITDA 1,931.1 3,037.8 -36.4 3,431.3 -43.7
EBITDA (%) 9.8 15.8 -594 bps 15.3 -548 bps
Reported PAT 1,489.3 1,799.0 -17.2 2,240.4 -33.5
Key Financials
| Crore FY17 FY18 FY19E FY20E
Revenue 68,035 79,763 86,851 93,113
EBITDA 10,353.0 12,061.5 11,602.8 13,250.2
Net Profit 7,337.7 7,721.8 7,561.0 8,592.6
EPS (|) 242.9 255.6 250.3 284.4
Valuation summary
FY17 FY18 FY19E FY20E
P/E (x) 26.8 25.5 26.0 22.9
Target P/E (x) 24.7 23.5 24.0 21.1
EV/EBITDA (x) 16.4 13.5 13.8 11.8
P/BV (x) 5.4 4.7 4.2 3.8
RoNW (%) 20.3 18.5 16.3 16.6
RoCE (%) 20.3 21.1 17.8 18.8
Stock data
Particular Amount
Market Capitalization (| Crore) | 196956.2 Crore
Total Debt | 110.8 Crore
Cash & Investment | 34153.1 Crore
EV | 162913.9 Crore
52 week H/L (|) 9923 / 6502
Equity capital (| crore) | 151 Crore
Face value (|) | 5
Price performance (%)
1M 3M 6M 12M
M&M Ltd -13.3 -6.8 -24.9 -9.8
Maruti Suzuki India -13.5 -3.1 -33.3 -29.8
Tata Motors 0.4 4.8 -32.8 -56.7
Maruti Suzuki India (MARUTI) | 6520
Research Analyst
Shashank Kanodia, CFA
Jaimin Desai
ICICI Securities Ltd | Retail Equity Research Page 2
x
Variance analysis
Q3FY19 Q3FY19E Q3FY18 YoY (Chg %) Q2FY19 QoQ (Chg %) Comments
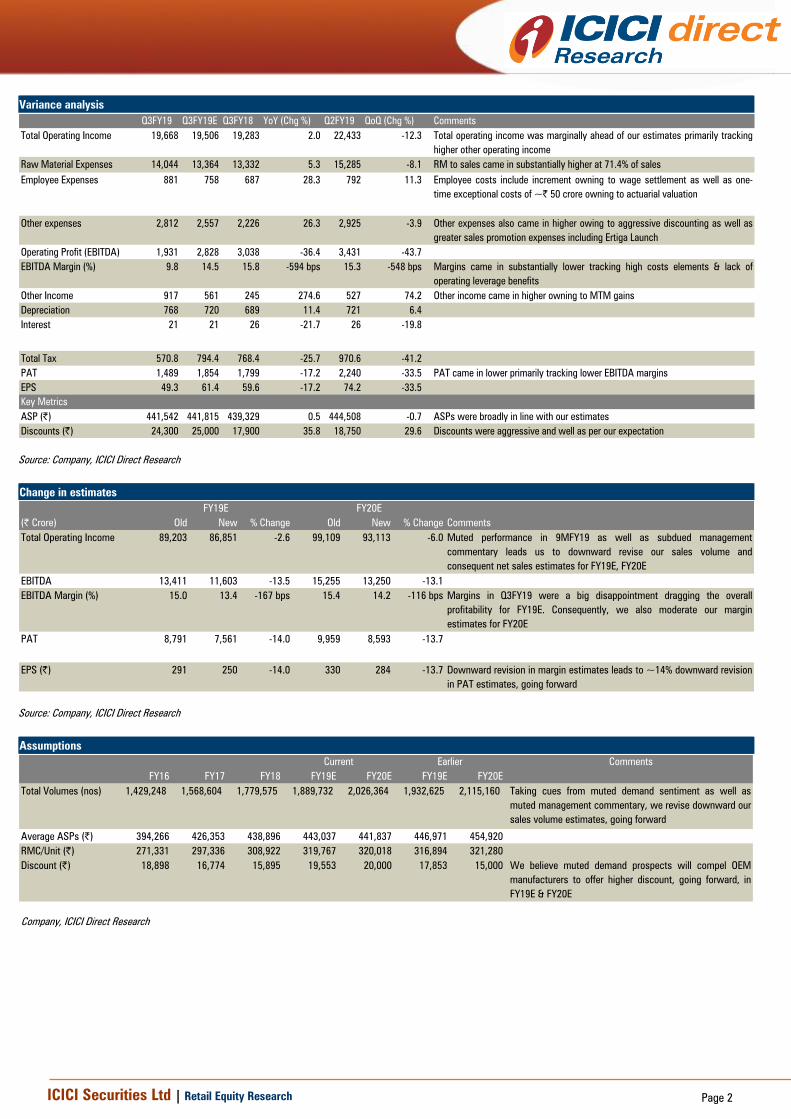
Total Operating Income 19,668 19,506 19,283 2.0 22,433 -12.3 Total operating income was marginally ahead of our estimates primarily tracking
higher other operating income
Raw Material Expenses 14,044 13,364 13,332 5.3 15,285 -8.1 RM to sales came in substantially higher at 71.4% of sales
Employee Expenses 881 758 687 28.3 792 11.3 Employee costs include increment owning to wage settlement as well as one-
time exceptional costs of ~| 50 crore owning to actuarial valuation
Other expenses 2,812 2,557 2,226 26.3 2,925 -3.9 Other expenses also came in higher owing to aggressive discounting as well as
greater sales promotion expenses including Ertiga Launch
Operating Profit (EBITDA) 1,931 2,828 3,038 -36.4 3,431 -43.7
EBITDA Margin (%) 9.8 14.5 15.8 -594 bps 15.3 -548 bps Margins came in substantially lower tracking high costs elements & lack of
operating leverage benefits
Other Income 917 561 245 274.6 527 74.2 Other income came in higher owning to MTM gains
Depreciation 768 720 689 11.4 721 6.4
Interest 21 21 26 -21.7 26 -19.8
Total Tax 570.8 794.4 768.4 -25.7 970.6 -41.2
PAT 1,489 1,854 1,799 -17.2 2,240 -33.5 PAT came in lower primarily tracking lower EBITDA margins
EPS 49.3 61.4 59.6 -17.2 74.2 -33.5
Key Metrics
ASP (|) 441,542 441,815 439,329 0.5 444,508 -0.7 ASPs were broadly in line with our estimates
Discounts (|) 24,300 25,000 17,900 35.8 18,750 29.6 Discounts were aggressive and well as per our expectation
Source: Company, ICICI Direct Research
Change in estimates
(| Crore) Old New % Change Old New % Change Comments
Total Operating Income 89,203 86,851 -2.6 99,109 93,113 -6.0 Muted performance in 9MFY19 as well as subdued management
commentary leads us to downward revise our sales volume and
consequent net sales estimates for FY19E, FY20E
EBITDA 13,411 11,603 -13.5 15,255 13,250 -13.1
EBITDA Margin (%) 15.0 13.4 -167 bps 15.4 14.2 -116 bps Margins in Q3FY19 were a big disappointment dragging the overall
profitability for FY19E. Consequently, we also moderate our margin
estimates for FY20E
PAT 8,791 7,561 -14.0 9,959 8,593 -13.7
EPS (|) 291 250 -14.0 330 284 -13.7 Downward revision in margin estimates leads to ~14% downward revision
in PAT estimates, going forward
FY19E FY20E
Source: Company, ICICI Direct Research
Assumptions
Comments
FY16 FY17 FY18 FY19E FY20E FY19E FY20E
Total Volumes (nos) 1,429,248 1,568,604 1,779,575 1,889,732 2,026,364 1,932,625 2,115,160 Taking cues from muted demand sentiment as well as
muted management commentary, we revise downward our
sales volume estimates, going forward
Average ASPs (|) 394,266 426,353 438,896 443,037 441,837 446,971 454,920
RMC/Unit (|) 271,331 297,336 308,922 319,767 320,018 316,894 321,280
Discount (|) 18,898 16,774 15,895 19,553 20,000 17,853 15,000 We believe muted demand prospects will compel OEM
manufacturers to offer higher discount, going forward, in
FY19E & FY20E
Current Earlier
Company, ICICI Direct Research
ICICI Securities Ltd | Retail Equity Research Page 3
Conference Call Highlights
Management outlook/guidance & demand
According to the company, the market remains under pressure
with retail demand still subdued amid worries on the ownership
cost perspective. The industry is now expected to post 4.5% YoY
volume growth in FY19E although the company is poised to
growth faster. Retail sales at MSIL in 9MFY19 stood at 4.9% YoY.
Exports are expected to clock flat volumes in FY20 over FY19E on
the back of import restriction in key markets like Indonesia
The rural segment (39% of overall pie) has exhibited 13% growth
against a flattish urban segment
MSIL undertook significant inventory liquidation efforts in
December to aid dealers post the disappointing festive season
offtake, helping retail 90,000 units
Response to new launches Ertiga and WagonR is strong, with
order levels to the tune of 55,000 units and 14,000 units
respectively. Waiting period of Ertiga is high at 28 weeks
Revenue & margins
Discounts in Q3FY19 amounted to ~| 24,300 per unit
A sequential slide in EBITDA margins of ~300 bps was the result
of higher commodity prices (~100 bps), higher sales promotion
expenses (~100 bps), adverse exchange rate movement (~50
bps) and inventory adjustment efforts (~30 bps)
MSIL also incurred incremental sales & marketing expenses
amounting to ~| 78 crore on QOQ basis.
Depreciation expense increase was owning to commissioning of
some new machineries.
Employee expenses spiked in Q3FY19 owing to implementation
of wage enhancement mechanism and one-off actuarial valuation
impact of ~| 48 crore
Thus far, MSIL has taken a price hike of ~70 bps in Q4FY19
Exports revenue for Q3FY19 was to the tune of | 1,158 crore
Royalty payments for Q3FY19 amounted to ~5.5% of revenues
Others
Six models (Ignis, Dzire, Brezza, Swift, Ertiga and WagonR) have
been shifted to the new rupee denominated royalty formula. The
entire product portfolio is expected to make the switch by 2022
Gujarat plant produced ~58,000 units in Q3FY19 against ~67,000
units in Q2FY19 and ~36,000 units in Q3FY18
MSIL usually enters into a relatively longer dated six month or
three month contracts for procuring its key material i.e. steel,
while it enters into monthly contracts for procuring aluminium
ICICI Securities Ltd | Retail Equity Research Page 4
Company Analysis
New facelifts encouraging; to help revive sales, retain market leadership!
MSIL in the recent past has launched to new facelifts of its top selling
models i.e. Ertiga and WagonR. MSIL has come out with refreshed
version loaded with all new age technology and consumer friendly
features bundled at the right price thereby giving strong competition to
the upcoming models in the market place in the similar segment. We
expect this to help Maruti retain its market leadership with company
already outperforming the industry in 9MFY19. Total domestic sales
growth at MSIL was at 7.2% vs. 4.4% for the industry leading to 165 bps
gain in market share to 51.65% as of December 2018 vs. 50% as of FY18.
Maruti still remains the preferred choice for first time buyers and is set to
benefit from low penetration of passenger vehicles domestically. The
company commands strong support from its nationwide dealer network
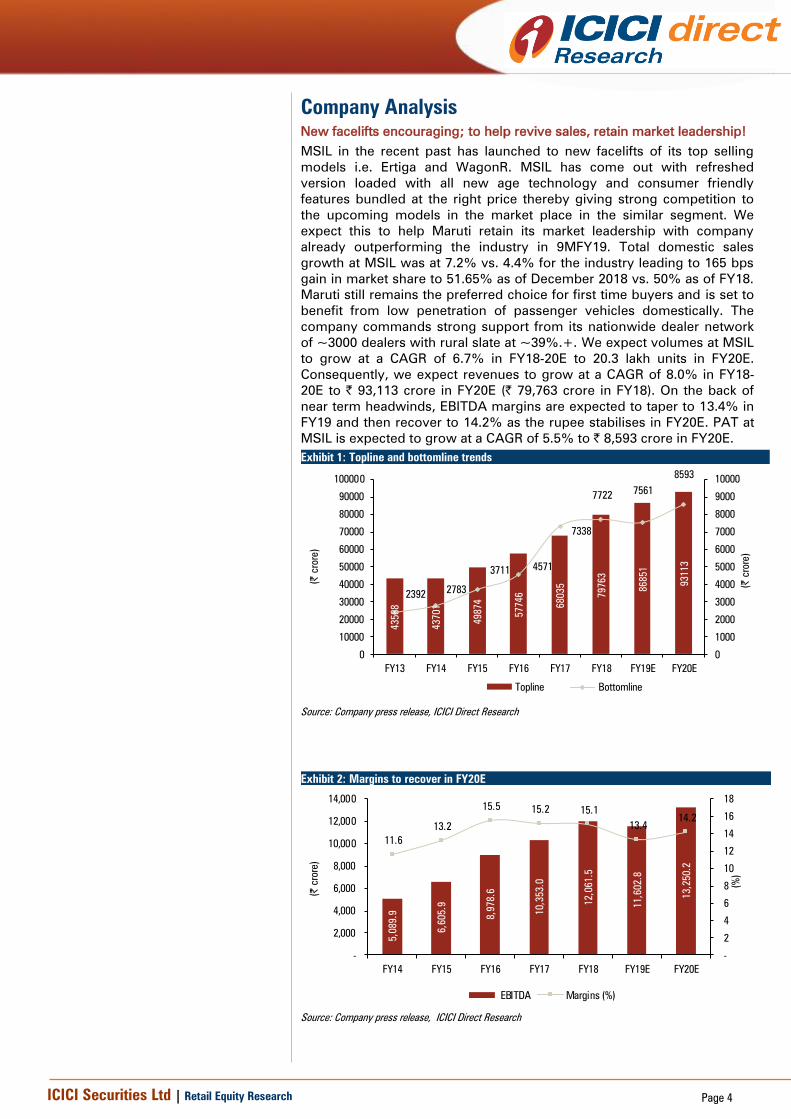
of ~3000 dealers with rural slate at ~39%.+. We expect volumes at MSIL
to grow at a CAGR of 6.7% in FY18-20E to 20.3 lakh units in FY20E.
Consequently, we expect revenues to grow at a CAGR of 8.0% in FY18-
20E to | 93,113 crore in FY20E (| 79,763 crore in FY18). On the back of
near term headwinds, EBITDA margins are expected to taper to 13.4% in
FY19 and then recover to 14.2% as the rupee stabilises in FY20E. PAT at
MSIL is expected to grow at a CAGR of 5.5% to | 8,593 crore in FY20E.
Exhibit 1: Topline and bottomline trends
43588
43701
49874
57746
68035
79763
86851
93113
23922783
37114571
7338
77227561
8593
0
1000
2000
3000
4000
5000
6000
7000
8000
9000
10000
0
10000
20000
30000
40000
50000
60000
70000
80000
90000
100000
FY13 FY14 FY15 FY16 FY17 FY18 FY19E FY20E
(| crore)
(| crore)
Topline Bottomline
Source: Company press release, ICICI Direct Research
Exhibit 2: Margins to recover in FY20E
5,089.9
6,605.9
8,978.6
10,353.0
12,061.5
11,602.8
13,250.2
11.6
13.2
15.5 15.2 15.1
13.4
14.2
-
2
4
6
8
10
12
14
16
18
-
2,000
4,000
6,000
8,000
10,000
12,000
14,000
FY14 FY15 FY16 FY17 FY18 FY19E FY20E
(%
)
(| crore)
EBITDA Margins (%)
Source: Company press release, ICICI Direct Research
ICICI Securities Ltd | Retail Equity Research Page 5
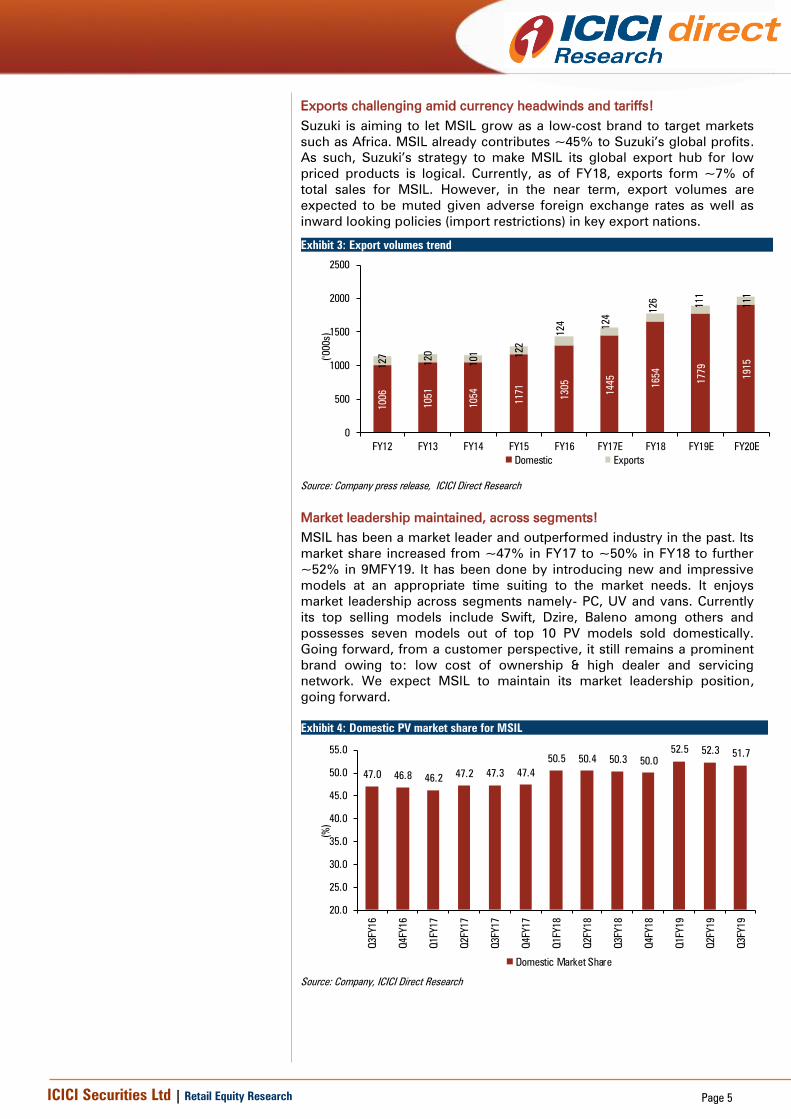
Exports challenging amid currency headwinds and tariffs!
Suzuki is aiming to let MSIL grow as a low-cost brand to target markets
such as Africa. MSIL already contributes ~45% to Suzuki’s global profits.
As such, Suzuki’s strategy to make MSIL its global export hub for low
priced products is logical. Currently, as of FY18, exports form ~7% of
total sales for MSIL. However, in the near term, export volumes are
expected to be muted given adverse foreign exchange rates as well as
inward looking policies (import restrictions) in key export nations.
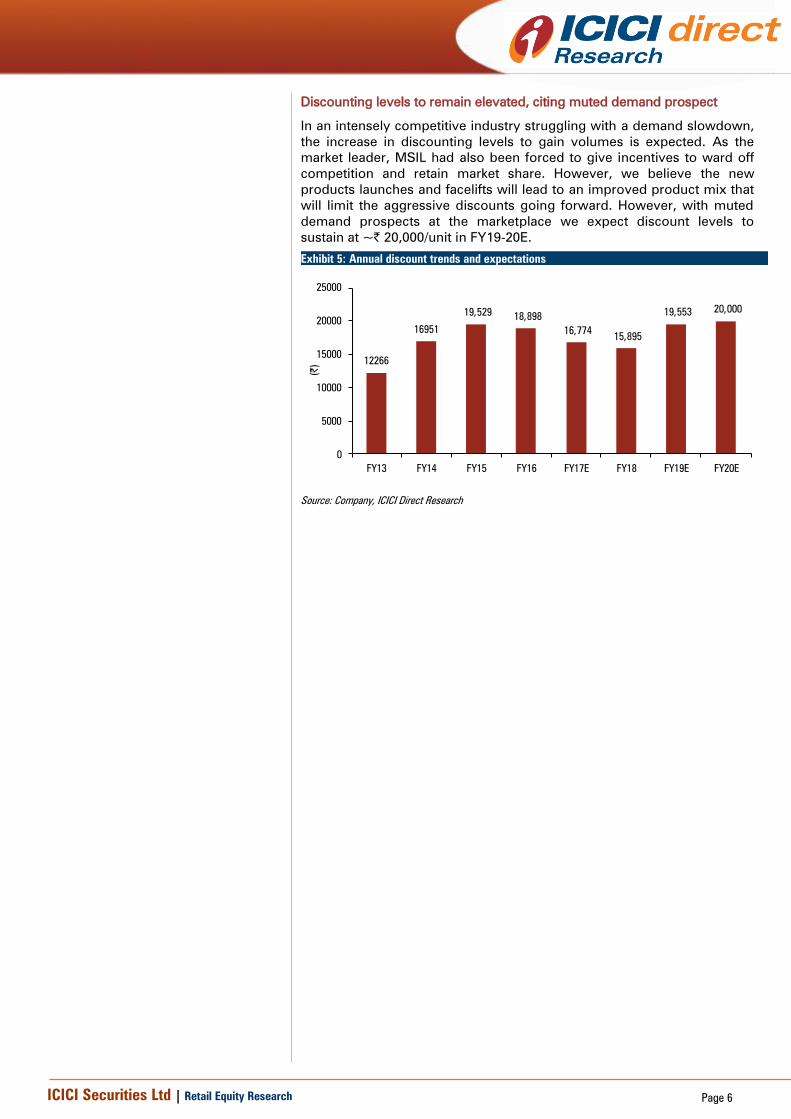
Market leadership maintained, across segments!
MSIL has been a market leader and outperformed industry in the past. Its
market share increased from ~47% in FY17 to ~50% in FY18 to further
~52% in 9MFY19. It has been done by introducing new and impressive
models at an appropriate time suiting to the market needs. It enjoys
market leadership across segments namely- PC, UV and vans. Currently
its top selling models include Swift, Dzire, Baleno among others and
possesses seven models out of top 10 PV models sold domestically.
Going forward, from a customer perspective, it still remains a prominent
brand owing to: low cost of ownership & high dealer and servicing
network. We expect MSIL to maintain its market leadership position,
going forward.
Exhibit 4: Domestic PV market share for MSIL
47.0 46.8 46.247.2 47.3 47.4
50.5 50.4 50.3 50.0
52.5 52.351.7
20.0
25.0
30.0
35.0
40.0
45.0
50.0
55.0
Q3FY16
Q4FY16
Q1FY17
Q2FY17
Q3FY17
Q4FY17
Q1FY18
Q2FY18
Q3FY18
Q4FY18
Q1FY19
Q2FY19
Q3FY19
(%
)
Domestic Market Share
Source: Company, ICICI Direct Research
Exhibit 3: Export volumes trend
1006
1051
1054
1171
1305
1445
1654
1779
1915
127
120
101 122
124
124
126
111
111
0
500
1000
1500
2000
2500
FY12 FY13 FY14 FY15 FY16 FY17E FY18 FY19E FY20E
('0
00s)
Domestic Exports
Source: Company press release, ICICI Direct Research
ICICI Securities Ltd | Retail Equity Research Page 6
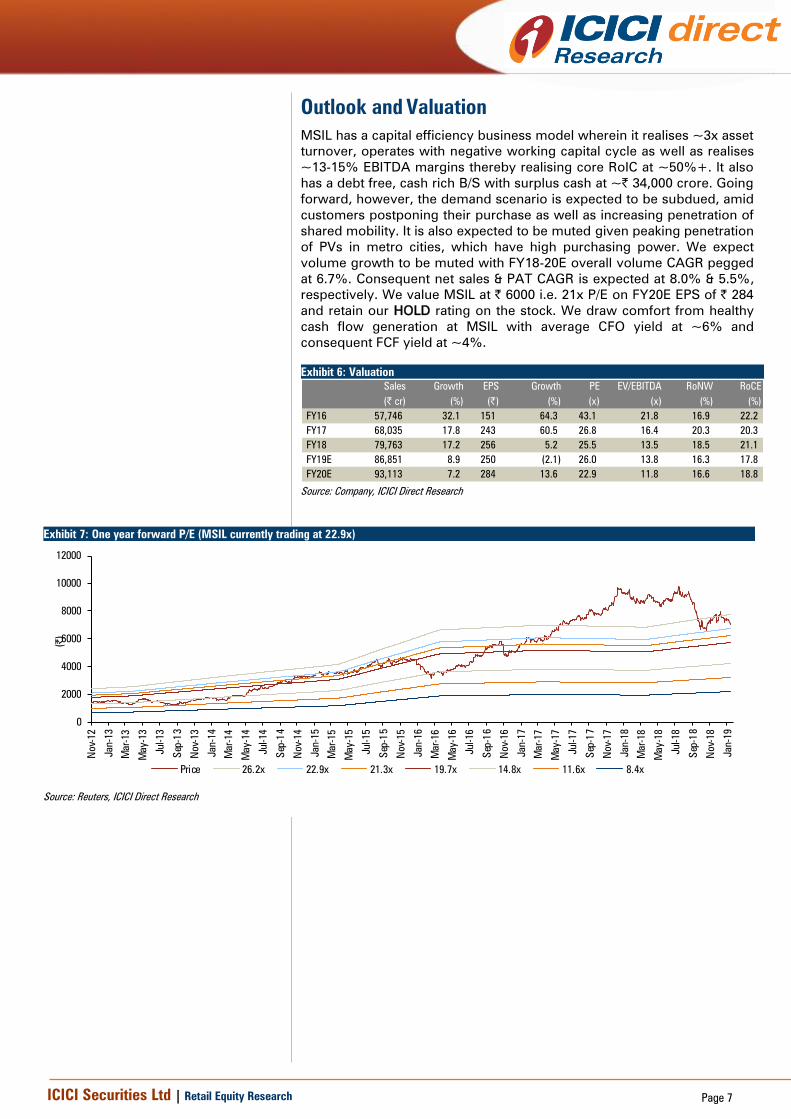
Discounting levels to remain elevated, citing muted demand prospect
In an intensely competitive industry struggling with a demand slowdown,
the increase in discounting levels to gain volumes is expected. As the
market leader, MSIL had also been forced to give incentives to ward off
competition and retain market share. However, we believe the new
products launches and facelifts will lead to an improved product mix that
will limit the aggressive discounts going forward. However, with muted
demand prospects at the marketplace we expect discount levels to
sustain at ~| 20,000/unit in FY19-20E.
Exhibit 5: Annual discount trends and expectations
12266
16951
19,529 18,898
16,774 15,895
19,553 20,000
0
5000
10000
15000
20000
25000
FY13 FY14 FY15 FY16 FY17E FY18 FY19E FY20E
(|)
Source: Company, ICICI Direct Research
ICICI Securities Ltd | Retail Equity Research Page 7
Outlook and Valuation
MSIL has a capital efficiency business model wherein it realises ~3x asset
turnover, operates with negative working capital cycle as well as realises
~13-15% EBITDA margins thereby realising core RoIC at ~50%+. It also
has a debt free, cash rich B/S with surplus cash at ~| 34,000 crore. Going
forward, however, the demand scenario is expected to be subdued, amid
customers postponing their purchase as well as increasing penetration of
shared mobility. It is also expected to be muted given peaking penetration
of PVs in metro cities, which have high purchasing power. We expect
volume growth to be muted with FY18-20E overall volume CAGR pegged
at 6.7%. Consequent net sales & PAT CAGR is expected at 8.0% & 5.5%,
respectively. We value MSIL at | 6000 i.e. 21x P/E on FY20E EPS of | 284
and retain our HOLD rating on the stock. We draw comfort from healthy
cash flow generation at MSIL with average CFO yield at ~6% and
consequent FCF yield at ~4%.
Exhibit 6: Valuation
Sales Growth EPS Growth PE EV/EBITDA RoNW RoCE
(| cr) (%) (|) (%) (x) (x) (%) (%)
FY16 57,746 32.1 151 64.3 43.1 21.8 16.9 22.2
FY17 68,035 17.8 243 60.5 26.8 16.4 20.3 20.3
FY18 79,763 17.2 256 5.2 25.5 13.5 18.5 21.1
FY19E 86,851 8.9 250 (2.1) 26.0 13.8 16.3 17.8
FY20E 93,113 7.2 284 13.6 22.9 11.8 16.6 18.8
Source: Company, ICICI Direct Research
Exhibit 7: One year forward P/E (MSIL currently trading at 22.9x)
0
2000
4000
6000
8000
10000
12000
Nov-12
Jan-13
Mar-13
May-13
Jul-13
Sep-1
3
Nov-13
Jan-14
Mar-14
May-14
Jul-14
Sep-1
4
Nov-14
Jan-15
Mar-15
May-15
Jul-15
Sep-1
5
Nov-15
Jan-16
Mar-16
May-16
Jul-16
Sep-1
6
Nov-16
Jan-17
Mar-17
May-17
Jul-17
Sep-1
7
Nov-17
Jan-18
Mar-18
May-18
Jul-18
Sep-1
8
Nov-18
Jan-19
(|)
Price 26.2x 22.9x 21.3x 19.7x 14.8x 11.6x 8.4x
Source: Reuters, ICICI Direct Research
ICICI Securities Ltd | Retail Equity Research Page 8
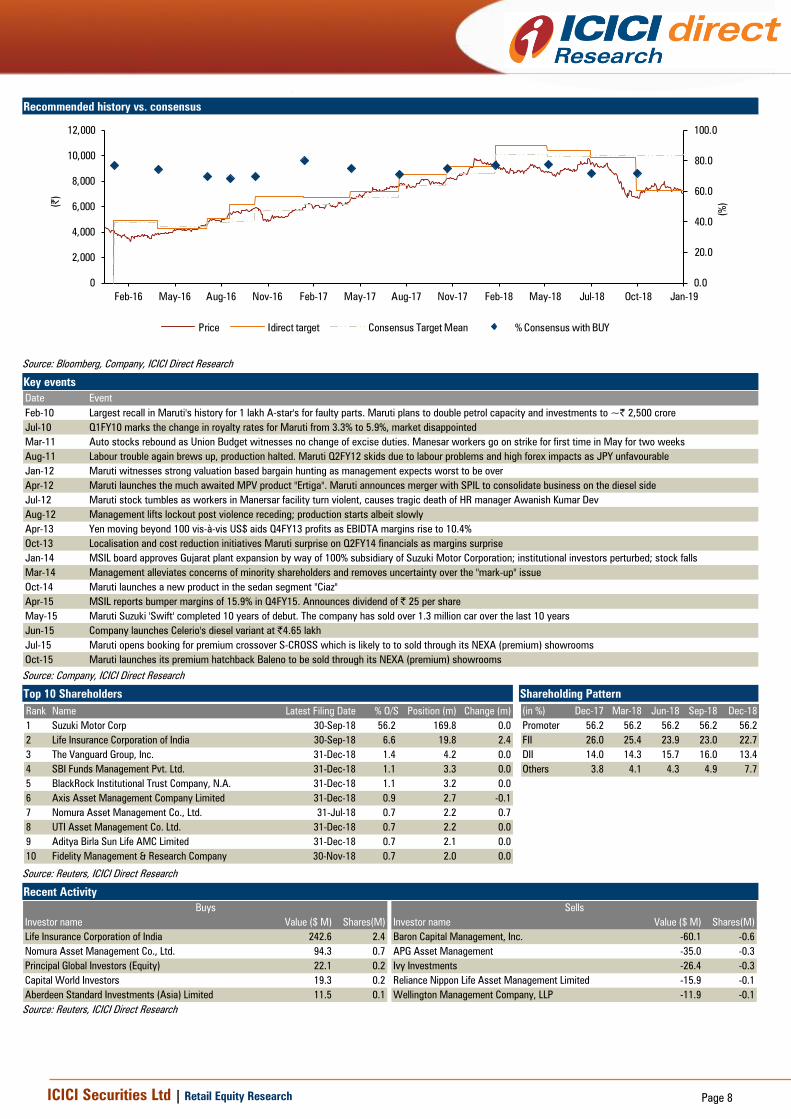
Recommended history vs. consensus
0.0
20.0
40.0
60.0
80.0
100.0
0
2,000
4,000
6,000
8,000
10,000
12,000
Jan-19Oct-18Jul-18May-18Feb-18Nov-17Aug-17May-17Feb-17Nov-16Aug-16May-16Feb-16
(%
)(|)
Price Idirect target Consensus Target Mean % Consensus with BUY
Source: Bloomberg, Company, ICICI Direct Research
Key events
Date Event
Feb-10 Largest recall in Maruti's history for 1 lakh A-star's for faulty parts. Maruti plans to double petrol capacity and investments to ~| 2,500 crore
Jul-10 Q1FY10 marks the change in royalty rates for Maruti from 3.3% to 5.9%, market disappointed
Mar-11 Auto stocks rebound as Union Budget witnesses no change of excise duties. Manesar workers go on strike for first time in May for two weeks
Aug-11 Labour trouble again brews up, production halted. Maruti Q2FY12 skids due to labour problems and high forex impacts as JPY unfavourable
Jan-12 Maruti witnesses strong valuation based bargain hunting as management expects worst to be over
Apr-12 Maruti launches the much awaited MPV product "Ertiga". Maruti announces merger with SPIL to consolidate business on the diesel side
Jul-12 Maruti stock tumbles as workers in Manersar facility turn violent, causes tragic death of HR manager Awanish Kumar Dev
Aug-12 Management lifts lockout post violence receding; production starts albeit slowly
Apr-13 Yen moving beyond 100 vis-à-vis US$ aids Q4FY13 profits as EBIDTA margins rise to 10.4%
Oct-13 Localisation and cost reduction initiatives Maruti surprise on Q2FY14 financials as margins surprise
Jan-14 MSIL board approves Gujarat plant expansion by way of 100% subsidiary of Suzuki Motor Corporation; institutional investors perturbed; stock falls
Mar-14 Management alleviates concerns of minority shareholders and removes uncertainty over the "mark-up" issue
Oct-14 Maruti launches a new product in the sedan segment "Ciaz"
Apr-15 MSIL reports bumper margins of 15.9% in Q4FY15. Announces dividend of | 25 per share
May-15 Maruti Suzuki 'Swift' completed 10 years of debut. The company has sold over 1.3 million car over the last 10 years
Jun-15 Company launches Celerio's diesel variant at |4.65 lakh
Jul-15 Maruti opens booking for premium crossover S-CROSS which is likely to to sold through its NEXA (premium) showrooms
Oct-15 Maruti launches its premium hatchback Baleno to be sold through its NEXA (premium) showrooms
Source: Company, ICICI Direct Research
Top 10 Shareholders Shareholding Pattern
Rank Name Latest Filing Date % O/S Position (m) Change (m)
1 Suzuki Motor Corp 30-Sep-18 56.2 169.8 0.0
2 Life Insurance Corporation of India 30-Sep-18 6.6 19.8 2.4
3 The Vanguard Group, Inc. 31-Dec-18 1.4 4.2 0.0
4 SBI Funds Management Pvt. Ltd. 31-Dec-18 1.1 3.3 0.0
5 BlackRock Institutional Trust Company, N.A. 31-Dec-18 1.1 3.2 0.0
6 Axis Asset Management Company Limited 31-Dec-18 0.9 2.7 -0.1
7 Nomura Asset Management Co., Ltd. 31-Jul-18 0.7 2.2 0.7
8 UTI Asset Management Co. Ltd. 31-Dec-18 0.7 2.2 0.0
9 Aditya Birla Sun Life AMC Limited 31-Dec-18 0.7 2.1 0.0
10 Fidelity Management & Research Company 30-Nov-18 0.7 2.0 0.0
(in %) Dec-17 Mar-18 Jun-18 Sep-18 Dec-18
Promoter 56.2 56.2 56.2 56.2 56.2
FII 26.0 25.4 23.9 23.0 22.7
DII 14.0 14.3 15.7 16.0 13.4
Others 3.8 4.1 4.3 4.9 7.7
Source: Reuters, ICICI Direct Research
Recent Activity
Investor name Value ($ M) Shares(M) Investor name Value ($ M) Shares(M)
Life Insurance Corporation of India 242.6 2.4 Baron Capital Management, Inc. -60.1 -0.6
Nomura Asset Management Co., Ltd. 94.3 0.7 APG Asset Management -35.0 -0.3
Principal Global Investors (Equity) 22.1 0.2 Ivy Investments -26.4 -0.3
Capital World Investors 19.3 0.2 Reliance Nippon Life Asset Management Limited -15.9 -0.1
Aberdeen Standard Investments (Asia) Limited 11.5 0.1 Wellington Management Company, LLP -11.9 -0.1
Buys Sells
Source: Reuters, ICICI Direct Research
ICICI Securities Ltd | Retail Equity Research Page 9
.
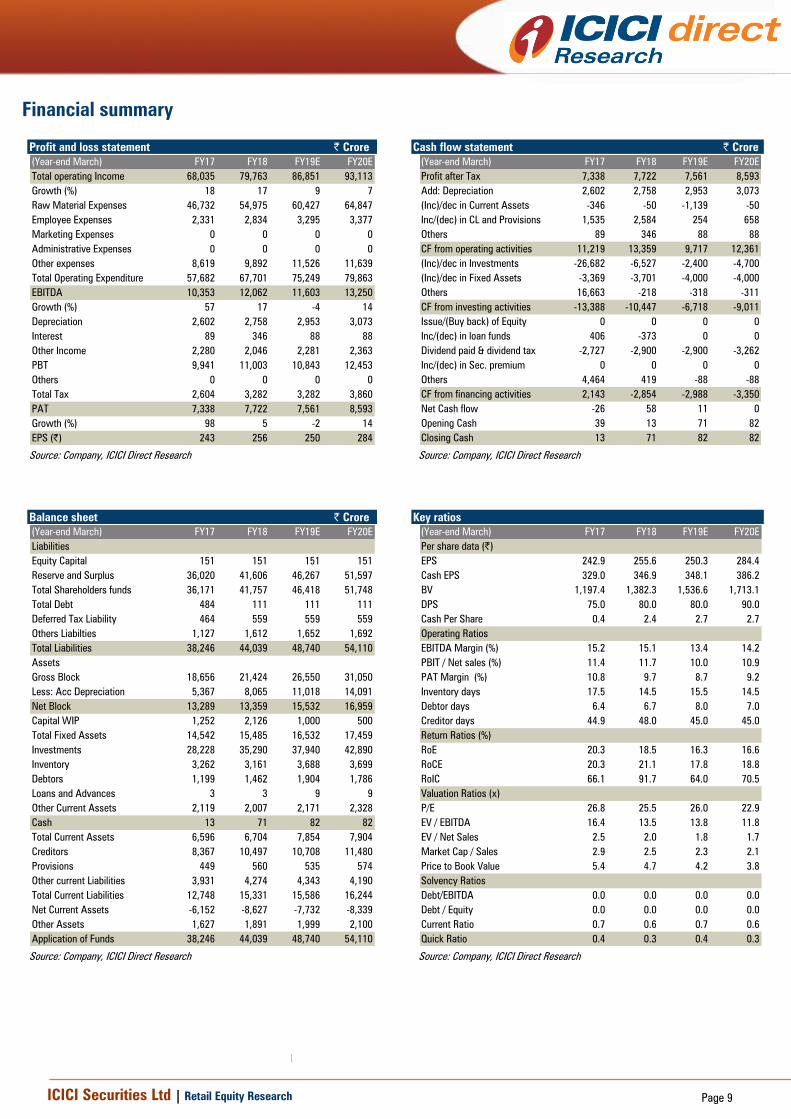
Financial summary
Profit and loss statement | Crore
(Year-end March) FY17 FY18 FY19E FY20E
Total operating Income 68,035 79,763 86,851 93,113
Growth (%) 18 17 9 7
Raw Material Expenses 46,732 54,975 60,427 64,847
Employee Expenses 2,331 2,834 3,295 3,377
Marketing Expenses 0 0 0 0
Administrative Expenses 0 0 0 0
Other expenses 8,619 9,892 11,526 11,639
Total Operating Expenditure 57,682 67,701 75,249 79,863
EBITDA 10,353 12,062 11,603 13,250
Growth (%) 57 17 -4 14
Depreciation 2,602 2,758 2,953 3,073
Interest 89 346 88 88
Other Income 2,280 2,046 2,281 2,363
PBT 9,941 11,003 10,843 12,453
Others 0 0 0 0
Total Tax 2,604 3,282 3,282 3,860
PAT 7,338 7,722 7,561 8,593
Growth (%) 98 5 -2 14
EPS (|) 243 256 250 284
Source: Company, ICICI Direct Research
Cash flow statement | Crore
(Year-end March) FY17 FY18 FY19E FY20E
Profit after Tax 7,338 7,722 7,561 8,593
Add: Depreciation 2,602 2,758 2,953 3,073
(Inc)/dec in Current Assets -346 -50 -1,139 -50
Inc/(dec) in CL and Provisions 1,535 2,584 254 658
Others 89 346 88 88
CF from operating activities 11,219 13,359 9,717 12,361
(Inc)/dec in Investments -26,682 -6,527 -2,400 -4,700
(Inc)/dec in Fixed Assets -3,369 -3,701 -4,000 -4,000
Others 16,663 -218 -318 -311
CF from investing activities -13,388 -10,447 -6,718 -9,011
Issue/(Buy back) of Equity 0 0 0 0
Inc/(dec) in loan funds 406 -373 0 0
Dividend paid & dividend tax -2,727 -2,900 -2,900 -3,262
Inc/(dec) in Sec. premium 0 0 0 0
Others 4,464 419 -88 -88
CF from financing activities 2,143 -2,854 -2,988 -3,350
Net Cash flow -26 58 11 0
Opening Cash 39 13 71 82
Closing Cash 13 71 82 82
Source: Company, ICICI Direct Research
Balance sheet | Crore
(Year-end March) FY17 FY18 FY19E FY20E
Liabilities
Equity Capital 151 151 151 151
Reserve and Surplus 36,020 41,606 46,267 51,597
Total Shareholders funds 36,171 41,757 46,418 51,748
Total Debt 484 111 111 111
Deferred Tax Liability 464 559 559 559
Others Liabilties 1,127 1,612 1,652 1,692
Total Liabilities 38,246 44,039 48,740 54,110
Assets
Gross Block 18,656 21,424 26,550 31,050
Less: Acc Depreciation 5,367 8,065 11,018 14,091
Net Block 13,289 13,359 15,532 16,959
Capital WIP 1,252 2,126 1,000 500
Total Fixed Assets 14,542 15,485 16,532 17,459
Investments 28,228 35,290 37,940 42,890
Inventory 3,262 3,161 3,688 3,699
Debtors 1,199 1,462 1,904 1,786
Loans and Advances 3 3 9 9
Other Current Assets 2,119 2,007 2,171 2,328
Cash 13 71 82 82
Total Current Assets 6,596 6,704 7,854 7,904
Creditors 8,367 10,497 10,708 11,480
Provisions 449 560 535 574
Other current Liabilities 3,931 4,274 4,343 4,190
Total Current Liabilities 12,748 15,331 15,586 16,244
Net Current Assets -6,152 -8,627 -7,732 -8,339
Other Assets 1,627 1,891 1,999 2,100
Application of Funds 38,246 44,039 48,740 54,110
Source: Company, ICICI Direct Research
Key ratios
(Year-end March) FY17 FY18 FY19E FY20E
Per share data (|)
EPS 242.9 255.6 250.3 284.4
Cash EPS 329.0 346.9 348.1 386.2
BV 1,197.4 1,382.3 1,536.6 1,713.1
DPS 75.0 80.0 80.0 90.0
Cash Per Share 0.4 2.4 2.7 2.7
Operating Ratios
EBITDA Margin (%) 15.2 15.1 13.4 14.2
PBIT / Net sales (%) 11.4 11.7 10.0 10.9
PAT Margin (%) 10.8 9.7 8.7 9.2
Inventory days 17.5 14.5 15.5 14.5
Debtor days 6.4 6.7 8.0 7.0
Creditor days 44.9 48.0 45.0 45.0
Return Ratios (%)
RoE 20.3 18.5 16.3 16.6
RoCE 20.3 21.1 17.8 18.8
RoIC 66.1 91.7 64.0 70.5
Valuation Ratios (x)
P/E 26.8 25.5 26.0 22.9
EV / EBITDA 16.4 13.5 13.8 11.8
EV / Net Sales 2.5 2.0 1.8 1.7
Market Cap / Sales 2.9 2.5 2.3 2.1
Price to Book Value 5.4 4.7 4.2 3.8
Solvency Ratios
Debt/EBITDA 0.0 0.0 0.0 0.0
Debt / Equity 0.0 0.0 0.0 0.0
Current Ratio 0.7 0.6 0.7 0.6
Quick Ratio 0.4 0.3 0.4 0.3
Source: Company, ICICI Direct Research
ICICI Securities Ltd | Retail Equity Research Page 10
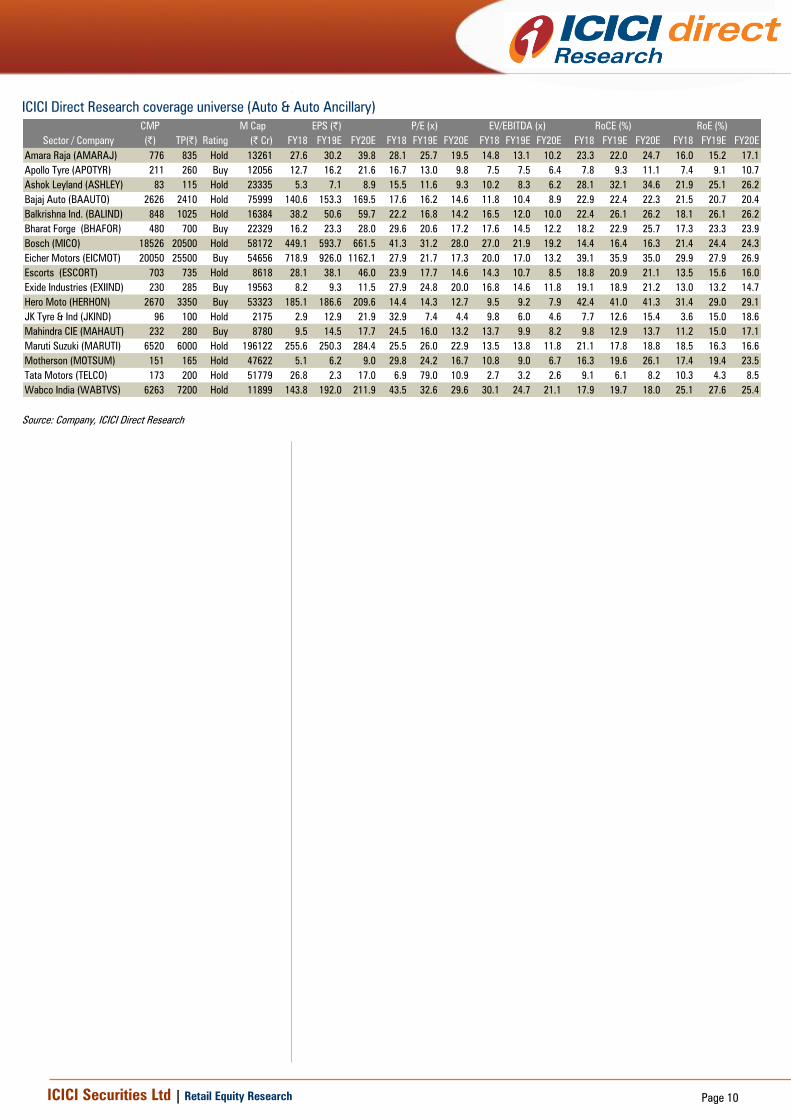
ICICI Direct Research coverage universe (Auto & Auto Ancillary)
CMP M Cap
(|) TP(|) Rating (| Cr) FY18 FY19E FY20E FY18 FY19E FY20E FY18 FY19E FY20E FY18 FY19E FY20E FY18 FY19E FY20E
Amara Raja (AMARAJ) 776 835 Hold 13261 27.6 30.2 39.8 28.1 25.7 19.5 14.8 13.1 10.2 23.3 22.0 24.7 16.0 15.2 17.1
Apollo Tyre (APOTYR) 211 260 Buy 12056 12.7 16.2 21.6 16.7 13.0 9.8 7.5 7.5 6.4 7.8 9.3 11.1 7.4 9.1 10.7
Ashok Leyland (ASHLEY) 83 115 Hold 23335 5.3 7.1 8.9 15.5 11.6 9.3 10.2 8.3 6.2 28.1 32.1 34.6 21.9 25.1 26.2
Bajaj Auto (BAAUTO) 2626 2410 Hold 75999 140.6 153.3 169.5 17.6 16.2 14.6 11.8 10.4 8.9 22.9 22.4 22.3 21.5 20.7 20.4
Balkrishna Ind. (BALIND) 848 1025 Hold 16384 38.2 50.6 59.7 22.2 16.8 14.2 16.5 12.0 10.0 22.4 26.1 26.2 18.1 26.1 26.2
Bharat Forge (BHAFOR) 480 700 Buy 22329 16.2 23.3 28.0 29.6 20.6 17.2 17.6 14.5 12.2 18.2 22.9 25.7 17.3 23.3 23.9
Bosch (MICO) 18526 20500 Hold 58172 449.1 593.7 661.5 41.3 31.2 28.0 27.0 21.9 19.2 14.4 16.4 16.3 21.4 24.4 24.3
Eicher Motors (EICMOT) 20050 25500 Buy 54656 718.9 926.0 1162.1 27.9 21.7 17.3 20.0 17.0 13.2 39.1 35.9 35.0 29.9 27.9 26.9
Escorts (ESCORT) 703 735 Hold 8618 28.1 38.1 46.0 23.9 17.7 14.6 14.3 10.7 8.5 18.8 20.9 21.1 13.5 15.6 16.0
Exide Industries (EXIIND) 230 285 Buy 19563 8.2 9.3 11.5 27.9 24.8 20.0 16.8 14.6 11.8 19.1 18.9 21.2 13.0 13.2 14.7
Hero Moto (HERHON) 2670 3350 Buy 53323 185.1 186.6 209.6 14.4 14.3 12.7 9.5 9.2 7.9 42.4 41.0 41.3 31.4 29.0 29.1
JK Tyre & Ind (JKIND) 96 100 Hold 2175 2.9 12.9 21.9 32.9 7.4 4.4 9.8 6.0 4.6 7.7 12.6 15.4 3.6 15.0 18.6
Mahindra CIE (MAHAUT) 232 280 Buy 8780 9.5 14.5 17.7 24.5 16.0 13.2 13.7 9.9 8.2 9.8 12.9 13.7 11.2 15.0 17.1
Maruti Suzuki (MARUTI) 6520 6000 Hold 196122 255.6 250.3 284.4 25.5 26.0 22.9 13.5 13.8 11.8 21.1 17.8 18.8 18.5 16.3 16.6
Motherson (MOTSUM) 151 165 Hold 47622 5.1 6.2 9.0 29.8 24.2 16.7 10.8 9.0 6.7 16.3 19.6 26.1 17.4 19.4 23.5
Tata Motors (TELCO) 173 200 Hold 51779 26.8 2.3 17.0 6.9 79.0 10.9 2.7 3.2 2.6 9.1 6.1 8.2 10.3 4.3 8.5
Wabco India (WABTVS) 6263 7200 Hold 11899 143.8 192.0 211.9 43.5 32.6 29.6 30.1 24.7 21.1 17.9 19.7 18.0 25.1 27.6 25.4
Sector / Company
RoE (%)EPS (|) P/E (x) EV/EBITDA (x) RoCE (%)
Source: Company, ICICI Direct Research

ICICI Securities Ltd | Retail Equity Research Page 11
RATING RATIONALE
ICICI Direct endeavours to provide objective opinions and recommendations. ICICI Direct assigns ratings to its
stocks according to their notional target price vs. current market price and then categorises them as Strong
Buy, Buy, Hold and Sell. The performance horizon is two years unless specified and the notional target price is
defined as the analysts' valuation for a stock.
Strong Buy: >15%/20% for large caps/midcaps, respectively, with high conviction;
Buy: >10%/15% for large caps/midcaps, respectively;
Hold: Up to +/-10%;
Sell: -10% or more;
Pankaj Pandey Head – Research [email protected]
ICICI Direct Research Desk,
ICICI Securities Limited,
1st Floor, Akruti Trade Centre,
Road No 7, MIDC,
Andheri (East)
Mumbai – 400 093
ICICI Securities Ltd | Retail Equity Research Page 12
ANALYST CERTIFICATION
We /I Shashank Kanodia, CFA MBA (Capital Markets), and Jaimin Desai, CA, Research Analysts, authors and the names subscribed to this report, hereby certify that all of the views expressed in this
research report accurately reflect our views about the subject issuer(s) or securities. We also certify that no part of our compensation was, is, or will be directly or indirectly related to the specific
recommendation(s) or view(s) in this report. It is also confirmed that above mentioned Analysts of this report have not received any compensation from the companies mentioned in the report in the
preceding twelve months and do not serve as an officer, director or employee of the companies mentioned in the report.
Terms & conditions and other disclosures:
ICICI Securities Limited (ICICI Securities) is a full-service, integrated investment banking and is, inter alia, engaged in the business of stock brokering and distribution of financial products. ICICI Securities
Limited is a Sebi registered Research Analyst with Sebi Registration Number – INH000000990. ICICI Securities Limited Sebi Registration is INZ000183631 for stock broker. ICICI Securities is a subsidiary of
ICICI Bank which is India’s largest private sector bank and has its various subsidiaries engaged in businesses of housing finance, asset management, life insurance, general insurance, venture capital fund
management, etc. (“associates”), the details in respect of which are available on www.icicibank.com
ICICI Securities is one of the leading merchant bankers/ underwriters of securities and participate in virtually all securities trading markets in India. We and our associates might have investment banking
and other business relationship with a significant percentage of companies covered by our Investment Research Department. ICICI Securities generally prohibits its analysts, persons reporting to analysts
and their relatives from maintaining a financial interest in the securities or derivatives of any companies that the analysts cover.
The information and opinions in this report have been prepared by ICICI Securities and are subject to change without any notice. The report and information contained herein is strictly confidential and
meant solely for the selected recipient and may not be altered in any way, transmitted to, copied or distributed, in part or in whole, to any other person or to the media or reproduced in any form, without
prior written consent of ICICI Securities. While we would endeavour to update the information herein on a reasonable basis, ICICI Securities is under no obligation to update or keep the information current.
Also, there may be regulatory, compliance or other reasons that may prevent ICICI Securities from doing so. Non-rated securities indicate that rating on a particular security has been suspended
temporarily and such suspension is in compliance with applicable regulations and/or ICICI Securities policies, in circumstances where ICICI Securities might be acting in an advisory capacity to this
company, or in certain other circumstances.
This report is based on information obtained from public sources and sources believed to be reliable, but no independent verification has been made nor is its accuracy or completeness guaranteed. This
report and information herein is solely for informational purpose and shall not be used or considered as an offer document or solicitation of offer to buy or sell or subscribe for securities or other financial
instruments. Though disseminated to all the customers simultaneously, not all customers may receive this report at the same time. ICICI Securities will not treat recipients as customers by virtue of their
receiving this report. Nothing in this report constitutes investment, legal, accounting and tax advice or a representation that any investment or strategy is suitable or appropriate to your specific
circumstances. The securities discussed and opinions expressed in this report may not be suitable for all investors, who must make their own investment decisions, based on their own investment
objectives, financial positions and needs of specific recipient. This may not be taken in substitution for the exercise of independent judgment by any recipient. The recipient should independently evaluate
the investment risks. The value and return on investment may vary because of changes in interest rates, foreign exchange rates or any other reason. ICICI Securities accepts no liabilities whatsoever for any
loss or damage of any kind arising out of the use of this report. Past performance is not necessarily a guide to future performance. Investors are advised to see Risk Disclosure Document to understand the
risks associated before investing in the securities markets. Actual results may differ materially from those set forth in projections. Forward-looking statements are not predictions and may be subject to
change without notice.
ICICI Securities or its associates might have managed or co-managed public offering of securities for the subject company or might have been mandated by the subject company for any other assignment
in the past twelve months.
ICICI Securities or its associates might have received any compensation from the companies mentioned in the report during the period preceding twelve months from the date of this report for services in
respect of managing or co-managing public offerings, corporate finance, investment banking or merchant banking, brokerage services or other advisory service in a merger or specific transaction.
ICICI Securities or its associates might have received any compensation for products or services other than investment banking or merchant banking or brokerage services from the companies mentioned
in the report in the past twelve months.
ICICI Securities encourages independence in research report preparation and strives to minimize conflict in preparation of research report. ICICI Securities or its associates or its analysts did not receive any
compensation or other benefits from the companies mentioned in the report or third party in connection with preparation of the research report. Accordingly, neither ICICI Securities nor Research Analysts
and their relatives have any material conflict of interest at the time of publication of this report.
Compensation of our Research Analysts is not based on any specific merchant banking, investment banking or brokerage service transactions.
ICICI Securities or its subsidiaries collectively or Research Analysts or their relatives do not own 1% or more of the equity securities of the Company mentioned in the report as of the last day of the month
preceding the publication of the research report.
Since associates of ICICI Securities are engaged in various financial service businesses, they might have financial interests or beneficial ownership in various companies including the subject
company/companies mentioned in this report.
ICICI Securities may have issued other reports that are inconsistent with and reach different conclusion from the information presented in this report.
Neither the Research Analysts nor ICICI Securities have been engaged in market making activity for the companies mentioned in the report.
We submit that no material disciplinary action has been taken on ICICI Securities by any Regulatory Authority impacting Equity Research Analysis activities.
This report is not directed or intended for distribution to, or use by, any person or entity who is a citizen or resident of or located in any locality, state, country or other jurisdiction, where such distribution,
publication, availability or use would be contrary to law, regulation or which would subject ICICI Securities and affiliates to any registration or licensing requirement within such jurisdiction. The securities
described herein may or may not be eligible for sale in all jurisdictions or to certain category of investors. Persons in whose possession this document may come are required to inform themselves of and
to observe such restriction.
Related Documents