MKG 301 Unit 1 : Introduction to Marketing Research 1 Unit 2 : Problem Definition 15 Unit 3 : Research Design 25 Unit 4 : Sampling Design 43 Unit 5 : Measurement and Scaling Techniques 63 Unit 6 : Questionnaire Design 81 Unit 7 : Quantitative Data Analysis 95 Unit 8 : Report Writing 123 Yashwantrao Chavan Maharashtra Open University MARKETING RESEARCH MBA : SECOND YEAR SEMESTER III MARKETING GROUP

Welcome message from author
This document is posted to help you gain knowledge. Please leave a comment to let me know what you think about it! Share it to your friends and learn new things together.
Transcript
MKG 301
Unit 1 : Introduction to Marketing Research 1
Unit 2 : Problem Definition 15
Unit 3 : Research Design 25
Unit 4 : Sampling Design 43
Unit 5 : Measurement and Scaling Techniques 63
Unit 6 : Questionnaire Design 81
Unit 7 : Quantitative Data Analysis 95
Unit 8 : Report Writing 123
Yashwantrao
Chavan
Maharashtra
Open University
MARKETING RESEARCH
MBA : SECOND YEAR
SEMESTER III
MARKETING GROUP
Dr. PiyushAssistant ProfessorFeroze Gandhi Institute ofEngineering & TechnologyRaebareli, Uttar Pradesh, India
YASHWANTRAO CHAVAN MAHARASHTRA OPEN UNIVERSITY
VICE-CHANCELLOR : Prof. E. Vayunandan
DIRECTOR, SCHOOL OF COMMERCE & MANAGEMENT : Dr. Pandit Palande
NATIONAL ADVISORY BOARD
Instructional Technology Editing & Programme Co-ordinator
Dr. Vinay SharmaAssociate ProfessorDepartment of Management StudiesIndian Institute of Technology (IIT)Roorkee, Uttarakhand, India
Visiting Professor, IIM, Lucknow
Production
Shri. Anand Yadav
Manager, Print Production Centre, Y. C. M. Open University, Nashik- 422 222
Copyright © Yashwantrao Chavan Maharashtra Open University, Nashik.
(First edition developed under DEB development grant)
q First Publication : October. 2017 q Publication No. : 2243
q Cover Design : Shri. Avinash Bharne
q Printed by : Shri. Navnath Zanakar, M/s. Shree Ganesh Enterprises, Wavare Lane, Shalimar, Nashik-1
q Publisher : Dr. Dinesh Bhonde, Registrar, Y. C. M. Open University, Nashik- 422 222
Dr. Latika Ajitkumar AjbaniAssistant ProfessorSchool of Commerce & ManagementYashwantrao Chavan MaharashtraOpen University, Nashik
Authors Editor
ISBN : 978-81-8055-427-8
Dr. Pandit PalandeFormer Vice ChancellorDirector, School of Commerce& Management,Yashwantrao Chavan MaharashtraOpen University, Nashik
Prof. Sudhir. K. JainFormer Vice ChancellorProfessor & Former HeadDept. of Management StudiesIndian Institute of Technology (IIT)Delhi
Prof. Vinay. K. NangiaProfessor & Former HeadDepartment of Business Studies,Indian Institute of Technology (IIT)Roorkee
Prof. Devanath Tirupati,Dean Academics,Indian Institute of Management (IIM)Bangalore.
Prof. Karuna Jain,Director,N I T I E, Vihar Lake,Mumbai
Dr. Surendra PatoleAssistant Professor,School of Commerce &Management,Yashwantrao Chavan MaharashtraOpen University, Nashik
Dr. Latika Ajitkumar AjbaniAssistant Professor,School of Commerce &Management,Yashwantrao Chavan MaharashtraOpen University, Nashik
MKG 301
Dr. Latika Ajitkumar AjbaniAssistant Professor, YCMOU
Dr. Surendra PatoleAssistant Professor, YCMOU
Introduction
In order to gain useful consumer insights, which allowed the company to optimize
the product and position it successfully in the market, Procter & Gamble had to plan
a market research process. This process included asking market research question(s),
collecting data, and analyzing these using quantitative methods. This book provides
an introduction to the skills necessary for conducting or commissioning such market
research projects. It is written for two audiences:
E Students of business and market research, and
E Practitioners wishing to know more about market research, or those who
need a practical, yet theoretically sound, reference.
This book is a bridge between the theory of conducting quantitative research
and its execution, using the market research process as a framework. We discuss
market research, starting with identifying the research question, designing the data
collection process, collecting, and describing data. We also introduce essential data
analysis techniques, and the basics of communicating the results, including a discussion
on ethics. Each unit on quantitative methods describes key theoretical choices.
All units are written in an accessible and comprehensive way so that non-technical
readers can also easily grasp the data analysis methods that are introduced. Each unit
on research methods includes examples to help the reader get a hands-on feel for the
technique. Each unit concludes with an illustrated real-life case, demonstrating the
application of a quantitative method. We also provide additional real-life cases,
including datasets, thus allowing readers to practice what they have learnt. Other
pedagogical features such as key words, examples, and end-of-unit questions support
the contents. This book is concise, focusing on the most important aspects that a
market researcher, or manager interpreting market research, should know. Many
units provide links to further readings and other websites.
- Dr. Vinay Sharma
Dr. Piyush Seth
Dr. Latika Ajitkumar Ajbani
Dr. Surendra Patole

Copyright © Yashwantrao Chavan Maharashtra Open University, Nashik.
All rights reserved. No part of this publication which is material protected by this copyright
notice may be reproduced or transmitted or utilized or stored in any form or by any means
now known or hereinafter invented, electronic, digital or mechanical, including photocopy-
ing, scanning, recording or by any information storage or retrieval system, without prior
written permission from the Publisher.
The information contained in this book has been obtained by authors from sources believed
to be reliable and are correct to the best of their knowledge. However, the publisher and its
authors shall in no event be liable for any errors, omissions or damage arising out of use of
this information and specially disclaim any implied warranties or merchantability or fitness
for any particular use.
Message from the Vice-Chancellor
Dear Students,
Greetings!!!
I offer cordial welcome to all of you for the Master’s degree programme of
Yashwantrao Chavan Maharashtra Open University.
As a post graduate student, you must have autonomy to learn, have information
and knowledge regarding different dimensions in the field of Commerce & Management
and at the same time intellectual development is necessary for application of knowledge
wisely. The process of learning includes appropriate thinking, understanding important
points, describing these points on the basis of experience and observation, explaining
them to others by speaking or writing about them. The science of education today
accepts the principle that it is possible to achieve excellence and knowledge in this
regard.
The syllabus of this course has been structured in this book in such a way, to
give you autonomy to study easily without stirring from home. During the counseling
sessions, scheduled at your respective study centre, all your doubts will be clarified
about the course and you will get guidance from some experienced and expert
professors. This guidance will not only be based on lectures, but it will also include
various techniques such as question-answers, doubt clarification. We expect your
active participation in the contact sessions at the study centre. Our emphasis is on
‘self study’. If a student learns how to study, he will become independent in learning
throughout life. This course book has been written with the objective of helping in
self-study and giving you autonomy to learn at your convenience.
During this academic year, you have to give assignments and complete the Project
work wherever required. You have to opt for specialization as per programme structure.
You will get experience and joy in personally doing above activities. This will enable
you to assess your own progress and thereby achieve a larger educational objective.
We wish that you will enjoy the courses of Yashwantrao Chavan Maharashtra
Open University, emerge successful and very soon become a knowledgeable and
honorable Master’s degree holder of this university.
Best Wishes!
- Vice-Chancellor
Syllabus
MARKETING RESEARCH MKG-301
UNIT 1 : INTRODUCTION TO MARKETING RESEARCH
Research Objectives—Marketing Research—Classification of Marketing
Research—Process of Marketing Research—Problem Definition—
Approach Development—Research Design Formulation—Field Work and
data collection—Data Analysis—Report Preparation—Marketing Research
Industry—Marketing Research Service providers.
UNIT 2 : PROBLEM DEFINITION
Problem Definition—Importance of Problem Definition—Selection of the
Problem—Understanding the Problem—Self Questioning by Researcher
while Defining the Problem.
UNIT 3 : RESEARCH DESIGN
An Overview—Need for Research Design—Types of Research Design—
Exploratory Research—Characteristics of Exploratory Stage—Hypothesis
Development at Exploratory Research Stage—Formulation of Hypothesis
in Exploratory Research—Secondary Data—Qualitative Research—
Descriptive Research Design—Types of Descriptive Studies—Survey—
Observation Studies—Difference between Exploratory Research and
Descriptive—Research—Causal Research Design.
UNIT 4 : SAMPLING DESIGN
Sampling — An Introduction—Distinction between Census and Sampling—
Steps of Sampling Design—Characteristics of a Good Sample Design—
Types of Sample Design—Probability Sampling Techniques—Non-
probability Sampling Techniques—Distinction between Probability Sample
and Non probability Sample—Fieldwork—Errors in Sampling—Sampling
Error—Non-sampling Error—Sampling Frame Error—Non-response
Error—Data Error—Sampling Distribution.
UNIT 5 : MEASUREMENT AND SCALING TECHNIQUES
Measurement Scales: Tools of Sound Measurement—Nominal Scale—
Ordinal Scale (Ranking Scale)—Interval Scale—Ratio Scale—
Techniques of Developing Measurement Tools—Scaling – Meaning—
Comparative and Non-comparative Scaling Techniques—Comparative
Scaling Techniques—Non-comparative Scale—Criteria for the Good
Test—Reliability Analysis—Validity Analysis.
UNIT 6 : QUESTIONNAIRE DESIGN
Questionnaire—Characteristics of good questionnaire.—The steps
preceding questionnaire design—Process of questionnaire design—
Choose the method(s) of reaching target respondents—Decide on
question content—Develop the question wording—Disadvantages are
also present when using such Questions—Closing questions—Physical
appearance of the questionnaire—Piloting the questionnaires.
UNIT 7 : QUANTITATIVE DATA ANALYSIS
The Process of Quantitative Data Analysis—Review—Coding survey data—
Data Entry—Data Analysis using Descriptive Statistics—Descriptive
statistics—Frequency—Central tendency—Mode—Median—Mean—
Dispersion measures—Range—Variance — Standard deviation—Data
Analysis using Inferential Statistics—Statistical testing process—
Hypothesis—Level of confidence—Chi-square tests—Analysis of
Qualitative Data Content—Consumer segments—Consumer behavior
processes—Comparing and contrasting consumer traits—Development
of hypotheses—Analysis of ethnographic and observational research data.
UNIT 8 : REPORT WRITING
Characteristics of Research Report—Substantive Characteristics—
Semantic Characteristics—Significance of Report Writing—Techniques
and Precautions of Interpretation—Basic Analysis of “Quantitative”
Information—Basic Analysis of “Qualitative” Information—Interpreting
Information—Precautions—Types of Report—Oral Report—Written
Report—Preparation of Research Report—How to Write a
Bibliography?—Style, Layout and Precautions of the Report writing—
Style of Report Writing—Layout of the Report—Precautions in Report
Writing.
nnnn

1.0 Unit Objectives
1.1 Introduction
1.1.1 Research Objectives
1.1.2 Marketing Research
1.1.3 Classification of Marketing Research
1.2 Process of Marketing Research
1.2.1 Problem Definition
1.2.2 Approach Development
1.2.3 Research Design Formulation
1.2.4 Field Work and data collection
1.2.5 Data Analysis
1.2.6 Report Preparation
1.3 Marketing Research Industry
1.3.1 Marketing Research Service providers
1.4 Summary
1.5 Keyterms
1.6 Review Questions
1.7 Further Readings
UNIT 1:INTRODUCTION TO
MARKETING RESEARCH
Introduction to
Marketing Research
NOTES
Marketing Research : 1
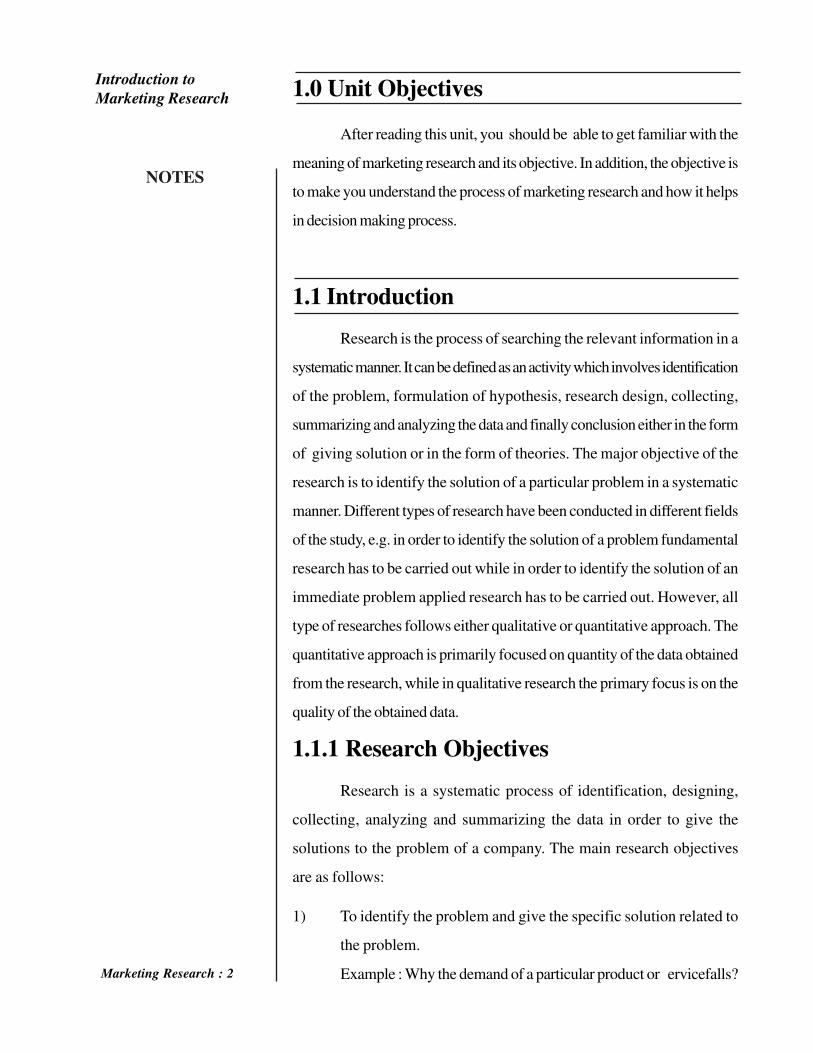
1.0 Unit Objectives
After reading this unit, you should be able to get familiar with the
meaning of marketing research and its objective. In addition, the objective is
to make you understand the process of marketing research and how it helps
in decision making process.
1.1 Introduction
Research is the process of searching the relevant information in a
systematic manner. It can be defined as an activity which involves identification
of the problem, formulation of hypothesis, research design, collecting,
summarizing and analyzing the data and finally conclusion either in the form
of giving solution or in the form of theories. The major objective of the
research is to identify the solution of a particular problem in a systematic
manner. Different types of research have been conducted in different fields
of the study, e.g. in order to identify the solution of a problem fundamental
research has to be carried out while in order to identify the solution of an
immediate problem applied research has to be carried out. However, all
type of researches follows either qualitative or quantitative approach. The
quantitative approach is primarily focused on quantity of the data obtained
from the research, while in qualitative research the primary focus is on the
quality of the obtained data.
1.1.1 Research Objectives
Research is a systematic process of identification, designing,
collecting, analyzing and summarizing the data in order to give the
solutions to the problem of a company. The main research objectives
are as follows:
1) To identify the problem and give the specific solution related to
the problem.
Example : Why the demand of a particular product or ervicefalls?
Introduction to
Marketing Research
NOTES
Marketing Research : 2
Why there is fluctuation in the business environment?
2) To develop new theories and concepts.
Example: Green marketing, Horizontal marketing etc.
3) To identify the alternative solutions of a problem.
Example: Which strategy (push or pull) must be followed for
the promotion of the product?
4) To make the process of decision making easier.
1.1.2 Marketing Research
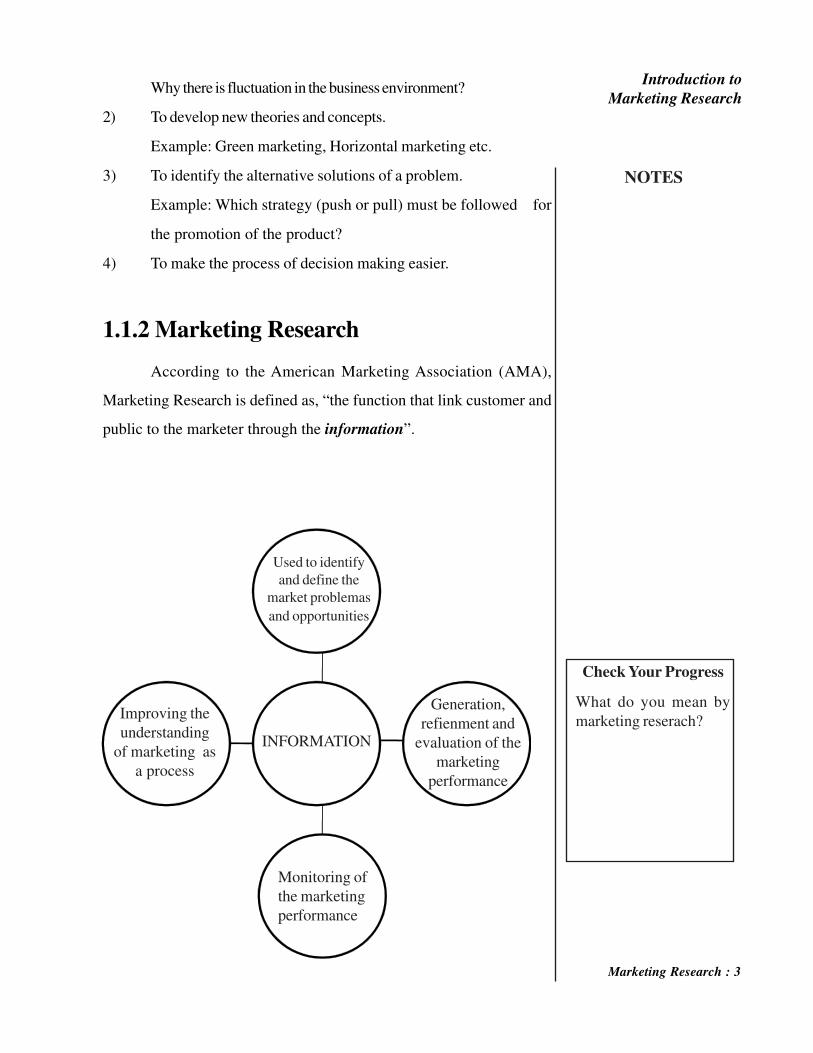
According to the American Marketing Association (AMA),
Marketing Research is defined as, “the function that link customer and
public to the marketer through the information”.
Used to identify
and define the
market problemas
and opportunities
Generation,
refienment and
evaluation of the
marketing
performance
INFORMATION
Monitoring of
the marketing
performance
Improving the
understanding
of marketing as
a process
Marketing Research : 3
Introduction to
Marketing Research
NOTES
Check Your Progress
What do you mean by
marketing reserach?
Thus, marketing research is defined as the systematic and objective:
Ø Identification
Ø Collection
Ø Analyzing
Ø Dissemination
Ø And use of the information
For the purpose of improving decision making related to the,
Ø Identification and
Ø Solutions of problems and opportunities in marketing (Adopted
from : Malhotra and Dash, 2010)
1.1.3 Classification of Marketing Research
Marketing Research can be classified into two categories:
Ø Problem Identification Research
Ø Problem Solving Research
Classification of
Marketing
Research
Research
undertaken for
solving the
particular
problem related
to marketing is
called as Problem
Solving research
Research undertaken
for identifying the
problem that are not
apparent but exist or
likely to arise in future
is called as Problem
identification research
Forecasting
Research
Business Trend
Research
Market Potential
Research
Market Potential
Research
Product
Research
Pricing
Research
Promotion
Research
Distribution
Research
Introduction to
Marketing Research
NOTES
Marketing Research : 4
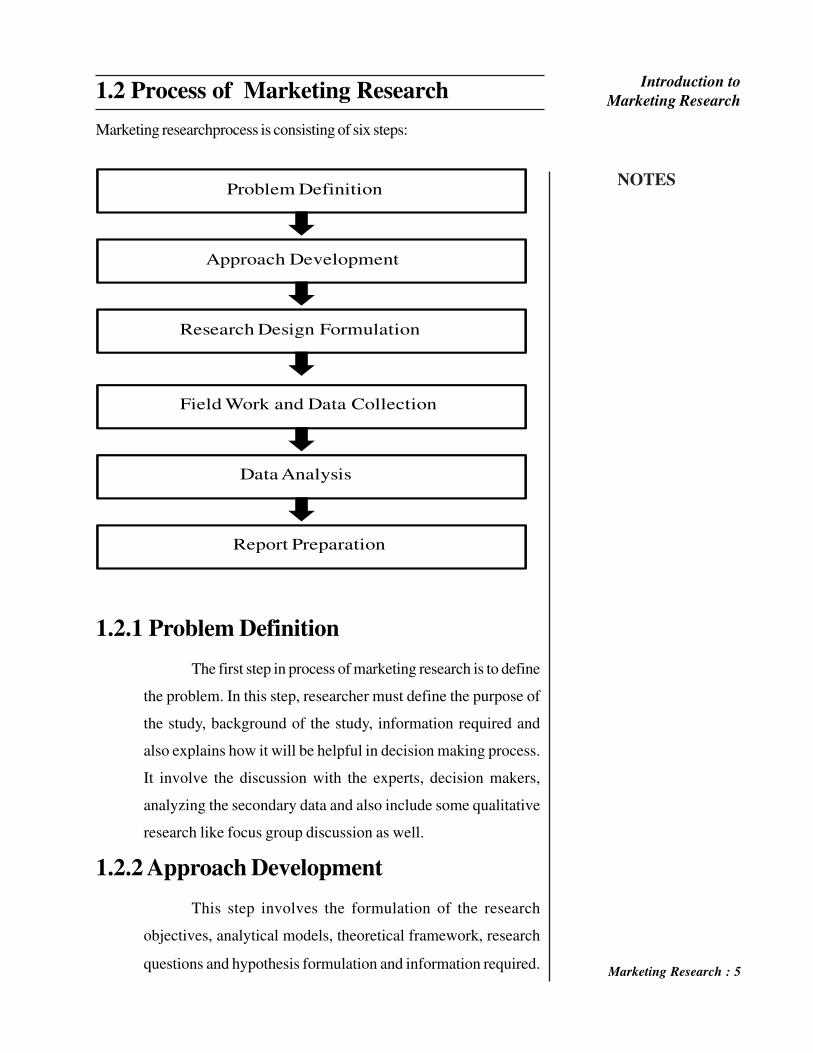
1.2 Process of Marketing Research
Marketing researchprocess is consisting of six steps:
Problem Definition
Research Design Formulation
Approach Development
Field Work and Data Collection
Data Analysis
Report Preparation
1.2.1 Problem Definition
The first step in process of marketing research is to define
the problem. In this step, researcher must define the purpose of
the study, background of the study, information required and
also explains how it will be helpful in decision making process.
It involve the discussion with the experts, decision makers,
analyzing the secondary data and also include some qualitative
research like focus group discussion as well.
1.2.2 Approach Development
This step involves the formulation of the research
objectives, analytical models, theoretical framework, research
questions and hypothesis formulation and information required.
Introduction to
Marketing Research
NOTES
Marketing Research : 5
1.2.3 Research Design Formulation
Research design is defined as the blueprint for conducting
the research process. The main purpose of the research design is to
test the hypothesis formulated and determine the tentative solution
to the research questions. There are two types of research design:
Ø Exploratory Research Design
Ø Causal Research Design
This step also addressed the issue of how the data will be
collected from the respondents (e.g. with the help of experiment or
by conducting a survey).
Formulation of research design includes:
Ø Defining the information required
Ø Analysis of secondary data
Ø Qualitative research
Ø Methods for obtaining the quantitative data
Ø Scaling techniques
Ø Designing the questionnaire
Ø Sampling
Ø Data Analysis
1.2.4 Field Work / Data Collection
Field work involves a capable staff that operates either in
the field or electronically or from the office in order to collect the
data. Right selection, proper training, necessary supervision and
Introduction to
Marketing Research
NOTES
Marketing Research : 6
the timely evaluation of the staff helps in reducing the error occurred
during the data collection.
1.2.5 Data Analysis
Data analysis includes:
Ø Editing
Ø Coding
Ø Transcription and
Ø Verification of the data
1.2.6 Report Preparation
The last step of the marketing research process is the report
preparation and the presentation. The whole process must be
documented in a report that includes the problem definition, description
of the research approach, research design, data collection procedure,
data analysis methodology and show the results and main findings of
the research.
1.3 Marketing Research Industry
The industry which is consists of the suppliers providing the services
related to the marketing research are known as marketing research industry.
Marketing research service providers provide maximum information which is
required for decision making.
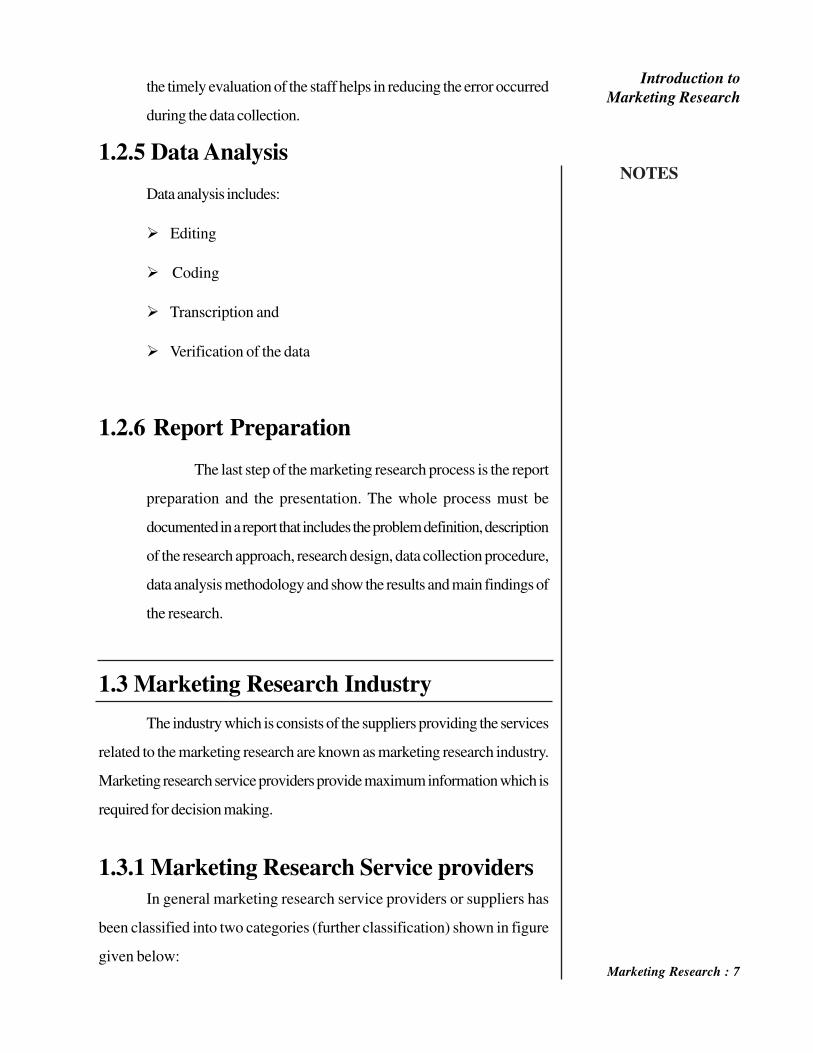
1.3.1 Marketing Research Service providers
In general marketing research service providers or suppliers has
been classified into two categories (further classification) shown in figure
given below:
Introduction to
Marketing Research
NOTES
Marketing Research : 7
Marketing research service
providers/ Suppliers
External SuppliersInternal Suppliers
Type of service provided
Limited ServiceFull Services
Standardized
Services
Customized
Services
Syndicate
Services
Internet
Services
Data analysis
services
Data Entry
Services
Field Services
Analytical
Services
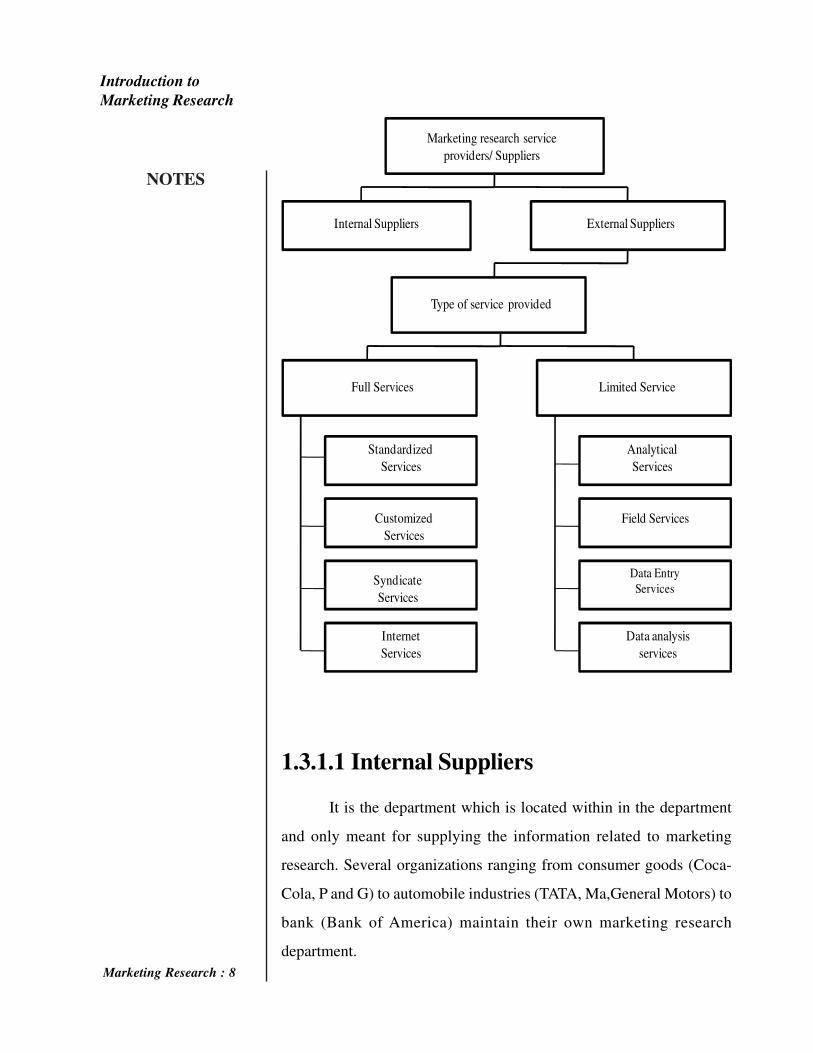
1.3.1.1 Internal Suppliers
It is the department which is located within in the department
and only meant for supplying the information related to marketing
research. Several organizations ranging from consumer goods (Coca-
Cola, P and G) to automobile industries (TATA, Ma,General Motors) to
bank (Bank of America) maintain their own marketing research
department.
Marketing Research : 8
Introduction to
Marketing Research
NOTES
1.3.1.2 External Suppliers
External Suppliers are the external (outside an organization) marketing
research companies hired for supplying the data required for marketing
research. External suppliers provide two types of services: Limited Services
and Full services.
Ø Full Service suppliers Full service suppliers are the suppliers
who offer the entire range of activities related to marketing
research. There are various types of full services which are
discussed below:
ü Standardized Services Services in which the organizations use
the standard and set procedures to provide the information to
the client related to marketing research are called as standardized
services.
ü Customized Services Services in which the organizations tailor
the research procedures to best meet the needs of each client are
called as customized services.
ü Syndicate Services Services in which the organizations collect
and sell the common data which is designed to serve the number
of clients are called as syndicate services.
ü Internet Services Services in which the organizations are
specialized in conducting the marketing research process online
are called as internet services.
Ø Limited Service suppliers Limited service suppliers are the
suppliers who are specialized and offer the specific range of
activities related to marketing research. There are various types
of limited services which are discussed below:
ü Analytical Services Services in which the marketing research
company provides the guidance for developing the research design
for conducting the research are called as analytical services.
Introduction to
Marketing Research
NOTES
Marketing Research : 9
Check Your Progress
What is the difference
between interanl and the
external suppliers?
ü Field Services Organizations that have expertise in collecting data
from field for the research are known as field service providers.
ü Data Entry ServicesOrganization whose primary aim is to convert
the interviews or surveys into the usable data for performing the
statistical analysis to complete the research process.
ü Data Analysis Services Organizations that have expertise in statistical
analysis of quantitative data are known as data analysis service
providers.
1.4 Summary
Marketing research is a systematic and objective process of identifying
and solving the particular problem related to the marketing. Thus, marketing
research has been classified into two categories:
ü Problem identification research and
ü Problem solving research.
The entire process of marketing research is consisting of six steps.
The process of marketing research may be performed internally or can
be hired from the external suppliers, which are known as marketing
research industry. Limited service providers have the expertise in one or
few services while full service providers offer the full range of services
required for conducting the marketing research. Because of tremendous
need of marketing research, attractive marketing research opportunities
are available with the marketing research organizations, advertising
agencies, non-business organizations, research department etc.
Information obtained plays a very crucial role in the entire process of
marketing research.
Introduction to
Marketing Research
NOTES
Marketing Research : 10
1.5 Key Terms
• Marketing Research:According to the American Marketing
Association (AMA), Marketing Research is defined as, “the function
that link customer and public to the marketer through the information”.
• External Suppliers : They are the external (outside an organization)
marketing research companies hired for supplying the data required
for marketing research
1.6 Review Questions
1. What do you mean by marketing reserach?
2. What are the steps in the process of marketing research?
3. Explain the following terms:
a) Approch development
b) Customised services
c) Analtical services
4. What is the difference between interanl and the external suppliers?
5. What do you mean by reserch design formulation?
Check your progress and review questions :
1. Business research comes within the purview of ............... research.
2. ................... Market research, which was previously known as
industrial marketing research.
3. ...................... methods are concerned with attempts to quantify
social phenomena and collect and analyse numerical data.
4. The purpose of research is to find solutions through the
application of ...................... and ...................... methods.
5. Research is a systematised effort to gain ...................... .
6. Research is a systematic approach to ...................... investigation.
Introduction to
Marketing Research
NOTES
Marketing Research : 11
7. ..................... is the orderly arrangement of the data in a tabular
form.
8. While selecting the sample, the .................... has to be clearly
specified.
9. A ......................... sampling can be convenience or judgment
sampling.
10. The .......................... must decide if data is to be collected by
observation method or by interviewing.
11. It is better for the researcher to generate as many alternatives
as possible during problem ............................ .
12. There are ............................. steps in the research process.
13. ................... is conducted to solve a problem.
14. In ................... research, an examination of relationship that
exists between independent and dependent variable is studied.
15. ................... research is generally used by philosophers.
16. Descriptive research deals with ................... characteristics
of the consumer.
17. Evaluation research is an example of ................... research
18. ................... research is done to gather secondary data.
19. Gathering knowledge for knowledge’s sake is known as
................... research.
20. In exploratory research, all possible reasons which are
................... are eliminated
Answers:
1. Social science 2. Business to Business (B2B) 3. Quantitative
4. Systematic, scientific 5. New knowledge 6. Purposeful 7. Data
tabulation 8. sample unit 9. non-probability 10. Researcher
11. formulation hypothesis 12. Nine 13. Action research 14. Ex-post
Facto 15. Conceptual 16. Demographic 17. applied 18. Library
19. basic 20. very obvious.
Marketing Research : 12
NOTES
1.7 Further Readings
• Abrams, M.A., Social Surveys and Social Action, London:
Heinemann, 1951.
• Arthur, Maurice, Philosophy of Scientific Investigation,
Baltimore: John Hopkins University Press, 1943.
• Bernal, J.D., The Social Function of Science, London: George
Routledge and Sons, 1939.
• Chase, Stuart, The Proper Study of Mankind: An inquiry into
the Science of Human Relations, New York, Harper and Row
Publishers, 1958.
• Malhotra, Naresh K. Marketing research: An applied
orientation, 5/e. Pearson Education India, 2008.
• S. N. Murthy and U. Bhojanna, Business Research Methods,
Excel Books.
Marketing Research : 13
Introduction to
Marketing Research
NOTES

Marketing Research : 14
NOTES
UNIT 2 : PROBLEM DEFINITION
Problem Definition
NOTES
Problem Definition : 15
2.0 Unit Objectives
2.1 Introduction
2.2 Problem Definition
2.2.1 Importance of Problem Definition
2.3 Selection of the Problem
2.4 Understanding the Problem
2.5 Self Questioning by Researcher while Defining the Problem
2.6 Summary
2.7 Keyterms
2.8 Review Questions
2.9 Further Readings
2.0 Unit Objectives
The objective of this unit is to get familiar with the definition
of marketing research problem.
After studying this unit, you will be able to:
• Formulate a research problem
• Identify the selection of the problem
• Report the understanding of problem
• State about necessity of defined problem
• Demonstrate the Self Questioning by researcher while defining
the problem.
NOTES
Problem Definition : 16
Problem Definition 2.1 Introduction
In every organization for decision making some kind of research is
required. Manager/ Entrepreneurs must consider past, present and future
aspect while making decision. Past gives the details of what has been achieved,
on the other hand present shows that what is being achieved by an
organization. While, future shows what needs to be achieved by an
organization. Research has been conducted in order to collect the data and
facts which supports the decision making process. All the decisions are taken
on the basis of data, facts and figures derived from the research. According
to the famous saying:
“Problem well-defined is half solved”
So there is need to define a problem clearly and the objectives also must be
clear. The data collection is meaningless if the objectives have not been defined
clearly. Problem definition includes the analysis of problem involving 5W’s
and 1H i.e. who, what, why, when, where and how.
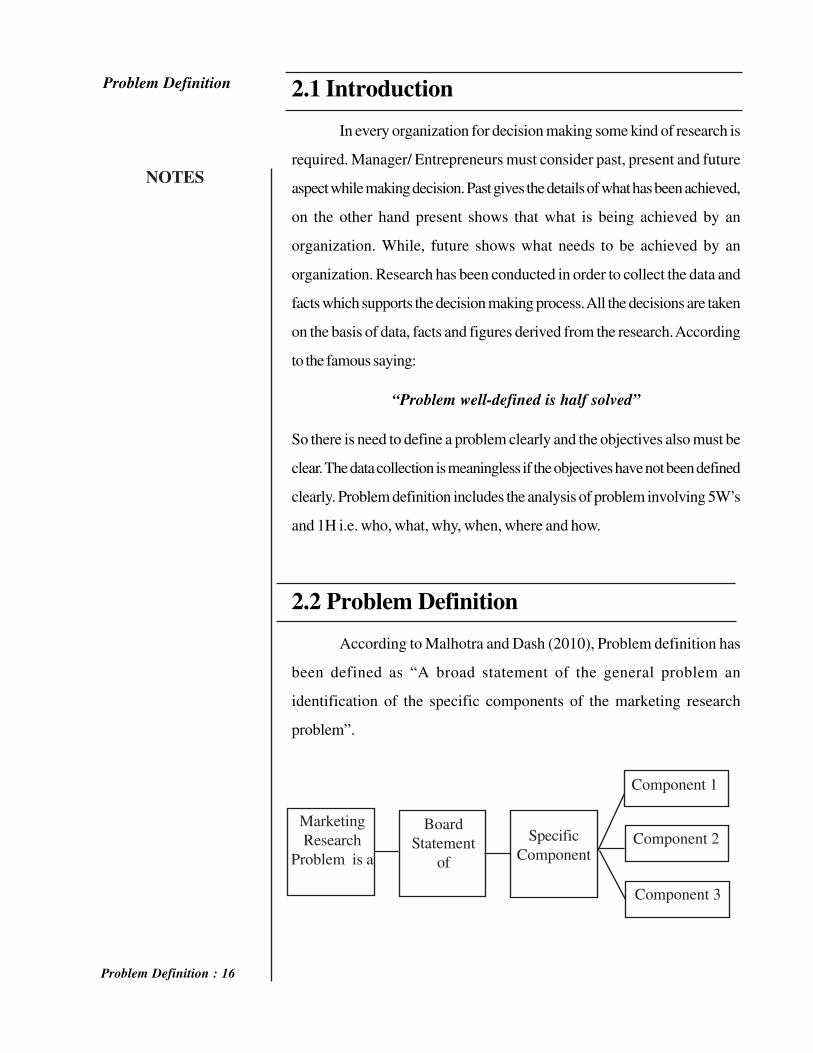
2.2 Problem Definition
According to Malhotra and Dash (2010), Problem definition has
been defined as “A broad statement of the general problem an
identification of the specific components of the marketing research
problem”.
Marketing
Research
Problem is a
Board
Statement
of
Specific
Component
Component 1
Component 3
Component 2
NOTES
Ø Broad Statement: The preliminary statement of the problem related
to marketing research that provides a suitable perspective on the
problem.
Ø Specific Component: Specific component of research problem
define the important aspect related to the problem and provides
the guideline of proceeding further in the process of marketing
research.
2.2.1 Importance of Problem Definition
Defining a research problem properly is a prerequisite for any
study and is an importance step. A problem well defined is half solved.
Defining the problem is often more essential than its solution because
when the problem is formulated, an appropriate technique can be applied
to generate alternative solutions. This statement signifies the need for
defining a research problem. The problem to be investigated must be
defined unambiguously for that will help to discriminate relevant data
from the irrelevant ones. When you define a research problem you are
trying to reduce the outcome of an answer. The question of course when
you speak about “marketing research” is how I can target more customers
that I can sell my product to. You are looking for specific answers such
as: “What type of soda does all foreign born males between the ages of
25-35 drink?” This is defining the problem. What do you consider foreign
born males? What constitutes soda? etc. This is important because
companies and sales organization attempt to “target” their market instead
of taking a shotgun approach. The process is to first make sure any
information you obtain is credible and from a reputable organization.
Then break down your problem and pick apart any inconsistencies you
may see within you research project. Problem formulation is the key to
research process. For a researcher, problem formulation means converting
the management problem to a research problem. In order to attain clarity,
Problem Definition
Problem Definition : 17
Check Your Progress
The objective of research
problem should be clearly
defined; otherwise the
data collection becomes
meaningless. Discuss
with suitable examples?
NOTES
the manager and researcher must articulate clearly so that perfect understanding
of each other’s is achieved.
2.3 Selection of the Problem
The research problem undertaken for study must be carefully selected.
The task is a difficult one, although it may not appear to be so. Help may be
taken from a research guide in this connection. Nevertheless, every researcher
must find out his own salvation for research problems cannot be borrowed. A
problem must spring from the researcher’s mind like a plant springing from its
own seed. If our eyes need glasses, it is not the optician alone who decides
about the number of the lens we require. We have to see ourself and enable
him to prescribe for us the right number by cooperating with him. Thus, a
research guide can at the most only help a researcher choose a subject.
Inevitably, selecting a problem is somewhat arbitrary, idiosyncratic,
and personal. Avoid selecting the first problem that you encounter. Try to
select the most interesting and personally satisfying choice from among
two or three possibilities. The problem selection should matter to
you. You should be eager and enthusiastic.
2.4 Understanding the Problem
Once the problem has been selected, the same has to be understood
thoroughly and then the same has to be reframed into meaningful terms
from an analytical point of view. The first step in research is to formulate
the problem. A company manufacturing television sets might think that it
is losing sales to a foreign company. A brief illustration aptly demonstrates
how such problem can be ill-conceived. The management of a company
felt, a drop in sales was because of the poor quality of product.
Subsequently, research was undertaken with a view to improve the quality of
Problem Definition
Problem Definition : 18
NOTES
the product. But despite an improvement in quality, sales did not pick up.
In this case, we may say that the problem is ill-defined. The actual reason
was ineffective sales promotion. The problem thus needs to be carefully
identified.
2.5 Self Questioning by Researcher while
Defining the Problem
1. Is the research problem correctly defined?
2. Is the research problem solvable?
3. Can relevant data be gathered through the process of marketing
research?
4. Is the research problem significant?
5. Can the research be conducted within the available resources?
6. Is the time given to complete the project sufficient?
7. What exactly will be the difficulties in conducting the study, and
hurdles to be overcome?
8. Am I competent, to carry the study out?
Managers often want the results of research in accordance with
their expectation. This satisfies them immensely. If one were to closely
look at the questionnaire, it is found that in most cases, there are
stereotyped answers given by the respondents.
2.6 Summary
• Proper problem formulation is the key to success in research.
• It is vital and any error in defining the problem incorrectly can
result in wastage of time and money.
Problem Definition
Problem Definition : 19
Check Your Progress
Cultural and techno-
logical changes can act
as a source for research
problem identification.
Why/why not?
NOTES
• Several elements of introspection will help in defining the problem
correctly.
• The task of defining a research problem, very often, follows a
sequential pattern.
• The problem is stated in a general way, the ambiguities are
resolved, thinking and rethinking process results in a more specific
formulation of the problem.
• It is done so that it may be a realistic one in terms of the available
data and resources and is also analytically meaningful.
• All this results in a well defined research problem that is not only
meaningful from an operational point of view.
• But is equally capable of paving the way for the development of
working hypotheses and for means of solving the problem itself.
2.7 Key Terms
Marketing Research Problem: It is a situation where your company intends
to sell a product or service that fills a specific gap.
Objective of Research: It means to what the researcher aims to achieve.
Pilot Study: A small scale preliminary study conducted before the main
research in order to check the feasibility or to improve the design of the
research.
Problem Definition: The process in order to clear understanding
(explanation) of what the problem is.
Research Problem: It focuses on the relevance of the present research.
2.8 Review Questions
1. The objective of research problem should be clearly defined;
otherwise the data collection becomes meaningless. Discuss with
suitable examples.
Problem Definition
Problem Definition : 20
NOTES
2. Cultural and technological changes can act as a source for
research problem identification. Why/why not?
3. Defining a research problem properly is a prerequisite for any
study. Why?
4. What precautions should be taken while formulating a
problem?
5. If you are appointed to do a research for some problem with
the client, what would you take as the sources for problem
identification?
6. It may be a problem and at the same time, it can also be
viewed as an opportunity. Why/ why not?
7. In some cases, some sort of preliminary study may be needed.
Which cases are being referred to and why?
8. A problem well defined is half solved. Comment.
9. While you define a research problem what do you try to do?
10. What do you think as the reason behind specialists suggesting
to avoid selecting the first problem that you encounter?
Check your progress:
1. In order to attain clarity, the manager and researcher must
...................... clearly.
2. Problem ......................... is the key to research process.
3. To define a problem correctly, a researcher must know:
...................................
4. A good topic should be small enough for a ..........................
investigation.
5. A ......................... should always avoid selecting the first
problem that he encounters.
6. The research problem undertaken for study must be
....................... selected.
7. Changes in the demographics, technological and legal changes
Problem Definition
Problem Definition : 21
Problem Definition : 22
affect the .......................function.
8. Opportunity related problems produce ........................... results.
9. The first step in research is to formulate the ………………..
10. ........................ and ...................... changes can act as a source
for research problem identification.
11. Research reports already published may be referred to define a
...........................
12.When you define a research problem you are trying to
...................... the outcome of an answer.
13. A problem well ..................... is half solved.
14. Managers often want the results of research in accordance
with their ........................
15. Assistance of any research organisation, which handles a number
of projects of the companies, can be sought to ...........................
the problem.
Answers:
1. articulate 2. Formulation 3. what a problem is 4. Conclusive
5. researcher 6. Carefully 7. marketing 8. Negative 9. problem
10. Cultural, technological 11. specific problem 12. Reduce
13. defined 14. Expectation 15. Identify.
2.9 Further Reading
• Abrams, M.A., Social Surveys and Social Action, London:
Heinemann, 1951.
•· Arthur, Maurice, Philosophy of Scientific Investigation,
Baltimore: John Hopkins University Press, 1943.
• Bernal, J.D., The Social Function of Science, London: George
Routledge and Sons, 1939.
• Chase, Stuart, The Proper Study of Mankind: An inquiry into
NOTES
Problem Definition
Problem Definition : 23
the Science of Human Relations, New York, Harper and Row
Publishers, 1958.
• Malhotra, Naresh K. Marketing research: An applied
orientation, 5/e. Pearson Education India, 2008.
• S. N. Murthy and U. Bhojanna, Business Research Methods,
Excel Books.
NOTES
Problem Definition

Marketing Research : 24
NOTES

UNIT 3 : RESEARCH DESIGN
NOTES
Marketing Research : 25
3.0 Unit Objectives
3.1 Introduction
3.2 An Overview
3.2.1 Need for Research Design
3.2.2 Types of Research Design
3.3 Exploratory Research
3.3.1 Characteristics of Exploratory Stage
3.3.2 Hypothesis Development at Exploratory Research Stage
3.3.3 Formulation of Hypothesis in Exploratory Research
3.3.4 Secondary Data
3.3.5 Qualitative Research
3.4 Descriptive Research Design
3.4.1 Types of Descriptive Studies
3.4.2 Survey
3.4.3 Observation Studies
3.5 Difference between Exploratory Research and Descriptive Research
3.6 Causal Research Design
3.7 Summary
3.8 Key Terms
3.9 Review Questions
3.10 Further Readings
Research Design
NOTES
Marketing Research : 26
3.0 Unit Objectives
After studying this unit, you will be able to:
• Define research design
• Describe the need of research design
• Explain the different types of research design
• Identify the Secondary data and qualitative research
• Recognize the Descriptive research design
• Label the causal research design.
3.1 Introduction
Research design is simply a plan for a study. This is used as a
guide in collecting and analyzing the data. It can be called a blue print to
carry out the study. It is like a plan made by an architect to build the
house, if a research is conducted without a blue print, the result is likely
to be different from what is expected at the start. The blue print includes
(1) interviews to be conducted, observations to be made, experiments to
be conducted data analysis to be made. (2) Tools used to collect the data
such as questionnaire (3) what is the sampling methods used.
3.2 An Overview
Research design can be thought of as the structure of research -
it is the “glue” that holds all of the elements in a research project together.
A successful design stems from a collaborative process involving good
planning and communication. Research Design is mainly of three types
namely, exploratory, descriptive and causal research. Exploratory research
is used to seek insights into general nature of the problem. It provides
the relevant variable that need to be considered. In this type of research,
Research Design
Marketing Research : 27
NOTES
there is no previous knowledge; research methods are flexible, qualitative
and unstructured.
Descriptive research is a type of research, very widely used in
marketing research. Generally in descriptive study there will be a
hypothesis, with respect to this hypothesis, we ask questions like size,
distribution, etc. Causal research, this type of research is concerned with
finding cause and effect relationship. Normally experiments are conducted
in this type of research.
3.2.1 Need for Research Design
Before starting the research process, efficient and appropriate research
design should be prepared. A research design is needed because of the
following benefits it provides:
• It helps in smooth functioning of various research operations.
• It requires less effort, time and money.
• It helps to plan in advance the methods and techniques to be used
for collecting and analyzing data.
• It helps in obtaining the objectives of the research with the
availability of staff, time and money.
The researcher should consider the following factors before
creating a research design:
• The method for obtaining information source
• Skills of the researcher and the co-ordinating staff
• Problem objectives
• Nature of the problem
• Time and money available for the research work.
3.2.2 Types of Research Design
Exploratory, descriptive and causal researches are some of the
Research Design
NOTES
Marketing Research : 28
major types. Exploratory researchis used to seek insights into general nature
of the problem. It provides the relevant variable that need to be considered.
In this type of research, there is no previous knowledge; research methods
are flexible, qualitative and unstructured. The researcher in this method
does not know “what he will find”. Descriptive research is a type of research,
very widely used in marketing research Generally in descriptive study there
will be a hypothesis, with respect to this hypothesis, we ask questions like
size, distribution, etc. Causal research, this type of research is concerned
with finding cause and effect relationship. Normally experiments are
conducted in this type of research.
3.3 Exploratory Research
The major emphasis in exploratory research is on converting broad,
vague problem statements into small, precise sub-problem statements,
which is done in order to formulate specific hypothesis. The hypothesis is
a statement that specifies, “how two or more variables are related?” In the
early stages of research, we usually lack from sufficient understanding of
the problem to formulate a specific hypothesis. Further, there are often
several tentative explanations.In this scenario, very little information is
available to point out, what is the actual cause of the problem. We can say
that the major purpose of exploratory research is to identify the problem
more specifically. Therefore, exploratory study is used in the initial stages
of research. Under what circumstances is exploratory study ideal?
The following are the circumstances in which exploratory study
would be ideally suited:
• To gain an insight into the problem
• To generate new product ideas
• To list all possibilities. Among the several possibilities, we need to
prioritize the possibilities which seem likely
Research Design
Check Your Progress
Can all causal research
hypotheses be studied?
Why or why not?
NOTES
Marketing Research : 29
• To develop hypothesis occasionally.
Example: A market researcher working for (new entrant) a company
for the first time.
• To establish priorities so that further research can be conducted.
• Exploratory studies may be used to clarify concepts and help in
formulating precise problems.
Example: The management is considering a change in the contract policy,
which it hopes, will result in improved satisfaction for channel members.
An exploratory study can be used to clarify the present state of channel
members’ satisfaction and to develop a method by which satisfaction
level of channel members is measured.
• To pre-test a draft questionnaire
• In general, exploratory research is appropriate to any problem
about which very little isknown. This research is the foundation
for any future study.
3.3.1 Characteristics of Exploratory Stage
• Exploratory research is flexible and very versatile.
• For data collection structured forms are not used.
• Experimentation is not a requirement.
• Cost incurred to conduct study is low.
• This type of research allows very wide exploration of views.
• Research is interactive in nature and also it is open ended.
3.3.2 Hypothesis Development at Exploratory
Research Stage
• Sometimes, it may not be possible to develop any hypothesis at
all, if the situation isbeing investigated for the first time. This is
because no previous data is available.
Research Design
NOTES
Marketing Research : 30
• Sometimes, some information may be available and it may be
possible to formulate atentative hypothesis.
• In other cases, most of the data is available and it may be possible
to provide answers tothe problem.
3.3.3 Formulation of Hypothesis in Expl-
oratory Research
The quickest and the cheapest way to formulate a hypothesis in
exploratory research is by using any of the four methods:
1. Literature Search : This refers to “referring to a literature to
develop a new hypothesis”.The literature referred are – trade
journals, professional journals, market research finding
publications, statistical publications etc. For example, suppose a
problem is “Why are sales down?” This can quickly be analysed
with the help of published data which should indicate, “whether
the problem” is an “industry problem” or a “firm problem”. Three
possibilities exist to formulate the hypothesis.
• The company’s market share has declined but industry’s figures
are normal.
• The industry is declining and hence the company’s market
share is also declining.
• The industry’s share is going up but the company’s share is
declining.
If we accept the situation that our company’s sales are down
despite the market showing an upward trend, then we need to
analyze the marketing mix variables.
2. Experience Survey : In experience surveys, it is desirable to talk
to persons who are well informed in the area being investigated.
These people may be company executives or persons outside the
Research Design
NOTES
Marketing Research : 31
organization. Here, no questionnaire is required. The approach adopted
in an experience survey should be highly unstructured, so that the
respondent can give divergent views.
3. Focus Group : Another widely used technique in exploratory research
is the focus group. In a focus group, a small number of individuals
are brought together to study and talk about some topic of interest.
The discussion is co-ordinated by a moderator. The group usually is
of 8-12 persons. While selecting these persons, care has to be taken
to see that they should have a common background and have similar
experiences in buying. This is required because there should not be a
conflict among the group members on the common issues that are
being discussed. During the discussion, future buying attitudes, present
buying opinion, etc., are gathered.
The following should be the characteristics of a moderator/
facilitator:
• Listening : He must have a good listening ability. The moderator
must not miss the participant’s comment, due to lack of attention.
• Permissive : The moderator must be permissive, yet alert to the
signs that the group is disintegrating.
• Memory : He must have a good memory. The moderator must be
able to remember the comments of the participants. Example: A
discussion is centered around a new advertisement by a telecom
company. The participant may make a statement early and make
another statement later, which is opposite to what was said earlier.
Example: The participant may say that s(he) never subscribed to
the views expressed in the advertisement by the competitor, but
subsequently may say that the “current advertisement of competitor
is excellent”.
• Encouragement : The moderator must encourage unresponsive
members to participate.
Research Design
Marketing Research : 32
NOTES
• Learning : He should be a quick learner.
• Sensitivity : The moderator must be sensitive enough to guide the
group discussion.
• Intelligence : He must be a person whose intelligence is above the
average.
• Kind/firm : He must combine detachment with empathy.
3.3.4 Secondary Data
Secondary data is information gathered for purposes other than the
completion of a research project. A variety of secondary information sources
is available to the researcher gathering data on an industry, potential product
applications and the market place. Secondary data is also used to gain initial
insight into the research problem.
Secondary data analysis saves time that would otherwise be spent
collecting data and, particularly in the case of quantitative data, provides
larger and higher-quality databases than would be unfeasible for any
individual researcher to collect on their own. In addition to that, analysts of
social and economic change consider secondary data essential, since it is
impossible to conduct a new survey that can adequately capture past change
and/or developments.
Secondary data can be obtained from two different research strands:
1. Quantitative : Census, housing, social security as well as electoral
statistics and other related databases.
2. Qualitative : Semi-structured and structured interviews, focus groups
transcripts, field notes, observation records and other personal,
research-related documents.
3.3.5 Qualitative Research
Qualitative research seeks out the ‘why’, not the ‘how’ of its topic
through the analysis of unstructured information – things like interview
Research Design
NOTES
Marketing Research : 33
transcripts, e-mails, notes, feedback forms, photos and videos. It doesn’t
just rely on statistics or numbers, which are the domain of quantitative
researchers. Qualitative research is used to gain insight into people’s
attitudes, behaviours, value systems, concerns, motivations, aspirations,
culture or life-styles. It’s used to inform business decisions policy
formation, communication and research. Focus groups, in-depth
interviews, content analysis and semiotics are among the many formal
approaches that are used, but qualitative research also involves the analysis
of any unstructured material, including customer feedback forms, reports
or media clips.
3.4 Descriptive Research Design
The name itself reveals that, it is essentially a research to describe
something. For example, I can describe the characteristics of a group
such as – customers, organisations, markets, etc Descriptive research
provides “association between two variables” like income and place of
shopping, age and preferences Descriptive inform us about the proportions
of high and low income customers in a particular territory. What descriptive
research cannot indicate is that it cannot establish a cause and effect
relationship between the characteristics of interest. This is the distinct
disadvantage of descriptive research.
Descriptive study requires a clear specification of “Who, what,
when, where, why and how” of the research. For example, consider a
situation of convenience stores (food world) planning to open a new outlet.
The company wants to determine, “How people come to patronize a new
outlet?”
3.4.1 Types of Descriptive Studies
There are two types of descriptive research:
Research Design
Check Your Progress
What do you see as the
reason behind Latin
Square Design testing
only one variable?
NOTES
Marketing Research : 34
1. Longitudinal Study : These are the studies in which an event or
occurrence is measured and again over a period of time. This is also
known as “Time Series Study”. Through longitudinal study, the
researcher comes to know how the market changes over time.
Longitudinal studies involve panels. Panel once constituted will have
certain elements. These elements may be individuals, stores, dealers,
etc. The panel or sample remains constant throughout the period.
There may be some dropouts and additions. The sample members in
the panel are being measured repeatedly. The periodicity of the study
may be monthly or quarterly etc.
2. Cross-sectional Study : Cross-sectional study is one of the most
important types of descriptive research; it can be done in two ways:
(a) Field study: This includes a depth study. Field study involves an
in-depth study of a problem, such as reaction of young men and
women towards a product.
Example: Reaction of Indian men towards branded ready-to-wear
suit. Field study is carried out in real world environment settings.
Test marketing is an example of field study.
(b) Field survey : Large samples are a feature of the study. The
biggest limitations of this survey are cost and time. Also, if the
respondent is cautious, then he might answer the questions in a
different manner. Finally, field survey requires good knowledge.
3.4.2 Survey
The survey is a research technique in which data are gathered by
asking questions of respondents. Survey research is one of the most
important areas of measurement in applied social research. The broad
area of survey research encompasses any measurement procedures that
Research Design
NOTES
Marketing Research : 35
involve asking questions of respondents. A “survey” can be anything
forms a short paper-and-pencil feedback form to an intensive one-on-
one in-depth interview.
3.4.3 Observation Studies
An observational study draws inferences about the possible effect
of a treatment on subjects, where the assignment of subjects into a treated
group versus a control group is outside the control of the investigator.
This is in contrast with controlled experiments, such as randomized
controlled trials, where each subject is randomly assigned to a treated
group or a control group before the start of the treatment. Observational
studies are sometimes referred to as natural experiments or as quasi-
experiments. These differences in terminology reflect certain differences
in emphasis, but a shared theme is that the early stages of planning or
designing an
3.5 Difference between Exploratory
Research and Descriptive Research
Exploatory Researh Desciptive Research
It is concerned with the “Why”
aspect of consumer behaviour
i.e., it tries to understand the
problem and not measure the
result.
It is concerned with the “What”,
“When” or “How often” on the
consumer behavior.
Research Design
This research does not require
large samples
This needs large samples of
respondents.
Sample need not to represent
the population
Sample must be representative of
population.
3.6 Causal Research Design
Causal Research are the studies that engage in hypotheses testing
usually explain the nature of certain relationships, or establish the
differences among groups or the independence of two or more factors in
a situation. A research design in which the major emphasis is on
determining the cause-and-effect relationship. The research is used to
measure what impact a specific change will have on existing norms and
allows market researchers to predict hypothetical scenarios upon which
a company can base its business plan.
3.7 Summary
• There are primarily four types of research namely exploratory
research, descriptive research, Casual and experimental research.
• Exploratory research helps the researcher to become familiar
with the problem. It helps to establish the priorities for further
research. It may or may not be possible to formulate Hypothesis
during exploratory stage.
Research Design
NOTES
Marketing Research : 36
Due to imprecise statement, data
collection is not easy.
Statement is precise. Therefore
data collection is easy
Characteristics of interest to be
measured are not clear.
Characteristics of interest to be
measured are clear.
There is no need for a question-
naire for collecting the data.
There should be a properly de-
signed questionnaire for data
collection.
Data collection methods are:
Focus group
Literature Searching
Case study
Use of panel data
Longitudinal
Cross-sectional studies
• To get an insight into the problem, literature search, experience
surveys, focus groups, and selected case studies assist in gaining
insight into the problem.
• The role of moderator or facilitator is extremely important in
focus group. There are several variations in the formation of focus
group.
• Descriptive research is rigid. This type of research is basically
dependent on hypothesis.
• Descriptive research is used to describe the characteristics of
the groups. It can also be used forecasting or prediction.
• Panel data is used in longitudinal studies. There are two different
types of panels. True panel and Omnibus panel. In true panel
same measurement are made during period of time. In Omnibus
panel different measurement are made during a period of time.
• Cross-sectional studies involve field study and field survey, the
difference being the size of sample.
• Causal research is conducted mainly to prove the fact that one
factor “X” the cause was responsible for the effect “Y”.
• While conducting experiment, the researcher must guard against
extraneous source of error. This may confound the experiment.
3.8 Key Terms
Causal Research : A research designed to determine cause and effect
relationship.
Conclusive Research : This is a research having clearly defined
objectives. In this type of research specific courses of action are taken to
solve the problem.
Concomitant Variation : It is the extent to which cause and effect vary
together.
Descriptive Research : It is essentially a research to describe something.
Research Design
NOTES
Marketing Research : 37
Ex-post Facto Research : Study of the current state and factors causing
it.
Extraneous Variable : These variables affect the response of test units.
Also known as confounding variable.
Field Study : Field study involves an in-depth study of a problem, such
as reaction of young men and women towards a product.
Literature Research : It refers to “referring to a literature to develop
a new hypothesis”.
Longitudinal Study : These are the studies in which an event or
occurrence is measured again and again over a period of time.
3.9 Review Questions
1. Can all causal research hypotheses be studied? Why or why
not?
2. For each of the situation mentioned below, state whether the
research should be exploratory, descriptive or causal and why
a) To find out the relationship between promotion and
sales.
b) To find out the consumer reaction regarding use of
new detergents which are Notes economical
c) To identify the target market demographics, for a
shopping mall.
d) Estimate the sales potential for ready-to-eat food in
the northeastern parts of India.
3. In your analysis, what are the advantages and disadvantages of
panel data?
4. What do you see as the reason behind Latin Square Design
testing only one variable?
5. Do you see any benefit of factorial design over that of before-
after design? Support your answer with reasons.
Research Design
NOTES
Marketing Research : 38
6. Is it necessary for the researcher to mention about the
bibliographies and appendices? Why/why not?
7. Illustrate advantages of experience survey by the help of
examples.
8. Why is an exploratory research used in the initial stages of
research?
9. Which type of research would you use to generate new
product ideas and why?
10. Which type of research study would you use to determine the
characteristics of market?
Check your progress
1. ........................... research is used to seek insights into general
nature of the problem.
2. Research design helps to plan in advance the methods and
techniques to be used for collecting and ………………..data.
3. The major emphasis in exploratory research is on converting
........................., vague problem statements into ...............
and .............................. sub-problem statements.
4. Exploratory research is ........................ and very
.......................
5. In experience surveys, it is desirable to talk to persons who
are well informed in the area being .............................
6. Most of the companies conducting the ...........................
groups first screen the candidates to determine who will
compose the particular group.
7. The moderator must not miss the .............................
comment.
8. The moderator must encourage ........................ members to
participate.
9. ................................. studies are the studies in which an event Marketing Research : 39
Research Design
NOTES
or occurrence is measured again and again over a period of
time.
10. Longitudinal study is also known as ...................................
11. True panel involves .......................... measurement of the
same variables.
12. The biggest limitations of field survey are ...................... and
............................
13. ……………….research requires large samples.
14. In ………………research, there is no need for a questionnaire
for collecting the data.
15. …………. research is a way of seeing how actions now will
affect a business in the future.
16. Synopsis is an abstract form of research which underlines the
research procedure followed and is presented before the guide
for evaluating its ……………….
17. Explanatory variable are the variables whose effects, resear-
cher wishes to .........................
18. …………………are units, on which the experiment is
carried out.
19. ……………..design helps to determine the effect of each of
the variables and also measure the interacting effect of the
several variables.
Answers:
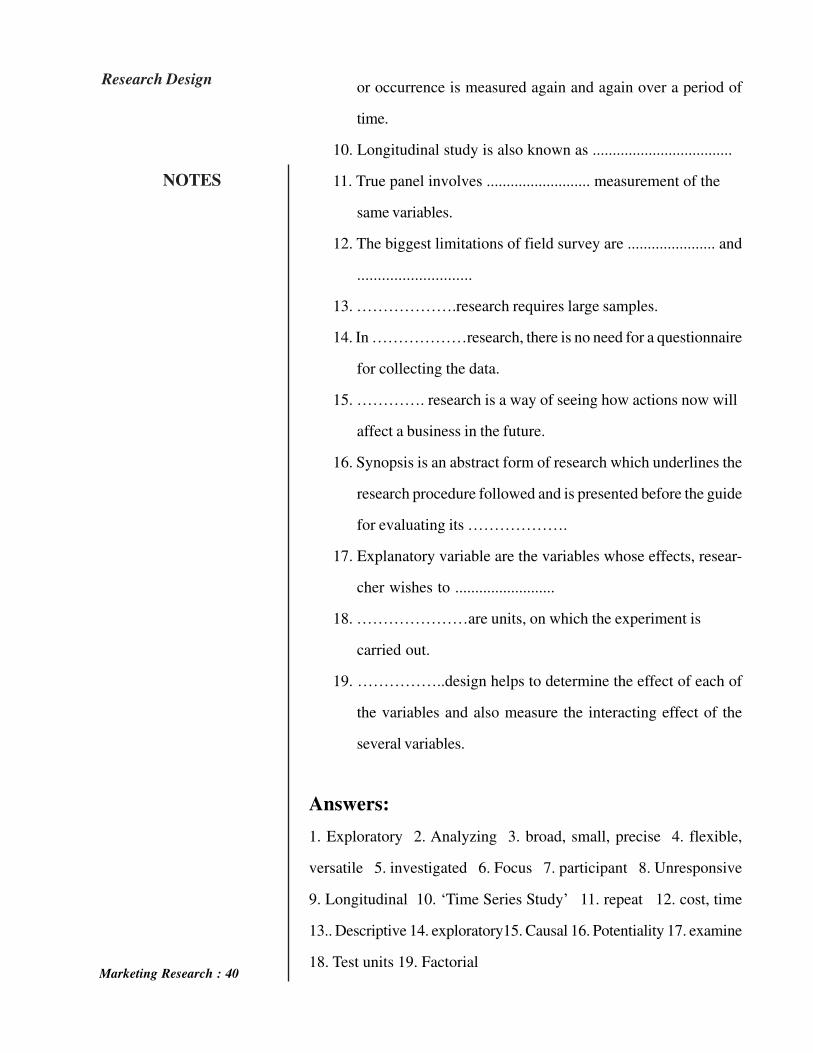
1. Exploratory 2. Analyzing 3. broad, small, precise 4. flexible,
versatile 5. investigated 6. Focus 7. participant 8. Unresponsive
9. Longitudinal 10. ‘Time Series Study’ 11. repeat 12. cost, time
13.. Descriptive 14. exploratory15. Causal 16. Potentiality 17. examine
18. Test units 19. FactorialMarketing Research : 40
Research Design
NOTES
3.10 Further Reading
• Abrams, M.A., Social Surveys and Social Action, London:
Heinemann, 1951.
• Arthur, Maurice, Philosophy of Scientific Investigation,
Baltimore: John Hopkins University Press, 1943.
• Bernal, J.D., The Social Function of Science, London: George
Routledge and Sons, 1939.
• Chase, Stuart, The Proper Study of Mankind: An inquiry into
the Science of Human Relations, New York, Harper and Row
Publishers, 1958.
• Malhotra, Naresh K. Marketing research: An applied
orientation, 5/e. Pearson Education India, 2008.
• S. N. Murthy and U. Bhojanna, Business Research Methods,
Excel Books.
Marketing Research : 41
Research Design
NOTES

Marketing Research : 42
NOTES
UNIT 4 : SAMPLING DESIGN
NOTES
Marketing Research : 43
4.0 Unit Objectives
4.1 Introduction
4.2 Sampling – An Introduction
4.2.1 Distinction between Census and Sampling
4.3 Steps of Sampling Design
4.3.1 Characteristics of a Good Sample Design
4.4 Types of Sample Design
4.4.1 Probability Sampling Techniques
4.4.2 Non-probability Sampling Techniques
4.4.3 Distinction between Probability Sample and Non-
probability Sample
4.5 Fieldwork
4.6 Errors in Sampling
4.6.1 Sampling Error
4.6.2 Non-sampling Error
4.6.3 Sampling Frame Error
4.6.4 Non-response Error
4.6.5 Data Error
4.7 Sampling Distribution
4.8 Summary
4.9 Key Terms
4.10 Review Questions
4.11 Further Readings
Sampling Design
NOTES
Marketing Research : 44
4.0 Unit Objectives
After studying this unit, you will be able to:
• Describe the conception of sampling
• Steps involved in the sampling design
• Identify the characteristics of good sampling design
• State the different types of sampling design
• Report about the probability and non-probability sampling
• Explain the various types of errors in sampling
4.1 Introduction
Sampling is the process of selecting units (e.g., people,
organizations) from a population of interest so that by studying the sample
we may fairly generalize our results back to the population from which
they were chosen. Each observation measures one or more properties
(weight, location, etc.) of an observable entity enumerated to distinguish
objects or individuals. Survey weights often need to be applied to the
data to adjust for the sample design. Results from probability theory and
statistical theory are employed to guide practice.
4.2 Sampling – An Introduction
A sample is a part of a target population, which is carefully
selected to represent the population. Sampling frame is the list of elements
from which the sample is actually drawn. Actually, sampling frame is
nothing but the correct list of population.
Example : Telephone directory, Product finder, Yellow pages.
The sampling process comprises several stages:
1. Defining the population of concern
2. Specifying a sampling frame, a set of items or events possible to
Sampling Design
Marketing Research : 45
NOTES
measure
3. Specifying a sampling method for selecting items or events from
the frame
4. Determining the sample size
5. Implementing the sampling plan
6. Sampling and data collecting
7. Reviewing the sampling process
4.2.1 Distinction between Census and Sampling
Census refers to complete inclusion of all elements in the
population. A sample is a sub-group of the population.
When is a Census Appropriate?
1. A census is appropriate if the size of population is small.
Example: A researcher may be interested in contacting firms in iron and
steel or petroleum products industry. These industries are limited in
number, so a census will be suitable.
2. Sometimes, the researcher is interested in gathering information from
every individual.
Example: Quality of food served in a mess.
When is Sample Appropriate?
1. When the size of population is large.
2. When time and cost are the main considerations in research.
3. If the population is homogeneous.
Also, there are circumstances when a census is not possible.
Example : Reactions to global advertising by a company.
4.3 Steps of Sampling Design
Sampling process consists of seven steps. They are:
1. Define the population
Sampling Design
Check Your Progress
What do you analyse as
the advantages and
disadvantages of
probability sampling?
NOTES
Marketing Research : 46
2. Identify the sampling frame
3. Specify the sampling unit
4. Selection of sampling method
5. Determination of sample size
6. Specify sampling plan
7. Selection of sample
1. Define the population :
Population is defined in terms of :
(a) Elements
(b) Sampling units
(c) Extent
(d) Time.
Example : If we are monitoring the sale of a new product recently
introduced by a company, say (shampoo sachet) the population will be:
(a) Element - Company’s product
(b) Sampling unit - Retail outlet, super market
(c) Extent - Hyderabad and Secunderabad
(d) Time - April 10 to May 10, 2016
2. Identify the sampling frame :
Sampling frame could be
(a) Telephone Directory
(b) Localities of a city using the municipal corporation listing
(c) Any other list consisting of all sampling units.
Example : You want to learn about scooter owners in a city. The RTO
will be the frame, which provides you names, addresses and the types of
vehicles possessed.
3. Specify the sampling unit :
Individuals who are to be contacted are the sampling units. If
retailers are to be contacted in a locality, they are the sampling units.
Sampling Design
NOTES
Marketing Research : 47
Sampling unit may be husband or wife in a family. The selection of
sampling unit is very important. If interviews are to be held during
office timings, when the heads of families and other employed persons
are away, interviewing would under-represent employed persons, and
over-represent elderly persons, housewives and the unemployed.
4. Selection of sampling method :
This refers to whether (a) probability or (b) non-probability
methods are used.
5. Determine the sample size :
This means we need to decide “how many elements of the target
population are to be chosen?” The sample size depends upon the type
of study that is being conducted. For example: If it is an exploratory
research, the sample size will be generally small. For conclusive research,
such as descriptive research, the sample size will be large. The sample
size also depends upon the resources available with the company.
6. Specify the sampling plan :
A sampling plan should clearly specify the target population.
Improper defining would lead to wrong data collection.
Example : This means that, if a survey of a household is to be conducted,
a sampling plan should define a “household” i.e., “Does the household
consist of husband or wife or both”, minors etc., “Who should be
included or excluded.” Instructions to the interviewer should include
“How he should obtain a systematic sample of households, probability
sampling non-probability sampling”. Advise him on what he should do
to the household, if no one is available.
7. Select the sample :
This is the final step in the sampling process.
Sampling Design
NOTES
Marketing Research : 48
4.3.1 Characteristics of a Good Sample
Design
A good sample design requires the judicious balancing of four
broad criteria - goal orientation, measurability, practicality and economy.
1. Goal orientation :
This suggests that a sample design “should be oriented to the
research objectives, tailored to the survey design, and fitted to the survey
conditions”. If this is done, it should influence the choice of the population,
the measurement as also the procedure of choosing a sample.
2. Measurability :
A sample design should enable the computation of valid estimates
of its sampling variability. Normally, this variability is expressed in the
form of standard errors in surveys. However, this is possible only in the
case of probability sampling. In non-probability samples, such a quota
sample, it is not possible to know the degree of precision of the survey
results.
3. Practicality :
This implies that the sample design can be followed properly in
the survey, as envisaged earlier. It is necessary that complete, correct,
practical, and clear instructions should be given to the interviewer so
that no mistakes are made in the selection of sampling units and the final
selection in the field is not different from the original sample design.
Practicality also refers to simplicity of the design, i.e. it should be capable
of being understood and followed in actual operation of the field work.
4. Economy :
Finally, economy implies that the objectives of the survey should
be achieved with minimum cost and effort. Survey objectives are generally
Sampling Design
NOTES
Marketing Research : 49
spelt out in terms of precision, i.e. the inverse of the variance of survey
estimates. For a given degree of precision, the sample design should give
the minimum cost. Alternatively, for a given per unit cost, the sample
design should achieve maximum precision (minimum variance).
4.4 Types of Sample Design
Sampling is divided into two types: Probability sampling: In a
probability sample, every unit in the population has equal chances for
being selected as a sample unit. Non-probability sampling: In the non-
probability sampling, the units in the population have unequal or negligible,
almost no chances for being selected as a sample unit.
4.4.1 Probability Sampling Techniques
1. Random sampling.
2. Systematic random sampling.
3. Stratified random sampling.
4. Cluster sampling.
5. Multistage sampling.
1. Random Sampling
Simple random sample is a process in which every item of the
population has an equal probability of being chosen.
In random sampling, there are two possibilities:
(a) Equal probability
(b) Varying probability.
(a) Equal Probability: This is also called as the random sampling with
replacement.
2. Systematic Random Sampling
In systematic random sampling first item was randomly selected.
The rest are systematically selected. This is a very popular method because
Sampling Design
Marketing Research : 50
NOTES
we need only one random number.
3. Stratified Random Sampling
A probability sampling procedure in which simple random sub-
samples are drawn from within different strata that are, more or less
equal on some characteristics. Stratified sampling is of two types:
A. Proportionate stratified sampling: The number of sampling units
drawn from each stratum is in proportion to the population size of that
stratum.
B. Disproportionate stratified sampling: The number of sampling units
drawn from each stratum is based on the analytical consideration, but
not in proportion to the size of the population of that stratum. Sampling
process is as follows:
1. The population to be sampled is divided into groups (stratified).
2. A simple random sample is chosen.
4. Cluster Sampling :
The following steps are followed:
1. The population is divided into clusters.
2. A simple random sample of few clusters is selected.
3. All the units in the selected cluster are studied.
4.4.2 Non-probability Sampling Techniques
1. Deliberate sampling
2. Shopping mall intercept sampling
3. Sequential sampling
4. Quota sampling
5. Snowball sampling
6. Panel samples
Sampling Design
NOTES
Marketing Research : 51
1. Deliberate or Purposive Sampling
This is also known as the judgment sampling. The investigator
uses his discretion in selecting sample observations from the universe.
As a result, there is an element of bias in the selection. From the point of
view of the investigator, the sample thus chosen may be a true
representative of the universe. However, the units in the universe do not
enjoy an equal chance of getting included in the sample. Therefore, it
cannot be considered a probability sampling.
2. Shopping Mall Intercept Sampling
This is a non-probability sampling method. In this method the
respondents are recruited for individual interviews at fixed locations in
shopping malls.
3.Sequential Sampling
This is a method in which the sample is formed on the basis of a
series of successive decisions. They aim at answering the research
question on the basis of accumulated evidence. Sometimes, a researcher
may want to take a modest sample and look at the results. Thereafter,
s(he) will decide if more information is required for which larger samples
are considered. If the evidence is not conclusive after a small sample,
more samples are required. If the position is still inconclusive, still larger
samples are taken. At each stage, a decision is made about whether
more information should be collected or the evidence is now sufficient
to permit a conclusion.
4. Snowball Sampling
This is a non-probability sampling. In this method, the initial
group of respondents are selected randomly. Subsequent respondents
are being selected based on the opinion or referrals provided by the
initial respondents. Further referrals will lead to more referrals, thus
leading to a snowball sampling. The referrals will have demographic
Sampling Design
NOTES
Marketing Research : 52
and psychographic characteristics that are relatively similar to the person
referring them.
Example: College students bring in more students on the consumption
of Pepsi. The major advantage of snowball sampling is that it monitors
the desired characteristics in the population.
5. Panel Samples
Panel samples are frequently used in marketing research. To give
an example, suppose that one is interested in knowing the change in the
consumption pattern of households. A sample of households is drawn.
These households are contacted to gather information on the pattern of
consumption. Subsequently, say after a period of six months, the same
households are approached once again and the necessary information on
their consumption is collected.
4.4.3 Distinction between Probability Sample
and Non-probability Sample Probability
Sample
1. Here, each member of a universe has a known chance of being
selected and included in the sample.
2. Any personal bias is avoided. The researcher cannot exercise his
discretion in the selection of sample items.
Example: Random sample and cluster sample.
Non-probability Sample
In this case, the likelihood of choosing a particular universe
element is unknown. The sample chosen in this method is based on aspects
like convenience, quota etc.
Example: Quota sampling and Judgment sampling.
Sampling Design
NOTES
Marketing Research : 53
Difference between Cluster Sampling and Stratified Random
Sampling
The major difference between cluster sampling and stratified
sampling lies with the inclusion of the cluster or strata. In stratified
random sampling, all the strata of the population is sampled while in
cluster sampling, the researcher merely randomly selects a number of
clusters from the collection of clusters of the entire population. Thus,
only a number of clusters are sampled, all the other clusters are left
unrepresented. The other notable differences between Cluster and
Stratified random sampling are as follows:
• When natural groupings are clear in a statistical population,
cluster sampling technique is used. While Stratified sampling
is a method where in, the member of a group are grouped into
relatively homogeneous groups.
• Cluster sampling can be chosen if the group consists of
homogeneous members. On the other hand, for heterogeneous
members in the groups, stratified sampling is a good option.
• The benefit of cluster sampling over other sampling methods is,
it is cheaper as compared to the other methods. While the
benefits of stratified sampling are, this method ignores the
irrelevant ones and focuses on the vital sub populations. Another
advantage is, with stratified random sampling method is that
for different sub populations, the researcher can opt for different
sampling techniques. The stratified sampling method as well
helps in improving the efficiency and accuracy of the estimation
and facilitates greater balancing of statistical power of tests.
• The major disadvantage of cluster sampling is, it initiates higher
sampling error. This sampling error may be represented as
design effect. The disadvantages of stratified random sampling
method are, it calls for choice of relevant stratification variables
which can be tough at times. When there are homogeneous
Sampling Design
Check Your Progress
Shopping Mall Intercept
Sampling is not consid-
ered a scientific appro-
ach. Why?
subgroups, random sampling method is not much useful. The
implementation of random sampling method is expensive and If
not provided with correct information about the population,
then an error may be introduced.
• All strata are represented in the sample; but only a subset of
clusters are in the sample.
4.5 Fieldwork
The fieldwork consists of informal conversations as well as
formal standardized interviews, including projective or questionnaires.
Initially, a single person conducted the research. Changes in society
have shifted research for the most part into teamwork. However, a
single person can still conduct effective research. Traditionally,
educational researchers began their research with a set of hypothesis,
whereas the fieldworker’s hypothesis emerges through the fieldwork.
Fieldwork in its inception may seem to be disorganized. The notes may
be scattered, information is coming from all over the place. That is
because the hypothesis has not yet emerged. Even though, at times the
hypothesis may become very clear rapidly.
Once the hypothesis became evident the fieldworker maintains
an open mind thus allowing other hypothesis to emerge. Another
important difference between the types of research is the “nature of the
proposition sought: his propositions are rarely of the A causes B type,
the usual casual interrelationships between two or more variables dealt
with in an experimental research”. Much of the naturalistic data is
collected by using raw materials: notes stating the actual response given.
In order to be accurate recorders are often used. Experienced researchers
create their own techniques and develop the ability to remember the
information that needs to be recorded.
Sampling Design
NOTES
Marketing Research : 54
4.6 Errors in Sampling
4.6.1 Sampling Error
The only way to guarantee the minimization of sampling error
is to choose the appropriate sample size. As the sample keeps on
increasing, the sampling error decreases. Sampling error is the gap
between the sample mean and population mean.
4.6.2 Non-sampling Error
One way of distinguishing between the sampling and the non-
sampling error is that, while sampling error relates to random variations
which can be found out in the form of standard error, non-sampling
error occurs in some systematic way which is difficult to estimate.
4.6.3 Sampling Frame Error
A sampling frame is a specific list of population units, from
which the sample for a study being chosen.
4.6.4 Non-response Error
This occurs, because the planned sample and final sample vary
significantly.
Example: Marketers want to know about the television viewing habits
across the country. They choose 500 households and mail the
questionnaire. Assume that only 200 respondents reply. This does not
show a non-response error, which depends upon the discrepancy. If
those 200 who replied did not differ from the chosen 500, there is no
non-response error. Consider an alternative. The people who responded
are those who had plenty of leisure time. Therefore, it is implied that
non-respondents do not have adequate leisure time. In this case, the
Sampling Design
NOTES
Marketing Research : 55
final sample and the planned sample differ. If it was assumed that all
the 500 chosen have leisure time, but in the final analysis only 200
have leisure time and not others. Therefore, a sample with respect to
leisure time leads to response error.
Guidelines to Increase the Response Rate
Every researcher likes to get maximum possible response from
the respondents, and will be most delighted if cent percent respondent
unfortunately, this does not happen. The non-response error can be
reduced by increasing the response rate. Higher the response rate,
more accurate and reliable is the data. In order to achieve this, some
useful hints could be as follows:
1. Intimate the respondents in advance through a letter. This will
improve the preparedness.
2. Personalized questionnaire should be accompanied by a covering
letter.
3. Ensure/Assure that confidentiality will be maintained
4. Questionnaire length is to be restricted
5. Increase of personal interview, I.D. card is essential to prove
the bona fide.
6. Monetary incentives are gifts will act as motivator
7. Reminder/Revisits would help.
8. Send self addressed/stamped envelope to return the completed
questionnaire.
4.6.5 Data Error
This occurs during the data collection, analysis of data or
interpretation. Respondents sometimes give distorted answers
unintentionally for questions which are difficult, or if the question is
exceptionally long and the respondent may not have answer. Data errors
can also occur depending on the physical and social characteristics of
Sampling Design
NOTES
Marketing Research : 56
the interviewer and the respondent. Things such as the tone and voice
can affect the responses. Therefore, we can say that the characteristics of
the interviewer can also result in data error. Also, cheating on the part of
the interviewer leads to data error. Data errors can also occur when
answers to open-ended questions are being improperly recorded.
4.7 Sampling Distribution
A sampling distribution is the probability distribution of a given
statistic based on a random sample of certain size n. It may be considered
as the distribution of the statistic for all possible samples of a given size.
The sampling distribution depends on the underlying distribution of the
population, the statistic being considered, and the sample size used. The
sampling distribution is frequently opposed to the asymptotic distribution,
which corresponds to the limit case.
Example: Consider a normal population with mean and variance. Assume
we repeatedly take samples of a given size from this population and
calculate the arithmetic mean for each sample – this statistic is called the
sample mean. Each sample will have its own average value, and the
distribution of these averages will be called the “sampling distribution of
the sample mean”. This distribution will be normal N(m, s2/n) since the
underlying population is normal. The standard deviation of the sampling
distribution of the statistic is referred to as the standard error of that
quantity.
4.8 Summary
• Sample is a representative of population while Census represents cent
percent of population.
• The most important factors distinguishing whether to choose sample
Sampling Design
NOTES
Marketing Research : 57
or census is cost and time. There are seven steps involved in selecting
the sample.
• There are two types of sample, namely, Probability sampling and
Non-probability sample.
• Probability sampling includes random sampling, stratified random
sampling systematic sampling, cluster sampling, Multistage
sampling.
• Random sampling can be chosen by Lottery method or using random
number table.
• Samples can be chosen either with equal probability or varying
probability.
• Random sampling can be systematic or stratified.
• In systematic random sampling, only the first number is randomly
selected. Then by adding a constant “K” remaining numbers are
generated.
• In stratified sampling, random samples are drawn from several strata,
which has more or less same characteristics.
• In multistage sampling, sampling is drawn in several stages.
4.9 Key Terms
Census: It refers to complete inclusion of all elements in the population.
A sample is a sub-group of the population.
Deliberate Sampling: The investigator uses his discretion in selecting
sample observations from the universe. As a result, there is an element
of bias in the selection.
Quota sampling :is quite frequently used in marketing research. It
involves the fixation of certain quotas, which are to be fulfilled by the
interviewers.
Random Sampling: Simple random sample is a process in which every
item of the population has an equal probability of being chosen.
Sampling Design
NOTES
Marketing Research : 58
Sample Frame: Sampling frame is the list of elements from which the
sample is actually drawn.
Stratified Random Sampling: A probability sampling procedure in
which simple random subsamples are drawn from within different strata,
that are, more or less equal on some characteristics.
4.10 Review Questions
1. What do you analyse as the advantages and disadvantages of
probability sampling?
2. Which method of sampling would you use in studies, where the
level of accuracy can vary from the prescribed norms and why?
3. Shopping Mall Intercept Sampling is not considered a scientific
approach. Why?
4. Quota sampling does not require prior knowledge about the cell
to which each population unit belongs. Does this attribute serve
as an advantage or disadvantage for Quota Sampling?
5. What suggestions would you give to reduce non sampling error?
6. One mobile phone user is asked to recruit another mobile phone
user. What sampling method is this known as and why?
7. Sampling is a part of the population. True/False? Why/why not?
8. Determine the sample size if the standard deviation of population
is 20 and the standard error is 4.1.
9. What do see as the reason behind purposive sampling being
known as judgement sampling?
Check your progress :
1. A sample is a part of a .................... population.
2. Sampling ........................... is the list of elements from which
the sample is actually drawn.
Sampling Design
NOTES
Marketing Research : 59
3. A sample is appropriate when the size of population is
.................... and .....................
4. A census is appropriate if the size of population is .....................
5. A sampling plan should clearly specify the ....................
population.
6. The sample size depends upon the .................... available with
the company.
7. Sampling is divided into two types, viz. ...................... and
......................
8. There are ...................... methods used in the random sampling.
9. ...................... is also called as the random sampling with
replacement.
10. ...................... is also called random sampling without
replacement.
11. Stratified sampling can be carried out with ......................
proportion across the strata proportionate stratified sample.
12. Fieldwork in its inception may seem to be ......................
13. ...................... researchers create their own techniques and
develop the ability to remember the information that needs to
be recorded.
14. The only way to guarantee the minimization of sampling error
is to choose the appropriate ...............................
15. A ............................... is a specific list of population units, from
which the sample for a study being chosen.
16. The ............................... error can be reduced by increasing
the response rate.
19. Sampling distribution depends on the underlying distribution
of the ..............................., the statistic being considered, and
the sample size used.
20. The standard deviation of the sampling distribution of the
statistic is referred to as the ............................... of that quantity.
Sampling Design
NOTES
Marketing Research : 60
Sampling Design
NOTES
Marketing Research : 61
Answers:
1. target 2. Frame 3. large, homogeneous 4. Small 5. target
6. Resources 7. probability, non-probability 8. Two 9. Equal
Probability 10. Varying Probability 11. same 12. Disorganized
13. Experienced 14. sample size 15. sampling frame 16. non
response 17. larger 18. Precision 19. population 20. standard error.
4.11 Further Reading
• Abrams, M.A., Social Surveys and Social Action, London:
Heinemann, 1951.
• Arthur, Maurice, Philosophy of Scientific Investigation,
Baltimore: John Hopkins University Press, 1943.
• Bernal, J.D., The Social Function of Science, London: George
Routledge and Sons, 1939.
• Chase, Stuart, The Proper Study of Mankind: An inquiry into
the Science of Human Relations, New York, Harper and Row
Publishers, 1958.
• Malhotra, Naresh K. Marketing research: An applied
orientation, 5/e. Pearson Education India, 2008.
• S. N. Murthy and U. Bhojanna, Business Research Methods,
Excel Books.

Marketing Research : 62
NOTES
UNIT 5: MEASUREMENT AND
SCALING TECHNIQUESNOTES
Marketing Research : 63
5.0 Unit Objectives
5.1 Introduction
5.2 Measurement Scales: Tools of Sound Measurement
5.2.1 Nominal Scale
5.2.2 Ordinal Scale (Ranking Scale)
5.2.3 Interval Scale
5.2.4 Ratio Scale
5.3 Techniques of Developing Measurement Tools
5.4 Scaling – Meaning
5.5 Comparative and Non-comparative Scaling Techniques
5.5.1 Comparative Scaling Techniques
5.5.2 Non-comparative Scale
5.6 Criteria for the Good Test
5.6.1 Reliability Analysis
5.6.2 Validity Analysis
5.7 Summary
5.8 Key Terms
5.9 Review Questions
5.10 Further Readings
Measurement and
Scaling Techniques
NOTES
Marketing Research : 64
5.0 Unit Objectives
After studying this unit, you will be able to:
• Recognize the tools of sound measurement
• Explain the techniques of developing measurement tools
• Describe the meaning and techniques of scaling
• Differentiate among Comparative and non-comparative scales
• Describe the Multi-dimensional scaling techniques
5.1 Introduction
Measurement is assigning numbers or other symbols to
characteristics of objects being measured, according to predetermined
rules. Concept (or Construct) is a generalized idea about a class of objects,
attributes, occurrences, or processes. Relatively concrete constructs
comprises of aspects such as Age, gender, number of children, education,
income. Relatively abstract constructs take into accounts the aspects
such as Brand loyalty, personality, channel power, satisfaction.
Scaling is the generation of a continuum upon which measured
objects are located.
Scale is a quantifying measure – a combination of items that is
progressively arranged according to value or magnitude. The purpose is
to quantitatively represent an item’s, person’s, or event’s place in the
scaling continuum.
5.2 Measurement Scales: Tools of Sound
Measurement
These are of four kinds of scales, namely:
1. Nominal scale
2. Ordinal scale
3. Interval scale
Measurement and
Scaling Techniques
Marketing Research : 65
NOTES
4. Ratio scale
5.2.1 Nominal Scale
In this scale, numbers are used to identify the objects. For
example, University Registration numbers assigned to students, numbers
on their jerseys. The purpose of marking numbers, symbols, labels etc.
in this type of scaling is not to establish an order but it is to simply put
labels in order to identify events and count the objects and subjects.
This measurement scale is used to classify individuals, companies,
products, brands or other entities into categories where no order is
implied. Indeed, it is often referred to as a categorical scale. It is a
system of classification and does not place the entity along a continuum.
It involves a simple count of the frequency of the cases assigned to the
various categories, and if desired numbers can be nominally assigned to
label each category.
Characteristics
1. It has no arithmetic origin.
2. It shows no order or distance relationship.
3. It distinguishes things by putting them into various groups.
Use: This scale is generally used in conducting in surveys and ex-
post-facto research.
Example: Have you ever visited Bangalore?
Yes-1
No-2
‘Yes’ is coded as ‘One’ and ‘No’ is coded as ‘Two’. The numeric
attached to the answers has no meaning, and is a mere identification. If
numbers are interchanged as one for ‘No’ and two for ‘Yes’, it won’t
Measurement and
Scaling Techniques
Check Your Progress
What do you analyse as
the merits of Thurstone
Scale?
NOTES
Marketing Research : 66
affect the answers given by respondents. The numbers used in nominal
scales serve only the purpose of counting.
The telephone numbers are an example of nominal scale, where
one number is assigned to one subscriber. The idea of using nominal scale
is to make sure that no two persons or objects receive the same number.
Similarly, bus route numbers are the example of nominal scale.
“How old are you”? This is an example of a nominal scale.
5.2.2 Ordinal Scale (Ranking Scale)
The ordinal scale is used for ranking in most market research
studies. Ordinal scales are used to ascertain the consumer perceptions,
preferences, etc. Ordinal scale is used to arrange things in order. In
qualitative researches, rank ordering is used to rank characteristics units
from the highest to the lowest.
Characteristics
1. The ordinal scale ranks the things from the highest to the lowest.
2. Such scales are not expressed in absolute terms.
3. The difference between adjacent ranks is not equal always.
4. For measuring central tendency, median is used.
5. For measuring dispersion, percentile or quartile is used.
Scales involve the ranking of individuals, attitudes or items along
the continuum of the characteristics being scaled.
From the information provided by ordinal scale, the researcher
knows the order of preference but nothing about how much more one
brand is preferred to another i.e., there is no information about the interval
between any two brands. All of the information, a nominal scale would
have given, is available from an ordinal scale. In addition, positional
statistics such as the median, quartile and percentile can be determined. It
Measurement and
Scaling Techniques
NOTES
Marketing Research : 67
is possible to test for order correlation with ranked data. The two main
methods are Spearman’s Ranked Correlation Coefficient and Kendall’s
Coefficient of Concordance.
5.2.3 Interval Scale
Interval scale is more powerful than the nominal and ordinal
scales. The distance given on the scale represents equal distance on the
property being measured. Interval scale may tell us “How far the objects
are apart with respect to an attribute?” This means that the difference
can be compared. The difference between “1” and “2” is equal to the
difference between “2” and “3”.
Interval scale uses the principle of “equality of interval” i.e., the
intervals are used as the basis for making the units equal assuming that
intervals are equal. It is only with an interval scaled data that researchers
can justify the use of the arithmetic mean as the measure of average.
The interval or cardinal scale has equal units of measurement thus,
making it possible to interpret not only the order of scale scores but
also the distance between them. However, it must be recognized that
the zero point on an interval scale is arbitrary and is not a true zero.
This, of course, has implications for the type of data manipulation and
analysis we can carry out on data collected in this form. It is possible to
add or subtract a constant to all of the scale values without affecting
the form of the scale but one cannot multiply or divide the values. It
can be said that two respondents with scale positions 1 and 2 are as far
apart as two respondents with scale positions 4 and 5, but not that a
person with score 10 feels twice as strongly as one with score 5.
Temperature is interval scaled, being measured either in Centigrade or
Fahrenheit. We cannot speak of 50°F being twice as hot as 25°F since
the corresponding temperatures on the centigrade scale, 100°C and -
3.9°C, are not in the ratio 2:1.
Measurement and
Scaling Techniques
NOTES
Marketing Research : 68
Interval scales may be either numeric or semantic.
Characteristics
1. Interval scales have no absolute zero. It is set arbitrarily.
2. For measuring central tendency, mean is used.
3. For measuring dispersion, standard deviation is used.
4. For test of significance, t-test and f-test are used.
5. Scale is based on the equality of intervals.
5.2.4 Ratio Scale
Ratio scale is a special kind of internal scale that has a meaningful
zero point. With this scale, length, weight or distance can be measured.
In this scale, it is possible to say, how many times greater or smaller
one object is being compared to the other.
This scale is used to measure actual variables. The highest level
of measurement is a ratio scale. This has the properties of an interval
scale together with a fixed origin or zero point.
Examples of variables which are ratio scaled include weights, lengths
and times. Ratio scales permit the researcher to compare both differences
in scores and in the relative magnitude of scores. For instance, the
difference between 5 and 10 minutes is the same as that between 10
and
15 minutes, and 10 minutes is twice as long as 5 minutes.
Characteristics
1. This scale has an absolute zero measurement.
2. For measuring central tendency, geometric and harmonic means are
used.
Use: Ratio scale can be used in all statistical techniques.
Measurement and
Scaling Techniques
NOTES
Marketing Research : 69
5.3 Techniques of Developing Measurement
Tools
The scale construction techniques are used for measuring the
attitude of a group or an individual. In other words, scale construction
technique helps in estimate the interest or behaviour of an individual or a
group towards others or another’s environment rather than oneself. While
performing a scale construction technique, you need to consider various
decisions related to the attitude of the individual or group. A few of
these decisions are:
• Determining the level of the involved data; identifying whether it
is nominal, ordinal, interval or ratio.
• Identifying the useful statistical analysis for the scale construction.
• Identifying the scale construction technique to be used.
• Selecting the physical layout of the scales.
• Determining the scale categories that need to be used.
There are two primary scale construction techniques, comparative
and non-comparative. The comparative technique is used to determine
the scale values of multiple items by performing comparisons among the
items. In the non-comparative technique, scale value of an item is
determined without comparing with another item. Furthermore, these
two techniques are also of many types. The various types of comparative
techniques are:
1. Pairwise comparison scale: This is an ordinal level scale
construction technique, where a respondent is provided with two
items and then asked him to select his/her choice.
2. Rasch model scale: In this technique, multiple respondents are
simultaneously involved with several items and from their
Measurement and
Scaling Techniques
Marketing Research : 70
NOTES
responses comparisons are derived to determine the scale values.
3. Rank-order scale: This is also an ordinal level scale constructing
technique, where a respondent is provided with multiple items,
which he needs to rank accordingly.
4. Constant sum scale: In this scale construction technique, a
respondent is usually provided with a constant amount of money,
credits or points that he needs to allocate to various items for
determining the scale values of the items.
The various types of non-comparative techniques are:
1. Continuous rating scale: In this technique, respondents generally
use a series of numbers known as scale points for rating an item.
This technique is also known as graphic rating scaling.
2. Likert scale: This technique allows the respondents to rate the
items on a scale of five to seven points depending upon the amount
of their agreement or disagreement on the item.
3. Semantic differential scale: In this technique, respondents are
asked to rate the different attributes of an item on a seven-point
scale.
5.4 Scaling – Meaning
Scaling is a process or set of procedures, which is used to assess
the attitude of an individual. Scaling is defined as the assignment of objects
to numbers according to a rule. The objects in the definition are text
statements, which can be the statements of attitude or principle. Attitude
of an individual is not measured directly by scaling. It is first migrated to
statements and then the numbers are assigned to them. Figure below shows
the how to scale the attitude of individuals.
Measurement and
Scaling Techniques
NOTES
Marketing Research : 71
5.5 Comparative and Non-comparative
Scaling Techniques
1. Comparative Scales : It involve the direct comparison of two
or more objects.
2. Non-comparative Scales : Objects or stimuli are scaled
independently of each other.
5.5.1 Comparative Scaling Techniques
Paired Comparison :
Example : Here a respondent is asked to show his preferences
from among five brands of coffee – A, B, C, D and E with respect to
flavours. He is required to indicate his preference in pairs. A number of
pairs are calculated as follows. The brands to be rated are presented
two at a time, so each brand in the category is compared once to every
other brand. In each pair, the respondents were asked to divide 100
points on the basis of how much they liked one compared to the other.
The score is totally for each brand.
No. of pairs = N(N-1)/2.
Rank Order Scaling
1. Respondents are presented with several objects simultaneously
2. Then asked to order or rank them according to some criterion
3. Data obtained are ordinal in nature-Arranged or ranked in order
of magnitude
4. Commonly used to measure preferences among brands and brand
attributes.
Constant Sum Scaling
1. Respondents are asked to allocate a constant sum of units among
a set of stimulus objects with respect to some criterion
Measurement and
Scaling Techniques
Check Your Progress
What might be the
limitations of Thurstone
Scale?
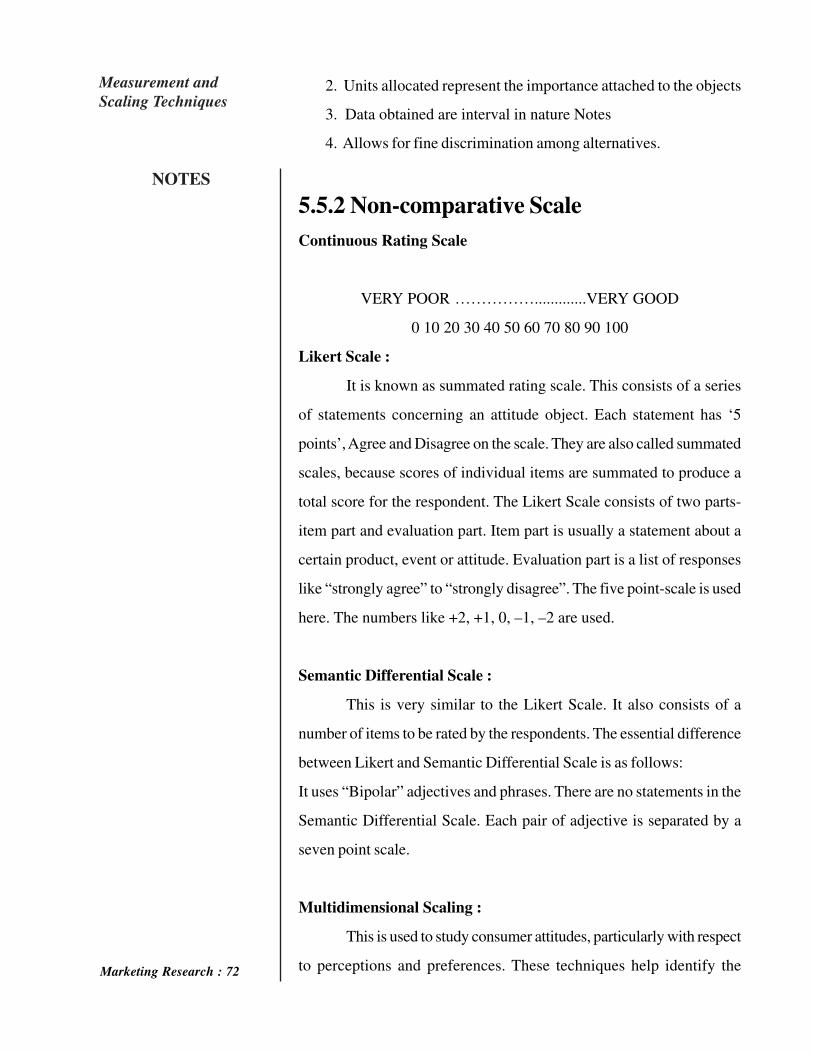
NOTES
Marketing Research : 72
2. Units allocated represent the importance attached to the objects
3. Data obtained are interval in nature Notes
4. Allows for fine discrimination among alternatives.
5.5.2 Non-comparative Scale
Continuous Rating Scale
VERY POOR …………….............VERY GOOD
0 10 20 30 40 50 60 70 80 90 100
Likert Scale :
It is known as summated rating scale. This consists of a series
of statements concerning an attitude object. Each statement has ‘5
points’, Agree and Disagree on the scale. They are also called summated
scales, because scores of individual items are summated to produce a
total score for the respondent. The Likert Scale consists of two parts-
item part and evaluation part. Item part is usually a statement about a
certain product, event or attitude. Evaluation part is a list of responses
like “strongly agree” to “strongly disagree”. The five point-scale is used
here. The numbers like +2, +1, 0, –1, –2 are used.
Semantic Differential Scale :
This is very similar to the Likert Scale. It also consists of a
number of items to be rated by the respondents. The essential difference
between Likert and Semantic Differential Scale is as follows:
It uses “Bipolar” adjectives and phrases. There are no statements in the
Semantic Differential Scale. Each pair of adjective is separated by a
seven point scale.
Multidimensional Scaling :
This is used to study consumer attitudes, particularly with respect
to perceptions and preferences. These techniques help identify the
Measurement and
Scaling Techniques
NOTES
Marketing Research : 73
product attributes that are important to the customers and to measure
their relative importance. Multi-Dimensional Scaling is useful in
studying the following:
1. (a) What are the major attributes considered while choosing a
product (soft drinks, modes of transportation)? (b) Which
attributes do customers compare to evaluate different brands
of the product? Is it price, quality, availability etc.?
2. Which is the ideal combination of attributes according to the
customer? (i.e., which two or more attributes consumer will
consider before deciding to buy.)
3. Which advertising messages are compatible with the
consumer’s brand perceptions?
Stapel Scales
1. Modern versions of the Stapel scale place a single adjective as
a substitute for the semantic differential when it is difficult to
create pairs of bipolar adjectives.
2. The advantage and disadvantages of a Stapel scale, as well as
the results, are very similar to those for a semantic differential.
However, the stapel scale tends to be easier to conduct and
administer.
5.6 Criteria for the Good Test
There are two criteria to decide whether the scale selected is
good or not. They are:
1. Reliability; and
2. Validity
Measurement and
Scaling Techniques
5.6.1 Reliability Analysis
Reliability means the extent to which the measurement process
is free from errors. Reliability deals with accuracy and consistency.
The scale is said to be reliable, if it yields the same results when repeated
measurements are made under constant conditions.
Reliability can be ensured by using the same scale on the same
set of respondents, using the same method. However, in actual practice,
this becomes difficult as:
1. Extent to which a scale produces consistent results
2. Test-retest Reliability: Respondents are administered scales at
2 different times under nearly equivalent conditions
3. Alternative-form Reliability: 2 equivalent forms of a scale are
constructed, then tested with the same respondents at 2 different
times
4. Internal Consistency Reliability:
(a) The consistency with which each item represents the
construct of interest
(b) Used to assess the reliability of a summated scale
(c) Split-half Reliability
5. Items constituting the scale divided into 2 halves, and resulting
half scores are correlated: Coefficient alpha (most common
test of reliability)
6. Average of all possible split-half coefficients resulting from
different splitting of the scale items.
5.6.2 Validity Analysis
The paradigm of validity focused in the question “Are we
measuring, what we think, we are measuring?” Success of the scale
lies in measuring “What is intended to be measured?” Of the two
attributes of scaling, validity is the most important.Marketing Research : 74
Measurement and
Scaling Techniques
NOTES
There are several methods to check the validity of the scale used for
measurement:
1. Construct Validity: A sales manager believes that there is a
clear relation between job satisfaction for a person and the
degree to which a person is an extrovert and the work
performance of his sales force. Therefore, those who enjoy high
job satisfaction, and have extrovert personalities should exhibit
high performance. If they do not, then we can question the
construct validity of the measure.
2. Content Validity: A researcher should define the problem clearly.
Identify the item to be measured. Evolve a suitable scale for
this purpose. Despite these, the scale may be criticized for being
lacking in content validity. Content validity is known as face
validity.
3. Predictive Validity: This pertains to “How best a researcher
can guess the future performance from the knowledge of attitude
score”?
4. Criterion Validity:
(a) Examines whether measurement scale performs as expected
in relation to other variables selected as meaningful criteria,
i.e., predicted and actual behavior should be similar
(b) Addresses the question of what construct or characteristic
the scale is actually measuring.
5. Convergent Validity: Extent to which scale correlates positively
with other measures of the same construct.
6. Discriminant Validity: Extent to which a measure does not
correlate with other constructs from which it is supposed to
differ.
7. Nomological Validity: Extent to which scale correlates in
theoretically predicted ways with measures of different but
related constructs. Marketing Research : 75
Measurement and
Scaling Techniques
NOTES
5.7 Summary
• Measurement can be made using nominal, ordinal, interval or
ratio scale.
• The scales show the extent of likes/dislikes, agreement
disagreement or belief towards an object.
• Each of the scale has certain statistical implications.
• There are four types of scales used in market research namely
paired comparison, Likert, semantic differential and thurstone
scale.
• Likert is a five point scale whereas semantic differential scale
is a seven point scale.
• Bipolar adjectives are used in semantic differential scale.
• Thurstone scale is used to assess attitude of the respondents
group regarding any issue of public interest.
• Validity and reliability of the scale is verified before the scale is
used for measurement.
• Validity refers to “Does the scale measure what it intends to
measure”.
• There are three methods to check the validity which type of
validity is required depends on “What is being measured”.
5.8 Key Terms
Interval Scale: Interval scale may tell us “How far the objects are
apart with respect to an attribute?”
Likert Scale: This consists of a series of statements concerning an
attitude object. Each statement has ‘5 points’, Agree and Disagree on
the scale.
Ordinal Scale: The ordinal scale is used for ranking in most market
research studies.Marketing Research : 76
Measurement and
Scaling Techniques
NOTES
Ratio Scale: Ratio scale is a special kind of internal scale that has a
meaningful zero point.
Reliability: It means the extent to which the measurement process is
free from errors.
5.9 Review Questions
1. What do you analyse as the merits of Thurstone Scale?
2. What might be the limitations of Thurstone Scale?
3. Which do you find to be more favorable of the attribute and
non-attribute method of perceptual mapping and why?
4. In your opinion, what might be the uses of multi dimensional
scaling?
5. One of the limitations of MDS can be that it keeps changing
from time to time. What else than this do you see as the major
drawbacks it has?
6. What can be the reasons for which you think that maintaining
reliability can become difficult?
7. Does measurement scale always perform as expected in relation
to other variables selected as meaningful criteria? Why/why not?
8. On an average, how many cups of tea do you drink in a day and
why? Reply technically.
9. Explain the construction of
(a) Likert scale
(b) Semantic differential scale
(c) Thurstone scale
10. Despite reliability, a scale may not have content validity.
Comment Identify the type of scale, you will use in each of the
following (ordinal, nominal, internal, ratio). Justify your answer.
11. Identify the type of scale, you will use in each of the following
(ordinal, nominal, internal, ratio). Justify your answer.Marketing Research : 77
Measurement and
Scaling Techniques
NOTES
Check your progress:
1. ....................... scale may tell us “How far the objects are apart
with respect to an attribute?”
2. Ratio scale is a special kind of internal scale that has a meaningful
.................................
3. Scale construction techniques are used for measuring the
…………….of a group.
4. The comparative technique is used to determine the scale values
of ……………items by performing comparisons among the
items.
7. The advantage and disadvantages of a Stapel scale, as well as
the results, are very similar to those for a ......................
differential.
8. ............................... Scaling is used to study consumer attitudes,
particularly with respect to perceptions and preferences
9. Thurstone Scale is also known as an .............................. scale.
10. Semantic Differential Scale is very similar to the .......................
Scale.
11. The Likert Scale consists of two parts ........................... and
..........................
12. In ............................. Scaling respondents are presented with
several objects simultaneously.
13. Comparative Scales involve the direct comparison of
................................objects.
14. An ....................... questionnaire, which is the basis for
forecasting the demand for a product has predictive validity.
15. Those who enjoy high job satisfaction, and have extrovert
personalities should exhibit .................... performance.
16. Reliability deals with ...................... and .........................Marketing Research : 78
Measurement and
Scaling Techniques
NOTES
Marketing Research : 79
Measurement and
Scaling Techniques
NOTES
17. There are two criteria to decide whether the scale selected is
good or not, viz. ....................... and ....................
Answers:
1. Interval 2. zero point 3. attitude 4. Multiple 5 Attitude 6. Hypothesis
7. semantic 8. Multidimensional 9. equal appearing interval 10. Likert
11. item part, evaluation part 12. Rank Order 13. ________
14. _________ 15. ___________ 16. _______ 17. _________
Further Reading
• Abrams, M.A., Social Surveys and Social Action, London:
Heinemann, 1951.
• Arthur, Maurice, Philosophy of Scientific Investigation,
Baltimore: John Hopkins University Press, 1943.
• Bernal, J.D., The Social Function of Science, London: George
Routledge and Sons, 1939.
• Chase, Stuart, The Proper Study of Mankind: An inquiry into
the Science of Human Relations, New York, Harper and Row
Publishers, 1958.
• Malhotra, Naresh K. Marketing research: An applied
orientation, 5/e. Pearson Education India, 2008.
• S. N. Murthy and U. Bhojanna, Business Research Methods,
Excel Books.

Marketing Research : 80
NOTES
UNIT 6: QUESTIONNAIRE DESIGN
NOTES
Marketing Research : 81
6.0 Unit Objectives
6.1 Introduction
6.2 Questionnaire
6.2.1 Characteristics of good questionnaire.
6.2.2 The steps preceding questionnaire design
6.3 Process of questionnaire design
6.4 Choose the method(s) of reaching target respondents
6.5 Decide on question content
6.5.1 Develop the question wording
6.5.2 Disadvantages are also present when using such
questions
6.5.3 Closing questions
6.6 Physical appearance of the questionnaire
6.7 Piloting the questionnaires
6.8 Summary
6.9 Key Terms
6.10 Review Questions
6.11 Further Reading
Questionnaire Design
NOTES
Marketing Research : 82
6.0 Unit Objectives
After studying this unit, you will be able to:
• Understand the attributes of a well-designed questionnaire,
and
• Adopt a framework for developing questionnaires.
6.1 Introduction
No survey can achieve success without a well-designed
questionnaire. Unfortunately, questionnaire design has no theoretical
base to guide the marketing researcher in developing a flawless
questionnaire. All the researcher has to guide him/her is a lengthy list of
do’s and don’ts born out of the experience of other researchers past and
present. Hence, questionnaire design is more of an art than a science.
6.2 Questionnaire
A questionnaire is a research instrument consisting of a series of
questions and other prompts for the purpose of gathering information
from respondents.
6.2.1 Characteristics of good questionnaire
The design of a questionnaire will depend on whether the
researcher wishes to collect exploratory information (i.e. qualitative
information for the purposes of better understanding or the generation
of hypotheses on a subject) or quantitative information (to test specific
hypotheses that have previously been generated).
Exploratory questionnaires :
If the data to be collected is qualitative or is not to be statistically
Questionnaire Design
Marketing Research : 83
NOTES
evaluated, it may be that no formal questionnaire is needed. For
example, in interviewing the female head of the household to find out
how decisions are made within the family when purchasing breakfast
foodstuffs, a formal questionnaire may restrict the discussion and
prevent a full exploration of the woman’s views and processes. Instead
one might prepare a brief guide, listing perhaps ten major open-ended
questions, with appropriate probes/prompts listed under each.
Formal standardized questionnaires :
If the researcher is looking to test and quantify hypotheses and
the data is to be analyzed statistically, a formal standardized
questionnaire is designed. Such questionnaires are generally
characterized by :
• prescribed wording and order of questions, to ensure that each
respondent receives the same stimuli
• prescribed definitions or explanations for each question, to
ensure interviewers handle questions consistently and can
answer respondents’ requests for clarification if they occur
• prescribed response format, to enable rapid completion of the
questionnaire during the interviewing process.
Given the same task and the same hypotheses, six different
people will probably come up with six different questionnaires that
differ widely in their choice of questions, line of questioning, use of
open-ended questions and length. There are no hard-and-fast rules
about how to design a questionnaire, but there are a number of points
that can be borne in mind :
1. A well-designed questionnaire should meet the research
objectives. This may seem obvious, but many research surveys
omit important aspects due to inadequate preparatory work,
and do not adequately probe particular issues due to poor
Questionnaire Design
Check Your Progress
Summarize the qualities
of a good questionnaire?
NOTES
Marketing Research : 84
understanding. To a certain degree some of this is inevitable. Every
survey is bound to leave some questions unanswered and provide
a need for further research but the objective of good questionnaire
design is to ‘minimise’ these problems.
2. It should obtain the most complete and accurate information
possible. The questionnaire designer needs to ensure that
respondents fully understand the questions and are not likely to
refuse to answer, lie to the interviewer or try to conceal their
attitudes. A good questionnaire is organised and worded to
encourage respondents to provide accurate, unbiased and
complete information.
3. A well-designed questionnaire should make it easy for respondents
to give the necessary information and for the interviewer to record
the answer, and it should be arranged so that sound analysis and
interpretation are possible.
4. It would keep the interview brief and to the point and be so
arranged that the respondent(s) remain interested throughout the
interview.
6.2.2 The steps preceding questionnaire design
It emphasizes that writing of the questionnaire proper should not
begin before an exploratory research phase has been completed.
6.3 Process of questionnaire design
There are nine steps involved in the development of a questionnaire :
1. Decide the information required.
2. Define the target respondents.
3. Choose the method(s) of reaching your target respodents.
4. Decide on question content.
5. Develop the question wording.
6. Put questions into a meaningful order and format.
Questionnaire Design
NOTES
Marketing Research : 85
7. Check the length of the questionnaire.
8. Pre-test the questionnaire.
9. Develop the final survey form
Deciding on the information required
It should be noted that one does not start by writing questions.
The first step is to decide ‘what are the things one needs to know from
the respondent in order to meet the survey’s objectives?’ These, as
has been indicated in the opening chapter of this textbook, should
appear in the research brief and the research proposal.
One may already have an idea about the kind of information to
be collected, but additional help can be obtained from secondary data,
previous rapid rural appraisals and exploratory research. In respect of
secondary data, the researcher should be aware of what work has
been done on the same or similar problems in the past, what factors
have not yet been examined, and how the present survey questionnaire
can build on what has already been discovered. Further, a small number
of preliminary informal interviews with target respondents will give a
glimpse of reality that may help clarify ideas about what information
is required.
Define the target respondents
At the outset, the researcher must define the population about
which he/she wishes to generalise from the sample data to be collected.
For example, in marketing research, researchers often have to decide
whether they should cover only existing users of the generic product
type or whether to also include non-users. Secondly, researchers have
to draw up a sampling frame. Thirdly, in designing the questionnaire
we must take into account factors such as the age, education, etc. of
the target respondents.
Questionnaire Design
NOTES
Marketing Research : 86
6.4 Choose the method(s) of reaching target
respondents
It may seem strange to be suggesting that the method of
reaching the intended respondents should constitute part of the
questionnaire design process. However, a moment’s reflection is
sufficient to conclude that the method of contact will influence not
only the questions the researcher is able to ask but the phrasing of
those questions. The main methods available in survey research are:
• personal interviews
• group or focus interviews
• mailed questionnaires
• telephone interviews.
Within this region the first two mentioned are used much more
extensively than the second pair. However, each has its advantages
and disadvantages. A general rule is that the more sensitive or personal
the information, the more personal the form of data collection should
be.
6.5 Decide on question content
Researchers must always be prepared to ask, “Is this question
really needed?” The temptation to include questions without critically
evaluating their contribution towards the achievement of the research
objectives, as they are specified in the research proposal, is surprisingly
strong. No question should be included unless the data it gives rise to
is directly of use in testing one or more of the hypotheses established
during the research design.
There are only two occasions when seemingly “redundant”
questions might be included:
Questionnaire Design

NOTES
Marketing Research : 87
• Opening questions that are easy to answer and which are not
perceived as being “threatening”, and/or are perceived as being
interesting, can greatly assist in gaining the respondent’s
involvement in the survey and help to establish a rapport.
This, however, should not be an approach that should be overly
used. It is almost always the case that questions which are of use in
testing hypotheses can also serve the same functions.
• “Dummy” questions can disguise the purpose of the survey and/
or the sponsorship of a study. For example, if a manufacturer
wanted to find out whether its distributors were giving the
consumers or end-users of its products a reasonable level of
service, the researcher would want to disguise the fact that the
distributors’ service level was being investigated. If he/she did
not, then rumours would abound that there was something
wrong with the distributor.
6.5.1 Develop the question wording
Survey questions can be classified into three forms, i.e. closed,
open-ended and open response-option questions. So far only the first of
these, i.e. closed questions has been discussed. This type of questioning
has a number of important advantages;
• It provides the respondent with an easy method of indicating his
answer - he does not have to think about how to articulate his
answer.
• It ‘prompts’ the respondent so that the respondent has to rely
less on memory in answering a question.
• Responses can be easily classified, making analysis very
straightforward.
Questionnaire Design
Check Your Progress
The textbook says that
one does not start by
writing questions. How
should the researcher
begin?
Marketing Research : 88
NOTES
• It permits the respondent to specify the answer categories most
suitable for their purposes.
Putting questions into a meaningful order and
format
Opening questions : Opening questions should be easy to answer
and not in any way threatening to THE respondents. The first question
is crucial because it is the respondent’s first exposure to the interview
and sets the tone for the nature of the task to be performed. If they
find the first question difficult to understand, or beyond their
knowledge and experience, or embarrassing in some way, they are
likely to break off immediately. If, on the other hand, they find the
opening question easy and pleasant to answer, they are encouraged
to continue.
Question flow : Questions should flow in some kind of psychological
order, so that one leads easily and naturally to the next. Questions on
one subject, or one particular aspect of a subject, should be grouped
together. Respondents may feel it disconcerting to keep shifting from
one topic to another, or to be asked to return to some subject they
thought they gave their opinions about earlier.
Question variety : Respondents become bored quickly and restless
when asked similar questions for half an hour or so. It usually improves
response, therefore, to vary the respondent’s task from time to time.
An open-ended question here and there (even if it is not analysed)
may provide much-needed relief from a long series of questions in
which respondents have been forced to limit their replies to pre-coded
categories. Questions involving showing cards/pictures to respondents
can help vary the pace and increase interest.
Questionnaire Design
NOTES
Marketing Research : 89
6.5.2 Closing Questions
It is natural for a respondent to become increasingly indifferent
to the questionnaire as it nears the end. Because of impatience or
fatigue, he may give careless answers to the later questions. Those
questions, therefore, that are of special importance should, if possible,
be included in the earlier part of the questionnaire. Potentially sensitive
questions should be left to the end, to avoid respondents cutting off
the interview before important information is collected.
In developing the questionnaire the researcher should pay
particular attention to the presentation and layout of the interview
form itself. The interviewer’s task needs to be made as straight-forward
as possible.
• Questions should be clearly worded and response options
clearly identified.
• Prescribed definitions and explanations should be provided.
This ensures that the questions are handled consistently by all
interviewers and that during the interview process the
interviewer can answer/clarify respondents’ queries.
Ample writing space should be allowed to record open-ended
answers, and to cater for differences in handwriting between
interviewers.
6.6 Physical appearance of the questionn-
aire
The physical appearance of a questionnaire can have a
significant effect upon both the quantity and quality of marketing data
obtained. The quantity of data is a function of the response rate. Ill-
designed questionnaires can give an impression of complexity, medium
and too big a time commitment. Data quality can also be affected by
Questionnaire Design

NOTES
Marketing Research : 90
the physical appearance of the questionnaire with unnecessarily confusing
layouts making it more difficult for interviewers, or respondents in the
case of self-completion questionnaires, to complete this task accurately.
Attention to just a few basic details can have a disproportionately
advantageous impact on the data obtained through a questionnaire. In
general it is best for a questionnaire to be as short as possible. A long
questionnaire leads to a long interview and this is open to the dangers
of boredom on the part of the respondent (and poorly considered, hurried
answers), interruptions by third parties and greater costs in terms of
interviewing time and resources. In a rural situation an interview should
not last longer then 30-45 minutes.
6.7 Piloting the questionnaires
Even after the researcher has proceeded along the lines
suggested, the draft questionnaire is a product evolved by one or two
minds only. Until it has actually been used in interviews and with
respondents, it is impossible to say whether it is going to achieve the
desired results. For this reason it is necessary to pre-test the questionnaire
before it is used in a full-scale survey, to identify any mistakes that need
correcting.
The purpose of pretesting the questionnaire is to
determine:
• Whether the questions as they are worded will achieve the desired
results
• Whether the questions have been placed in the best order
• Whether the questions are understood by all classes of
respondent
• Whether additional or specifying questions are needed or whether
some questions should be eliminated
Questionnaire Design
NOTES
Marketing Research : 91
• Whether the instructions to interviewers are adequate.
Usually a small number of respondents are selected for the pre-
test. The respondents selected for the pilot survey should be broadly
representative of the type of respondent to be interviewed in the main
survey.
If the questionnaire has been subjected to a thorough pilot
test, the final form of the questions and questionnaire will have evolved
into its final form. All that remains to be done is the mechanical process
of laying out and setting up the questionnaire in its final form. This
will involve grouping and sequencing questions into an appropriate
order, numbering questions, and inserting interviewer instructions.
6.8 Summary
A well designed questionnaire is essential to a successful survey.
However, the researcher must develop his/her own intuition with
respect to what constitutes ‘good design’ since there is no theory of
questionnaires to guide him/her.
A good questionnaire is one which help directly achieve the
research objectives, provides complete and accurate information; is
easy for both interviewers and respondents to complete, is so designed
as to make sound analysis and interpretation possible and is brief.
There are at least nine distinct steps: decide on the information
required; define the target respondents, select the method(s) of reaching
the respondents; determine question content; word the questions;
sequence the questions; check questionnaire length; pre-test the
questionnaire and develop the final.
Questionnaire Design
6.9 Key Terms
••••• Questionnaire : It is a research instrument consisting of a series
of questions and other prompts for the purpose of gathering
information from respondents.
Mailed questionnaire
Open-ended and open response-option questions
Personal interviews
6.10 Review Questions
1. Summarize the qualities of a good questionnaire.
2. Where should interviewer instructions pertaining to responses
to a particular question be placed on the questionnaire?
3. The textbook says that one does not start by writing questions.
How should the researcher begin?
4. What are the two occasions when apparently “redundant”
questions should be found in a questionnaire?
5. Name the three advantages of open-ended questions.
6. What are the three reasons why a respondent is unable to answer
a question?
7. What is the recommended duration of interviews carried out in
rural situations?
8. What are the key characteristics of opening questions in a
questionnaire?
Check your progress:
1. Generally as a thumb rule, it is advisable to keep the number of
words in a question not exceeding ………......
Questionnaire Design
Marketing Research : 92
NOTES
Questionnaire Design
Marketing Research : 93
NOTES
2. In a ............................scale, the number of favourable responses
are equal to the number of unfavorable responses.
3. A major disadvantage of dichotomous question is that it .......... the
respondent’s response..
4. Open-ended questions are useful in ………………research,
where all possible alternatives are explored.
Answers:
1. 20 2. Balanced 3. Limits 4. exploratory
6.11 Further Reading
• Abrams, M.A., Social Surveys and Social Action, London:
Heinemann, 1951.
• Arthur, Maurice, Philosophy of Scientific Investigation,
Baltimore: John Hopkins University Press, 1943.
• Bernal, J.D., The Social Function of Science, London: George
Routledge and Sons, 1939.
• Chase, Stuart, The Proper Study of Mankind: An inquiry into
the Science of Human Relations, New York, Harper and Row
Publishers, 1958.
• Malhotra, Naresh K. Marketing research: An applied
orientation, 5/e. Pearson Education India, 2008.
• S. N. Murthy and U. Bhojanna, Business Research Methods,
Excel Books.

Marketing Research : 94
NOTES
UNIT 7: QUANTITATIVE DATA
ANALYSISNOTES
Marketing Research : 95
7.0 Unit Objectives
7.1 Introduction
7.2 The Process of Quantitative Data Analysis
7.2.1 Review
7.2.2 Coding survey data
7.2.3 Data Entry
7.3 Data Analysis using Descriptive Statistics
7.3.1 Descriptive statistics
7.3.2 Frequency
7.3.3 Central tendency
7.3.4 Mode
7.3.5 Median
7.3.6 Mean
7.3.7 Dispersion measures
7.3.8 Range
7.3.9 Variance
7.3.10 Standard deviation
7.4 Data Analysis using Inferential Statistics
7.4.1 Statistical testing process
7.4.2 Hypothesis
7.4.3 Level of confidence
7.4.4 Chi-square tests
7.5 Analysis of Qualitative Data Content
7.5.1 Consumer segments
7.5.2 Consumer behavior processes
7.5.3 Comparing and contrasting consumer traits
7.5.4 Development of hypotheses
Quantitative Data
Analysis
NOTES
Marketing Research : 96
7.6 Analysis of ethnographic and observational research data
7.7 Summary
7.8 Key Terms
7.9 Review Questions
7.10 Further Readings and References
7.0 Unit Objectives
After reading this unit you should be able:
• To describe about the marketing research.
• To describe various statistical data analytical techniques used in
marketing research.
• To differentiate between qualitative and quantitative data analysis.
• To describe the importance of marketing research in an
organization.
7.1 Introduction
Marketing research is all about gathering information. Although
it is applied to a broad array of situations, marketing research gives
decision-makers the information they need to find solutions to business
problems, such as the following
ü What is satisfaction level of customers about your product and
service offering?
ü What would be probable reaction of your customers to a decision
of change in price or a product?
ü What is the feedback of your customers?
ü What would be the appropriate strategy to sustain in the
competition of given market?
Quantitative Data
Analysis
Marketing Research : 97
NOTES
The solutions to several issues of the business can be found by
using marketing research. Despite the fact that the fundamentals of
research have survived for thousands of years, technological progress
during the last century have bought into a wider array of studies feasible.
Enhanced use of Internet in the last 10-15 years has made research
accessible at a greatly lesser price and, as a result, it is easily accessible
to organizations of all sizes. Therefore, the research area has burst up
with new prospectus and methodologies, and organizations have large
statistical data at their disposal than ever before.
7.2 The Process of Quantitative Data Analysis
After completion of the survey research, the first job to be
carried out in a marketing researcher is to appraise the questionnaire
forms. On completion of this appraisal the researcher is prepared to
add any open-ended questions if required. The last step in the pre-
analysis method is to feed the data onto a computer software program.
7.2.1 Review
Analysts might have taken great care in choosing the research
question. Additionally, the questionnaire form might have been
meticulously written and tested. However, unless the survey sample
was extra emeelyun derided with only a few participators, the actually
conducting of the survey will have been out of the control of
researchers. For an administered survey form, subordinates might have
been employed to carry out the survey. Self-administered forms will
have to be accomplished void of any help from researchers or
subordinates. Due to these facts, the survey should be checked for
validity, comprehensiveness and precision prior to enter the data. The
problems that occur when validity is considered are the survey so carried
is checked if actually accomplished by an assistant and whether a
participator was eligible for the survey. It is inopportune but factual
Quantitative Data
Analysis
Check Your Progress
Explain the process of
Quantitative Data analy-
sis in short?
NOTES
Marketing Research : 98
that occasionally those individuals hired to perform surveys may actually have
completed the forms on their own. Probable reason for this may be due to
disappointment, because of lack of ability to acquire the cooperation of potent
participator, or it may perhaps be due to untruthfulness. Whatever be the
case, all forms should be checked to see if it looks as if an assistant has
completed them. Evidences would reveal answers that are exceptionally
random or answers that are persistently replicated. Besides, the demographic
segment of a form must be checked to make sure that any eligibility
requirements, such as education level and age, have been valued. Completeness
of the survey forms should be checked whether all the questions asked in that
form are answered or not. There is a possibility of an in complete form due to
participants’ choice of not to answering some of the questions or may not
have been accomplished because of time restriction. Apart from this, the form
would consist of more than one page which may produce a possibility that a
participant would not have noticed further questions on the next page.
Researchers have to decide what proportion of completion is essential for a
form to be incorporated in the study or not needed. Finally, forms should be
checked for precision. Researchers must appraise the forms to decide if the
answers can be read and understood. They should be capable to simply
differentiate which answers have been marked. In addition, the answers to
open-ended questions should be able to be decoded.
7.2.2 Coding Survey Data
Later on the forms are checked for validity, completeness and
accuracy; now they are ready for data entry. Because surveys are a type
of quantitative research, the data required is entered as numbers that can
then be statistically analyzed. Close-ended questions should be pre-coded
on the survey form with the numbers that will be fed into the computer
program. On the other hand, open-ended questions require manual
processing before they are ready to be entered onto the computer program.
Quantitative Data
Analysis
NOTES
Marketing Research : 99
To complete this assignment, researchers should commence by listing all
the answers that were recorded for an open-ended question, and then
merge the responses. For instance, if a question asked for reason for
shopping at city centre Mall, the answers may be combined into the
groupings of ‘convenient location’, ‘diversity of stores’, ‘parking’ and
‘special events’. Each grouping is then allotted an arithmetical code and it
is this code that is fed into the computer program.
7.2.3 Data entry
In case of web-based survey, the data entry step is not necessary
as the answers are entered automatically. Some survey forms are now
designed so that the outcomes can be automatically scanned. Data
entry for conventional paper survey forms can be performed by anybody
with the ability to use a computer. A software package such as SPSS,
‘R’ program can be used for statistical analysis. SPSS is commonly
used for business entities and the social science researches. This
program is user friendly with built in tutoring features.
7.3 Data Analysis using Descriptive Statistics
After entering the data into the computer software program,
marketing researchers begin the process of analyzing the data. The
researchers should in no way disregard that the purpose of the analysis
is to offer information that can be used for taking strategic decisions.
There are two kinds of statistical analysis that can be used and these
are descriptive and inferential. Descriptive analysis gathers, summarizes
and presents a set of data. This type of analysis is easy for researchers
to perform and for management to comprehend.
7.3.1 Descriptive statistics
Descriptive statistics help researchers to observe prototypes
Quantitative Data
Analysis
NOTES
Marketing Research : 100
in research data. A fundamental idea used to examine end user
characteristics and conduct is frequency, together with one-way frequency
and cross tabulation. Using frequency researchers can recognize how many
participants’ answers were analogous. A second concept is central
tendency, which comprises the mode, median and mean. Additionally,
dispersion of central tendency should be examined together with range,
variance and standard deviation.
Data analysis
ü Frequency: one way, cross tabulation
ü Central Tendency: mode, median, mean
ü Dispersion: range, variance, standard deviation
7.3.2 Frequency
Frequency can be understood by means of the simple example
of a survey question that is asked why consumers shop at Atul’s Toy
store. The survey question may provide the required answers to choose
from – fair prices, the top selection and better service. If 100 persons
were examined, Atul would wish to know what proportion of the
customers preferred each response. However, some persons will not
react to a survey in any way. In reality the response rate will vary
based on cultural values (Lyness and Kropf, 2007).
The foremost problem faced by the researchers in helping Atul
is that among the 100 survey forms not all of them would be useable
as a few of the participants might not have given their response, whilst
others may have attempted the question but the response provided by
them may beard to interpret. Additionally, a number of respondents
may not attempt the entire questionnaire. As a consequence, of the
100 survey forms completed conceivably only 95 will be useable. After
analyzing the data for one-way distribution (how many persons
responded to each potential answer to the question) it may be
Quantitative Data
Analysis
NOTES
Marketing Research : 101
concluded that helpful service is the most repeated response. A distribution
table of the data would look like Table 1below.
This information will promptly notify Atul of the positioning of
the responses, with helpful service being at the top, followed by best
selection and then good prices. Although, it is hard when just interpreting
the numbers to comprehend how much more significant to the participants
was service over selection. Addition of percentage to the table makes
the association between the responses simpler to grasp as the majority
of the people can observe the associations among percentages more
quickly than those between raw numbers. The percentage is calculated
off of the total number of responses used (95) rather than the total number
of respondents (100). The percentages show that helpful service is almost
twice as important as best selection.
The survey question asking consumers for their impulse for
shopping at Atul’s store could have been designed to permit for numerous
responses. The question would have read ‘Which among the following
reasons make you shop here?’ In such a scenario the numbers would
look dissimilar as some people might mark more than one response. The
responses look like Table 2 since the question permitted respondents to
tick more than one answer; the total response is now 105. Still, the
percentage is calculated on 95 respondents only which is why when added
together, the responses total more than 100 per cent.
These dissimilar frequency results exhibit the significance of
cautiously scheduling the survey questions and answers. In the tables
above, the ranking did not change. However it is likely that permitting
multiple responses will alter the frequency ranking. If more than one
response is permitted, researchers may desire to ask respondents to grade
them in preference. In these way respondents who mark both service
and price can express which of the two is most significant.
Quantitative Data
Analysis
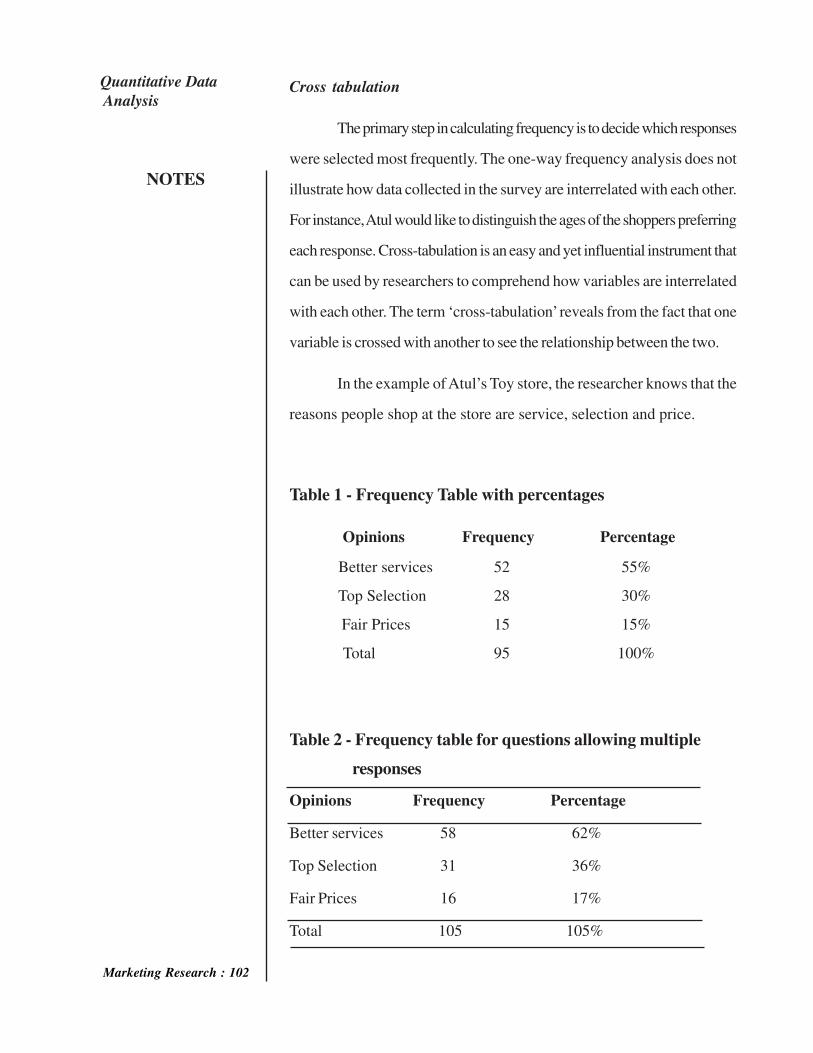
Marketing Research : 102
NOTES
Cross tabulation
The primary step in calculating frequency is to decide which responses
were selected most frequently. The one-way frequency analysis does not
illustrate how data collected in the survey are interrelated with each other.
For instance, Atul would like to distinguish the ages of the shoppers preferring
each response. Cross-tabulation is an easy and yet influential instrument that
can be used by researchers to comprehend how variables are interrelated
with each other. The term ‘cross-tabulation’ reveals from the fact that one
variable is crossed with another to see the relationship between the two.
In the example of Atul’s Toy store, the researcher knows that the
reasons people shop at the store are service, selection and price.
Table 1 - Frequency Table with percentages
Opinions Frequency Percentage
Better services 52 55%
Top Selection 28 30%
Fair Prices 15 15%
Total 95 100%
Table 2 - Frequency table for questions allowing multiple
responses
Opinions Frequency Percentage
Better services 58 62%
Top Selection 31 36%
Fair Prices 16 17%
Total 105 105%
Quantitative Data
Analysis
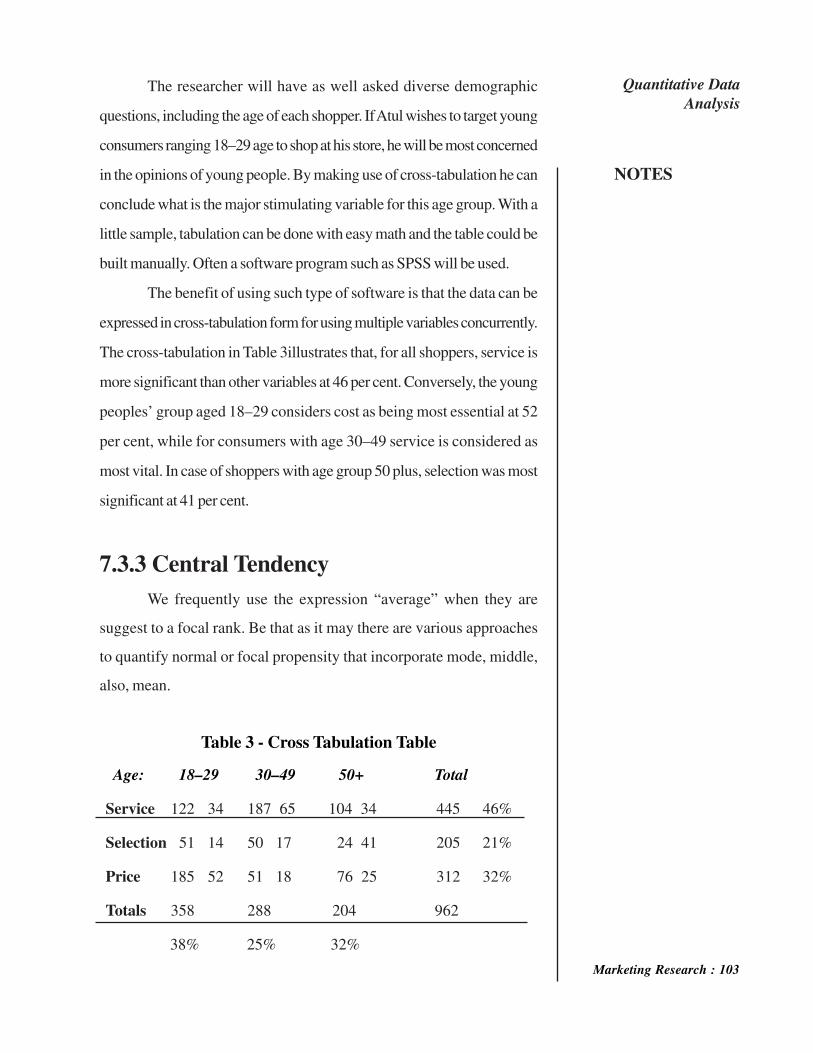
NOTES
Marketing Research : 103
The researcher will have as well asked diverse demographic
questions, including the age of each shopper. If Atul wishes to target young
consumers ranging 18–29 age to shop at his store, he will be most concerned
in the opinions of young people. By making use of cross-tabulation he can
conclude what is the major stimulating variable for this age group. With a
little sample, tabulation can be done with easy math and the table could be
built manually. Often a software program such as SPSS will be used.
The benefit of using such type of software is that the data can be
expressed in cross-tabulation form for using multiple variables concurrently.
The cross-tabulation in Table 3illustrates that, for all shoppers, service is
more significant than other variables at 46 per cent. Conversely, the young
peoples’ group aged 18–29 considers cost as being most essential at 52
per cent, while for consumers with age 30–49 service is considered as
most vital. In case of shoppers with age group 50 plus, selection was most
significant at 41 per cent.
7.3.3 Central Tendency
We frequently use the expression “average” when they are
suggest to a focal rank. Be that as it may there are various approaches
to quantify normal or focal propensity that incorporate mode, middle,
also, mean.
Table 3 - Cross Tabulation Table
Age: 18–29 30–49 50+ Total
Service 122 34 187 65 104 34 445 46%
Selection 51 14 50 17 24 41 205 21%
Price 185 52 51 18 76 25 312 32%
Totals 358 288 204 962
38% 25% 32%
Quantitative Data
Analysis
NOTES
Marketing Research : 104
7.3.4 Mode
Mode alludes to the reaction that is the most well-known for all
members. Mode is utilized when portraying ostensible information, which
can have one of either two conditions of being, however not both. In the
investigation about for Atul’s store examined over, the respondents may
have additionally been asked their gender. The question may have found
that of the 95 study members who reacted to the question on sexual
orientation, 55 were male and 40 female. Clearly gender orientation
can’t be arrived at the midpoint of, as the answer would dependably be
precisely half or 50. Rather the idea of mode (generally visit reaction) is
utilized, with the mode being male rather than female.
7.3.5 Median
Median is the reaction that measures the midpoint of the reactions.
Middle is utilized as a part of ordinal information, where there is a level
of distinction. In the question on inspiration for shopping at Atul’s, best
determination is the middle reaction as one answer got more reactions
and one answer got less reactions. Middle can’t be utilized while
dissecting ostensible information as there are just two conceivable
reactions so there can’t be a midpoint.
7.3.6 Mean
Mean is the normal of the greater part of the reactions. The mean
is computed by including every one of the reactions and afterward
partitioning by the quantity of members. On the off chance that the study
members were asked their age, it would be easy to decide mean age.
The times of the considerable number of members would be included
and after that separated by the quantity of reactions, or 95.
Central tendency measures
ü Mode: the most repeated response
Quantitative Data
Analysis
NOTES
Marketing Research : 105
ü Median: the response that split a series of responses in half
ü Mean: the average of the responses
7.3.7 Dispersion measures
One of the problems that researchers should examine is how
diverse the responses are from the calculated mean. To do so
researchers use the model of range, variance and standard deviation.
These statistical ideas let researchers to contrast the dispersions of
two sets of data. Whereas two sets of data could at first appear a like
since they contain the similar mean, researchers recognize that the
individual responses that consist of the mean may be dispersed very
differently.
The methods to examine this matter of dispersion of responses
comprise of range, variance and standard deviation. The quantity of
dispersion may depend on the way the rating or ranking question was
structured (Coelho and Esteves, 2007).
7.3.8 Range
Range is the simpler dispersion measure to recognize and tells
the researchers how extensively answers are dispersed. To calculate
range, the minimum value expressed in the survey is deducted from
the maximum value. This furnishes the range of responses. The data
below in Table give the sum of money spent on lunch by male and
female undergraduates. Both have the same mean of 11 whether the
currency is in dollars or pounds or Euros, and yet just by looking at
the figures there is obviously difference between the spending patterns
of male and female undergraduates. To calculate range, the minimum
figure is subtracted from the maximum figure. The range for the females
is 6, while the range for them ales is 16.
Quantitative Data
Analysis
Check Your Progress
What kind of problems
can result from
researchers skipping the
pre-analysis stage?
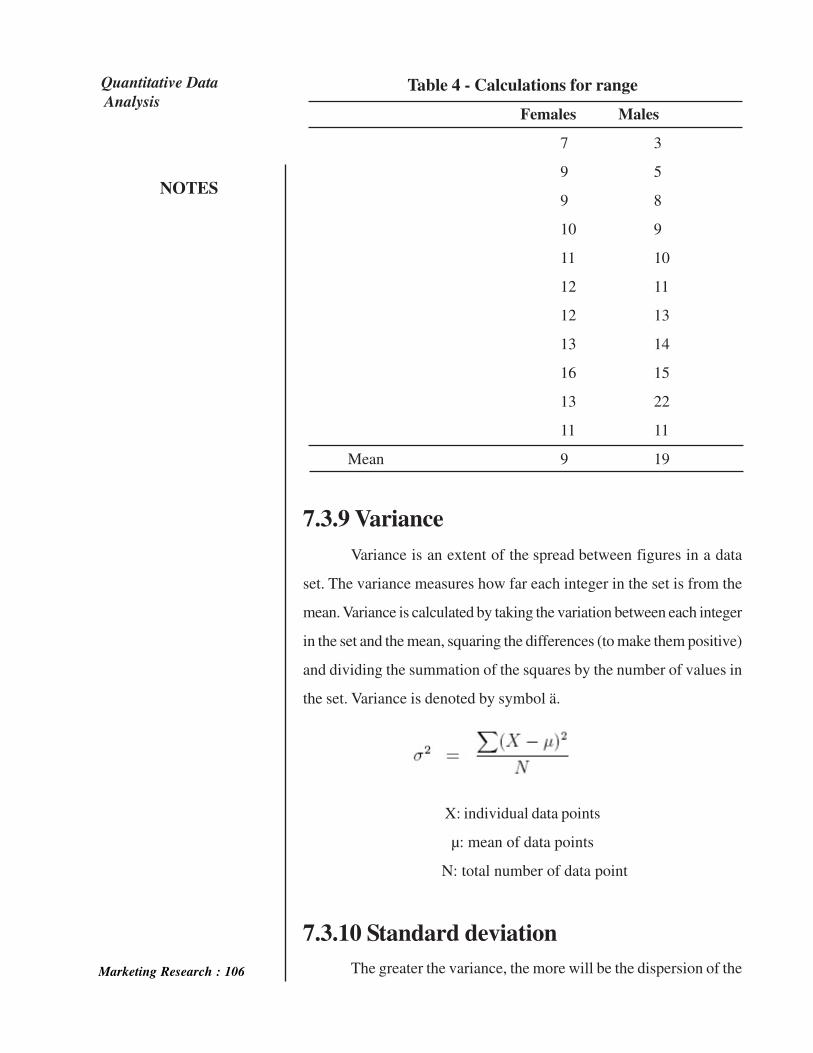
Table 4 - Calculations for range
Females Males
7 3
9 5
9 8
10 9
11 10
12 11
12 13
13 14
16 15
13 22
11 11
Mean 9 19
7.3.9 Variance
Variance is an extent of the spread between figures in a data
set. The variance measures how far each integer in the set is from the
mean. Variance is calculated by taking the variation between each integer
in the set and the mean, squaring the differences (to make them positive)
and dividing the summation of the squares by the number of values in
the set. Variance is denoted by symbol ä.
X: individual data points
µ: mean of data points
N: total number of data point
7.3.10 Standard deviation
The greater the variance, the more will be the dispersion of the
NOTES
Marketing Research : 106
Quantitative Data
Analysis

responses in the set of data. As can be observed by looking at the data,
the males’ spending pattern is more dispersed. The problem with the
variance number is that being squared; the number no longer has any
meaning. If the square root of the variance is calculated the answer will be
the standard deviation, which is in the same units, currency, as the original
numbers. If the standard deviation is summed and then deducted from the
variance, this tells researchers that this range is where the majorityof
responses will fall. The standard deviation for the females is 3.72and for
that of malesare 4.05. If the standard deviation is higher in one data set
than the other, then the responses provided by the participants in that sample
will have varied more extensively. While it is easy to observe in the small
sample of ten numbers, it would not be simple to see in a set of
950numbers.If these standard deviation numbers are then summed and
deducted from the mean, they will illustrate where most of the responses
lie. For females, this is between the price of 8.51 and 13.49.
For males, it is 5.58 and 16.42. Two sets of data can have the
same mean but still have very differentstandard deviations.
Table 5 - Calculating Variance
Females Males
7 16 3 64
9 4 5 36
9 4 8 9
10 1 9 4
11 0 10 1
11 0 11 0
12 1 13 4
12 1 14 9
13 4 15 16
16 2.5 22 21
11.0 56 11.0 264
Variance 6.22 29.33
Standard Deviation 2.49 5.42
NOTES
Marketing Research : 107
Quantitative Data
Analysis
Most females and males spend between the mean plus or minus the
standard deviation.
Females : 8.51 – 13.49, Males: 5.58 – 16.42.
7.4 Data Analysis using Inferential Statistics
The additional kind of statistical analysis that researchers can
perform make use of inferential statistics. These statistical methods go
beyond just recitation the data conquered during the research. Of
course, no marketing research study that utilizes a sample can ‘prove’
anything with complete assurance. What the analysis of quantitative
research data can do however is indicate whether a hypothesizes most
likely to be false. Using inferential statistics, researchers can carry out
statistical testator conclude if responses from a sample can be used to
depict conclusions about an entire population? In fact more than one
statistical test can be conducted on the same set of data (Parket al.,
2007).
7.4.1 Statistical testing process
The primary step in using statistical analysis to point out the
fact of a hypothesis is to affirm the hypothesis, or deduce, about some
characteristics of customers or their behavior. The research
methodology will then be planned to make sure that these
characteristics, whether about public or their behavior, are calculated.
Once the research study has been accomplished and the data fed onto
a computer program, the calculated variable for the sample of
participants will be compared with the expected results stated in the
hypothesis.
The kind of test that will be used to decide if the variation is
significant depends on both the type of dimension that was used and
the type of resultant data. These tests may be used on their own or in
NOTES
Marketing Research : 108
Quantitative Data
Analysis
combination (van Wezel and Potharst, 2007). The z-test is used to decide
if the variation in size or mean of characteristics are statistically significant
or not, while the t-test also seem for statistical significance but between the
means of two unrelated groups. The z-test is used in marketing when one
segment of consumers is being studied.
7.4.2 Hypothesis
A hypothesis is a guess or assumption that is made by the
business or persons commissioning the research. For instance, an
electronic gadget manufacturer has come up with a new mobile phone
which can take multiple pictures at a single click. The question is whether
they should spend the money to develop and launch the product?
Qualitative research has pointed out that a lot of users would be
fascinated in this product. However, the finance department of the
business has declared that at least 30 per cent of users will need to buy
the product to make it money-wise feasible. This first hypothesis is the
null hypothesis and will be declared as what the business does not
desire to be true. (The symbol H0 is used to designate the null
hypothesis.) The null hypothesis is considered true until established
false. For the manufacturer in this example the null hypothesis is that
less than 30 per cent of users will be pay attention in buying the product.
The alternative hypothesis would be that 30 per cent or more of users
will be interested in buying the product. (The alternative hypothesis is
designated H1.) One hypothesis is the contrary of the other and so both
cannot be true.
Formulae for stating the hypotheses
H0: _ = < 0.30
H1: _ = > 0.30
The statistical tests cannot be used to confirm the hypothesis
NOTES
Marketing Research : 109
Quantitative Data
Analysis
true. This is impracticable as the only way to identify with 100 per cent
accurateness if a hypothesis is true is to review the whole population. If the
null hypothesis is proven false, then the alternative hypothesis (that 30 per
cent or more of students will be interested) can be accepted as being true.
The null hypothesis needs tube articulated in such as way that its rejection
directs to the acceptance of the preferred conclusion developing the new
product. These affirmed hypotheses are an example of a one-tailed test,
the type commonly used in marketing research.
The manufacturing company surveyed a sample of 1,100 users
(greater than the sample size of 1,024 that would have been needed to
make the study viable at 95 per cent assurance) and originated that 32
per cent declared they were interested. While this is over the required
30 percent, researchers know that taking a sample will never be as
accurate as asking everyone. However, the question remains – if 32
per cent is so close then is it merely an error that made it over 30 per
cent? As a result, the subsequent step is to compute whether the
distinction between the hypothesized result and the survey result is
statistically significant. The word ‘significant’ usually is meant to be
important, but in statistics it means ‘true’. The test to find if it is
significant would be automatically calculated by a statistical computer
software program such as SPSS. However, the formula is actually
easy to comprehend. To calculate the significance all we need is three
figures: the hypothesized percentage, the sample percentage, and the
standard error of the percentage. Researchers readily have two of these,
the hypothesized and sample percentages. They are required to calculate
the standard error of the percentages.
The z-score (sometimes referred to as the p-value) can be
compared with the numbers found on a table of z-scores to decide if it
specify that the null hypothesis is not true. It is standard process to
have the computer software do the assessment. However, a rough
NOTES
Marketing Research : 110
Quantitative Data
Analysis
computation can be furnished by recalling the standard numbers for
confidence levels. For a95 per cent confidence level the number was 1.96
and for 97 per cent confidence 2.58.The z-score of 2.0 tells the researchers
that they cannot say with 95 per cent confidence that the null hypothesis is
not proved false. Therefore the business will not go ahead with production.
Fascinatingly, if the business wanted to be 97 per cent confident – the
company would not start production. The same type of calculations can be
done for comparing hypothesized mean and the mean that was found by
surveying the sample.
Steps in the analysis process
ü Formulation of the hypothesis
ü Carry out the research
ü Compare the calculated value with the hypothesized value
ü Choose the necessary level of confidence
ü Decide a statistical test for significance
ü Compute the test value
ü State a conclusion and any recommendations
7.4.3 Level of confidence
The chance that the null hypothesis will be rejected as false
when it is definitely true is called Type I Error, which is denoted by
using the lower case Greek alpha (á). The extent of possibility that a
Type I error has been committed is called the level of significance of
the statistical test. Researchers have to choose on the amount of risk
they are ready to accept of committing type I error. There are standard
levels of risk that are considered tolerable when conducting statistical
analysis. These standard levels, or value of á, are 0.01, 0.05 or 0.010.
Another way to articulate these values is that there is a 1 per cent, 5
per cent or 10 per cent chance of the hypothesis being rejected when it
is definitely true. The traditional value used by researchers is 0.05, or
there is a5 per cent risk that the null hypothesis is false, but it isn’t rejected.
NOTES
Marketing Research : 111
Quantitative Data
Analysis
Another type of error, Type II, happens when the null hypothesis is not
rejected when it is supposed to be rejected. The Greek letter beta (â) is
used for this type of error. A statistical test to verify for Type I errors is
known as one-tailed test, while a statistical test to check for Type II errors
is known as two-tailed test. Most of the researchers only use a Type I
error that is one-tailed test.
7.4.4 Chi-square tests
Chi-square is a statistical test usually used to compare observed
data with data we would expect to attain as per specific hypothesis.
For instance, if, according to Gregor Mendel’s law of inheritance,
you expected 100 of 200seedlings from a cross to be male and the real
observed number was 80 males, then you might want to know about
the “goodness to fit” between the observed and expected. Were the
deviations (differences between observed and expected) the result of
chance, or were they due to other factors. How much deviation can
take place before you, the investigator, must conclude that something
other than chance is at work, causing the observed to differ from the
expected. The chi-square test is always testing what scientists call
the null hypothesis, which states that there is no significant difference
between the expected and observed result.
The formula for calculating chi-square ( X2) is:
X2= (o-e) 2/e
Where,
e = stands for expected frequency
o = stands for observed frequency and
X = stands for chi square.
NOTES
Marketing Research : 112
Quantitative Data
Analysis
7.5 Analysis of Qualitative Data Content
Once the data have been structured, recorded and coded, the
second step in the process of analysis is to decide if there are any associations
between the conceptions and categories. The reason of developing
associations is to produce novel ideas to answer a research question. These
novel ideas will be the foundation for making suggestions for action. For
instance, one qualitative research study was used to scrutinize the cultural
effects of the country of origin of a product on British consumption manners.
Consequently, it was observed that country of source was significant for a
few groups of products (Balestrini et al., 2003).After all, administration
will desire actionable suggestions from a study, not just analysis. Testimonies
that basically portray researchers’ impressions will not be considered
valuable enough to validate the cost of the research. Probable suggestions
may involve how to target fresh form of customer segments, descriptions
of the process of consumer behaviors, a comparison and difference of
customer stimulus, or a hypothesis of a relation among variables that will
require to be verified by future quantitative research. Beneath is one example
of ethnographic research that was used to provide such recommendations.
7.5.1 Consumer segments
New market segments can be targeted by making use of Coded
qualitative research data. A business might be conscious of how to
promote their produce to their present demographic and geographic
segments, but qualitative data may disclose completely new
psychographic segments of which that business was ignorant. These
fresh segments should have been recognized based on general principles
and approach that have been verbalized or exhibited through the
qualitative research process. For illustration, a research group on a
NOTES
Marketing Research : 113
Quantitative Data
Analysis
produce for elder consumers may have found that people aged 65–75
years old do not believe themselves as being elder. Since they are still
living a active life, this categorization based on age may have no sense for
them. In spite, they might recognize themselves as ‘active adults’ who just
happen to be retired or on their next job. They might as well believe that
they have no approach in ordinary with people in the conventional group
called ‘senior citizens’. Similarly, qualitative research data may discover
groups of individuals who recognize themselves based on their various
types of hobbies. What they would all have in familiar is a precise interest,
say in crafts, and will therefore classify themselves by this, for example as
‘crafters’. As a outcome, researchers might advise that a business
commissioning research on this topic considers producing products intended
to this new segment. Qualitative research might also reveal new usage
categories. In discussions of food utilization, it may be found that food
usually consumed at breakfast is as well enjoyed at other times of the day.
Based on a discovery that cereal is also eaten at the office, researchers
may suggest a new promotional campaign based on this usage.
7.5.2 Consumer behavior processes
A part from new market segments, qualitative research can
offer insights into customer behavior practices. A business that
formulates readymade dinner entrées may be interested in the food
preparation processes of today’s hectic dual career families.
Investigations of ethnographic data may disclose that parents would
like to have everyone at dining table for meals together, but that kids
would have their personal food preferences. Using this information,
researchers might suggest that a business produces prepackaged dinners
with a option of side dishes so that everybody can have food jointly
and yet still have the foodstuff they each desire. If it is found that
NOTES
Marketing Research : 114
Quantitative Data
Analysis
parents still wish to have their families uphold a modest custom when dining,
researchers may then suggest that the wrapping includes decorative paper
napkins. An observational study on how people ride their cars may find
that drivers need mug holders which can carry their beverages hot or cold
when they spend lengthy times in the car. Additionally, observing kids
traveling in their cars may have discovered a requirement of a small storage
space for their foodstuff. These are thoughts that may not or else have
been revealed in quantitative survey research. However, analyzing the
data from qualitative research can disclose helpful thoughts such as these
that can be suggested to businesses.
7.5.3 Comparing and contrasting consumer
qualities
While carrying out the research the researchers may note some
variations in the customer behavior process depending upon their
demographic or psychographic qualities. For instance, a qualitative
research study may have been specially intended to observe and
evaluate the variations in cell phone usage for different age groups.
These types of variations will appear in qualitative data from focus
groups, interviews or ethnographic studies. In this case researcher’s
may possibly discover that women were using the picture featured
mobile phone to take pictures while purchasing of possible purchases
for their home that they can then observe later. Where as, it was found
that males were using their mobile phone cameras to take candid
pictures of their friends. These are thoughts that can be converted
into recommendations.
7.5.4 Development of hypotheses
Additional recommendations that might outcome from an
analysis of qualitative data are hypotheses about the association among
NOTES
Marketing Research : 115
Quantitative Data
Analysis
two variables. These hypotheses cannot be supposed to be proven, based
on the qualitative research. Yet, it may be so stimulating that the researchers
recommend quantitative research is carried out to decide the soundness
of these hypotheses. For instance, qualitative research may discover that
the consumers who are nonusers of a produce trust that the produce is
too costly to manage. This fact might then be tested further with survey
research.
7.6 Analysis of ethnographic and observa-
tional research data
The information offered by ethnographic and observational
research will not be in a unwritten format. Alternatively, the data will
be in the type of notes on behavior, photos or video. Observation
forms and comments should also be analyzed, but not by coding for
words. Instead researchers will be looking for sole or recurring
behavior that has been noted on the forms or in the photos or videos.
Researchers can come across these data pertaining to the process of
using a produce, novel habits of using a produce, where consumers
use a produce and the mistakes they make when using produce – all
of which may have been noted on the forms (Gummesson, 2007).
For instance, observational research of consumers shopping
at a garment stores can show how they move through the store, which
products they tend to purchase at the earliest, and how much time
they spending the store. If researchers observe that people appear to
have a difficulty in finding the fitting rooms, improved signs may be
recommended. In addition, if it becomes noticeable that certain clothing
racks are not being visited, it may be recommended that the store
layout to be changed. All of this records can then be used by
management to make the store extra user friendly. Often ethnographic
NOTES
Marketing Research : 116
Quantitative Data
Analysis
research may disclose that people use a product in a way that was not
originally proposed by the company that designed that product. These
insights can be used to make suggestions on the redesigning of a product
or the development of a entirely new product. For instance, an ethnographic
study may have been carried out on students living together in university-
owned accommodation. An analysis of videos taken during the study may
have found that students prefer to study while lying on their beds. This
study, would recommend that better lighting to be provided above beds.
After all, good research should result in increased profits.
7.7 Summary
The distinction between analyzing qualitative and quantitative
data include the fact that the analysis of quantitative data results in
statistics that portray human behavior. However, qualitative data are
analyzed for insights into the impetus for human behavior. Quantitative
data are analyzed at the end of research while qualitative data are
analyzed while research is being conducted. The analysis of qualitative
data is an art that depends up on the comprehension and ability of
researchers. The analysis must only be carried out by researchers as
they on their own will have experienced the incidents that took place
during the research. In order to these incidents are not lost, researchers
should hold debriefing meetings as soon as the research study has been
accomplished and even during the research progression. While
qualitative analysis is an art, there is still a procedure to be followed.
Initially the data must be organized and any vocal information should
be written down. The data are then reviewed and coded for concepts
and categories. Lastly, the correlation between concepts and categories
is questioned and the findings are deduced into recommendations for
action. Data are arranged based on the methodology and comments
are then transcribed. This transcription can be accurate or in note form.
The transcription should be in a format that allows researchers to effortlessly
NOTES
Marketing Research : 117
Quantitative Data
Analysis
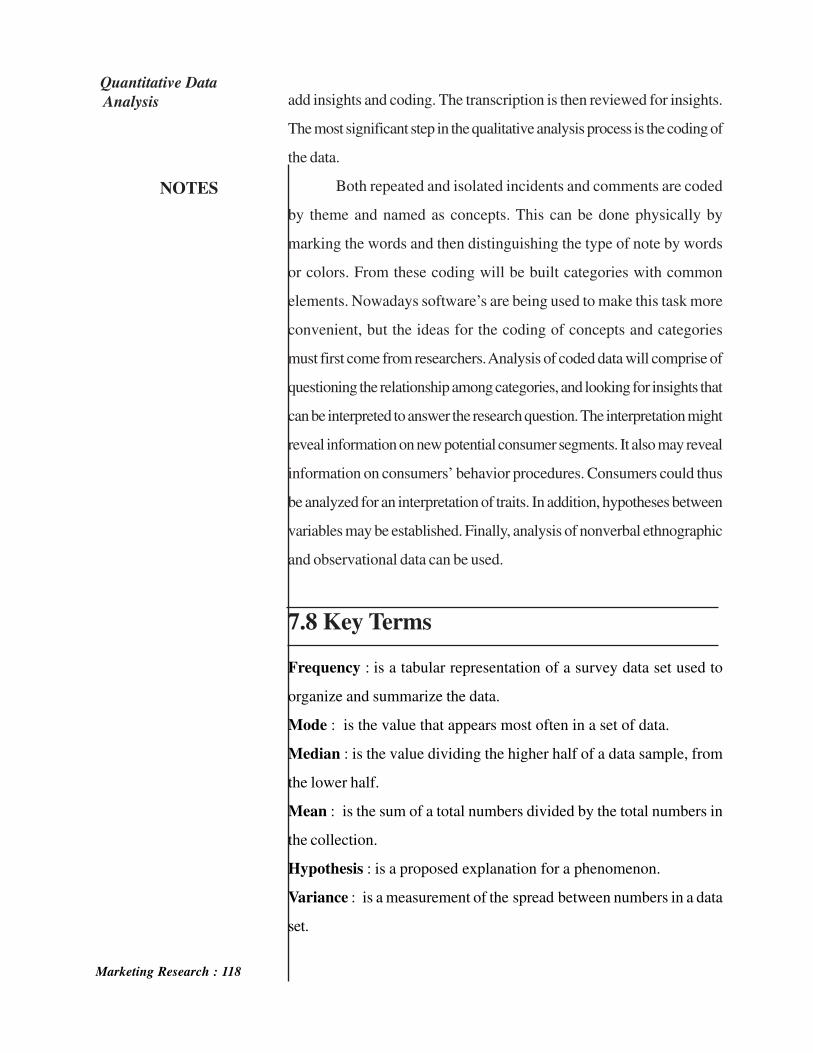
add insights and coding. The transcription is then reviewed for insights.
The most significant step in the qualitative analysis process is the coding of
the data.
Both repeated and isolated incidents and comments are coded
by theme and named as concepts. This can be done physically by
marking the words and then distinguishing the type of note by words
or colors. From these coding will be built categories with common
elements. Nowadays software’s are being used to make this task more
convenient, but the ideas for the coding of concepts and categories
must first come from researchers. Analysis of coded data will comprise of
questioning the relationship among categories, and looking for insights that
can be interpreted to answer the research question. The interpretation might
reveal information on new potential consumer segments. It also may reveal
information on consumers’ behavior procedures. Consumers could thus
be analyzed for an interpretation of traits. In addition, hypotheses between
variables may be established. Finally, analysis of nonverbal ethnographic
and observational data can be used.
7.8 Key Terms
Frequency : is a tabular representation of a survey data set used to
organize and summarize the data.
Mode : is the value that appears most often in a set of data.
Median : is the value dividing the higher half of a data sample, from
the lower half.
Mean : is the sum of a total numbers divided by the total numbers in
the collection.
Hypothesis : is a proposed explanation for a phenomenon.
Variance : is a measurement of the spread between numbers in a data
set.
NOTES
Marketing Research : 118
Quantitative Data
Analysis
7.9 Review Questions
1. Explain the process of Quantitative Data analysis in short?
2. What is a meant by coding of data and how it is carried out?
3. Enlist various computer software programs used for data analysis?
4. What type of errors can be found when survey forms are reviewed
before data entry?
5. What kind of problems can result from researchers skipping the
pre-analysis stage?
6. What is frequency in statistical means?
7. What do you understand about mode, mean, median?
8. Explain central tendency?
9. Explain hypothesis and its types?
10. Describe Chi Square Test?
11. What does level of confidence let us know explain in short?
12. Explain in detail about qualitative data analysis?
13. What is ethnographic and observational research; explain the
process of analysis used in such research types?
Check your progress:
1. ................................ of the data is a necessary function of any
statistical analysis.
2. Different sets of data can be compared by comparing their
................................
3. .............................. is defined as the sum of observations divided
by the number of observations.
4. ................................ is used when the magnitude of individual
observations is large.
5. Median and mode are also known as the ................................
averages.
6. In a grouped frequency distribution, there are classes along
with their respective ...............................
NOTES
Marketing Research : 119
Quantitative Data
Analysis
7. ................................ check of accuracy is used when the arithmetic
mean of a frequency distribution is calculated by shortcut or step-
deviation method.
8. Median of distribution is that value of the variate which divides it
into ................................ parts.
9. The total area under a histogram is equal to total ................................
10. ................................ divide a distribution into 10 equal parts.
11. A distribution may have only ................................ quartiles.
12. Mode is that value of the variate which occurs ...........................
number of times in a distribution.
13. It is ................................ around which other items are most densely
distributed.
14. ................................ is the spread of the data in a distribution.
15. ................................ is a measure of the average squared distance
between the mean and each term in the population.
Answers:
1. Summarisation 2. Averages 3. Arithmetic Mean 4. Shortcut Method
5. Positional 6. Frequencies 7. Charlier’s 8. Two equal 9. Frequency
10. Deciles 11. 3 12. Maximum 13. Mode 14. Dispersion 15. Variance
7.10 Further Readings and References
• Abrams, M.A., Social Surveys and Social Action, London:
Heinemann, 1951.
• Arthur, Maurice, Philosophy of Scientific Investigation,
Baltimore: John Hopkins University Press, 1943.
• Bernal, J.D., The Social Function of Science, London: George
Routledge and Sons, 1939.
• Chase, Stuart, The Proper Study of Mankind: An inquiry into
the Science of Human Relations, New York, Harper and Row
NOTES
Marketing Research : 120
Quantitative Data
Analysis
Publishers, 1958.
• Malhotra, Naresh K. Marketing research: An applied orientation,
5/e. Pearson Education India, 2008.
• S. N. Murthy and U. Bhojanna, Business Research Methods,
Excel Books.
• Levine, David M. and Stephan, David F. (2005) Even You Can
Learn Statistics: A Guide For EveryoneWho Has Ever Been
Afraid of Statistics. Upper Saddle River, NJ: Pearson Prentice
Hall. Startswith an explanation of key statistical terms and then
describes the types of statistics, analysis,testing and presentation
of statistical findings.
• Stevens, Robert E. (2006) Concise Encyclopedia of Church
and Religious Organization Marketing.
••••• Bonita Kolb (2008) Marketing Research: A Practical Approach.
• Foster, Jeremy, Barkus, Emma and Yavorsky, Christian (2006)
Understanding Advanced Statistics.
• Good, Phillip I. and Hardin, James W. (2006) Common Errors
in Statistics (And How to Avoid Them). Chichester: Wiley. A
more advanced treatment of statistics, with an emphasis on
the mathematics behind statistical theories.
• Kault, David (2003) Statistics with Common Sense. Westport,
CT: Greenwood. Introduces statisticalconcepts through their
application in real life without overly emphasizing the theory
behindthe statistics.
• Lee, Eun Sul and FoCheck Your Progressrthofer, Ron N. (2006)
Analyzing Complex Survey Data. London: SAGE. Athorough
approach to the many issues involved in analyzing qualitative
data, including varianceestimation, data requirements and
preliminary analysis.
• Levine, David M. and Stephan, David F. (2005) Even You Can
Learn Statistics: A Guide For EveryoneWho Has Ever Been
NOTES
Marketing Research : 121
Quantitative Data
Analysis
Afraid of Statistics. Upper Saddle River, NJ: Pearson Prentice Hall.
Startswith an explanation of key statistical terms and then describes
the types of statistics, analysis,testing and presentation of statistical
findings.
• Stevens, Robert E. (2006) Concise Encyclopedia of Church
and Religious Organization Marketing.
• Binghamton, NY: Best Business Books. This book is a good
reminder that marketing is now usedby religious organizations.
Chapters on survey research and analysis are included.
• Lyness and Kropf, (2007) The Handbook of Social Work
Research Methods.
• Coelho and Esteves, (2007) Customer Satisfaction: The
Customer Experience through the Customer’s Eyes.
• Van Wezel and Potharst, (2007) Trends and Innovations in
Marketing Information Systems.
• Balestrini et al., (2003) Fungi in the Environment.
• Gummesson, (2007)The SAGE Handbook of Marketing
Theory.
NOTES
Marketing Research : 122
Quantitative Data
Analysis
UNIT 8: REPORT WRITING
NOTES
Marketing Research : 123
8.0 Unit Objectives
8.1 Introduction
8.2 Characteristics of Research Report
8.2.1 Substantive Characteristics
8.2.2 Semantic Characteristics
8.3 Significance of Report Writing
8.4 Techniques and Precautions of Interpretation
8.4.1 Basic Analysis of “Quantitative” Information
8.4.2 Basic Analysis of “Qualitative” Information
8.4.3 Interpreting Information
8.4.4 Precautions
8.5 Types of Report
8.5.1 Oral Report
8.5.2 Written Report
8.6 Preparation of Research Report
8.6.1 How to Write a Bibliography?
8.7 Style, Layout and Precautions of the Report writing
8.7.1 Style of Report Writing
8.7.2 Layout of the Report
8.7.3 Precautions in Report Writing
8.8 Summary
8.9 Key Terms
8.10 Review Questions
8.11 Further Readings
Report Writing
NOTES
Marketing Research : 124
8.0 Unit Objectives
After studying this unit, you will be able to:
• Explain the meaning and characteristics of research report
• Recognize the significance of report writing
• Describe the techniques and precaution of interpretation
• Discuss the layout of report
• Categorize different types of report
8.1 Introduction
A report is a very formal document that is written for a variety
of purposes, generally in the sciences, social sciences, engineering and
business disciplines. Generally, findings pertaining to a given or specific
task are written up into a report. It should be noted that reports are
considered to be legal documents in the workplace and, thus, they need
to be precise, accurate and difficult to misinterpret.
There are three features that, together, characterize report
writing at a very basic level: a predefined structure, independent sections,
and reaching unbiased conclusions.
• Predefined structure: Broadly, these headings may indicate
sections within a report, suchas an introduction, discussion, and
conclusion.
• Independent sections: Each section in a report is typically
written as a stand-alone piece, sothe reader can selectively
identify the report sections they are interested in, rather
thanreading the whole report through in one go from start to
finish.
• Unbiased conclusions: A third element of report writing is that
it is an unbiased and objective form of writing.
Report Writing
Check Your Progress
What is a research report?
Marketing Research : 125
NOTES
8.2 Characteristics of Research Report
Characteristics feature is an integral part of the report. There is
no hard and fast rule for preparing a research report. The research
report will differ based on the need of the particular managers using the
report. The report also depends on the philosophy of the researcher.
Example: A report prepared for a government agency will be different
from the one preparedfor a private organization. In spite of the fact
that, marketing report is influenced by the researcher, there are certain
characteristics which the report should possess, if it is to be effectively
communicated. These characteristics can be classified as:
A. Substantive characteristics
B. Semantic characteristics.
8.2.1 Substantive Characteristics
Substantive characteristics are:
• Accuracy
• Currency
• Sufficiency
• Availability
• Relevancy
The more that the report possesses the above characteristics,
the greater is its practical value in decision making.
Accuracy: Accuracy refers to the degree to which information
reflects reality. Specifically, research report must accurately
present both research procedure and research results. Even if
the researchresults are not as per the expectation of the
management, the researcher has the professional
Currency: Currency refers to the time span between completion
of the research project and presentation of the research report
Report Writing
NOTES
Marketing Research : 126
to management. If the management receives the research report
too late, the results are no longer valid due to environmental
changes, and then the report will have no or little value for decision
making. Currency is one of the reasons for orally orinformally
communicating preliminary research results to management to
ensure timely decisionmaking.
Sufficiency: The research report must have sufficient details, so
that important and valid decision can be made. Sometimes the
sample size, sample representativeness may act as a constraint for
sufficient details not being available.
Example: Data required by the management, say segment wise
market, whereas overall market data is available.
Availability: The fourth important characteristic of research report
is that, it is available to the appropriate decision maker when they
need it. Availability refers to the communication process between
researcher and the decision maker. We use the word ‘appropriate
decision maker’ to emphasize the fact “who should or who should
not have access to the report”. This decision is made by the
management, and it is the duty of the researcher to carry out this
decision. Most reports carry confidential information. Therefore,
it is necessary to restrict the report availability, to individuals as
well as outside of an organization to prevent the competitor from
having access to it.
Relevancy: The research report should be confined to the decision
issue researched. Sometimes the researcher might include some
information, which he thinks is interesting, but may not have any
relevance. This type of information should be excluded from the
report. Example: A researcher may be preparing a report on the
audience perception of RJs (Radio Jockeys). This may be done
with a view to recruit them based on the perception. In this context,
a lengthy commentary on relative audience appeal of each radio
station is included. This type of data may be readily available from
Report Writing
NOTES
Marketing Research : 127
some research agency, who is selling commercial data. Therefore,
including this type of aspect may not be necessary.
8.2.2 Semantic Characteristics
Semantic characteristics are equally important in report. The
report should be grammatically correct. It should be free from spelling
and typing errors. This will ensure that there is no ambiguity or
misunderstanding. Assistance of a proof reader, other than the researcher
would be required to eliminate the above errors.
1. Creative expressions in the form of superlatives, similes should
be avoided. Notes
2. The report should be concise.
3. Jargon of any kind should be avoided.
4. Common words with multiple meaning should be avoided. v.
Language of the report must be simple. For example, sentences
like “illumination must be
5. extinguished when premises are not in use” can be expressed in
simple words say “switch
6. off the lights when you leave”.
7. Avoid using ‘I’ ‘we’. The report should be more impersonal.
8. Sometimes, the current research uses the data of research
conducted in the past. In this case it is better to use past tense
than present tense.
The following are the hindrances for clarity of any research report.
• Ambiguity
• Jargon
• Misspelled words
• Excessive prediction
• Improper punctuation
Report Writing
NOTES
Marketing Research : 128
• Unfamiliar words
• Clerical error
Some of the illustrations that can cause inaccuracy in report
writing are given below :
ü• Addition/subtraction error: Assume that a survey was
conducted to ascertain the incomeof various strata of
population in a city. Suppose, it is found that 15% belong to
super rich,18% belong to rich class, 61% belong to middle
class.By oversight the total is recorded as (15+61+18) which
is not equal to hundred. This errorcan be corrected easily by
the researcher. This type of error leads to confusion because
thereader or decision maker does not know which categories
are left out (may be lowermiddle class and lower class).
• Confusion between percentage and percentage points:
Suppose the report indicates thatraw material cost of a product
as a percentage of total cost increased from 8 percentagepoints
in 2003 to 10 percentage points in 2009. Therefore, the raw
material cost has increasedby only 2 percentage points in 6
years. The real increase is 2 percentage points or25 percent.
• Wrong conclusion: Mr. X annual income has increased from
20,000 to 40,000 in 8 years.Therefore, the conclusion is, since
income has doubled, the purchasing power also hasdoubled.
This may not be true because due to inflation in 8 years,
purchasing power mightcome down or money value could
get eroded.
8.3 Significance of Report Writing
Preparation and presentation of a research report is the most
important part of the research process. No matter how brilliant the
Report Writing
NOTES
Marketing Research : 129
hypothesis and how well designed is the research study, they are of little
value unless communicated effectively to others in the form of a research
report. Moreover, if the report is confusing or poorly written, the time
and effort spent on gathering and analysing data would be wasted. It is
therefore, essential to summarise and communicate the result to the
management in the form of an understandable and logical research report.
Research report is regarded as a major component of the research study
for the research task remains unfinished till the report has been presented
and/or written. As a matter of fact even the most brilliant hypothesis,
very well designed and conducted research study, and the most striking
generalizations and findings are of modest value unless they are effectively
communicated to others. The rationale of research is not well served
unless the findings are made known to others. Research results must
customarily enter the general store of knowledge. All this explains the
importance of writing research report. There are people who do not
consider writing of report as an essential part of the research process.
But the general opinion is in favour of treating the presentation of research
results or the writing of report as division and parcel of the research
project. Writing of report is the final step in a research study and requires
a set of skills somewhat different from those called for in respect of the
former stages of research. This task should be accomplished by the
researcher with extreme care; he may seek the assistance and guidance
of experts for the reason.
8.4 Techniques and Precautions of Inter-
pretation
Interpretation means bringing out the meaning of data. We can
also say that interpretation is to convert data into information. The essence
of any research is to do interpretation about the study. This requires a
high degree of skill. There are two methods of drawing conclusions (i)
induction (ii) deduction. In the induction method, one starts from
Report Writing
Marketing Research : 130
NOTES
observed data and then generalisation is done which explains the
relationship between objects observed. On the other hand, deductive
reasoning starts from some general law and is then applied to a particular
instance i.e., deduction comes from the general to a particular situation.
Example of Induction: All products manufactured by Sony are excellent.
DVD player model 2602 MX is made by Sony. Therefore, it must be
excellent.
Example of Deduction: All products have to reach decline stage one
day and become obsolete. This Notes radio is in decline mode. Therefore,
it will become obsolete.
During the inductive phase, we reason from observation. During
the deductive phase, we reason towards the observation. Successful
interpretation depends on how well the data is analysed. If data is not
properly analysed, the interpretation may go wrong. If analysis has to be
corrected, then data collection must be proper. Similarly, if the data
collected is proper but analysed wrongly, then too the interpretation or
conclusion will be wrong. Sometimes, even with the proper data and
proper analysis, the data can still lead to wrong interpretation.
Interpretation depends upon the experience of the researcher and methods
used by him for interpretation.
8.4.1 Basic Analysis of “Quantitative”
Information
(for information other than commentary, e.g., ratings, rankings,
yes’s, no’s, etc.) ? Make copies of your data and store the master copy
away. Use the copy for making edits, cutting and pasting, etc.
ü Tabulate the information, i.e., add up the number of ratings,
rankings, yes’s, no’s for eachquestion.
Report Writing
NOTES
Marketing Research : 131
ü For ratings and rankings, consider computing a mean, or
average, for each question. Forexample, “For question #1, the
average ranking was 2.4”. This is more meaningful
thanindicating, e.g., how many respondents ranked 1, 2, or 3.
ü Consider conveying the range of answers, e.g., 20 people ranked
“1”, 30 ranked “2”, and 20people ranked “3”.
8.4.2 Basic Analysis of “Qualitative”
Information
(respondents’ verbal answers in interviews, focus groups, or written
commentary on questionnaires):
ü Read through all the data.
ü Organize comments into similar categories, e.g., concerns,
suggestions, strengths,
ü weaknesses, similar experiences, program inputs,
recommendations, outputs, outcome
ü indicators, etc.
ü Label the categories or themes, e.g., concerns, suggestions, etc.
ü Attempt to identify patterns, or associations and causal
relationships in the themes, e.g. all people who attended
programs in the evening had similar concerns, most people
camefrom the same geographic area, most people were in the
same salary range, what processesor events respondents
experience during the program, etc.
ü Keep all commentary for several years after completion in case
needed for future reference.
8.4.3 Interpreting Information
ü Attempt to put the information in perspective, e.g., compare
results to what you expected,promised results; management or
Report Writing
NOTES
Marketing Research : 132
program staff; any common standards for your productsor
services; original goals (especially if you’re conducting a
program evaluation);indications or measures of accomplishing
outcomes or results (especially if you’reconducting an outcomes
or performance evaluation); description of the
program’sexperiences, strengths, weaknesses, etc. (especially
if you’re conducting a processevaluation).
ü Consider recommendations to help employees improve the
program, product or service;conclusions about program
operations or meeting goals, etc.
ü Record conclusions and recommendations in a report, and
associate interpretations tojustify your conclusions or
recommendations.
8.4.4 Precautions
1. Keep the main objective of research in mind.
2. Analysis of data should start from simpler and more fundamental
aspects.
3. It should not be confusing.
4. The sample size should be adequate.
5. Take care before generalising of the sample studied.
6. Give due attention to significant questions.
Caution: In report writing, do not miss the significance of some answers,
because they are found from very few respondents, such as “don’t know”
or “can’t say”.
8.5 Types of Report Notes
8.5.1 Oral Report
This type of reporting is required, when the researchers are
asked to make an oral presentation. Making an oral presentation is
Report Writing
Check Your Progress
Why are visual aids used
in oral presentation?
NOTES
Marketing Research : 133
somewhat difficult compared to the written report. This is because
the reporter has to interact directly with the audience. Any faltering
during an oral presentation can leave a negative impression on the
audience. This may also lower the self-confidence of the presenter. In
an oral presentation, communication plays a big role. A lot of planning
and thinking is required to decide ‘What to say’, ‘How to say’, ‘How
much to say’. Also, the presenter may have to face a barrage of
questions from the audience. A lot of preparation is required; the broad
classification of an oral presentation is as follows.
Nature of an Oral Presentation
Opening: A brief statement can be made on the nature of
discussion that will follow. The opening statement should
explain the nature of the project, how it came about and what
was attempted.
Finding/Conclusion: Each conclusion may be stated backed
up by findings.
Recommendation: Each recommendation must have the
support of conclusion. At the end of the presentation, question-
answer session should follow from the audience.
Method of presentation: Visuals, if need to be exhibited, can
be made use of. The use of tabular form for statistical
information would help the audience.
What type of presentation is a root question? Is it read from a
manuscript or memorized or delivered ex-tempo. Memorization is
not recommended, since there could be a slip during presentation.
Secondly, it produces speaker-centric approach. Even reading from
the manuscript is not recommended, because it becomes monotonous,
dull and lifeless. The best way to deliver in ex-tempo, is to make main
points notes, so that the same can be expanded. Logical sequences
should be followed.
Report Writing
8.5.2 Written Report
Following are the Various Types of Written Reports:
(A) Reports can be classified based on the time-interval such as:
1. Daily
2. Weekly
3. Monthly
4. Quarterly
5. Yearly
(B) Type of reports:
1. Short report
2. Long report
3. Formal report
4. Informal report
5. Government report
1. Short report: Short reports are produced when the problem is
very well defined and if the scope is limited. For example,
Monthly sales report. It will run into about five pages. It consists
of report about the progress made with respect to a particular
product in a clearly specified geographical locations.
2. Long report: This could be both a technical report as well as
non-technical report. This will present the outcome of the
research in detail.
(a) Technical report: This will include the sources of data,
research procedure, sample design, tools used for gathering
data, data analysis methods used, appendix, conclusion and
detailed recommendations with respect to specific findings.
If any journal, paper or periodical is referred, such references
must be given for the benefit of reader.
(b) Non-technical report: This report is meant for those who
NOTES
Report Writing
Marketing Research : 134
are not technically qualified. E.g. Chief of the finance
department. He may be interested in financial implications
only, such as margins, volumes, etc. He may not be
interested in the methodology.
3. Formal report: Example: The report prepared by the marketing
manager to be submitted to the VicePresident(marketing) on
quarterly performance, reports on test marketing.
4. Informal report: The report prepared by the supervisor by
way of filling the shift log book, to be used by his colleagues.
5. Government report: These may be prepared by state
governments or the central government on a given issue.
8.6 Preparation of Research Report
Having decided on the type of report, the next step is report
preparation. The following is the format of a research report:
1. Title Page
2. Page Contents
3. Executive Summary
4. Body
5. Conclusions and Recommendations
6. Bibliography
7. Appendix
1. Title Page: Title Page should indicate the topic on which the report
is prepared. It should include the name of the person or agency who
has prepared the report.
2. Table of Contents: The table of contents will help the reader to
know “what the report contains”. The table of contents should indicate
the various parts or sections of the report. It should also indicate the
chapter headings along with the page number.
NOTES
Report Writing
Marketing Research : 135
3. Executive Summary: If your report is long and drawn out, the
person to whom you have prepared the report may not have the time
to read it in detail. Apart from this, an executive summary will help in
highlighting major points. It is a condensed version of the whole report.
It should be written in one or two pages. An executive summary should
have,
a) Objectives
b) Brief methodology
c) Important findings
d) Key results
e) Conclusion
4. The Body: This section includes:
a) Introduction
b) Methodology
c) Limitations
d) Analysis and interpretations
Introduction: The introduction must explain clearly the decision
problem and research objective. The background information
should be provided on the product and services provided by
the organisation which is under study.
Methodology: How you have collected the data is the key in
this section. For example, Was primary data collected or
secondary data used? Was a questionnaire used? What was the
sample size and sampling plan and method of analysis? Was
the design exploratory or conclusive?
Limitations: Every report will have some shortcoming. The
limitations may be of time, geographical area, the methodology
adopted, correctness of the responses, etc.
5. Conclusion and Recommendation:
a) What was the conclusion drawn from the study?
b) Based on the study, what recommendation do you make?
NOTES
Report Writing
Marketing Research : 136
6. Bibliography: If portions of your report are based on secondary
data, use a bibliography section to list the publications or sources that
you have consulted. The bibliography should include, title of the book,
name of the journal in case of article, volume number, page number,
edition, etc.
7. Appendix: The purpose of an appendix is to provide a place for
material which is not absolutely essential to the body of the report. The
appendix will contain copies of data collection forms called
questionnaires, details of the annual report of the company, details of
graphs/charts, photographs, CDs, interviewers’ instructions. Following
are the items to be placed in this section.
a) Data collection forms
b) Project related paper cuttings
c) Pictures and diagrams related to project
d) Any other relevant things.
8.6.1 How to Write a Bibliography?
Bibliography, the last section of the report comes after
appendices. Appendices contains questionnaires and other relevant
material of the study. The bibliography contains the source of every
reference used and any other relevant work that has been consulted. It
imparts an authenticity regarding the source of data to the reader.
Bibliography are of different types viz., bibliography of works cited;
this contains only the items referred in the text. A selected bibliography
lists the items which the author thinks are of primary interest to the
reader. An annotated bibliography gives brief description of each item.
The method of representing bibliography is explained below.
Books :
Name of the author, title of the book (underlined), publisher’s detail,
year of publishing, page number.
NOTES
Report Writing
Marketing Research : 137
Single Volume Works. Dube, S. C. “India’s Changing Villages”,
Routledge and Kegan Paul Ltd.,1958, p. 76.
8.7 Style, Layout and Precautions of the
Report writing
8.7.1 Style of Report Writing
Remember that the reader:
• Has short of time,
• Has many other urgent matters demanding his or her interest
and attention,
• Is probably not knowledgeable concerning ‘research jargon’.
Therefore, the rules are:
• Simplify. Keep to the essentials.
• Justify. Make no statement that is not based on facts and data.
• Quantify when you have the data to do so. Avoid large, small,
instead, say 50%, one inthree.
• Be precise and specific in your phrasing of findings.
• Inform, not impress. Avoid exaggeration.
• Use short sentences.
8.7.2 Layout of the Report
A good physical layout is important, as it will help your report:
a) Make a good initial impression,
b) Encourage the readers, and
c) Give them an idea of how the material has been organised so
the reader can make a quick determination of what he will
read first.
Particular attention should be paid to make sure there is:
a) An attractive layout for the title page and a clear table of
contents.
NOTES
Report Writing
Marketing Research : 138
b) Consistency in margins and spacing.
c) Consistency in headings and subheadings, for example, font
size 16 or 18 bold, for headingsof chapters; size 14 bold for
headings of major sections; size 12 bold, for headings of
subsections,etc.
d) Good quality printing and photocopying. Correct drafts
carefully with spell check as wellas critical reading for clarity
by other team-members, your facilitator and, if possible,
outsiders.
e) Numbering of figures and tables, provision of clear titles for
tables, and clear headings for columns and rows, etc.
f) Accuracy and consistency in quotations and references.
8.7.3 Precautions in Report Writing
Endless description without interpretation is another pitfall.
Tables need conclusions, not detailed presentation of all numbers or
percentages in the cells which readers can see for themselves.
Neglect of qualitative data is also quite common. Still, quotes
of informants as illustration of your findings and conclusions make
your report lively. They also have scientific value in allowing the reader
to draw his/her own conclusions from the data you present. (Assuming
you are not biased in your presentation!) Sometimes qualitative data
(e.g., open opinion questions) are just coded and counted like
quantitative data, without interpretation, whereas they may be providing
interesting.
The following must be avoided while preparing a report:
• The inclusion of careless, inaccurate, or conflicting data.
• The inclusion of outdated or irrelevant data.
• Facts and opinions that are not separated.
• Unsupported conclusions and recommendations.
NOTES
Report Writing
Marketing Research : 139
• Careless presentation and proofreading.
• Too much emphasis on appearance and not enough on content.
8.8 Summary
• A report is a very formal document that is written for a variety
of purposes, generally inthe sciences, social sciences,
engineering and business disciplines.
• The most important aspect to be kept in mind while developing
research report, is the communication with the audience.
• Report should be able to draw the interest of the readers.
Therefore, report should be centric. Other aspect to be
considered while writing report are accuracy and clarity.
• The presenter must make sure that presentation is completed
within the time allotted.
• Written report may be classified based on whether the report is
a short report or a long report. It can also be classified based
on technical report or non-technical report.
• Written report should contain title page, contents, executive
summary. Body, conclusionsand appendix. The last part is
bibliography.
• The style of the report should be simple and to the essentials.
• There should not be endless description in report writing and
qualitative data is not to beexcluded.
8.9 Key Terms
Appendix: The part of the report whose purpose is to provide a place
for material which is not absolutely essential to the body of the report.
Bibliography: The section to list the publications or sources that you
have consulted in Notespreparation of report
Executive Summary: It is a condensed version of the whole report.
NOTES
Report Writing
Marketing Research : 140
Informal Report: The report prepared by the supervisor by way of
filling the shift log book, to be used by his colleagues
Short Report: Short reports are the reports that are produced when
the problem is very well defined and if the scope is limited.
8.10 Review Questions
1. What is a research report?
2. What are the characteristics of report?
3. What is the criterion for an oral report? Explain.
4. What is meant by “consider the audience” when writing a
research report.
5. On what criteria, oral report is evaluated? Suggest a suitable
format.
6. Why are visual aids used in oral presentation?
7. What are the various criteria used for classification of written
report?
8. What are the essential content of the following parts of research
report?
(a) Table of contents
(b) Title page
(c) Executive summary
(d) Introduction
(e) Conclusion
(f) Appendix
9 Oral presentation requires the researcher to be good public
speaker explain.
10 Explain the style and layout of report.
Check your progress:
1. The research report will differ based on the …………of the
particular managers using the report.
NOTES
Report Writing
Marketing Research : 141
2. Accuracy refers to the degree to which information
reflects……………..
3. Availability refers to the communication process between
researcher and the………………..
4. …………….refers to the time span between completion of the
research project and presentation of the research report to
management
5. ……………is regarded as a major component of the research
study
6. Writing of report is the ………..step in a research study and
requires a set of skills somewhat different from those called for
in respect of the former stages of research.
7. ………………means bringing out the meaning of data.
8. Successful interpretation depends on how well the data
is……………...
9. In the ……………method, one starts from observed data and
then generalisation is done
10. In an oral presentation, ……………….plays a big role.
11. ………….report presents the outcome of the research in detail.
12. The …………….statement should explain the nature of the
project, how it came about and what was attempted.
13. The ………………..should indicate the various parts or sections
of the report.
14. …………..Page should indicate the topic on which the report is
prepared.
15. A selected bibliography lists the items which the author thinks
are of ………….interest to the reader.
16. In a report there must be …………….in margins and spacing.
17. Aim must be logical and ……………in the report presentation.
Answers:
1. need 2. Reality 3. decision maker 4. Currency 5. Research report
NOTES
Report Writing
Marketing Research : 142
6. Final 7. Interpretation 8. Analysed 9. induction 10. Communication
11. Long 12. Opening 13. table of contents 14. Title 15. primary
16. Consistency 17. systematic
8.11 Further Readings
Books
1. Abrams, M.A., Social Surveys and Social Action, London:
Heinemann, 1951.
2. Arthur, Maurice, Philosophy of Scientific Investigation,
Baltimore: John Hopkins
3. University Press, 1943
4. Bernal, J.D., The Social Function of Science, London: George
Routledge and Sons, 1939.
5. Chase, Stuart, The Proper Study of Mankind: An inquiry into
the Science of Human Relations, New York, Harper and Row
Publishers, 1958.
6. S. N. Murthy and U. Bhojanna, Business Research Methods,
Excel Books.
NOTES
Report Writing
Marketing Research : 143
Related Documents