MARKET RISK REPORT 2016: What a year December 2016

Welcome message from author
This document is posted to help you gain knowledge. Please leave a comment to let me know what you think about it! Share it to your friends and learn new things together.
Transcript

MARKET RISK REPORT 2016: What a year
December 2016

Volatilities rose during November and were typically medium relative to their 12-month averages.
Realised volatility (of Eurostoxx equities over 30 days) rose from 11.4% to 12.6% (low).
Equity market price moves were moderate and mixed during the month. Volatility trends were all upwards. Sector volatilities rose to 13-16% (but with Energy at 23%). Sector volatilities were all medium or high relative to the last 12 months.
Sovereign bond price moves were downwards. Bond volatility changes were all upwards, ending at 4-5% (and 2.1% in Japan). The US was low, others high.
FX price moves were once again large. Volatility trends were mixed: e.g. €/£ down to 9.5%. Volatilities were medium for all major currencies relative to the euro, except €/Yen which stayed low.
Option volatility will likely have risen, driven by rising volatility of volatility and with some large moves in underlying prices during the month. Volatility of volatility for the US ended at 126% (medium).
Commodities’ price moves were large, with Oil rising +4.5% but Gold -8.0%. Volatility moves were upwards e.g. Oil sharply up to 48% (high).
Real Estate (equity) price moves were again downwards outside Japan. Volatility changes were mixed and finished at 19.7% in the US (high) and 15.3% in Europe (low). PE Funds prices rose again, with volatility trends in PE and hedge funds mixed.
Niall O’Connor
Executive summary

Table of contents
1. Summary volatility matrix p. 4
2. Key News p. 5
3. Kurtosis & correlation in the equity markets p. 6-7
4. Equities p. 8-9
5. Equity Implied Volatility p. 10
6. Fixed Income p. 11
7. Foreign Exchange p. 12
8. (Equity) Options p. 13
9. Commodities p. 14
10. Real Estate (Real Estate Share Prices) & Alternatives p. 15-16

Note: Throughout the text we refer to volatilities as being "low", "medium" or "High". We define this by defining three equal "sized" regimes over the last 12 months. i.e. “High” volatility implies that volatility is in the upper third of its statistical range over the last 12 months. The table shows the "z-score" of the volatility of each market, i.e. how many standard deviations above (or below) the mean over the last 12 months each market's volatility is.
ASSET CLASS AREA LATEST
VOLATILITY LATEST
Z-SCORE REGIME
EQUITIES
North America 10.2% -0.6 low
Asia ex-Japan 13.8% 0.3 medium
Europe 11.4% -0.9 low
Japan (Nikkei) 32.1% 0.8 HIGH
Energy 23.3% 0.0 medium
Consumer Staples 13.8% 0.9 HIGH
Financials 15.9% -0.1 medium
IT 13.5% -0.2 medium
VOLATILITY OF VOLATILITY
Volatility of VIX 126% -0.0 medium
Volatility of VSTOXX 92% -0.2 medium
GOVERNMENT BONDS
Germany 5.1% 0.5 HIGH
US 3.8% -0.6 low
Japan 2.1% 0.7 HIGH
Italy 6.5% 1.6 HIGH
FX VS $
€/$ 7.5% -0.3 medium
€/Yen 7.6% -0.7 low
€/CHF 3.4% -0.9 low
€/£ 9.5% -0.3 medium
COMMODITIES
Oil (Brent) 47.7% 0.4 HIGH
Gold 17.3% 0.4 HIGH
Copper 26.9% 2.0 HIGH
PROPERTY
US 19.7% 0.9 HIGH
Europe 15.3% -0.5 low
Japan 18.9% -0.2 medium
ALTERNATIVES HFRX Global HF 3.1% -0.4 medium
Avg PE Fund 5.4% -0.7 low
KURTOSIS ZCF 1% left (vs -2.33 for normal curve) -1.95 0.9 low
CORRELATION Average market correlation with euro equities
5% -0.9 low
Summary volatility matrix
Volatilities rose back in almost all assets in
November; mostly driven by big moves in
underlying prices post the US presidential
election.
Slowly we are beginning to tick off the
long list of tail risks we have been
identifyied during the year. Both the US
Presidential election and the Italian
referendum yielded outcomes that
analysts had postulated as negative for
equity markets, and yet they rose on both
occasions. There is still a long list to get
through, including French and German
national elections, against a backdrop of a
possible post-Brexit breakup of the UK
and/or EU, the Fed’s starting to taper, the
Chinese debt bubble, another tech
bubble, rising inflation in the UK and US,
and further fallout from the lower oil
price in oil producing countries as deficits
remain high. Central banks remain all-
powerful, but it is only a matter of time
before the magic doesn’t work any more.
But it could be months or it could be
years.
2016 has been an unpredictable and
tumultuous year, with sub-$30 oil, Brexit
and Trump to name but a few. We think
everyone deserves a break; wishing you
all a very merry Christmas and a
prosperous new year.
4

GDP ESTIMATES FOR 2016, DEVELOPED COUNTRIES
GDP ESTIMATES FOR 2016, DEVELOPING COUNTRIES
The US presidential election hogged the limelight, and newsflow outside it was surprisingly light.
Donald Trump surprised pundits by winning the US presidential elections. Republicans also held onto both chambers of Congress. Markets also confounding pundits; equities and bond yields rose on a reflationary and anti-regulations theme, and Gold fell. US equities hit new record highs
The Egyptian Pound fell further after its floatation
India surprised the entire population by making 500 and 1,000 rupee notes, which make up over 80% of all currency in circulation, no longer legal tender
Valeant shares fell again after a profits warning
Samsung bought Harman for $8bn. Sunoco Logistics and Energy Transfer Partners agreed a $21bn merger.
US house prices rose to a new all time nominal high
The UK economy also continued its strength; unemployment hit a new 11 year low of 4.8% and inflation fell to just 0.9% despite the weakness of Sterling
Japan saw quarterly GDP grow by 2.2% annualised
OPEC finally managed to get an agreement on oil production cuts; prices rose.
2016 GDP estimates for developed countries were revised up for the UK and Spain.
Key News Major Volatility-Driving Events
5
2016 GDP growth forecasts for developing countries were marginally revised up for China, but marginally down for Russia, India, Brazil and Turkey.
0.5%
1.0%
1.5%
2.0%
2.5%
3.0%
3.5%
Mar-15 Jun-15 Sep-15 Dec-15 Mar-16 Jun-16 Sep-16 Dec-16US UK Spain Germany Euro Area Japan France Italy
-4%
-3%
-2%
-1%
0%
1%
2%
3%
4%
5%
6%
7%
8%
9%
Mar-15 Jun-15 Sep-15 Dec-15 Mar-16 Jun-16 Sep-16 Dec-16
China India Turkey Russia Brazil

Kurtosis in the equity markets
Methodology
To capture a measure of both Skewness and Kurtosis we look at the Cornish-Fischer expansion, which gives a good measure of the tails of the equity market. (We use a 60-calendar day rolling basis). The underlying market we plot is the Eurostoxx 50, but other equity markets normally show very similar results.
We plot on the chart the expected Z-scores for 1% left tail (i.e. a 99% VaR) and a 1% right tail assuming a normal distribution: +/-2.33.
We also show the Cornish-Fischer expansion result for the same market. This indicates how far from a normal distribution each tail was.
On a long term basis on average the tails are slightly fatter than the normal distribution would suggest, which should not come as a surprise. What is perhaps more surprising is how much variation in fat-tailedness there has been: a daily 99% VaR has varied between -1 and -4.5 standard deviations over time. The biggest variations from +/-2.33 came in 2008 and 2010.
CORNISH-FISCHER EXPANSION OF EURO STOXX 50
The left tail of the eurozone equity market distribution continued to drift inside its normal level during the month, to -1.95 vs a theoretical normal -2.33. The right tail also was well behaved.
6
The left tail of the eurozone equity market distribution continued to drift inside its normal level during the month, to -1.95 vs a theoretical normal -2.33.
“
” -4
-3
-2
-1
0
1
2
3
4
ZCF 1% left Z 1% left ZCF 1% right Z 1% right

Average correlations remained low during the month.
Average correlation fell from 12% to 5% (low).
Note: The chart shows 30-day correlation over time between different markets and the pan-Euro equity market. Higher levels of correlation will in general lead to less ability to diversify risks, and higher portfolio volatility for given position holding volatility.
INTER-MARKET CORRELATIONS
MULTI-ASSET PORTFOLIO
We also look at a hypothetical multi-asset portfolio consisting of equities, bonds, gold, oil and hedge funds.
Average asset volatilities rose from 9.1% to 16.3% during the month, while the benefit of (multi-asset) diversification increased to -8.3%. In combination portfolio volatility rose from 4.7% to 8.0%.
Inter-market correlations with EU equities
↘ 7% AVERAGE CORRELATION
↗ 3.3% PORTFOLIO VOLATILITY
↘ 8.3% AVERAGE VOLATILITIES
7
-80%
-60%
-40%
-20%
0%
20%
40%
60%
80%
100%
North America Japan Bunds (negative) €/$ Average
-15%
-10%
-5%
0%
5%
10%
15%
20%
25%
30%
Average asset Multi-asset portfolio Diversification impact

STOCK PRICE PERFORMANCE: REGIONS (LOG SCALES)
STOCK PRICE PERFORMANCE: SECTORS (LOG SCALES)
Equities Stock price
Sector price moves were unusually large.
Energy was +5.1% on the OPEC deal, Financials +7.5% on Trump’s anti-regulation drive, while IT fell -0.7% and Consumer Staples fell -5.3%.
Equity index price moves were mixed during the month.
North America rose +3.3% on the Trump presidency, Asia ex-Japan fell -1.7% and Europe ended the month down slightly at -0.8%. The Nikkei rose +5.1%; its second 5%+ month in a row.
8
↘ 0.8 % Europe
↗ 7.5% FINANCIALS
↗ 5.1% ENERGY
↘ 0.7% IT
↘ 5.3% CONSUMER
STAPLES
10,000
20,000
1000
2000
North America Europe Asia ex-Japan Japan (rh axis)
80
90
100
110
120
130
140
150
160
120
140
160
180
200
220
240
Energy Consumer Staples IT Financials, rh axis

EQUITY VOLATILITY: REGIONS
EQUITY VOLATILITY: SECTORS
Regional volatilities were all up on the month.. North America ended up to 10.2% (low), Asia ex-Japan up to 13.8% (low up to medium), Europe up to 11.4% (low) and Japan rose to 32.1% (low to high) although this was almost entirely driven by a big drop immediately after the US election followed by a similarly big rise the next day.
Sector volatility moves were likewise all upwards.
They ended at 13-16%, with Energy at 23%. All sectors ended with medium volatility, except Consumer Staples at high.
Equities Volatility
9
between 13-16%
All sector volatilities
32.1% NIKKEI
0%
5%
10%
15%
20%
25%
30%
35%
40%
45%
North America Europe Asia ex-Japan Japan (Nikkei)
0%
5%
10%
15%
20%
25%
30%
35%
40%
45%
50%
Energy Consumer Staples IT Financials

Equity Implied Volatility Market-Implied Near Term Outlook
Note: Note: the implied/realised volatility ratio gives an indication as to whether the market sees an event in the next 30 days (the implied volatility period) which will increase realised volatility (implied/realised >100%, e.g. within 30 days prior to the Greek elections during the Greek crisis) or a period of relative calm after high realised volatility (implied/realised <100%, e.g. immediately after Draghi’s calming “whatever it takes” comments).
Implied Volatility
Implied volatilities dropped on the month as the US election passed. The VIX fell from 17.1 to 13.3 while European implied volatility (VSTOXX) was relatively unchanged at 21.4.
Implied vs. Realised Volatility
((European equity) implied volatility was flat on the month while realised volatility rose. So the ratio of implied/realised fell back slightly from 189% to 170%.
Interestingly despite the US election passing, this ratio is still well above a neutral level, suggesting that the market expected there would continue to be volatility-inducing news over the next 30 days compared to the last 30 days; the Italian referendum being one possibility.
IMPLIED VOLATILITY
IMPLIED VS. REALISED VOLATILITY
13.3 VIX
↘19%
21.4 VSTOXX
IMPLIED/REALISED
VOLATILITY
10
0
5
10
15
20
25
30
35
40
45
VSTOXX VIX
-
50%
100%
150%
200%
250%
0%
5%
10%
15%
20%
25%
30%
35%
40%
45%
Implied Realised Implied / Realised (rh axis)
Trump victory(Nov)
Fed raises,ECB
disappoints (Dec)
BoJ goes negativeOil price trough(Jan)
Fed hints at June rate rise (May)
Brexit (Jun)
Fed hints at rate rise
(Sep)
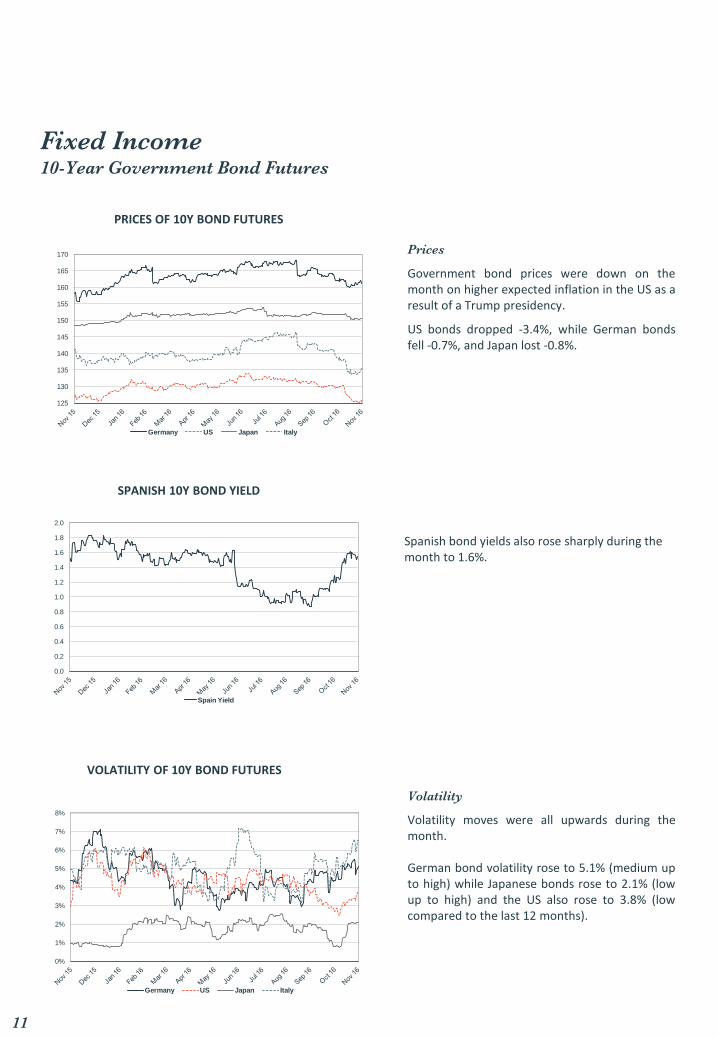
Prices
Government bond prices were down on the month on higher expected inflation in the US as a result of a Trump presidency.
US bonds dropped -3.4%, while German bonds fell -0.7%, and Japan lost -0.8%.
Volatility
Volatility moves were all upwards during the month.
German bond volatility rose to 5.1% (medium up to high) while Japanese bonds rose to 2.1% (low up to high) and the US also rose to 3.8% (low compared to the last 12 months).
PRICES OF 10Y BOND FUTURES
SPANISH 10Y BOND YIELD
VOLATILITY OF 10Y BOND FUTURES
Fixed Income 10-Year Government Bond Futures
11
Spanish bond yields also rose sharply during the month to 1.6%.
125
130
135
140
145
150
155
160
165
170
Germany US Japan Italy
0.0
0.2
0.4
0.6
0.8
1.0
1.2
1.4
1.6
1.8
2.0
Spain Yield
0%
1%
2%
3%
4%
5%
6%
7%
8%
Germany US Japan Italy

Note: The charts show currencies vs. the €. Axes on the first chart are inverted to show conventional currency quotations, but with higher on the chart representing a stronger currency vs. the euro.
Prices
FX moves were again large during the month.
The Dollar rose +3.3% against the euro on higher rate expectations, while Sterling bounced back +5.4%, and the Yen again fell -5.1%.
Volatility
FX volatility moves were again mixed. €/$ rose to 7.5% (low up to medium), but €/£ fell to 9.5% (medium), while €/Yen fell to 7.6% (low relative to 12 month averages.)
FX RATES VS. €
VOLATILITY OF FX RATES VS. €
Foreign Exchange
12
↗ 7.5% € vs. $
↘ 9.5% € vs. £
↘ 7.6% € vs. ¥
↘ 5.4% € vs. £
↘ 5.1% € vs. ¥
↗ 3.3% € vs. $
0.65
0.70
0.75
0.80
0.85
0.90
1.00
1.05
1.10
1.15
1.20
1.25
1.30
1.35
1.40
1.45
1.50€/$ €/JPY /100 €/£ (rh axis)
0%
5%
10%
15%
20%
25%
30%
€/£ €/Yen €/$

(Equity) Options Option volatility is mainly driven by the volatility of volatility and moves in prices of the underlying instruments affecting options’ deltas.
Volatility of Implied Volatility
Volatility of implied volatility rose, with the US ending at 126% (low up to medium) and Europe at 92% (also low up to medium relative to the last 12 months.) Volatility of volatility could quite probably have been a driver of option volatility during the month.
Major (Regional Equity) price moves
(Equity) prices saw big swings during the month.
Underlying price moves are also likely to have been a big driver of option volatility.
VOLATILITY OF VOLATILITY
CHANGE IN PRICES OF EQUITY INDICES, 30 DAYS
126% US
92% EUROPE
Note on Treatment: Options show more complex behaviour than the other instruments we look at in this report, so we make some simplifying assumptions. As Calls and Puts are in effect polar opposites and in and out of the money options behave very differently, it is hard to generalise all options’ behaviour. However, we look at the two key drivers: volatility of implied volatility and major price movements of the underlying security.
Implied volatility (via an option's Vega) drives option prices, so a big indicator of option price volatility is the “volatility of implied volatility”.
But usually the biggest driver of individual option prices is the movement of the underlying (via the option Delta): a move in either direction will cause the option to go more in or out of the money (and a corresponding change in the option’s Delta and price volatility). As a proxy for this, we look at the 30-day price swing of equity market indices; options on bonds or FX could of course behave differently. The 30-day period is relatively close to the time to maturity of many options. Calls and Puts will respond in opposite fashions: calls becoming more volatile (relative to the size of the underlying notional) as prices rise.
Note on Convertibles: Convertibles are in effect a combination of a bond and a call option, with the bond portion usually making little contribution to the instrument volatility unless the option is significantly out of the money. As such, convertible portfolios’ volatilities will tend to behave similarly to call option portfolios, and this commentary can be applied to convertibles as well as options. 13
0%
50%
100%
150%
200%
250%
Volatility of VIX Volatility of VSTOXX
-20%
-15%
-10%
-5%
0%
5%
10%
15%
20%
North America EU Asia ex-Japan Japan

Commodities
Note: all prices refer to near futures rather than spot with the exception of iron ore which is a spot price.
Prices
Commodity price moves were large during the month.
Oil rose +4.5% on the month on the OPEC agreement. Gold fell -8.0% on rising US bond yields while Copper was +18.9%, partly on rising growth estimates and Trump’s election, but also partly attributed to speculative trading.
Volatility
Volatility changes were up for all assets; Oil finished significantly up at 48% (low up to high) while Gold rose slightly to 17% (low up to high) and Copper rose to 27% (also low to high).
COMMODITIES PRICES
COMMODITIES VOLATILITY
↘ 8.0% GOLD
OIL
14
↗ 18.9% COPPER
↗ 4.5%
600
700
800
900
1,000
1,100
1,200
1,300
1,400
30
40
50
60
70
80
90
100
Oil (Brent) Copper (indexed) Iron Ore Gold (rh axis)
0%
10%
20%
30%
40%
50%
60%
70%
80%
90%
Oil (Brent) Copper Gold

Real Estate (Real Estate Share Prices)
Note: Note that for property we look at indices of the share prices of REITs, and not the underlying property directly, for which little real-time data is available. This is usually consistent with funds which tend to invest in property indirectly, e.g. via REITs or property companies.
As REITs are usually focused on commercial property, residential property may also follow a slightly different pattern to that discussed in this article.
Real estate equities price moves were again downwards outside Japan on the prospect of higher interest rates.
Europe was down -1.0%, the US down -2.1% while Japan was again up at +5.2%.
Volatility moves were mixed.
Europe fell back to 15.3% (medium down to low) while the US rose to 19.7% (medium up to high). Japan was sharply up at 18.9% (low up to medium).
REAL ESTATE (REIT) PRICES
REAL ESTATE (REIT) VOLATILITY
↘ 1.0 %EUROPE
↘ 2.1% US
↗ 5.2% JAPAN
15
2,400
2,600
2,800
3,000
3,200
3,400
3,600
1,800
1,900
2,000
2,100
2,200
2,300
2,400
Europe Japan (rh axis) US (rh axis)
0%
10%
20%
30%
40%
50%
60%
Europe Japan US

PE funds had a seventh consecutive positive month, at +0.3%. The average hedge fund rose fractionally.
The global hedge fund index volatility rose to 3.1% (low up to medium) while the volatility of an average of PE fund fell slightly again to 5.4% (medium down to low by the standards of the last 12 months).
ALTERNATIVES PRICES
AI VOLATILITY
Alternatives
5.4% AVERAGE PE FUND
3.1% HFRX volatility
16
900
950
1,000
1,050
1,100
1,150
1,200
1,250
Global Hedge Funds (EUR) Avg PE Fund (indexed)
0%
2%
4%
6%
8%
10%
12%
14%
Global Hedge Funds (EUR) Avg PE Fund

Definitions
To avoid repetitions, the term volatility refers to annualised, 30-day average realised volatility in local currency unless otherwise specified. As such, it may be lower than, and lag, shorter-term market volatility in times of high market volatility.
Charts show data up until 30th November 2016, and the commentary was written on or before 12th December 2016.
Disclaimer
The commentary does not constitute, and is not intended to constitute, investment advice.
Any views expressed in this report are based on historical market data and as such cannot be interpreted as being forward-looking, or to constitute forecasts. Past movements are not necessarily indicative of future movements.
Employees of IRML/ARKUS FS may hold positions in securities mentioned.
All expressions of opinion reflect the judgment of IRML/ARKUS FS at this date and are subject to change. Information has been obtained from sources considered reliable, but we do not guarantee that the report is accurate or complete.
This document is not for US clients or distribution to the US.
© Arkus Financial Services - 2016 Arkus is the brand under which IRML S.A. operates and provides services
This document is the property of IRML/Arkus FS and should not be copied or distributed to any third party without the prior consent of IRML/Arkus FS – please contact us regarding
distribution rights.

Related Documents