Measurement of Market Risk

Measurement of Market Risk. Market Risk Directional risk Relative value risk Price risk Liquidity risk Type of measurements –scenario analysis –statistical.
Dec 14, 2015
Welcome message from author
This document is posted to help you gain knowledge. Please leave a comment to let me know what you think about it! Share it to your friends and learn new things together.
Transcript
Measurement of Market Risk
Market Risk
• Directional risk
• Relative value risk
• Price risk
• Liquidity risk
Type of measurements
– scenario analysis
– statistical analysis
Scenario Analysis
• A scenario analysis measures the change in market
value that would result if market factors were changed
from their current levels, in a specified way. No
assumption about probability of changes is made.
• A stress test is a measurement of the change in the
market value of a portfolio that would occur for a
specified unusually large change in a set of market
factors.
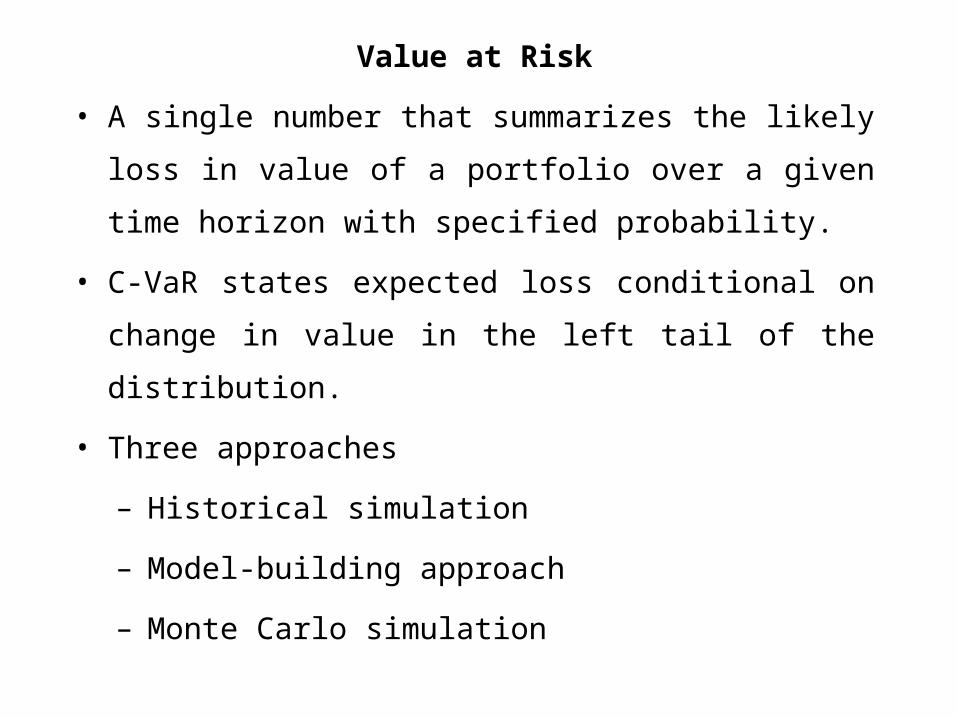
Value at Risk
• A single number that summarizes the likely loss in
value of a portfolio over a given time horizon with
specified probability.
• C-VaR states expected loss conditional on change in
value in the left tail of the distribution.
• Three approaches
– Historical simulation
– Model-building approach
– Monte Carlo simulation
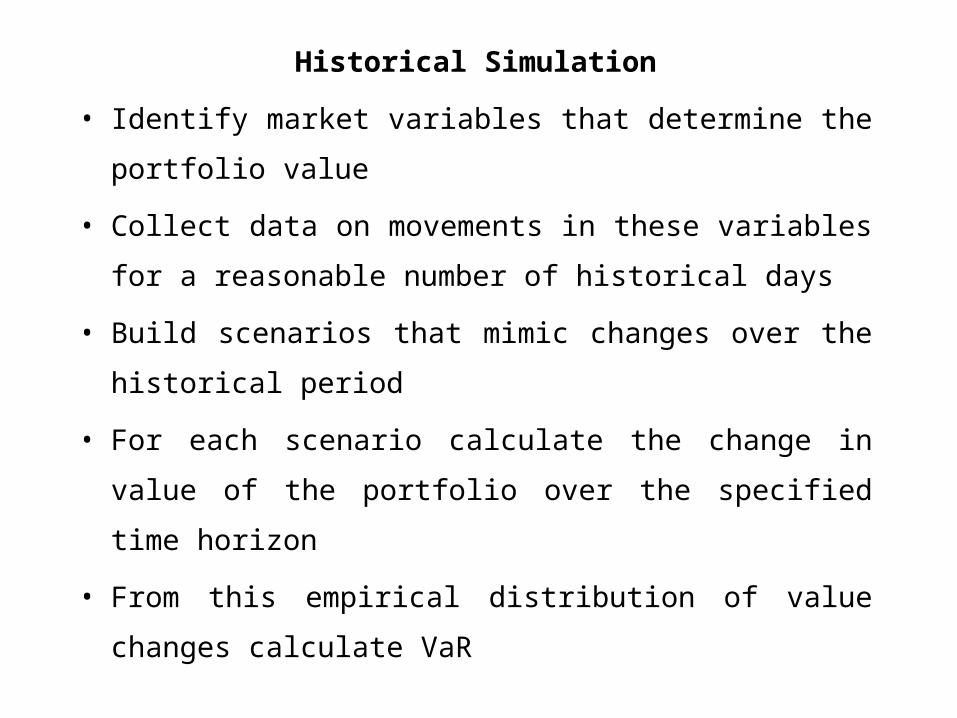
Historical Simulation
• Identify market variables that determine the portfolio
value
• Collect data on movements in these variables for a
reasonable number of historical days
• Build scenarios that mimic changes over the
historical period
• For each scenario calculate the change in value of
the portfolio over the specified time horizon
• From this empirical distribution of value changes
calculate VaR
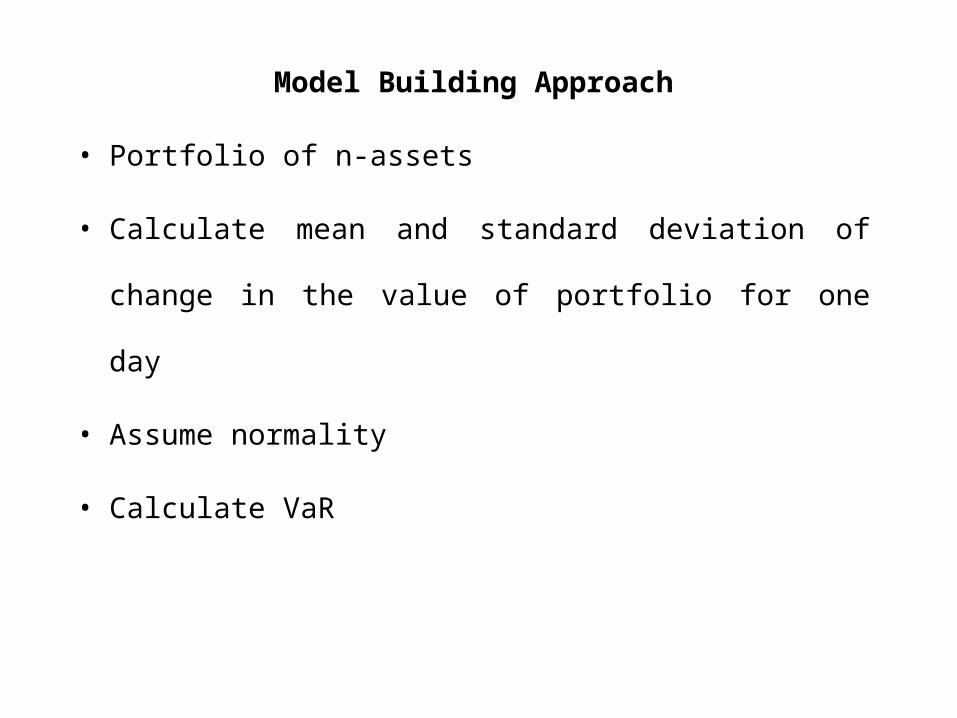
Model Building Approach
• Portfolio of n-assets
• Calculate mean and standard deviation of change in
the value of portfolio for one day
• Assume normality
• Calculate VaR
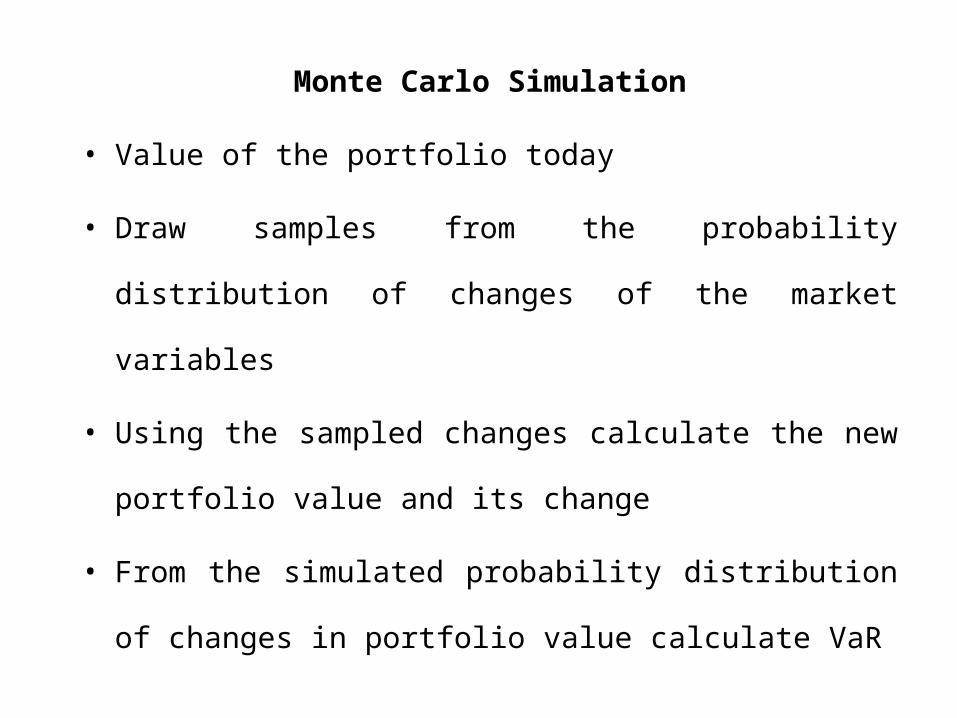
Monte Carlo Simulation
• Value of the portfolio today
• Draw samples from the probability distribution of
changes of the market variables
• Using the sampled changes calculate the new portfolio
value and its change
• From the simulated probability distribution of changes
in portfolio value calculate VaR

Pitfalls of Normal Distribution Based VaR
• Normality assumption may not be valid for tail part of the
distribution
• VaR of a portfolio is not less than weighted sum of VaR
of individual assets (not sub-additive)
• Expected shortfall conditional on the fact that loss is
more than VaR is a sub-additive measure of risk

Pitfalls of Value-at-Risk
• VaR is a statistical measurement of price risk
• VaR assumes a static portfolio. It does not take into
account
– Structural change in the portfolio that would
contractually occur during the period
– Dynamic hedging of the portfolio
• VaR calculation has two basic components
– Simulation of changes in market rates
– Calculation of resultant changes in the portfolio value
Value-at-Risk
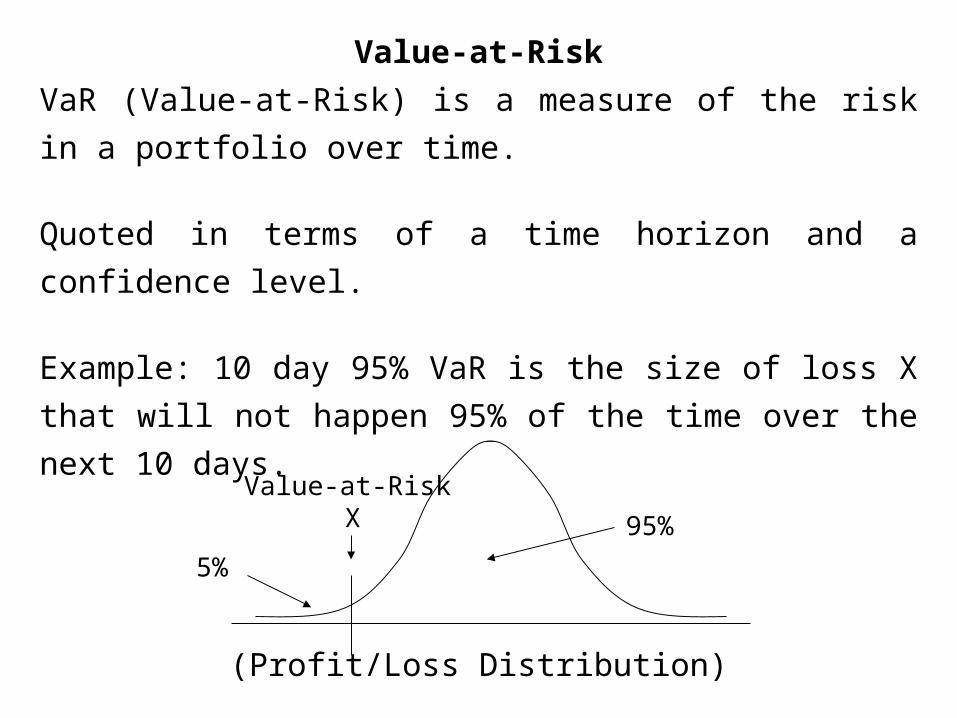
VaR (Value-at-Risk) is a measure of the risk in a portfolio over
time.
Quoted in terms of a time horizon and a confidence level.
Example: 10 day 95% VaR is the size of loss X that will not
happen 95% of the time over the next 10 days.
(Profit/Loss Distribution)
5%
95%XValue-at-Risk

Value-at-Risk Levels
Two standard VaR levels are 95% and 99%.
95% is 1.645 standard deviations from the mean
99% is 2.33 standard deviations from the mean
mean
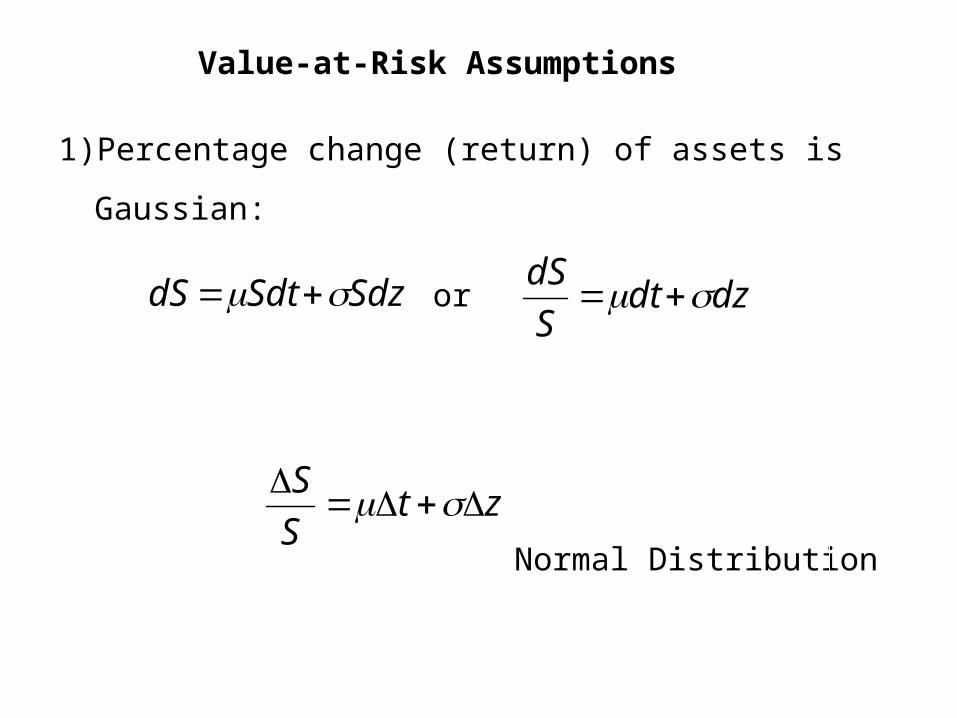
Value-at-Risk Assumptions
1) Percentage change (return) of assets is Gaussian:
SdzSdtdS dzdtS
dS or
ztS
S
Normal Distribution
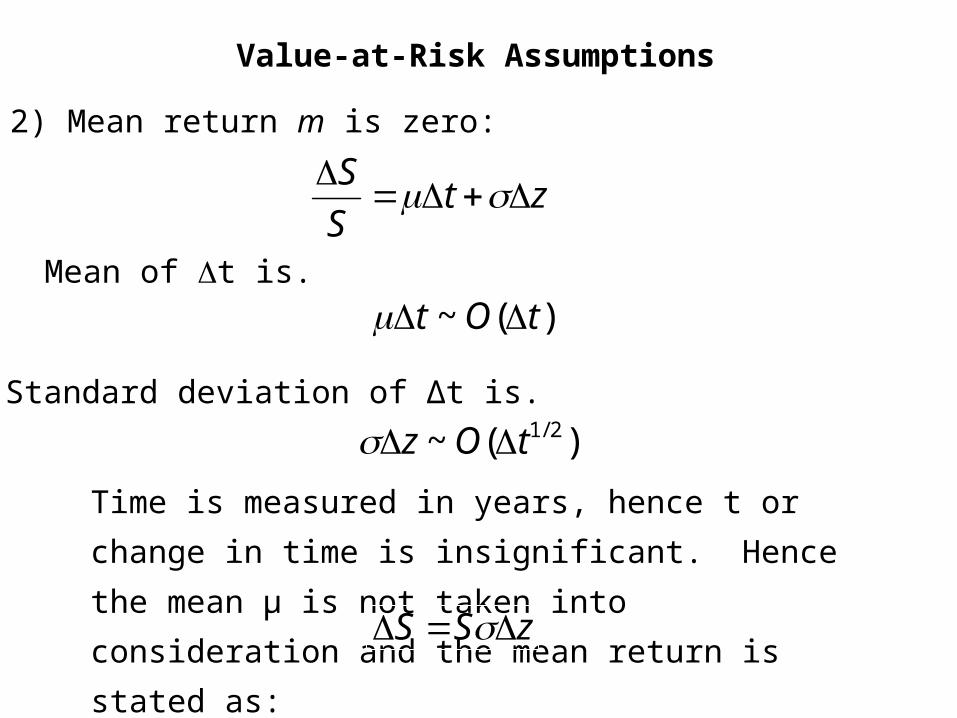
Value-at-Risk Assumptions
2) Mean return m is zero:
ztS
S
Mean of t is.
)(~ tOt
Standard deviation of ∆t is.
)(~ 2/1tOz Time is measured in years, hence t or change in
time is insignificant. Hence the mean μ is not taken
into consideration and the mean return is stated as: zSS
VaR and Regulatory Capital
Regulators require banks to keep capital for market risk
equal to the average of VaR estimates for past 60
trading days using confidence level of 99% and number
of days (N) =10, times a multiplication factor
(multiplication factor equals 3).

Advantages of VaR
• Captures an important aspect of risk in a single number
• Easy to understand
• Indicates the worst loss that could happen
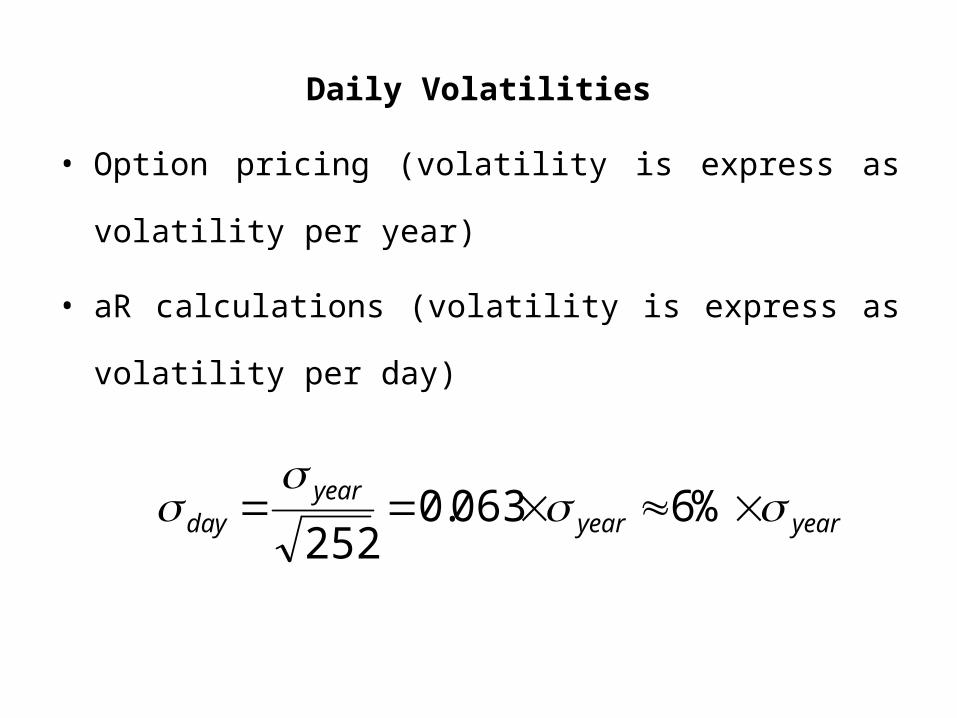
Daily Volatilities
• Option pricing (volatility is express as volatility per year)
• aR calculations (volatility is express as volatility per day)
yearyearyear
day
%6063.0252

Daily Volatility
• day is defined as the standard deviation of the
continuously compounded return in one day
• In practice it is also assumed that it is the standard
deviation of the proportional change in one day
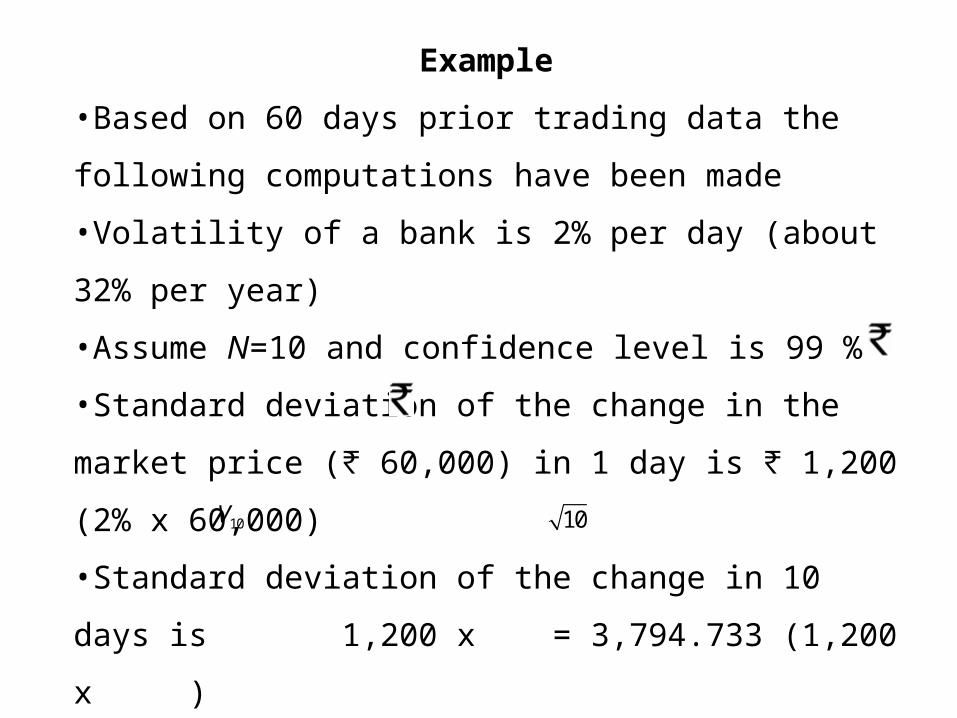
Example
•Based on 60 days prior trading data the following
computations have been made
•Volatility of a bank is 2% per day (about 32% per year)
•Assume N=10 and confidence level is 99 %
•Standard deviation of the change in the market price ( ₹
60,000) in 1 day is 1,200 (2% x 60,000)₹
•Standard deviation of the change in 10 days is 1,200
x = 3,794.733 (1,200 x )
10V 10

Example (continued)
• Assume that the expected change in the value of the
bank’s share is zero
• Assume that the change in the value of the bank’s share
is normally distributed
• Since N(0.01)= -2.33, ({Z<-2.33}=0.01)
the VaR is
2.33 x 3,794.733 = 8,846.728.₹
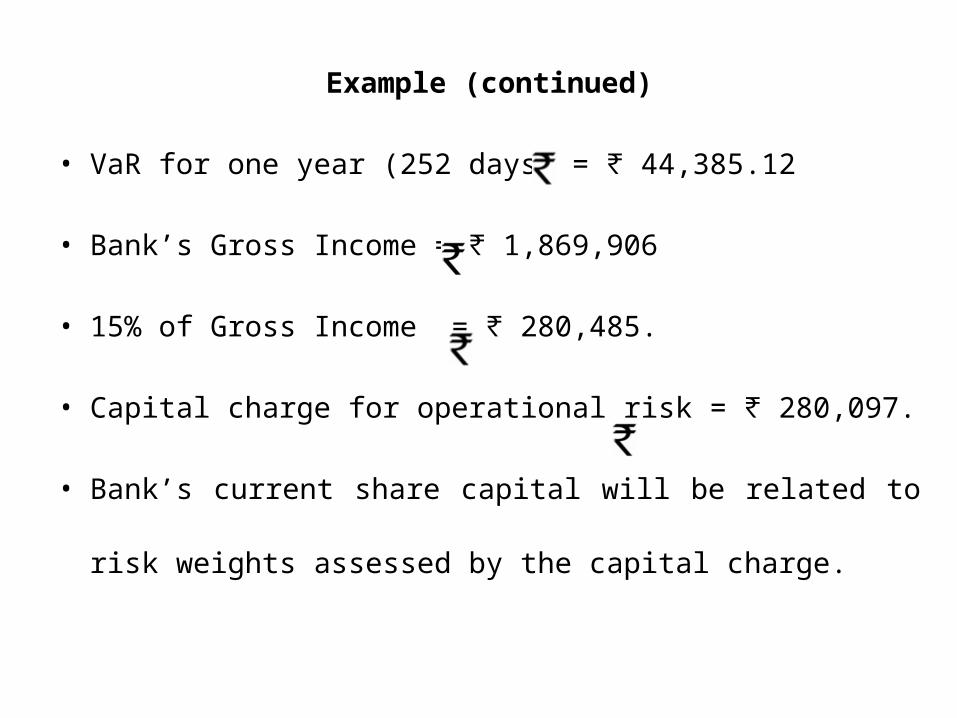
Example (continued)
• VaR for one year (252 days) = 44,385.12₹
• Bank’s Gross Income = 1,869,906 ₹
• 15% of Gross Income = 280,485.₹
• Capital charge for operational risk = 280,097.₹
• Bank’s current share capital will be related to risk weights
assessed by the capital charge.
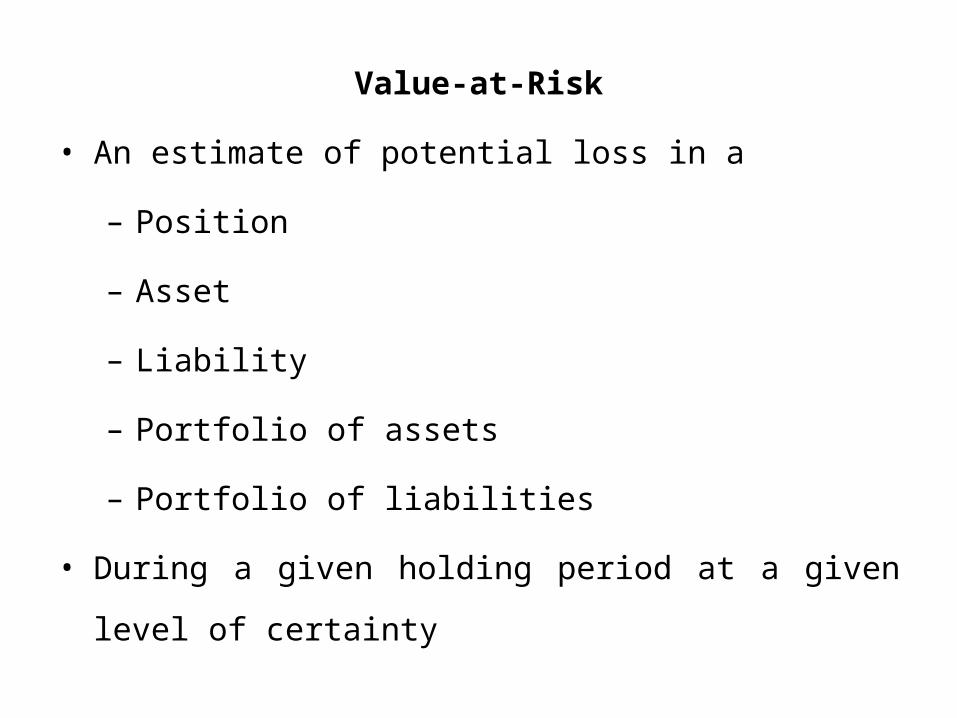
Value-at-Risk
• An estimate of potential loss in a
– Position
– Asset
– Liability
– Portfolio of assets
– Portfolio of liabilities
• During a given holding period at a given level of certainty
Value-at-Risk
•Probability of the unexpected happening
•Probability of suffering a loss
•Estimate of loss likely to be suffered
•VaR is not the actual loss
•VaR measures potential loss and not potential gain
•VaR measures the probability of loss for a given time period
over which the position is held

Bank for International Settlement (BIS)
• VaR is a measurement of market risk
• Provision of capital adequacy for market risk, subject to
approval by banks' supervisory authorities
• Computation of VaR changes based on the estimated
time period
– One day
– One week
– One month
– One year

Bank for International Settlement (BIS)
•Holding period for an instrument will depend on liquidity of
the instrument
•Varying degrees of certainty changes potential loss
•VaR estimates that the loss will not exceed a certain
amount
•VaR will change with different levels of certainty

VaR Methodology
• Computed as the expected loss on a position from an
adverse movement in identified market risk parameter(s)
• Specified probability over a nominated period of time
• Volatility in financial markets is calculated as the
standard deviation of the percentage changes in the
relevant asset price over a specified asset period
• Volatility for calculation of VaR is specified as the
standard deviation of the percentage change in the risk
factor over the relevant risk horizon

VaR Computation Method
• Correlation Method
– Variance – covariance method
– Deterministic approach
– Change in value of the position computed by combining
the sensitivity of each component to price changes in
the underlying assets

VaR Computation Method
• Historical Simulation
– Change in the value of a position using the actual historical movements of the underlying assets
– Historical period has to be adequately long to capture all possible events and relationships between the various assets and within each asset class
– Dynamics of the risk factors captured since simulation follows every historical move
VaR Computation Method
• Monte Carlo Simulation
– Calculates the change in the value of a portfolio using a sample of randomly generated price scenarios
– Assumptions on market structures, correlations between risk factors and the volatility of these factors
VaR Application
• Basic parameters
– Holding period
– Confidence interval
– Historical time period (observed asset prices)
• Closer the models fit economic reality, more accurate the
estimated
• There is no guarantee that the numbers returned by
each VaR method will be near each other
VaR Application
• VaR is used as a Management Information System (MIS)
tool in the trading portfolio
• Risk by levels
• Products
• Geography
• Level of organisation
• VaR is used to set risk limits
• VaR is used to decide the next business

VaR Limitation
• VaR does not substitute
– Management judgement
– Internal control
• VaR measures market risk
– Trading portfolio
– Investment portfolio
• VaR is helpful subject to the extent of
– Measurement parameters

Back Testing
• Backtests compare realized trading results with model
generated risk measures
• Evaluate a new model
• Reassess the accuracy of existing models
• Banks using internal VaR models for market risk capital
requirements must backtest their models on a regular
basis
Back Testing
• Banks back test risk models on a monthly or quarterly
basis to verify accuracy
• Observe whether trading results fall within pre-specified
confidence bands as predicted by the VaR models
• If the models perform poorly establish cause for poor
performance
– Check integrity of position
– Check market data
– Check model parameters
– Check methodology

Stress Testing
• Banks gauge their potential vulnerability to exceptional,
but plausible, events
• Stress testing addresses the large moves in key market
variables that lie beyond day to day risk monitoring but
that could potentially occur

Stress Testing
• Process of stress testing involves
– Identifying potential movements
– Market variables to stress
– How much to stress them
– What time frame to run the stress analysis
– Shocks are applied to the portfolio
• Revaluing the portfolios
– Effect of a particular market movement on the value of
the portfolio
– Profit and Loss
– Effects of different shocks of different magnitudes

Stress Testing Technique
• Scenario analysis
• Evaluating the portfolios
– under various expectations
– evaluating the impact
• changing evaluation models
• volatilities and correlations
• Scenarios requiring no simulations
– analyzing large past losses
Stress Testing Technique
• Scenarios requiring simulations
– Running simulations of the current portfolio subject to
large historical shocks
• Bank specific scenario
– Driven by the current position of the bank rather than
historical simulation
• Subjective than VaR
• Identify undetected weakness in the bank's portfolio
Efficiency of a Stress Test
• Relevant to the current market position
• Consider changes in all relevant market rates
• Examine potential regime shifts (whether the current risk
parameters will hold or break down)
• Consider market illiquidity
• Consider the interrelationship between market and credit
risk
Application of Stress Tests
• Stress tests produce information summarising the bank’s
exposure to extreme but possible circumstances
• Role of risk managers in the bank is gathering and
summarising information to enable senior management
to understand the strategic relationship between the
bank’s risk taking
– Extent and character of financial leverage employed
– Risk appetite
– Stress scenarios created on a regular basis
– Stress scenarios monitored over time

Application of Stress Tests
•Influence decision-making
•Manage funding risk
•Provide a check on modelling assumptions
•Set limits for traders
•Determine capital charges on trading desks’ positions

Limitations of Stress Test
• Stress tests are often neither transparent nor
straightforward
• Depends on a large number of practitioner choices
• Choice of risk factors to stress
• Methods of combining factors stressed
• Range of values considered
Limitations of Stress Test
•Time frame to analyse
•Risk manager is faced with the considerable tasks of
analyzing the results and identifying implications
•Stress test results interpretation for the bank is based on
qualitative criteria
•Manage bank’s risk-taking activities is subject to
interpretations
Related Documents