Market Recap Highlights A1 MR- 12/02/2011 Heightened volatility is once again the theme. Stocks closed sharply higher Wednesday as investors cheered the move by central banks to boost global liquidity. Also contributing to the upside was a slew of data released from the U.S., which alleviated fears of a possible "double dip." Including the big 490 point move higher for the Dow Jones Industrial Average, we had, for November, four 200+ point UP days to go along with four 200+ point DOWN days. The previous quarter saw 19 trading days in which the market moved 200 points or more compared with just one such day during the second quarter. The high level of excess volatility could signal that the economy’s recent slow growth has reached an inflection point, but it is not clear whether that change is to the upside or downside. Despite the market being relatively flat for the year, investors who were nimble and tactical with their trading found the market volatility highly profitable. Source: Reuters Dow Jones Industrial Average 200+ Point Up/Down Days 2002 2003 2004 2005 2006 2007 2008 2009 2010 2011 Comm odities 25.9% Em erging M arkets Stock 55.8% Em erging M arkets Stock 25.6% Em erging M arkets Stock 34.0% Em erging M arkets Stock 32.2% Em erging M arkets Stock 39.4% World Bonds 10.9% Em erging M arkets Stock 78.5% Em erging M arkets Stock 18.9% U.S. Bonds 7.8% World Bonds 19.5% International Stock 40.0% International Stock 20.8% Comm odities 21.4% International Stock 26.2% Comm odities 16.2% U.S. Bonds 5.2% International Stock 33.7% Comm odities 16.8% World Bonds 6.4% U.S. Bonds 10.3% U.S. Stock 26.4% World Bonds 10.4% International Stock 15.0% U.S. Stock 13.6% International Stock 12.9% Commodities -35.7% U.S. Stock 26.5% U.S. Stock 15.1% U.S. Stock 2.1% Em erging M arkets Stock -6.2% Commodities 23.9% Com modities 9.1% U.S. Stock 3.0% World Bonds 6.1% World Bonds 11.0% U.S. Stock -37.0% Com modities 18.9% International Stock 9.0% International Stock -12.2% International Stock -15.5% World Bonds 14.9% U.S. Stock 9.0% U.S. Bonds 2.4% U.S. Bonds 4.3% U.S. Bonds 7.0% International Stock -37.0% U.S. Bonds 5.9% U.S. Bonds 6.5% Comm odities -13.3% U.S. Stock -23.4% U.S. Bonds 4.1% U.S. Bonds 4.3% World Bonds -6.9% Comm odities 2.1% U.S. Stock 5.5% Em erging M arkets Stock -53.3% World Bonds 2.6% World Bonds 5.2% Em erging M arkets Stock -18.4% Investment Quilt of Returns Source: Bloomberg, HFRI, ThompsonOne.com MR – 01/20/2012 The Investment Quilt of Returns ranks key market indices, representing different asset classes, in order of calendar year performance. Asset classes can rotate in and out of relative favor depending on factors such as market sentiment and economic dynamics. While U.S. bonds were the best performing asset class this past year, they were an under- performing asset for 7 years during the past decade. Likewise, emerging market equity was the top-performing category for the majority of the past decade but was the least favorable category in 2011. Because it is difficult to ‘time the market’ and predict which asset class will outperform in a given year, investors should consider investing in a balanced and well-diversified portfolio instead of investing too heavily in any single asset class.

Market Recap Highlights A1 MR- 12/02/2011 Heightened volatility is once again the theme. Stocks closed sharply higher Wednesday as investors cheered the.
Dec 16, 2015
Welcome message from author
This document is posted to help you gain knowledge. Please leave a comment to let me know what you think about it! Share it to your friends and learn new things together.
Transcript

Market Recap Highlights
A1
MR- 12/02/2011
Heightened volatility is once again the theme. Stocks closed sharply higher Wednesday as investors cheered the move by central banks to boost global liquidity. Also contributing to the upside was a slew of data released from the U.S., which alleviated fears of a possible "double dip." Including the big 490 point move higher for the Dow Jones Industrial Average, we had, for November, four 200+ point UP days to go along with four 200+ point DOWN days. The previous quarter saw 19 trading days in which the market moved 200 points or more compared with just one such day during the second quarter. The high level of excess volatility could signal that the economy’s recent slow growth has reached an inflection point, but it is not clear whether that change is to the upside or downside. Despite the market being relatively flat for the year, investors who were nimble and tactical with their trading found the market volatility highly profitable.
Source: Reuters
Dow Jones Industrial Average 200+ Point Up/Down Days2002 2003 2004 2005 2006 2007 2008 2009 2010 2011
Commodities25.9%
Emerging Markets
Stock55.8%
Emerging Markets
Stock25.6%
Emerging Markets
Stock34.0%
Emerging Markets
Stock32.2%
Emerging Markets
Stock39.4%
World Bonds10.9%
Emerging Markets
Stock78.5%
Emerging Markets
Stock18.9%
U.S. Bonds7.8%
World Bonds19.5%
InternationalStock40.0%
InternationalStock20.8%
Commodities21.4%
InternationalStock26.2%
Commodities16.2%
U.S. Bonds5.2%
InternationalStock33.7%
Commodities16.8%
World Bonds6.4%
U.S. Bonds10.3%
U.S. Stock26.4%
World Bonds10.4%
InternationalStock15.0%
U.S. Stock13.6%
InternationalStock12.9%
Commodities-35.7%
U.S. Stock26.5%
U.S. Stock15.1%
U.S. Stock2.1%
Emerging Markets
Stock-6.2%
Commodities23.9%
Commodities9.1%
U.S. Stock3.0%
World Bonds6.1%
World Bonds11.0%
U.S. Stock
-37.0%
Commodities18.9%
InternationalStock9.0%
InternationalStock
-12.2%
InternationalStock
-15.5%
World Bonds14.9%
U.S. Stock9.0%
U.S. Bonds2.4%
U.S. Bonds4.3%
U.S. Bonds7.0%
InternationalStock
-37.0%
U.S. Bonds5.9%
U.S. Bonds6.5%
Commodities-13.3%
U.S. Stock
-23.4%
U.S. Bonds4.1%
U.S. Bonds4.3%
World Bonds-6.9%
Commodities2.1%
U.S. Stock5.5%
Emerging Markets
Stock-53.3%
World Bonds2.6%
World Bonds5.2%
Emerging Markets
Stock-18.4%
Investment Quilt of Returns
Source: Bloomberg, HFRI, ThompsonOne.com
MR – 01/20/2012
The Investment Quilt of Returns ranks key market indices, representing different asset classes, in order of calendar year performance. Asset classes can rotate in and out of relative favor depending on factors such as market sentiment and economic dynamics. While U.S. bonds were the best performing asset class this past year, they were an under-performing asset for 7 years during the past decade. Likewise, emerging market equity was the top-performing category for the majority of the past decade but was the least favorable category in 2011. Because it is difficult to ‘time the market’ and predict which asset class will outperform in a given year, investors should consider investing in a balanced and well-diversified portfolio instead of investing too heavily in any single asset class.

Market Recap Highlights
A2
Source: Gallup
MR-11/11/2011
Much of the current focus of the direction of the economy centers on the upcoming election. President Obama faces one of the most challenging political environments, as he prepares to try to win a second term next November. A state-by-state examination of the electoral map suggests that the president faces a far more challenging election than in 2008. President Obama was swept into office with 365 electoral votes (270 needed to win the election), having won several traditionally-Republican states. He is currently falling behind in several of the battleground states that he won in the last election. Based on current polling data, the upcoming election will be decided by 12 swing states, with Florida, Pennsylvania, and Ohio being the most highly-contested.
Electoral Map
MR – 01/06/2012
At the start of each year, market strategists typically attempt to forecast how the market will perform in the coming year. Most Wall Street strategists are optimistic that the stock market will increase in 2012 but are not forecasting a dramatic move higher. The current consensus estimate among strategists is for the S&P 500 index to end 2012 at around 1334, which would be 6.1% higher than the 2011 closing value of 1257. Given the current 2% yield for the S&P 500, the total return for the market would be ~ 8%. Many worry that there seem to be few solutions to the European sovereign-debt crisis and that corporate earnings growth in the U.S. may begin to slow. It is interesting to note that the average forecast for 2011 was 1372, which would have been an 8.3% gain. The market fell well short of that estimate.
S&P 500 Analyst Forecasts
Source: Birinyi Associates/WSJ
Asset Allocation Classes
A3
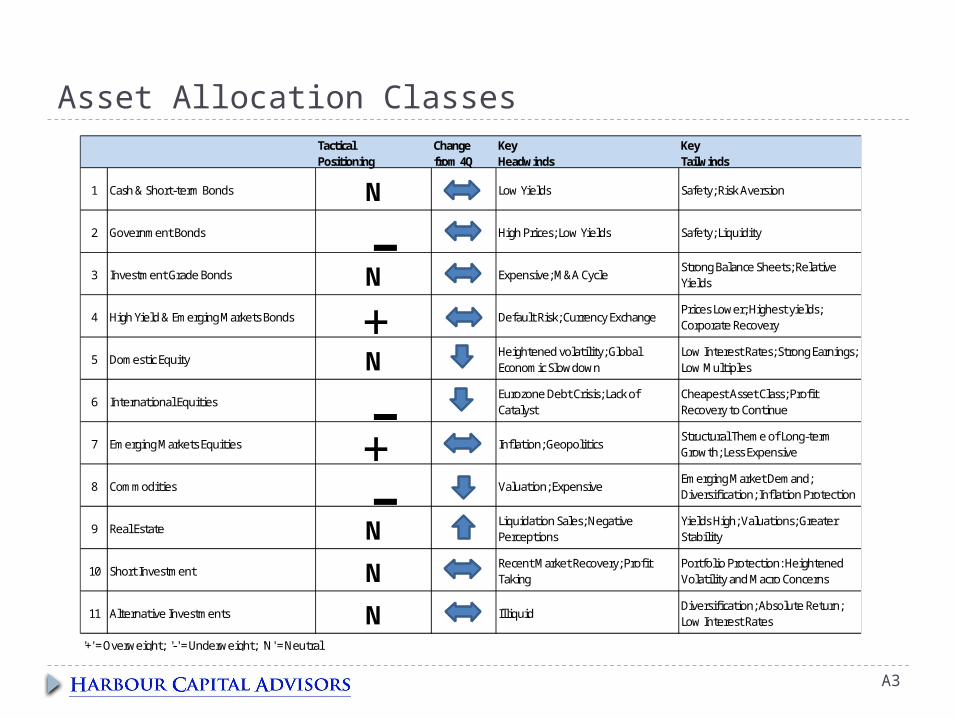
Tactical Change Key KeyPositioning from 4Q Headwinds Tailwinds
1 Cash & Short-term Bonds N Low Yields Safety; Risk Aversion
2 Government Bonds - High Prices; Low Yields Safety; Liquidity
3 Investment Grade Bonds N Expensive; M&A CycleStrong Balance Sheets; Relative Yields
4 High Yield & Emerging Markets Bonds + Default Risk; Currency ExchangePrices Lower; Highest yields; Corporate Recovery
5 Domestic Equity N Heightened volatility; Global Economic Slowdown
Low Interest Rates; Strong Earnings; Low Multiples
6 International Equities - Eurozone Debt Crisis; Lack of Catalyst
Cheapest Asset Class; Profit Recovery to Continue
7 Emerging Markets Equities + Inflation; Geopolitics Structural Theme of Long-term Growth; Less Expensive
8 Commodities - Valuation; ExpensiveEmerging Market Demand; Diversification; Inflation Protection
9 Real Estate N Liquidation Sales; Negative Perceptions
Yields High; Valuations; Greater Stability
10 Short Investment N Recent Market Recovery; Profit Taking
Portfolio Protection: Heightened Volatility and Macro Concerns
11 Alternative Investments N IlliquidDiversification; Absolute Return; Low Interest Rates
'+' = Overweight; '-' = Underweight; 'N' = Neutral
Economic Forecasts
A4
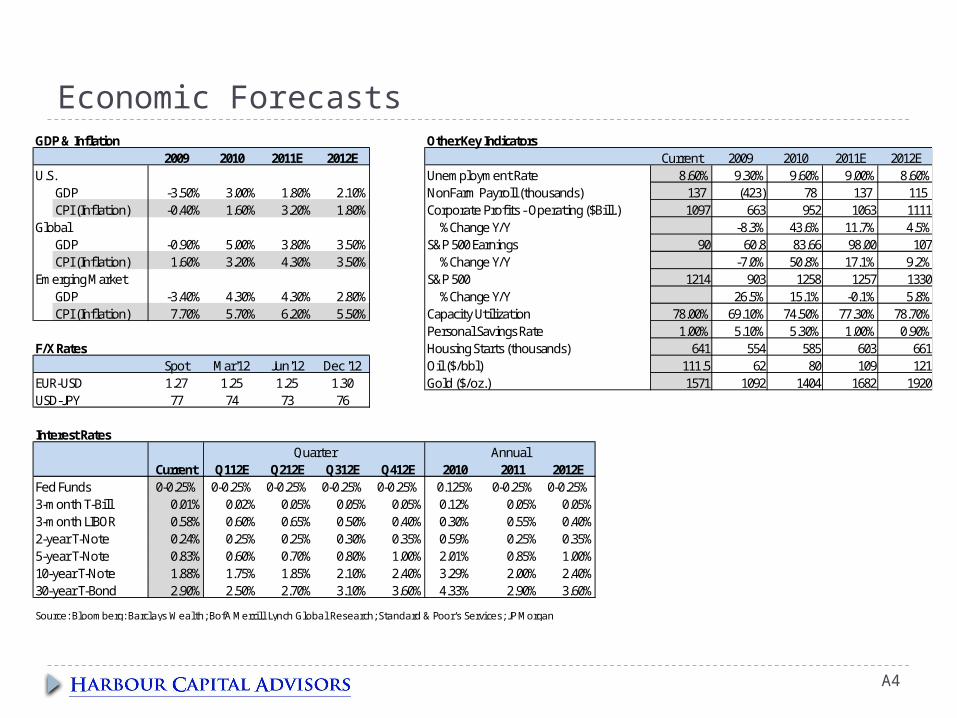
Other Key Indicators2009 2010 2011E 2012E Current 2009 2010 2011E 2012E
U.S. Unemployment Rate 8.60% 9.30% 9.60% 9.00% 8.60%GDP -3.50% 3.00% 1.80% 2.10% NonFarm Payroll (thousands) 137 (423) 78 137 115 CPI (Inflation) -0.40% 1.60% 3.20% 1.80% Corporate Profits - Operating ($Bill.) 1097 663 952 1063 1111
Global %Change Y/Y -8.3% 43.6% 11.7% 4.5%GDP -0.90% 5.00% 3.80% 3.50% S&P 500 Earnings 90 60.8 83.66 98.00 107CPI (Inflation) 1.60% 3.20% 4.30% 3.50% %Change Y/Y -7.0% 50.8% 17.1% 9.2%
Emerging Market S&P 500 1214 903 1258 1257 1330GDP -3.40% 4.30% 4.30% 2.80% %Change Y/Y 26.5% 15.1% -0.1% 5.8%CPI (Inflation) 7.70% 5.70% 6.20% 5.50% Capacity Utilization 78.00% 69.10% 74.50% 77.30% 78.70%
Personal Savings Rate 1.00% 5.10% 5.30% 1.00% 0.90%F/X Rates Housing Starts (thousands) 641 554 585 603 661
Spot Mar'12 Jun'12 Dec '12 Oil ($/bbl) 111.5 62 80 109 121EUR-USD 1.27 1.25 1.25 1.30 Gold ($/oz.) 1571 1092 1404 1682 1920USD-JPY 77 74 73 76
Interest Rates
Current Q112E Q212E Q312E Q412E 2011 2012EFed Funds 0-0.25% 0-0.25% 0-0.25% 0-0.25% 0-0.25% 0-0.25% 0-0.25%3-month T-Bill 0.01% 0.02% 0.05% 0.05% 0.05% 0.05% 0.05%3-month LIBOR 0.58% 0.60% 0.65% 0.50% 0.40% 0.55% 0.40%2-year T-Note 0.24% 0.25% 0.25% 0.30% 0.35% 0.25% 0.35%5-year T-Note 0.83% 0.60% 0.70% 0.80% 1.00% 0.85% 1.00%10-year T-Note 1.88% 1.75% 1.85% 2.10% 2.40% 2.00% 2.40%30-year T-Bond 2.90% 2.50% 2.70% 3.10% 3.60% 2.90% 3.60%
Source: Bloomberg: Barclays Wealth; BofA Merri l l Lynch Global Research; Standard & Poor's Services ; JP Morgan
4.33%
GDP & Inflation
Quarter
0.59%2.01%3.29%
Annual
0.30%0.12%0.125%
2010
Current Market Yields
Implementation
A5
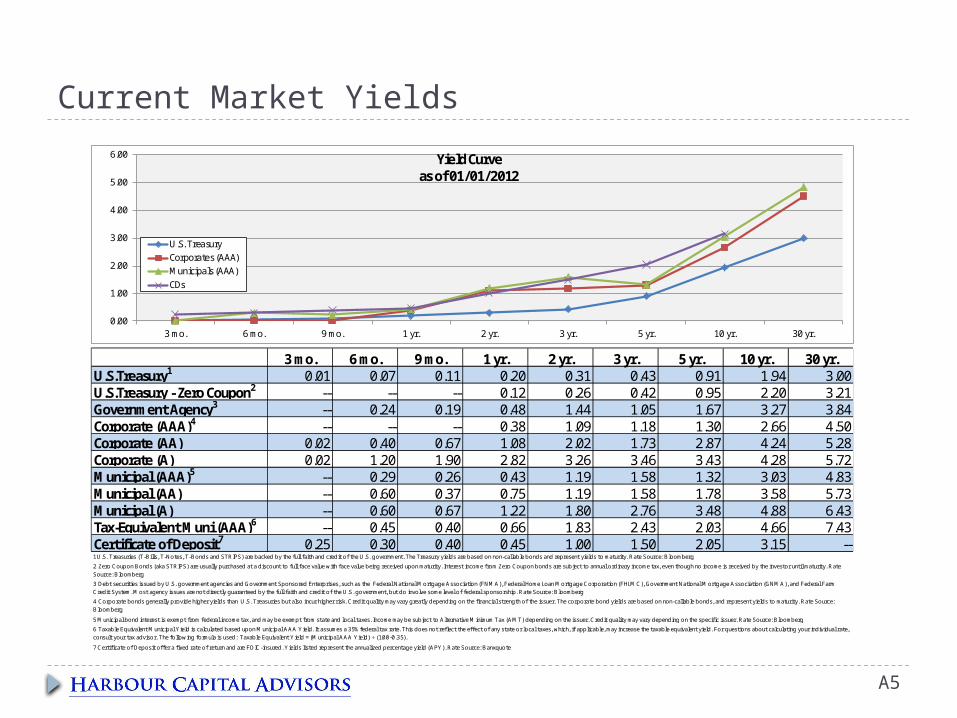
3 mo. 6 mo. 9 mo. 1 yr. 2 yr. 3 yr. 5 yr. 10 yr. 30 yr.U.S.Treasury1 0.01 0.07 0.11 0.20 0.31 0.43 0.91 1.94 3.00U.S.Treasury - Zero Coupon2 -- -- -- 0.12 0.26 0.42 0.95 2.20 3.21Government Agency3 -- 0.24 0.19 0.48 1.44 1.05 1.67 3.27 3.84Corporate (AAA)4 -- -- -- 0.38 1.09 1.18 1.30 2.66 4.50Corporate (AA) 0.02 0.40 0.67 1.08 2.02 1.73 2.87 4.24 5.28Corporate (A) 0.02 1.20 1.90 2.82 3.26 3.46 3.43 4.28 5.72Municipal (AAA)5 -- 0.29 0.26 0.43 1.19 1.58 1.32 3.03 4.83Municipal (AA) -- 0.60 0.37 0.75 1.19 1.58 1.78 3.58 5.73Municipal (A) -- 0.60 0.67 1.22 1.80 2.76 3.48 4.88 6.43Tax-Equivalent Muni (AAA)6 -- 0.45 0.40 0.66 1.83 2.43 2.03 4.66 7.43Certificate of Deposit7 0.25 0.30 0.40 0.45 1.00 1.50 2.05 3.15 --
7 Certificate of Deposit offer a fixed rate of return and are FDIC-insured. Y ields listed represent the annualized percentage yield (APY). Rate Source: Banxquote
1 U.S. Treasuries (T-Bills, T-Notes, T-Bonds and STRIPS) are backed by the full faith and credit of the U.S. government. The Treasury yields are based on non-callable bonds and represent yields to maturity. Rate Source: Bloomberg
2 Zero Coupon Bonds (aka STRIPS) are usually purchased at a discount to full face value with face value being received upon maturity. Interest income from Zero Coupon bonds are subject to annual ordinary income tax, even though no income is received by the investor until maturity. Rate Source: Bloomberg
3 Debt securities issued by U.S. government agencies and Government Sponsored Enterprises, such as the Federal National Mortgage Association (FNMA), Federal Home Loan Mortgage Corporation (FHLMC), Government National Mortgage Association (GNMA), and Federal Farm Credit System. Most agency issues are not directly guaranteed by the full faith and credit of the U.S. government, but do involve some level of federal sponsorship. Rate Source: Bloomberg
4 Corporate bonds generally provide higher yields than U.S. Treasuries but also incur higher risk. Credit quality may vary greatly depending on the financial strength of the issuer. The corporate bond yields are based on non-callable bonds, and represent yields to maturity. Rate Source: Bloomberg
5 Municipal bond interest is exempt from federal income tax, and may be exempt from state and local taxes. Income may be subject to Alternative Minimum Tax (AMT) depending on the issuer. Credit quality may vary depending on the specific issuer. Rate Source: Bloomberg
6 Taxable Equivalent Municipal Y ield is calculated based upon Municipal AAA Y ield. It assumes a 35% federal tax rate. This does not reflect the effect of any state or local taxes, which, if applicable, may increase the taxable equivalent yield. For questions about calculating your individual rate, consult your tax advisor. The following formula is used: Taxable Equivalent Y ield = (Municipal AAA Y ield) ÷ (1.00-0.35).
0.00
1.00
2.00
3.00
4.00
5.00
6.00
3 mo. 6 mo. 9 mo. 1 yr. 2 yr. 3 yr. 5 yr. 10 yr. 30 yr.
U.S. TreasuryCorporates (AAA)Municipals (AAA)CDs
Yield Curve as of 01/01/2012
Core Portfolio
Harbour Capital Advisors LLC A6
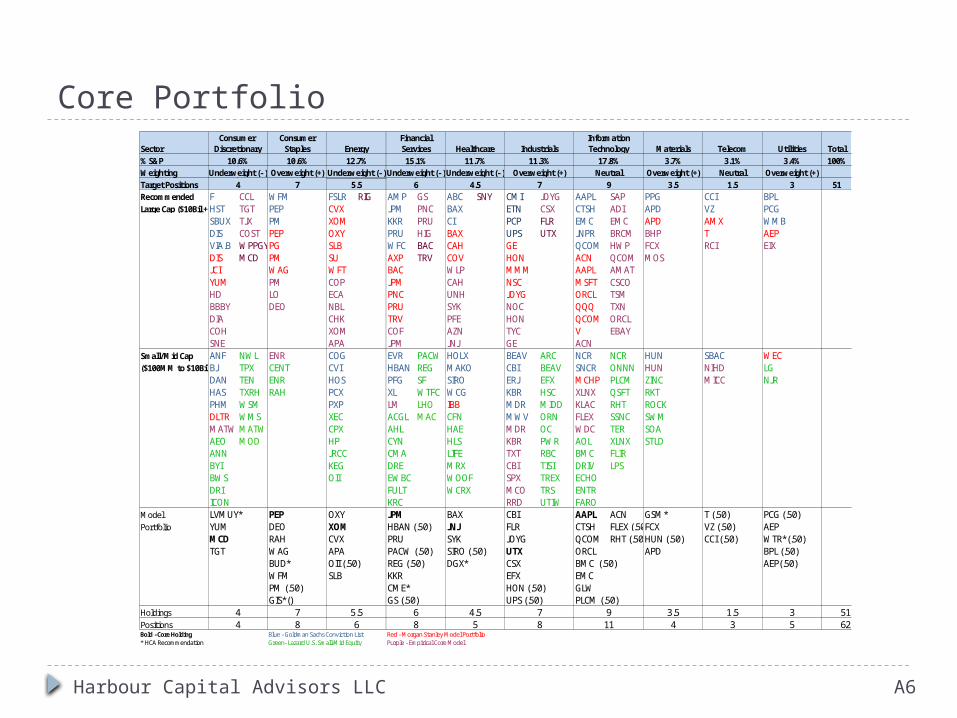
ConsumerSector Staples Materials Telecom Utilities Total% S&P 10.6% 3.7% 3.1% 3.4% 100%Weighting Overweight (+) Overweight (+) Neutral Overweight (+)Target Positions 7 3.5 1.5 3 51Recommended F CCL WFM FSLR RIG AMP GS ABC SNY CMI JOYG AAPL SAP PPG CCI BPLLarge Cap ($10Bil +)HST TGT PEP CVX JPM PNC BAX ETN CSX CTSH ADI APD VZ PCG
SBUX TJX PM XOM KKR PRU CI PCP FLR EMC EMC APD AMX WMBDIS COST PEP OXY PRU HIG BAX UPS UTX JNPR BRCM BHP T AEPVIA.B WPPGYPG SLB WFC BAC CAH GE QCOM HWP FCX RCI EIXDIS MCD PM SU AXP TRV COV HON ACN QCOM MOSJCI WAG WFT BAC WLP MMM AAPL AMATYUM PM COP JPM CAH NSC MSFT CSCOHD LO ECA PNC UNH JOYG ORCL TSMBBBY DEO NBL PRU SYK NOC QQQ TXNDIA CHK TRV PFE HON QCOM ORCLCOH XOM COF AZN TYC V EBAYSNE APA JPM JNJ GE ACN
Small/Mid Cap ANF NWL ENR COG EVR PACW HOLX BEAV ARC NCR NCR HUN SBAC WEC($100MM to $10Bil)BJ TPX CENT CVI HBAN REG MAKO CBI BEAV SNCR ONNN HUN NIHD LG
DAN TEN ENR HOS PFG SF SIRO ERJ EFX MCHP PLCM ZINC MICC NJRHAS TXRH RAH PCX XL WTFC WCG KBR HSC XLNX QSFT RKTPHM WSM PXP LM LHO IBB MDR MIDD KLAC RHT ROCKDLTR WMS XEC ACGL MAC CFN MWV ORN FLEX SSNC SWMMATW MATW CPX AHL HAE MDR OC WDC TER SOAAEO MOD HP CYN HLS KBR PWR AOL XLNX STLDANN JRCC CMA LIFE TXT RBC BMC FLIRBYI KEG DRE MRX CBI TISI DRIV LPSBWS OII EWBC WOOF SPX TREX ECHODRI FULT WCRX MCO TRS ENTRICON KRC RRD UTIW FARO
Model LVMUY* PEP OXY JPM BAX CBI AAPL ACN GSM* T (.50) PCG (.50)Portfolio YUM DEO XOM HBAN (.50) JNJ FLR CTSH FLEX (.50)FCX VZ (.50) AEP
MCD RAH CVX PRU SYK JOYG QCOM RHT (.50)HUN (.50) CCI (.50) WTR*(.50)TGT WAG APA PACW (.50) SIRO (.50) UTX ORCL APD BPL (.50)
BUD* OII (.50) REG (.50) DGX* CSX BMC (.50) AEP(.50)WFM SLB KKR EFX EMCPM (.50) CME* HON (.50) GLW GIS*() GS (.50) UPS (.50) PLCM (.50)
Holdings 7 3.5 1.5 3 51Positions 8 4 3 5 62Bold - Core Holding Blue - Goldman Sachs Conviction List Red - Morgan Stanley Model Portfolio* HCA Recommendation Green- Lazard U.S. Small-Mid Equity Purple - Empirical Core Model
78
911
9
InformationTechnology
17.8%Neutral
Industrials11.3%
Overweight (+)7
44
FinancialServices15.1%
Underweight (- )6
Consumer Discretionary
10.6%Underweight (- )
4
68
Energy12.7%
Underweight (- )5.5
5.56 5
4.5
Healthcare11.7%
Underweight (- )4.5

Thematic Investments
Harbour Capital Advisors LLC A7
Sector Overweights: Industrials, Technology and Materials are the more economically sensitive areas of the market and benefit from overseas demand. We expect to maintain this view for the first half of the year but will consider a more defensive view later in the year which is more reflective of the business cycle.
Income-producing Securities provide attractive yields and hedge against near-term equity market volatility. Initiate positions in Master Limited Partnerships (MLPs), Floating Rate Bank Notes, High Yield Bonds, and Preferred Stocks.
Rise of Cloud Computing: Life in the clouds means applications are based in remote internet data centers – not on your PC or local server. Technology spending will be devoted to network applications, IT security, and systems management.
With strong balance sheets and hoards of cash, US Capital Expenditure Acceleration will be in stark contrast to both the consumer and government sectors. Corporate balance sheets are in better shape than they’ve been in over half a century. Focus on the stock of companies increasing dividends and buying back their stock.
Several factors suggest a Domestic Manufacturing Renaissance, as overseas manufacturing jobs may be returning to the U.S. as wages in many emerging economies have been increasing and companies are more willing to reconsider the U.S. in order to gain greater reliability and reduce the risks associated with the loss of intellectual property.
Dividend-paying Stocks are attractive to those seeking income but also as a means to offset market volatility. Companies able to consistently increase dividend payouts signal stability and an ability to weather an economic soft patch.
Be Nimble, with a Safety Net. The need to be active is greater than ever in a volatile market. Consider resorting to regular, dynamic portfolio rebalancing to adjust to economic and market developments.

Contrarian Investments
Harbour Capital Advisors LLC A8
Execution of Short-interest Strategies focused on timely investment when perception is that the market is “over-bought.” The market increases 2/3 of the time. This means that there are times when the market is under pressure. Short-interest prospers in such times and allows for greater conviction with the “long” portion of the portfolio.
Real over nominal assets: The potential for higher inflation favors real assets and those that are inflation-protected. Commodities are a winner. Precious metals such as Gold and Silver also serve as safe havens in times of market turbulence. Second-derivative investments (miners) should also benefit from elevated metal prices.
Distressed and Deep-value investments have led us to look at opportunities in areas such as Precious Metals and Financial Services companies. These would represent relatively short-term, tactical investments focused on the tendency of the market to over-discount headline news.
While Japan’s economy continues its recovery process and expects limited growth of domestic demand, it has an enormous potential of benefiting from the increasing Asian consumption market, given that Asia now accounts for more than 50% of Japan’s total exports
Hedge against equity Market Volatility by investing in the VIX. In times of market distress and sell-off, markets tend to converge, increasing trading volume.
Short the Euro versus the U.S. Dollar: With the unsettled nature of European Sovereign credit, we believe investment in European exporters is appealing, but we would also look to hedge Euro Dollar exposure.
The prices of Natural Gas Companies have plummeted as the commodity has fallen to historical lows. Many believe that natural gas is now significantly undervalued and presents room for sizable upsize.
Related Documents