D1.2: Current marine pressures and mechanisms driving changes in marine habitats Marine Ecosystem Restoration in Changing European Seas MERCES Grant agreement n. 689518 COORDINATOR: UNIVPM LEAD BENEFICIARY: NUIG AUTHORS: Chris Smith, Thanos Dailianis, Nadia Papadopoulou, Vasilis Gerovasileiou, Katerina Sevastou (all HCMR), Anthony Grehan (NUIG), Dave Billett (DSES), Chris McOwen, (UNEP-WCMC), Teresa Amaro (CIIMAR), Tatjana Bakran-Petricioli (PMF-ZAGREB) Trine Bekkby, (NIVA), Meri Bilan (IMAR-UAz), Chris Boström (ÅAU), Marina Carriero-Silva (IMAR-UAz), Laura Carugati (UNIVPM), Emma Cebrian (UGIR), Carlo Cerrano (UNIVPM), Hartvig Christie (NIVA), Roberto Danovaro (UNIVPM), Elizabeth Grace Tunka Eronat (MCS), Dario Fiorentino (AWI), Simonetta Fraschetti (CONISMA), Karine Gagnon (ÅAU), Cristina Gambi (UNIVPM), Bernat Hereu (UB), Silvija Kipson (PMF-ZAGREB), Jonne Kotta (UTARTU), Cristina Linares (UB), Telmo Morato, (IMAR-UAz), Henn Ojaveer (UTARTU), Helen Orav-Kotta (UTARTU), Christopher Pham (IMAR-UAz), Eli Rinde (NIVA), Antonio Sarà (GAIA), Rachael Scrimgeour (UNEP-WCMC). SUBMISSION DATE: 25/05/17 DISSEMINATION LEVEL (e.g. Public) PU Public X CO Confidential, only for members of the consortium (including the Commission Services) WP 1 Deliverable 1.2

Welcome message from author
This document is posted to help you gain knowledge. Please leave a comment to let me know what you think about it! Share it to your friends and learn new things together.
Transcript
D1.2: Current marine pressures and mechanisms driving changes in
marine habitats
Marine Ecosystem Restoration in Changing European Seas MERCES
Grant agreement n. 689518
COORDINATOR: UNIVPM
LEAD BENEFICIARY: NUIG AUTHORS: Chris Smith, Thanos Dailianis, Nadia Papadopoulou, Vasilis Gerovasileiou, Katerina Sevastou (all HCMR), Anthony Grehan (NUIG), Dave Billett (DSES), Chris McOwen, (UNEP-WCMC), Teresa Amaro (CIIMAR), Tatjana Bakran-Petricioli (PMF-ZAGREB) Trine Bekkby, (NIVA), Meri Bilan (IMAR-UAz), Chris Boström (ÅAU), Marina Carriero-Silva (IMAR-UAz), Laura Carugati (UNIVPM), Emma Cebrian (UGIR), Carlo Cerrano (UNIVPM), Hartvig Christie (NIVA), Roberto Danovaro (UNIVPM), Elizabeth Grace Tunka Eronat (MCS), Dario Fiorentino (AWI), Simonetta Fraschetti (CONISMA), Karine Gagnon (ÅAU), Cristina Gambi (UNIVPM), Bernat Hereu (UB), Silvija Kipson (PMF-ZAGREB), Jonne Kotta (UTARTU), Cristina Linares (UB), Telmo Morato, (IMAR-UAz), Henn Ojaveer (UTARTU), Helen Orav-Kotta (UTARTU), Christopher Pham (IMAR-UAz), Eli Rinde (NIVA), Antonio Sarà (GAIA), Rachael Scrimgeour (UNEP-WCMC). SUBMISSION DATE: 25/05/17
DISSEMINATION LEVEL
(e.g. Public)
PU Public X CO Confidential, only for members of the consortium
(including the Commission Services)
WP 1 Deliverable 1.2
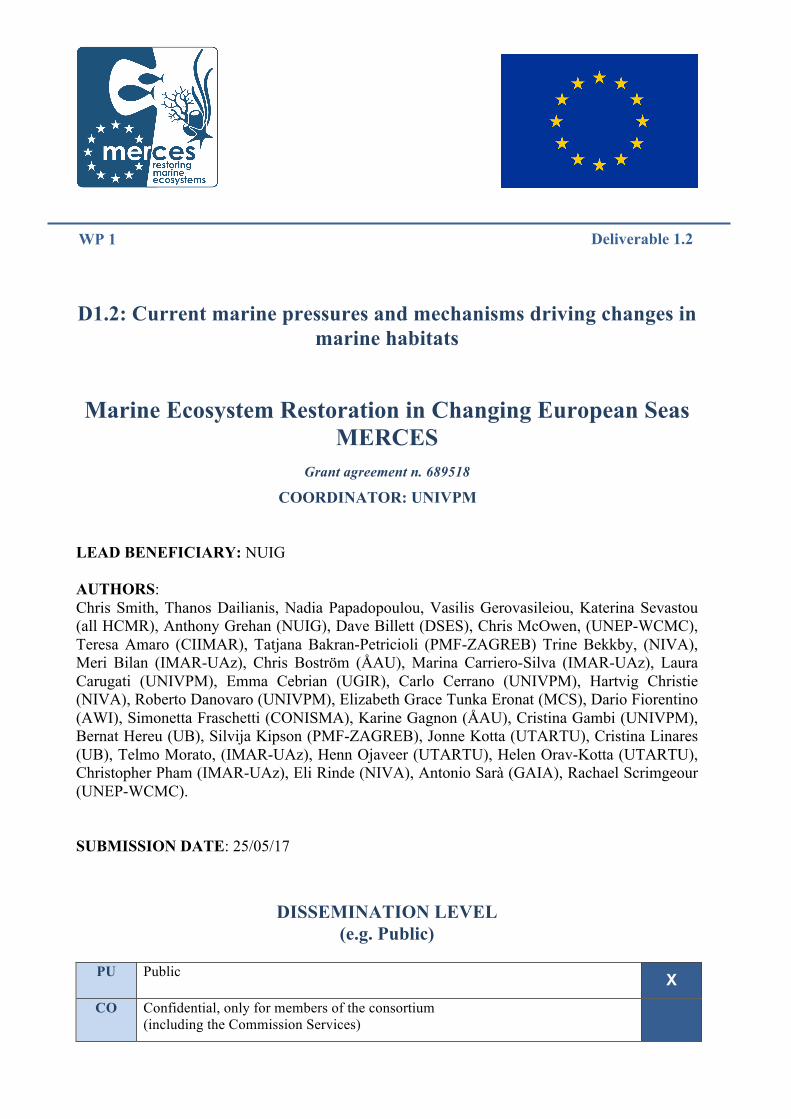
Typical coastal activities – aquaculture and oil and gas shore infrastructure in Saronikos Gulf, Greece. Photo by © Chris Smith.
Citation
Smith, C.J., Dailianis, T., Papadopoulou, K-N., Gerovasileiou, V., Sevastou, K., Grehan, A., Billett, B., McOwen, C., Amaro, T., Bakran-Petricioli, T., Bekkby, T., Bilan, M., Boström, C., Carriero-Silva, M., Carugati, L., Cebrian, E., Cerrano, C., Christie, H., Danovaro, R., Eronat, E.G.T., Fiorentino, D., Fraschetti, S., Gagnon, K., Gambi, C., Hereu, B., Kipson, S., Kotta, J., Linares, C., Morato, T., Ojaveer, H., Orav-Kotta, H., Pham, C.K., Rinde, E., Sarà, A., Scrimgeour, R. (2017) Current marine pressures and mechanisms driving changes in marine habitats. Deliverable 1.2, MERCES Project. 102 pp, incl. 2 Annexes.
Acknowledgments
The authors would like to thank James Aronson (CCSD, Missouri Botanical Garden), Steve Fletcher (UNEP-WCMC), Eleni Hatziyanni (Region of Crete), David Johnson (Seascape Consultants Ltd.) and Chiara Piroddi (ICM-CSIC), for commenting on and improving content of this report. This project has received funding from the European Union’s Horizon 2020 research and innovation programme under grant agreement No 689518.
MERCES – D1.2. Activities and Pressures in Marine Habitats 1
Summary
Human activities and the resultant pressures they place on the marine environment have been
widely demonstrated to contribute to habitat degradation, therefore, their identification and
quantification is an essential step towards any meaningful restoration effort. The overall scope of
MERCES Deliverable 1.2 is to review current knowledge regarding the major marine pressures
placed upon marine ecosystems in EU waters and the mechanisms by which they impact habitats
in order to determine potential restoration pathways. An understanding of their geographical
distribution is critical for any local assessment of degradation, as well as for planning
conservation and restoration actions. This information would ideally be in the form of maps,
which: (a) compile single or multiple activities and pressures over broad scales, integrating and
visualizing available data and allowing direct identification of aggregations as well as gaps and
(b) may be overlaid with habitat maps (or any other map layer containing additional
information), thus combining different data levels and producing new information to be used for
example when implementing EU policies. The deliverable also documents typical example
habitat case studies, the prominent impacts and consequences of activities and pressures towards
the identification of possible restoration or mitigation actions. Finally the deliverable discusses
pressures, assessments, marine spatial planning and blue growth potential.
Activities and pressures are used in a strict sense, where marine activities are undertaken to
satisfy the needs of societal drivers (e.g. aquaculture or tourism) and pressures are considered to
be the mechanism through which an activity has an actual or potential effect on any part of the
ecosystem (e.g. for demersal trawling activity, one pressure would be abrasion of the seabed).
Habitats are addressed using a nested approach from large-scale geological features (e.g. shallow
soft bottoms) to species-characterised habitats (e.g. Posidonia meadows) because of the way
they are referred to in current policy documents which lack standard and precise definitions.
MERCES Pressure Catalogue
The MERCES Pressures catalogue was compiled from a semi-structured literature search using
specific keywords and combinations. The catalogue consists of 264 entries, with 67 columns of
associated data. Entries include published documents, web resources, and grey literature and are
mostly in the form of simple images, but 5% of the entries concerned shapefiles where data can
be directly shared for other applications. The majority of entries were for the Mediterranean Sea

2 MERCES – D1.1. Marine habitats and degraded habitats
and North-East Atlantic. The activity/pressure entries were mostly broad-scale (regional sea,
national), with lesser numbers of entries for specific habitat classes. Map resources were
screened for a total of 13 types of activities and 34 pressures. Fisheries, coastal marine
infrastructure and transport were the most featured activities with respect to the broad scale maps
and were consistent across the regional seas. Aquaculture and tourism ranked high for the
sublittoral habitat and research/conservation for the deep-sea entries. Chemical pressures (inputs
of various substances) and biological invasions ranked high at the broad scale, followed by litter,
abrasion and extraction of species. These last three pressures seem to be the most frequently
mapped pressures in deep-sea records.
Map availability depended on geographical area, research efforts and more obvious activities or
pressures. The Black Sea had the least resources, but it is being supported in new projects
towards spatial management; this applies to a lesser extent to southern Mediterranean Sea areas.
Current EU directives and related research projects (e.g., MSFD, HD, MSP directives;
EMODnet, BENTHIS, ADRIPLAN, MEDTRENDS) are driving the mapping process, as well as
some national initiatives through the publication of marine atlases.
Maps vary in their use from positioning of point sources (aquaculture farm sites, oil platforms),
continuous cables/pipelines, to general areas where an activity takes place (e.g.,
trawling/shipping maps) or might take place (e.g., MSP zoning/maps, oil and gas exploration
blocks). Pressure maps may be more specific as an activity may not necessarily lead to a related
pressure, however, many broad scale pressure maps may be interpolative/modelled (e.g.,
cumulative impacts maps), or the pressure map may just indicate where an incidence has been
noted without information in other adjacent areas.
The limitations and gaps revealed by the review included; a large proportion of resources
concerned static data (simple images, static in time, that have a limited use beyond that
reference), spatial resolution (most maps are broad scale with unreliable information at the local
scale – also containing modelled/interpolated data lacking validation), geographic coverage
(under-representation in some regional and sub-regional areas and over-representation in others),
and hard to find information (grey literature). It is recommended that future mapping initiatives
should focus on: new georeferenced data (digital maps in open-access format), filling knowledge
gaps (addressing geographical and temporal gaps and supporting regional/national initiatives)
and gaining high levels of standardisation (through involvement of
transnational/intergovernmental organisations).
MERCES – D1.2. Activities and Pressures in Marine Habitats 3
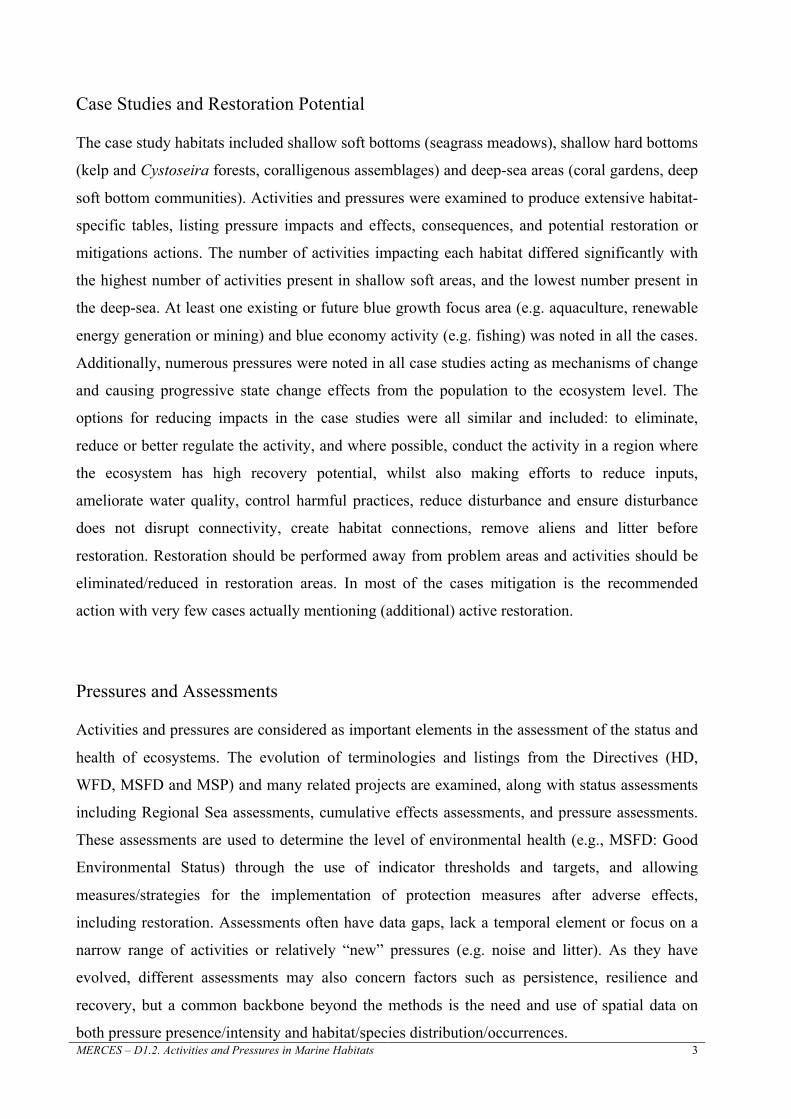
Case Studies and Restoration Potential
The case study habitats included shallow soft bottoms (seagrass meadows), shallow hard bottoms
(kelp and Cystoseira forests, coralligenous assemblages) and deep-sea areas (coral gardens, deep
soft bottom communities). Activities and pressures were examined to produce extensive habitat-
specific tables, listing pressure impacts and effects, consequences, and potential restoration or
mitigations actions. The number of activities impacting each habitat differed significantly with
the highest number of activities present in shallow soft areas, and the lowest number present in
the deep-sea. At least one existing or future blue growth focus area (e.g. aquaculture, renewable
energy generation or mining) and blue economy activity (e.g. fishing) was noted in all the cases.
Additionally, numerous pressures were noted in all case studies acting as mechanisms of change
and causing progressive state change effects from the population to the ecosystem level. The
options for reducing impacts in the case studies were all similar and included: to eliminate,
reduce or better regulate the activity, and where possible, conduct the activity in a region where
the ecosystem has high recovery potential, whilst also making efforts to reduce inputs,
ameliorate water quality, control harmful practices, reduce disturbance and ensure disturbance
does not disrupt connectivity, create habitat connections, remove aliens and litter before
restoration. Restoration should be performed away from problem areas and activities should be
eliminated/reduced in restoration areas. In most of the cases mitigation is the recommended
action with very few cases actually mentioning (additional) active restoration.
Pressures and Assessments
Activities and pressures are considered as important elements in the assessment of the status and
health of ecosystems. The evolution of terminologies and listings from the Directives (HD,
WFD, MSFD and MSP) and many related projects are examined, along with status assessments
including Regional Sea assessments, cumulative effects assessments, and pressure assessments.
These assessments are used to determine the level of environmental health (e.g., MSFD: Good
Environmental Status) through the use of indicator thresholds and targets, and allowing
measures/strategies for the implementation of protection measures after adverse effects,
including restoration. Assessments often have data gaps, lack a temporal element or focus on a
narrow range of activities or relatively “new” pressures (e.g. noise and litter). As they have
evolved, different assessments may also concern factors such as persistence, resilience and
recovery, but a common backbone beyond the methods is the need and use of spatial data on
both pressure presence/intensity and habitat/species distribution/occurrences.
4 MERCES – D1.1. Marine habitats and degraded habitats
Potential for Restoration and Blue Growth
MSP provides a means of setting boundaries for spatially managed areas, for which it is essential
to have a knowledge of the footprint of human activities and their pressures. It can also facilitate
restoration initiatives by providing an appropriate zoning mechanism that will support continued
economic activity while ensuring Good Environmental Status and thus sustainable ‘Blue
Growth’. Indeed, restoration areas may well be one of the tools in the ‘toolkit’ of managers
tasked with maritime spatial planning. The identification of activities and pressure hot spots is
crucial for planning future restoration actions. Mitigation of pressures and removal of their
impacts at sites where restoration activities take place would also enable the quicker recovery of
the given habitat.
Ecosystems provide us with goods and services that can be considered under the term Natural
Capital. Their values can be monetised and integrated into a national accounting system to
manage natural capital. Big business is beginning to adopt Corporate Natural Capital Accounting
methods to balance business against environmental offsets, the latter through, for example,
carbon sequestration, recreation or biodiversity. Biodiversity offsetting and habitat banking
could potentially provide mitigation or compensation measures for impacts. The restoration of
degraded marine ecosystems can often be seen as a cost in business planning, but recently
greater awareness by businesses of ecosystem services has led to new business opportunities
from restoration activities. Businesses, after Environmental Impact Assessments, are trying first
to avoid pressures, devise civil and ecological engineering solutions to minimise adverse
impacts, or where degradation cannot be avoided, to take direct restorative actions – this may be
in the form of carbon trading initiatives (e.g. carbon sequestration by planting marine plants –
which also offsets climate change), flood defence (coastal building/management) or Corporate
Social Responsibility (deep sea mining and experimental restoration). There are business
opportunities for knowledge-based companies and consultancies to assess ecosystem goods and
services, plan for sustainable development and, where ecosystems have been degraded, invent
simple and cost-effective solutions to kick start and speed up natural recolonisation processes.
They can also advise on the role of marine ecosystem restoration for future carbon markets and
carbon trading.
MERCES – D1.2. Activities and Pressures in Marine Habitats 5
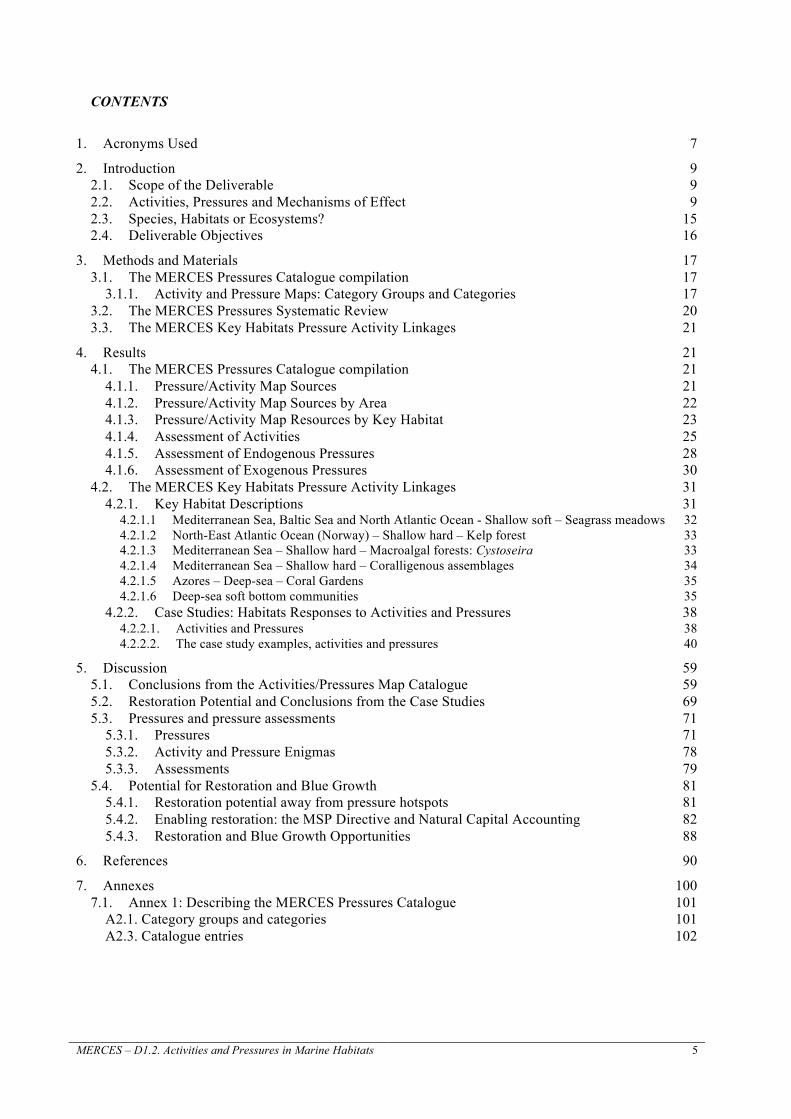
CONTENTS
1. Acronyms Used 7 2. Introduction 9
2.1. Scope of the Deliverable 9 2.2. Activities, Pressures and Mechanisms of Effect 9 2.3. Species, Habitats or Ecosystems? 15 2.4. Deliverable Objectives 16
3. Methods and Materials 17 3.1. The MERCES Pressures Catalogue compilation 17
3.1.1. Activity and Pressure Maps: Category Groups and Categories 17 3.2. The MERCES Pressures Systematic Review 20 3.3. The MERCES Key Habitats Pressure Activity Linkages 21
4. Results 21 4.1. The MERCES Pressures Catalogue compilation 21
4.1.1. Pressure/Activity Map Sources 21 4.1.2. Pressure/Activity Map Sources by Area 22 4.1.3. Pressure/Activity Map Resources by Key Habitat 23 4.1.4. Assessment of Activities 25 4.1.5. Assessment of Endogenous Pressures 28 4.1.6. Assessment of Exogenous Pressures 30
4.2. The MERCES Key Habitats Pressure Activity Linkages 31 4.2.1. Key Habitat Descriptions 31
4.2.1.1 Mediterranean Sea, Baltic Sea and North Atlantic Ocean - Shallow soft – Seagrass meadows 32 4.2.1.2 North-East Atlantic Ocean (Norway) – Shallow hard – Kelp forest 33 4.2.1.3 Mediterranean Sea – Shallow hard – Macroalgal forests: Cystoseira 33 4.2.1.4 Mediterranean Sea – Shallow hard – Coralligenous assemblages 34 4.2.1.5 Azores – Deep-sea – Coral Gardens 35 4.2.1.6 Deep-sea soft bottom communities 35
4.2.2. Case Studies: Habitats Responses to Activities and Pressures 38 4.2.2.1. Activities and Pressures 38 4.2.2.2. The case study examples, activities and pressures 40
5. Discussion 59 5.1. Conclusions from the Activities/Pressures Map Catalogue 59 5.2. Restoration Potential and Conclusions from the Case Studies 69 5.3. Pressures and pressure assessments 71
5.3.1. Pressures 71 5.3.2. Activity and Pressure Enigmas 78 5.3.3. Assessments 79
5.4. Potential for Restoration and Blue Growth 81 5.4.1. Restoration potential away from pressure hotspots 81 5.4.2. Enabling restoration: the MSP Directive and Natural Capital Accounting 82 5.4.3. Restoration and Blue Growth Opportunities 88
6. References 90 7. Annexes 100
7.1. Annex 1: Describing the MERCES Pressures Catalogue 101 A2.1. Category groups and categories 101 A2.3. Catalogue entries 102

6 MERCES – D1.1. Marine habitats and degraded habitats

MERCES – D1.2. Activities and Pressures in Marine Habitats 7
1. Acronyms Used
Acronyms AIS Automatic Identification System BALTIC Baltic Sea BLACK Black Sea CBD Convention on Biological Diversity CO2 Carbon dioxide CPIA Cumulative pressure and impact assessments CWC Cold water coral DPSIR Driving Force-Pressure-State-Impact-Response framework EC European Commission EEA European Environmental Agency EIA Environmental Impact Assessment EU European Union EUNIS European nature information system EEZ Exclusive Economic Zone EMODnet European Marine Observation and Data Network FAO Food and Agriculture Organisation of the United Nations GES Good Environmental Status GIS Geographic Information System HD Habitats Directive HELCOM Helsinki Commission (Baltic Marine Environment Protection Commission) IUCN International Union for Conservation of Nature MAP Mediterranean Action Plan (UNEP) MarLIN Marine Life Information Network (UK) MED Mediterranean Sea MSFD Marine Strategy Framework Directive MSP Marine Spatial Planning Directive NEA North-East Atlantic NIS Non-indigenous species NGO Non-governmental organisation OCEANA Ocean Conservation non-governmental organisation set up by the Pew Trust OSPAR Oslo and Paris Commissions (Commission for the Protection of the Marine
Environment of the North-East Atlantic) OTHER Other Regional Sea pH A figure expressing the acidity or alkalinity of a solution on a logarithmic scale. RAC/SPA Regional Activity Centre for Spatially Protected Areas (UNEP) ROV Remotely Operated Vehicle RSC Regional Sea Convention SCOPUS Abstract and citation database of peer-reviewed literature SLR Sea Level Rise SME Small and medium sized-enterprise SST Sea Surface Temperature UNEP United Nations Environment Programme VMS Vessel Monitoring System WFD Waters Framework Directive WoS Web of Science WWF World Wildlife Fund for Nature
8 MERCES – D1.1. Marine habitats and degraded habitats
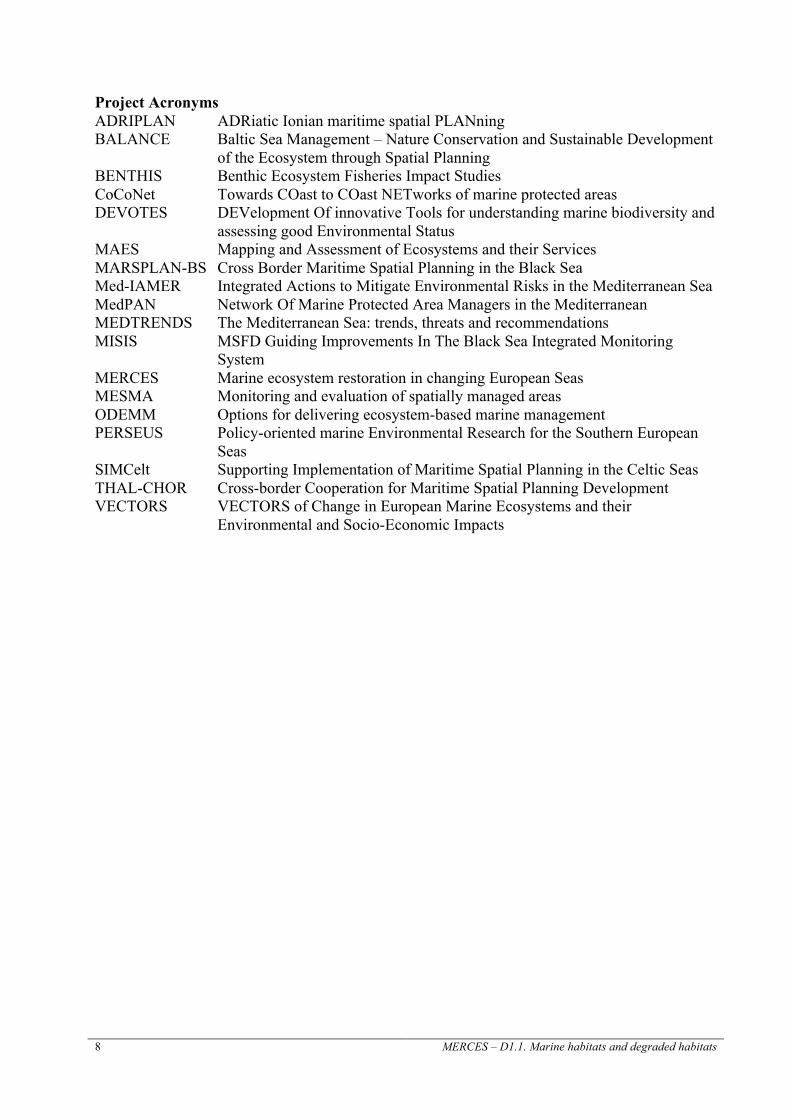
Project Acronyms ADRIPLAN ADRiatic Ionian maritime spatial PLANning BALANCE Baltic Sea Management – Nature Conservation and Sustainable Development
of the Ecosystem through Spatial Planning BENTHIS Benthic Ecosystem Fisheries Impact Studies CoCoNet Towards COast to COast NETworks of marine protected areas DEVOTES DEVelopment Of innovative Tools for understanding marine biodiversity and
assessing good Environmental Status MAES Mapping and Assessment of Ecosystems and their Services MARSPLAN-BS Cross Border Maritime Spatial Planning in the Black Sea Med-IAMER Integrated Actions to Mitigate Environmental Risks in the Mediterranean Sea MedPAN Network Of Marine Protected Area Managers in the Mediterranean MEDTRENDS The Mediterranean Sea: trends, threats and recommendations MISIS MSFD Guiding Improvements In The Black Sea Integrated Monitoring
System MERCES Marine ecosystem restoration in changing European Seas MESMA Monitoring and evaluation of spatially managed areas ODEMM Options for delivering ecosystem-based marine management PERSEUS Policy-oriented marine Environmental Research for the Southern European
Seas SIMCelt Supporting Implementation of Maritime Spatial Planning in the Celtic Seas THAL-CHOR Cross-border Cooperation for Maritime Spatial Planning Development VECTORS VECTORS of Change in European Marine Ecosystems and their
Environmental and Socio-Economic Impacts
MERCES – D1.2. Activities and Pressures in Marine Habitats 9
2. Introduction
2.1. Scope of the Deliverable
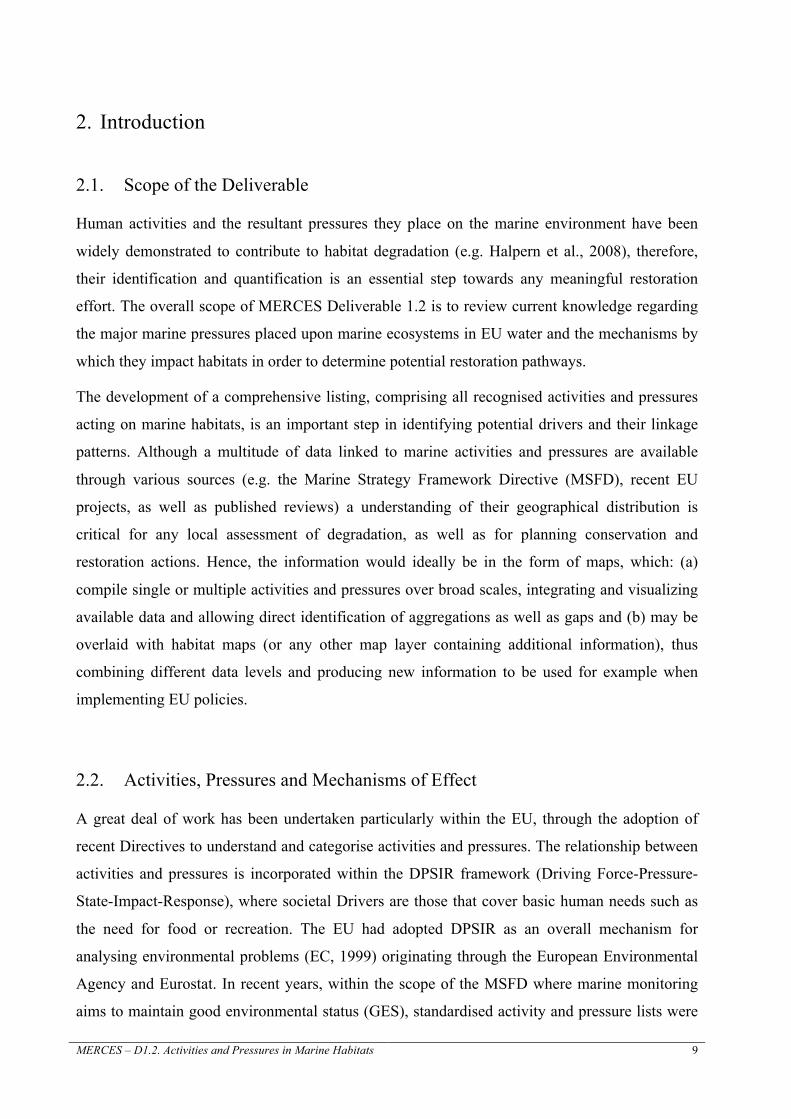
Human activities and the resultant pressures they place on the marine environment have been
widely demonstrated to contribute to habitat degradation (e.g. Halpern et al., 2008), therefore,
their identification and quantification is an essential step towards any meaningful restoration
effort. The overall scope of MERCES Deliverable 1.2 is to review current knowledge regarding
the major marine pressures placed upon marine ecosystems in EU water and the mechanisms by
which they impact habitats in order to determine potential restoration pathways.
The development of a comprehensive listing, comprising all recognised activities and pressures
acting on marine habitats, is an important step in identifying potential drivers and their linkage
patterns. Although a multitude of data linked to marine activities and pressures are available
through various sources (e.g. the Marine Strategy Framework Directive (MSFD), recent EU
projects, as well as published reviews) a understanding of their geographical distribution is
critical for any local assessment of degradation, as well as for planning conservation and
restoration actions. Hence, the information would ideally be in the form of maps, which: (a)
compile single or multiple activities and pressures over broad scales, integrating and visualizing
available data and allowing direct identification of aggregations as well as gaps and (b) may be
overlaid with habitat maps (or any other map layer containing additional information), thus
combining different data levels and producing new information to be used for example when
implementing EU policies.
2.2. Activities, Pressures and Mechanisms of Effect
A great deal of work has been undertaken particularly within the EU, through the adoption of
recent Directives to understand and categorise activities and pressures. The relationship between
activities and pressures is incorporated within the DPSIR framework (Driving Force-Pressure-
State-Impact-Response), where societal Drivers are those that cover basic human needs such as
the need for food or recreation. The EU had adopted DPSIR as an overall mechanism for
analysing environmental problems (EC, 1999) originating through the European Environmental
Agency and Eurostat. In recent years, within the scope of the MSFD where marine monitoring
aims to maintain good environmental status (GES), standardised activity and pressure lists were
10 MERCES – D1.1. Marine habitats and degraded habitats
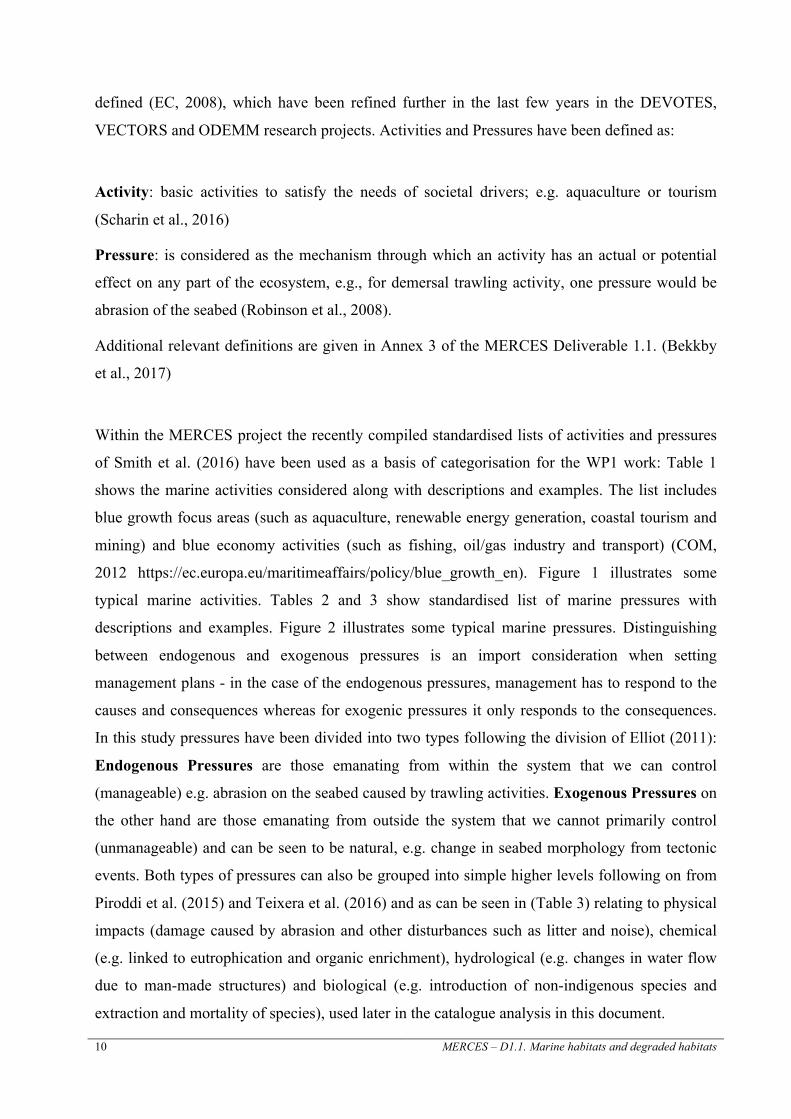
defined (EC, 2008), which have been refined further in the last few years in the DEVOTES,
VECTORS and ODEMM research projects. Activities and Pressures have been defined as:
Activity: basic activities to satisfy the needs of societal drivers; e.g. aquaculture or tourism
(Scharin et al., 2016)
Pressure: is considered as the mechanism through which an activity has an actual or potential
effect on any part of the ecosystem, e.g., for demersal trawling activity, one pressure would be
abrasion of the seabed (Robinson et al., 2008).
Additional relevant definitions are given in Annex 3 of the MERCES Deliverable 1.1. (Bekkby
et al., 2017)
Within the MERCES project the recently compiled standardised lists of activities and pressures
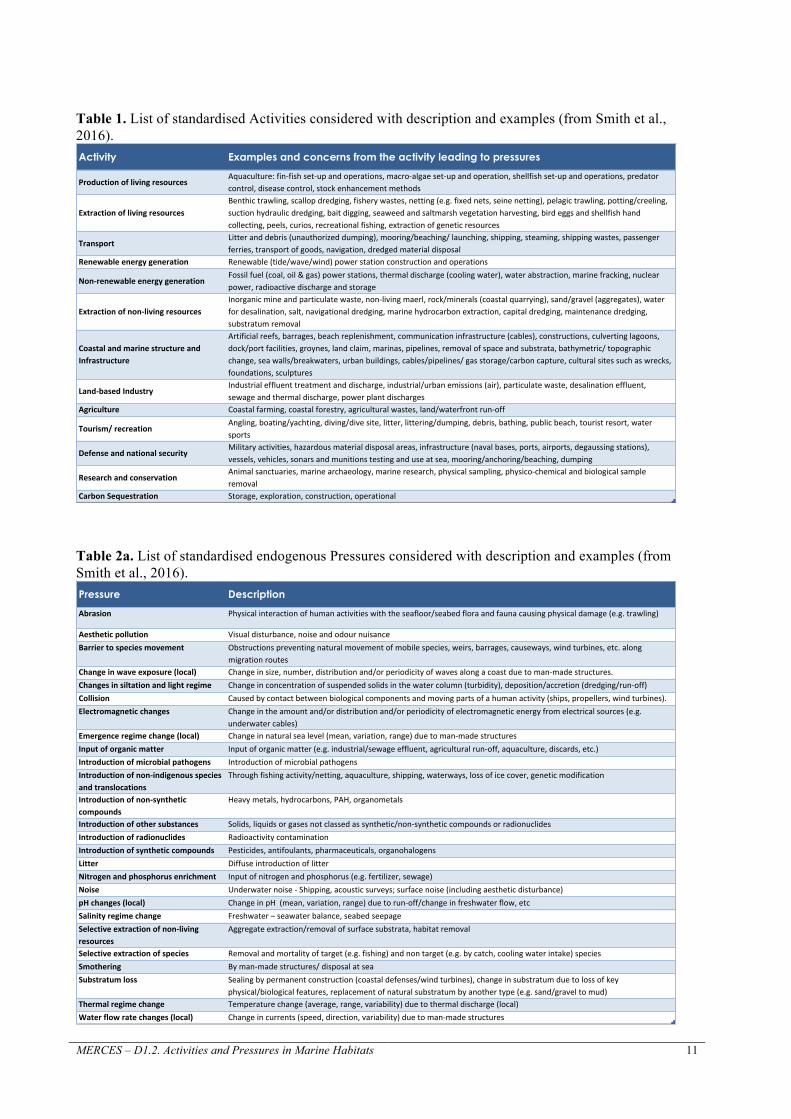
of Smith et al. (2016) have been used as a basis of categorisation for the WP1 work: Table 1
shows the marine activities considered along with descriptions and examples. The list includes
blue growth focus areas (such as aquaculture, renewable energy generation, coastal tourism and
mining) and blue economy activities (such as fishing, oil/gas industry and transport) (COM,
2012 https://ec.europa.eu/maritimeaffairs/policy/blue_growth_en). Figure 1 illustrates some
typical marine activities. Tables 2 and 3 show standardised list of marine pressures with
descriptions and examples. Figure 2 illustrates some typical marine pressures. Distinguishing
between endogenous and exogenous pressures is an import consideration when setting
management plans - in the case of the endogenous pressures, management has to respond to the
causes and consequences whereas for exogenic pressures it only responds to the consequences.
In this study pressures have been divided into two types following the division of Elliot (2011):
Endogenous Pressures are those emanating from within the system that we can control
(manageable) e.g. abrasion on the seabed caused by trawling activities. Exogenous Pressures on
the other hand are those emanating from outside the system that we cannot primarily control
(unmanageable) and can be seen to be natural, e.g. change in seabed morphology from tectonic
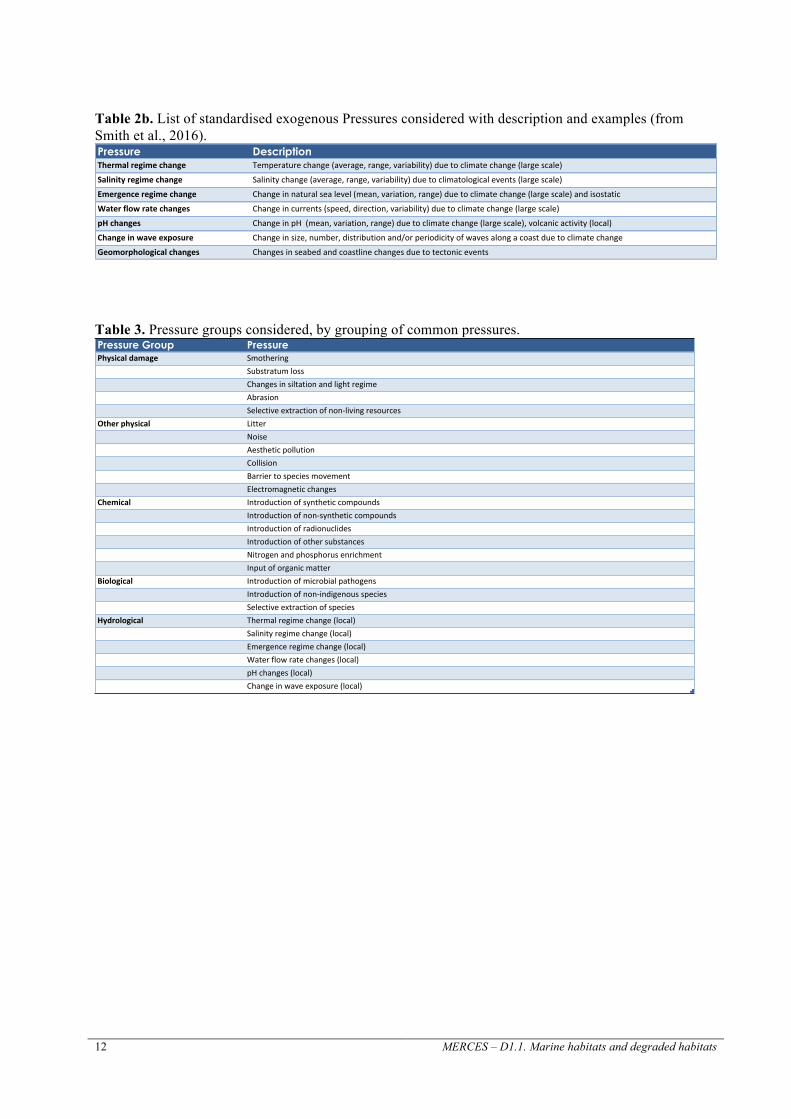
events. Both types of pressures can also be grouped into simple higher levels following on from
Piroddi et al. (2015) and Teixera et al. (2016) and as can be seen in (Table 3) relating to physical
impacts (damage caused by abrasion and other disturbances such as litter and noise), chemical
(e.g. linked to eutrophication and organic enrichment), hydrological (e.g. changes in water flow
due to man-made structures) and biological (e.g. introduction of non-indigenous species and
extraction and mortality of species), used later in the catalogue analysis in this document.
MERCES – D1.2. Activities and Pressures in Marine Habitats 11
Table 1. List of standardised Activities considered with description and examples (from Smith et al., 2016).
Table 2a. List of standardised endogenous Pressures considered with description and examples (from Smith et al., 2016).
Activity Examples and concerns from the activity leading to pressures
Production*of*living*resourcesAquaculture:+fin/fish+set/up+and+operations,+macro/algae+set/up+and+operation,+shellfish+set/up+and+operations,+predator+control,+disease+control,+stock+enhancement+methods
Extraction*of*living*resourcesBenthic+trawling,+scallop+dredging,+fishery+wastes,+netting+(e.g.+fixed+nets,+seine+netting),+pelagic+trawling,+potting/creeling,+suction+hydraulic+dredging,+bait+digging,+seaweed+and+saltmarsh+vegetation+harvesting,+bird+eggs+and+shellfish+hand+collecting,+peels,+curios,+recreational+fishing,+extraction+of+genetic+resources
Transport*Litter+and+debris+(unauthorized+dumping),+mooring/beaching/+launching,+shipping,+steaming,+shipping+wastes,+passenger+ferries,+transport+of+goods,+navigation,+dredged+material+disposal
Renewable*energy*generation Renewable+(tide/wave/wind)+power+station+construction+and+operations
Non;renewable*energy*generationFossil+fuel+(coal,+oil+&+gas)+power+stations,+thermal+discharge+(cooling+water),+water+abstraction,+marine+fracking,+nuclear+power,+radioactive+discharge+and+storage
Extraction*of*non;living*resources*Inorganic+mine+and+particulate+waste,+non/living+maerl,+rock/minerals+(coastal+quarrying),+sand/gravel+(aggregates),+water+for+desalination,+salt,+navigational+dredging,+marine+hydrocarbon+extraction,+capital+dredging,+maintenance+dredging,+substratum+removal
Coastal*and*marine*structure*and*Infrastructure
Artificial+reefs,+barrages,+beach+replenishment,+communication+infrastructure+(cables),+constructions,+culverting+lagoons,+dock/port+facilities,+groynes,+land+claim,+marinas,+pipelines,+removal+of+space+and+substrata,+bathymetric/+topographic+change,+sea+walls/breakwaters,+urban+buildings,+cables/pipelines/+gas+storage/carbon+capture,+cultural+sites+such+as+wrecks,+foundations,+sculptures
Land;based*IndustryIndustrial+effluent+treatment+and+discharge,+industrial/urban+emissions+(air),+particulate+waste,+desalination+effluent,+sewage+and+thermal+discharge,+power+plant+discharges
Agriculture Coastal+farming,+coastal+forestry,+agricultural+wastes,+land/waterfront+run/off
Tourism/*recreationAngling,+boating/yachting,+diving/dive+site,+litter,+littering/dumping,+debris,+bathing,+public+beach,+tourist+resort,+water+sports
Defense*and*national*securityMilitary+activities,+hazardous+material+disposal+areas,+infrastructure+(naval+bases,+ports,+airports,+degaussing+stations),+vessels,+vehicles,+sonars+and+munitions+testing+and+use+at+sea,+mooring/anchoring/beaching,+dumping
Research*and*conservationAnimal+sanctuaries,+marine+archaeology,+marine+research,+physical+sampling,+physico/chemical+and+biological+sample+removal
Carbon*Sequestration Storage,+exploration,+construction,+operational
Pressure Description
Abrasion Physical)interaction)of)human)activities)with)the)seafloor/seabed)flora)and)fauna)causing)physical)damage)(e.g.)trawling)
Aesthetic-pollution Visual)disturbance,)noise)and)odour)nuisanceBarrier-to-species-movement- Obstructions)preventing)natural)movement)of)mobile)species,)weirs,)barrages,)causeways,)wind)turbines,)etc.)along)
migration)routesChange-in-wave-exposure-(local) Change)in)size,)number,)distribution)and/or)periodicity)of)waves)along)a)coast)due)to)manAmade)structures.Changes-in-siltation-and-light-regime Change)in)concentration)of)suspended)solids)in)the)water)column)(turbidity),)deposition/accretion)(dredging/runAoff)Collision- Caused)by)contact)between)biological)components)and)moving)parts)of)a)human)activity)(ships,)propellers,)wind)turbines).Electromagnetic-changes Change)in)the)amount)and/or)distribution)and/or)periodicity)of)electromagnetic)energy)from)electrical)sources)(e.g.)
underwater)cables)Emergence-regime-change-(local) Change)in)natural)sea)level)(mean,)variation,)range))due)to)manAmade)structures)Input-of-organic-matter Input)of)organic)matter)(e.g.)industrial/sewage)effluent,)agricultural)runAoff,)aquaculture,)discards,)etc.)Introduction-of-microbial-pathogens Introduction)of)microbial)pathogensIntroduction-of-non>indigenous-species-and-translocations
Through)fishing)activity/netting,)aquaculture,)shipping,)waterways,)loss)of)ice)cover,)genetic)modification
Introduction-of-non>synthetic-compounds
Heavy)metals,)hydrocarbons,)PAH,)organometals
Introduction-of-other-substances Solids,)liquids)or)gases)not)classed)as)synthetic/nonAsynthetic)compounds)or)radionuclidesIntroduction-of-radionuclides Radioactivity)contaminationIntroduction-of-synthetic-compounds Pesticides,)antifoulants,)pharmaceuticals,)organohalogensLitter Diffuse)introduction)of)litterNitrogen-and-phosphorus-enrichment Input)of)nitrogen)and)phosphorus)(e.g.)fertilizer,)sewage)Noise Underwater)noise)A)Shipping,)acoustic)surveys;)surface)noise)(including)aesthetic)disturbance)pH-changes-(local) Change)in)pH))(mean,)variation,)range))due)to)runAoff/change)in)freshwater)flow,)etc)Salinity-regime-change Freshwater)–)seawater)balance,)seabed)seepageSelective-extraction-of-non>living-resources
Aggregate)extraction/removal)of)surface)substrata,)habitat)removal
Selective-extraction-of-species Removal)and)mortality)of)target)(e.g.)fishing))and)non)target)(e.g.)by)catch,)cooling)water)intake))speciesSmothering By)manAmade)structures/)disposal)at)seaSubstratum-loss Sealing)by)permanent)construction)(coastal)defenses/wind)turbines),)change)in)substratum)due)to)loss)of)key)
physical/biological)features,)replacement)of)natural)substratum)by)another)type)(e.g.)sand/gravel)to)mud)Thermal-regime-change Temperature)change)(average,)range,)variability))due)to)thermal)discharge)(local)Water-flow-rate-changes-(local) Change)in)currents)(speed,)direction,)variability))due)to)manAmade)structures)
12 MERCES – D1.1. Marine habitats and degraded habitats
Table 2b. List of standardised exogenous Pressures considered with description and examples (from Smith et al., 2016).
Table 3. Pressure groups considered, by grouping of common pressures.
Pressure DescriptionThermalregimechange Temperaturechange(average,range,variability)duetoclimatechange(largescale)Salinityregimechange Salinitychange(average,range,variability)duetoclimatologicalevents(largescale)Emergenceregimechange Changeinnaturalsealevel(mean,variation,range)duetoclimatechange(largescale)andisostatic
reboundWaterflowratechanges Changeincurrents(speed,direction,variability)duetoclimatechange(largescale)pHchanges ChangeinpH(mean,variation,range)duetoclimatechange(largescale),volcanicactivity(local)Changeinwaveexposure Changeinsize,number,distributionand/orperiodicityofwavesalongacoastduetoclimatechange
(largescale)Geomorphologicalchanges Changesinseabedandcoastlinechangesduetotectonicevents
Pressure Group PressurePhysical)damage Smothering
Substratum/loss/Changes/in/siltation/and/light/regime/AbrasionSelective/extraction/of/non8living/resources
Other)physical LitterNoiseAesthetic/pollutionCollision/Barrier/to/species/movement/Electromagnetic/changes
Chemical Introduction/of/synthetic/compounds/Introduction/of/non8synthetic/compounds/Introduction/of/radionuclidesIntroduction/of/other/substancesNitrogen/and/phosphorus/enrichmentInput/of/organic/matter
Biological Introduction/of/microbial/pathogensIntroduction/of/non8indigenous/speciesSelective/extraction/of/species
Hydrological Thermal/regime/change/(local)Salinity/regime/change/(local)Emergence/regime/change/(local)Water/flow/rate/changes/(local)pH/changes/(local)Change/in/wave/exposure/(local)

MERCES – D1.2. Activities and Pressures in Marine Habitats 13
Figure 1. Typical marine activities; (a) Aquaculture (production of living resources); (b) demersal trawling (extraction of living resources); (c) Oil platforms (extraction of non-living resources); (d) Container terminal (coastal and marine structure and infrastructure); (e) river run-off from Agriculture; (f) Tourism/recreation. Photos by Chris Smith (a, b, d), Vasilis Gerovasileiou (f). Satellite images from Google Earth (c, e).

14 MERCES – D1.1. Marine habitats and degraded habitats
Figure 2. Typical pressures in the marine environments: (a) abrasion (trawl door scarring); (b) input of organic matter (aquaculture shore facility effluent); (c) introduction of non-indigenous species (Caulerpa rachemosa); (d) Litter (shore stranded floating litter); (e) Selective extraction of species (fish in a trawl cod-end); (f) Smothering (trammel net covering sponge garden). Photos by Chris Smith (a, d); Thanos Dailianis (b, f); Donat Petricioli (c); EPILEXIS/HCMR (e).
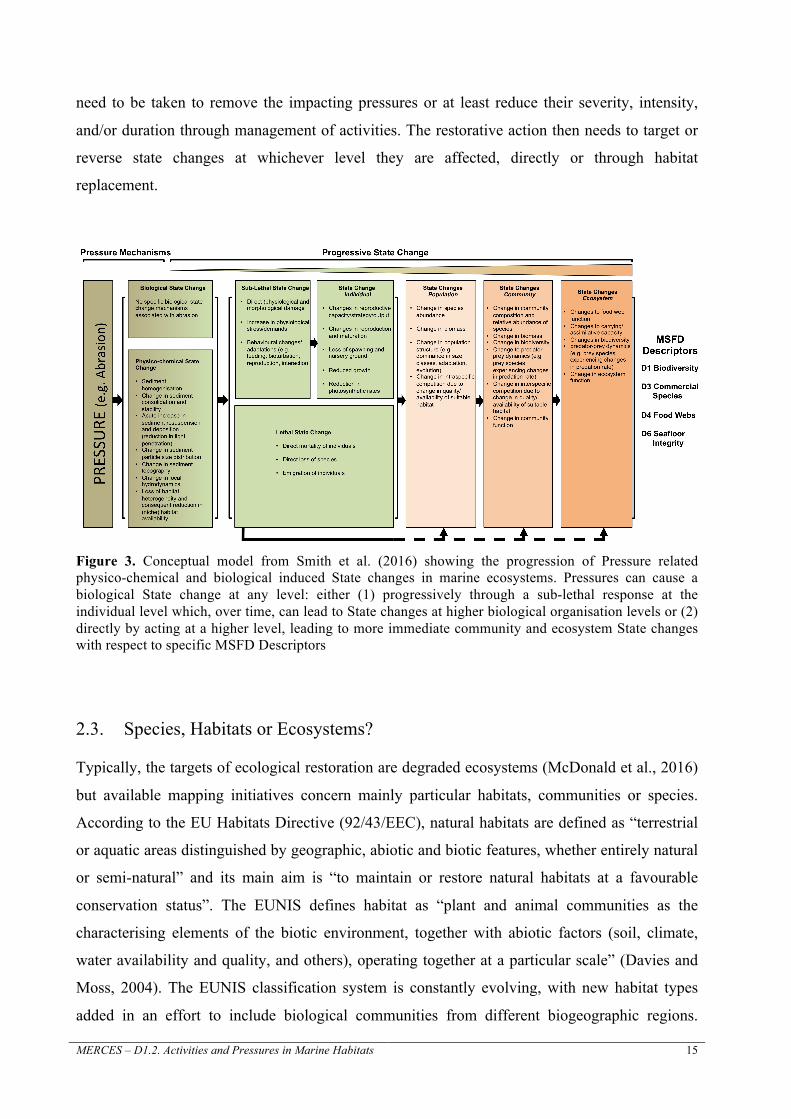
A pressure, through lethal or sub-lethal processes, may cause a physico-chemical and biological
change in state affecting biological organization at many different levels (summarised in Figure
3). The mechanisms through which pressures cause a change in the state of a particular
component of marine ecosystems are often very complex, for example, pressures may directly
impact species/assemblages/habitats or may indirectly impact these components through changes
in relationships/processes and rates. In order to effectively restore a degraded habitat actions
MERCES – D1.2. Activities and Pressures in Marine Habitats 15
need to be taken to remove the impacting pressures or at least reduce their severity, intensity,
and/or duration through management of activities. The restorative action then needs to target or
reverse state changes at whichever level they are affected, directly or through habitat
replacement.
Figure 3. Conceptual model from Smith et al. (2016) showing the progression of Pressure related physico-chemical and biological induced State changes in marine ecosystems. Pressures can cause a biological State change at any level: either (1) progressively through a sub-lethal response at the individual level which, over time, can lead to State changes at higher biological organisation levels or (2) directly by acting at a higher level, leading to more immediate community and ecosystem State changes with respect to specific MSFD Descriptors
2.3. Species, Habitats or Ecosystems?
Typically, the targets of ecological restoration are degraded ecosystems (McDonald et al., 2016)
but available mapping initiatives concern mainly particular habitats, communities or species.
According to the EU Habitats Directive (92/43/EEC), natural habitats are defined as “terrestrial
or aquatic areas distinguished by geographic, abiotic and biotic features, whether entirely natural
or semi-natural” and its main aim is “to maintain or restore natural habitats at a favourable
conservation status”. The EUNIS defines habitat as “plant and animal communities as the
characterising elements of the biotic environment, together with abiotic factors (soil, climate,
water availability and quality, and others), operating together at a particular scale” (Davies and
Moss, 2004). The EUNIS classification system is constantly evolving, with new habitat types
added in an effort to include biological communities from different biogeographic regions.

16 MERCES – D1.1. Marine habitats and degraded habitats
However, there has been a long debate on the definition of “habitat” among researchers (e.g.
Fraschetti et al. (2010) wondering how many habitats are there, and where) and policy makers
(e.g. in the requirement for assessments by broad habitat types for various EU directives,
Galparsoro et al., 2012, 2014). Additionally environmental status assessments usually require
integration of multiple ecosystem components such as species and broad scale habitats as well as
spatially defined outputs (Borja et al., 2016). This often leads to a conflating and broad use of the
term. This broad use of the term habitat is, for example, close to the definition of ecosystem
provided by Clewell and Aronson (2007) as “the complex of living organisms and the abiotic
environment with which they interact at a specified location”.
In the current report, we have used a nested approach, starting from broad scale to fine scale. We
have looked at very broad habitat types (e.g. A6 Deep sea, a level 2 EUNIS habitat) that are
often seen in global maps or in initiatives mapping human activities. We considered various
features, which correspond to different levels of the EUNIS habitat classification system,
supporting communities of special conservation interest. We have included, for example,
habitats from regional lists of threatened or declining habitats (e.g. OSPAR lists include Zostera
beds and deep-sea sponge aggregations). Finally, we have also considered specific ecosystem-
engineering taxa (e.g. Posidonia meadows, macroalgal/Cystoseira forests and coral/sponge
gardens), and large physical/geological features such as seamounts and canyons and associated
species communities, covering both levels 4 and 5 of the EUNIS habitat classification system.
2.4. Deliverable Objectives
Following on from the scope of the deliverable, the specific objectives of this report are:
(a) to inventory and assess available activity and pressure maps across the European regional
seas (MERCES D1.2 Catalogue), as well as to perform a review and analyses that will allow
identification of commonalities, and conclusions to be drawn;
(b) to showcase typical examples (case studies) to investigate activities and pressures acting on
the selected MERCES habitats (habitats of focussed research efforts within the MERCES
project, detailed in the following sections), their prominent impacts and consequences, as well as
the identification and evaluation of possible restoration or mitigation actions.

MERCES – D1.2. Activities and Pressures in Marine Habitats 17
3. Methods and Materials
3.1. The MERCES Pressures Catalogue compilation
The MERCES Pressures Catalogue was compiled from a semi-structured literature search on the
internet using keywords and keyword combinations. Keywords included “map” and “marine”
and “Europe” and types of activity (e.g. “aquaculture”, “trawling”, “aggregate extraction”,
“hydrocarbons”, “renewable energy”, “shipping” etc.), or more general terms and major habitat
types, such as “habitat” or “deep sea”, “seagrass” etc. in marine and coastal areas (excluding
estuaries and lagoons). For all the above cases, the first 100 search results were scanned, (a) in
order of relevance (browser derived) and (b) ranked by year (2016 - most recent). Specific web
resources were also searched (including downloadable reports) of national/international
organizations (including NGOs), commissions and agencies dealing with habitat conservation
(e.g. EEA, IUCN, UNEP-MAP-RAC/SPA, HELCOM, OSPAR, FAO, OCEANA, MarLIN,
Scotland’s Marine Atlas) and all the European projects registered in the European Marine Spatial
Planning platform (e.g. MEDTRENDS, CoCoNet, MESMA, PERSEUS, ADRIPLAN, THAL-
CHOR, BALANCE). In addition, MERCES participants were asked to provide entries based on
their thematic and regional knowledge/expertise.
The catalogue was an Excel file with single row entries for pressure/activity map resources and
column categories. Some categories permitted free-text entries; whilst others were restricted to
specific lists of options (drop-down menus). The catalogue included a ‘Read me’ datasheet with
instructions and clarifications for completion, a ‘List’ datasheet (for visualising the drop-down
list options) and ‘Catalogue’ datasheet to be filled in. Additional sheets contained information
helpful for the contributor, such as maps of the regional seas and their subdivisions, lists of
habitat types and description of activities and pressures.
The catalogue entries were broken down into several broad category groups and then individual
categories in single columns as described below.
3.1.1. Activity and Pressure Maps: Category Groups and Categories
The entries are broken down into 8 broad categories and then individual categories in single
columns.

18 MERCES – D1.1. Marine habitats and degraded habitats
3.1.1.1. Data input identifier section
To identify the record and the record provider:
• ID: the unique entry number for this record (filled by the catalogue administrators)
• No.: the sequential number of the data entries starting from 1
• ID Partner: the acronym of the institution of the person providing the data
• Name: the name of the person providing the data
• E-mail: contact e-mail address of the person providing the data
3.1.1.2. Habitat Type
• Category: drop-down list with options (a) ‘Broad scale’ or (b) ‘Particular Habitat’.
‘Broad scale’ referring to large area, actual or predicted seabed habitat maps or
geomorphology maps for regional, sub-regional or country area. ‘Particular Habitat’ if a
specific habitat type with more detail in next column.
• Type: only applicable if previous entry was ‘Particular Habitat’. A drop-down list with
options (a) ‘sublittoral soft’, (b) ‘sublittoral hard’, (c) ‘deep sea’ (>200 m depth), and (d)
‘other’ particular habitat.
• Main Feature: a drop-down list to specify habitat type, depending on category selected in
the previous column. For ‘Sublittoral soft’: (a) Posidonia, (b) Zostera, (c) Other seagrass,
(d) Other. For ‘Sublittoral hard’: (a) Maerl, (b) Coralligenous (including gorgonians), (c)
Gorgonians, (d) Sponges, (e) Cystoseira/Macroalgal forests/beds, (f) Other. For ‘Deep
Sea’ (a) Corals, (b) Sponges, (c) Mixed coral/sponge field, (d) Seamounts, (e)
Hydrothermal vents, (f) Carbonate mounds, (g) Canyons, (h) Other. Not applicable for
‘Broad scale’ category.
3.1.1.3. Activities
For all activities explicitly mapped in the reference and matching the definitions provided. Free
text information provided under each activity (Activity list taken from Smith et al., 2016, see
Section 2.2.):
• 13 columns relating to activities shown in Table 1
• Activities comments: any extra or more detailed information on specific activities.

MERCES – D1.2. Activities and Pressures in Marine Habitats 19
3.1.1.4. Endogenous (manageable) Pressures
For all pressures explicitly mapped in the reference and matching the definitions provided. Free
text information provided under each pressure (endogenous pressure list taken from Smith et al.,
2016, see Section 2.2.):
• 26 columns relating to endogenous pressures shown in Table 2a
• Endogenous Pressures Comments: any extra or more detailed information on endogenous
pressures
3.1.1.5. Exogenous (unmanageable) Pressures
For all Pressures explicitly mapped in the reference and matching the definitions provided. Free
text information provided under each pressure (exogenous pressure list taken from Smith et al.,
2016, see Section 2.2.):
• 7 columns relating to exogenous pressures shown in Table 2b
• Exogenous Pressures comments: any extra or more detailed information on exogenous
pressures
3.1.1.6. Information
• Other Maps: Drop-down list: chose one option, Yes or No, with any more detailed
information added in the Comments in the next column.
• Comments: Free text, further details about the map source or finding of the paper/report,
or any other useful information, e.g. human activities/impacts in the area.
3.1.1.7. Region
• Sea basins MSFD Regions: a drop-down list of MSFD Regions with options (a) Baltic
Sea, (b) North-East Atlantic, (c) Mediterranean Sea, (d) Black Sea, (e) Other Regional
Sea. The latter category (“other”) refers to either sources at a global or European scale, or
areas not included in the MSFD categories (such as Norwegian waters, or seafloor banks
in the international waters of North-East Atlantic).
• MSFD sub-region: a drop-down list of MSFD sub-regions (applying only for the North-
East Atlantic and the Mediterranean Sea). Options for the North-East Atlantic are (a)
20 MERCES – D1.1. Marine habitats and degraded habitats
Greater North Sea, including the Kattegat, and the English Channel, (b) Celtic Seas, (c)
Bay of Biscay and the Iberian Coast, (d) Macaronesian biogeographic region (Azores,
Madeira, Canary Islands). Options for the Mediterranean Sea are (a) Western
Mediterranean Sea, (b) Adriatic Sea, (c) Ionian Sea and the Central Mediterranean Sea,
(d) Aegean-Levantine Sea.
• Other Subdivisions: Free text for stating any further information or localised region e.g.
ICES rectangles, GSA. A specification for non-MSFD regions (such as Norwegian
waters, or seafloor banks in the international waters of the North-East Atlantic) is also
included here, if “Other regional sea” is selected in the first column.
3.1.1.8. Sources
• Source: a drop-down list with options (a) on-line resource/site, (b) paper, (c) report, (d)
conference paper, (e) expert/unpublished.
• Type: a drop-down list with options (a) Map image (raster or printed image from a paper
or on-line), (b) Map viewer (interactive image on-line), (c) Shapefile (possibility to
individually download GIS format shapefiles)
• Reference: Free text field, providing the full citation for the reference
• Reference Link: Free text field, providing a web link to the reference
• Multiple Entries: a drop-down list with options (a) Yes or (b) No, depending on how
many rows have been added per reference. “Yes” indicates multiple entries for a single
reference, as for example if a reference covers more than one regional area, or more than
one habitat.
3.2. The MERCES Pressures Systematic Review
On receipt of the individual catalogues, an accession number was given to every entry. Once the
catalogues had been collated and checked for duplicates and missing information, a systematic
review of the data was undertaken to highlight the different data categories and the range of
information by regional sea, habitat, etc.

MERCES – D1.2. Activities and Pressures in Marine Habitats 21
3.3. The MERCES Key Habitats Pressure Activity Linkages
Marine habitats within the European Union are under pressure from a wide array of sources,
hampering attempts to restore degraded areas. In order to explore this further, we investigated
linkages between specific activities (e.g. the extraction of living resources), their resultant
pressures (e.g. abrasion) and the implications for restoration efforts. First, following consultation
with a number of experts, a generic table was constructed mapping 26 pressures derived from 13
human activities (Tables 1 and 2). Following this, several case studies were investigated in more
detail. Case studies were selected at a WP1 MERCES workshop based on the presence of focal
key habitats being investigated under MERCES (shallow soft bottom habitats – seagrass;
shallow hard bottom habitats – kelp, macroalgal forests, coralligenous assemblages; deep sea
habitats – coral gardens, deep-sea soft bottom communities (open slopes, submarine canyons,
deep basins, seamounts). The review of the case studies included elements of the biology,
ecology and relevant stressors and pressures. Full descriptions of the case studies including key
important but generic features identified at the workshop (such as dynamics, connectivity and
structural complexity) are given in Bekkby et al. (2017) MERCES D1.1. Deliverable. Short
summaries of the selected habitats are given in this report (Section 4.2.1) with additional
information provided here on relevant impacts and pressures. For each case study, tables were
constructed whereby specific features were noted related to each of the generic feature topics to
impacts (for example, on growth, patch size or on connectivity) as well as their consequence for
restoration.
4. Results
4.1. The MERCES Pressures Catalogue compilation
The catalogue consists of 264 entries, resulting from the semi-structured search and contribution
from 10 project partners.
4.1.1. Pressure/Activity Map Sources
Out of the 264 entries, 194 (73.5%) map activities, 147 (55.7%) map pressures, and 101 (38.3%)
map both. Most of the information (49%) came from peer-reviewed journals, followed by project
reports (27%) and web resources (19%) which consisted mainly of map viewers and other online
22 MERCES – D1.1. Marine habitats and degraded habitats
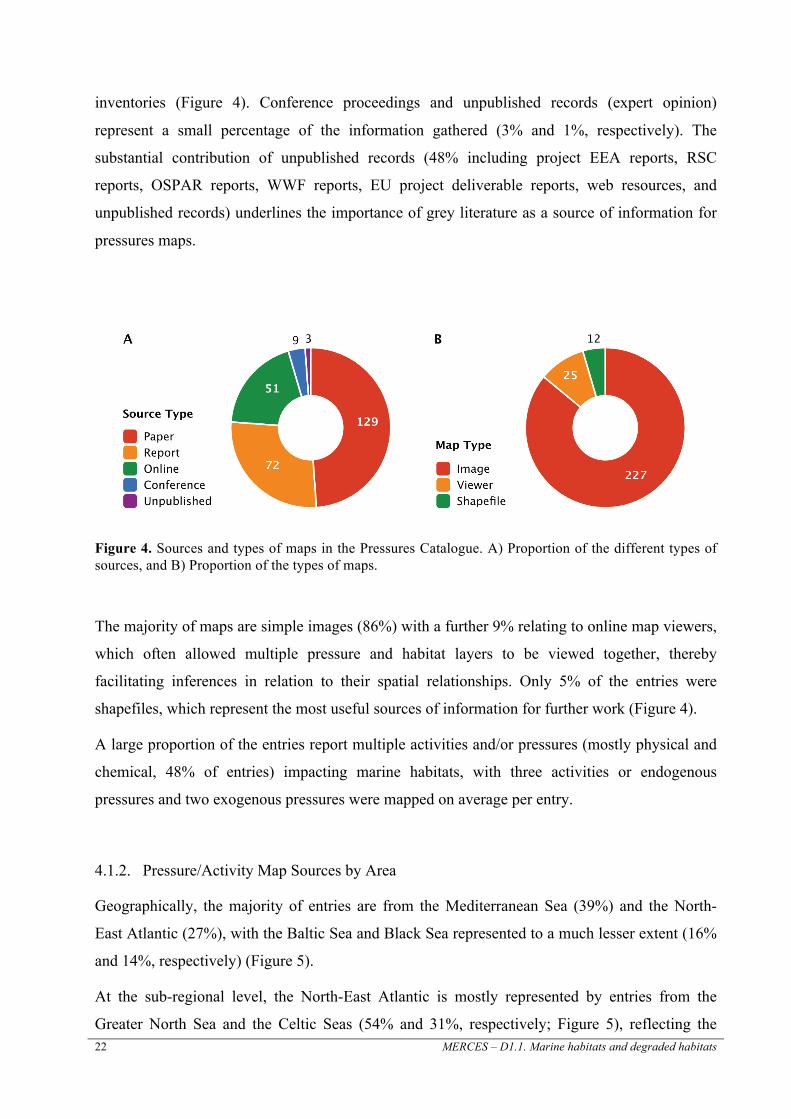
inventories (Figure 4). Conference proceedings and unpublished records (expert opinion)
represent a small percentage of the information gathered (3% and 1%, respectively). The
substantial contribution of unpublished records (48% including project EEA reports, RSC
reports, OSPAR reports, WWF reports, EU project deliverable reports, web resources, and
unpublished records) underlines the importance of grey literature as a source of information for
pressures maps.
Figure 4. Sources and types of maps in the Pressures Catalogue. A) Proportion of the different types of sources, and B) Proportion of the types of maps.
The majority of maps are simple images (86%) with a further 9% relating to online map viewers,
which often allowed multiple pressure and habitat layers to be viewed together, thereby
facilitating inferences in relation to their spatial relationships. Only 5% of the entries were
shapefiles, which represent the most useful sources of information for further work (Figure 4).
A large proportion of the entries report multiple activities and/or pressures (mostly physical and
chemical, 48% of entries) impacting marine habitats, with three activities or endogenous
pressures and two exogenous pressures were mapped on average per entry.
4.1.2. Pressure/Activity Map Sources by Area
Geographically, the majority of entries are from the Mediterranean Sea (39%) and the North-
East Atlantic (27%), with the Baltic Sea and Black Sea represented to a much lesser extent (16%
and 14%, respectively) (Figure 5).
At the sub-regional level, the North-East Atlantic is mostly represented by entries from the
Greater North Sea and the Celtic Seas (54% and 31%, respectively; Figure 5), reflecting the

MERCES – D1.2. Activities and Pressures in Marine Habitats 23
extensive amount of references from UK waters and the OSPAR region. Regarding the
Mediterranean Sea, all four MSFD sub-regions are represented, and a significant portion of
entries (26%) includes maps of pan-Mediterranean scale. “Other” regions represent 3% of the
total records and may either refer to sources with a global coverage, those covering the entire
European continent, or sub-regions outside the EU or non MSFD-relevant (e.g. Norway, Hatton
and Rockall Banks).
Figure 5. Number of records in the Pressures Catalogue for European regions and sub-regions. A) Regional seas (BALTIC: Baltic Sea; BLACK: Black Sea; MED: Mediterranean Sea; NEA: North-East Atlantic; Other: Other regional sea), B) North-East Atlantic sub-region, C) Mediterranean Sea sub-regions (WMED: Western Mediterranean; CMED: Central Mediterranean; ADRIA: Adriatic; EMED: Eastern Mediterranean), and D) Other sub-regions.
4.1.3. Pressure/Activity Map Resources by Key Habitat
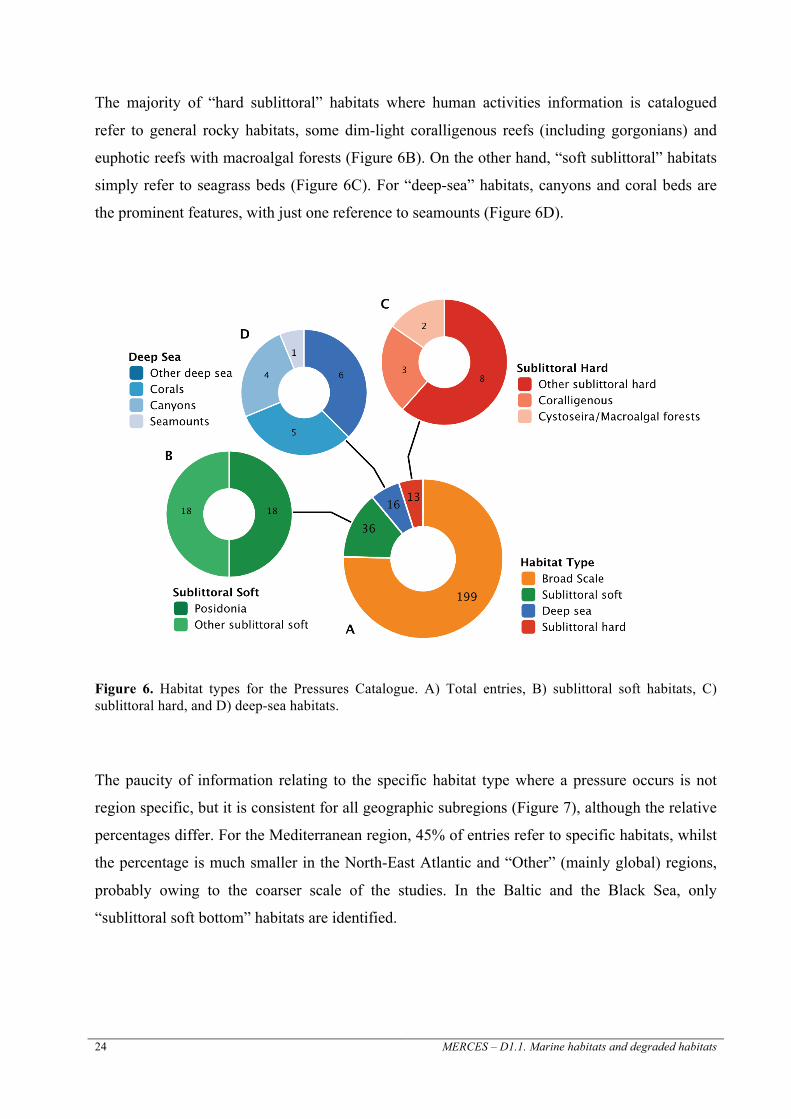
Seventy-five percent of the entries refer to “broad scale” habitat categories, without an indication
of specific habitat types. Those entries (25%) that do specify habitat type refer to either
“sublittoral hard” and “soft bottoms”, or “deep-sea” habitats (Figure 6).
24 MERCES – D1.1. Marine habitats and degraded habitats
The majority of “hard sublittoral” habitats where human activities information is catalogued
refer to general rocky habitats, some dim-light coralligenous reefs (including gorgonians) and
euphotic reefs with macroalgal forests (Figure 6B). On the other hand, “soft sublittoral” habitats
simply refer to seagrass beds (Figure 6C). For “deep-sea” habitats, canyons and coral beds are
the prominent features, with just one reference to seamounts (Figure 6D).
Figure 6. Habitat types for the Pressures Catalogue. A) Total entries, B) sublittoral soft habitats, C) sublittoral hard, and D) deep-sea habitats.
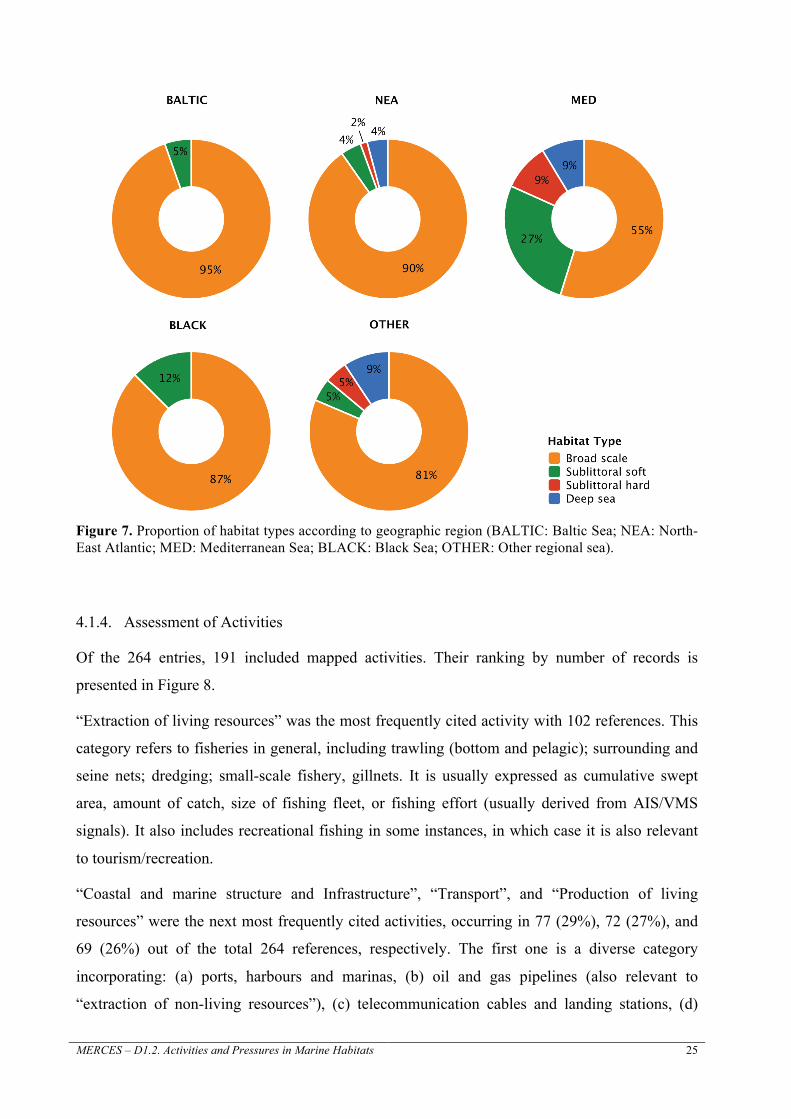
The paucity of information relating to the specific habitat type where a pressure occurs is not
region specific, but it is consistent for all geographic subregions (Figure 7), although the relative
percentages differ. For the Mediterranean region, 45% of entries refer to specific habitats, whilst
the percentage is much smaller in the North-East Atlantic and “Other” (mainly global) regions,
probably owing to the coarser scale of the studies. In the Baltic and the Black Sea, only
“sublittoral soft bottom” habitats are identified.
MERCES – D1.2. Activities and Pressures in Marine Habitats 25
Figure 7. Proportion of habitat types according to geographic region (BALTIC: Baltic Sea; NEA: North-East Atlantic; MED: Mediterranean Sea; BLACK: Black Sea; OTHER: Other regional sea).
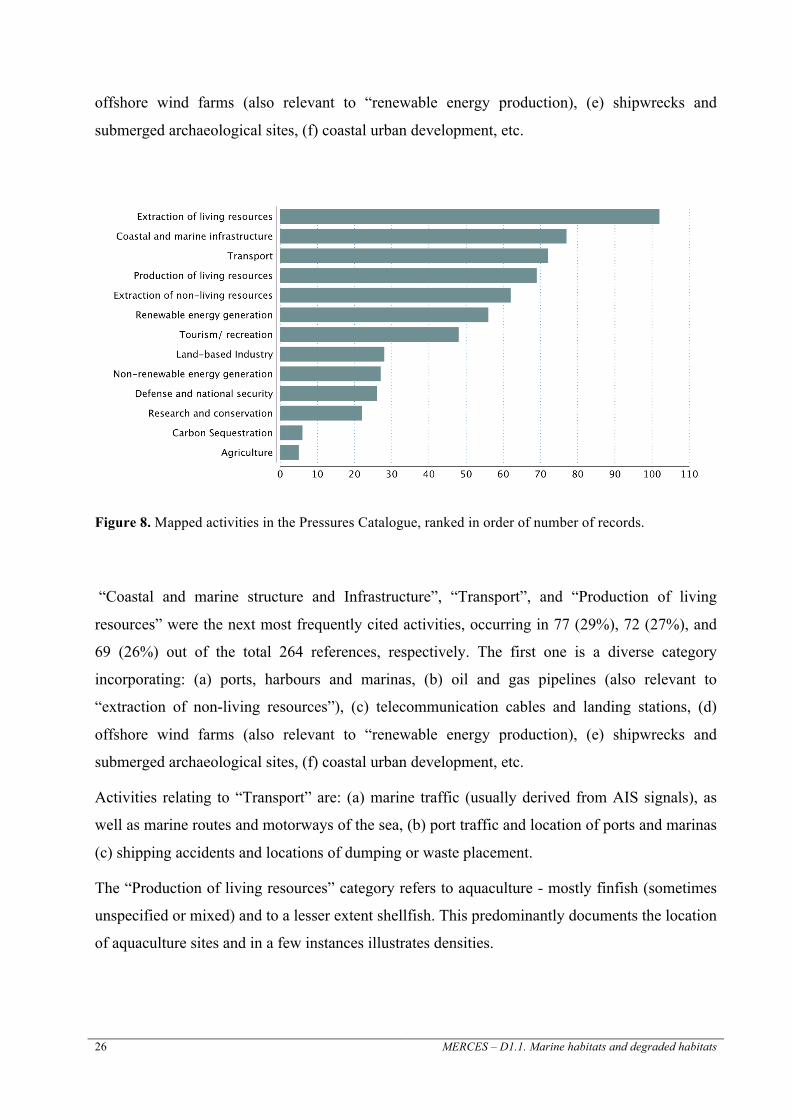
4.1.4. Assessment of Activities
Of the 264 entries, 191 included mapped activities. Their ranking by number of records is
presented in Figure 8.
“Extraction of living resources” was the most frequently cited activity with 102 references. This
category refers to fisheries in general, including trawling (bottom and pelagic); surrounding and
seine nets; dredging; small-scale fishery, gillnets. It is usually expressed as cumulative swept
area, amount of catch, size of fishing fleet, or fishing effort (usually derived from AIS/VMS
signals). It also includes recreational fishing in some instances, in which case it is also relevant
to tourism/recreation.
“Coastal and marine structure and Infrastructure”, “Transport”, and “Production of living
resources” were the next most frequently cited activities, occurring in 77 (29%), 72 (27%), and
69 (26%) out of the total 264 references, respectively. The first one is a diverse category
incorporating: (a) ports, harbours and marinas, (b) oil and gas pipelines (also relevant to
“extraction of non-living resources”), (c) telecommunication cables and landing stations, (d)
26 MERCES – D1.1. Marine habitats and degraded habitats
offshore wind farms (also relevant to “renewable energy production), (e) shipwrecks and
submerged archaeological sites, (f) coastal urban development, etc.
Figure 8. Mapped activities in the Pressures Catalogue, ranked in order of number of records.
“Coastal and marine structure and Infrastructure”, “Transport”, and “Production of living
resources” were the next most frequently cited activities, occurring in 77 (29%), 72 (27%), and
69 (26%) out of the total 264 references, respectively. The first one is a diverse category
incorporating: (a) ports, harbours and marinas, (b) oil and gas pipelines (also relevant to
“extraction of non-living resources”), (c) telecommunication cables and landing stations, (d)
offshore wind farms (also relevant to “renewable energy production), (e) shipwrecks and
submerged archaeological sites, (f) coastal urban development, etc.
Activities relating to “Transport” are: (a) marine traffic (usually derived from AIS signals), as
well as marine routes and motorways of the sea, (b) port traffic and location of ports and marinas
(c) shipping accidents and locations of dumping or waste placement.
The “Production of living resources” category refers to aquaculture - mostly finfish (sometimes
unspecified or mixed) and to a lesser extent shellfish. This predominantly documents the location
of aquaculture sites and in a few instances illustrates densities.
MERCES – D1.2. Activities and Pressures in Marine Habitats 27
“Research and conservation” is a rather under-represented category (only 22 (8%) out of 264
sources) that could be possibly expanded with a focused search for maps illustrating MPA
distribution, or potentially locations where regulations apply.
“Carbon sequestration” and “agriculture” are the obviously under-represented categories in the
Catalogue. The first is restricted to 6 sources citing offshore CO2 storage and underground coal
gasification, while the latter (with 5 entries) relates to mapped as agricultural land coverage
proximal to the coast, or coastal population employed in agriculture.
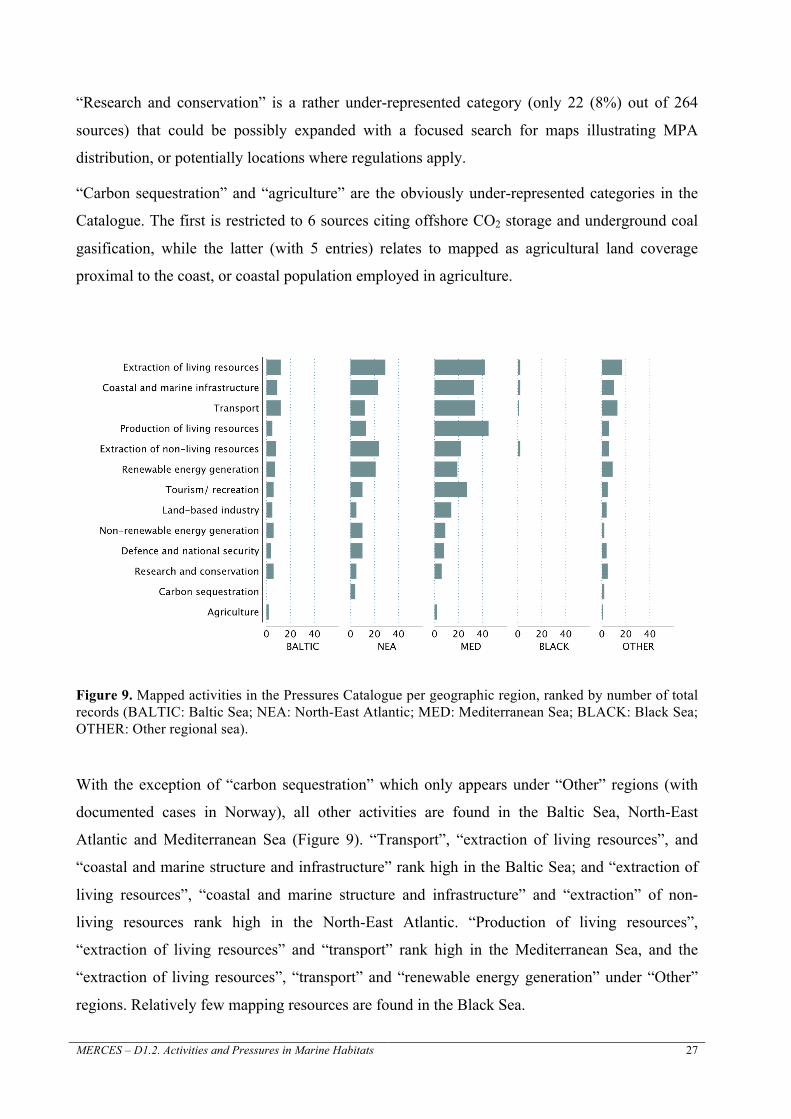
Figure 9. Mapped activities in the Pressures Catalogue per geographic region, ranked by number of total records (BALTIC: Baltic Sea; NEA: North-East Atlantic; MED: Mediterranean Sea; BLACK: Black Sea; OTHER: Other regional sea).
With the exception of “carbon sequestration” which only appears under “Other” regions (with
documented cases in Norway), all other activities are found in the Baltic Sea, North-East
Atlantic and Mediterranean Sea (Figure 9). “Transport”, “extraction of living resources”, and
“coastal and marine structure and infrastructure” rank high in the Baltic Sea; and “extraction of
living resources”, “coastal and marine structure and infrastructure” and “extraction” of non-
living resources rank high in the North-East Atlantic. “Production of living resources”,
“extraction of living resources” and “transport” rank high in the Mediterranean Sea, and the
“extraction of living resources”, “transport” and “renewable energy generation” under “Other”
regions. Relatively few mapping resources are found in the Black Sea.
28 MERCES – D1.1. Marine habitats and degraded habitats
4.1.5. Assessment of Endogenous Pressures
Endogenous pressures are less frequently mapped than the activities that induce them. Out of the
total 264 catalogued sources, 147 (56%) include mapped endogenous pressures (Figure 10).
Chemical pressures rank high in the list, with nitrogen and phosphorous enrichment, introduction
of other substances, and input of organic matter occupying the three first positions, cited in 45,
40, and 35 (13-17%) out of a total of 264 sources, respectively.
Entries for “nitrogen and phosphorous enrichment” include mapping of point sources and actual
(mainly bottom) concentrations. “Introduction of other substances” mainly includes mapped
pollution sources or aggregations that are either not specified, or described in generic terms (e.g.
land-based pollution, hazardous and noxious substances, chemical spills). Mapped “organic
matter input” mainly includes riverine and urban runoffs, as well as chlorophyll concentrations.
Of those endogenous pressures present in more than 20% of the relevant entries, “abrasion”,
“introduction of non-indigenous species”, and “litter” are notable. “Abrasion” is a physical
pressure most commonly related to fishing activities (mainly trawling and dredging, but also
physical contact with other fishing gear); in specific instances, it can be physical contact by
sinking ships, infrastructure construction, and anchoring. “Introduction of non-indigenous
species” is the most mapped biological pressure, with maps illustrating both the presence and the
introduction vectors of species in the examined areas. Marine “litter” emerges as a well-mapped
physical pressure, due to experimental trawling and ROV studies; maps of marine litter in our
catalogue include (a) general waste, (b) abandoned, lost, or dismissed fishing gear, (c) mining
waste dumping.
“Selective extraction of species”, although highly ranked, is seemingly under-represented in the
catalogue (28 entries; 11%), considering the intensity of fisheries in the examined areas. When
present, it is associated with general fisheries, in some instances being more specific (e.g.
bycatch records of cetaceans and turtles, removal of kelp). The reason for the presumed under-
representation is that, while fishing as an activity is widely assessed, the actual extraction of
species is seldom explicitly put on a map, hence can be only assumed from fishing intensity
maps or catch quotas per geographic areas.
Several endogenous pressures appear as seldom mapped, each one represented in less than 4% of
the total entries. Most notable among these are local “thermal regime change”, “underwater
noise”, “selective extraction of non-living resources”, and “barriers to species movement”.
“Death by injury or collision” is not mapped in any of the examined sources.
MERCES – D1.2. Activities and Pressures in Marine Habitats 29
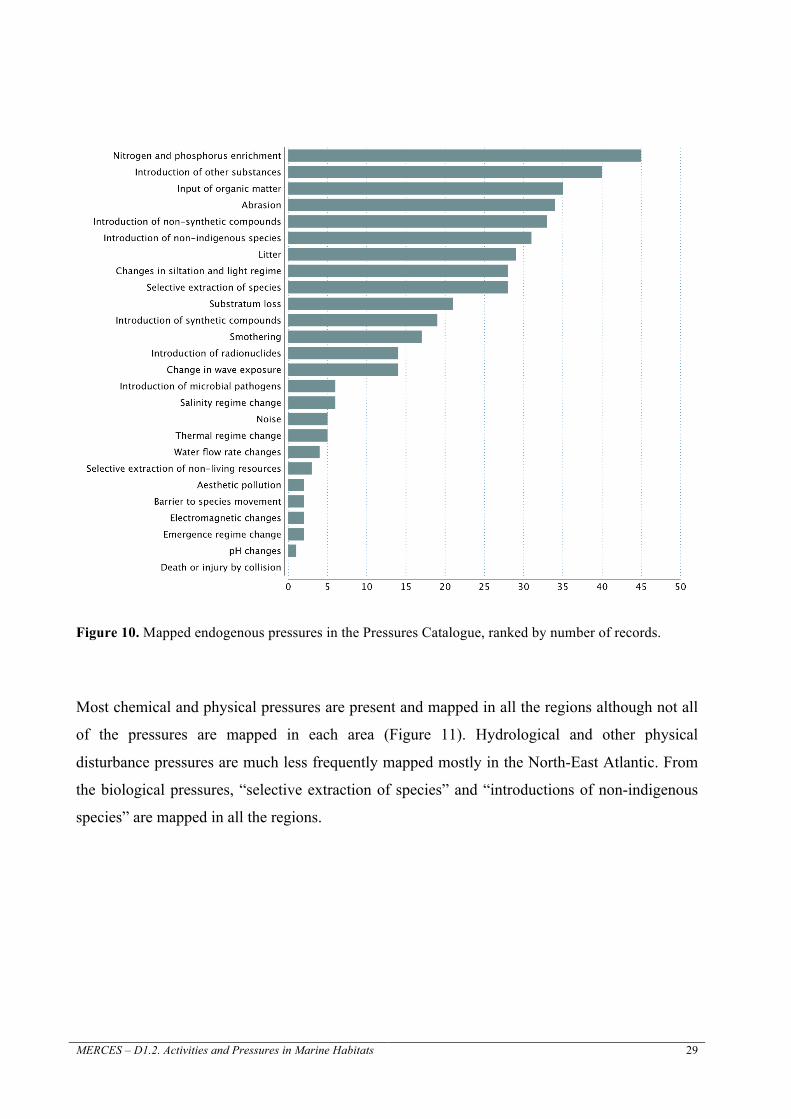
Figure 10. Mapped endogenous pressures in the Pressures Catalogue, ranked by number of records.
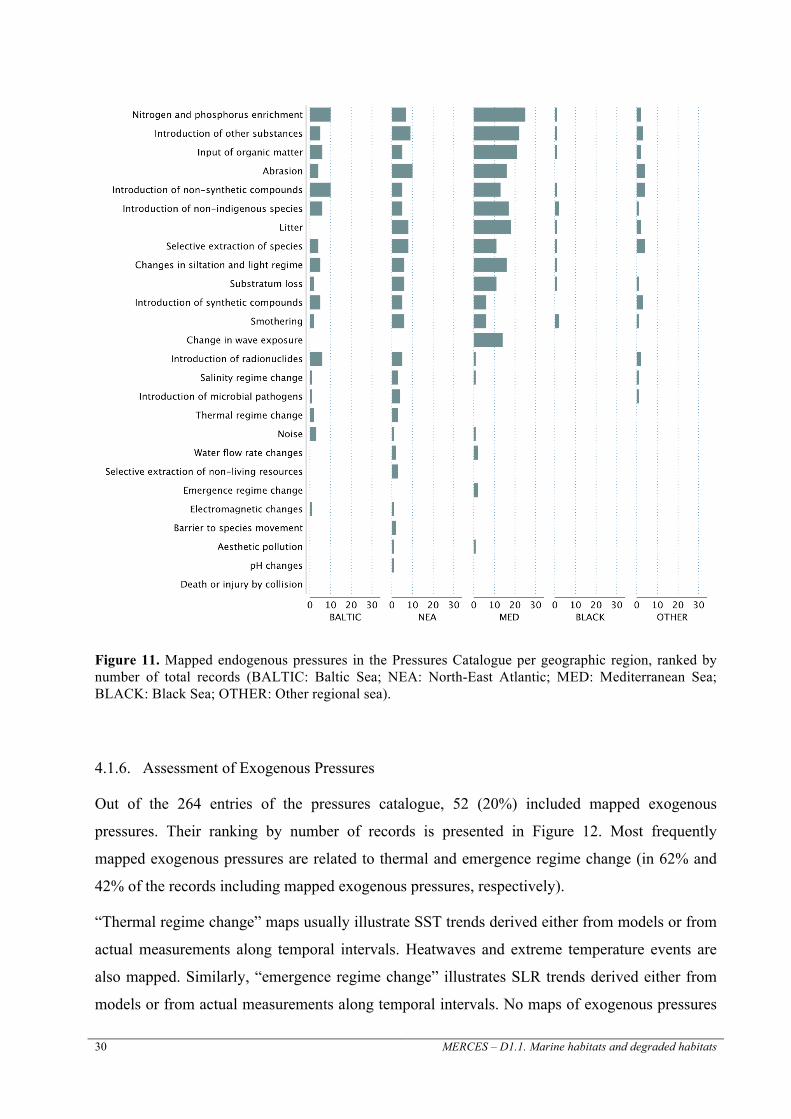
Most chemical and physical pressures are present and mapped in all the regions although not all
of the pressures are mapped in each area (Figure 11). Hydrological and other physical
disturbance pressures are much less frequently mapped mostly in the North-East Atlantic. From
the biological pressures, “selective extraction of species” and “introductions of non-indigenous
species” are mapped in all the regions.
30 MERCES – D1.1. Marine habitats and degraded habitats
Figure 11. Mapped endogenous pressures in the Pressures Catalogue per geographic region, ranked by number of total records (BALTIC: Baltic Sea; NEA: North-East Atlantic; MED: Mediterranean Sea; BLACK: Black Sea; OTHER: Other regional sea).
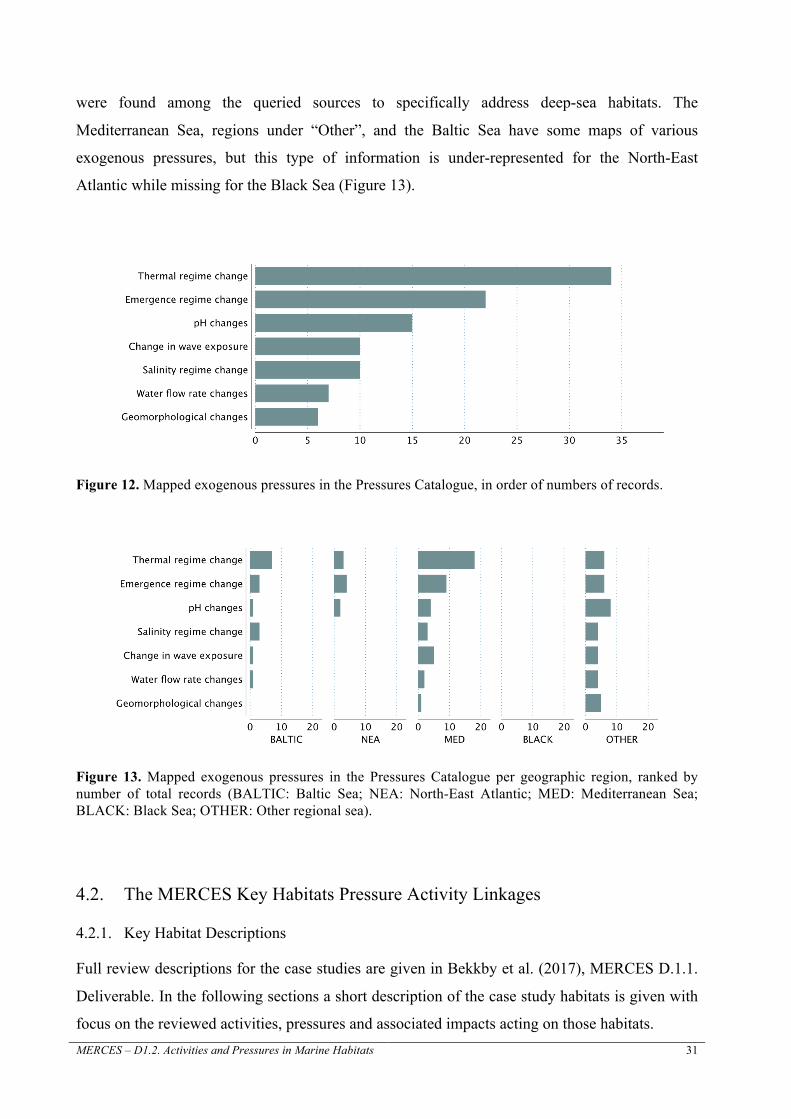
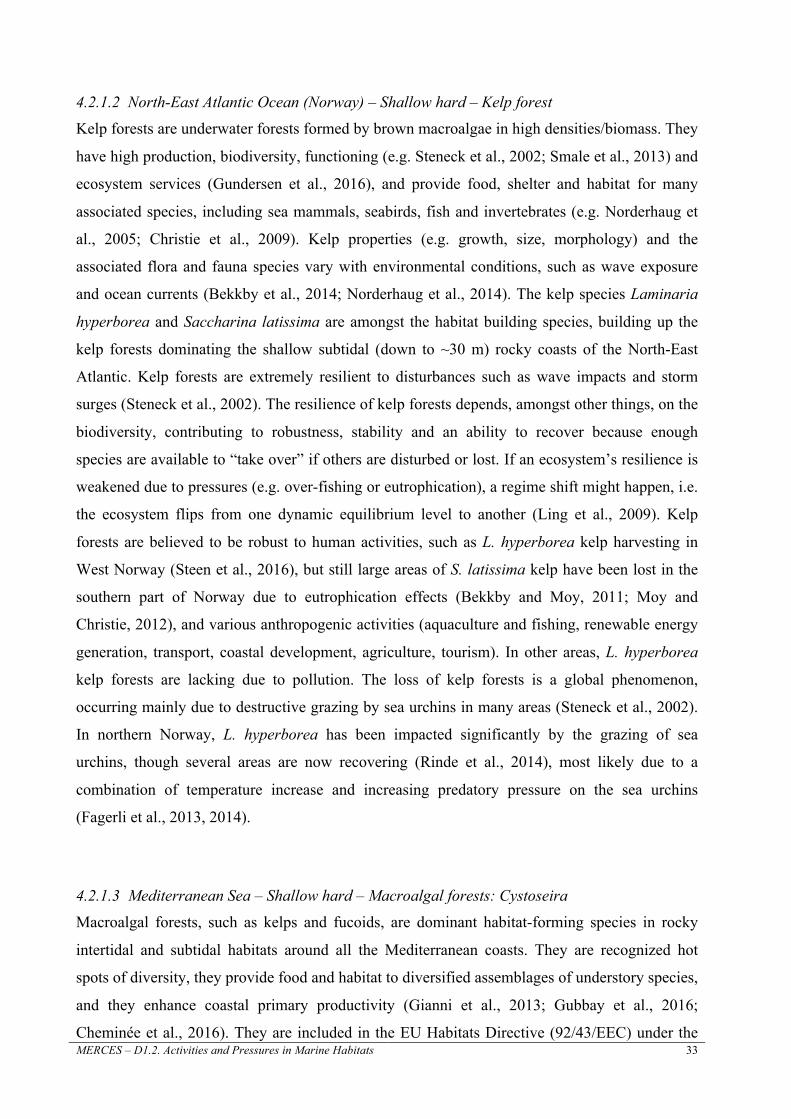
4.1.6. Assessment of Exogenous Pressures
Out of the 264 entries of the pressures catalogue, 52 (20%) included mapped exogenous
pressures. Their ranking by number of records is presented in Figure 12. Most frequently
mapped exogenous pressures are related to thermal and emergence regime change (in 62% and
42% of the records including mapped exogenous pressures, respectively).
“Thermal regime change” maps usually illustrate SST trends derived either from models or from
actual measurements along temporal intervals. Heatwaves and extreme temperature events are
also mapped. Similarly, “emergence regime change” illustrates SLR trends derived either from
models or from actual measurements along temporal intervals. No maps of exogenous pressures
MERCES – D1.2. Activities and Pressures in Marine Habitats 31
were found among the queried sources to specifically address deep-sea habitats. The
Mediterranean Sea, regions under “Other”, and the Baltic Sea have some maps of various
exogenous pressures, but this type of information is under-represented for the North-East
Atlantic while missing for the Black Sea (Figure 13).
Figure 12. Mapped exogenous pressures in the Pressures Catalogue, in order of numbers of records.
Figure 13. Mapped exogenous pressures in the Pressures Catalogue per geographic region, ranked by number of total records (BALTIC: Baltic Sea; NEA: North-East Atlantic; MED: Mediterranean Sea; BLACK: Black Sea; OTHER: Other regional sea).
4.2. The MERCES Key Habitats Pressure Activity Linkages
4.2.1. Key Habitat Descriptions
Full review descriptions for the case studies are given in Bekkby et al. (2017), MERCES D.1.1.
Deliverable. In the following sections a short description of the case study habitats is given with
focus on the reviewed activities, pressures and associated impacts acting on those habitats.

32 MERCES – D1.1. Marine habitats and degraded habitats
4.2.1.1 Mediterranean Sea, Baltic Sea and North Atlantic Ocean - Shallow soft – Seagrass meadows
Seagrass meadows are key ecosystems in soft-bottom coastal waters. Seagrasses depend on good
environmental conditions such as clear waters, stable sediments, and suitable nutrients for
successful growth, and are very vulnerable to anthropogenic pressures. Four native seagrass
species are found in European waters: Cymodocea nodosa, Posidonia oceanica, Zostera marina,
and Zostera noltii. They can be found both intertidally and subtidally up to 40 m depth and
inhabit a wide range of salinity, ranging from the brackish waters (5‰) of the Baltic to 37‰ in
Mediterranean waters. Seagrass play an important role in coastal ecosystems: they grow
alongside algae and other plant species, support high associated biodiversity, and provide
important ecological services. These include providing habitat and nursery areas for fish and
invertebrates, as well as a food source for herbivores, contributing to the productivity of coastal
areas by producing oxygen, supporting complex trophic networks, and playing a major role in
carbon storage (Barbier et al., 2011; Cullen-Unsworth and Unsworth, 2013; Campagne et al.,
2015; Nordlund et al., 2016). Seagrasses also filter freshwater discharges from land, reduce
water movements thus stabilising sediments, and trap heavy metals and nutrient rich run-off, thus
improving the water quality for the entire associated community.
Over their wide distribution range, seagrass meadows are prone to many pressures and activities,
such as habitat loss, eutrophication, pollution, anchoring, invasive species, fishing, coastal
development, aquaculture, dredging, energy generation including cables, transport, land-based
industry, agriculture, tourism, defence (target shooting), natural disturbances, disease outbreaks,
and climate change (Short and Wyllie-Echeverria, 1996; Short and Neckles, 1999; Milazzo et al.,
2004; Orth et al., 2006; Boudouresque et al., 2009; Waycott et al., 2009; van der Heide et al.,
2011), with seagrass experts agreeing that urban/industrial runoff, urban/port infrastructure
development, agricultural runoff and dredging have the greatest impact on seagrasses (Grech et
al., 2012). Seagrass losses have occurred around the world (approximately 30% of seagrasses
have been lost globally; Waycott et al., 2009), and due to their important ecological role as
ecosystem engineers, this has widespread repercussions for coastal ecosystems. Conservation
measures, including protection of existent seagrass meadows, reduction of pressures, and
restoration are necessary to ensure the continued existence of seagrass ecosystems (Orth et al.,
2006).
MERCES – D1.2. Activities and Pressures in Marine Habitats 33
4.2.1.2 North-East Atlantic Ocean (Norway) – Shallow hard – Kelp forest
Kelp forests are underwater forests formed by brown macroalgae in high densities/biomass. They
have high production, biodiversity, functioning (e.g. Steneck et al., 2002; Smale et al., 2013) and
ecosystem services (Gundersen et al., 2016), and provide food, shelter and habitat for many
associated species, including sea mammals, seabirds, fish and invertebrates (e.g. Norderhaug et
al., 2005; Christie et al., 2009). Kelp properties (e.g. growth, size, morphology) and the
associated flora and fauna species vary with environmental conditions, such as wave exposure
and ocean currents (Bekkby et al., 2014; Norderhaug et al., 2014). The kelp species Laminaria
hyperborea and Saccharina latissima are amongst the habitat building species, building up the
kelp forests dominating the shallow subtidal (down to ~30 m) rocky coasts of the North-East
Atlantic. Kelp forests are extremely resilient to disturbances such as wave impacts and storm
surges (Steneck et al., 2002). The resilience of kelp forests depends, amongst other things, on the
biodiversity, contributing to robustness, stability and an ability to recover because enough
species are available to “take over” if others are disturbed or lost. If an ecosystem’s resilience is
weakened due to pressures (e.g. over-fishing or eutrophication), a regime shift might happen, i.e.
the ecosystem flips from one dynamic equilibrium level to another (Ling et al., 2009). Kelp
forests are believed to be robust to human activities, such as L. hyperborea kelp harvesting in
West Norway (Steen et al., 2016), but still large areas of S. latissima kelp have been lost in the
southern part of Norway due to eutrophication effects (Bekkby and Moy, 2011; Moy and
Christie, 2012), and various anthropogenic activities (aquaculture and fishing, renewable energy
generation, transport, coastal development, agriculture, tourism). In other areas, L. hyperborea
kelp forests are lacking due to pollution. The loss of kelp forests is a global phenomenon,
occurring mainly due to destructive grazing by sea urchins in many areas (Steneck et al., 2002).
In northern Norway, L. hyperborea has been impacted significantly by the grazing of sea
urchins, though several areas are now recovering (Rinde et al., 2014), most likely due to a
combination of temperature increase and increasing predatory pressure on the sea urchins
(Fagerli et al., 2013, 2014).
4.2.1.3 Mediterranean Sea – Shallow hard – Macroalgal forests: Cystoseira
Macroalgal forests, such as kelps and fucoids, are dominant habitat-forming species in rocky
intertidal and subtidal habitats around all the Mediterranean coasts. They are recognized hot
spots of diversity, they provide food and habitat to diversified assemblages of understory species,
and they enhance coastal primary productivity (Gianni et al., 2013; Gubbay et al., 2016;
Cheminée et al., 2016). They are included in the EU Habitats Directive (92/43/EEC) under the
34 MERCES – D1.1. Marine habitats and degraded habitats
generic habitat type “Reefs” (1180) and several Cystoseira species are protected according to the
EU and Mediterranean legislation (i.e. Habitats Directive and Barcelona Convention).
Macroalgal forests can thrive from the intertidal to the circalittoral (photosynthetic related limit)
and they show a succession of different dominant species dwelling at each depth. Therefore,
habitat features depend on the depth where macroalgae develop. Photophilic communities with
canopy-forming algae in Mediterranean infralittoral and upper circalittoral rock were recently
assessed as Endangered (EN) under the European Red List of Habitats (Gubbay et al., 2016).
In response to multiple stressors, pressures and activities, including urbanization and coastal
development, eutrophication and increasing sediment loads in coastal areas, fishing, energy
generation and other industries, transport, agriculture and tourism these habitats (shallow and
deep) are being lost at alarming rates (Benedetti-Cecchi et al., 2001; Thibaut et al., 2005;
Bermejo et al., 2016) and manipulative experiments have demonstrated that these systems may
switch towards the dominance of algal turfs if the macroalgal canopy is removed or damaged
(Benedetti-Cecchi, 1992a, b; Benedetti-Cecchi et al., 2015).
4.2.1.4 Mediterranean Sea – Shallow hard – Coralligenous assemblages
Coralligenous assemblages are hard bottoms of biogenic origin that are mainly produced by the
accumulation of calcareous encrusting algae growing at low irradiance levels. Coralligenous
assemblages harbour approximately 10% of Mediterranean marine species (Ballesteros 2007).
Coralligenous assemblages extend around all Mediterranean coasts with a bathymetrical
distribution ranging from 20 to 120 m depth depending on the local environmental variables,
mainly light conditions (Ballesteros, 2007; Giakoumi et al., 2013; Martin et al., 2014). They are
included in the EU Habitats Directive (92/43/EEC) under the generic habitat type “Reefs” (1170)
and an Action Plan has been adopted by contracting parties of the Barcelona Convention
specifically aiming at their conservation (UNEP-MAP-RAC/SPA, 2008). Infralittoral
coralligenous bio-concretions were recently assessed as Near-Threatened (NT) under the
European Red List of Habitats (Gubbay et al., 2016).
The main engineering key species involved in the construction of coralligenous concretions are
long-lived with slow growth rates, including rhodophytes and sessile invertebrates, such as
sponges, anthozoans, bryozoans and ascidians (Garrabou and Ballesteros, 2000; Ballesteros,
2006; UNEP-MAP-RAC/SPA, 2008; Teixidó et al., 2011).
MERCES – D1.2. Activities and Pressures in Marine Habitats 35
Coralligenous assemblages are affected by several pressures, such as nutrient enrichment,
invasive species, increase of sedimentation, mechanical impacts, climate change, and numerous
anthropogenic activities including fishing, energy generation, transport, coastal and marine
structure and infrastructure, land-based industry, agriculture, tourism, research and conservation
activities (Ballesteros, 2006; Balata et al., 2007; Garrabou et al., 2009; Piazzi et al., 2012;
Giakoumi et al., 2013; Martin et al., 2014; Gatti et al., 2015; Gubbay et al., 2016).
4.2.1.5 Azores – Deep-sea – Coral Gardens
Coral gardens are defined as dense single or multi-species aggregations of sessile, filter-feeding
cold-water corals (CWC). CWCs include the anthozoan stony, soft and black corals and the
hydrozoan hydrocorals (Roberts et al., 2009). Most species need a hard substratum for settlement
and high currents to be able to find enough food input. They form structural habitats which
include patches reefs, or carbonate mounds up to 380 m high (Mienis et al., 2006). CWCs can be
found over a wide range of habitats and latitudes ranging from tropical to polar regions, and from
shallow to the deep sea (Roberts et al., 2009). In the Azores, coral gardens are found in
seamounts and island slopes, typically below 200 m depth, although the black coral Antipathella
wollastoni, can occur at 20m deep (Braga-Henriques et al., 2013; Rakka et al., 2016). CWCs
support high levels of biodiversity providing feeding, spawning and nursery areas for a wide
range of organisms, including commercially important fish species (Buhl-Mortensen et al., 2010;
Pham et al., 2015). Specific characteristics, particularly with regard to gorgonians and black
corals, such as slow growth rates, long lifespan, low fecundity and larvae with potentially low
dispersal capabilities (Roark et al., 2009; Watling et al., 2011) make them and the habitats they
form vulnerable to impacts from human activities, such as fishing (bottom trawling and
longlining), extraction of non-living resources (e.g. oil, gas and minerals), the potential
development of Blue Growth activities, such as bio-prospecting and deep-sea mining, scientific
research, marine litter, and the overall ocean warming and acidification (Freiwald et al., 2004,
Roberts et al., 2009; Carreiro-Silva et al., 2013; Pham et al., 2014).
4.2.1.6 Deep-sea soft bottom communities
Open slopes
Slopes are the steep part of the continental margins connecting the continental shelf with the
deep basins. The bathymetric gradient of slopes is characterised by sharp environmental
36 MERCES – D1.1. Marine habitats and degraded habitats
gradients, such as temperature and food availability, high habitat heterogeneity and diverse
communities (Levin and Sibuet, 2012). In spite of their restricted size (roughly 10 %, Ramirez-
Llodra et al., 2010), slopes are very important ecosystems for the functioning of the oceans and
the globe, offering important ecosystem goods and services, such as biological resources (finfish
and shellfish), nutrient cycling, biodiversity, water circulation and exchange, energy transfer, and
cultural services for educational and scientific point of views (Armstrong et al., 2010, 2012;
Rogers et al., 2015). The most immediate threats for open slopes are related to several
anthropogenic activities that include fishing, oil and gas exploitation, cable laying, pipeline
construction, underwater noise and water pollution from shipping routes, waste dumping, drill
cuttings from mining activities, and pollution from terrestrial sources (Armstrong et al., 2012,
2014; Benn et al., 2010; Ramirez-Llodra et al., 2011). The benthic responses to the effects of the
disposal of litter and waste, fishing (trawling and longlining), oil and gas exploration and
extraction have been documented at global ocean scale (Ramirez-Llodra et al., 2011), but also
along the northern-western continental margins of the Mediterranean basin (Ramirez-Llodra et
al., 2013; Pusceddu et al., 2014; Pham et al., 2014).
Submarine canyons
A submarine canyon is a steep-sided valley cut into the seabed of the continental slope,
sometimes extending well onto the continental shelf, having nearly vertical walls. They are
major and complex topographic systems that enhance the heterogeneity of continental slopes
(Levin et al., 2010). Submarine canyons are major fast-track pathways for water, sediments,
nutrients and pollutants passing from continental shelves to the deep ocean (Palanques et al.,
2008, Pham et al., 2014, Puig et al., 2014, Amaro et al., 2015). Canyons show a wide variety of
biodiversity levels, trophic interactions and ecosystem functions within each benthic components
from microbes to megafauna (Ramirez-Llodra et al., 2013; Schlining et al., 2013; De Leo et al.,
2014; Leduc et al., 2014; Ramalho et al., 2014; Amaro et al., 2015; Gambi and Danovaro, 2016).
Submarine canyons offer different ecosystem goods and services, including biological resources
(finfish and shellfish), habitat, nutrient cycling, enhance carbon sequestration and storage,
biodiversity, water circulation and exchange, and cultural services for educational and scientific
point of views (Epping et al., 2002; Canals et al., 2006; Masson et al., 2010; Armstrong et al.,
2012, 2014; Rogers et al., 2015). Pressures from human activities include fishing, dumping of
land-based mine tailings, and oil and gas extraction (Fernandez-Arcaya et al., 2017 and
MERCES – D1.2. Activities and Pressures in Marine Habitats 37
references therein). Moreover, hydrodynamic processes of canyons enhance the down-canyon
transport of litter (Fernandez-Arcaya et al., 2017, and references therein).
Seamounts
Seamounts are mountains rising from the ocean seafloor that do not reach the water's surface. It
is estimated that there are ca. 33,000 seamounts (with elevation >1000 m) and more than
138,000 knolls (elevation <1000 m) (Ramirez-Llodra et al., 2010; Harris and Whiteway, 2011;
Yesson et al., 2011; Beaulie et al., 2015; Rogers et al., 2015). The percentage of seamounts
investigated is very low (Rogers et al., 2015). The physical effects of the presence of seamounts
have been summarized in the theory of ‘seamount effects’ that includes local, small- and
mesoscale phenomena, turbulent mixing on the benthic boundary layers and regional up- or
down-welling processes (Dieckman et al., 2006). All these factors may enhance local primary
and secondary production, and community structure above the seamounts (Dower and Mackas,
1996). Seamounts are characterised by heterogeneous geophysical settings, hence, not all
seamounts are expected to affect the surrounding ecosystems in the same way but because of
their unique characteristics, seamounts may be viewed as ‘oases’ in the abyssal basins (Kvile et
al., 2014). Seamounts offer important ecosystem goods and services such as biological resources,
nutrient cycling, biodiversity, habitat, and cultural services for education and science (Rogers et
al., 2015). Major existing and future human activities on seamount habitats are fishing, rock-
drilling, gas and oil exploitation, deep-sea mining, and climate change. Trawling, in particular,
physically destroys reef-building organisms (Williams et al., 2010), disturbs the filter feeding
communities by sediment re-suspension (Clark et al., 2010), and selectively removes long-lived
commercially valuable fish species (Pitcher, 2010) that are extremely vulnerable to heavy fishing
(Morato et al., 2006).
Deep-sea Basins
Deep-sea basins are plains on the deep ocean floor, usually found at depths between 3000 and
6000 m, lying generally between the foot of a continental rise and a mid-ocean ridge. They
represent the largest biome on our planet, covering 75% of the ocean floor (Danovaro et al.,
2014). With less than 1% investigated (Rogers et al., 2015), this ecosystem is much more
temporally and spatially variable than previously thought (Lampitt et al., 2010; Pusceddu et al.,
2010, 2013; Rex and Etter, 2010). A global-scale study reports that deep-sea ecosystem
functioning is positively exponentially related to deep-sea biodiversity, suggesting that a minor
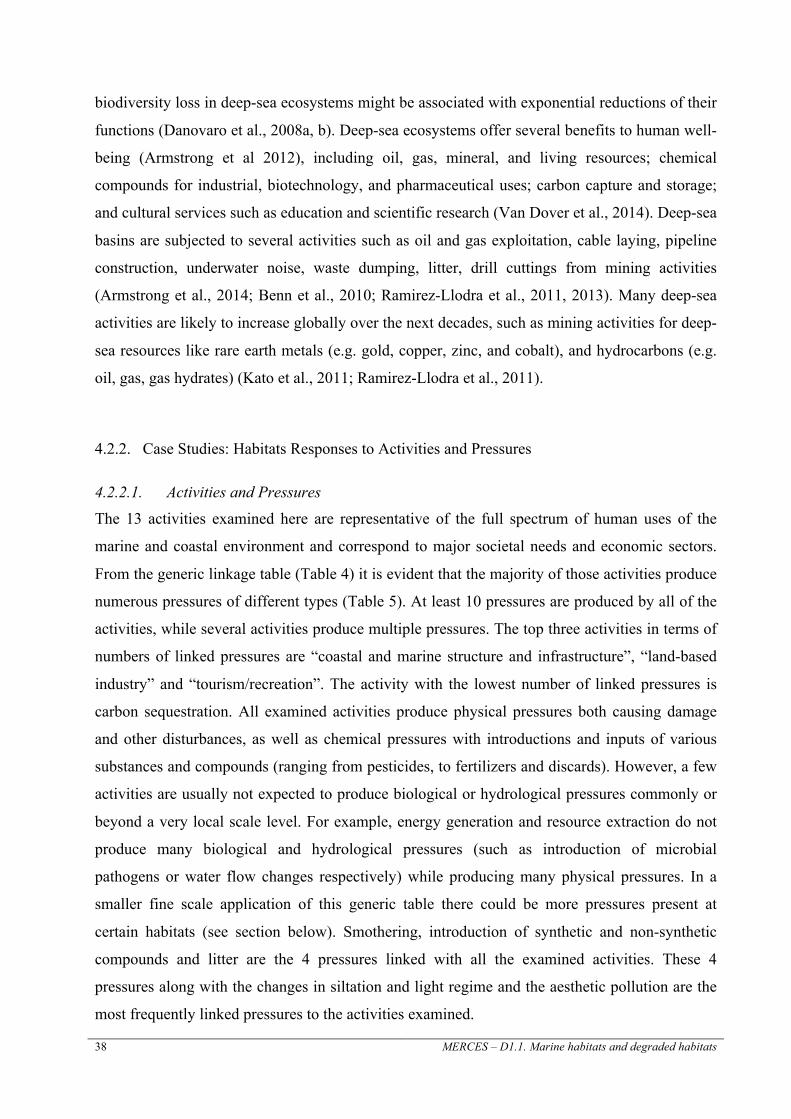
38 MERCES – D1.1. Marine habitats and degraded habitats
biodiversity loss in deep-sea ecosystems might be associated with exponential reductions of their
functions (Danovaro et al., 2008a, b). Deep-sea ecosystems offer several benefits to human well-
being (Armstrong et al 2012), including oil, gas, mineral, and living resources; chemical
compounds for industrial, biotechnology, and pharmaceutical uses; carbon capture and storage;
and cultural services such as education and scientific research (Van Dover et al., 2014). Deep-sea
basins are subjected to several activities such as oil and gas exploitation, cable laying, pipeline
construction, underwater noise, waste dumping, litter, drill cuttings from mining activities
(Armstrong et al., 2014; Benn et al., 2010; Ramirez-Llodra et al., 2011, 2013). Many deep-sea
activities are likely to increase globally over the next decades, such as mining activities for deep-
sea resources like rare earth metals (e.g. gold, copper, zinc, and cobalt), and hydrocarbons (e.g.
oil, gas, gas hydrates) (Kato et al., 2011; Ramirez-Llodra et al., 2011).
4.2.2. Case Studies: Habitats Responses to Activities and Pressures
4.2.2.1. Activities and Pressures
The 13 activities examined here are representative of the full spectrum of human uses of the
marine and coastal environment and correspond to major societal needs and economic sectors.
From the generic linkage table (Table 4) it is evident that the majority of those activities produce
numerous pressures of different types (Table 5). At least 10 pressures are produced by all of the
activities, while several activities produce multiple pressures. The top three activities in terms of
numbers of linked pressures are “coastal and marine structure and infrastructure”, “land-based
industry” and “tourism/recreation”. The activity with the lowest number of linked pressures is
carbon sequestration. All examined activities produce physical pressures both causing damage
and other disturbances, as well as chemical pressures with introductions and inputs of various
substances and compounds (ranging from pesticides, to fertilizers and discards). However, a few
activities are usually not expected to produce biological or hydrological pressures commonly or
beyond a very local scale level. For example, energy generation and resource extraction do not
produce many biological and hydrological pressures (such as introduction of microbial
pathogens or water flow changes respectively) while producing many physical pressures. In a
smaller fine scale application of this generic table there could be more pressures present at
certain habitats (see section below). Smothering, introduction of synthetic and non-synthetic
compounds and litter are the 4 pressures linked with all the examined activities. These 4
pressures along with the changes in siltation and light regime and the aesthetic pollution are the
most frequently linked pressures to the activities examined.

MERCES – D1.2. Activities and Pressures in Marine Habitats 39
Table 4. Generic linkage table showing expected pressures by activity, a matrix of 13 activities x 26 pressures. Pressures are grouped into 5 categories: physical damage (pink), other physical damage (yellow), chemical (lavender), biological (green) and hydrological (blue).
Table 5. Types of pressures arising by each activity based on the generic linkage table (Table 4).
Physicaldamage Otherphysical Chemical Biological HydrologicalPressure presence/absence - generic example
Smothe
ring
Substratum
loss
siltatio
nandlightre
gime
Abrasio
n
extractio
nofnon
-livingre
sources
Noise
Litter
Aesthe
ticpollutio
n
Collisio
n
Barriertospeciesm
ovem
ent
Electrom
agne
ticch
anges
Introd
uctio
nofsy
nthe
tic
Introd
uctio
nofnon
-synthetic
Introd
uctio
nofra
dion
uclides
Introd
uctio
nofothersu
bstances
NandPen
richm
ent
Inpu
tofo
rganicmatter
microb
ialpatho
gens
non-indigeno
ussp
ecies
extractio
nofsp
ecies
Thermalre
gimechange
Salinity
regimechange
Emergenceregimechange
Waterflow
ratech
anges
pHch
anges
Changeinwaveexpo
sure
26 physica
l
otherp
hysi
chem
i
biologica
l
hydrologica
l
ActivityProductionoflivingresources
1 1 1 1 0 1 1 1 0 0 0 1 1 0 0 1 1 1 1 0 0 0 0 1 1 1
Extractionoflivingresources
1 1 1 1 1 1 1 1 1 1 1 1 1 0 0 0 1 0 1 1 0 0 0 0 0 0
Transport 1 1 1 1 0 1 1 1 1 0 0 1 1 0 0 0 1 1 1 0 0 0 0 0 0 0Renewableenergygeneration
1 1 1 1 1 1 1 1 1 1 1 1 1 0 0 0 1 0 0 0 0 0 0 1 0 1
Non-renewableenergygeneration
1 1 1 1 1 1 1 1 0 0 1 1 1 1 0 0 0 0 0 0 1 1 0 0 0 1
Extractionofnon-livingresources
1 1 1 1 1 1 1 1 1 0 0 1 1 0 0 0 0 0 0 1 0 0 0 0 0 0
CoastalandmarinestructureandInfrastructure
1 1 1 1 1 1 1 1 0 1 1 1 1 0 0 0 0 0 1 0 0 1 1 1 1 1
Land-basedIndustry 1 0 1 0 0 0 1 1 0 1 0 1 1 0 1 1 1 1 1 0 1 1 0 1 1 1Agriculture 1 0 1 0 0 0 1 1 0 0 0 1 1 0 0 1 1 1 0 0 1 1 0 0 1 0Tourism/recreation 1 1 1 1 1 1 1 1 1 0 0 1 1 0 0 1 1 1 1 1 0 0 0 0 0 1Defenseandnationalsecurity
1 1 1 1 0 1 1 1 1 1 0 1 1 1 1 1 0 0 1 0 0 0 0 0 0 0
Researchandconservation
1 1 1 1 1 1 1 1 1 0 0 1 1 1 1 0 1 0 1 1 0 0 0 1 0 0
CarbonSequestration 1 1 0 1 1 1 1 0 0 0 0 1 1 0 1 0 0 0 0 0 0 1 0 0 1 0

40 MERCES – D1.1. Marine habitats and degraded habitats
4.2.2.2. The case study examples, activities and pressures
From the case study habitat examples (Table 6 to Table 11) it is evident that the number of
activities impacting each habitat differs significantly with the highest number of activities
present in shallow soft areas and the lowest number present in the deep-sea habitats. All types
(groups) of pressures are present as mechanisms of change, although not all activities produce all
types (Table 5); whilst the physical pressures are always present, most activities produce only 2-
3 types of pressure.
“Extraction of living resources”, “transport”, “coastal and marine structure and infrastructure” as
well as “research and conservation” are present in all the studied key habitat examples, whilst,
“land-based industry”, “tourism/recreation”, “renewable energy generation” and “agriculture”
additionally operate in all the shallow soft and hard habitats. All of the key habitats examined
feature at least one existing or future blue growth focus area (e.g. aquaculture, renewable energy
generation or mining) and blue economy activity (e.g. fishing). Almost all of the pressures
examined are present within shallow seagrass habitats, and several (e.g. smothering, changes in
siltation and light, substratum loss, litter) appear to derive from multiple, often co-occurring,
activities. Most pressures are produced by “coastal and marine structure and infrastructure” and
“land based industry” and the least by “agriculture”. All 5 types of pressures are present in
seagrass habitats overall, although they do not always occur together, i.e. they are not produced
by all the activities or concurrently. This is also true for the 3 shallow hard habitats, regardless of
the lower number of activities and pressures operating there. “Changes in siltation and light
regime”, “introduction of synthetic and non-synthetic compounds” and “input of organic matter
and litter” are the most frequent pressures for the shallow hard habitats algal forests and the
coralligenous, whereas “changes in siltation and light regime”, “smothering” and “litter” are
present in the shallow hard kelp habitat example. “Abrasion”, “substratum loss” and “litter”
occur most often in the deep-sea example as they are generated by the majority of activities
operating in that area (Table 10). All types of pressures are present overall, although most
activities induce only 2-3 types, with the physical pressures always being present.
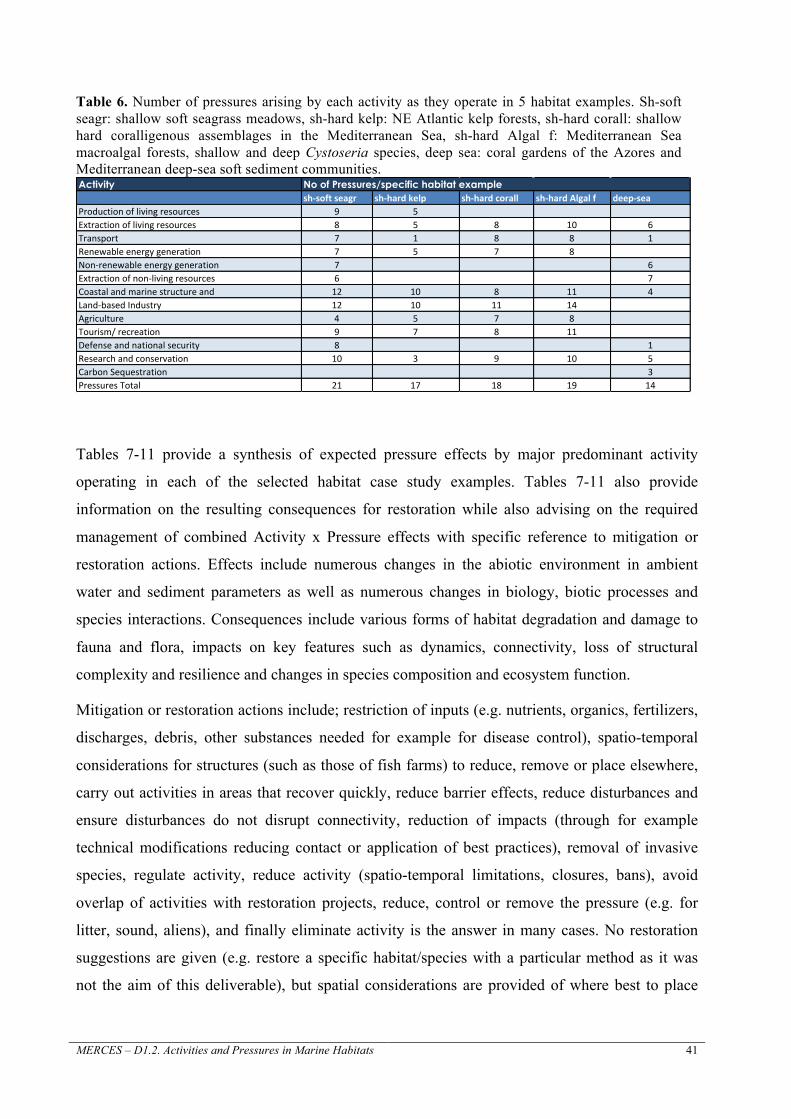
MERCES – D1.2. Activities and Pressures in Marine Habitats 41
Table 6. Number of pressures arising by each activity as they operate in 5 habitat examples. Sh-soft seagr: shallow soft seagrass meadows, sh-hard kelp: NE Atlantic kelp forests, sh-hard corall: shallow hard coralligenous assemblages in the Mediterranean Sea, sh-hard Algal f: Mediterranean Sea macroalgal forests, shallow and deep Cystoseria species, deep sea: coral gardens of the Azores and Mediterranean deep-sea soft sediment communities.
Tables 7-11 provide a synthesis of expected pressure effects by major predominant activity
operating in each of the selected habitat case study examples. Tables 7-11 also provide
information on the resulting consequences for restoration while also advising on the required
management of combined Activity x Pressure effects with specific reference to mitigation or
restoration actions. Effects include numerous changes in the abiotic environment in ambient
water and sediment parameters as well as numerous changes in biology, biotic processes and
species interactions. Consequences include various forms of habitat degradation and damage to
fauna and flora, impacts on key features such as dynamics, connectivity, loss of structural
complexity and resilience and changes in species composition and ecosystem function.
Mitigation or restoration actions include; restriction of inputs (e.g. nutrients, organics, fertilizers,
discharges, debris, other substances needed for example for disease control), spatio-temporal
considerations for structures (such as those of fish farms) to reduce, remove or place elsewhere,
carry out activities in areas that recover quickly, reduce barrier effects, reduce disturbances and
ensure disturbances do not disrupt connectivity, reduction of impacts (through for example
technical modifications reducing contact or application of best practices), removal of invasive
species, regulate activity, reduce activity (spatio-temporal limitations, closures, bans), avoid
overlap of activities with restoration projects, reduce, control or remove the pressure (e.g. for
litter, sound, aliens), and finally eliminate activity is the answer in many cases. No restoration
suggestions are given (e.g. restore a specific habitat/species with a particular method as it was
not the aim of this deliverable), but spatial considerations are provided of where best to place
ActivityColumn1 sh-softseagr sh-hardkelp sh-hardcorall sh-hardAlgalf deep-seaProductionoflivingresources 9 5Extractionoflivingresources 8 5 8 10 6Transport 7 1 8 8 1Renewableenergygeneration 7 5 7 8Non-renewableenergygeneration 7 6Extractionofnon-livingresources 6 7Coastalandmarinestructureand 12 10 8 11 4Land-basedIndustry 12 10 11 14Agriculture 4 5 7 8Tourism/recreation 9 7 8 11Defenseandnationalsecurity 8 1Researchandconservation 10 3 9 10 5CarbonSequestration 3PressuresTotal 21 17 18 19 14
No of Pressures/specific habitat example
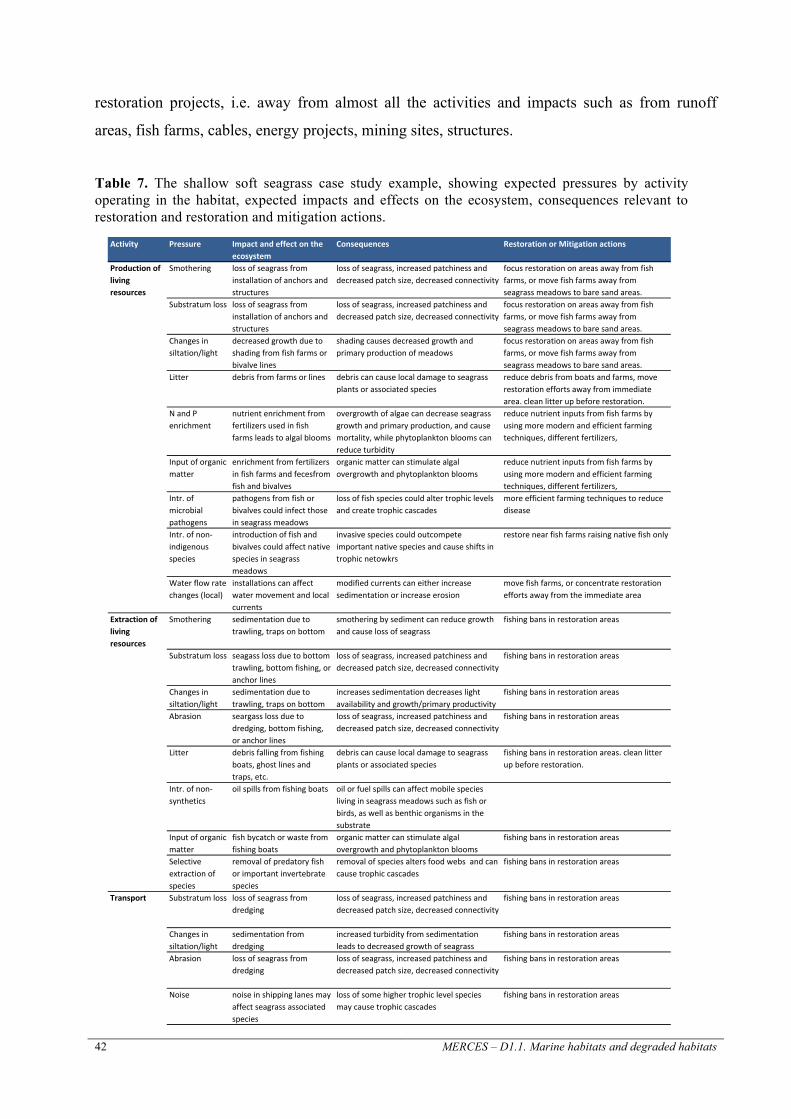
42 MERCES – D1.1. Marine habitats and degraded habitats
restoration projects, i.e. away from almost all the activities and impacts such as from runoff
areas, fish farms, cables, energy projects, mining sites, structures.
Table 7. The shallow soft seagrass case study example, showing expected pressures by activity operating in the habitat, expected impacts and effects on the ecosystem, consequences relevant to restoration and restoration and mitigation actions.
Activity Pressure Impactandeffectontheecosystem
Consequences RestorationorMitigationactions
Productionoflivingresources
Smothering lossofseagrassfrominstallationofanchorsandstructures
lossofseagrass,increasedpatchinessanddecreasedpatchsize,decreasedconnectivity
focusrestorationonareasawayfromfishfarms,ormovefishfarmsawayfromseagrassmeadowstobaresandareas.
Substratumloss lossofseagrassfrominstallationofanchorsandstructures
lossofseagrass,increasedpatchinessanddecreasedpatchsize,decreasedconnectivity
focusrestorationonareasawayfromfishfarms,ormovefishfarmsawayfromseagrassmeadowstobaresandareas.
Changesinsiltation/light
decreasedgrowthduetoshadingfromfishfarmsorbivalvelines
shadingcausesdecreasedgrowthandprimaryproductionofmeadows
focusrestorationonareasawayfromfishfarms,ormovefishfarmsawayfromseagrassmeadowstobaresandareas.
Litter debrisfromfarmsorlines debriscancauselocaldamagetoseagrassplantsorassociatedspecies
reducedebrisfromboatsandfarms,moverestorationeffortsawayfromimmediatearea.cleanlitterupbeforerestoration.
NandPenrichment
nutrientenrichmentfromfertilizersusedinfishfarmsleadstoalgalblooms
overgrowthofalgaecandecreaseseagrassgrowthandprimaryproduction,andcausemortality,whilephytoplanktonbloomscanreduceturbidity
reducenutrientinputsfromfishfarmsbyusingmoremodernandefficientfarmingtechniques,differentfertilizers,
Inputoforganicmatter
enrichmentfromfertilizersinfishfarmsandfecesfromfishandbivalves
organicmattercanstimulatealgalovergrowthandphytoplanktonblooms
reducenutrientinputsfromfishfarmsbyusingmoremodernandefficientfarmingtechniques,differentfertilizers,
Intr.ofmicrobialpathogens
pathogensfromfishorbivalvescouldinfectthoseinseagrassmeadows
lossoffishspeciescouldaltertrophiclevelsandcreatetrophiccascades
moreefficientfarmingtechniquestoreducedisease
Intr.ofnon-indigenousspecies
introductionoffishandbivalvescouldaffectnativespeciesinseagrassmeadows
invasivespeciescouldoutcompeteimportantnativespeciesandcauseshiftsintrophicnetowkrs
restorenearfishfarmsraisingnativefishonly
Waterflowratechanges(local)
installationscanaffectwatermovementandlocalcurrents
modifiedcurrentscaneitherincreasesedimentationorincreaseerosion
movefishfarms,orconcentraterestorationeffortsawayfromtheimmediatearea
Extractionoflivingresources
Smothering sedimentationduetotrawling,trapsonbottom
smotheringbysedimentcanreducegrowthandcauselossofseagrass
fishingbansinrestorationareas
Substratumloss seagasslossduetobottomtrawling,bottomfishing,oranchorlines
lossofseagrass,increasedpatchinessanddecreasedpatchsize,decreasedconnectivity
fishingbansinrestorationareas
Changesinsiltation/light
sedimentationduetotrawling,trapsonbottom
increasessedimentationdecreaseslightavailabilityandgrowth/primaryproductivity
fishingbansinrestorationareas
Abrasion seargasslossduetodredging,bottomfishing,oranchorlines
lossofseagrass,increasedpatchinessanddecreasedpatchsize,decreasedconnectivity
fishingbansinrestorationareas
Litter debrisfallingfromfishingboats,ghostlinesandtraps,etc.
debriscancauselocaldamagetoseagrassplantsorassociatedspecies
fishingbansinrestorationareas.cleanlitterupbeforerestoration.
Intr.ofnon-synthetics
oilspillsfromfishingboats oilorfuelspillscanaffectmobilespecieslivinginseagrassmeadowssuchasfishorbirds,aswellasbenthicorganismsinthesubstrate
Inputoforganicmatter
fishbycatchorwastefromfishingboats
organicmattercanstimulatealgalovergrowthandphytoplanktonblooms
fishingbansinrestorationareas
Selectiveextractionofspecies
removalofpredatoryfishorimportantinvertebratespecies
removalofspeciesaltersfoodwebsandcancausetrophiccascades
fishingbansinrestorationareas
Transport Substratumloss lossofseagrassfromdredging
lossofseagrass,increasedpatchinessanddecreasedpatchsize,decreasedconnectivity
fishingbansinrestorationareas
Changesinsiltation/light
sedimentationfromdredging
increasedturbidityfromsedimentationleadstodecreasedgrowthofseagrass
fishingbansinrestorationareas
Abrasion lossofseagrassfromdredging
lossofseagrass,increasedpatchinessanddecreasedpatchsize,decreasedconnectivity
fishingbansinrestorationareas
Noise noiseinshippinglanesmayaffectseagrassassociatedspecies
lossofsomehighertrophiclevelspeciesmaycausetrophiccascades
fishingbansinrestorationareas
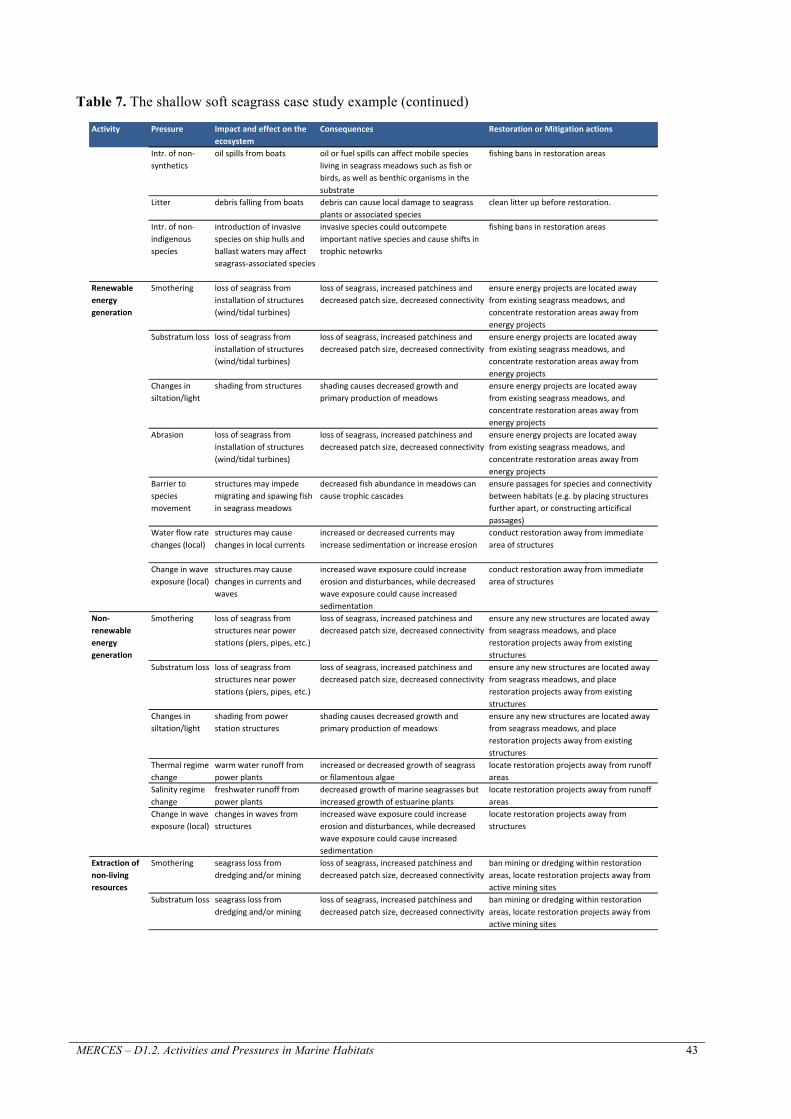
MERCES – D1.2. Activities and Pressures in Marine Habitats 43
Table 7. The shallow soft seagrass case study example (continued)
Activity Pressure Impactandeffectontheecosystem
Consequences RestorationorMitigationactions
Intr.ofnon-synthetics
oilspillsfromboats oilorfuelspillscanaffectmobilespecieslivinginseagrassmeadowssuchasfishorbirds,aswellasbenthicorganismsinthesubstrate
fishingbansinrestorationareas
Litter debrisfallingfromboats debriscancauselocaldamagetoseagrassplantsorassociatedspecies
cleanlitterupbeforerestoration.
Intr.ofnon-indigenousspecies
introductionofinvasivespeciesonshiphullsandballastwatersmayaffectseagrass-associatedspecies
invasivespeciescouldoutcompeteimportantnativespeciesandcauseshiftsintrophicnetowrks
fishingbansinrestorationareas
Renewableenergygeneration
Smothering lossofseagrassfrominstallationofstructures(wind/tidalturbines)
lossofseagrass,increasedpatchinessanddecreasedpatchsize,decreasedconnectivity
ensureenergyprojectsarelocatedawayfromexistingseagrassmeadows,andconcentraterestorationareasawayfromenergyprojects
Substratumloss lossofseagrassfrominstallationofstructures(wind/tidalturbines)
lossofseagrass,increasedpatchinessanddecreasedpatchsize,decreasedconnectivity
ensureenergyprojectsarelocatedawayfromexistingseagrassmeadows,andconcentraterestorationareasawayfromenergyprojects
Changesinsiltation/light
shadingfromstructures shadingcausesdecreasedgrowthandprimaryproductionofmeadows
ensureenergyprojectsarelocatedawayfromexistingseagrassmeadows,andconcentraterestorationareasawayfromenergyprojects
Abrasion lossofseagrassfrominstallationofstructures(wind/tidalturbines)
lossofseagrass,increasedpatchinessanddecreasedpatchsize,decreasedconnectivity
ensureenergyprojectsarelocatedawayfromexistingseagrassmeadows,andconcentraterestorationareasawayfromenergyprojects
Barriertospeciesmovement
structuresmayimpedemigratingandspawingfishinseagrassmeadows
decreasedfishabundanceinmeadowscancausetrophiccascades
ensurepassagesforspeciesandconnectivitybetweenhabitats(e.g.byplacingstructuresfurtherapart,orconstructingarticificalpassages)
Waterflowratechanges(local)
structuresmaycausechangesinlocalcurrents
increasedordecreasedcurrentsmayincreasesedimentationorincreaseerosion
conductrestorationawayfromimmediateareaofstructures
Changeinwaveexposure(local)
structuresmaycausechangesincurrentsandwaves
increasedwaveexposurecouldincreaseerosionanddisturbances,whiledecreasedwaveexposurecouldcauseincreasedsedimentation
conductrestorationawayfromimmediateareaofstructures
Non-renewableenergygeneration
Smothering lossofseagrassfromstructuresnearpowerstations(piers,pipes,etc.)
lossofseagrass,increasedpatchinessanddecreasedpatchsize,decreasedconnectivity
ensureanynewstructuresarelocatedawayfromseagrassmeadows,andplacerestorationprojectsawayfromexistingstructures
Substratumloss lossofseagrassfromstructuresnearpowerstations(piers,pipes,etc.)
lossofseagrass,increasedpatchinessanddecreasedpatchsize,decreasedconnectivity
ensureanynewstructuresarelocatedawayfromseagrassmeadows,andplacerestorationprojectsawayfromexistingstructures
Changesinsiltation/light
shadingfrompowerstationstructures
shadingcausesdecreasedgrowthandprimaryproductionofmeadows
ensureanynewstructuresarelocatedawayfromseagrassmeadows,andplacerestorationprojectsawayfromexistingstructures
Thermalregimechange
warmwaterrunofffrompowerplants
increasedordecreasedgrowthofseagrassorfilamentousalgae
locaterestorationprojectsawayfromrunoffareas
Salinityregimechange
freshwaterrunofffrompowerplants
decreasedgrowthofmarineseagrassesbutincreasedgrowthofestuarineplants
locaterestorationprojectsawayfromrunoffareas
Changeinwaveexposure(local)
changesinwavesfromstructures
increasedwaveexposurecouldincreaseerosionanddisturbances,whiledecreasedwaveexposurecouldcauseincreasedsedimentation
locaterestorationprojectsawayfromstructures
Extractionofnon-livingresources
Smothering seagrasslossfromdredgingand/ormining
lossofseagrass,increasedpatchinessanddecreasedpatchsize,decreasedconnectivity
banminingordredgingwithinrestorationareas,locaterestorationprojectsawayfromactiveminingsites
Substratumloss seagrasslossfromdredgingand/ormining
lossofseagrass,increasedpatchinessanddecreasedpatchsize,decreasedconnectivity
banminingordredgingwithinrestorationareas,locaterestorationprojectsawayfromactiveminingsites
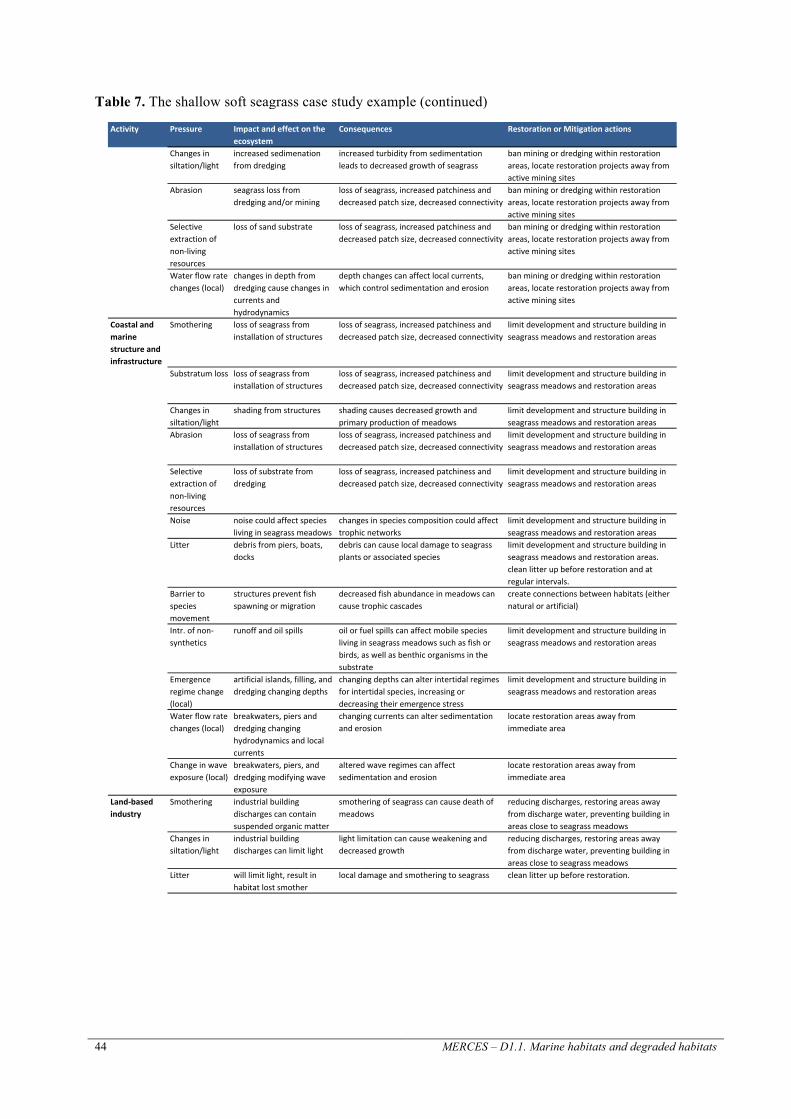
44 MERCES – D1.1. Marine habitats and degraded habitats
Table 7. The shallow soft seagrass case study example (continued)
Activity Pressure Impactandeffectontheecosystem
Consequences RestorationorMitigationactions
Changesinsiltation/light
increasedsedimenationfromdredging
increasedturbidityfromsedimentationleadstodecreasedgrowthofseagrass
banminingordredgingwithinrestorationareas,locaterestorationprojectsawayfromactiveminingsites
Abrasion seagrasslossfromdredgingand/ormining
lossofseagrass,increasedpatchinessanddecreasedpatchsize,decreasedconnectivity
banminingordredgingwithinrestorationareas,locaterestorationprojectsawayfromactiveminingsites
Selectiveextractionofnon-livingresources
lossofsandsubstrate lossofseagrass,increasedpatchinessanddecreasedpatchsize,decreasedconnectivity
banminingordredgingwithinrestorationareas,locaterestorationprojectsawayfromactiveminingsites
Waterflowratechanges(local)
changesindepthfromdredgingcausechangesincurrentsandhydrodynamics
depthchangescanaffectlocalcurrents,whichcontrolsedimentationanderosion
banminingordredgingwithinrestorationareas,locaterestorationprojectsawayfromactiveminingsites
Coastalandmarinestructureandinfrastructure
Smothering lossofseagrassfrominstallationofstructures
lossofseagrass,increasedpatchinessanddecreasedpatchsize,decreasedconnectivity
limitdevelopmentandstructurebuildinginseagrassmeadowsandrestorationareas
Substratumloss lossofseagrassfrominstallationofstructures
lossofseagrass,increasedpatchinessanddecreasedpatchsize,decreasedconnectivity
limitdevelopmentandstructurebuildinginseagrassmeadowsandrestorationareas
Changesinsiltation/light
shadingfromstructures shadingcausesdecreasedgrowthandprimaryproductionofmeadows
limitdevelopmentandstructurebuildinginseagrassmeadowsandrestorationareas
Abrasion lossofseagrassfrominstallationofstructures
lossofseagrass,increasedpatchinessanddecreasedpatchsize,decreasedconnectivity
limitdevelopmentandstructurebuildinginseagrassmeadowsandrestorationareas
Selectiveextractionofnon-livingresources
lossofsubstratefromdredging
lossofseagrass,increasedpatchinessanddecreasedpatchsize,decreasedconnectivity
limitdevelopmentandstructurebuildinginseagrassmeadowsandrestorationareas
Noise noisecouldaffectspecieslivinginseagrassmeadows
changesinspeciescompositioncouldaffecttrophicnetworks
limitdevelopmentandstructurebuildinginseagrassmeadowsandrestorationareas
Litter debrisfrompiers,boats,docks
debriscancauselocaldamagetoseagrassplantsorassociatedspecies
limitdevelopmentandstructurebuildinginseagrassmeadowsandrestorationareas.cleanlitterupbeforerestorationandatregularintervals.
Barriertospeciesmovement
structurespreventfishspawningormigration
decreasedfishabundanceinmeadowscancausetrophiccascades
createconnectionsbetweenhabitats(eithernaturalorartificial)
Intr.ofnon-synthetics
runoffandoilspills oilorfuelspillscanaffectmobilespecieslivinginseagrassmeadowssuchasfishorbirds,aswellasbenthicorganismsinthesubstrate
limitdevelopmentandstructurebuildinginseagrassmeadowsandrestorationareas
Emergenceregimechange(local)
artificialislands,filling,anddredgingchangingdepths
changingdepthscanalterintertidalregimesforintertidalspecies,increasingordecreasingtheiremergencestress
limitdevelopmentandstructurebuildinginseagrassmeadowsandrestorationareas
Waterflowratechanges(local)
breakwaters,piersanddredgingchanginghydrodynamicsandlocalcurrents
changingcurrentscanaltersedimentationanderosion
locaterestorationareasawayfromimmediatearea
Changeinwaveexposure(local)
breakwaters,piers,anddredgingmodifyingwaveexposure
alteredwaveregimescanaffectsedimentationanderosion
locaterestorationareasawayfromimmediatearea
Land-basedindustry
Smothering industrialbuildingdischargescancontainsuspendedorganicmatter
smotheringofseagrasscancausedeathofmeadows
reducingdischarges,restoringareasawayfromdischargewater,preventingbuildinginareasclosetoseagrassmeadows
Changesinsiltation/light
industrialbuildingdischargescanlimitlight
lightlimitationcancauseweakeninganddecreasedgrowth
reducingdischarges,restoringareasawayfromdischargewater,preventingbuildinginareasclosetoseagrassmeadows
Litter willlimitlight,resultinhabitatlostsmother
localdamageandsmotheringtoseagrass cleanlitterupbeforerestoration.

MERCES – D1.2. Activities and Pressures in Marine Habitats 45
Table 7. The shallow soft seagrass case study example (continued)
Activity Pressure Impactandeffectontheecosystem
Consequences RestorationorMitigationactions
Intr.ofsynthetics
industrialbuildingdischargesfullofsyntheticcompoundseffectsthephysiologyofthemeadow.
canlimitreproductivesuccess,slowgrowth,increasestressandmortality
reducingdischarges,restoringareasawayfromdischargewater,preventingbuildinginareasclosetoseagrassmeadows
Intr.ofnon-synthetics
industrialbuildingdischargefullofnon-syntheticcompounds
canlimitreproductivesuccess,slowgrowth,increasestressandmortality
reducingdischarges,restoringareasawayfromdischargewater,preventingbuildinginareasclosetoseagrassmeadows
NandPenrichment
inductrialdischargefullofnandpwillresultwithplanktonblooms
planktonbloomswilllimitlight,changethebiochemicalparameters.mayincreasethegrowthrateforawhilebutinthelongrunwillharmseagrassthroughshadingandovergrowth
reducingdischarges,restoringareasawayfromdischargewater,preventingbuildinginareasclosetoseagrassmeadows
Inputoforganicmatter
planktonbloomsincreasewhichlimitslight
planktonbloomswilllimitlight,changethebiochemicalparameters.mayincreasethegrowthrateforawhilebutinthelongrunwillharmseagrassthroughshadingandovergrowth
reducingdischarges,restoringareasawayfromdischargewater,preventingbuildinginareasclosetoseagrassmeadows
Thermalregimechange
coolingwaterdischargewillchangelocaltemperature
canlimitreproductivesuccess,slowgrowth,increasestressandmortality
reducingdischarges,restoringareasawayfromdischargewater,preventingbuildinginareasclosetoseagrassmeadows
Salinityregimechange
industrialbuildingdischargesrichinionschangessalinity
canlimitreproductivesuccess,slowgrowth,increasestressandmortality
reducingdischarges,restoringareasawayfromdischargewater,preventingbuildinginareasclosetoseagrassmeadows
Waterflowratechanges(local)
structuresaffectcurrents shiftinerosionorsedimentationrates restoreareasawayfromstructures,preventbuildingnearseagrassmeadows
Changeinwaveexposure(local)
structurescanaffectwaveexposure
shiftinerosionorsedimentationrates,damagetoleaves
restoreareasawayfromstructures,preventbuildingnearseagrassmeadows
Agriculture Changesinsiltation/light
runoffwaterfromoverirrigationcanhighamountsofsilt
lightlimitationcancauseweakeninganddecreasedgrowth
reducingdischarges,restoringareasawayfromdischargewater.
Litter debrisfromrunoff localdamageandlightlimitation cleanlitterupbeforerestoration.NandPenrichment
nandp(fertilizers)fromcontaminatedrunoffwaterfromoverirrigationcanresultinplanktonandfilamentousalgalbloomsblooms
planktonbloomswilllimitlight,changethebiochemicalparameters.mayincreasethegrowthrateforawhilebutinthelongrunwillharmseagrassthroughshadingandovergrowth
reducingdischarges,restoringareasawayfromdischargewater,reducetheamountoffertilizersusedinfarmlands
Inputoforganicmatter
organicmatterfromrunoffwaterwithhighnutrientcontent
planktonbloomswilllimitlight,changethebiochemicalparameters.mayincreasethegrowthrateforawhilebutinthelongrunwillharmseagrassthroughshadingandovergrowth
reducingdischarges,restoringareasawayfromdischargewater,reducetheamountoffertilizersusedinfarmlands
Tourism/recreation
Smothering clearingactivities siltandsubstratecansmothermeadows,causeseagrasshabitatloss.
reduceactivitesinseagrassmeadows.enactprotectionmeasuresreducingaccess
Substratumloss substratumdestructionduetoclearingorbuildingstructures
lossofseagrasshabitat reduceactivitesinseagrassmeadows.enactprotectionmeasuresreducingaccess
Changesinsiltation/light
floatingdecksorplatforms,clearingactivities
clearingactivitieschangethesiltation,limitlightavailability.floatingplatformsalsolimitlightavaliablity.thesewilllimitgrowthandreproduction,increasestress.
reduceactivitesinseagrassmeadows.enactprotectionmeasuresreducingaccess
Abrasion clearingactivities continuesclearingdamagesthemeadows reduceactivitesinseagrassmeadows.enactprotectionmeasuresreducingaccess
Litter litteringbytouristsandrecreationalactivitiesfromboattours,atbeaches
cansmotheranddamagemeadows cleanlitterupbeforerestorationandatregularintervals.
NandPenrichment
excessiveuseofdetergents,cleaningagentsandsewersystemsbyhotelsandrecreationalplaces
nutrientenrichmentcausesalgalblooms,decreasesseagrassgrowth.
reducedischargesinseagrassmeadows.restoreinareasawayfromdischarges

46 MERCES – D1.1. Marine habitats and degraded habitats
Table 7. The shallow soft seagrass case study example (continued)
Activity Pressure Impactandeffectontheecosystem
Consequences RestorationorMitigationactions
Inputoforganicmatter
organicmatterinputbyhotelsandrecreationalplacesincreasesthenutrientlevelsinwater
increasesphytoplanktonblooms,inhibitslightpenetrationthusphotosynthesis
reducedischargesinseagrassmeadows.restoreinareasawayfromdischarges
Selectiveextractionofspecies
recreationalfishing,marineaquariums,scubadiving
decreasedbiodiversity,shiftsintrophicstructure
fishingbansinrestorationareas.
Changeinwaveexposure(local)
clearingactivities,constructionofstructures
lostinnaturalwavebarriers,exposingmeadowstoerosion.changessedimentationanderosion
restoreareasawayfromstructures,preventbuildingnearseagrassmeadows
Defenseandnationalsecurity
Smothering usingunderwaterweaponry
candamageandweakenmeadows reduceactivitiesinseagrassmeadows.
Substratumloss destructionduetoexplosions
useofexplosiveswilldamageanddestroysoftbottomsubstratum
reduceactivitiesinseagrassmeadows.
Noise excessiveshiptraffic canaffectspecieslivinginseagrass restoreinundisturbedareas.Intr.ofsynthetics
pollution,e.g.chemicalspills
damagetoseagrassmeadowsandassociatedspecies
betterpreventionofspills
Intr.ofnon-synthetics
pollution,e.g.oilspills damagetoseagrassmeadowsandassociatedspecies
betterpreventionofspills
NandPenrichment
nitrogenorphosphorusbasedweaponry
excessnitrogenorphosphoruswillcausebloomsandlimitphotosynthesis,growth,increasestress
redicedischarges.restoreinareasawayfromdischarges.
Litter litterfromships damageseagrasshabitat cleanlitterupbeforerestorationandatregularintervals.
Barriertospeciesmovement
constructionofstructures blocksseagrassdispersal,migrationofassociatedspecies
reduceactivitiesinseagrassmeadows.createconnectionsbetweenhabitats(naturalorartificial)
Researchandconservation
Smothering substratumsmotheringforexperimentalpurposes
lossofseagrasshabitat reducedisturbancesandensuredisturbancesdonotdisruptconnectivity.donotperformdestructivesamplinginnewlyrestoredareas.
Substratumloss substratumdestructionforexperimentalpurposes
duringdestructivesamplingssustratumlosswilleffectseagrassandweaken,resultinbarrenpatches
reducedisturbancesandensuredisturbancesdonotdisruptconnectivity.donotperformdestructivesamplinginnewlyrestoredareas.
Changesinsiltation/light
duringexperimentalactivitieslightlimitation
lightlimitationcancauseweakeningandstress,inhibitsphotosynthesis
reducedisturbancesandensuredisturbancesdonotdisruptconnectivity.donotperformdestructivesamplinginnewlyrestoredareas.
Abrasion abrasionsduetosampling destructivesamplingwillweaken,vulnerabletodiseases
reducedisturbancesandensuredisturbancesdonotdisruptconnectivity.donotperformdestructivesamplinginnewlyrestoredareas.
Selectiveextractionofnon-livingresources
removalofsubstrateforexperimentalpurposes
candestroysomeseagrasshabitat reducedisturbancesandensuredisturbancesdonotdisruptconnectivity.donotperformdestructivesamplinginnewlyrestoredareas.
Intr.ofsynthetics
Intr.ofsyntheticsforexperimentalactivities
syntheticcompoundintroductionforexperimentalproposesmighthaveeffectsinthelongrun.
ensurepropercleanupandremovalofsubstancesinthefield.
Litter leftoverexperimentmaterialorstructures
candamageseagrass,decreaselightavailabilityandgrowth.
cleanlitterupbeforerestorationandatregularintervals.
Selectiveextractionofspecies
collectionofspecificspeciesfromtheenvironmentforresearchpurposes(lab/aquariumresearch,transplantion,etc.).removalofinvasivespecies.
removalofnativespeciesinlargenumberscouldaffecttrophicnetworks.removalofinvasivespeciesisbeneficialforthemeadow.
pullingoutinvasivespeciespriortorestoration.
Waterflowratechanges(local)
structuresmaylimitflow changesinerosionandsedimentation removestructuresaftertheendofexperiments.limittheamountofstructures,especiallyinrestoredmeadows.

MERCES – D1.2. Activities and Pressures in Marine Habitats 47
Table 8. The shallow hard kelp case study example, showing expected pressures by activity operating in the habitat, expected impacts and effects on the ecosystem, consequences relevant to restoration and restoration and mitigation actions.
Activity Pressure Impactandeffectontheecosystem
Consequences RestorationorMitigationactions
Productionoflivingresources
Changesinsiltation/light
aquaculturefacilitiesmayimposeashadowingeffect
reduceslowergrowthlimit eliminateactivity,placefacilityinnone-kelpareas
NandPenrichment
nutrientenrichmentfromfertilizersusedinfishfarmsleadstoalgalblooms
overgrowthofturfalgaecandecreasekelpgrowthandprimaryproduction,causemortality,mayreducethelowergrowthlimit
reducenutrientinputsfromfishfarmsbyusingimprovedmethodsforfeedingandfarming
Inputoforganicmatter
enrichmentfromfertilizersinfishfarmsandfaecesfromfishandbivalves
organicmattercanstimulatealgalovergrowthofkelp,oceandarkening
reducenutrientinputsfromfishfarmsbyusingimprovedmethodsforfeedingandfarming
Intr.ofmicrobialpathogens
pathogensfromfishorbivalvescouldinfectthoseinkelpforests
lossoffishspeciesmaycreatetrophiccascades
moreefficientfarmingtechniquestoreducedisease
Intr.ofnon-indigenousspecies
introductionofnon-indigenousspeciesorfarmingtheminanareatheynormallydonotlivecouldaffectnativespeciesinthekelpforest
foreignspeciescouldoutcompeteimportantnativespeciesandcauseshiftsintrophicnetwokrs
raisingnativespeciesonly
Extractionoflivingresources
Smothering damagingkelpandassociatedfloraandfauna(frome.g.fishtrawling)
totalandpartialmortalityoforganisms,lossofdensityandcover,lossofdiversity
eliminateactivity,carryouttheactivityinareasthatrecoverquickly
Changesinsiltation/light
alteringenvironmentalcharacteristics,impactinggrowth
regrowthofamorehomogenouskelpforest(becauseofkelptrawlingremovingthewholecanopy)
eliminateactivity
Abrasion removing/destroyingthekelpforest(kelptrawling)
totalremovalofkelp,lossofassociatedfloraandfaunaspecies,bothabundanceanddiversity,reducinggeneticconnectivity,lossofstructuralcomplexity;
eliminateactivity,carryouttheactivityinareasthatrecoverquickly,reducebarriereffects
Selectiveextractionofspecies
predationremoval(e.g.seaurchins),removalofkelp
incresingkelpgrowthandrecoverywhenremovngurchins,lossofkelpasassociatedfloraandfaunewhenkelptrawling
regulateactivity
Barriertospeciesmovement
reducingconnectivitybetweenkelpforestareasandbetweenkelpforestandotherhabitats(suchasseagrassmeadowsinsideofkelpforests)
lossofgeneticconnectivity,lossofresilience(abilitytorecoverfromdisturbances)
eliminateactivity,reducebarriers,carryouttheactivityinareasthatrecoverquickly
Transport Smothering mooring,dredgingetc.mayremoving/destroykelpforests
lossofassociatedfloraandfaunaspecies,bothabundanceanddiversity,reducinggeneticconnectivity,lossofstructuralcomplexity
eliminateactivity,carryouttheactivityinareasthatrecoverquickly
Renewableenergygeneration
Smothering constructionsmaydestroykelpforests
lossofassociatedfloraandfaunaspecies,bothabundanceanddiversity,reducinggeneticconnectivity,lossofstructuralcomplexity
eliminateactivity,carryouttheactivityinareasthatrecoverquickly
Substratumloss removing/destroyinghabitat
lossofassociatedfloraandfaunaspecies,bothabundanceanddiversity,reducinggeneticconnectivity,lossofstructuralcomplexity
eliminateactivity,carryouttheactivityinareasthatrecoverquickly
Barriertospeciesmovement
reducingconnectivitybetweenkelpforestareasandbetweenkelpforestandotherhabitats(suchasseagrassmeadowsinsideofkelpforests)
lossofgeneticconnectivity,lossofresilience(abilitytorecoverfromdisturbances)
eliminateactivity,reducebarriers,carryouttheactivityinareasthatrecoverquickly
Waterflowratechanges(local)
changeinwaterflowcharacteristics
changeinkelpgrowthandspeciescomposition(ofkelpandassociatedfloraandfaunaspecies)
eliminateactivityorplaceitinordertoimpactthewaterflowaslittleaspossible
Changeinwaveexposure(local)
changeinwaveexposurelevel
changeinkelpgrowthandspeciescomposition(ofkelpandassociatedfloraandfaunaspecies)
eliminateactivityorplaceitinordertoimpactthewaveexposureaslittleaspossible
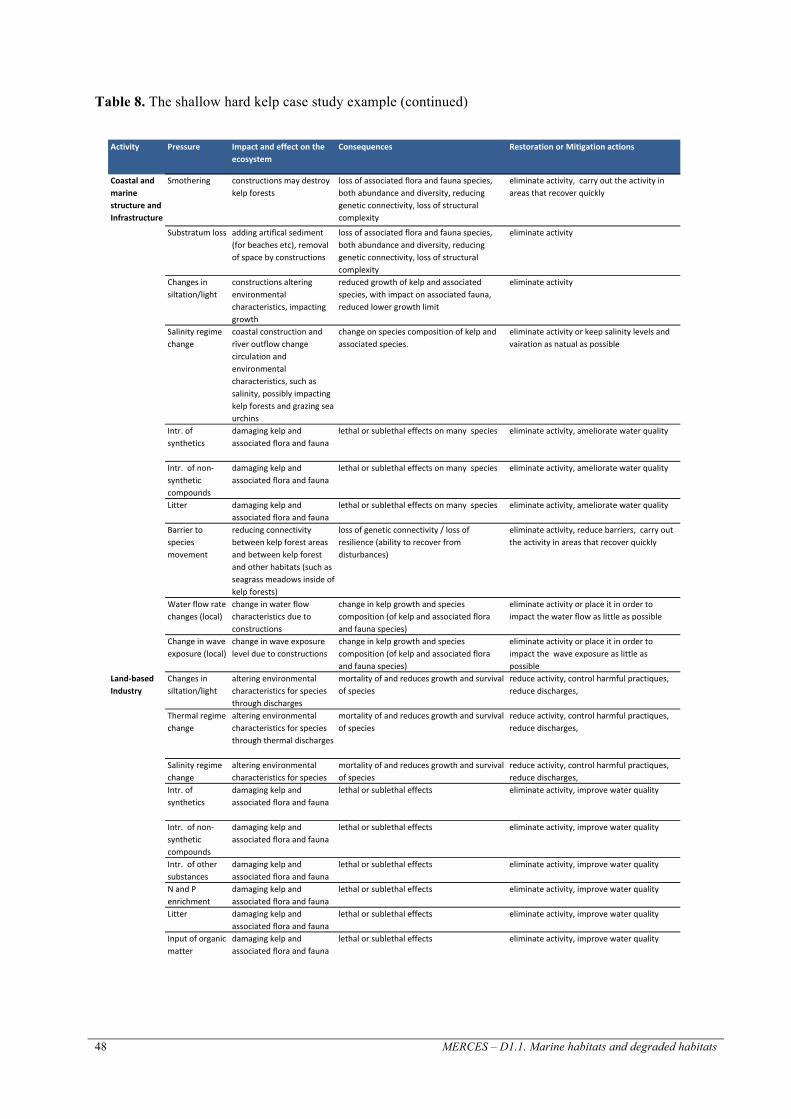
48 MERCES – D1.1. Marine habitats and degraded habitats
Table 8. The shallow hard kelp case study example (continued)
Activity Pressure Impactandeffectontheecosystem
Consequences RestorationorMitigationactions
CoastalandmarinestructureandInfrastructure
Smothering constructionsmaydestroykelpforests
lossofassociatedfloraandfaunaspecies,bothabundanceanddiversity,reducinggeneticconnectivity,lossofstructuralcomplexity
eliminateactivity,carryouttheactivityinareasthatrecoverquickly
Substratumloss addingartificalsediment(forbeachesetc),removalofspacebyconstructions
lossofassociatedfloraandfaunaspecies,bothabundanceanddiversity,reducinggeneticconnectivity,lossofstructuralcomplexity
eliminateactivity
Changesinsiltation/light
constructionsalteringenvironmentalcharacteristics,impactinggrowth
reducedgrowthofkelpandassociatedspecies,withimpactonassociatedfauna,reducedlowergrowthlimit
eliminateactivity
Salinityregimechange
coastalconstructionandriveroutflowchangecirculationandenvironmentalcharacteristics,suchassalinity,possiblyimpactingkelpforestsandgrazingseaurchins
changeonspeciescompositionofkelpandassociatedspecies.
eliminateactivityorkeepsalinitylevelsandvairationasnatualaspossible
Intr.ofsynthetics
damagingkelpandassociatedfloraandfauna
lethalorsublethaleffectsonmanyspecies eliminateactivity,amelioratewaterquality
Intr.ofnon-syntheticcompounds
damagingkelpandassociatedfloraandfauna
lethalorsublethaleffectsonmanyspecies eliminateactivity,amelioratewaterquality
Litter damagingkelpandassociatedfloraandfauna
lethalorsublethaleffectsonmanyspecies eliminateactivity,amelioratewaterquality
Barriertospeciesmovement
reducingconnectivitybetweenkelpforestareasandbetweenkelpforestandotherhabitats(suchasseagrassmeadowsinsideofkelpforests)
lossofgeneticconnectivity/lossofresilience(abilitytorecoverfromdisturbances)
eliminateactivity,reducebarriers,carryouttheactivityinareasthatrecoverquickly
Waterflowratechanges(local)
changeinwaterflowcharacteristicsduetoconstructions
changeinkelpgrowthandspeciescomposition(ofkelpandassociatedfloraandfaunaspecies)
eliminateactivityorplaceitinordertoimpactthewaterflowaslittleaspossible
Changeinwaveexposure(local)
changeinwaveexposurelevelduetoconstructions
changeinkelpgrowthandspeciescomposition(ofkelpandassociatedfloraandfaunaspecies)
eliminateactivityorplaceitinordertoimpactthewaveexposureaslittleaspossible
Land-basedIndustry
Changesinsiltation/light
alteringenvironmentalcharacteristicsforspeciesthroughdischarges
mortalityofandreducesgrowthandsurvivalofspecies
reduceactivity,controlharmfulpractiques,reducedischarges,
Thermalregimechange
alteringenvironmentalcharacteristicsforspeciesthroughthermaldischarges
mortalityofandreducesgrowthandsurvivalofspecies
reduceactivity,controlharmfulpractiques,reducedischarges,
Salinityregimechange
alteringenvironmentalcharacteristicsforspecies
mortalityofandreducesgrowthandsurvivalofspecies
reduceactivity,controlharmfulpractiques,reducedischarges,
Intr.ofsynthetics
damagingkelpandassociatedfloraandfauna
lethalorsublethaleffects eliminateactivity,improvewaterquality
Intr.ofnon-syntheticcompounds
damagingkelpandassociatedfloraandfauna
lethalorsublethaleffects eliminateactivity,improvewaterquality
Intr.ofothersubstances
damagingkelpandassociatedfloraandfauna
lethalorsublethaleffects eliminateactivity,improvewaterquality
NandPenrichment
damagingkelpandassociatedfloraandfauna
lethalorsublethaleffects eliminateactivity,improvewaterquality
Litter damagingkelpandassociatedfloraandfauna
lethalorsublethaleffects eliminateactivity,improvewaterquality
Inputoforganicmatter
damagingkelpandassociatedfloraandfauna
lethalorsublethaleffects eliminateactivity,improvewaterquality

MERCES – D1.2. Activities and Pressures in Marine Habitats 49
Table 8. The shallow hard kelp case study example (continued)
Activity Pressure Impactandeffectontheecosystem
Consequences RestorationorMitigationactions
Intr.ofmicrobialpathogens
damagingkelpandassociatedfloraandfauna
lethalorsublethaleffects eliminateactivity,improvewaterquality
Agriculture Changesinsiltation/light
alteringenvironmentalcharacteristicsforspeciesthroughdischarges
mortalityofandreducesgrowthandsurvivalofspecies
reduceactivity,controlharmfulpractiques,reducedischarges,
Intr.ofsyntheticcompounds
damagingkelpandassociatedfloraandfauna
lethalorsublethaleffects eliminateactivity,improvewaterquality
NandPenrichment
damagingkelpandassociatedfloraandfauna
lethalorsublethaleffects eliminateactivity,improvewaterquality
Litter damagingkelpandassociatedfloraandfauna
lethalorsublethaleffects eliminateactivity,improvewaterquality
Inputoforganicmatter
damagingkelpandassociatedfloraandfauna
lethalorsublethaleffects eliminateactivity,improvewaterquality
Tourism/recreation
Smothering touristresorts,anchoringetcmayleadtosmotheringofkelpforests
lossofkelpandassociatedfloraandfaunaspecies,bothabundanceanddiversity,reducinggeneticconnectivity,lossofstructuralcomplexity;
eliminateactivity
Substratumloss touristresortsmayleadtoaddingofartificalsediment(forbeachesetc),removalofspacebyconstructions
lossofkelpandassociatedfloraandfaunaspecies,bothabundanceanddiversity,reducinggeneticconnectivity,lossofstructuralcomplexity;
eliminateactivity
Changesinsiltation/light
touristresortsmayleadtoconstructionsalteringenvironmentalcharacteristics,impactinggrowth
reducedgrowthofkelpandassociatedspecies,withimpactonassociatedfauna.
eliminateactivity
NandPenrichment
touristresortsmayleadtonutrientaddedthatdamagekelpandassociatedfloraandfauna
lethalorsublethaleffectsonmanyspecies eliminateactivity,amelioratewaterquality
Litter touristresortsmayleadtolitteraddedthatdamagekelpandassociatedfloraandfauna
lethalorsublethaleffectsonmanyspecies eliminateactivity,amelioratewaterquality
Inputoforganicmatter
touristresortsmayleadtoorganicmatteraddedthatdamagekelpandassociatedfloraandfauna
lethalorsublethaleffectsonmanyspecies eliminateactivity,amelioratewaterquality
Changeinwaveexposure(local)
touristresortsmayleadtoconstructionsthatchangethewaveexposurelevelduetoconstructions
changeinkelpgrowthandspeciescomposition(ofkelpandassociatedfloraandfaunaspecies)
eliminateactivityorplaceitinordertoimpactthewaveexposureaslittleaspossible
Researchandconservation
Substratumloss addingpermanentsconstructionandremovingkelpforests
lossofassociatedfloraandfaunaspecies,bothabundanceanddiversity,reducinggeneticconnectivity,lossofstructuralcomplexity;
eliminate/reducetheactivity,carryouttheactivityinareasthatrecoverquickly
Abrasion removing/destroyingareasofkelpforest
totalremovalofkelp,lossofassociatedfloraandfaunaspecies,bothabundanceanddiversity,reducinggeneticconnectivity,lossofstructuralcomplexity;
eliminate/reducetheactivity,carryouttheactivityinareasthatrecoverquickly
Intr.ofnon-indigenousspecies
changeonspeciesinteractionsandecosystemfunctioningbydoingfielsexperimentsonnon-indigenousspecies
simplificationofecosystemfunctioninganddiversity
eliminateorreducetheactivity
Selectiveextractionofspecies
removingandtherebydamagingfloraandfaunaandremovingpredators(e.g.seaurchins)
partialandtotalmortalityofsampledorganisms,regrowthofkelpforests
somerestrictionsandcontrolareneededifsamplingisimportant
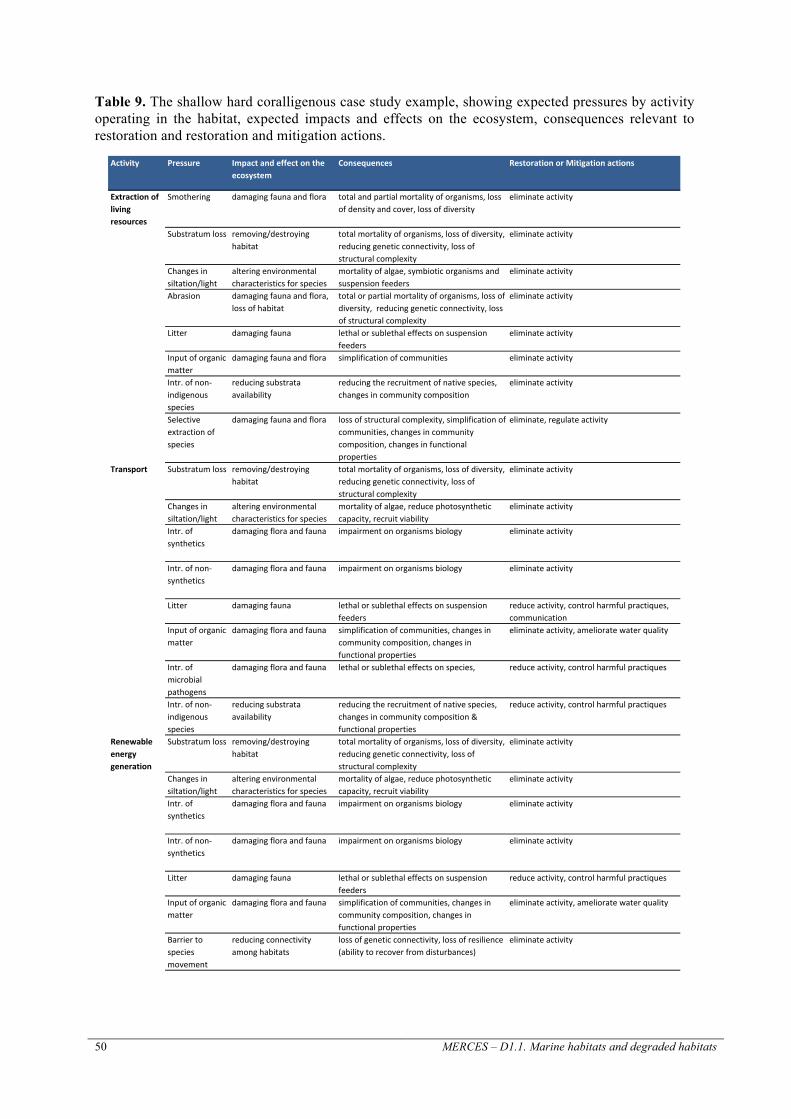
50 MERCES – D1.1. Marine habitats and degraded habitats
Table 9. The shallow hard coralligenous case study example, showing expected pressures by activity operating in the habitat, expected impacts and effects on the ecosystem, consequences relevant to restoration and restoration and mitigation actions.
Activity Pressure Impactandeffectontheecosystem
Consequences RestorationorMitigationactions
Extractionoflivingresources
Smothering damagingfaunaandflora totalandpartialmortalityoforganisms,lossofdensityandcover,lossofdiversity
eliminateactivity
Substratumloss removing/destroyinghabitat
totalmortalityoforganisms,lossofdiversity,reducinggeneticconnectivity,lossofstructuralcomplexity
eliminateactivity
Changesinsiltation/light
alteringenvironmentalcharacteristicsforspecies
mortalityofalgae,symbioticorganismsandsuspensionfeeders
eliminateactivity
Abrasion damagingfaunaandflora,lossofhabitat
totalorpartialmortalityoforganisms,lossofdiversity,reducinggeneticconnectivity,lossofstructuralcomplexity
eliminateactivity
Litter damagingfauna lethalorsublethaleffectsonsuspensionfeeders
eliminateactivity
Inputoforganicmatter
damagingfaunaandflora simplificationofcommunities eliminateactivity
Intr.ofnon-indigenousspecies
reducingsubstrataavailability
reducingtherecruitmentofnativespecies,changesincommunitycomposition
eliminateactivity
Selectiveextractionofspecies
damagingfaunaandflora lossofstructuralcomplexity,simplificationofcommunities,changesincommunitycomposition,changesinfunctionalproperties
eliminate,regulateactivity
Transport Substratumloss removing/destroyinghabitat
totalmortalityoforganisms,lossofdiversity,reducinggeneticconnectivity,lossofstructuralcomplexity
eliminateactivity
Changesinsiltation/light
alteringenvironmentalcharacteristicsforspecies
mortalityofalgae,reducephotosyntheticcapacity,recruitviability
eliminateactivity
Intr.ofsynthetics
damagingfloraandfauna impairmentonorganismsbiology eliminateactivity
Intr.ofnon-synthetics
damagingfloraandfauna impairmentonorganismsbiology eliminateactivity
Litter damagingfauna lethalorsublethaleffectsonsuspensionfeeders
reduceactivity,controlharmfulpractiques,communication
Inputoforganicmatter
damagingfloraandfauna simplificationofcommunities,changesincommunitycomposition,changesinfunctionalproperties
eliminateactivity,amelioratewaterquality
Intr.ofmicrobialpathogens
damagingfloraandfauna lethalorsublethaleffectsonspecies, reduceactivity,controlharmfulpractiques
Intr.ofnon-indigenousspecies
reducingsubstrataavailability
reducingtherecruitmentofnativespecies,changesincommunitycomposition&functionalproperties
reduceactivity,controlharmfulpractiques
Renewableenergygeneration
Substratumloss removing/destroyinghabitat
totalmortalityoforganisms,lossofdiversity,reducinggeneticconnectivity,lossofstructuralcomplexity
eliminateactivity
Changesinsiltation/light
alteringenvironmentalcharacteristicsforspecies
mortalityofalgae,reducephotosyntheticcapacity,recruitviability
eliminateactivity
Intr.ofsynthetics
damagingfloraandfauna impairmentonorganismsbiology eliminateactivity
Intr.ofnon-synthetics
damagingfloraandfauna impairmentonorganismsbiology eliminateactivity
Litter damagingfauna lethalorsublethaleffectsonsuspensionfeeders
reduceactivity,controlharmfulpractiques
Inputoforganicmatter
damagingfloraandfauna simplificationofcommunities,changesincommunitycomposition,changesinfunctionalproperties
eliminateactivity,amelioratewaterquality
Barriertospeciesmovement
reducingconnectivityamonghabitats
lossofgeneticconnectivity,lossofresilience(abilitytorecoverfromdisturbances)
eliminateactivity
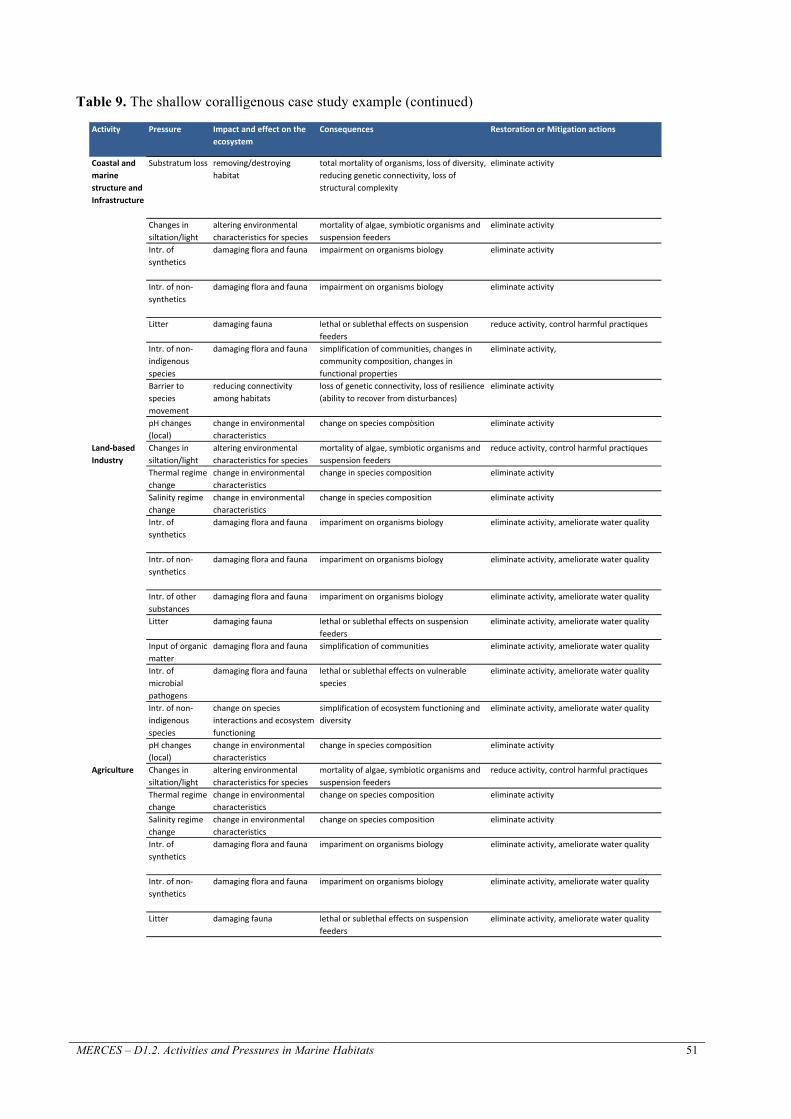
MERCES – D1.2. Activities and Pressures in Marine Habitats 51
Table 9. The shallow coralligenous case study example (continued)
Activity Pressure Impactandeffectontheecosystem
Consequences RestorationorMitigationactions
CoastalandmarinestructureandInfrastructure
Substratumloss removing/destroyinghabitat
totalmortalityoforganisms,lossofdiversity,reducinggeneticconnectivity,lossofstructuralcomplexity
eliminateactivity
Changesinsiltation/light
alteringenvironmentalcharacteristicsforspecies
mortalityofalgae,symbioticorganismsandsuspensionfeeders
eliminateactivity
Intr.ofsynthetics
damagingfloraandfauna impairmentonorganismsbiology eliminateactivity
Intr.ofnon-synthetics
damagingfloraandfauna impairmentonorganismsbiology eliminateactivity
Litter damagingfauna lethalorsublethaleffectsonsuspensionfeeders
reduceactivity,controlharmfulpractiques
Intr.ofnon-indigenousspecies
damagingfloraandfauna simplificationofcommunities,changesincommunitycomposition,changesinfunctionalproperties
eliminateactivity,
Barriertospeciesmovement
reducingconnectivityamonghabitats
lossofgeneticconnectivity,lossofresilience(abilitytorecoverfromdisturbances)
eliminateactivity
pHchanges(local)
changeinenvironmentalcharacteristics
changeonspeciescompòsition eliminateactivity
Land-basedIndustry
Changesinsiltation/light
alteringenvironmentalcharacteristicsforspecies
mortalityofalgae,symbioticorganismsandsuspensionfeeders
reduceactivity,controlharmfulpractiques
Thermalregimechange
changeinenvironmentalcharacteristics
changeinspeciescomposition eliminateactivity
Salinityregimechange
changeinenvironmentalcharacteristics
changeinspeciescomposition eliminateactivity
Intr.ofsynthetics
damagingfloraandfauna imparimentonorganismsbiology eliminateactivity,amelioratewaterquality
Intr.ofnon-synthetics
damagingfloraandfauna imparimentonorganismsbiology eliminateactivity,amelioratewaterquality
Intr.ofothersubstances
damagingfloraandfauna imparimentonorganismsbiology eliminateactivity,amelioratewaterquality
Litter damagingfauna lethalorsublethaleffectsonsuspensionfeeders
eliminateactivity,amelioratewaterquality
Inputoforganicmatter
damagingfloraandfauna simplificationofcommunities eliminateactivity,amelioratewaterquality
Intr.ofmicrobialpathogens
damagingfloraandfauna lethalorsublethaleffectsonvulnerablespecies
eliminateactivity,amelioratewaterquality
Intr.ofnon-indigenousspecies
changeonspeciesinteractionsandecosystemfunctioning
simplificationofecosystemfunctioninganddiversity
eliminateactivity,amelioratewaterquality
pHchanges(local)
changeinenvironmentalcharacteristics
changeinspeciescomposition eliminateactivity
Agriculture Changesinsiltation/light
alteringenvironmentalcharacteristicsforspecies
mortalityofalgae,symbioticorganismsandsuspensionfeeders
reduceactivity,controlharmfulpractiques
Thermalregimechange
changeinenvironmentalcharacteristics
changeonspeciescomposition eliminateactivity
Salinityregimechange
changeinenvironmentalcharacteristics
changeonspeciescomposition eliminateactivity
Intr.ofsynthetics
damagingfloraandfauna imparimentonorganismsbiology eliminateactivity,amelioratewaterquality
Intr.ofnon-synthetics
damagingfloraandfauna imparimentonorganismsbiology eliminateactivity,amelioratewaterquality
Litter damagingfauna lethalorsublethaleffectsonsuspensionfeeders
eliminateactivity,amelioratewaterquality

52 MERCES – D1.1. Marine habitats and degraded habitats
Table 9. The shallow coralligenous case study example (continued)
Activity Pressure Impactandeffectontheecosystem
Consequences RestorationorMitigationactions
Inputoforganicmatter
alteringenvironmentalcharacteristicsforspecies
mortalityofsomevulnerablespecies reduceactivity,controlharmfulpractiques
Tourism/recreation
Smothering damagingfaunaandflora totalandpartialmortalityoforganisms,lossofdensityandcover,lossofdiversity
establishmentappropiatecarryingcapacity,transplantsofdamagedspeciesinlocalareaswheretheactivityisreduced
Substratumloss removing/destroyinghabitat
totalmortalityoforganisms,lossofdiversity,reducinggeneticconnectivity,lossofstructuralcomplexity
eliminateactivity
Abrasion damagingfaunaandflora,lossofhabitat
totalorpartialmortalityoforganisms,lossofdiversity,reducinggeneticconnectivity,lossofstructuralcomplexity
establishmentappropiatecarryingcapacity,transplantsofdamagedspeciesinlocalareaswheretheactivityisreduced
Intr.ofsynthetics
damagingfloraandfauna imparimentonorganismsbiology eliminateactivity,amelioratewaterquality
Intr.ofnon-synthetics
damagingfloraandfauna imparimentonorganismsbiology eliminateactivity,amelioratewaterquality
Litter damagingfauna lethalorsublethaleffectsonsuspensionfeeders
eliminateactivity,amelioratewaterquality
Inputoforganicmatter
alteringenvironmentalcharacteristicsforspecies
mortalityofsomevulnerablespecies reduceactivity,controlharmfulpractiques
Intr.ofnon-indigenousspecies
changeonspeciesinteractionsandecosystemfunctioning
simplificationofecosystemfunctioninganddiversity
eliminateactivity,amelioratewaterquality
Researchandconservation
Substratumloss removing/destroyinghabitat
totalmortalityoforganisms,lossofdiversity,reducinggeneticconnectivity,lossofstructuralcomplexity
eliminateactivity
Changesinsiltation/light
alteringenvironmentalcharacteristicsforspecies
mortalityofsomevulnerablespecies reduceactivity,controlharmfulpractiques
Intr.ofsynthetics
damagingfloraandfauna lethalorsublethaleffectsonvulnerablespecies
eliminateactivity,amelioratewaterquality
Intr.ofnon-synthetics
damagingfloraandfauna lethalorsublethaleffectsonvulnerablespecies
eliminateactivity,amelioratewaterquality
Intr.ofothersubstances
damagingfloraandfauna lethalorsublethaleffectsonvulnerablespecies
eliminate/regulatetheactivity
Litter damagingfloraandfauna lethalorsublethaleffectsonvulnerablespecies
eliminateactivity
Inputoforganicmatter
damagingfloraandfauna lethalorsublethaleffectsonvulnerablespecies
eliminateactivity,amelioratewaterquality
Intr.ofnon-indigenousspecies
damagingfloraandfauna simplificationofecosystemfunctioninganddiversity
eliminate/regulateactivity
Selectiveextractionofspecies
damagingfloraandfauna partialandtotalmortalityofsampledorganisms
somerestrictionsneededifsamplingisatlargescale(100'skilometers)
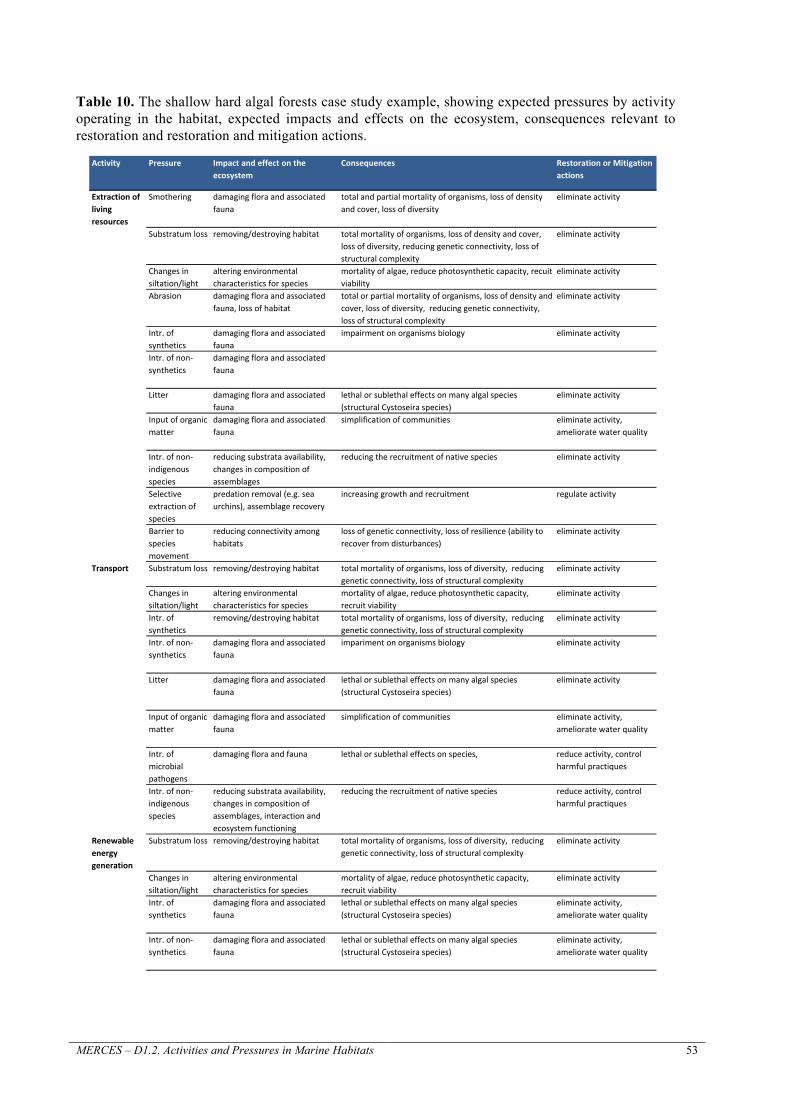
MERCES – D1.2. Activities and Pressures in Marine Habitats 53
Table 10. The shallow hard algal forests case study example, showing expected pressures by activity operating in the habitat, expected impacts and effects on the ecosystem, consequences relevant to restoration and restoration and mitigation actions.
Activity Pressure Impactandeffectontheecosystem
Consequences RestorationorMitigationactions
Extractionoflivingresources
Smothering damagingfloraandassociatedfauna
totalandpartialmortalityoforganisms,lossofdensityandcover,lossofdiversity
eliminateactivity
Substratumloss removing/destroyinghabitat totalmortalityoforganisms,lossofdensityandcover,lossofdiversity,reducinggeneticconnectivity,lossofstructuralcomplexity
eliminateactivity
Changesinsiltation/light
alteringenvironmentalcharacteristicsforspecies
mortalityofalgae,reducephotosyntheticcapacity,recuitviability
eliminateactivity
Abrasion damagingfloraandassociatedfauna,lossofhabitat
totalorpartialmortalityoforganisms,lossofdensityandcover,lossofdiversity,reducinggeneticconnectivity,lossofstructuralcomplexity
eliminateactivity
Intr.ofsynthetics
damagingfloraandassociatedfauna
impairmentonorganismsbiology eliminateactivity
Intr.ofnon-synthetics
damagingfloraandassociatedfauna
Litter damagingfloraandassociatedfauna
lethalorsublethaleffectsonmanyalgalspecies(structuralCystoseiraspecies)
eliminateactivity
Inputoforganicmatter
damagingfloraandassociatedfauna
simplificationofcommunities eliminateactivity,amelioratewaterquality
Intr.ofnon-indigenousspecies
reducingsubstrataavailability,changesincompositionofassemblages
reducingtherecruitmentofnativespecies eliminateactivity
Selectiveextractionofspecies
predationremoval(e.g.seaurchins),assemblagerecovery
increasinggrowthandrecruitment regulateactivity
Barriertospeciesmovement
reducingconnectivityamonghabitats
lossofgeneticconnectivity,lossofresilience(abilitytorecoverfromdisturbances)
eliminateactivity
Transport Substratumloss removing/destroyinghabitat totalmortalityoforganisms,lossofdiversity,reducinggeneticconnectivity,lossofstructuralcomplexity
eliminateactivity
Changesinsiltation/light
alteringenvironmentalcharacteristicsforspecies
mortalityofalgae,reducephotosyntheticcapacity,recruitviability
eliminateactivity
Intr.ofsynthetics
removing/destroyinghabitat totalmortalityoforganisms,lossofdiversity,reducinggeneticconnectivity,lossofstructuralcomplexity
eliminateactivity
Intr.ofnon-synthetics
damagingfloraandassociatedfauna
imparimentonorganismsbiology eliminateactivity
Litter damagingfloraandassociatedfauna
lethalorsublethaleffectsonmanyalgalspecies(structuralCystoseiraspecies)
eliminateactivity
Inputoforganicmatter
damagingfloraandassociatedfauna
simplificationofcommunities eliminateactivity,amelioratewaterquality
Intr.ofmicrobialpathogens
damagingfloraandfauna lethalorsublethaleffectsonspecies, reduceactivity,controlharmfulpractiques
Intr.ofnon-indigenousspecies
reducingsubstrataavailability,changesincompositionofassemblages,interactionandecosystemfunctioning
reducingtherecruitmentofnativespecies reduceactivity,controlharmfulpractiques
Renewableenergygeneration
Substratumloss removing/destroyinghabitat totalmortalityoforganisms,lossofdiversity,reducinggeneticconnectivity,lossofstructuralcomplexity
eliminateactivity
Changesinsiltation/light
alteringenvironmentalcharacteristicsforspecies
mortalityofalgae,reducephotosyntheticcapacity,recruitviability
eliminateactivity
Intr.ofsynthetics
damagingfloraandassociatedfauna
lethalorsublethaleffectsonmanyalgalspecies(structuralCystoseiraspecies)
eliminateactivity,amelioratewaterquality
Intr.ofnon-synthetics
damagingfloraandassociatedfauna
lethalorsublethaleffectsonmanyalgalspecies(structuralCystoseiraspecies)
eliminateactivity,amelioratewaterquality

54 MERCES – D1.1. Marine habitats and degraded habitats
Table 10. The shallow hard algal forests case study example (continued)
Activity Pressure Impactandeffectontheecosystem
Consequences RestorationorMitigationactions
Litter damagingfloraandassociatedfauna
lethalorsublethaleffectsonmanyalgalspecies(structuralCystoseiraspecies)
eliminateactivity,amelioratewaterquality
Inputoforganicmatter
damagingfloraandassociatedfauna
simplificationofcommunities eliminateactivity,amelioratewaterquality
Barriertospeciesmovement
reducingconnectivityamonghabitats
lossofgeneticconnectivity,lossofresilience(abilitytorecoverfromdisturbances)
eliminateactivity
Changeinwaveexposure(local)
changeinenvironmentalcharacteristics
changeinspeciescomposition eliminateactivity
CoastalandmarinestructureandInfrastructure
Substratumloss removing/destroyinghabitat totalmortalityoforganisms,lossofdiversity,reducinggeneticconnectivity,lossofstructuralcomplexity
eliminateactivity
Changesinsiltation/light
alteringenvironmentalcharacteristicsforspecies
mortalityofalgae,symbioticorganismsandsuspensionfeeders
eliminateactivity
Salinityregimechange
changeinenvironmentalcharacteristics,increasingvulnerabilityofsomealgalspecies
changeinspeciescomposition eliminateactivity
Intr.ofsynthetics
damagingfloraandassociatedfauna
lethalorsublethaleffectsonmanyalgalspecies(structuralCystoseiraspecies)
eliminateactivity,amelioratewaterquality
Intr.ofnon-synthetics
damagingfloraandassociatedfauna
lethalorsublethaleffectsonmanyalgalspecies(structuralCystoseiraspecies)
eliminateactivity,amelioratewaterquality
Litter damagingfloraandassociatedfauna
lethalorsublethaleffectsonmanyalgalspecies(structuralCystoseiraspecies)
eliminateactivity,amelioratewaterquality
Intr.ofnon-indigenousspecies
changeinspeciescomposition,interactionsandecosystemfunctioning
simplificationofecosystemfunctioninganddiversity eliminateactivity,amelioratewaterquality
Barriertospeciesmovement
reducingconnectivityamonghabitats
lossofgeneticconnectivity,lossofresilience(abilitytorecoverfromdisturbances)
Waterflowratechanges(local)
changeinenvironmentalcharacteristics
changeinspeciescomposition eliminateactivity
pHchanges(local)
changeinenvironmentalcharacteristics
changeinspeciescomposition eliminateactivity
Changeinwaveexposure(local)
alteringenvironmentalcharacteristicsforspecies
mortalityofalgae,changeinspeciescomposition reduceactivity,controlharmfulpractiques
Land-basedIndustry
Changesinsiltation/light
alteringenvironmentalcharacteristicsforspecies
mortalityofalgae,symbioticorganismsandsuspensionfeeders
reduceactivity,controlharmfulpractiques
Thermalregimechange
changeinenvironmentalcharacteristics
changeinspeciescomposition eliminateactivity
Salinityregimechange
changeinenvironmentalcharacteristics
changeinspeciescomposition eliminateactivity
Intr.ofsynthetics
damagingflora(speciallyspeciesofgenusCystoseira)
lethalorsublethaleffectsonmanyalgalspecies eliminateactivity,amelioratewaterquality
Intr.ofnon-synthetics
damagingflora(speciallyspeciesofgenusCystoseira)
lethalorsublethaleffectsonmanyalgalspecies eliminateactivity,amelioratewaterquality
Intr.ofothersubstances
damagingfloraandchangingassociatedfauna
lethalorsublethaleffectsonmanyalgalspecies eliminateactivity,amelioratewaterquality
NandPenrichment
damagingfloraandchangingassociatedfauna
lethalorsublethaleffectsonmanyalgalspecies eliminateactivity,amelioratewaterquality
Litter damagingfloraandassociatedfauna
lethalorsublethaleffectsonsuspensionfeeders reduceactivity,controlharmfulpractiques
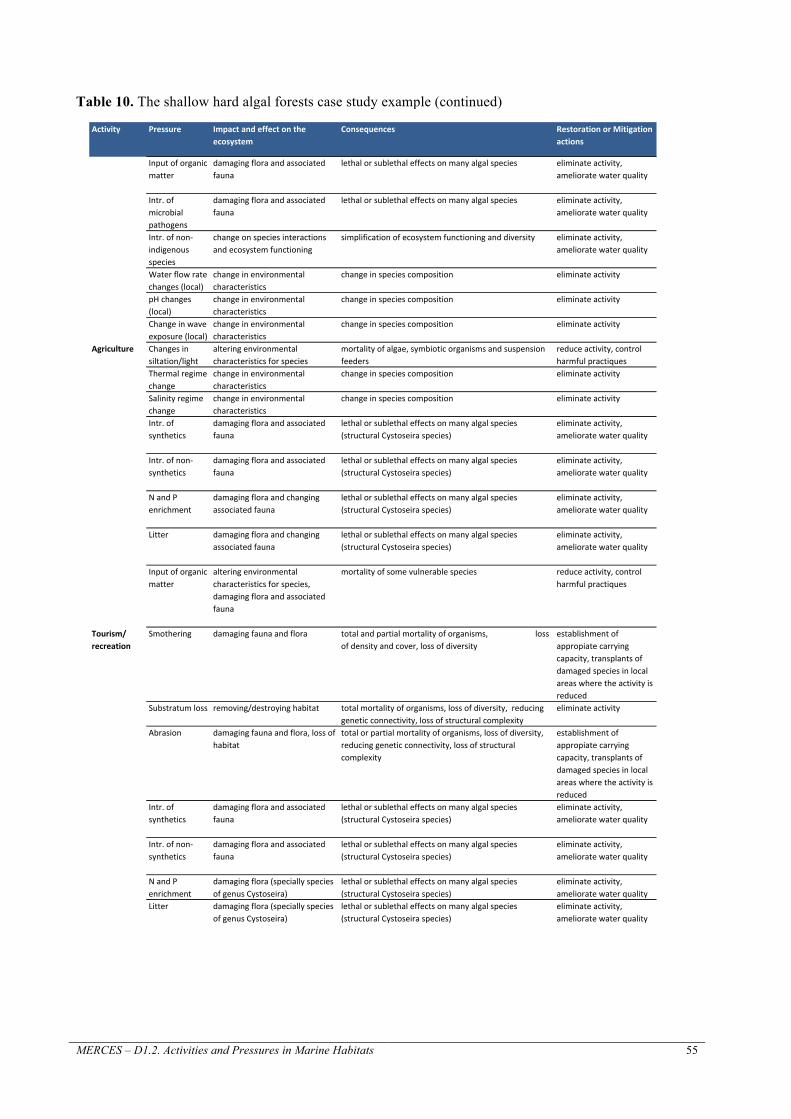
MERCES – D1.2. Activities and Pressures in Marine Habitats 55
Table 10. The shallow hard algal forests case study example (continued)
Activity Pressure Impactandeffectontheecosystem
Consequences RestorationorMitigationactions
Inputoforganicmatter
damagingfloraandassociatedfauna
lethalorsublethaleffectsonmanyalgalspecies eliminateactivity,amelioratewaterquality
Intr.ofmicrobialpathogens
damagingfloraandassociatedfauna
lethalorsublethaleffectsonmanyalgalspecies eliminateactivity,amelioratewaterquality
Intr.ofnon-indigenousspecies
changeonspeciesinteractionsandecosystemfunctioning
simplificationofecosystemfunctioninganddiversity eliminateactivity,amelioratewaterquality
Waterflowratechanges(local)
changeinenvironmentalcharacteristics
changeinspeciescomposition eliminateactivity
pHchanges(local)
changeinenvironmentalcharacteristics
changeinspeciescomposition eliminateactivity
Changeinwaveexposure(local)
changeinenvironmentalcharacteristics
changeinspeciescomposition eliminateactivity
Agriculture Changesinsiltation/light
alteringenvironmentalcharacteristicsforspecies
mortalityofalgae,symbioticorganismsandsuspensionfeeders
reduceactivity,controlharmfulpractiques
Thermalregimechange
changeinenvironmentalcharacteristics
changeinspeciescomposition eliminateactivity
Salinityregimechange
changeinenvironmentalcharacteristics
changeinspeciescomposition eliminateactivity
Intr.ofsynthetics
damagingfloraandassociatedfauna
lethalorsublethaleffectsonmanyalgalspecies(structuralCystoseiraspecies)
eliminateactivity,amelioratewaterquality
Intr.ofnon-synthetics
damagingfloraandassociatedfauna
lethalorsublethaleffectsonmanyalgalspecies(structuralCystoseiraspecies)
eliminateactivity,amelioratewaterquality
NandPenrichment
damagingfloraandchangingassociatedfauna
lethalorsublethaleffectsonmanyalgalspecies(structuralCystoseiraspecies)
eliminateactivity,amelioratewaterquality
Litter damagingfloraandchangingassociatedfauna
lethalorsublethaleffectsonmanyalgalspecies(structuralCystoseiraspecies)
eliminateactivity,amelioratewaterquality
Inputoforganicmatter
alteringenvironmentalcharacteristicsforspecies,damagingfloraandassociatedfauna
mortalityofsomevulnerablespecies reduceactivity,controlharmfulpractiques
Tourism/recreation
Smothering damagingfaunaandflora totalandpartialmortalityoforganisms,lossofdensityandcover,lossofdiversity
establishmentofappropiatecarryingcapacity,transplantsofdamagedspeciesinlocalareaswheretheactivityisreduced
Substratumloss removing/destroyinghabitat totalmortalityoforganisms,lossofdiversity,reducinggeneticconnectivity,lossofstructuralcomplexity
eliminateactivity
Abrasion damagingfaunaandflora,lossofhabitat
totalorpartialmortalityoforganisms,lossofdiversity,reducinggeneticconnectivity,lossofstructuralcomplexity
establishmentofappropiatecarryingcapacity,transplantsofdamagedspeciesinlocalareaswheretheactivityisreduced
Intr.ofsynthetics
damagingfloraandassociatedfauna
lethalorsublethaleffectsonmanyalgalspecies(structuralCystoseiraspecies)
eliminateactivity,amelioratewaterquality
Intr.ofnon-synthetics
damagingfloraandassociatedfauna
lethalorsublethaleffectsonmanyalgalspecies(structuralCystoseiraspecies)
eliminateactivity,amelioratewaterquality
NandPenrichment
damagingflora(speciallyspeciesofgenusCystoseira)
lethalorsublethaleffectsonmanyalgalspecies(structuralCystoseiraspecies)
eliminateactivity,amelioratewaterquality
Litter damagingflora(speciallyspeciesofgenusCystoseira)
lethalorsublethaleffectsonmanyalgalspecies(structuralCystoseiraspecies)
eliminateactivity,amelioratewaterquality
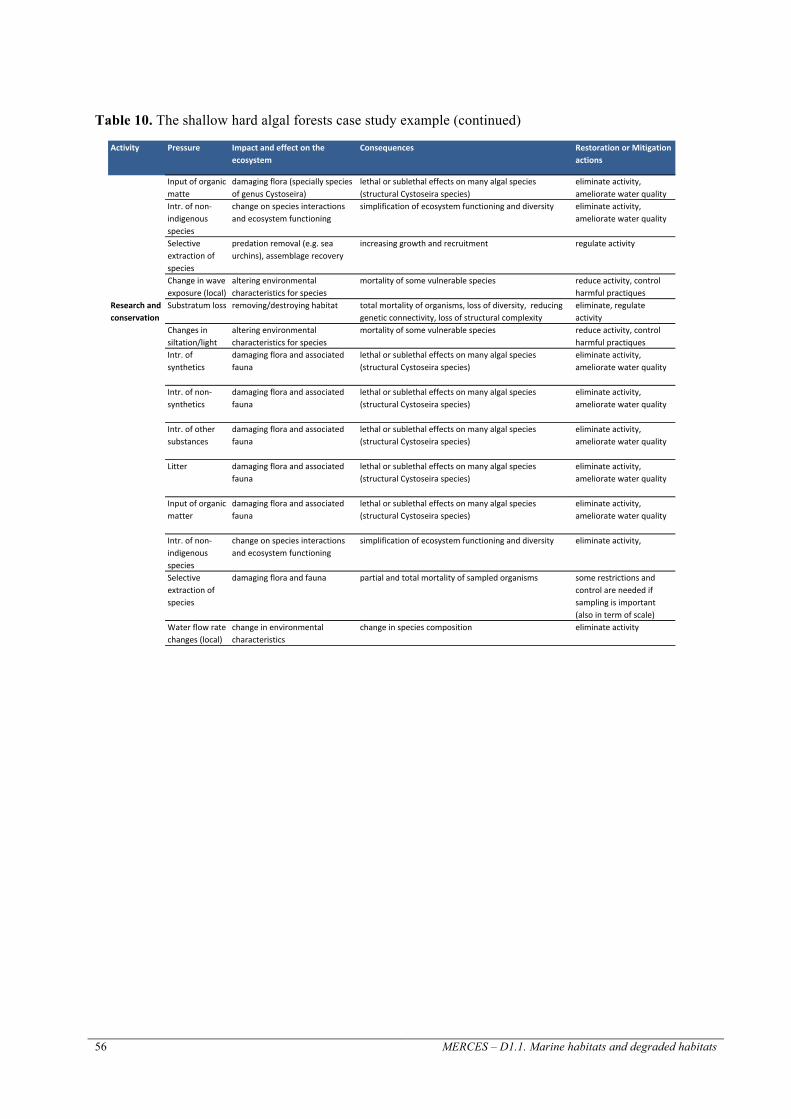
56 MERCES – D1.1. Marine habitats and degraded habitats
Table 10. The shallow hard algal forests case study example (continued)
Activity Pressure Impactandeffectontheecosystem
Consequences RestorationorMitigationactions
Inputoforganicmatte
damagingflora(speciallyspeciesofgenusCystoseira)
lethalorsublethaleffectsonmanyalgalspecies(structuralCystoseiraspecies)
eliminateactivity,amelioratewaterquality
Intr.ofnon-indigenousspecies
changeonspeciesinteractionsandecosystemfunctioning
simplificationofecosystemfunctioninganddiversity eliminateactivity,amelioratewaterquality
Selectiveextractionofspecies
predationremoval(e.g.seaurchins),assemblagerecovery
increasinggrowthandrecruitment regulateactivity
Changeinwaveexposure(local)
alteringenvironmentalcharacteristicsforspecies
mortalityofsomevulnerablespecies reduceactivity,controlharmfulpractiques
Researchandconservation
Substratumloss removing/destroyinghabitat totalmortalityoforganisms,lossofdiversity,reducinggeneticconnectivity,lossofstructuralcomplexity
eliminate,regulateactivity
Changesinsiltation/light
alteringenvironmentalcharacteristicsforspecies
mortalityofsomevulnerablespecies reduceactivity,controlharmfulpractiques
Intr.ofsynthetics
damagingfloraandassociatedfauna
lethalorsublethaleffectsonmanyalgalspecies(structuralCystoseiraspecies)
eliminateactivity,amelioratewaterquality
Intr.ofnon-synthetics
damagingfloraandassociatedfauna
lethalorsublethaleffectsonmanyalgalspecies(structuralCystoseiraspecies)
eliminateactivity,amelioratewaterquality
Intr.ofothersubstances
damagingfloraandassociatedfauna
lethalorsublethaleffectsonmanyalgalspecies(structuralCystoseiraspecies)
eliminateactivity,amelioratewaterquality
Litter damagingfloraandassociatedfauna
lethalorsublethaleffectsonmanyalgalspecies(structuralCystoseiraspecies)
eliminateactivity,amelioratewaterquality
Inputoforganicmatter
damagingfloraandassociatedfauna
lethalorsublethaleffectsonmanyalgalspecies(structuralCystoseiraspecies)
eliminateactivity,amelioratewaterquality
Intr.ofnon-indigenousspecies
changeonspeciesinteractionsandecosystemfunctioning
simplificationofecosystemfunctioninganddiversity eliminateactivity,
Selectiveextractionofspecies
damagingfloraandfauna partialandtotalmortalityofsampledorganisms somerestrictionsandcontrolareneededifsamplingisimportant(alsointermofscale)
Waterflowratechanges(local)
changeinenvironmentalcharacteristics
changeinspeciescomposition eliminateactivity

MERCES – D1.2. Activities and Pressures in Marine Habitats 57
Table 11. The deep sea case study example, showing expected pressures by activity operating in the habitat, expected impacts and effects on the ecosystem, consequences relevant to restoration and restoration and mitigation actions
Activity Pressure Impactandeffectontheecosystem Consequences RestorationorMitigationactionsExtractionoflivingresources
Smothering trawling-inducedsediment
displacementandremovalfrom
fishinggroundscausesthe
morphologyofthedeepseafloorto
becomesmootherovertime,
reducingitsoriginalcomplexity
reducedspeciesdiversityby
regulatinglevelsofcompetition,
predationandphysiologicalstress
reducetheactivitiesandconsider
undisturbedadjacentareasassourceof
species
Substratumloss habitatdestructionduetotrawling
activities
lossofspecies,decreased
connectivityandecosystem
functioning
reducetheactivitiesandconsider
undisturbedadjacentareasassourceof
species
Changesin
siltation/light
plumegeneratedbytrawling
activitiesanddeposition/burial
decreasedbiodiversity,
connectivityandecosystem
functioning
reducetheactivitiesandconsider
undisturbedadjacentareasassourceof
species
Abrasion lossofsubstratumduetotrawling
activities,trawling-inducedsediment
displacementandremovalfrom
fishinggroundscausesthe
morphologyofthedeepseafloorto
becomesmootherovertime,
reducingitsoriginalcomplexity
lossofspecies,decreased
connectivityandecosystem
functioning
reducetheactivitiesandconsider
undisturbedadjacentareasassourceof
species
Litter burialduetothelossofnetand
samplingdevices
lossofspeciesanddecreasingof
ecosystemfucntioning
removethelitter
Selective
extractionof
species
removalofnon-targetspecies
(bycatch)
lossofspeciesandalterfoodwebs reducebycatchbyusingspecificnets
Non-renewableenergygeneration
Smothering lossofsubtratumduetothe
installationofoil&gasplatforms
lossofspecies,decreased
connectivity
ensureanynewstructuresarelocatedaway
fromrestoringareasandplacerestoration
projectsawayfromexistingstructures
Substratumloss lossofsubstratumduetothe
installationofoil&gasplatforms
lossofspecies,decreased
connectivity
ensureanynewstructuresarelocatedaway
fromrestoringareasandplacerestoration
projectsawayfromexistingstructures
Abrasion lossofsubstratumduetothe
installationofoil&gasplatforms
lossofspecies,decreased
connectivity
ensureanynewstructuresarelocatedaway
fromrestoringareasandplacerestoration
projectsawayfromexistingstructures
Selective
extractionof
non-living
resources
lossofbenthichabitatsduetothe
installationofoil&gasplatforms
lossofspecies,decreased
connectivityandecosystem
functioning
ensureanynewstructuresarelocatedaway
fromrestoringareasandplacerestoration
projectsawayfromexistingstructures
Introductionof
radionuclides
contaminationofbenthichabitats
andorganisms
radioactivitycontamination reducingradionuclidedischargesandplace
restoringareasawayfromdischarge
Introductionof
other
substances
contaminationofbenthichabitats
andorganisms
toxicchemicalscontamination reducingtoxicchemicaldischargesandplace
restoringareasawayfromdischarge
Extractionofnon-livingresources
Substratumloss lossofsubstratumduetomining
activities
lossofspecies,decreased
connectivityandecosystem
functioning
reducetheactivitiesandconsider
undisturbedadjacentareasassourceof
species
Changesin
siltation/light
plumegeneratedbyminingactivities
andburialafteritsdeposition
decreasedbiodiversity,
connectivityandecosystem
functioning
reducetheactivitiesandconsider
undisturbedadjacentareasassourceof
species
Abrasion lossofsubstratumduetomining
activities;changingthesubstrate
characteristics(e.g.,porosity,
particlesizedistribution,mineralogy)
lossofspecies,decreased
connectivityandecosystem
functioning
reducetheactivitiesandconsider
undisturbedadjacentareasassourceof
species
Selective
extractionof
non-living
resources
lossofbenthichabitatsdueto
miningactivities
lossofspecies,decreased
connectivityandecosystem
functioning
reducetheactivitiesandconsider
undisturbedadjacentareasassourceof
species
Noise disturbancetomegafauna;
producedatsurfacevessel’sengine
andmachinery,atbottom
machinery,crushingactivities,and
pumping
changesinbehaviour;attractionto
thesource,avoidancefromthe
sourceatsomerange,maskingof
signalsofinterest,inducestressfor
animalswhichlingerinthearea
removethepressure,reducingthenoise
withnewtechnologies
Intr.ofnon-
synthetics
disturbancetopelagicandbenthic
species
changeinspeciescomposition reducetheuseofnon-syntheticcompounds
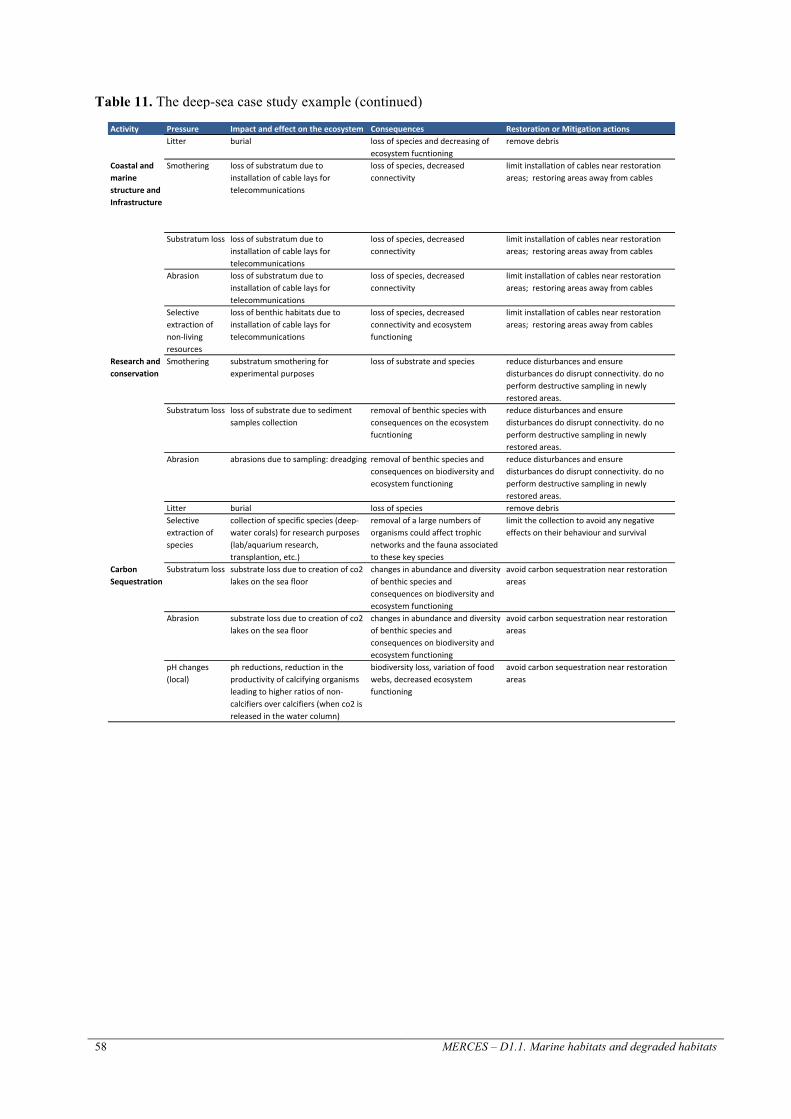
58 MERCES – D1.1. Marine habitats and degraded habitats
Table 11. The deep-sea case study example (continued)
Activity Pressure Impactandeffectontheecosystem Consequences RestorationorMitigationactionsLitter burial lossofspeciesanddecreasingof
ecosystemfucntioningremovedebris
CoastalandmarinestructureandInfrastructure
Smothering lossofsubstratumduetoinstallationofcablelaysfortelecommunications
lossofspecies,decreasedconnectivity
limitinstallationofcablesnearrestorationareas;restoringareasawayfromcables
Substratumloss lossofsubstratumduetoinstallationofcablelaysfortelecommunications
lossofspecies,decreasedconnectivity
limitinstallationofcablesnearrestorationareas;restoringareasawayfromcables
Abrasion lossofsubstratumduetoinstallationofcablelaysfortelecommunications
lossofspecies,decreasedconnectivity
limitinstallationofcablesnearrestorationareas;restoringareasawayfromcables
Selectiveextractionofnon-livingresources
lossofbenthichabitatsduetoinstallationofcablelaysfortelecommunications
lossofspecies,decreasedconnectivityandecosystemfunctioning
limitinstallationofcablesnearrestorationareas;restoringareasawayfromcables
Researchandconservation
Smothering substratumsmotheringforexperimentalpurposes
lossofsubstrateandspecies reducedisturbancesandensuredisturbancesdodisruptconnectivity.donoperformdestructivesamplinginnewlyrestoredareas.
Substratumloss lossofsubstrateduetosedimentsamplescollection
removalofbenthicspecieswithconsequencesontheecosystemfucntioning
reducedisturbancesandensuredisturbancesdodisruptconnectivity.donoperformdestructivesamplinginnewlyrestoredareas.
Abrasion abrasionsduetosampling:dreadging removalofbenthicspeciesandconsequencesonbiodiversityandecosystemfunctioning
reducedisturbancesandensuredisturbancesdodisruptconnectivity.donoperformdestructivesamplinginnewlyrestoredareas.
Litter burial lossofspecies removedebrisSelectiveextractionofspecies
collectionofspecificspecies(deep-watercorals)forresearchpurposes(lab/aquariumresearch,transplantion,etc.)
removalofalargenumbersoforganismscouldaffecttrophicnetworksandthefaunaassociatedtothesekeyspecies
limitthecollectiontoavoidanynegativeeffectsontheirbehaviourandsurvival
CarbonSequestration
Substratumloss substratelossduetocreationofco2lakesontheseafloor
changesinabundanceanddiversityofbenthicspeciesandconsequencesonbiodiversityandecosystemfunctioning
avoidcarbonsequestrationnearrestorationareas
Abrasion substratelossduetocreationofco2lakesontheseafloor
changesinabundanceanddiversityofbenthicspeciesandconsequencesonbiodiversityandecosystemfunctioning
avoidcarbonsequestrationnearrestorationareas
pHchanges(local)
phreductions,reductionintheproductivityofcalcifyingorganismsleadingtohigherratiosofnon-calcifiersovercalcifiers(whenco2isreleasedinthewatercolumn)
biodiversityloss,variationoffoodwebs,decreasedecosystemfunctioning
avoidcarbonsequestrationnearrestorationareas
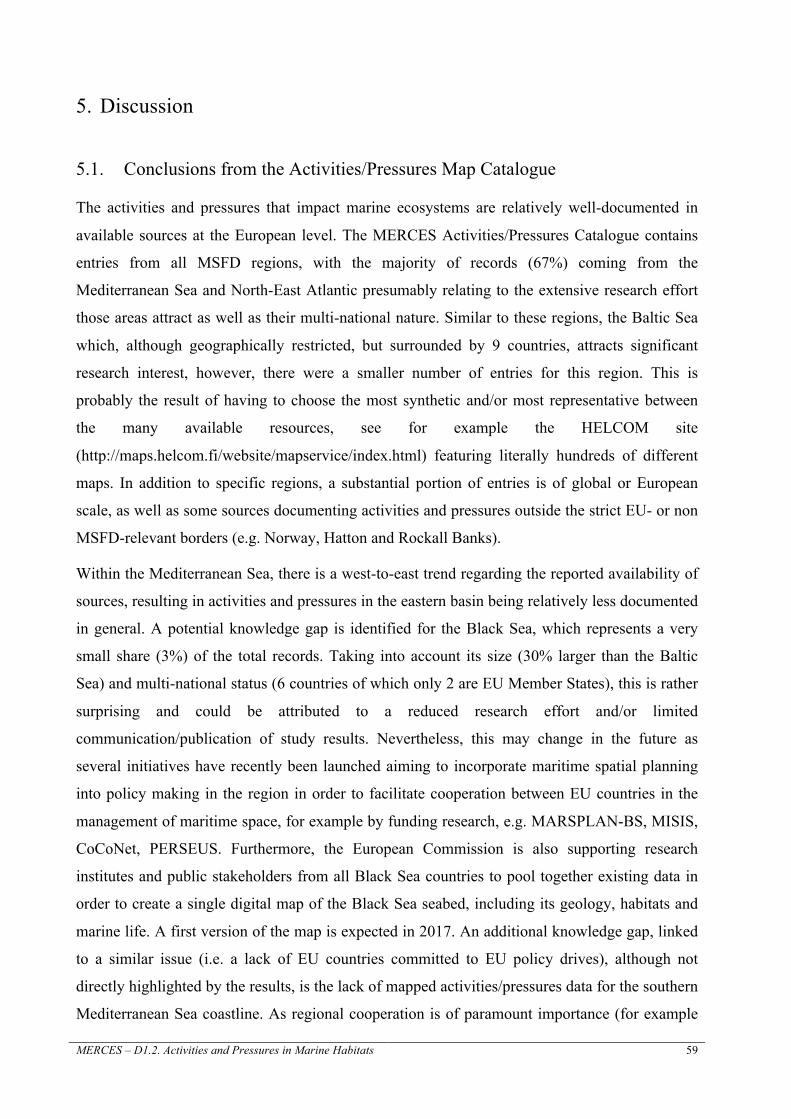
MERCES – D1.2. Activities and Pressures in Marine Habitats 59
5. Discussion
5.1. Conclusions from the Activities/Pressures Map Catalogue
The activities and pressures that impact marine ecosystems are relatively well-documented in
available sources at the European level. The MERCES Activities/Pressures Catalogue contains
entries from all MSFD regions, with the majority of records (67%) coming from the
Mediterranean Sea and North-East Atlantic presumably relating to the extensive research effort
those areas attract as well as their multi-national nature. Similar to these regions, the Baltic Sea
which, although geographically restricted, but surrounded by 9 countries, attracts significant
research interest, however, there were a smaller number of entries for this region. This is
probably the result of having to choose the most synthetic and/or most representative between
the many available resources, see for example the HELCOM site
(http://maps.helcom.fi/website/mapservice/index.html) featuring literally hundreds of different
maps. In addition to specific regions, a substantial portion of entries is of global or European
scale, as well as some sources documenting activities and pressures outside the strict EU- or non
MSFD-relevant borders (e.g. Norway, Hatton and Rockall Banks).
Within the Mediterranean Sea, there is a west-to-east trend regarding the reported availability of
sources, resulting in activities and pressures in the eastern basin being relatively less documented
in general. A potential knowledge gap is identified for the Black Sea, which represents a very
small share (3%) of the total records. Taking into account its size (30% larger than the Baltic
Sea) and multi-national status (6 countries of which only 2 are EU Member States), this is rather
surprising and could be attributed to a reduced research effort and/or limited
communication/publication of study results. Nevertheless, this may change in the future as
several initiatives have recently been launched aiming to incorporate maritime spatial planning
into policy making in the region in order to facilitate cooperation between EU countries in the
management of maritime space, for example by funding research, e.g. MARSPLAN-BS, MISIS,
CoCoNet, PERSEUS. Furthermore, the European Commission is also supporting research
institutes and public stakeholders from all Black Sea countries to pool together existing data in
order to create a single digital map of the Black Sea seabed, including its geology, habitats and
marine life. A first version of the map is expected in 2017. An additional knowledge gap, linked
to a similar issue (i.e. a lack of EU countries committed to EU policy drives), although not
directly highlighted by the results, is the lack of mapped activities/pressures data for the southern
Mediterranean Sea coastline. As regional cooperation is of paramount importance (for example
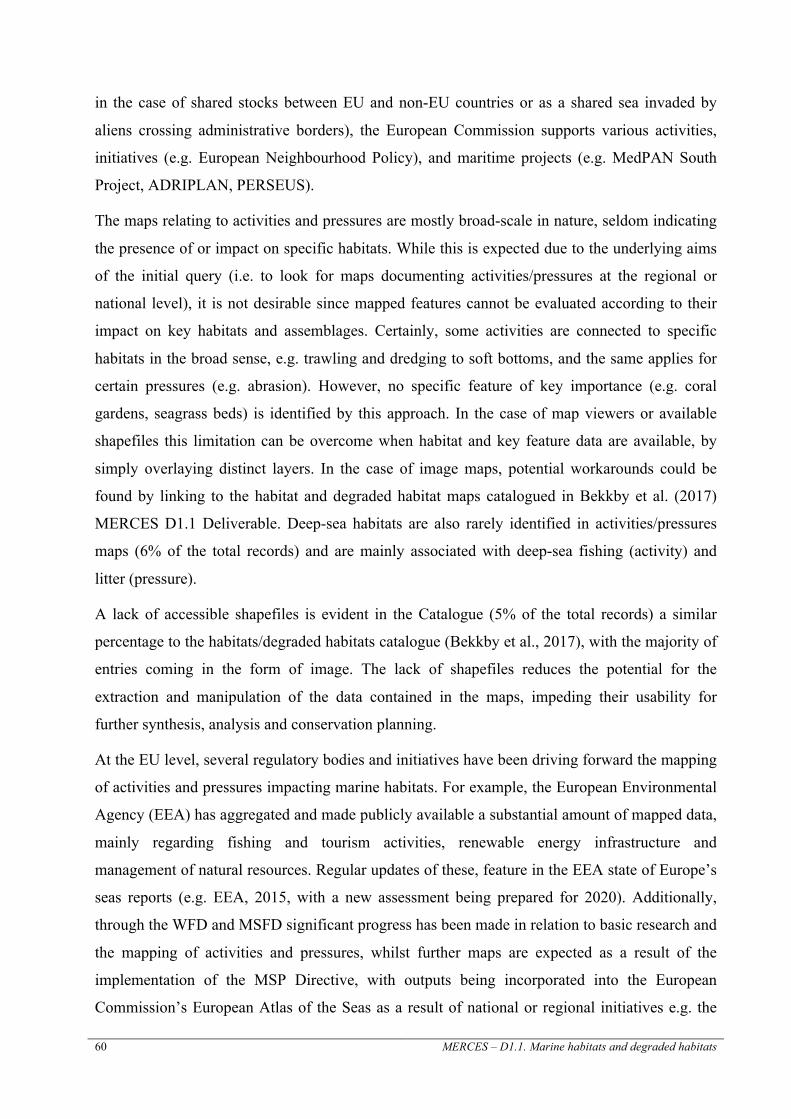
60 MERCES – D1.1. Marine habitats and degraded habitats
in the case of shared stocks between EU and non-EU countries or as a shared sea invaded by
aliens crossing administrative borders), the European Commission supports various activities,
initiatives (e.g. European Neighbourhood Policy), and maritime projects (e.g. MedPAN South
Project, ADRIPLAN, PERSEUS).
The maps relating to activities and pressures are mostly broad-scale in nature, seldom indicating
the presence of or impact on specific habitats. While this is expected due to the underlying aims
of the initial query (i.e. to look for maps documenting activities/pressures at the regional or
national level), it is not desirable since mapped features cannot be evaluated according to their
impact on key habitats and assemblages. Certainly, some activities are connected to specific
habitats in the broad sense, e.g. trawling and dredging to soft bottoms, and the same applies for
certain pressures (e.g. abrasion). However, no specific feature of key importance (e.g. coral
gardens, seagrass beds) is identified by this approach. In the case of map viewers or available
shapefiles this limitation can be overcome when habitat and key feature data are available, by
simply overlaying distinct layers. In the case of image maps, potential workarounds could be
found by linking to the habitat and degraded habitat maps catalogued in Bekkby et al. (2017)
MERCES D1.1 Deliverable. Deep-sea habitats are also rarely identified in activities/pressures
maps (6% of the total records) and are mainly associated with deep-sea fishing (activity) and
litter (pressure).
A lack of accessible shapefiles is evident in the Catalogue (5% of the total records) a similar
percentage to the habitats/degraded habitats catalogue (Bekkby et al., 2017), with the majority of
entries coming in the form of image. The lack of shapefiles reduces the potential for the
extraction and manipulation of the data contained in the maps, impeding their usability for
further synthesis, analysis and conservation planning.
At the EU level, several regulatory bodies and initiatives have been driving forward the mapping
of activities and pressures impacting marine habitats. For example, the European Environmental
Agency (EEA) has aggregated and made publicly available a substantial amount of mapped data,
mainly regarding fishing and tourism activities, renewable energy infrastructure and
management of natural resources. Regular updates of these, feature in the EEA state of Europe’s
seas reports (e.g. EEA, 2015, with a new assessment being prepared for 2020). Additionally,
through the WFD and MSFD significant progress has been made in relation to basic research and
the mapping of activities and pressures, whilst further maps are expected as a result of the
implementation of the MSP Directive, with outputs being incorporated into the European
Commission’s European Atlas of the Seas as a result of national or regional initiatives e.g. the

MERCES – D1.2. Activities and Pressures in Marine Habitats 61
SIMCelt cross-border project involving partners from the UK, Ireland and France, and
supporting the implementation of the Maritime Spatial Planning Directive in the Celtic Seas.
In addition, the EU have led or funded a number of research projects with pan European (e.g.
EMODnet, PERSEUS, and BENTHIS) and more restricted, sub-regional coverage (e.g.
ADRIPLAN and Med-IAMER). At the regional or regional sea level, the extensive production
and aggregation of mapped environmental data has been coordinated by OSPAR and HELCOM,
two major international commissions governing policies in the North-East Atlantic and the Baltic
Sea, respectively. The OPAR Quality Status Report of 2010 is perhaps the most comprehensive
of these (including, for example, detailed factsheets on threatened and/or declining species and
habitats (OSPAR, 2010)) and OSPAR has an Intermediate Assessment due in 2017 leading to
another QSR in 2020. Within the Mediterranean Sea, MEDTRENDS (WWF project funded by
EU through the European Development Fund, Piante and Ody, 2015) has produced a substantial
repository of multi-parametric maps of activities and pressures, although its focus is the eight
Mediterranean countries of the EU. Finally, at the national level, there are a number of initiatives
which have generated comprehensive collections of mapped activities/pressures mainly at the
EEZ level, for example, the Marine Atlases of Scotland and Ireland.
Regarding the mapping of activities, variation was observed in relation to the degree to which
the activities are quantified, often in relating to the nature of the activity (i.e. fixed or mobile).
Specifically, some activities are mapped as geographic points indicating the presence of an
activity (such as locations of mining or hydrocarbon extraction and pipeline contiguous presence,
locations of ports, shipping routes, locations of fish farms), while others indicate concentrations
of activities over wide areas (such as fishing effort, density of marine traffic, intensity of
tourism, and so on) (Figure 14).
The most frequently mapped activity in the MERCES Activities/Pressures Map Catalogue was
the extraction of living resources which is generally expressed as cumulative swept area, amount
of catch, size of fishing fleet, or fishing effort (usually derived from AIS/VMS signals). The
latter, especially, makes the activity easy to track and quantify, resulting in the availability of
relevant maps at varying scales (Figure 15). It should be noted though, that the coverage may be
incomplete, due to the absence of information from specific fleets.
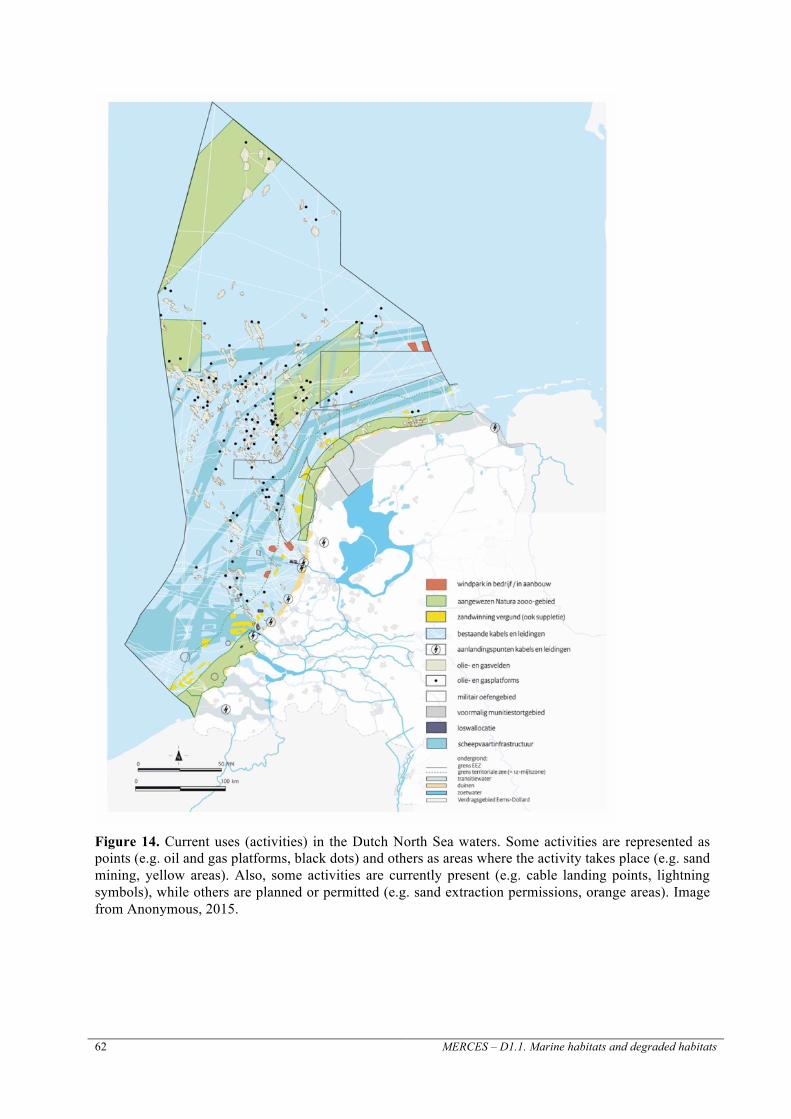
62 MERCES – D1.1. Marine habitats and degraded habitats
Figure 14. Current uses (activities) in the Dutch North Sea waters. Some activities are represented as points (e.g. oil and gas platforms, black dots) and others as areas where the activity takes place (e.g. sand mining, yellow areas). Also, some activities are currently present (e.g. cable landing points, lightning symbols), while others are planned or permitted (e.g. sand extraction permissions, orange areas). Image from Anonymous, 2015.
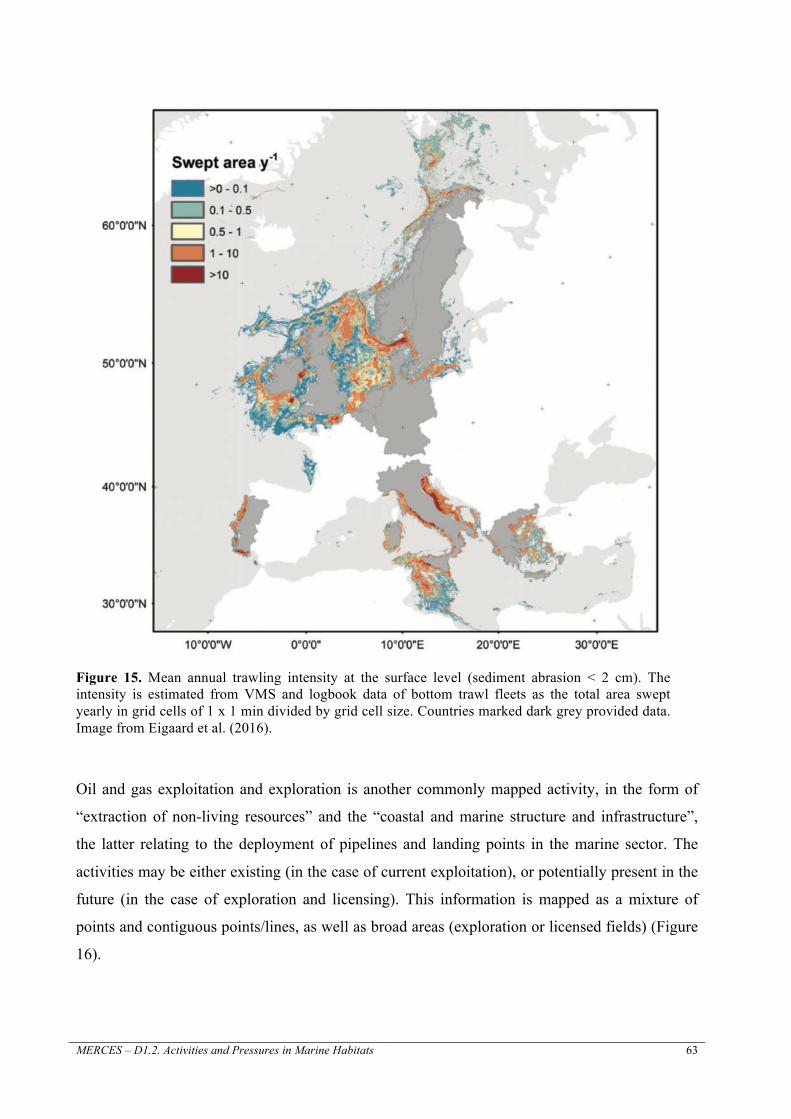
MERCES – D1.2. Activities and Pressures in Marine Habitats 63
Figure 15. Mean annual trawling intensity at the surface level (sediment abrasion < 2 cm). The intensity is estimated from VMS and logbook data of bottom trawl fleets as the total area swept yearly in grid cells of 1 x 1 min divided by grid cell size. Countries marked dark grey provided data. Image from Eigaard et al. (2016).
Oil and gas exploitation and exploration is another commonly mapped activity, in the form of
“extraction of non-living resources” and the “coastal and marine structure and infrastructure”,
the latter relating to the deployment of pipelines and landing points in the marine sector. The
activities may be either existing (in the case of current exploitation), or potentially present in the
future (in the case of exploration and licensing). This information is mapped as a mixture of
points and contiguous points/lines, as well as broad areas (exploration or licensed fields) (Figure
16).

64 MERCES – D1.1. Marine habitats and degraded habitats
Figure 16. Current offshore oil and gas exploration and production contracts in the Mediterranean Sea (depicted as broad areas), and active and projected gas pipelines (depicted as lines). Image from Piante and Ody (2015).
The production of living resources is another major activity in the catalogue which captures
aquaculture and fish farming activities. This tends to be relatively well-documented and mapped
at the national level, generally taking the form of point locations (presence of farming units),
although sometimes it can also be quantified (either through production levels or incorporated in
pressure indices) (Figure 17).
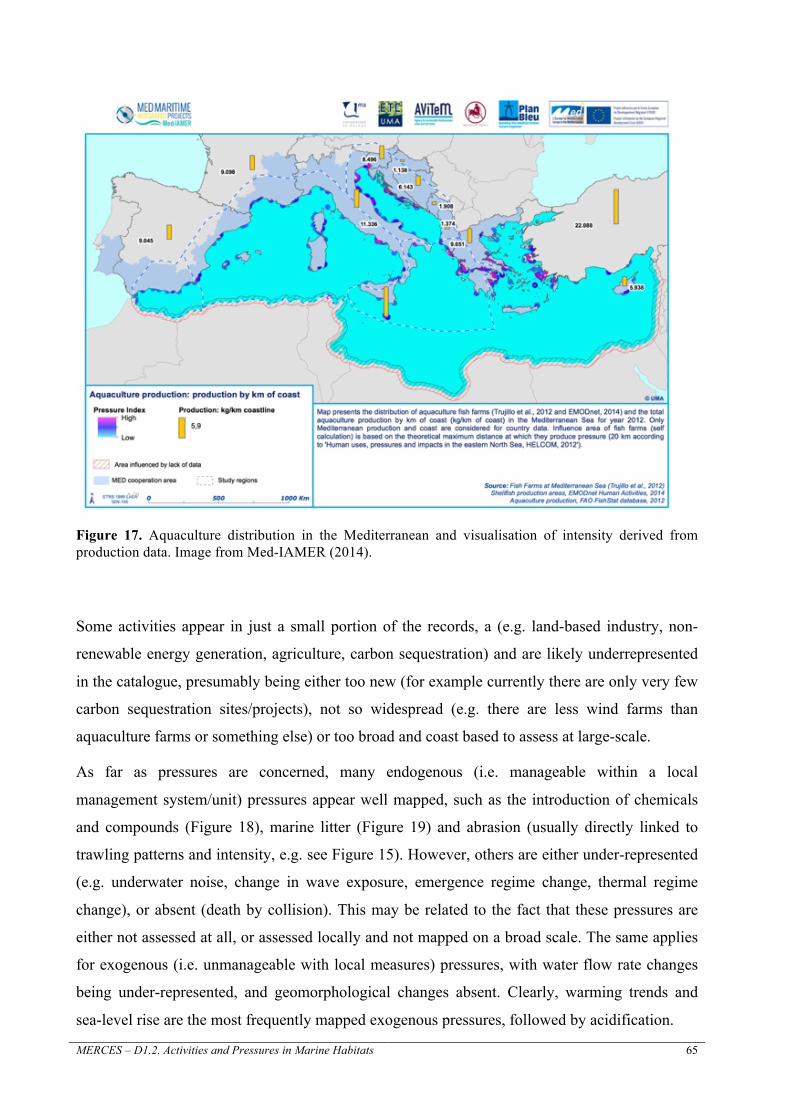
MERCES – D1.2. Activities and Pressures in Marine Habitats 65
Figure 17. Aquaculture distribution in the Mediterranean and visualisation of intensity derived from production data. Image from Med-IAMER (2014).
Some activities appear in just a small portion of the records, a (e.g. land-based industry, non-
renewable energy generation, agriculture, carbon sequestration) and are likely underrepresented
in the catalogue, presumably being either too new (for example currently there are only very few
carbon sequestration sites/projects), not so widespread (e.g. there are less wind farms than
aquaculture farms or something else) or too broad and coast based to assess at large-scale.
As far as pressures are concerned, many endogenous (i.e. manageable within a local
management system/unit) pressures appear well mapped, such as the introduction of chemicals
and compounds (Figure 18), marine litter (Figure 19) and abrasion (usually directly linked to
trawling patterns and intensity, e.g. see Figure 15). However, others are either under-represented
(e.g. underwater noise, change in wave exposure, emergence regime change, thermal regime
change), or absent (death by collision). This may be related to the fact that these pressures are
either not assessed at all, or assessed locally and not mapped on a broad scale. The same applies
for exogenous (i.e. unmanageable with local measures) pressures, with water flow rate changes
being under-represented, and geomorphological changes absent. Clearly, warming trends and
sea-level rise are the most frequently mapped exogenous pressures, followed by acidification.

66 MERCES – D1.1. Marine habitats and degraded habitats
Figure 18. Aggregated assessment of hazardous substances in biota measured in the North-East Atlantic, Baltic Sea and the Mediterranean Sea. Image from EEA (2015).

MERCES – D1.2. Activities and Pressures in Marine Habitats 67
Figure 19. Litter densities (number of items per hectare) in different locations across some European waters obtained with ROVs, towed camera systems, manned submersible and trawls. Image from Pham et al. (2014).
Nevertheless, whilst an activity has the potential to cause multiple pressures, it may not
necessarily be realised in practice in a particular space/habitat, for example, shipping only causes
abrasion by anchoring or grounding in shallow waters rather than along an entire shipping
route/track and might not actually ever happen if the vessels tie-up alongside in port.
Furthermore, even if an activity does take place its resultant pressure upon the marine
environment will vary as a function of its frequency/intensity/duration and footprint. For
example, many pressures may be accidental (shipping: abrasion from grounding, contamination
from oil spills) and therefore infrequent, but others may be a major part of the activity and for the
large part match the action/footprint of the activity (fishing: abrasion from trawling activities).
Furthermore, whist activities are shown as points of presence or areas of concentration, their
pressures may go beyond the actual footprint of the activity, for example smothering caused by
dredging/trawling impacts areas outside the actual footprint of the activity, as does
contamination by hydrocarbons following an oil spill. Therefore, whilst maps of activity are
useful indicators of its location they do not necessarily translate into maps of pressures (and vice
versa) and as such care needs to be taken when interpreting them.
A limitation with a number of the maps in the catalogue is their applicability at small spatial
scales. Whilst VMS data have highly accurate initial vessel geo-positioning (10 m accuracy) by
the time they are processed they are often at 2000 m accuracy based on an intensity derived from
the proportion of an area swept per year. The same is also true for interpolated maps based on
modelled data, which is often relatively coarse. If the resolution is low, the possibility of having
accurate data within that area is also low, making it difficult to infer activity extent at local

68 MERCES – D1.1. Marine habitats and degraded habitats
levels. In addition, such “footprints” of activity often lack actual details on intensity, temporal
scales, actual duration and in the case of a pressure, how long the impact may last.
The comprehensive review undertaken in this report highlights several limitations and gaps
concerning the resolution, data availability and format and geographical coverage of mapped
pressure and activates occurring in European Seas as well as their geographic coverage:
• Static data: A clear majority of the available activities/pressure maps are simple images
greatly reducing their usability since they cannot be accurately overlaid with other
complimentary maps nor can the underlying data be easily extracted. Moreover, images
are static in time (in contrast to digital media which can be easily updated with newer
data), while activities and pressures in marine habitats are temporally dynamic.
• Spatial resolution: Available activities/pressure maps are usually broad-scale and low-
resolution. This has considerable implications for precision and accuracy, further
enhanced by the fact that broad-scale coverage for non-point data is usually inferred by
interpolation. While low resolution may be sufficient for setting conservation priorities
(see Giakoumi et al., 2015) it cannot be considered appropriate for actual conservation
and for restoration actions.
• Modelled data: Related to the previous bullet; a number of the available maps may
contain a high level of modelled/predicted data (using a variety of data proxies) with a
high degree of interpolation between actual data points. Validation of spatial analysis,
that may cover complete regional seas, is an issue and this leads to high levels of
uncertainty and the limitation of broad scale map utilisation only for broad scale use.
• Geographic coverage: Geographic under-representation is an issue, both at the regional
level (Black Sea) and sub-basin level (Eastern Mediterranean Sea). This reflects
geographical research efforts, but may also reflect the lesser degree of local project
expertise in some areas.
• Over-representation: some specific habitats have more information than others (e.g.
seagrass meadows). This is most likely due to their multi-use, perceived or legislative
importance, or simple “accessibility”.
• Hard to find information: Grey literature (e.g. dissemination publications, technical and
project reports) is a significant source for useful activities/pressure maps; however, these
sources are not directly visible or searchable through standard literature platforms (e.g.
SCOPUS, WoS).

MERCES – D1.2. Activities and Pressures in Marine Habitats 69
Based on the above, it is recommended that future mapping initiatives should focus on the
following:
• Generating georeferenced data: The generation of digital maps based on georeferenced
information, preferably in open-access formats. The ideal solution would be to create and
support universal web platforms to serve as data repositories and visualizers to allow the
interrogation of multiple sources of information at varying spatial and temporal scales.
• Increased needs in assessments. Open access georeferenced data on habitats, degraded
habitats and activities/pressures are in high demand for status and health assessments,
cumulative effects assessments, EU directives, EIA and EEA assessments and for
planning for MSP. They are also needed for threatened and special places in the world’s
oceans such as the IUCN Red Lists assessments and the work of the Convention of
Biological on Ecologically or Biologically Significant Areas respectively. All these
assessments need to one degree or another ecological, biological and pressures data
layers - overlaying multiple layers of information is becoming a necessity (see examples
for vulnerability, fragility and naturalness and high/low level of human induced habitat
degradation, in the Global Ocean Biodiversity Initiative that builds on the scientific
criteria adopted by the Parties to the Convention on Biological Diversity (CBD)
www/gobi.org)
• Filling gaps in knowledge: Filling the aforementioned geographical and temporal gaps
(by digitization of old/historical maps) and supporting regional and national mapping
initiatives. National or regional atlases are often valuable resources since they integrate
state-of-the-art knowledge over broad components of the environment and relevant
human activities and induced pressures.
• Gaining high-level standardization: The role of transnational and intergovernmental
organizations such as the EU but also UNEP-MAP, OSPAR, HELCOM and the Black
Sea Commission can be crucial towards the production, standardization, and integration
of data with universal approaches and balanced geographical representativeness.
5.2. Restoration Potential and Conclusions from the Case Studies
For the shallow soft substrate seagrass example, the effects (Table 7) of the mix of activities and
pressures operating there include changes in sediment biogeochemistry, changes in hydrology,
70 MERCES – D1.1. Marine habitats and degraded habitats
changes in light and ambient water biochemical parameters. Negative changes in biology and
species include effects of native and alien species, micro and macroalgal overgrowth and
blooms. Consequences include impacts on key features: population and spatial dynamics,
reduced growth, primary production, habitat complexity, general diversity, dispersion and
migration of species, reproductive success, increased stress and mortality, smother and damage,
loss of seagrass and bare patches, increased habitat fragmentation (decreased patch size,
increased isolation and decreased connectivity) as well as shifts in trophic structure.
For the three shallow hard substrate examples effects and consequences include removing and
destroying the habitat (e.g. by mooring/dredging and trawling in the kelp), damaging flora and
associated fauna, altering environmental characteristics for species, shadowing and enrichment
effects, hydrological changes, predation removal, reducing connectivity among habitats,
mortality of organisms, loss of diversity, loss of density and cover, reducing genetic
connectivity, loss of structural complexity, loss of resilience (ability to recover from
disturbances), impairment on organisms biology, lethal or sub-lethal effects on many algal
species (specially structural Cystoseira species), change in species composition, simplification of
communities.
Existing and potential effects on deep-sea habitats (Table 11) include changes in substrate
characteristics such as porosity, particle size distribution and mineralogy biogeochemistry, loss
and change of substratum due to mining activities, oil-gas platforms, cables lays and the creation
of CO2 lakes on the sea floor, changes in sediment topography and complexity (e.g. sediment
displacement due to trawling causing flattening of the sea floor, plumes generated by trawling
and mining activities leading to deposition, burial and clogging of suspension feeding (including
water column gelatinous zooplankton), changes in hydrology (in the case of the carbon
sequestration activity with pH reductions and reduction in the productivity of calcifying
organisms leading to higher ratios of non-calcifiers over calcifiers when CO2 is released in the
water column), changes in biodiversity and species composition (including removal of various
species such as fish and corals for commercial interest and scientific/research purposes
(lab/aquarium research, transplantation, etc.), as well as changes in physical properties with
introduction of litter and noise, changes in nutrient conditions, changes in pH, changes in
temperature and salinity and release of toxic metals. The main consequences are the loss of
species, decreased biodiversity, changes in behaviour and species composition, alterations of
food webs, decreased connectivity and ecosystem functioning.
MERCES – D1.2. Activities and Pressures in Marine Habitats 71
As expected, numerous pressures are recorded in all case studies acting as mechanisms of change
and causing progressive state change effects from the population to the ecosystem level in
agreement with Smith et al. (2016) (see below for cumulative pressure assessments). The options
recorded in the case studies are all similar in nature offering the same advice and conclusions.
These include: to eliminate, reduce or better regulate the activity, and where possible, conduct
the activity in a region where the ecosystem has high recovery potential, whilst also making
efforts to reduce impacts and inputs, ameliorate water quality, control harmful practices, reduce
disturbance and ensure disturbance does not disrupt connectivity, create habitat connections,
remove alien species and litter before restoration. Restoration should be performed away from
problem areas, activities should be eliminated/reduced in restoration areas, and destructive
sampling should not be allowed in newly restored areas. In most of the cases mitigation is the
recommended action with very few cases actually mentioning (additional) active restoration (e.g.
transplanting). In these latter cases emphasis is given to the prevailing pre-conditions and the
biological and environmental features that could compromise the restoration efforts in the
absence of suitable factors to support spontaneous regeneration and restoration.
In this deliverable/section, six key habitats were reviewed listing pressures, impacts,
consequences and restoration or mitigation actions. Restoration practices themselves, and/or
differences between the key habitats in terms of resilience and receptiveness to restoration are
discussed in terms of six major ecosystem features (including diversity, vulnerability,
connectivity and structural complexity) and presented in detail in MERCES D1.1 Deliverable
(Bekkby et al., 2017). In summary, based on ecosystem features and logistical considerations,
deep-sea coral habitats are likely to be the most challenging to restore due to their slow growth
rates and high vulnerability while, kelp forests, among the shallow hard-bottom habitats, are
probably the easiest to restore owing to their fast growth rates and high levels of connectivity.
5.3. Pressures and pressure assessments
5.3.1. Pressures
The Habitats Directive, one of the oldest EU policies and of fundamental importance in assessing
the status and trends of species and habitats of the European Seas, has been using for its
reporting and assessment needs a comprehensive list of pressures and threats based on
hierarchical system of over 400 threats and pressure codes
(http://bd.eionet.europa.eu/activities/Reporting/Article_17/reference_portal). These include a

72 MERCES – D1.1. Marine habitats and degraded habitats
variety of activities and an extensive list of pressures ranging from agriculture and forestry to
disturbances due to human activities, pollution, invasive and introduced species to geological
events and natural catastrophes (see Table 12, 13, 14).
Table 12. Habitat Directive listed activities, pressures and threats
HDPressuresforReporting
AgricultureSilviculture,forestryMining,extractionofmaterialsandenergyproductionTransportationandservicecorridorsUrbanisation,residentialandcommercialdevelopmentBiologicalresourceuseotherthanagriculture&forestryHumanintrusionsanddisturbancesPollutionInvasive,otherproblematicspeciesandgenesNaturalSystemmodificationsNaturalbioticandabioticprocesses(withoutcatastrophes)Geologicalevents,naturalcatastrophesClimatechangeUnknownthreatorpressureNothreatsorpressuresThreatsandpressuresfromoutsidetheEUterritoryThreatsandpressuresfromoutsidetheMemberState

MERCES – D1.2. Activities and Pressures in Marine Habitats 73
Table 13. Habitat Directive listed pressures under Mining, extraction of materials and energy production, includes various levels as seen by the code (part of the hierarchical system)
code HDPressuresUnderMining,extractionofmaterialsandenergyproduction
C Mining,quarrying&energyproductionC01 MiningandquarryingC01.01 SandandgravelextractionC01.01.01 sandandgravelquarriesC01.01.02 removalofbeachmaterialsC01.02 LoamandclaypitsC01.03 PeatextractionC01.03.01 handcuttingofpeatC01.03.02 mechanicalremovalofpeatC01.04 MinesC01.04.01 opencastminingC01.04.02 undergroundminingC01.05 SaltworksC01.05.01 abandonmentofsaltpans(salinas)C01.05.02 conversionofsaltpansC01.06 GeotechnicalsurveyC01.07 MiningandextractionactivitiesnotreferredtoaboveC02 OilandgasexploitationC02.01 explorationdrillingC02.02 productiondrillingC02.03 jack-updrillingrigC02.04 semi-submersiblerigC02.05 drillshipC03 Productionofrenewableenergy(abiotic)C03.01 geothermalpowerproductionC03.02 solarenergyproductionC03.03 windenergyproductionC03.04 tidalenergyproduction
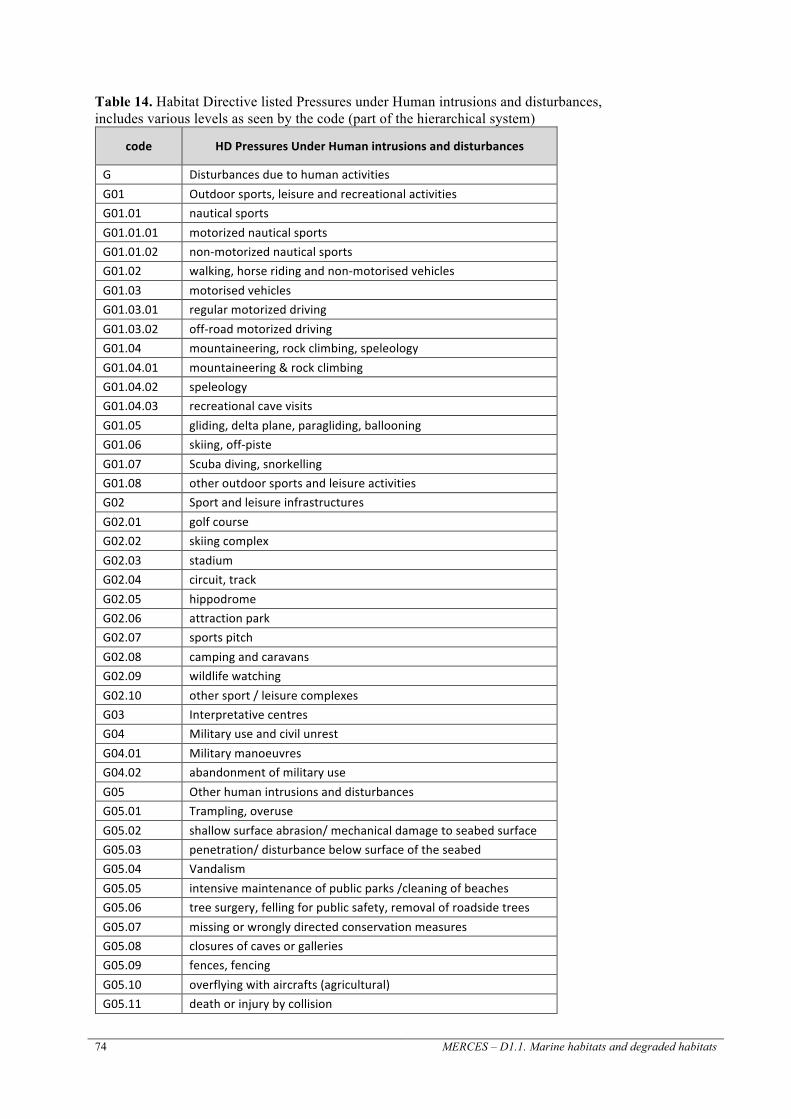
74 MERCES – D1.1. Marine habitats and degraded habitats
Table 14. Habitat Directive listed Pressures under Human intrusions and disturbances, includes various levels as seen by the code (part of the hierarchical system)
code HDPressuresUnderHumanintrusionsanddisturbances
G DisturbancesduetohumanactivitiesG01 Outdoorsports,leisureandrecreationalactivitiesG01.01 nauticalsportsG01.01.01 motorizednauticalsportsG01.01.02 non-motorizednauticalsportsG01.02 walking,horseridingandnon-motorisedvehiclesG01.03 motorisedvehiclesG01.03.01 regularmotorizeddrivingG01.03.02 off-roadmotorizeddrivingG01.04 mountaineering,rockclimbing,speleologyG01.04.01 mountaineering&rockclimbingG01.04.02 speleologyG01.04.03 recreationalcavevisitsG01.05 gliding,deltaplane,paragliding,ballooningG01.06 skiing,off-pisteG01.07 Scubadiving,snorkellingG01.08 otheroutdoorsportsandleisureactivitiesG02 SportandleisureinfrastructuresG02.01 golfcourseG02.02 skiingcomplexG02.03 stadiumG02.04 circuit,trackG02.05 hippodromeG02.06 attractionparkG02.07 sportspitchG02.08 campingandcaravansG02.09 wildlifewatchingG02.10 othersport/leisurecomplexesG03 InterpretativecentresG04 MilitaryuseandcivilunrestG04.01 MilitarymanoeuvresG04.02 abandonmentofmilitaryuseG05 OtherhumanintrusionsanddisturbancesG05.01 Trampling,overuseG05.02 shallowsurfaceabrasion/mechanicaldamagetoseabedsurfaceG05.03 penetration/disturbancebelowsurfaceoftheseabedG05.04 VandalismG05.05 intensivemaintenanceofpublicparks/cleaningofbeachesG05.06 treesurgery,fellingforpublicsafety,removalofroadsidetreesG05.07 missingorwronglydirectedconservationmeasuresG05.08 closuresofcavesorgalleriesG05.09 fences,fencingG05.10 overflyingwithaircrafts(agricultural)G05.11 deathorinjurybycollision

MERCES – D1.2. Activities and Pressures in Marine Habitats 75
The Habitats Directive also considers pressures originating from outside EU waters as well as
threats (defined as future pressures expected to occur in the not too distant future e.g., around 10
years) and climate change. This information is used in the regular status assessments to elucidate
the factors affecting the status of the habitats in question. In the most recent such State of Nature
report (COM, 2015) the main reported threats and pressures for marine systems include the use
of living resources (primarily fishing and harvesting of aquatic resources), pollution,
modification of natural conditions (dredging, hydrological modifications and coastline
management) and disturbances due to human activities (Figure 20) which is in agreement with
the findings of this report.
Figure 20. Frequency (percentage) of high ranked level 1 pressures and threats (together). COM (2015).
In a similar approach, the Water Framework Directive (Article 5) calls for the identification of
driving forces or sectors of activities that might exert pressures on the water bodies under
assessment. The driving forces include, among others, diffuse (e.g., urban drainage and
agriculture diffuse), point (e.g., wastewater, industry, mining, aquaculture), and morphological
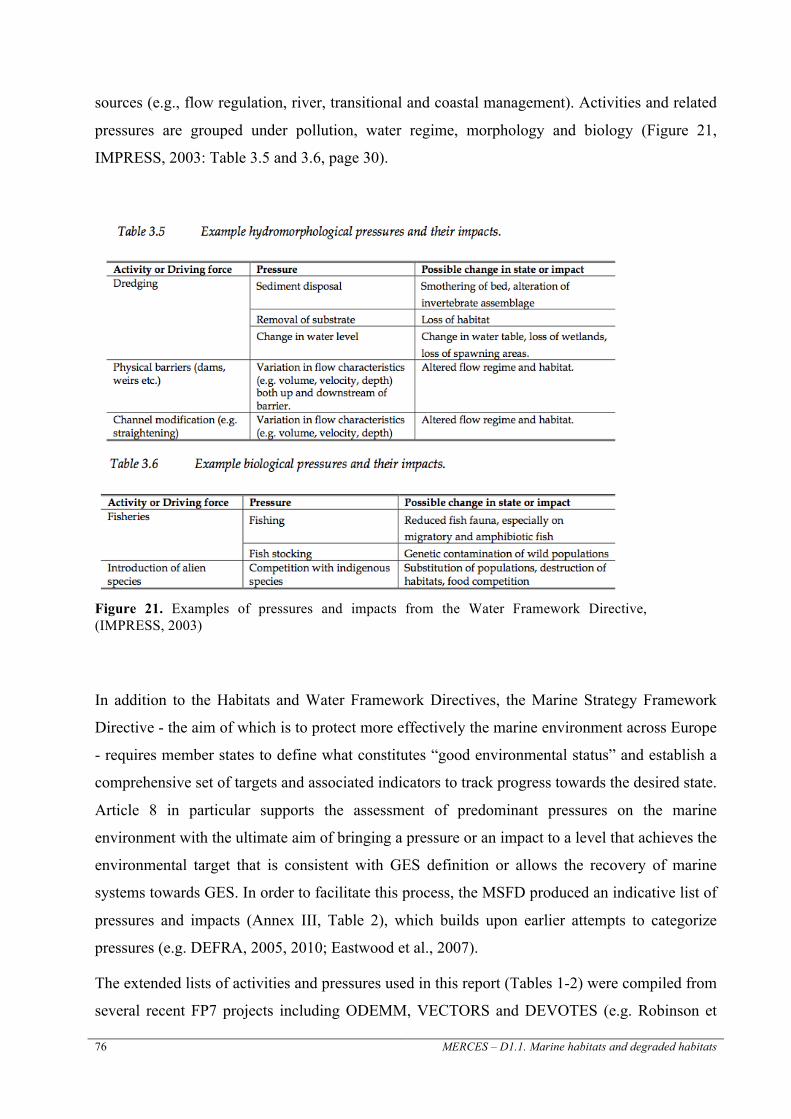
76 MERCES – D1.1. Marine habitats and degraded habitats
sources (e.g., flow regulation, river, transitional and coastal management). Activities and related
pressures are grouped under pollution, water regime, morphology and biology (Figure 21,
IMPRESS, 2003: Table 3.5 and 3.6, page 30).
Figure 21. Examples of pressures and impacts from the Water Framework Directive, (IMPRESS, 2003)
In addition to the Habitats and Water Framework Directives, the Marine Strategy Framework
Directive - the aim of which is to protect more effectively the marine environment across Europe
- requires member states to define what constitutes “good environmental status” and establish a
comprehensive set of targets and associated indicators to track progress towards the desired state.
Article 8 in particular supports the assessment of predominant pressures on the marine
environment with the ultimate aim of bringing a pressure or an impact to a level that achieves the
environmental target that is consistent with GES definition or allows the recovery of marine
systems towards GES. In order to facilitate this process, the MSFD produced an indicative list of
pressures and impacts (Annex III, Table 2), which builds upon earlier attempts to categorize
pressures (e.g. DEFRA, 2005, 2010; Eastwood et al., 2007).
The extended lists of activities and pressures used in this report (Tables 1-2) were compiled from
several recent FP7 projects including ODEMM, VECTORS and DEVOTES (e.g. Robinson et

MERCES – D1.2. Activities and Pressures in Marine Habitats 77
al., 2013; Smith et al., 2016). This work was focused on the MSFD lists and terminology (Annex
III, Table 2) while looking at adding clarity in the definitions (e.g., Patricio et al., 2014, 2016;
Smith et al., 2016) and consistency in the assessments. In most cases, proxies and groupings are
necessary. The choice of pressure groupings (or themes) is important but as the majority of EU
policy instruments call for the same main groupings, it is fairly standardised (biological change,
physical change (including, or not, hydrological modifications) and chemical changes related to
pollution, eutrophication and various inputs of substances, litter and energy). For example,
physical pressures, such as changes in siltation due to sediment plumes or even seabed abrasion,
are very difficult to measure and monitor and often the activities themselves are used as proxies
(e.g. fishing footprint from VMS vessel tracks to represent abrasion). Although grouping is often
the only practical solution, it is important to note here that the footprint and longevity of the
siltation and abrasion pressures would not be the same; sediment clouds would be more
ephemeral than trawl tracks and they would spread further than the measured trawl path by VMS
technology. But very rarely there will be data for separate pressures or pressure components (but
see an exception in Eigaard et al. (2016) who give surface and subsurface abrasion maps).
A note on consistency: as it obvious from the examples presented here (Tables 12-14, Figures
21-22) and the analysis of the Catalogue entries, a “pressure” is not always a pressure, and the
terms “driver”, “activity”, “sector”, “pressure”, “stressor” and “threat” have been used
interchangeably or in a variety of inconsistent ways (see for example, Halpern et al., 2008; Coll
et al., 2012; Micheli et al., 2013; Korpinen and Andersen, 2016; Knights et al., 2015). Further
examples of discrepancies in the definition and use of the elements of the DPSIR cycle in marine
assessments are given by Elliot (2014), Borja et al. (2006) for the WFD, Smith et al. (2016),
Patricio et al. (2016), both for the MSFD and Borja et al. (2016) for integrative assessments.
These discrepancies include also the “Impact” element of the DPSIR cycle where impacts can be
considered impacts or state changes, while impacts and effects (of pressures) can be used
interchangeably or be considered a different step in the process (Judd et al., 2015; Korpinen and
Andersen, 2016; Patricio et al., 2016; Smith et al., 2016). A major challenge is defining
“significant impacts”, “adverse effects” and/or “significant adverse effects” that can cause
“serious harm” (see Korpinen et al., 2013, for a Habitats Directive-MSFD example and Levin et
al., 2016, for a deep-sea example). Article 1 of the MSFD calls for marine strategies to be
developed and implemented in order to protect the marine environment, prevent its deterioration
or, where practicable, restore marine ecosystems in areas where they have been “adversely”
affected. In the revised MSFD (based on documents endorsed by the MSFD common
implementation groups) Member states will be required to assess the spatial extent of any
78 MERCES – D1.1. Marine habitats and degraded habitats
adversely affected habitats and to provide thresholds of the adverse effects by physical
disturbance through regional cooperation. These thresholds will be linked to GES and the risk of
failing to achieve it, in which case measures will be required and implemented. These could
range from activity reduction (reduce fishing effort) to active interventions (eradication of
invasive alien species) and ecosystem restoration. Depending on the degree of degradation and
the type of ecosystem in question, it is likely that repeated policy cycles and long monitoring of
restored sites (Bayraktarov et al., 2016) will be necessary to match the restoration time scale, as
full recovery may take decades to centuries (Clewell and Aronson, 2007)
5.3.2. Activity and Pressure Enigmas
Whilst marine activities are all to the benefit of society, they create pressures that are generally
perceived to be negative to the environment. A few activities that have been recently received
attention and large-scale investment are as a result of societies “worries” including carbon
sequestration and renewable energy activities (wind turbines, tidal and wave energy generating
systems). There are, however, a few enigmas to this thought and some pressures/activities may
have mitigative or restorative abilities. Carbon sequestration has localised impacts in the area of
sequestration, but a far wider area of pressure reduction from containment of carbon dioxide.
Renewable energy activities may also create local pressures, but energy generated and
distributed widely leads to a reduction in more wasteful (non-renewable resources – oils, gas and
coal) or polluting (production of CO2, other contaminants or nuclear waste) energy generation
activities. Structures in the sea associated with marine renewable energies may also provide hard
substrates that will allow hard substrate communities and local biodiversity hotspots to develop,
or lead to closed areas where other activities are no longer allowed to operate (e.g. fishing and
dredging), thus creating de-facto protected areas (albeit with potential displacement activity
consequences too). Another enigma relating to activities and pressures concerns litter. Lost
fishing gears (classified under litter) may ghost-fish for some time after loss, but in time will
provide hard substrates for colonisation of hard substrate fauna. Such objects on the bottom may
also baffle seabed currents and allow settlement of larvae and colonisation in the lee of the
objects (Matsuoka et al., 2005).
MERCES – D1.2. Activities and Pressures in Marine Habitats 79
5.3.3. Assessments
Numerous policies call for preservation/restoration of habitats, minimization of loss/reduction of
impacts and holistic ecosystem health assessments.
Structured linkage frameworks (matrices of Pressures x Activities), like those produced for the
case study examples in this deliverable, are the base of many integrated pressure or cumulative
pressure and impact assessments (CPIA). OSPAR, for example has regular assessments of
certain human activities and Intersessional Correspondence Group working on cumulative
effects. Numerous such pressure assessments have been performed in Europe and elsewhere in
the last decade (Halpern et al., 2008; Korpinen et al., 2013; Korpinen and Andersen, 2016;
Knights et al., 2015; Goodsir et al., 2015; Giakoumi et al., 2015; UK Charting Process
assessments http://www.marlin.ac.uk/habitats/SNCB-benchmarks,
http://www.marlin.ac.uk/species/sensitivity_rationale ,
http://www.marlin.ac.uk/habitats/detail/1142/deep_water_lophelia_reefs, Borja et al., 2016). A
recent review of 40 assessments (Korpinen and Andersen, 2016) concludes that activities were
included in the majority of the studies, pressures were commonly linked to activities and
pressure categories were used often according to the MSFD. Impacts, often cumulative, were
assessed based on the sensitivity of the habitats/ecosystem components, their resistance to
damage (Eno et al., 2013), or the severity of the pressures. However, very few studies have
included a full array of pressures in their assessments, or have looked at more than a few
ecosystem components.
Due to lack of information or data gaps, few studies incorporated the element of time, assuming
that many pressures are long lasting. However, some pressures and impacts can be short-lived
(e.g. noise). One of the assessments attempted to assess and incorporate the recovery potential by
looking at the pressure persistence, i.e. time (years) the pressure continues to cause impact after
cessation of the activity working at the broad habitat level (e.g., littoral or sub-littoral sediments).
Using expert judgment and published information, over 4000 potential activity-pressure-
species/habitats-impact chains were evaluated for this assessment (see details in Knights et al.,
2013, 2015). Four persistence categories and four resilience categories were used in the
assessment (i.e. recovery time of the ecological characteristic to return to pre-impact conditions).
The resulting recovery lag (based on the persistence of a pressure and the resilience of a
habitat/species group) was found to be highly dependent on the pressure type. Relatively short
minimum recovery times (between 1 and 11 years) were associated with physical pressures (e.g.,
abrasion, noise) while biological (e.g. NIS) contaminant and hydrological pressures were
80 MERCES – D1.1. Marine habitats and degraded habitats
characterized by long RL times of >100 years. For some pressure types, there were no
differences in recovery lag between regions/seas (e.g., non-synthetic or synthetic contaminants),
but for others such as recovery following nitrogen and phosphorus enrichment were region
specific (estimated to take a minimum of 11 years in the Baltic Sea but only 2–3 years in all
other regions (Knights et al., 2015, Figure 22 from his Figure 4).
In agreement with findings in this Deliverable and Bekkby et al. (2017) MERCES Deliverable
D.1.1., most of the assessments worked at the broad habitat types as these are often the only
available mapped habitats (Korpinen and Andersen, 2016).
Spatial and temporal uncertainty and uncertainty in measurements (e.g. objective measurements
versus estimated or modelled values) is an issue that is increasingly addressed systematically by
some of the assessments (Borja et al., 2016). Despite the simplicity involved in these
assessments, for example the relationship between pressure and state change is often assumed to
be linear, and the interaction between co-occurring activities and pressures is ignored or assumed
to be additive (when it could be, synergistic or antagonistic) they are very useful as risk based
frameworks for prioritization of management (Judd et al., 2015; Knights et al., 2015).
The common backbone to all these assessments, beyond methods for assessing impacts and
recovery from damage, is the need and use of spatial data on both pressure presence/intensity
and habitat/species distribution/occurrences. Korpinen and Andersen (2016) promote the open
access to geospatial data and free sharing of tools and codes such as the open access
EcoImpactMapper (Stock, 2016) used by the widely adopted Halpern et al. (2008) assessment.

MERCES – D1.2. Activities and Pressures in Marine Habitats 81
Figure 22. Distribution of Impact Risk and Recovery Lag scores grouped by pressure type in each of the 4 European regional seas (bars: Baltic Sea (green), Black Sea (yellow), Mediterranean Sea (orange) and North-East Atlantic (white)). The maximum IR and RL score for any chain is 0.7 and 1.0 respectively. No bar indicated the absence of the pressure in the region. Middle lines of boxplots represent the median values; hinge lengths (end of box) represent the 25% quartiles from the median; whiskers represent the 1.5 times the interquartile range (IQR) beyond the hinge. Outliers are shown as black dots (from Knights et al., 2015, Figure 4)
5.4. Potential for Restoration and Blue Growth
5.4.1. Restoration potential away from pressure hotspots
The identification of activities and pressure hot spots (as seen in the catalogue maps and the case
studies examples, Results section, Tables 6-10) is crucial for planning future restoration actions.
Highly degraded sites harbouring habitats which suffer intense anthropogenic impacts are

82 MERCES – D1.1. Marine habitats and degraded habitats
usually more difficult to restore (Abelson et al., 2016). Therefore, restoration activities taking
place in these hotspot areas are likely to require more intense restoration efforts as well as
greater costs. Mitigation of pressures and removal of their impacts at sites where restoration
activities take place could also enable the quicker recovery of the given habitat, as highlighted in
the aforementioned case studies. Notable measures which apply to most – if not all – of the
examined habitats include the elimination and/or regulation of particular detrimental activities
(e.g. harmful fishing practices), the reduction and/or removal of specific pressures (e.g. removal
of litter, reduction of nutrient input) and the amelioration of water quality.
Different types of activities and pressures differ in the level and type of degradation inflicted on
different habitats. The systematic review regarding degraded habitat map resources (Bekkby et
al., 2017, MERCES D1.1. Deliverable) revealed that most map sources reported multiple
activities and pressures (mostly physical and chemical) causing habitat degradation in all regions
and major habitat types. However, very few of the mapped sources include information on the
recovery restoration potential of the examined habitats. Mitigation and/or removal of pressures
causing habitat degradation (e.g., restrictions to fishing activities and MPAs) were highlighted as
important components of habitat restoration (see discussion in Elliot et al., 2007). Alternative
restoration actions were suggested only in a few cases, due to (a) the logistical constraints and
cost of applying active restoration at large scales, or (b) the lack of mapping initiatives suitable
for planning restoration actions. Therefore, the detailed mapping and assignment of “habitat-
specific” activities and pressures causing degradation, could aid recovery potential increasing the
chances for effective restoration.
5.4.2. Enabling restoration: the MSP Directive and Natural Capital Accounting
Blue Growth is the European Union’s long-term strategy to support sustainable growth in the
marine and maritime sectors (COM, 2012). Maintaining healthy seas and oceans are considered
vital to Blue Growth. The MSFD, adopted in 2008, establishes the policy framework to address
the challenges facing Europe's marine environment and to work towards a sustainable use of its
marine resources. With the Birds and Habitats Directives (EC, 2009; EEC, 1992 respectively),
this Directive forms the environmental pillar of the maritime policy and is at the heart of the
EU's contribution to international efforts to protect the marine environment (SWD, 2017).
Within the MSFD, the marine environment is considered “a precious heritage” and Member
States should adopt an ecosystem approach to the management of human activities, put emphasis
on the health of the ecosystem alongside the sustainable use of marine goods and services and
MERCES – D1.2. Activities and Pressures in Marine Habitats 83
take measures to achieve GES by 2020 to prevent further deterioration and/or restore marine
ecosystems in areas where they have been adversely affected.
The European Biodiversity Strategy 2020 (COM, 2011) promotes the restoration of degraded
ecosystems and their services and is intended to contribute to the Union's sustainable growth and
help mitigate and adapt to climate change (SWD, 2017). Indeed, the Biodiversity Strategy has
the longer term goal that by 2050, European Union biodiversity and the ecosystem services it
provides, its ‘natural capital’ will be protected, valued and appropriately restored for
biodiversity's intrinsic value and for their essential contribution to human wellbeing and
economic prosperity, and so that catastrophic changes caused by the loss of biodiversity are
avoided (COM, 2011). The recently amended Environmental Impact Assessment (EIA)
Directive (2014/52/EU), simplifies the rules for assessing the potential effects of projects on the
environment. If projects are likely to cause significant adverse effects on the environment,
developers are obliged to do the necessary to avoid, prevent or reduce such effects.
The Maritime Spatial Planning (MSP) Directive (Directive 2014/89/EU) is considered a key
enabler of Blue Growth. Spatial planning should lead to an increase in the efficiency of licensing
offshore activities whilst protecting the marine environment. The Directive requires Member
States to develop national marine spatial plans before March 2021. Together with the MSFD, the
MSP Directive is a foundation stone for the sustainable development of the EU's seas and oceans
(SWD, 2017). The main purpose of the MSP Directive is to promote sustainable development
and to identify the utilisation of maritime space for different sea uses as well as to manage spatial
uses and conflicts in marine areas. In so doing, the Directive will contribute to achieving the
aims of several Directives and initiatives including MSFD, the Habitats Directive and the EU
Biodiversity Strategy.
A common information need, shared by MSP and a number of the Directives and initiatives it
will support, is the collation and mapping of existing information to provide an inventory of
ecosystem components, and major human pressures and impacts, in a given area (cf.
Stelzenmüller et al. 2013) although differences do exist between Directives (e.g. MSP specifies a
minumum number of human activities to be considered explicitly mentioning several Blue
growth activities, the maritime dimension of coastal uses as well as nature conservation and
research (Boyes et al. 2016)). As well as informing zoning decisions required under MSP,
knowledge of the extent of ecosystem components is required to support mapping and
assessment and valuation of ecosystem goods and services (MAES, 2013, 2014); while spatial
and temporal data on pressures and impacts can be used to assist the determination of GES in the
84 MERCES – D1.1. Marine habitats and degraded habitats
MSFD and the future prospects of attaining/maintaining ecosystem integrity in Special Areas of
Conservation (cf. Article 17 reporting, Habitats Directive, (EIONET, 2017)).
Almost all economic activities in the sea cause some environmental impact. The degree of
impact depends on the severity/frequency of the activity and the resistance/recoverability of the
receiving environment. The 'concept' of sensitivity has been developed over many decades and
applied in coastal and marine habitats with numerous approaches, applied at a range of spatial
scales, and to a variety of management questions (see Roberts et al., 2010). Sensitivity
assessments typically employ a variety of standardized thresholds, categories and ranks
(MarLIN, 2017) including:
1. standard categories of human activities and natural events, and their resultant ‘pressures’
on the environment;
2. descriptors of the nature of the pressure (i.e., type of pressure, e.g., temperature change or
physical disturbance);
3. descriptors of the pressure (e.g. magnitude, extent, duration and frequency of the effect)
termed the pressure benchmark (or Impact Risk sensu Knights et al. 2015);
4. descriptors of resultant change/damage (intolerance/resistance) (i.e. proportion of species
population lost, area of habitat lost/damaged);
5. categories or ranks of recovery (recoverability/resilience) thought to be significant; and
6. resultant ranks of sensitivity and/or vulnerability.
Thresholds used to assess GES under the MSFD will facilitate an ‘acceptable’ level of
environmental degradation provided key ecosystem components and functions are maintained.
Prins et al. (2014) and Borja et al. (2014) state that one of the key issues when evaluating GES
will be choosing the appropriate spatial scale for the assessment of multiple criteria and
indicators. They state that assessments need to be done at spatial scales that are ecologically
relevant, to provide information on the environmental status which is relevant to ecosystem-
based management. The assessments have to support management of human activities and
pressures in the marine environment, in order to achieve GES in line with the ecosystem-based
approach. They also state that from a management perspective, the definition of spatial scales
can be linked to the risk-based approach which should assess the link between Pressure-State-
Indicator criteria/indicators. From this perspective, issues like the spatial scale of pressures and
impacts, the impacts of one single pressure on various indicators/descriptors, the cumulative
MERCES – D1.2. Activities and Pressures in Marine Habitats 85
impacts of pressures, trans-boundary problems and time scales of impacts need to be considered.
While, the MSFD requires that GES is determined at the level of European marine region or sub-
region, Prins et al. (2014) recommend that a further system of nested spatial scales is required to
reconcile the large number of assessment scales required for each specific assessment while
maintaining an acceptable monitoring and reporting effort.
The MSP Directive requires setting boundaries for areas managed by spatial plans. Knowledge
of the footprint of human activities (e.g. in the form of pressure maps, cf. Andersen et al., 2013)
is required both for GES assessments and to facilitate area-based management. Combining
pressure maps with maps assessing ecosystem services (see above), can provide useful
information to managers required to implement maritime spatial planning adopting an ecosystem
approach. Maritime spatial planning can also facilitate restoration initiatives by providing an
appropriate zoning mechanism. Obviously to succeed, all impacting activities should cease in the
area chosen for habitat restoration. Maritime spatial planning can be used to identify locations
for potential restoration within a managed area that will allow continued economic activity while
ensuring GES and thus sustainable ‘Blue Growth’. Indeed, restoration areas may well be one of
the tools in the ‘toolkit’ of managers tasked with maritime spatial planning.
Other potential tools that can be used in a maritime spatial planning context are biodiversity
offsetting and habitat banking to ensure no net loss of biodiversity (see points 1, 2 and 3 in Box
1) from planned marine developments. A recent feasibility study in the UK (Cook and Clay,
2013) attempted to identify potential biodiversity offsetting and habitat banking options for use
in UK waters. Biodiversity offsetting and habitat banking could potentially provide mitigation or
compensation measures for impacts on Natura 2000 sites. The mitigation or compensation could
be located in a different location to the impact and would be considered an ‘offsite mitigation’.
Biodiversity offsetting and habitat banking options considered by Cook and Clay (loc cit.) fall
under the following categories (adapted from Eftec, 2013) of: Restoration, Creation, Averted
risk, Preservation and Research. Restoration is considered as the manipulation of the physical,
chemical, or biological characteristics of a degraded site, with the goal of enhancing natural
functions or species communities in an existing habitat. While the authors concluded that
offsetting was a viable proposition, they drew attention to the considerable uncertainty regarding
the financial viability of marine biodiversity offsetting; in particular whether the cost of creating
and/or managing an offset scheme would be prohibitive with respect to the ability of developers
to fund the scheme or to purchase credits. They also drew attention to the need to manage or
exclude fisheries if any of the offsetting options were to be successful.
86 MERCES – D1.1. Marine habitats and degraded habitats
While EU directives have created a second driver in MSP to identify areas of high biological
value (Olsen et al., 2014), a possible criticism of the MSP Directive is that while it should
contribute to the EU Marine Biodiversty Strategy, it does not explicitly mention the need to
conserve natural capital. A stronger integration of the natural capital ‘mindset’, would ensure a
more holistic understanding of the environmental trade-offs of human activity and better inform
strategic business and investment decisions, for example, by factoring in the need to take
measures to mitigate/adapt to climate change.
The concept of Natural Capital (see point 4 in Box 1) has gained currency in recent years as a
means to highlight the finite nature of our planet’s living resources and how ecosystem goods
and services make life possible on the planet. In the past, natural capital has been considered a
‘free’ commodity but increasingly economists and scientists are calling for politicians and the
public to recognise nature's value to the economy. Integrating these values into national
accounting systems can therefore help us manage our scarce and dwindling natural capital
(Constanza and Daly, 1992; Aronson et al., 2007; Blignaut et al., 2014).
A rapidly-evolving method for properly recognising the value of nature is 'natural capital
accounting'. This involves attributing a measurable value to our natural capital in monetary terms
(such as euros or dollars) and/or in ecological terms (such as the number of species in an area).
Natural capital accounting is something that all EU member States have to do by 2020, through
the Mapping and Assessment of Ecosystem Services project (MAES, 2013). Increasingly, big
business is beginning to adopt Corporate Natural Capital Accounting methods as a means to
integrate financial values for carbon sequestration and recreation, and non-financial values for
biodiversity, into a natural capital asset index and in their financial reports (cf. Greenhouse Gas
Protocol, 2001; Eftec, 2015). Habitat restoration as part of biodiversity offsetting and habitat
banking initiatives can help business ‘grow’ their natural capital assets. The recently developed
Natural Capital Protocol (Natural Capital Coalition, 2016) is a framework designed to help
generate trusted, credible, and actionable information that business managers need to inform
decisions. It aims to support better decisions by including how we interact with nature, or more
specifically natural capital, in decision making.

MERCES – D1.2. Activities and Pressures in Marine Habitats 87
Box 1. Natural capital and loss mitigation tools
1: Biodiversity offsets can be defined as “measurable conservation outcomes resulting from actions designed to compensate for significant residual adverse biodiversity impacts arising from project development after appropriate mitigation measures have been taken” (BBOP, 2013). They are distinguished from other forms of ecological compensation by the requirement for measurable outcomes. 2: No net biodiversity loss lies at the heart of biodiversity offsetting. No net loss, in essence, refers to the point where biodiversity gains from targeted conservation activities match the losses of biodiversity due to the impacts of a specific development project, so that there is no net reduction overall in the type, amount and condition (or quality) of biodiversity over space and time. A net gain means that biodiversity gains exceed a specific set of losses (BBOP, 2012).
3: Habitat banking provides a route through which those seeking to offset residual impacts on biodiversity can finance offsetting activities. This is achieved by the creation of a market in which developers can purchase biodiversity credits. The term habitat bank can also be used in reference to private or publicly owned land managed for its biodiversity value or to the delivering body, which brokers arrangements between developers seeking biodiversity credits and the land owners/managers which provide them).
4: Natural capital is a concept that unites the economy and the environment as allies for a sustainable future. It comprises the world's stocks of physical and biological resources, including air, water, minerals, soils, fossil fuels and biodiversity. Natural capital is an economic metaphor for the limited stocks of physical and biological natural elements found on Earth, some of which are of direct use to society (then called resources) and some of which are not. According to Rees (1995, 1996) and the Millennium Ecosystem Assessment (2005), there are four, partially overlapping types: renewable (living species and ecosystems), non-renewable (subsoil assets, e.g. petroleum, coal, and diamonds), replenishable (e.g. the atmosphere, potable water, and fertile soils) and cultivated (e.g., heritage lines of crop plants and livestock, and traditional agricultural knowledge).

88 MERCES – D1.1. Marine habitats and degraded habitats
5.4.3. Restoration and Blue Growth Opportunities
The restoration of degraded marine ecosystems can often be seen as a cost in business planning,
but recently greater awareness by businesses of ecosystem services has led new business
opportunities from restoration activities. By working methodically through a mitigation
hierarchy businesses are first trying to avoid pressures, then devising civil and ecological
engineering solutions to minimise adverse impacts. Where substantial impacts are inevitable,
businesses are then taking direct actions to restore degraded portions of marine environments,
using creative and cost-effective solutions that are of direct benefit to the environment, the
reputation of industries and a business’s the bottom line. Examples of restoration actions
(described below) might be seen for instance, in 1) ‘Building with Nature’ in coastal
management, such as for flood defence, 2) carbon sequestration by salt marshes, seagrass beds
and mangroves (and the sediments they accrete) as an element in new carbon trading initiatives,
and 3) experimenting with restoration measure by oceans mining companies as part of their
Corporate Social Responsibility.
Short term planning in the coastal zone can often lead to unsustainable economic activities that
have unintended consequences on local populations, such as the clearing of mangroves for
aquaculture. Within the last 50 years, clearing of mangroves for shrimp culture has contributed
to 38% of global mangrove loss, with other aquaculture accounting for another 14% (Barbier and
Cox, 2004; Polidoro et al., 2010). Shrimp farms can become polluted with wastes, fertilizers and
antibiotics (e.g. Thuy et al., 2011). The coasts in some cases, such as in the Asia-Pacific region,
have become prone to erosion which in turn exposes coastal communities to increased risk from
flooding and storm surges (DasGupta and Shaw, 2017). Longer-term planning is now evident
recognising the value of a wider array of ecosystem services such as coastal protection and
carbon sequestration. This requires the accurate mapping and quantification of habitats and
pressures. There are business opportunities for knowledge-based companies and consultancies to
assess all ecosystem services and their benefits, plan for sustainable coastal development and,
where ecosystems have been degraded, invent simple and cost-effective engineering solutions to
kick start and speed up natural recolonisation processes. Coastal engineers are now ‘Building
with Nature’ to provide sustainable coastal management practices. In European waters this
includes using salt marshes as natural coastal defence reducing wave erosion, binding pollutants,
sequestering carbon and providing nursery grounds for fish.
Recently, the importance of salt marsh, seagrass and mangrove ecosystems in sequestering
significant amounts of carbon from the atmosphere and the ocean has been recognised (e.g.
MERCES – D1.2. Activities and Pressures in Marine Habitats 89
McLeod et al., 2011; Röhr et al., 2016). Restoring marine environments is now good business in
mitigating climate change. For instance, although seagrasses account for less than 0.1% of sea
areas, they account for approximately 10-18% of total oceanic carbon burial (Fourqurean et al.,
2012; Greiner et al., 2013). The sediments associated with mangroves, tidal marshes, and
seagrass meadows capture and store between 50 and 99% of the carbon in these systems, storing
the carbon for exceptionally long times (http://thebluecarboninitiative.org/blue-
carbon/#mitigation, Duarte et al., 2005). Key to assessing the value of restoring salt marshes,
seagrasses (Greiner et al., 2013) and mangroves for carbon sequestration is accurate mapping of
habitats and pressures worldwide, including the large-scale losses that have occurred in recent
times. Knowledge-based SMEs have the capacity to advise on the role of marine ecosystem
restoration for future carbon markets and carbon trading to address climate actions and
sustainable development.
The growing need for ‘technology metals’ in electrical and communication goods upon which
we all depend is driving greater activity in the exploration of minerals in the deep ocean (SPC,
2013). The seabed of the equatorial eastern Pacific Ocean between Hawaii and Central America
alone has some 21 billion tons of polymetallic nodules lying on the surface of the abyssal seabed
sediment (http://worldoceanreview.com/en/wor-3-overview/mineral-resources/manganese-
nodules/). In addition, exploration is occurring on mid ocean ridges and in back-arc basins on
deposits associated with hydrothermal activity and many seamounts (undersea mountains) are
coated in a layer of cobalt rich crust up to 25 cm thick, especially in the western equatorial
Pacific Ocean (https://www.isa.org.jm/sites/default/files/files/documents/ia6_eng6.pdf). While
engineering solutions are being devised to minimise impacts, such as sediment compaction and
the effects of near-bed plumes, large-scale impacts from mining are still inevitable. In addition, it
is known that deep-sea ecosystems will take a long time to recover owing to long generation
times (Thiel, 2003). There is therefore growing interest in what restoration measures might be
undertaken to speed up natural recolonisation processes. It is likely that in order to obtain ‘a
social licence’ to operate businesses will have to develop novel restoration solutions for the
different ecosystems that might be impacted by mining. Mapping and modelling of species
distributions and ocean habitats, and the scale, intensity and duration of mining impacts, are
required in order to determine what proportion of the seabed can be disturbed, and over what
time, without affecting natural ecosystem services and values.
90 MERCES – D1.1. Marine habitats and degraded habitats
6. References
Abelson A, Nelson PA, Edgar GJ, Shashar N, Reed DC, Belmaker J, Krause G, Beck MW, Brokovich E, France R, Gaines SD (2016) Expanding marine protected areas to include degraded coral reefs. Conservation Biology 30:1182–1191
Amaro T, de Stigter H, Lavaleye M, Duineveld G (2015) Organic matter enrichment in the Whittard Channel (northern Bay of Biscay margin, NE Atlantic); its origin and possible effects on benthic megafauna. Deep-Sea Research Part I 102:90–100
Andersen JH, Stock A (eds), Mannerla M, Heinanen S, Vinthe, M (2013) Human uses, pressures and impacts in the eastern North Sea. Aarhus University, DCE – Danish Centre for Environment and Energy, Technical Report from DCE – Danish Centre for Environment and Energy, No 18
Anonymous (2015) Ontwerp Beleidsnota Noordzee 2016-2021
Armstrong CW, Foley N, Tinch R, van den Hove S (2010) Ecosystem goods and services of the deep sea. Deliverable D62 HERMIONE Project
Armstrong CW, Foley N, Tinch R, van den Hove S (2012) Services from the deep: steps towards valuation of deep sea goods and services. Ecosystem Services 2:2–13
Armstrong CW, Foley NS, Kahui V, Grehan A (2014) Cold water coral reef management from an ecosystem service perspective. Marine Policy 50:126–134
Aronson J, Milton SJ, Blignaut J (eds) ( 2007) Restoring natural capital: science, business and practice. Island Press, Washington DC
Ballesteros E (2006) Mediterranean coralligenous assemblages: a synthesis of present knowledge. Oceanography and Marine Biology - An Annual Review 44:123–195
Barbier EB, Cox M (2004) Introduction: global mangrove loss and economic development. In: Barbier EB, Sathirathai S (eds) Shrimp Farming and Mangrove Loss in Thailand. Edward Elgar Publishing, Cheltenham, p 1-22
Barbier EB, Hacker SD, Kennedy C, Koch EW, Stier AC, Silliman BR (2011) The value of estuarine and coastal ecosystem services. Ecological Monographs 81:169–193
Bayraktarov E, Saunders MI, Abdullah S, Mills M, Beher J, Possingham HP, Mumby PJ, Lovelock CE (2016) The cost and feasibility of marine coastal restoration. Ecological Applications 26:1055–1074
BBOP - Business and Biodiversity Offsets Programme (2012) Resource Paper: No net loss and loss- gain calculations in biodiversity offsets. BBOP, Washington DC, Forest Trends
BBOP - Business and Biodiversity Offsets Programme (2013) To no net loss and beyond: an overview of the Business and Biodiversity Offsets Programme (BBOP). BBOP, Washington DC, Forest Trends
Beaulieu S, Joyce K, Cook J, Soule SA (2015) Woods Hole Oceanographic Institution
Bekkby T, Gerovasileiou V, Papadopoulou K-N, Sevastou K, Dailianis T, Fiorentino D, McOwen C, Smith CJ, Amaro T, Bakran-Petricioli T, Bilan M, Boström C, Carreiro-Silva M, Carugati L, Cebrian E, Cerrano C, Christie H, Danovaro R, Eronat EGT, Fraschetti S, Gagnon K, Gambi C, Grehan A, Hereu B, Kipson S, Kizilkaya I, van de Koppel J, Kotta J, Linares C, Milanese M, Morato T, Ojaveer H, Orav-Kotta H, Rinde E, Sarà A, Scharfe M Srimgeour R (2017) State of the knowledge on European marine habitat mapping and degraded habitats. Deliverable 1.1, MERCES Project, p 137
Bekkby T, Moy FE (2011) Developing spatial models of sugar kelp (Saccharina latissima) potential distribution under natural conditions and areas of its disappearance in Skagerrak. Estuarine, Coastal and Shelf Science 95:477–483
Bekkby T, Rinde E, Gundersen H, Norderhaug KM, Gitmark J, Christie H (2014) Length, strength and water flow - the relative importance of wave and current exposure on kelp Laminaria hyperborea morphology. Marine Ecology Progress Series 506:61–70
Benedetti-Cecchi L, Cinelli F (1992a) Canopy removal experiments in Cystoseira dominated rockpools from the Western coast of the Mediterranean (Ligurian Sea). Journal of Experimental Marine Biology and Ecology 155:69–83
MERCES – D1.2. Activities and Pressures in Marine Habitats 91
Benedetti-Cecchi L, Cinelli F (1992b) Effects of canopy cover, herbivores and substratum type on patterns of Cystoseira spp settlement and recruitment in littoral rockpools. Marine Ecology Progress Series 90:183–191
Benedetti-Cecchi L, Pannacciulli F, Bulleri F, Moschella PS, Airoldi L, Relini G, Cinelli F (2001) Predicting the consequences of anthropogenic disturbance: large-scale effect of loss of canopy algae on rocky shores. Marine Ecology Progress Series 214:137–150
Benedetti-Cecchi L, Tamburello L, Maggi E, Bulleri F (2015) Experimental perturbations modify the performance of early warning indicators of regime shift. Current Biology 25:1867–1872
Benn AR,Weaver PP, Billet DSM, van den Hove S, Murdock AP, Doneghan GB, Le Bas T (2010) Human activities on the deep seafloor in the North East Atlantic: an assessment of spatial extent. PLoS ONE 5 (9): e12730, https://doi.org/10.1371/journal.pone.0012730
Bermejo R, de la Fuente G, Ramírez-Romero E, Vergara JJ, Hernández I (2016) Spatial variability and response to anthropogenic pressures of assemblages dominated by a habitat forming seaweed sensitive to pollution (northern coast of Alboran Sea). Marine Pollution Bulletin 105:255–64
Blignaut JN, Aronson J, de Groot RS (2014) Restoration of natural capital: a key strategy on the path to sustainability. Ecological Engineering 65:54–61
Borja A, Elliott M, Andersen JH, Berg T, Carstensen J, Halpern BS, Heiskanen A-S, Korpinen S, Lowndes JSS, Martin G, Rodriguez-Ezpeleta N (2016) Overview of integrative assessment of marine systems: the Ecosystem Approach in practice. Frontiers in Marine Science 3(20), https://doi.org/10.3389/fmars.2016.00020
Borja A, Galparsoro I, Solaun O, Muxika I, Tello EM, Uriarte A, Valencia V (2006) The European Water Framework Directive and the DPSIR, a methodological approach to assess the risk of failing to achieve good ecological status. Estuarine Coastal and Shelf Science 66:88–96
Borja A, Prins T, Simboura N, Andersen JA, Berg T, Marques JC, Neto JM, Papadopoulou N, Reker J, Teixeira H, Uusitalo L (2014) Tales from a thousand and one ways to integrate marine ecosystem components when assessing the environmental status. Frontiers in Marine Science 1(72), https://doi.org/10.3389/fmars.2014.00072
Boyes SJ, Elliott M, Murillas-Maza A, Papadopoulou N, Uyarra MC (2016) Is existing legislation fit-for-purpose to achieve Good Environmental Status in European seas? Marine Pollution Bulletin 137:105–119
Braga-Henriques A, Porteiro FM, Ribeiro PA, De Matos V, Sampaio Í, Ocaña O, Santos RS (2013) Diversity, distribution and spatial structure of the cold-water coral fauna of the Azores (NE Atlantic). Biogeosciences 10:4009–4036, doi:10.5194/bg-10-4009-2013
Buhl-Mortensen L, Vanreusel A, Gooday AJ, Levin LA, Priede IG, Buhl-Mortensen P, Gheerardyn H, King NJ, Raes M (2010) Biological structures as a source of habitat heterogeneity and biodiversity on the deep ocean margins. Marine Ecology 31:21–50
Campagne CS, Salles J-M, Boissery P, Deter J (2015) The seagrass Posidonia oceanica: ecosystem services identification and economic evaluation of goods and benefits. Marine Pollution Bulletin 97:391–400
Canals M, Danovaro R, Heussner S, Lykousis V, Puig P, Trincardi F, Calafat A, Durrieu de Madron X, Palanques A (2009) Cascades in Mediterranean submarine grand canyons. Oceanography 22:26–43
Canals M, Puig P, de Madron XD, Heussner S, Palanques A, Fabres J (2006) Flushing submarine canyons. Nature 444:354–357
Carreiro-Silva M, Andrews AH, Braga-Henriques A, De Matos V, Porteiro FM, Santos RS (2013) Variability in growth rates of long-lived black coral Leiopathes sp from the Azores. Marine Ecology Progress Series 473:189–199
Cheminée A, Sala E, Pastor J, Bodilis P, Thireiet P, Mangialajo L, Cottalorda JM, Francour P (2013) Nursery value of Cystoseira forests for Mediterranean rocky reef fishes. Journal of Experimental Marine Biology and Ecology 442:70–79
Christie H, Norderhaug KM, Fredriksen S (2009) Macrophytes as habitat for fauna. Marine Ecology Progress Series 396:221–233
Clark MR, Rowden AA, Schlacher T, Williams A, Consalvey M, Stocks KI, Rogers AD, O’Hara TD, White M, Shank TM, Hall-Spencer JM (2010) The ecology of seamounts: structure, function, and human impacts. Annual Review of Marine Science 2:253–278
92 MERCES – D1.1. Marine habitats and degraded habitats
Clewell AF, Aronson J (2013) Ecological restoration: principles, values, and structures of an emerging profession. 2nd Edition. Island Press, Washington DC
Coll M, Piroddi C, Albouy C, Lasram FBR, Cheung WWL, Christensen V, Karpouzi VS, Guilhauman F, Mouillot D, Paleczny C, Palomares ML, Steenbeek J, Trujillo P, Watson R, Pauly D (2012) The Mediterranean Sea under siege: spatial overlap between marine biodiversity, cumulative threats and marine reserves. Global Ecology and Biogeography 21:465–480
COM (2011) Communication from the Commission to the European Parliament, the Council, the Economic and Social Committee and the Committee of the Regions "Our life insurance, our natural capital: an EU biodiversity strategy to 2020". COM(2011)244
COM (2012) Communication from the Commission to the European Parliament, the Council, the Economic and Social Committee and the Committee of the Regions "Blue growth: opportunities for marine and maritime sustainable growth". COM(2012)494
COM (2015) Report of the Commission to the Council and the European Parliament “The state of nature in the European Union: report on the status of and trends for habitat types and species covered by the Birds and Habitats Directives for the 2007-2012 period as required under Article 17 of the Habitats Directive and Article 12 of the Birds Directive”. COM(2015)219
Cook D, Clay N (2013) Marine biodiversity offsetting and habitat banking feasibility study. The Crown Estate
Costanza R, Daly HE (1992) Natural capital and sustainable development. Conservation Biology 6:37–46
Cullen-Unsworth L, Unsworth R (2013) Seagrass meadows, ecosystem services, and sustainability. Environment: Science and Policy for Sustainable Development 55:14–28
Danovaro R, Gambi C, Dell’Anno A, Corinaldesi C, Fraschetti S, Vanreusel A, Vincx M, Gooday AJ (2008b) Exponential decline of deep-sea ecosystem functioning linked to benthic biodiversity loss. Current Biology 18:1–8
Danovaro R, Gambi C, Lampadariou N, Tselepides A (2008a) Deep-sea biodiversity in the Mediterranean Basin: testing for longitudinal, bathymetric and energetic gradients. Ecography 31:231–244
Danovaro R, Snelgrove PVR, Tyler P (2014) Challenging the paradigms of deep-sea ecology. Trends in Ecology & Evolution 29:465–475
DasGupta R, Shaw R (2017) Mangroves in Asia-Pacific: a review of threats and responses. In: DasGupta R, Shaw R (eds) Participatory Mangrove Management in a Changing Climate. Springer, p 1-16
Davies CE, Moss D, Hill MO (2004) EUNIS habitat classification revised 2004. Report to European Environmental Agency and European Topic Centre on Nature Protection and Biodiversity
De Groot RS, Blignaut J, van der Ploeg S, Aronson J, Elmqvist T, Farley J (2013) Benefits of investing in ecosystem restoration. Conservation Biology 27:1286–1293.
De Leo FC, Vetter EW, Smith CR, Rowden AA, McGranaghan M (2014) Spatial scale-dependent habitat heterogeneity influences submarine canyon macrofaunal abundance and diversity off the Main and Northwest Hawaiian Islands. Deep-Sea Research Part II 104:267–290
DEFRA (2005) Charting progress: an integrated assessment of the state of UK seas. DEFRA, London, http://wwwmcciporguk/media/1405/charting-progresspdf
DEFRA (2010) Charting progress 2: an assessment of the state of UK seas. DEFRA, London, http://catalogipbesnet/system/assessment/180/references/files/482/original/CP2-Full_reportpdf?1363944877)
Diekmann R, Nellen W, Piatkowski U (2006) A multivariate analysis of larval fish and paralarval cephalopod assemblages at Great Meteor Seamount. Deep-Sea Research Part I 53:1635–1657
Dower J F, Mackas DL (1996) Seamount effects in the zooplankton community near Cobb Seamount. Deep-Sea Research Part I 43:837–858
Duarte CM, Middelburg JJ, Caraco N (2005) Major role of marine vegetation on the oceanic carbon cycle. Biogeosciences 2:1–8, doi:10.5194/bg-2-1-2005
Eastwood PD, Mills CM, Aldridge JN, Houghton CA, Rogers SI (2007) Human activities in UK offshore waters: an assessment of direct, physical pressure on the seabed. ICES Journal of Marine Science 64:453–463
MERCES – D1.2. Activities and Pressures in Marine Habitats 93
EC (1999) Towards Environmental Pressure Indicators for the EU. 1st Edn. Luxembourg: Office for Official Publications of the European Communities
EC (2008) Directive 2008/56/EC of the European Parliament and of the Council of 17 June 2008 establishing a framework for community action in the field of marine environment policy (Marine Strategy Framework Directive). Official Journal of the European Union 164:19–40
EC (2009) Directive 2009/147/EC of the European Parliament and of the Council of 30 November 2009 on the conservation of wild bird. Official Journal of the European Union 20:7–25
EC (2014) Directive 2014/89/EU of the European parliament and of the council of 23 July 2014 establishing a framework for maritime spatial planning. Official Journal of the European Union 257:135–145
EEA (2015) State of Europe’s seas. European Environment Agency, Luxembourg
EEC (1992) Directive 92/43/EEC of 21 May 1992 on the conservation of natural habitats and of wild fauna and flora. Official Journal of the European Union 206:7–50
Eftec - Economics for the Environment Consultancy Ltd (2013) Marine Biodiversity Offsetting – UK scoping study, available at: http://wwwthecrownestatecouk/media/397708/marine-biodiversity-offsetting-uk- scoping-studypdf
Eftec - Economics for the Environment Consultancy Ltd (2015) Developing corporate natural capital accounts - Final Report for the Natural Capital Committee, UK, p 1–80, available at: https://www.cbd.int/financial/values/uk-corporatenatural.pdf
Eigaard OR, Bastardie F, Hintzen NT, Buhl-Mortensen L, Buhl-Mortensen P, Catarino R, Dinesen GE, Egekvist J, Fock HO, Geitner K, Gerritsen HD, Marín González M, Jonsson P, Kavadas S, Laffargue P, Lundy M, Gonzalez-Mirelis G, Nielsen JR, Papadopoulou N, Posen PE, Pulcinella J, Russo T, Sala A, Silva C, Smith CJ, Vanelslander B, Rijnsdorp AD (2016) The footprint of bottom trawling in European waters: distribution, intensity, and seabed integrity. ICES Journal of Marine Science 74:847–86
EIONET (2017) Reporting under Article 17 of the Habitats Directive (period 2007-2012). Introduction to assessment of conservation status of habitats and species of Community interest. European Topic Centre on Biological Diversty, http://ec.europa.eu/environment/nature/knowledge/rep_habitats/index_en.htm
Elliott M (2011) Marine science and management means tackling exogenic unmanaged pressures and endogenic managed pressures - a numbered guide. Marine Pollution Bulletin 62:651–655
Elliott M (2014) Integrated marine science and management: wading through the morass. Marine Pollution Bulletin 86:1–4
Elliott M, Burdon D, Hemingway KL, Apitz SE (2007) Estuarine, coastal and marine ecosystem restoration: confusing management and science - A revision of concepts. Estuarine, Coastal and Shelf Science 74:349–366
Eno NC, Frid CLJ, Hall K, Ramsay K, Sharp RAM, Brazier DP, Hearn S, Dernie KM, Robinson KA, Paramor OAL, Robinson LA (2013) Assessing the sensitivity of habitats to fishing: from seabed maps to sensitivity maps. Journal of Fish Biology 83:826–846
Epping E, van der Zee C, Soetaert K, Helder W (2002) On the oxidation and burial of organic carbon in sediments of the Iberian margin and Nazaré Canyon (NE Atlantic). Progress in Oceanography 52:399–431
Fagerli CW, Norderhaug KM, Christie H (2013) Lack of sea urchin settlement may explain kelp forest recovery in overgrazed areas in Norway. Marine Ecology Progress Series 488:119–132
Fagerli CW, Norderhaug KM, Christie H, Pedersen MF, Fredriksen S (2014) Predators of the destructive sea urchin Strongylocentrotus droebachiensis on the Norwegian coast. Marine Ecology Progress Series 502:207–218
Fernandez-Arcaya U, Ramirez-Llodra E, Aguzzi J, Allcock AL, Davies JS, Dissanayake A, Harris P, Howell K, Huvenne VAI, Macmillan-Lawler M, Martín J, Menot L, Nizinski M, Puig P, Rowden AA, Sanchez F, van den Beld IMJ (2017) Ecological role of submarine canyons and need for canyon conservation: a review. Frontiers in Marine Science 4(5), https://doi.org/10.3389/fmars.2017.00005
Fourqurean JW, Duarte CM, Kennedy H, Marba N, Holmer M, Mateo MA, Apostolaki ET, Kendrick GA, Krause-Jensen D, McGlathery KJ, Serrano O (2012) Seagrass ecosystems as a globally significant carbon stock. Nature Geoscience 5:505–509
Fraschetti S, Terlizzi A, Boero F (2008) How many habitats are there in the sea (and where)? Journal of Experimental Marine Biology and Ecology 366:109–115

94 MERCES – D1.1. Marine habitats and degraded habitats
Freiwald AJH, Fosså SJH, Grehan A, Koslow A, Roberts JM (2004) Cold-water coral reefs: out of sight – no longer out of mind. UNEP-WCMC, Cambridge
Galparsoro I, Borja A, Uyarra MC (2014) Mapping ecosystem services provided by benthic habitats in the European North Atlantic Ocean. Frontiers in Marine Science 1(23), https://doi.org/10.3389/fmars.2014.00023
Galparsoro I, Connor DW, Borja A, Aish A, Amorim P, Bajjouk T, Chambers C, Coggan R, Dirberg G, Ellwood H, Evans D, Goodin KL, Grehan A, Haldin J, Howell K, Jenkins C, Michez N, Mon G, Buhl-Mortensen P, Pearce B, Populus J, Salomidi M, Sánchez F, Serrano A, Shumchenia E, Tempera F, Vasquez M (2012) Using EUNIS habitat classification for benthic mapping in European seas: present concerns and future needs. Marine Pollution Bulletin 64:2630–2638
Gambi C, Danovaro R (2016) Biodiversity and life strategies of deep-sea meiofauna and nematode assemblages in the Whittard Canyon (Celtic margin, NE Atlantic Ocean). Deep-Sea Research Part I 108:13–22
Garrabou J, Ballesteros E (2000) Growth of Mesophyllum alternans and Lithophyllum frondosum (Corallinales, Rhodophyta) in the northwestern Mediterranean. European Journal of Phycology 35:1–10
Garrabou J, Coma R, Benssousan N, Bally M, Chevaldonne P, Cigliano M, Diaz D, Harmelin J-G, Gambi M-C, Kersting DK, Ledoux J-B, Lejeusne C, Linares C, Marschal C, Pérez T, Ribes M, Romano JC, Serrano E, Teixidó N, Torrents O, Zabala M, Zuberer F, Cerrano C (2009) Mass mortality in Northwestern Mediterranean rocky benthic communities: effects of the 2003 heat wave. Global Change Biology 15:1090–1103
Gatti G, Bianchi CN, Parravicini V, Rovere A, Peirano A, Montefalcone M, Massa F, Morri C (2015) Ecological change, sliding baselines and the importance of historical data: lessons from combing observational and quantitative data on a temperate reef over 70 years. PLoS ONE 10 (2): e0118581, https://doi.org/10.1371/journal.pone.0118581
Giakoumi S, Halpern BS, Michel LN, Gobert S, Sini M, Boudouresque C-F, Gambi M-C, Katsanevakis S, Lejeune P, Montefalcone M, Pergent G, Pergent-Martini C, Sanchez-Jerez P, Velimirov B, Vizzini S, Abadie A, Coll M, Guidetti P, Micheli F, Possingham HP (2015) Towards a framework for assessment and management of cumulative human impacts on marine food webs. Conservation Biology 29:1228–1234
Giakoumi S, Sini M, Gerovasileiou V, Mazor T, Beher J, Possingham H, Abdulla A, Cinar ME, Dendrinos P, Gucu AC, Karamanlidis A, Rodic P, Panayotidis P, Taskin E, Jaklin A, Voultsiadou E, Webster C, Zenetos A, Katsanevakis S (2013) Ecoregion-based conservation planning in the Mediterranean: dealing with large-scale heterogeneity. PLoS ONE 8 (10): e76449, https://doi.org/10.1371/journal.pone.0076449
Gianni F, Bartolini F, Airoldi L, Ballesteros E, Francour P, Meinesz A, Thibaut T, Mangialajo L (2013) Conservation and restoration of marine forests in the Mediterranean Sea and the potential role of Marine Protected Areas. Advances in Oceanography and Limnology 4:83–101
Goodsir F, Bloomfield HJ, Judd AD, Kral F, Robinson LA, Knights AM (2015) A spatially-resolved pressure-based approach for the identification and management of combined effects arising from multiple human activities. ICES Journal of Marine Science 72:2245–2256
Grech A, Chartrand-Miller K, Erftemeijer P, Fonseca M, McKenzie L, Rasheed M, Taylor H, Coles R (2012) A comparison of threats, vulnerabilities and management approaches in global seagrass bioregions. Environmental Research Letters 7:024006, doi:101088/1748-9326/7/2/024006
Greenhouse Gas Protocol (2001) A Corporate Accounting and Reporting Standard (Corporate Standard), http://www.ghgprotocol.org/about-ghgp
Greiner JT, McGlathery KJ, Gunnell J, McKee BA (2013) Seagrass restoration enhances “Blue Carbon” Sequestration in coastal waters. PLoS ONE 8(8): e72469, https://doi.org/10.1371/journal.pone.0072469
Gubbay S, Sanders N, Haynes T, Janssen JAM, Rodwell JR, Nieto A, García Criado M, Beal S, Borg J, Kennedy M, Micu D, Otero M, Saunders G, Calix M (2016) European Red List of Habitats – Part 1. Marine habitats. European Commission
Gundersen H, Bryan T, Chen W, Moy FE, Sandman AN, Sundblad G, Schneider S, Andersen JH, Langaas S, Walday MG (2015) Ecosystem Services in the Coastal Zone of the Nordic Countries. TemaNord 2016:552
Halpern BS, Walbridge S, Selkoe KA, Kappel CV, Micheli F, D'Agrosa C, Bruno JF, Casey KS, Ebert C, Fox HE, Fujita R, Heinemann D, Lenihan HS, Madin EM, Perry MT, Selig ER, Spalding M, Steneck R, Watson R (2008) A global map of human impact on marine ecosystems. Science 319:948–52
MERCES – D1.2. Activities and Pressures in Marine Habitats 95
Harris PT, Whiteway T (2011) Global distribution of large submarine canyons: geomorphic differences between active and passive continental margins. Marine Geology 285:69–86
IMPRESS (2003) Analysis of pressures and impacts. Guidance document No3 - Common implementation strategy for the Water Framework Directive (2000/60/EC). IMPRESS Working Group 21. Office for Official Publication of the European Communities, Luxembourg
Judd AD, Backhaus T, Goodsir F (2015) An effective set of principles for practical implementation of marine cumulative effects assessment. Environmental Science and Policy 54:254–262
Kato Y, Fujinaga K, Nakamura K, Takaya, Y, Kitamura K, Ohta J, Toda R, Nakashima T, Iwamori H (2011) Deep-sea mud in the Pacific Ocean as a potential resource for rare-earth elements. Nature Geoscience 4:535–539
Knights AM, Koss RS, Robinson LA (2013) Identifying common pressure pathways from a complex network of human activities to support ecosystem-based management. Ecological Applications 23:755–765
Knights AM, Piet GJ, Jongbloed RH, Tamis JE, White L, Akoglu E, Boicenco L, Churilova T, Kryvenko O, Fleming-Lehtinen V, Leppanen J-M, Galil BS, Goodsir F, Goren M, Margonski P, Moncheva S, Oguz T, Papadopoulou K-N, Setälä O, Smith CJ, Stefanova K, Timofte F, Robinson LA (2015) An exposure-effect approach for evaluating ecosystem-wide risks from human activities. ICES Journal of Marine Science 72:1105–1115
Korpinen S, Andersen JH (2016) A global review of cumulative pressure and impact assessments in marine environments. Frontier in Marine Science 3(153), https://doi.org/10.3389/fmars.2016.00153
Korpinen S, Meidinger M, Laamanen M (2013) Cumulative impacts on seabed habitats: an indicator for assessments of good environmental status. Marine Pollution Bulletin 74:311-319
Kvile KØ, Taranto GH, Pitcher TJ, Morato T (2014) A global assessment of seamount ecosystems knowledge using an ecosystem evaluation framework. Biological Conservation 173:108–120
Lampitt RS, Billett DSM, Martin AP (2010) The sustained observatory over the Porcupine Abyssal Plain (PAP): insights from time series observations and process studies. Deep-Sea Research Part II 57:1267–1271
Leduc D, Rowden AA, Nodder SD, Berkenbusch K, Probert PK, Hadfield MG (2014) Unusually high food availability in Kaikoura Canyon linked to distinct deep-sea nematode community. Deep-Sea Research Part II 104:310–318
Levin LA, Mengerink K, Gjerde KM, Rowden AA, Van Dover CL, Clark MR, Ramirez-Llodra E, Currie B, Smith CR, Sato KN, Gallo N, Sweetman AK, Lily H, Armstrong CW, Brider J (2016) Defining serious harm to the marine environment in the context of deep-seabed mining. Marine Policy 74:245–59
Levin LA, Sibuet M (2012) Understanding continental margin biodiversity: a new imperative. Annual Review of Marine Science 4:79–112
Levin LA, Sibuet M, Gooday AJ, Smith CR, Vanreusel A (2010) The roles of habitat heterogeneity in generating and maintaining biodiversity on continental margins: an introduction. Marine Ecology 31:1–5
Ling SD, Johnson CR, Frusher SD, Ridgway KR (2009) Overfishing reduces resilience of kelp beds to climate-driven catastrophic phase shift. Proceedings of the National Academy of Sciences of the United States of America 106:22341–22345
MAES (2013) Mapping and assessment of ecosystems and their services - An analytical framework for ecosystem assessments under action 5 of the EU biodiversity strategy to 2020. Technical Report 067. Publications office of the European Union, Luxembourg
MAES (2014) Mapping and assessment of ecosystems and their services - Indicators for ecosystem assessments under Action 5 of the EU Biodiversity Strategy to 2020. Technical Report 080. Publications office of the European Union, Luxembourg
MarLIN (2017) Marine evidence based sensitivity assessment (MarESA). Marine Life and Information Network, http://www.marlin.ac.uk/species/sensitivity_rationale
Martin CS, Giannoulaki M, De Leo F, Scardi M, Salomidi M, Knittweis L, Pace ML, Garofalo G, Gristina M, Ballesteros E, Bavestrello G, Belluscio A, Cebrian E, Gerakaris V, Pergent G, Pergent-Martini C, Schembri PJ, Terribile K, Rizzo L, Souissi J Ben, Bonacorsi M, Guarnieri G, Krzelj M, Macic V, Punzo E, Valavanis V, Fraschetti S (2014) Coralligenous and maërl habitats: predictive modelling to identify their spatial distributions across the Mediterranean Sea. Scientific Reports 4:5073, doi:101038/srep05073
Masson DG, Huvenne VAI, de Stigter HC, Wolff GA, Kiriakoulakis K, Arzola RG, Blackbird S (2010) Efficient burial of carbon in a submarine canyon. Geology 38:831–834
96 MERCES – D1.1. Marine habitats and degraded habitats
Matsuoka T, Nakashima T, Nagasawa N (2005) A review of ghost fishing: scientific approaches to evaluation and solutions. Fisheries Science 71:691–702
McDonald T, Gann GD, Jonson J, Dixon KW (2016) International standards for the practice of ecological restoration – including principles and key concepts. Society for Ecological Restoration, Washington DC
Mcleod E, Chmura GL, Bouillon S, Salm R, Bjork M, Duarte CM (2011) A blueprint for blue carbon: toward an improved understanding of the role of vegetated coastal habitats in sequestering CO2. Frontiers in Ecology and the Environment 9:552–560
Med-IAMER (2014) Med-IAMER project: activities, outputs and results
Micheli F, Halpern BS, Walbridge S, Ciriaco S, Ferretti F, Fraschetti S, Lewison R, Nykjaer L, Rosenberg AA (2013) Cumulative human impacts on Mediterranean and Black Sea marine ecosystems: assessing current pressures and opportunities. PLoS ONE 8(12): e79889, https://doi.org/10.1371/journal.pone.0079889
Mienis F, van Weering T, de Haas H, de Stigter H, Huvenne VAI, Wheeler AJ (2006) Carbonate mound development at the SW Rockall Trough margin based on high resolution TOBI and seismic recording. Marine Geology 233:1–19
Milazzo M, Badalamenti F, Ceccherelli G, Chemello R (2004) Boat anchoring on Posidonia oceanica beds in a marine protected area (Italy, western Mediterranean): effect of anchor types in different anchoring stages. Journal of Experimental Marine Biology and Ecology 299:51–62
Millennium Ecosystem Assessment (2005) Ecosystems and human well-being: biodiversity synthesis. World Resources Institute, Washington DC
Morato T, Watson R, Pitcher TJ, Pauly D (2006) Fishing down the deep. Fish and Fisheries 7:24–34
Moy FE, Christie H (2012) Large-scale shift from sugar kelp (Saccharina latissima) to ephemeral algae along the south and west coast of Norway. Marine Biology Research 8:357–369
Natural Capital Coalition (2016) Natural Capital Protocol, www.naturalcapitalcoalition.org/protocol
Norderhaug KM, Christie H (2009) Sea urchin grazing and kelp re-vegetation in the NE Atlantic. Marine Biology Research 5:515–528
Norderhaug KM, Christie H, Fosså JH, Fredriksen S (2005) Fish-macrofauna interactions in a kelp (Laminaria hyperborea) forest. Journal of the Marine Biological Association UK 85:1279–1286
Norderhaug KM, Christie H, Rinde E, Gundersen H, Bekkby T (2014) Importance of wave and current exposure to fauna communities in Laminaria hyperborea kelp forests. Marine Ecology Progress Series 502:295–301
Nordlund LM, Koch EW, Barbier EB, Creed JC (2016) Seagrass ecosystem services and their variability across genera and geographical regions. PLoS ONE 11(10): e0163091, https://doi.org/10.1371/journal.pone.0163091
Olsen E, Fluharty D, Hoel AH, Hostens K, Maes F, Pecceu E (2014) Integration at the round table: marine spatial planning in multi-stakeholder settings. PLoS ONE 9(10): e109964, https://doi.org/10.1371/journal.pone.0109964
Orth RJ, Carruthers TJB, Dennison WC, Duarte CM, Fourqurean JW, Heck KLJ, Hughes AR, Kendrick GA, Kenworthy WJ, Olyarnik S, Short FT, Waycott M, Williams SL (2006) A global crisis for seagrass ecosystems. BioScience 56:987–996
OSPAR (2010) Quality Status Report. OSPAR Commission, London
Palanques A, Masqué P, Puig P, Sanchez-Cabeza JA, Frignani M, Alvisi F (2008) Anthropogenic trace metals in the sedimentary record of the Llobregat continental shelf and adjacent Foix Submarine Canyon (northwestern Mediterranean). Marine Geology 248:213–227
Patrício J, Elliott M, Mazik K, Papadopoulou K-N, Smith C (2016) DPSIR - two decades of trying to develop a unifying framework for marine environmental management? Frontiers in Marine Science 3(177), doi:103389/fmars201600177
Patrício J, Teixeira H, Borja A, Elliott M, Berg T, Papadopoulou N, Smith C, Luisetti T, Uusitalo L, Wilson C, Mazik K, Niquil N, Cochrane S, Andersen JH, Boyes S, Burdon D, Carugati L, Danovaro R, Hoepffner N (2014) DEVOTES recommendations for the implementation of the Marine Strategy Framework Directive. Deliverable 1.5 DEVOTES project. JRC92131
MERCES – D1.2. Activities and Pressures in Marine Habitats 97
Pham CK, Ramirez-Llodra E, Alt CHS, Amaro T, Bergmann M, Canals M, Company JB, Davies J, Duineveld G, Galgani F, Howell KL, Huvenne VAI, Isidro E, Jones DOB, Lastras G, Morato T, Gomes-Pereira JN, Purser A, Stewart H, Tojeira I, Tubau X, Van Rooij D, Tyler PA (2014) Marine litter distribution and density in European Seas, from the shelves to deep basins. PLoS ONE 9(4): e95839, https://doi.org/10.1371/journal.pone.0095839
Pham CK, Vandeperre F, Menezes G, Porteiro F, Isidro E, Morato T (2015) The importance of deep-sea vulnerable marine ecosystems for demersal fish in the Azores. Deep-Sea Research Part I 96:80–8
Piante C, Ody D (2015) Blue Growth in the Mediterranean Sea: the challenge of Good Environmental Status. MedTrends Project. WWF-France
Piazzi L, Gennaro P, Balata D (2012) Threats to macroalgal coralligenous assemblages in the Mediterranean Sea. Marine Pollution Bulletin 64:2623–2629
Piroddi C, Teixeira H, Lynam CP, Smith C, Alvarez MC, Mazik K, Andonegi E, Churilova T, Tedesco L, Chifflet M, Chust G, Galparsoro I, Garcia AC, Kämäri M, Kryvenko O, Lassalle G, Neville S, Niquil N, Papadopoulou N, Rossberg AG, Suslin V, Uyarra MC (2015) Using ecological models to assess ecosystem status in support of the European Marine Strategy Framework Directive. Ecological Indicators 58:175–191
Pitcher TJ (2010) BOX 8: Eight Major Target Species in World Seamount Fisheries. Oceanography 23:130–131
Polidoro BA, Carpenter KE, Collins L, Duke NC, Ellison AM, Ellison JC, Farnsworth EJ, Fernando ES, Kathiresan K, Koedam NE, Livingstone SR, Miyagi T, Moore GE, Ngoc Nam V, Ong JE, Primavera JH, Salmo SG, Sanciangco JC, Sukardjo S, Wang Y, Yong JWH (2010) The loss of species: mangrove extinction risk and geographic areas of global concern. PLoS ONE 5(4): e10095, https://doi.org/10.1371/journal.pone.0010095
Prins TC, Borja A, Simboura N, Tsangaris C, Van der Meulen MD, Boon AR, Menchaca I, Gilbert AJ (2014) Coherent geographic scales and aggregation rules for environmental status assessment within the Marine Strategy Framework Directive: towards a draft guidance. Deltares/AZTI/HCMR, Report 1207879-000-ZKS-0014 to the European Commission, Delft, p 56 + annexes
Puig P, Palanques A, Martín J (2014) Contemporary sediment-transport processes in submarine canyons. Annual Review of Marine Science 6:53–77
Pusceddu A, Bianchelli S, Canals M, Sanchez-Vidal A, Durrieu De Madron X, Heussner S, Lykousis V, de Stigter H, Trincardi F, Danovaro R (2010) Organic matter in sediments of canyons and open slopes of the Portuguese, Catalan, Southern Adriatic and Cretan Sea margins. Deep-Sea Research Part I 57:441–457
Pusceddu A, Bianchelli S, Martin J, Puig P, Palanques A, Masque P, Danovaro R (2014) Chronic and intensive bottom trawling impairs deep-sea biodiversity and ecosystem functioning. Proceedings of the National Academy of Sciences of the United States of America 111:8861–8866
Pusceddu A, Mea M, Canals M, Heussner S, Durrieu De Madron X, Sanchez-Vidal A, Bianchelli S, Corinaldesi C, Dell'Anno A, Thomsen L, Danovaro R (2013) Major consequences of an intense dense shelf water cascading event on deep-sea benthic trophic conditions and meiofaunal biodiversity. Biogeosciences 10:2659–2670, doi:10.5194/bg-10-2659-2013
Rakka M, Orejas C, Sampaio I, Monteiro J, Parra H, Carreiro-Silva M (2017) Reproductive biology of the black coral Antipathella wollastoni (Cnidaria: Antipatharia) in the Azores (NE Atlantic). Deep-Sea Research Part II in press
Ramalho SP, Adão H, Kiriakoulakis K, Wolff GA, Vanreusel A, Ingels J (2014) Temporal and spatial variation in the Nazaré Canyon (Western Iberian margin): inter-annual and canyon heterogeneity effects on meiofauna biomass and diversity. Deep-Sea Research Part I 83:102–114
Ramirez-Llodra E, Brandt A, Danovaro R, De Mol B, Escobar E, German CR, Levin LA, Martinez Arbizu P, Menot L, Buhl-Mortensen P, Narayanaswamy BE, Smith CR, Tittensor DP, Tyler PA, Vanreusel A, Vecchione M (2010) Deep, diverse and definitely different: unique attributes of the world’s largest ecosystem. Biogeosciences 7:2851–2899, doi:10.5194/bg-7-2851-2010
Ramirez-Llodra E, De Mol B, Company JB, Coll M, Sardà F (2013) Effects of natural and anthropogenic processes in the distribution of marine litter in the deep Mediterranean Sea. Progress in Oceanography 118:273–287
Ramirez-Llodra E, Tyler PA, Baker MC, Bergstad OA, Clark MR, Escobar E, Levin LA, Menot L, Rowden AA, Smith CR, Van Dover CL (2011) Man and the last great wilderness: human impact on the deep sea. PLoS ONE 6(7): e22588, https://doi.org/10.1371/journal.pone.0022588
Rees W (1995) Achieving sustainability: reform or transformation? Journal of Planning Literature 9:343–361
98 MERCES – D1.1. Marine habitats and degraded habitats
Rees W (1996) Revisiting carrying capacity: area-based indicators of sustainability. Population and Environment 17:195–215
Rex MA, Etter RJ (2010) Deep-sea biodiversity: pattern and scale. Harvard University Press
Rinde E, Christie H, Fagerli CW, Bekkby T, Gundersen H, Norderhaug KM, Hjermann DØ (2014) The influence of physical factors on kelp and sea urchin distribution in previously and still grazed areas in the NE Atlantic. PLoS ONE 9(6): e100222, https://doi.org/10.1371/journal.pone.0100222
Roark EB, Guilderson TP, Dunbar RB, Fallon SJ, Mucciarone DA (2009) Extreme longevity in proteinaceous deep-sea corals. Proceedings of the National Academy of Sciences 106:5204–5208
Roberts C, Smith C, Tillin H, Tyler-Walters H (2010) Review of existing approaches to evaluate marine habitat vulnerability to commercial fishing activities. Report to the Environment Agency from the Marine Life Information Network and ABP Marine Environmental Research Ltd. Environment Agency Evidence Report: SC080016/R3. Environment Agency, Peterborough, http://publications.environment-agency.gov.uk/PDF/SCHO1110BTEQ-E-E.pdf
Roberts JM, Wheeler A, Freiwald A, Cairns S (2009) Cold-Water Corals: the biology and geology of deep-sea coral habitats. Cambridge University Press, UK
Roberts JM, Wheeler AJ, Freiwald A (2006) Reefs of the deep: the biology and geology of cold-water coral ecosystems. Science 312:543–547
Robinson LA, Rogers S, Frid CLJ (2008) A marine assessment and monitoring framework for application by UKMMAS and OSPAR – Assessment of Pressures and Impacts Phase II: Application for Regional Assessments. (Contract No: C-08-0007-0027for the Joint Nature Conservation Committee). University of Liverpool, Liverpool and Centre for the Environment, Fisheries and Aquaculture Science, Lowestoft
Rogers AD, Brierley A, Croot P, Cunha MR, Danovaro R, Devey C, Hoel AH, Ruhl HA, Sarradin P-M, Trevisanut S, van den Hove S, Vieira H, Visbeck M (2015) Delving deeper: critical challenges for 21st century deep-sea research. Larkin KE, Donaldson K, McDonough N (eds) Position Paper 22 of the European Marine Board, Ostend
Röhr ME, Boström C, Canal-Vergès P, Holmer M (2016) Blue carbon stocks in Baltic Sea eelgrass (Zostera marina) meadows. Biogeosciences 13:6139–6153, doi:105194/bg-13-6139-2016
Scharin H, Ericsdotter S, Elliott M, Turner RK, Niiranen S, Blenckner T, Hyytiäinen K, Ahlvik L, Ahtiainen H, Artell J, Hasselström L, Söderqvist T, Rockström J (2016) Processes for the sustainable stewardship of marine environments. Ecological Economics 128:55–67
Schlining K, von Thun S, Kuhnz L, Schlining B, Lundsten L, Jacobsen Stout N, Chaney L, Connor J (2013) Debris in the deep: using a 22-year video annotation database to survey marine litter in Monterey Canyon, central California, USA. Deep-Sea Research Part I 79:96–105
Short FT, Neckles H (1999) The effects of global climate change on seagrasses. Aquatic Botany 63:169–196
Short FT, Wyllie-Echeverria S (1996) Natural and human-induced disturbance of seagrasses. Environmental Conservation 23:17–27
Smale DA, Burrows MT, Moore P, O’Connor N, Hawkins SJ (2013) Threats and knowledge gaps for ecosystem services provided by kelp forests: a northeast Atlantic perspective. Ecology and Evolution 3:4016–4038
Smith CJ, Papadopoulou K-N, Barnard S, Mazik K, Elliott M, Patrício J, Solaun O, Little S, Bhatia N, Borja A (2016) Managing the marine environment, conceptual models and assessment considerations for the European Marine Strategy Framework Directive. Frontiers in Marine Science 3(144), doi:103389/fmars201600144
SPC (2013) Deep sea minerals: Deep sea minerals and the green economy. Baker E, Beaudoin Y (eds) Vol. 2, Secretariat of the Pacific Community
Steen H, Moy FE, Bodvin T, Husa V (2016) Regrowth after kelp harvesting in Nord-Trøndelag, Norway. ICES Journal of Marine Science 73:2708–2720
Stelzenmüller V, Breen P, Stamford T, Thomsen F, Badalamenti F, Borja A, Buhl-Mortensen L, Carlstöm J, D’Anna G, Dankers N, Degraer S, Dujin M, Fiorentino F, Galparsoro I, Giakoumi S, Gristina M, Johnson K, Jones PJS, Katsanevakis S, Knittweis L, Kyriazi Z, Pipitone C, Piwowarczyk J, Rabaut M, Sørensen TK, van Dalfsen J, Vassilopoulou V, Vega Fernández T, Vincx M, Vöge S, Weber A, Wijkmark N, Jak R, Qiu W, ter Hofstede R (2013) Monitoring and evaluation of spatially managed areas: a generic framework for implementation of ecosystem based marine management and its application. Marine Policy 37:149–164
MERCES – D1.2. Activities and Pressures in Marine Habitats 99
Steneck RS, Graham MH, Bourque BJ, Corbett D, Erlandson JM, Estes JA, Tegner MJ (2002) Kelp forest ecosystems: biodiversity, stability, resilience and future. Environmental Conservation 29:436–459
Stock A (2016) Open source software for mapping human impacts on marine ecosystems with an additive model. Journal of Open Research Software 4(1), p.e21, doi:http://doi.org/10.5334/jors.88
SWD (2017) Report on the Blue Growth Strategy Towards more sustainable growth and jobs in the blue economy. Commission Staff Working Document, SWD (2017), Brussels
Teixeira H, Berg T, Uusitalo L, Fürhaupter K, Heiskanen A-S, Mazik K, Lynam CP, Neville S, Rodriguez JG, Papadopoulou N, Moncheva S, Churilova T, Kryvenko O, Krause-Jensen D, Zaiko A, Veríssimo H, Pantazi M, Carvalho S, Patrício J, Uyarra MC, Borja A (2016) A catalogue of marine biodiversity indicators. Frontiers in Marine Science 3(207), doi:103389/fmars201600207
Teixido N, Garrabou J, Harmelin J-G (2011) Low dynamics, high longevity and persistence of sessile structural species dwelling on Mediterranean coralligenous outcrops. PLoS ONE 6(8): e23744, https://doi.org/10.1371/journal.pone.0023744
Thibaut T, Pinedo S, Torras X, Ballesteros E (2005) Long-term decline of the populations of Fucales (Cystoseira spp and Sargassum spp) in the Alberes coast (France, North-western Mediterranean). Marine Pollution Bulletin 50:1472–1489
Thiel H (2003) Anthropogenic impacts on the deep sea. In: Tyler PA (ed) Ecosystems of the deep oceans. Ecosystems of the World. Vol 28. Elsevier, Amsterdam, p 427–471
Thuy HTT, Nga LP, Loan TTC (2011) Antibiotic contaminants in coastal wetlands from Vietnamese shrimp farming. Environmental Science and Pollution Research 18:835–841
UNEP-MAP-RAC/SPA (2008) Action plan for the conservation of the coralligenous and other calcareous bio-concretions in the Mediterranean Sea Tunis: RAC/SPA
van der Heide T, van Nes EH, van Katwijk MM, Olff H, Smolders AJP (2011) Positive feedbacks in seagrass ecosystems – Evidence from large-scale empirical data. PLoS ONE 6(1): e16504, https://doi.org/10.1371/journal.pone.0016504
Van Dover CL, Aronson J, Pendleton L, Smith S, Arnaud-Haond S, Moreno-Mateos D, Barbier E, Billett D, Bowers K, Danovaro R, Edwards A, Kellert S, Morato T, Pollard E, Rogers A, Warner R (2014) Ecological restoration in the deep sea: desiderata. Marine Policy 44:98–106
Watling L, France SC, Pante E, Simpson A (2011) Biology of Deep-Water Octocorals. Advances in Marine Biology 60:41–122
Waycott M, Duarte C, Carruthers T, Orth B, Dennison B, Olyarnik S, Calladine A, Fourqurean J, Heck K, Hughes R, Kendrick G, Kenworthy J, Short F, Williams S (2009) Accelerating loss of seagrasses across the globe threatens coastal ecosystems. Proceedings of the National Academy of Science 106:12377–12381
White LJ, Koss RS, Knights AM, Eriksson A, Robinson LA (2013) ODEMM Linkage Framework Userguide (Version 2). ODEMM Guidance Document Series No.3. EC FP7 project (244273) ‘Options for Delivering Ecosystem-based Marine Management’. University of Liverpool
Williams A, Schlacher TA, Rowden AA, Althaus F, Clark MR, Bowden DA, Stewart R, Bax NJ, Consalvey M, Kloser RJ (2010) Seamount megabenthic assemblages fail to recover from trawling impacts. Marine Ecology 31:183–199
Yesson C, Clark MR, Taylor M, Rogers AD (2011) The global distribution of seamounts based on 30-second bathymetry data. Deep-Sea Research Part I 58:442–453
100 MERCES – D1.1. Marine habitats and degraded habitats
7. Annexes
Annex 1 – Describing the MERCES Pressures Catalogue
Contained within this document
Annex 2 – The Catalogue (MERCES_WP1_D1.2_Catalogue_Activities&Pressures_v10.xlsx)
A separate downloadable Excel file

MERCES – D1.2. Activities and Pressures in Marine Habitats 101
7.1. Annex 1: Describing the MERCES Pressures Catalogue
A.1.Introduction
The purpose of Annex 1 is to physically describe Annex 2, which is the MERCES Pressures
Catalogue database.
The data catalogue is a simple Excel file entitled:
MERCES_WP1_D1.2_Catalogue_Activities&Pressures_v10.xlsx
The file consists of 7 separate sheets
Sheet 1_Cover page: cover page for the Catalogue and Deliverable D1.2
Sheet 2_Read me & DoW: description of work and instructions for the contributing partners of
the catalogue
Sheet 3_Catalogue_Pressures: the Pressures Catalogues entries and associated data/information
Sheet 4_Lists: data entry options and lists of preselected options for various categories of data
entries
Sheet 5_Regional Seas: regional and sub-regional maps with information on regional seas, their
subdivisions, management units, or assessment areas for defining geographical categories entries
Sheet 6_ EUNIS & EUSEAMAP: European Nature Information System (EUNIS) habitat types
hierarchical view and seabed habitats according to EMODNET (European Marine Observation
and Data Network) for defining habitat type/feature categories entries
Sheet 7_Press_Activ: lists of pressures and activities leading to pressures/concerns with
descriptions and examples.
A.2.CataloguePages
The Catalogue worksheet contains the single row entries of all activities and pressures map
source entries (264 rows in total) with various categories of associated information (67 columns).
7.1.1. A2.1. Category groups and categories
The entries are broken down into 8 broad categories and then individual categories in single
columns.
102 MERCES – D1.1. Marine habitats and degraded habitats
• Data Input identifier section: to identify who added data information, including
institution name and contact
• Habitat Type: identifying the habitats by category, type and main feature
• Activities: checklist of 13 major categories of activities explicitly mapped in the
reference entry, with any comments provided in a separate column
• Endogenous (manageable) pressures: checklist of 26 major pressures explicitly mapped
in the reference entry, with any comments provided in a separate column
• Exogenous (unmanageable) pressures: checklist of 7 major pressures explicitly mapped
in the reference entry, with any comments provided in a separate column
• Information: additional information on any other types of maps provided by the reference
entry and general comments
• Region: information on the MSFD region, subregion or other subdivision covered by the
source entry
• Source: source/type of the data entry, including full reference and the reference link.
7.1.2. A2.3. Catalogue entries
There is a total of 264 entries in the Catalogue with data/information given for most of the
categories for each entry. The catalogue also cites 164 references.
Related Documents