Geologic framework of the 2005 Keathley Canyon gas hydrate research well, northern Gulf of Mexico D.R. Hutchinson a, * , P.E. Hart b , T.S. Collett c , K.M. Edwards a , D.C. Twichell a , F. Snyder d a U.S. Geological Survey, Woods Hole, MA 02543, USA b U.S. Geological Survey, Menlo Park, CA 94025, USA c U.S. Geological Survey, Denver, CO 80225, USA d WesternGeco, Schlumberger Data and Consulting Services, Houston, TX 77042, USA article info Article history: Received 19 March 2007 Received in revised form 13 June 2007 Accepted 4 January 2008 Keywords: Gulf of Mexico Gas hydrate Methane hydrate Geologic framework Joint industry projects JIP abstract The Keathley Canyon sites drilled in 2005 by the Chevron Joint Industry Project are located along the southeastern edge of an intraslope minibasin (Casey basin) in the northern Gulf of Mexico at 1335 m water depth. Around the drill sites, a grid of 2D high-resolution multichannel seismic data designed to image depths down to at least 1000 m sub-bottom reveals 7 unconformities and disconformities that, with the seafloor, bound 7 identifiable seismic stratigraphic units. A major disconformity in the middle of the units stands out for its angular baselapping geometry. From these data, three episodes of sedi- mentary deposition and deformation are inferred. The oldest episode consists of fine-grained muds deposited during a period of relative stability in the basin (units e, f, and g). Both the BSR and inferred gas hydrate occur within these older units. The gas hydrate occurs in near-vertical fractures. A second episode (units c and d) involved large vertical displacements associated with infilling and ponding of sediment. This second interval corresponds to deposition of intercalated fine and coarse-grained material that was recovered in the drill hole that penetrated the thin edges of the regionally much thicker units. The final episode of deposition (units a and b) occurred during more subdued vertical motions. Hemi- pelagic drape (unit a) characterizes the modern seafloor. The present-day Casey basin is mostly filled. Its sill is part of a subsiding graben structure that is only 10–20 m shallower than the deepest point in the basin, indicating that gravity-driven transport would mostly bypass the basin. Contemporary faulting along the basin margins has selectively reactivated an older group of faults. The intercalated sand and mud deposits of units c and d are tentatively correlated with Late Pleistocene deposition derived from the western shelf-edge delta/depocenter of the Mississippi River, which was probably most active from 320 ka to 70 ka [Winker, C.D., Booth, J., 2000. Sedimentary dynamics of the salt-dominated continental slope, Gulf of Mexico: integration of observations from the seafloor, near-surface, and deep subsurface. In: Proceedings of the GCSSEPM Foundation 20th Annual Research Conference, Deep-water Reservoirs of the World, pp. 1059–1086]. The presence of sand within the gas hydrate stability zone (in units c and d) is not sufficient to concentrate gas hydrate even though dispersed gas hydrate occurs deeper in the frac- tured mud/clay-rich sections of units e and f. Published by Elsevier Ltd. 1. Introduction While general characteristics of the hydrate stability zone (HSZ) can be estimated with pressure, temperature, and gas solubility parameters, the geologic setting is also critical for understanding factors that control the distribution and concentration of marine gas hydrates (Clennell et al., 1999; Nimblett and Ruppel, 2003; Trehu et al., 2004; Xu and Ruppel, 1999). Lithology and structure, together with the sometimes complicated history of deposition and deformation, are known to affect the distribution and concentra- tion of hydrate (Expedition 311 Scientists, 2006; Reidel et al., 2006; Trehu et al., 2004). Although the northern Gulf of Mexico (hereafter referred to simply as the Gulf) is a passive continental margin, the continental slope is remarkably complex and heterogeneous because of widespread salt tectonism, differential Pleistocene sediment loading, and consequent large variations in sediment patterns and structural style (Bryant et al., 1990; Diegel et al., 1995; Peel et al., 1995). Hence, understanding the geologic setting around the Joint Industry Project (JIP) drill holes sets the stage for understanding the factors affecting distribution of gas hydrate within the sedimentary section. * Corresponding author. Tel þ1 (508) 457 2263. E-mail address: [email protected] (D.R. Hutchinson). Contents lists available at ScienceDirect Marine and Petroleum Geology journal homepage: www.elsevier.com/locate/marpetgeo 0264-8172/$ – see front matter Published by Elsevier Ltd. doi:10.1016/j.marpetgeo.2008.01.012 Marine and Petroleum Geology 25 (2008) 906–918

Welcome message from author
This document is posted to help you gain knowledge. Please leave a comment to let me know what you think about it! Share it to your friends and learn new things together.
Transcript
lable at ScienceDirect
Marine and Petroleum Geology 25 (2008) 906–918
Contents lists avai
Marine and Petroleum Geology
journal homepage: www.elsevier .com/locate /marpetgeo
Geologic framework of the 2005 Keathley Canyon gas hydrate researchwell, northern Gulf of Mexico
D.R. Hutchinson a,*, P.E. Hart b, T.S. Collett c, K.M. Edwards a, D.C. Twichell a, F. Snyder d
a U.S. Geological Survey, Woods Hole, MA 02543, USAb U.S. Geological Survey, Menlo Park, CA 94025, USAc U.S. Geological Survey, Denver, CO 80225, USAd WesternGeco, Schlumberger Data and Consulting Services, Houston, TX 77042, USA
a r t i c l e i n f o
Article history:Received 19 March 2007Received in revised form 13 June 2007Accepted 4 January 2008
Keywords:Gulf of MexicoGas hydrateMethane hydrateGeologic frameworkJoint industry projectsJIP
* Corresponding author. Tel þ1 (508) 457 2263.E-mail address: [email protected] (D.R. Hutc
0264-8172/$ – see front matter Published by Elsevierdoi:10.1016/j.marpetgeo.2008.01.012
a b s t r a c t
The Keathley Canyon sites drilled in 2005 by the Chevron Joint Industry Project are located along thesoutheastern edge of an intraslope minibasin (Casey basin) in the northern Gulf of Mexico at 1335 mwater depth. Around the drill sites, a grid of 2D high-resolution multichannel seismic data designed toimage depths down to at least 1000 m sub-bottom reveals 7 unconformities and disconformities that,with the seafloor, bound 7 identifiable seismic stratigraphic units. A major disconformity in the middle ofthe units stands out for its angular baselapping geometry. From these data, three episodes of sedi-mentary deposition and deformation are inferred. The oldest episode consists of fine-grained mudsdeposited during a period of relative stability in the basin (units e, f, and g). Both the BSR and inferred gashydrate occur within these older units. The gas hydrate occurs in near-vertical fractures. A secondepisode (units c and d) involved large vertical displacements associated with infilling and ponding ofsediment. This second interval corresponds to deposition of intercalated fine and coarse-grained materialthat was recovered in the drill hole that penetrated the thin edges of the regionally much thicker units.The final episode of deposition (units a and b) occurred during more subdued vertical motions. Hemi-pelagic drape (unit a) characterizes the modern seafloor. The present-day Casey basin is mostly filled. Itssill is part of a subsiding graben structure that is only 10–20 m shallower than the deepest point in thebasin, indicating that gravity-driven transport would mostly bypass the basin. Contemporary faultingalong the basin margins has selectively reactivated an older group of faults. The intercalated sand andmud deposits of units c and d are tentatively correlated with Late Pleistocene deposition derived fromthe western shelf-edge delta/depocenter of the Mississippi River, which was probably most active from320 ka to 70 ka [Winker, C.D., Booth, J., 2000. Sedimentary dynamics of the salt-dominated continentalslope, Gulf of Mexico: integration of observations from the seafloor, near-surface, and deep subsurface.In: Proceedings of the GCSSEPM Foundation 20th Annual Research Conference, Deep-water Reservoirs ofthe World, pp. 1059–1086]. The presence of sand within the gas hydrate stability zone (in units c and d) isnot sufficient to concentrate gas hydrate even though dispersed gas hydrate occurs deeper in the frac-tured mud/clay-rich sections of units e and f.
Published by Elsevier Ltd.
1. Introduction
While general characteristics of the hydrate stability zone (HSZ)can be estimated with pressure, temperature, and gas solubilityparameters, the geologic setting is also critical for understandingfactors that control the distribution and concentration of marinegas hydrates (Clennell et al., 1999; Nimblett and Ruppel, 2003;Trehu et al., 2004; Xu and Ruppel, 1999). Lithology and structure,
hinson).
Ltd.
together with the sometimes complicated history of deposition anddeformation, are known to affect the distribution and concentra-tion of hydrate (Expedition 311 Scientists, 2006; Reidel et al., 2006;Trehu et al., 2004). Although the northern Gulf of Mexico (hereafterreferred to simply as the Gulf) is a passive continental margin, thecontinental slope is remarkably complex and heterogeneousbecause of widespread salt tectonism, differential Pleistocenesediment loading, and consequent large variations in sedimentpatterns and structural style (Bryant et al., 1990; Diegel et al., 1995;Peel et al., 1995). Hence, understanding the geologic setting aroundthe Joint Industry Project (JIP) drill holes sets the stage forunderstanding the factors affecting distribution of gas hydratewithin the sedimentary section.
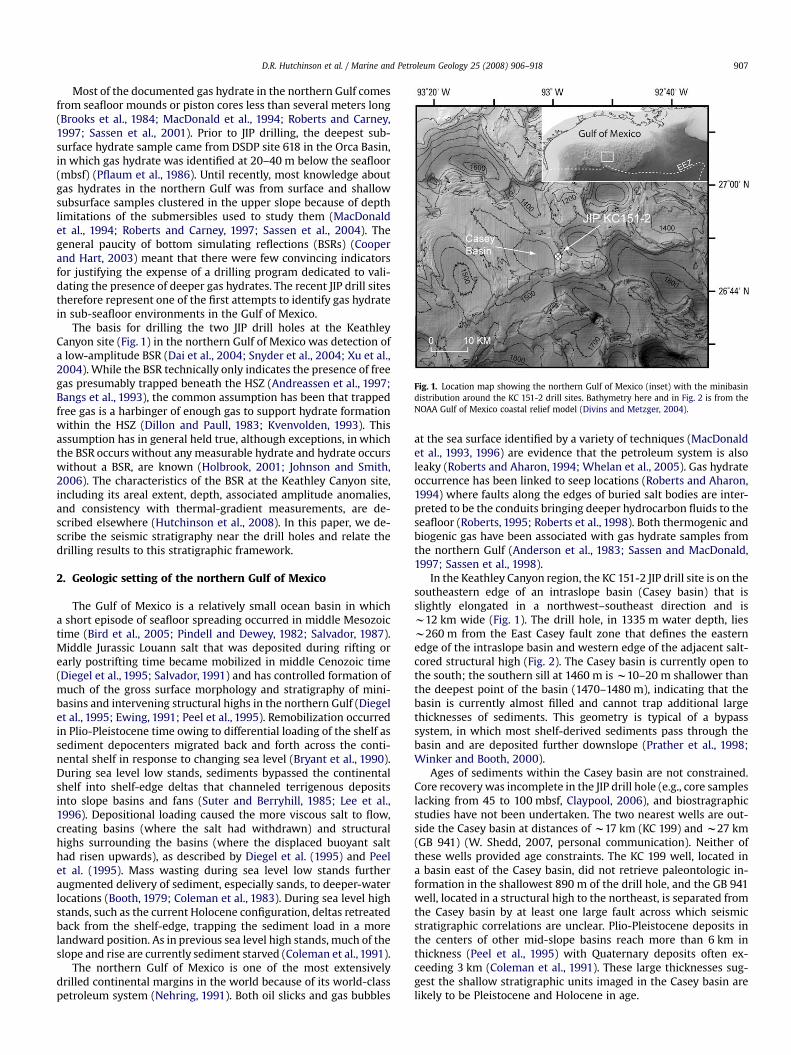
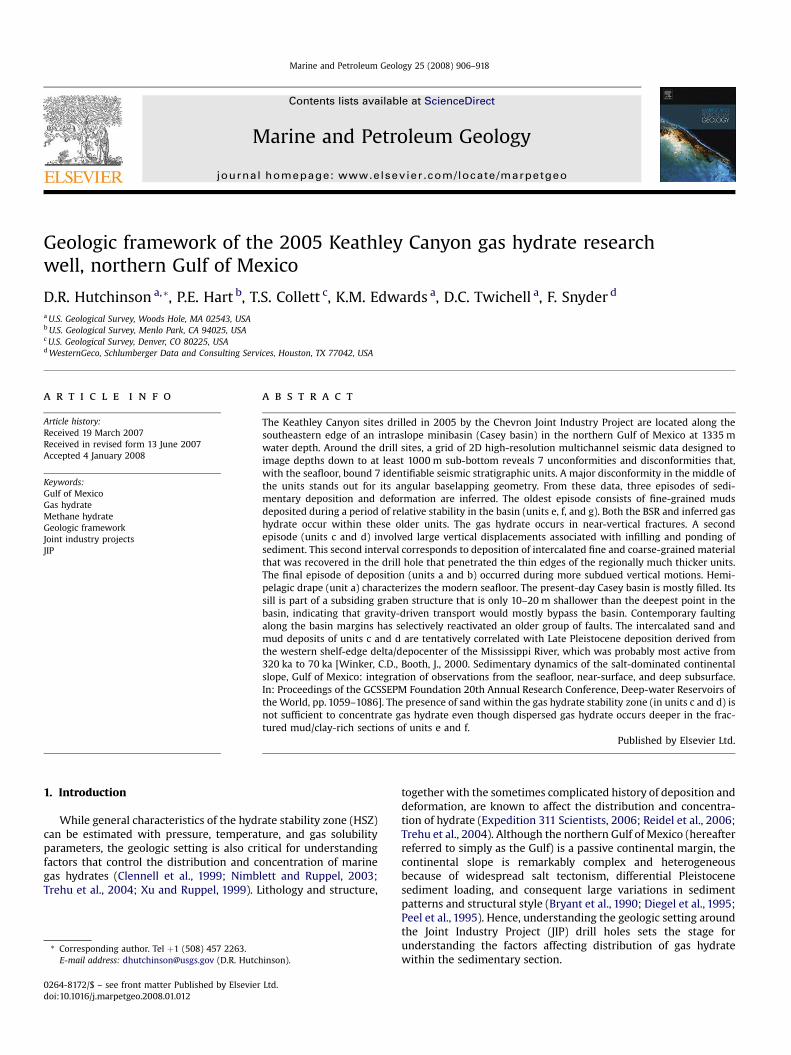
Fig. 1. Location map showing the northern Gulf of Mexico (inset) with the minibasindistribution around the KC 151-2 drill sites. Bathymetry here and in Fig. 2 is from theNOAA Gulf of Mexico coastal relief model (Divins and Metzger, 2004).
D.R. Hutchinson et al. / Marine and Petroleum Geology 25 (2008) 906–918 907
Most of the documented gas hydrate in the northern Gulf comesfrom seafloor mounds or piston cores less than several meters long(Brooks et al., 1984; MacDonald et al., 1994; Roberts and Carney,1997; Sassen et al., 2001). Prior to JIP drilling, the deepest sub-surface hydrate sample came from DSDP site 618 in the Orca Basin,in which gas hydrate was identified at 20–40 m below the seafloor(mbsf) (Pflaum et al., 1986). Until recently, most knowledge aboutgas hydrates in the northern Gulf was from surface and shallowsubsurface samples clustered in the upper slope because of depthlimitations of the submersibles used to study them (MacDonaldet al., 1994; Roberts and Carney, 1997; Sassen et al., 2004). Thegeneral paucity of bottom simulating reflections (BSRs) (Cooperand Hart, 2003) meant that there were few convincing indicatorsfor justifying the expense of a drilling program dedicated to vali-dating the presence of deeper gas hydrates. The recent JIP drill sitestherefore represent one of the first attempts to identify gas hydratein sub-seafloor environments in the Gulf of Mexico.
The basis for drilling the two JIP drill holes at the KeathleyCanyon site (Fig. 1) in the northern Gulf of Mexico was detection ofa low-amplitude BSR (Dai et al., 2004; Snyder et al., 2004; Xu et al.,2004). While the BSR technically only indicates the presence of freegas presumably trapped beneath the HSZ (Andreassen et al., 1997;Bangs et al., 1993), the common assumption has been that trappedfree gas is a harbinger of enough gas to support hydrate formationwithin the HSZ (Dillon and Paull, 1983; Kvenvolden, 1993). Thisassumption has in general held true, although exceptions, in whichthe BSR occurs without any measurable hydrate and hydrate occurswithout a BSR, are known (Holbrook, 2001; Johnson and Smith,2006). The characteristics of the BSR at the Keathley Canyon site,including its areal extent, depth, associated amplitude anomalies,and consistency with thermal-gradient measurements, are de-scribed elsewhere (Hutchinson et al., 2008). In this paper, we de-scribe the seismic stratigraphy near the drill holes and relate thedrilling results to this stratigraphic framework.
2. Geologic setting of the northern Gulf of Mexico
The Gulf of Mexico is a relatively small ocean basin in whicha short episode of seafloor spreading occurred in middle Mesozoictime (Bird et al., 2005; Pindell and Dewey, 1982; Salvador, 1987).Middle Jurassic Louann salt that was deposited during rifting orearly postrifting time became mobilized in middle Cenozoic time(Diegel et al., 1995; Salvador, 1991) and has controlled formation ofmuch of the gross surface morphology and stratigraphy of mini-basins and intervening structural highs in the northern Gulf (Diegelet al., 1995; Ewing, 1991; Peel et al., 1995). Remobilization occurredin Plio-Pleistocene time owing to differential loading of the shelf assediment depocenters migrated back and forth across the conti-nental shelf in response to changing sea level (Bryant et al., 1990).During sea level low stands, sediments bypassed the continentalshelf into shelf-edge deltas that channeled terrigenous depositsinto slope basins and fans (Suter and Berryhill, 1985; Lee et al.,1996). Depositional loading caused the more viscous salt to flow,creating basins (where the salt had withdrawn) and structuralhighs surrounding the basins (where the displaced buoyant salthad risen upwards), as described by Diegel et al. (1995) and Peelet al. (1995). Mass wasting during sea level low stands furtheraugmented delivery of sediment, especially sands, to deeper-waterlocations (Booth, 1979; Coleman et al., 1983). During sea level highstands, such as the current Holocene configuration, deltas retreatedback from the shelf-edge, trapping the sediment load in a morelandward position. As in previous sea level high stands, much of theslope and rise are currently sediment starved (Coleman et al., 1991).
The northern Gulf of Mexico is one of the most extensivelydrilled continental margins in the world because of its world-classpetroleum system (Nehring, 1991). Both oil slicks and gas bubbles
at the sea surface identified by a variety of techniques (MacDonaldet al., 1993, 1996) are evidence that the petroleum system is alsoleaky (Roberts and Aharon, 1994; Whelan et al., 2005). Gas hydrateoccurrence has been linked to seep locations (Roberts and Aharon,1994) where faults along the edges of buried salt bodies are inter-preted to be the conduits bringing deeper hydrocarbon fluids to theseafloor (Roberts, 1995; Roberts et al., 1998). Both thermogenic andbiogenic gas have been associated with gas hydrate samples fromthe northern Gulf (Anderson et al., 1983; Sassen and MacDonald,1997; Sassen et al., 1998).
In the Keathley Canyon region, the KC 151-2 JIP drill site is on thesoutheastern edge of an intraslope basin (Casey basin) that isslightly elongated in a northwest–southeast direction and isw12 km wide (Fig. 1). The drill hole, in 1335 m water depth, liesw260 m from the East Casey fault zone that defines the easternedge of the intraslope basin and western edge of the adjacent salt-cored structural high (Fig. 2). The Casey basin is currently open tothe south; the southern sill at 1460 m is w10–20 m shallower thanthe deepest point of the basin (1470–1480 m), indicating that thebasin is currently almost filled and cannot trap additional largethicknesses of sediments. This geometry is typical of a bypasssystem, in which most shelf-derived sediments pass through thebasin and are deposited further downslope (Prather et al., 1998;Winker and Booth, 2000).
Ages of sediments within the Casey basin are not constrained.Core recovery was incomplete in the JIP drill hole (e.g., core sampleslacking from 45 to 100 mbsf, Claypool, 2006), and biostragraphicstudies have not been undertaken. The two nearest wells are out-side the Casey basin at distances of w17 km (KC 199) and w27 km(GB 941) (W. Shedd, 2007, personal communication). Neither ofthese wells provided age constraints. The KC 199 well, located ina basin east of the Casey basin, did not retrieve paleontologic in-formation in the shallowest 890 m of the drill hole, and the GB 941well, located in a structural high to the northeast, is separated fromthe Casey basin by at least one large fault across which seismicstratigraphic correlations are unclear. Plio-Pleistocene deposits inthe centers of other mid-slope basins reach more than 6 km inthickness (Peel et al., 1995) with Quaternary deposits often ex-ceeding 3 km (Coleman et al., 1991). These large thicknesses sug-gest the shallow stratigraphic units imaged in the Casey basin arelikely to be Pleistocene and Holocene in age.

Fig. 2. Site map of the KC 151-2 drill site showing data coverage, basin morphology, and the East Casey fault zone. Lines illustrated in Figs. 3–5, and 8 are highlighted and labeled,respectively. Vent sites are from Hutchinson et al. (2008). Vent Beta is the northeastern most of the two mapped vents.
D.R. Hutchinson et al. / Marine and Petroleum Geology 25 (2008) 906–918908
The thickness of the HSZ around the KC 151-2 drill site is esti-mated (from BSR depths) to increase from 250 m at the basin edgesto greater than 400 m towards the center of the basin (Hutchinsonet al., 2008). Detailed descriptions and analysis of the BSR are givenin Hutchinson et al. (2008).
The structural high defined by uplift along the East Casey faultzone is a region of structural and stratigraphic complexity. Salt risesto within w1 km of the seafloor beneath the structural high(Hutchinson et al., 2008) and is probably many kilometers deepbeneath the adjacent minibasin (Diegel et al., 1995; Peel et al.,1995). The BSR extends across the faulted structural high from thedrill site to at least as far as vent Beta (Fig. 2) (Hutchinson et al.,2008; Snyder et al., 2004). The lack of offset in the BSR across theEast Casey fault suggests that the fault is not currently a conduit forwarm fluids from depth (Hutchinson et al., 2008). However, otherindicators of gas in the structural high suggest that fluid flow is orhas been active in the recent past: bright spots, blanking, chimneystructures, and possible seafloor vents (Hutchinson et al., 2008).Despite the structural and stratigraphic complexity, the observa-tion of a BSR and other acoustic evidence of potential gas in thesubsurface suggested that the Keathley Canyon intraslope basin sitewas an appropriate target for drilling subsurface gas hydrate.
3. Data
The seismic data used in this analysis consist of w380 km ofhigh-resolution multichannel seismic reflection data collected byUSGS in 2003 (Hart et al., 2005; Hutchinson and Hart, 2004). Dataquality is excellent, although the small source size (13 in3 GI airgun)limits penetration generally to the uppermost 1–1.5 s two-waytravel time (twtt) or about the uppermost 1000 m of section. Thesedepths are adequate for imaging the HSZ in these water depths, butare not appropriate for imaging the deeper stratigraphy andstructure controlling the regional geology. Line spacing was 1 km ina grid-based layout (Fig. 2).
The short streamer length (200 m) in water depths greater than1 km precludes obtaining accurate velocities from analysis of
normal moveout. Therefore, to convert seismic travel times todepth, a grid of velocities from a 3D multichannel seismic data setfrom this area acquired with an 8-km-long streamer wereincorporated into the analysis (Snyder et al., 2004; Xu et al., 2004).These velocity control points (Fig. 2) do not cover the entire surveyarea; therefore depths are more accurate only in the region ofvelocity control points. Standard Dix analysis was used in con-verting stacking velocities to depths (Dix, 1955). Line KC03, closestto the drill hole, was depth converted (Fig. 3). Interpretation andmapping of seismic horizons were completed on unmigrated data,for which errors in line ties are minimized. Migrated data wereused to interpret fault locations and are used to illustrate repre-sentative horizons and units (Figs. 4 and 5).
Two drill holes located w10 m apart were completed in theKeathley Canyon drilling program: KC 151-2 and the slightly updipKC 151-3. Only logging while drilling (LWD) was conducted at holeKC 151-2, whereas core samples and wire-line logging data werecollected from KC151-3. Interpretations of the JIP drilling data usedin this paper are based on the gamma-ray and ring resistivity logs(from the GeoVision tool) collected in the LWD program in KC 151-2as described in Claypool (2006) and Cook and Goldberg (2006).Synthetic seismograms constructed from the logging data are ingood agreement with seismic reflection data at the drill hole (Leeand Collett, 2008).
4. Seismic stratigraphy
In an analysis linking seismic stratigraphy with well data forintraslope basins in the upper and middle slope of the northernGulf, Prather et al. (1998) used four stratal characteristics to identifydepositional environments (Table 1): convergent baselapping, inwhich the units progressively fill and lap onto a basal disconfor-mity; convergent thinning, in which generally concordantreflections thin laterally updip; draping, in which subparallelreflections drape over paleotopography; and chaotic, in which fewlaterally continuous or coherent reflections occur. The boundariesbetween these units are characterized either as conformities, which

Fig. 3. Depth section of east–west line KC03. Upper panel is uninterpreted. Lowerpanel shows seismic stratigraphic interpretation including location of drill hole KC151-2. Lettered units (a–g) are separated by numbered horizons (solid lines). Subunitse1 and e2 are the only subunits named in the interpretation and are separated bya dashed line representing horizon 8. Other subunits are not named but are indicatedby dashed-line boundaries. Location is shown in Fig. 2, and seismic stratigraphic unitsare summarized in Table 2.
D.R. Hutchinson et al. / Marine and Petroleum Geology 25 (2008) 906–918 909
follow concordant strata although there may be local truncation, ordisconformities, which contain evidence for erosion, non-deposition, or a significant hiatus even if the horizon is concordantin places (Prather et al., 1998). Prather et al. (1998) further distin-guish high-impedance and low-impedance subcategories withintheir broader classification. These are interpreted to indicate rela-tively sand-prone (high reflectivity) and mud- or clay-prone (lowreflectivity) turbidite/fan facies. Chaotic facies may include masstransport complexes consisting of mud-rich sections of slumps,slides, and debris flow deposits (Beauboeuf and Friedmann, 2000).Our analysis uses these categories, boundaries, and criteria to dis-tinguish 7 units in the upper and lower portions of the seismic datain the Casey basin (Table 2, Figs. 3–5).
Near the JIP drill holes, the most prominent event in the shallowseismic section is a major disconformity (horizon 5 in Figs. 3–6,Table 2). This event is clear in all seismic sections and divides thestratigraphy into upper and lower packages. At the site of the drillhole, four units of distinct and different seismic character areidentified in the upper package (units a, b, c, and d bounded by theseafloor and horizons 1, 1a, 1b and 5). Three units, including oneunit consisting of two parts, are identified in the lower package
beneath the unconformity (units e–e1 and e2, f, and g, bounded byhorizons 5, 9, and 9a, horizon 8 separates e1 and e2).
4.1. Upper package
In the upper package, units b and d have primarily chaoticseismic–stratigraphic character containing transparent zones. Dis-continuous, arcuate, and sometimes wavy reflections occur, as dooccasional, semi-continuous subparallel internal reflections ofmoderate to high amplitude. The seismic character of these units ishighly variable. The upper thirds of both of these units showa transition to more convergent thinning style in the middle of thebasin, although at the drill hole this convergent thinning material iseither absent (top of unit b) or extremely thin (top of unit d). Unitd also shows classic baselap on horizon 5 in many of the seismicprofiles (Figs. 4 and 5), indicating that this unit filled either a sub-sided or subsiding basin. Unit b has a hummocky basal surface(horizon 1a) suggesting that deposition was preceded by intervalsof downcutting. The overall transparent, chaotic acoustic style ofboth units b and d suggests that they are dominated by discretepackages of mass wasting, channelized sand deposits, and sub-marine fan complexes, probably containing sand-prone intervals(Prather et al., 1998). An abundant sediment source bringingmaterial to fill this accommodation space is consistent withinterpretations of sea level low stands and shelf-edge deltas(Coleman et al., 1983; Suter and Berryhill, 1985; Winker and Booth,2000).
Units a and c of the upper sequence, which are above units b andd, respectively, are much thinner units that have well-imaged,subparallel, concordant layering. Unit a, which forms at the sea-floor, has draping style, with little or no thickening into the middleof the basin (<20 m thick). Although unit c is generally thin(w 40 m) compared to units b and d, it has a slight convergentthinning character towards the east. Both units have continuous tosemi-continuous reflections of mixed high and low impedance.This concordant reflection style is characteristic of hemipelagic,fine-grained deposition at times of higher sea level and reducedsediment supply (Beauboeuf and Friedmann, 2000; Winker andBooth, 2000).
The units and horizons above disconformity 5 are abruptly ter-minated at the eastern edge of the basin by an eastward dippingfault zone (East Casey fault zone) with a scarp or series of scarpsshowing seafloor offsets up to 0.070 s twtt (or about 50 m) (Fig. 6).In the vicinity of the JIP drilling, units a, b, and possibly also ctherefore may have connectivity with sea water along this scarp.Further south, the scarp is less pronounced and these units remainburied. These scarp and reflector offsets indicate that the East Caseyfault zone has been active recently, and neither erosion nor moderndeposition has smoothed away the steep relief.
The East Casey fault zone marks the edge of the adjacent salt-cored structural high (Hutchinson et al., 2008). As interpreted fromother intraslope basins (Diegel et al., 1995), this salt has presumablyflowed out of the middle of the basin creating the space for lens-shaped deposition in the center of the basin and pushing up theedges of the basin into the structural highs. Salt flow waspresumably most active during the formation of units b and d,which show the greatest thickening into the basin. Few horizonsfrom within the basin can be traced with any certainty across thecomplicated, diffractive acoustic character of the structural high.
4.2. Lower package
Beneath disconformity 5, the seismic stratigraphy of the lowerpackage is primarily convergent thinning. Unit e has a mixed cha-otic and concordant reflection character, in which discontinuousreflections are interspersed with semi-continuous and transparent
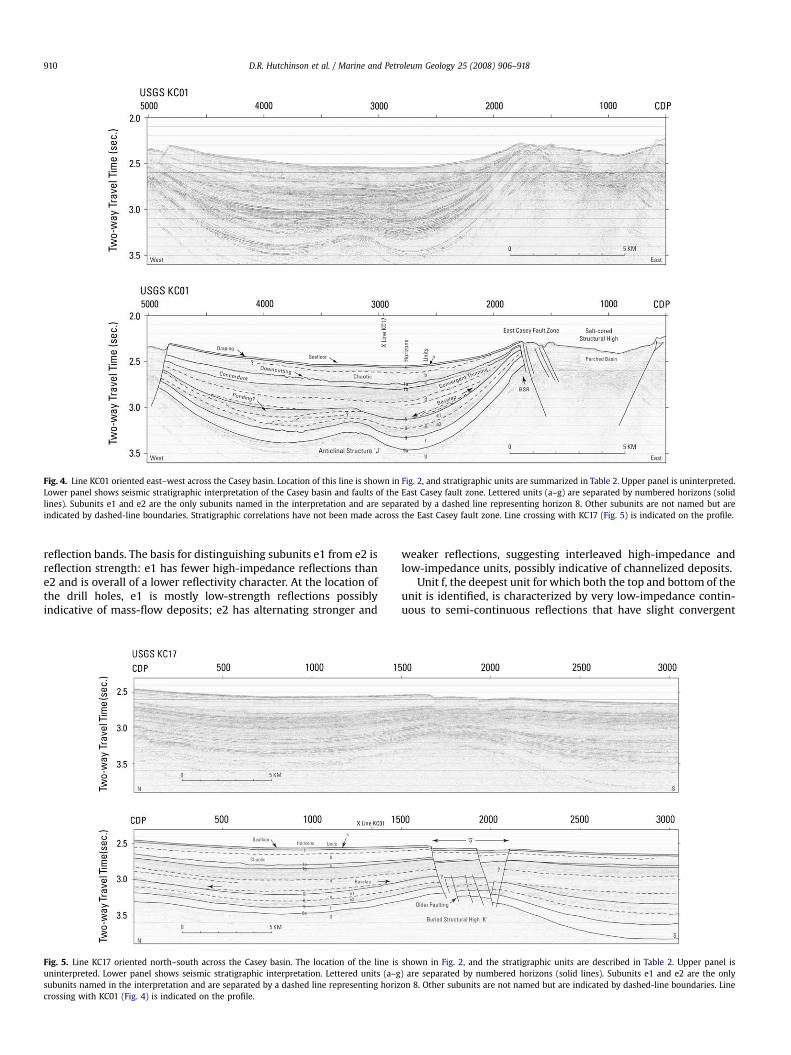
Fig. 4. Line KC01 oriented east–west across the Casey basin. Location of this line is shown in Fig. 2, and stratigraphic units are summarized in Table 2. Upper panel is uninterpreted.Lower panel shows seismic stratigraphic interpretation of the Casey basin and faults of the East Casey fault zone. Lettered units (a–g) are separated by numbered horizons (solidlines). Subunits e1 and e2 are the only subunits named in the interpretation and are separated by a dashed line representing horizon 8. Other subunits are not named but areindicated by dashed-line boundaries. Stratigraphic correlations have not been made across the East Casey fault zone. Line crossing with KC17 (Fig. 5) is indicated on the profile.
D.R. Hutchinson et al. / Marine and Petroleum Geology 25 (2008) 906–918910
reflection bands. The basis for distinguishing subunits e1 from e2 isreflection strength: e1 has fewer high-impedance reflections thane2 and is overall of a lower reflectivity character. At the location ofthe drill holes, e1 is mostly low-strength reflections possiblyindicative of mass-flow deposits; e2 has alternating stronger and
Fig. 5. Line KC17 oriented north–south across the Casey basin. The location of the line isuninterpreted. Lower panel shows seismic stratigraphic interpretation. Lettered units (a–gsubunits named in the interpretation and are separated by a dashed line representing horizcrossing with KC01 (Fig. 4) is indicated on the profile.
weaker reflections, suggesting interleaved high-impedance andlow-impedance units, possibly indicative of channelized deposits.
Unit f, the deepest unit for which both the top and bottom of theunit is identified, is characterized by very low-impedance contin-uous to semi-continuous reflections that have slight convergent
shown in Fig. 2, and the stratigraphic units are described in Table 2. Upper panel is) are separated by numbered horizons (solid lines). Subunits e1 and e2 are the onlyon 8. Other subunits are not named but are indicated by dashed-line boundaries. Line
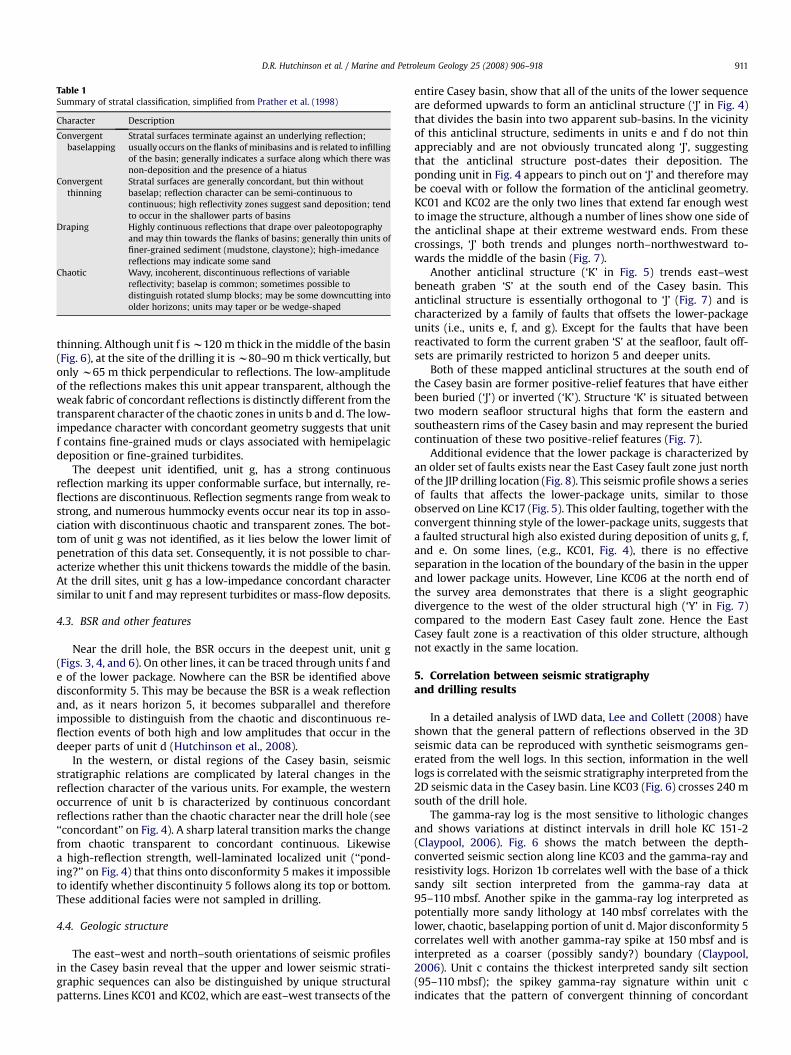
Table 1Summary of stratal classification, simplified from Prather et al. (1998)
Character Description
Convergentbaselapping
Stratal surfaces terminate against an underlying reflection;usually occurs on the flanks of minibasins and is related to infillingof the basin; generally indicates a surface along which there wasnon-deposition and the presence of a hiatus
Convergentthinning
Stratal surfaces are generally concordant, but thin withoutbaselap; reflection character can be semi-continuous tocontinuous; high reflectivity zones suggest sand deposition; tendto occur in the shallower parts of basins
Draping Highly continuous reflections that drape over paleotopographyand may thin towards the flanks of basins; generally thin units offiner-grained sediment (mudstone, claystone); high-imedancereflections may indicate some sand
Chaotic Wavy, incoherent, discontinuous reflections of variablereflectivity; baselap is common; sometimes possible todistinguish rotated slump blocks; may be some downcutting intoolder horizons; units may taper or be wedge-shaped
D.R. Hutchinson et al. / Marine and Petroleum Geology 25 (2008) 906–918 911
thinning. Although unit f is w120 m thick in the middle of the basin(Fig. 6), at the site of the drilling it is w80–90 m thick vertically, butonly w65 m thick perpendicular to reflections. The low-amplitudeof the reflections makes this unit appear transparent, although theweak fabric of concordant reflections is distinctly different from thetransparent character of the chaotic zones in units b and d. The low-impedance character with concordant geometry suggests that unitf contains fine-grained muds or clays associated with hemipelagicdeposition or fine-grained turbidites.
The deepest unit identified, unit g, has a strong continuousreflection marking its upper conformable surface, but internally, re-flections are discontinuous. Reflection segments range from weak tostrong, and numerous hummocky events occur near its top in asso-ciation with discontinuous chaotic and transparent zones. The bot-tom of unit g was not identified, as it lies below the lower limit ofpenetration of this data set. Consequently, it is not possible to char-acterize whether this unit thickens towards the middle of the basin.At the drill sites, unit g has a low-impedance concordant charactersimilar to unit f and may represent turbidites or mass-flow deposits.
4.3. BSR and other features
Near the drill hole, the BSR occurs in the deepest unit, unit g(Figs. 3, 4, and 6). On other lines, it can be traced through units f ande of the lower package. Nowhere can the BSR be identified abovedisconformity 5. This may be because the BSR is a weak reflectionand, as it nears horizon 5, it becomes subparallel and thereforeimpossible to distinguish from the chaotic and discontinuous re-flection events of both high and low amplitudes that occur in thedeeper parts of unit d (Hutchinson et al., 2008).
In the western, or distal regions of the Casey basin, seismicstratigraphic relations are complicated by lateral changes in thereflection character of the various units. For example, the westernoccurrence of unit b is characterized by continuous concordantreflections rather than the chaotic character near the drill hole (see‘‘concordant’’ on Fig. 4). A sharp lateral transition marks the changefrom chaotic transparent to concordant continuous. Likewisea high-reflection strength, well-laminated localized unit (‘‘pond-ing?’’ on Fig. 4) that thins onto disconformity 5 makes it impossibleto identify whether discontinuity 5 follows along its top or bottom.These additional facies were not sampled in drilling.
4.4. Geologic structure
The east–west and north–south orientations of seismic profilesin the Casey basin reveal that the upper and lower seismic strati-graphic sequences can also be distinguished by unique structuralpatterns. Lines KC01 and KC02, which are east–west transects of the
entire Casey basin, show that all of the units of the lower sequenceare deformed upwards to form an anticlinal structure (‘J’ in Fig. 4)that divides the basin into two apparent sub-basins. In the vicinityof this anticlinal structure, sediments in units e and f do not thinappreciably and are not obviously truncated along ‘J’, suggestingthat the anticlinal structure post-dates their deposition. Theponding unit in Fig. 4 appears to pinch out on ‘J’ and therefore maybe coeval with or follow the formation of the anticlinal geometry.KC01 and KC02 are the only two lines that extend far enough westto image the structure, although a number of lines show one side ofthe anticlinal shape at their extreme westward ends. From thesecrossings, ‘J’ both trends and plunges north–northwestward to-wards the middle of the basin (Fig. 7).
Another anticlinal structure (‘K’ in Fig. 5) trends east–westbeneath graben ‘S’ at the south end of the Casey basin. Thisanticlinal structure is essentially orthogonal to ‘J’ (Fig. 7) and ischaracterized by a family of faults that offsets the lower-packageunits (i.e., units e, f, and g). Except for the faults that have beenreactivated to form the current graben ‘S’ at the seafloor, fault off-sets are primarily restricted to horizon 5 and deeper units.
Both of these mapped anticlinal structures at the south end ofthe Casey basin are former positive-relief features that have eitherbeen buried (‘J’) or inverted (‘K’). Structure ‘K’ is situated betweentwo modern seafloor structural highs that form the eastern andsoutheastern rims of the Casey basin and may represent the buriedcontinuation of these two positive-relief features (Fig. 7).
Additional evidence that the lower package is characterized byan older set of faults exists near the East Casey fault zone just northof the JIP drilling location (Fig. 8). This seismic profile shows a seriesof faults that affects the lower-package units, similar to thoseobserved on Line KC17 (Fig. 5). This older faulting, together with theconvergent thinning style of the lower-package units, suggests thata faulted structural high also existed during deposition of units g, f,and e. On some lines, (e.g., KC01, Fig. 4), there is no effectiveseparation in the location of the boundary of the basin in the upperand lower package units. However, Line KC06 at the north end ofthe survey area demonstrates that there is a slight geographicdivergence to the west of the older structural high (‘Y’ in Fig. 7)compared to the modern East Casey fault zone. Hence the EastCasey fault zone is a reactivation of this older structure, althoughnot exactly in the same location.
5. Correlation between seismic stratigraphyand drilling results
In a detailed analysis of LWD data, Lee and Collett (2008) haveshown that the general pattern of reflections observed in the 3Dseismic data can be reproduced with synthetic seismograms gen-erated from the well logs. In this section, information in the welllogs is correlated with the seismic stratigraphy interpreted from the2D seismic data in the Casey basin. Line KC03 (Fig. 6) crosses 240 msouth of the drill hole.
The gamma-ray log is the most sensitive to lithologic changesand shows variations at distinct intervals in drill hole KC 151-2(Claypool, 2006). Fig. 6 shows the match between the depth-converted seismic section along line KC03 and the gamma-ray andresistivity logs. Horizon 1b correlates well with the base of a thicksandy silt section interpreted from the gamma-ray data at95–110 mbsf. Another spike in the gamma-ray log interpreted aspotentially more sandy lithology at 140 mbsf correlates with thelower, chaotic, baselapping portion of unit d. Major disconformity 5correlates well with another gamma-ray spike at 150 mbsf and isinterpreted as a coarser (possibly sandy?) boundary (Claypool,2006). Unit c contains the thickest interpreted sandy silt section(95–110 mbsf); the spikey gamma-ray signature within unit cindicates that the pattern of convergent thinning of concordant

Table 2Casey Basin seismic stratigraphy
Horizonname
Horizondescription
Unitname
Unit description Reflection strength Drilling correlation Interpretation
sf Seafloor Strong, continuous Seafloor
a Thin laminated, semi-continuousreflections parallel to the seafloor,little thickening towards middleof basin; w15 m thick
Mixed strongand weak
Fine-grained muds of normalsalinity
Hemipelagic drape,highstand conditions,Holocene
1 Continuousreflection at base ofunit a
Strong, continuous Conformity
b Upper – semi-continuous mixed weak andmoderate reflections, convergent thinning,pinches out to w10 m thick near drill hole;>60 m near basin middle;Lower – chaotic,mostly transparent, absence of continuousreflections, many chaotic diffractions (edgesof slump blocks?); w50 m at drill hole;thickens to >100 m in middle of basin
Mixed weakand strong
Fine-grained muds; salinityincreases from sea water valuesat top of unit to w45 ppt about10 m down from top of unit
Mass wasting depositionwith some interspersedconcordant deposition;absence of baselap suggestsminimal subsidence.
1a Base of chaotic zoneof unit b
Strong, segmented Disconformity, locallyincised
c Convergent thinning; semi-continuousconcordant reflections; some transparentzones, similar to top of unit b; top iscut into (channelized?) by unit b;w35 m thick near drill holes, 40–50 mthick near middle of basin
Weak Fine-grained muds withcoarser, sandier intervals.Overpressured sand at 105 m(Claypool, 2006) occurs at thebase of this interval
Mixed deposition (e.g.,hemipelagic or low-densityturbidites); minor or nosubsidence; fine-grained
1b Strong reflection atbase of unit c
Strong Conformity
d Convergent baselapping. Upper –convergent thinning, semi-continuousconcordant interspersed strong and weakreflections, generally thin (<30 m) near drillhole; >100 m near middle of basin.Lower –chaotic with some convergent thinning;well developed baselap fromsemi-continuous strong reflections;10–20 m thick at drill hole, >200 min middle of basin
Mixed transparentand strong
Mixed coarse- and fine-grainedintervals
Mixed mass wasting duringperiod of rapid subsidenceand infilling; largesediment supply, sand-prone (primarily lowstand)
5 One of strongestreflections inprofile markingangularterminations
Very strong Major disconformity
e1 Convergent thinning, generally lowimpedance with segments showing strongreflections; semi-continuous; w 50–60 mthick near drill hole; w110 m thick towardsmiddle of basin
Weak Fine-grained muds; high-resistivity spikes in lower thirdindicate probable hydrateoccurrence
Predominantly mudcontaining coarsersediment to account forsegments of strongreflections
8 Base of weakreflections of unit e
Weak Conformity
e2 Convergent thinning, semi-continuous,similar to unit e’, but generally higherimpedance; also contains segmentsshowing strong reflections; w30 mnear drill hole, w90 m thick towardsmiddle of basin
Strong Fine-grained muds; fewerresistivity spikes indicatelower-saturation hydrateoccurrences
Predominantly coarser(silt? sand?) to explainhigher reflectivity, but alsocontaining finer muds orclays
9 Top of weaklyreflective unit f
Weak Conformity
f Convergent thinning, low-impedancecontinuous, concordant reflections;<100 m near drill hole; w120 mthick near middle of basin
Very weak Fine-grained muds, resistivityspikes in upper third indicateprobable hydrate occurrence
Hemipelagic deposition;fine-grained, highstand
9a Base of unit f Strong Conformityg Mixed chaotic (transparent) and segments
of semi-continuous weak to strongamplitude reflections; chaotic zones havewavy and short dipping segments; strongcontinous reflections are infrequent;base of unit not picked in interpretation
Mixed weakand strong
Fine-grained muds, elevatedsalinity, BSR occurs in thissection at small resistivityanomaly
Mixed mass wasting, muddominated with somecoarser material (highamplitudes)
D.R. Hutchinson et al. / Marine and Petroleum Geology 25 (2008) 906–918912
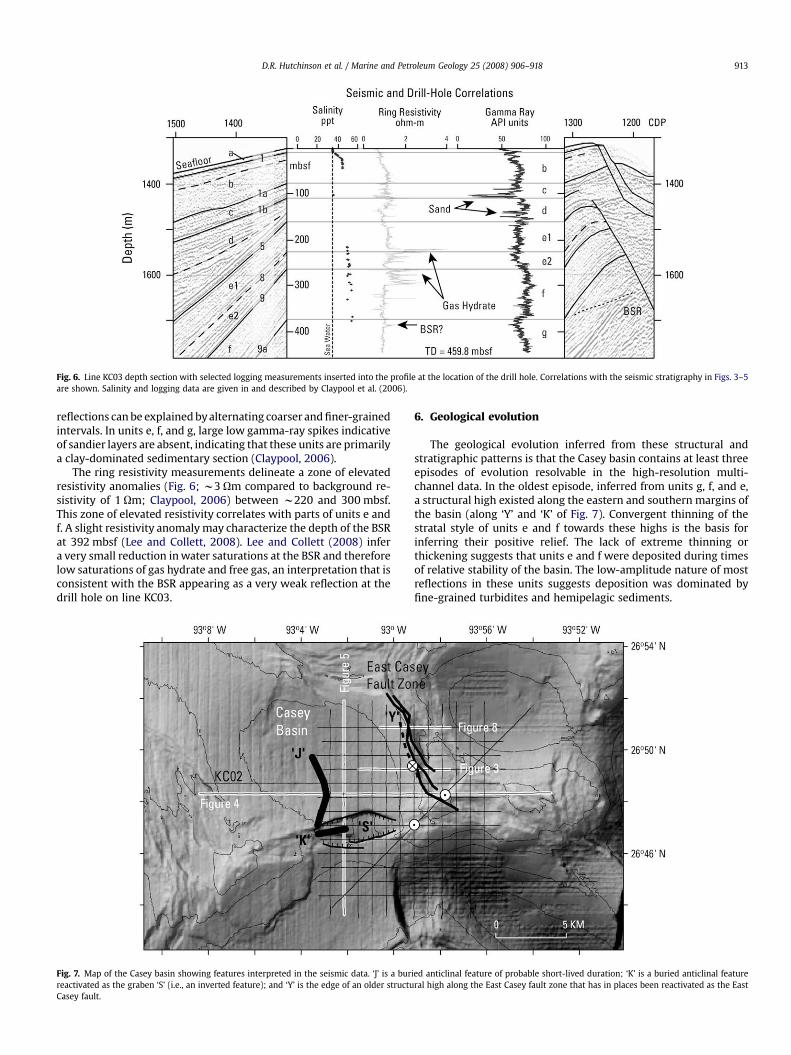
Fig. 6. Line KC03 depth section with selected logging measurements inserted into the profile at the location of the drill hole. Correlations with the seismic stratigraphy in Figs. 3–5are shown. Salinity and logging data are given in and described by Claypool et al. (2006).
D.R. Hutchinson et al. / Marine and Petroleum Geology 25 (2008) 906–918 913
reflections can be explained by alternating coarser and finer-grainedintervals. In units e, f, and g, large low gamma-ray spikes indicativeof sandier layers are absent, indicating that these units are primarilya clay-dominated sedimentary section (Claypool, 2006).
The ring resistivity measurements delineate a zone of elevatedresistivity anomalies (Fig. 6; w3 Um compared to background re-sistivity of 1 Um; Claypool, 2006) between w220 and 300 mbsf.This zone of elevated resistivity correlates with parts of units e andf. A slight resistivity anomaly may characterize the depth of the BSRat 392 mbsf (Lee and Collett, 2008). Lee and Collett (2008) infera very small reduction in water saturations at the BSR and thereforelow saturations of gas hydrate and free gas, an interpretation that isconsistent with the BSR appearing as a very weak reflection at thedrill hole on line KC03.
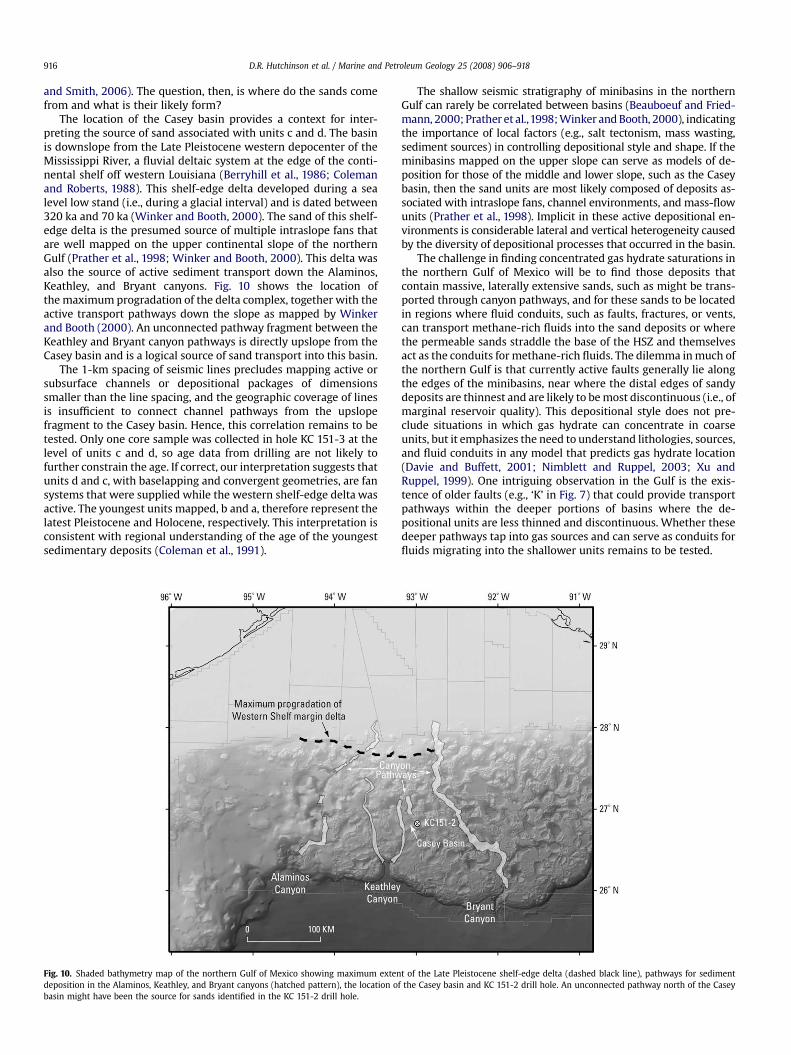
Fig. 7. Map of the Casey basin showing features interpreted in the seismic data. ‘J’ is a burreactivated as the graben ‘S’ (i.e., an inverted feature); and ‘Y’ is the edge of an older structuCasey fault.
6. Geological evolution
The geological evolution inferred from these structural andstratigraphic patterns is that the Casey basin contains at least threeepisodes of evolution resolvable in the high-resolution multi-channel data. In the oldest episode, inferred from units g, f, and e,a structural high existed along the eastern and southern margins ofthe basin (along ‘Y’ and ‘K’ of Fig. 7). Convergent thinning of thestratal style of units e and f towards these highs is the basis forinferring their positive relief. The lack of extreme thinning orthickening suggests that units e and f were deposited during timesof relative stability of the basin. The low-amplitude nature of mostreflections in these units suggests deposition was dominated byfine-grained turbidites and hemipelagic sediments.
ied anticlinal feature of probable short-lived duration; ‘K’ is a buried anticlinal featureral high along the East Casey fault zone that has in places been reactivated as the East

Fig. 8. Line KC06 oriented east–west showing two families of faults (‘‘older’’ and East Casey fault zone). Location of this line is shown in Fig. 2. Seismic stratigraphic horizons andunits identified in Figs. 3–5 and described in Table 2.
D.R. Hutchinson et al. / Marine and Petroleum Geology 25 (2008) 906–918914
Horizon 5 and overlying unit d define a second episode offormation in which a major change occurred (Figs. 3-6). The base-lapping geometry of unit d and the formation of anticlinal structure‘J’ at and along horizon 5 suggests that the basin experienced sig-nificant vertical motions–subsidence to create the accommodationspace that unit d eventually filled and uplift in the central part ofthe basin to form anticlinal structure ‘J.’ The chaotic depositionalstyle of unit d indicates erratic deposition, multiple hiatuses, andprobably frequent mass wasting events. Large amounts of sedimentfilled the space above horizon 5 and eventually buried anticlinalstructure ‘‘J’’. The basin returned to a convergent thinning andconvergent baselapping geometry during deposition of the upperpart of unit d. The progression suggests a transition from gravity-driven mass wasting to sheet sand/fan deposition to channelizedmixed-grained deposits to bypass deposition.
The stratal and structural relations of unit d are consistent witha period of ponding of sediment (Prather et al., 1998; Winker andBooth, 2000), in which the intraslope basin acts as a trap first formass wasting deposits and subsequently for submarine fan mate-rial that would otherwise move downslope. These ponded faciesassemblages are often characterized by sand-dominated turbidites(Winker and Booth, 2000). The sand units inferred at 140 and 150mbsf in the logging data are probably the distal, thinned fringe ofmuch thicker sand units that were deposited in the middle of thebasin within unit d. The sandy intervals logged in unit c may rep-resent the last or youngest parts of the sand-dominated pondedfacies assemblage within the Casey basin. By the time that horizon1a formed at the top of unit c, the basin had mostly filled to its sill atthe south end. The irregular surface on horizon 1a (Fig. 4) suggestssubsequent downcutting and removal of material.
During the final and youngest episode of basin formation,coincident with deposition of units a and b, the basin continued toaccumulate deposits, but the convergent thinning of concordantreflections (top of unit b) and the draping style (unit a) indicate thatthe vertical motions are much subdued compared to the secondepisode of formation. This facies succession suggests progressionfrom fine-grained turbidite deposition during unit b time to hem-ipelagic sedimentation during unit a time. Offset of the seaflooralong the East Casey fault zone indicates that vertical motion
continues along the structural high rimming the basin. Similarly,the graben structure at the south end (‘S’ in Figs. 5 and 7) offsets theseafloor and indicates that extremely localized subsidence isdeepening the southern end of the basin. These youngest depositsappear to represent a transition to the bypass facies assemblage, inwhich sediments are not trapped in the basin, but bypass it toaccumulate further downslope (Prather et al., 1998; Winker andBooth, 2000).
7. Discussion
7.1. Occurrence of gas hydrate
Although gas hydrate was not physically recovered during theGulf of Mexico drilling program, indirect evidence for its occur-rence in situ (e.g., cold spots in the cores and elevated electricalresistivity anomalies) suggested its probable occurrence fromw220 to 300 m in KC 151-2 (Claypool, 2006). This corresponds toportions of units e and f in the seismic stratigraphy, units that areinterpreted as fine-grained muds and clays based on gamma-raylogging data. Using the resistivity measurements and the Archierelation to quantify the amount of gas hydrate, Lee and Collett(2008) estimated that the top of this interval from 220–230 mbsfcontained significant gas hydrate, with several thin peaks up to 40%saturation of the pore space. In the rest of the gas hydrate-bearingsection, variability was large, and estimates of less than 10% satu-ration were common. Sinusoidal patterns in the resistivity-at-the-bit (RAB) imaging for the KC 152-2 hole (Fig. 9) further indicate thatthis interval from 220 to 300 mbsf contains numerous, near-verticalstructures interpreted as fractures (Cook et al., 2008). Thefracture voids are the most likely explanation for the localized el-evated concentrations of gas hydrate (Cook et al., 2008). Fractureswithin clay-dominated hydrate-bearing sediments have been ob-served in the Blake Ridge (Dillon et al., 1997; Rowe and Gettrust,1993). The Gulf of Mexico data are consistent with these fracturesbeing a common feature associated with hydrates in fine-grainedsediments.
There are currently three conceptual models for the formationand location of elevated concentrations of gas hydrate. One of the

Fig. 9. RAB images showing the high-resistivity interval below 220 mbsf, which isbelow the major disconformity (horizon 5). The sinusoidal patterns seen in the RABimages are consistent with steeply dipping fracture surfaces. These fractures are notevident in the shallower units.
D.R. Hutchinson et al. / Marine and Petroleum Geology 25 (2008) 906–918 915
earliest models leads to hydrate concentrations that increase withdepth to a maximum near the BSR (Dillon et al.,1980; Hyndman andDavis, 1992; Hyndman and Spence, 1992; Kvenvolden, 1990). Thisexplanation has been invoked to explain hydrate concentrations onthe Blake Ridge, a mobile sediment drift deposit on a passive margin(Holbrook, 2001; Korenaga et al., 1997) and in the Cascadia accre-tionary wedge on an active margin (Hyndman and Davis, 1992;Hyndman and Spence, 1992). In this model, hydrate becomes con-centrated near the base of the HSZ through time either by con-tinuing sedimentation (Blake Ridge) or uplift (Cascadia accretionarywedge), both processes that recycle methane near the BSR as theBSR migrates to shallower depths through time. Higher concen-trations of gas hydrate near the base of the stability zone are also
consistent with the results of steady-state numerical models forupward migration of methane through homogeneous sediments(Xu and Ruppel, 1999), with the higher concentration of hydratenear the base of the HSZ being a consequence of the morphology ofthe methane solubility curve between this depth and the seafloor(Nimblett and Ruppel, 2003). The JIP studies described in this paperin the northern Gulf of Mexico inferred that maximum concentra-tions of hydrate within the northern Gulf of Mexico study areasoccur well above the BSR, indicating that a simple steady-stateevolutionary model does not readily apply there.
A second model, which has grown out of the results of studies inpermafrost settings, suggests that hydrate is concentrated alongcoarse, sand-rich horizons that might be located anywhere withinthe HSZ and contain maximum hydrate concentrations greater than50 to 70% or pore space (Collett, 2002; Collett and Dallimore, 2000;Dallimore and Collett, 2005). Recently, this model was demon-strated to also be applicable to some marine environments, withhigh saturations of gas hydrate recovered in sand-rich units abovethe BSR in the Nankai trough off Japan (Baba and Yamada, 2004;Fujii et al., 2005), offshore Oregon (Trehu et al., 2004) and offshoreVancouver, British Columbia (Expedition 311 Scientists, 2006;Reidel et al., 2006). In the KC 151-2 hole, the sandy silt sectionsidentified as part of units c and d appear to lack significant hydrate,based on the lack of resistivity anomalies at those depths. However,these more sandy units at KC 151-2 are not the type of cleaner,coarser, and/or more permeable sands that have been found tocontain significant gas hydrate at other locations and may be dis-connected from a source of gas charge as well. This may explainwhy these units may not have concentrated gas hydrate, whiledeeper mud/clay-rich sections of units e and f do.
The third model accounts for the dynamic nature of the gas HSZby identifying and emphasizing the pathways and concentrationsof methane-rich fluids that move through the sedimentary section(Nimblett and Ruppel, 2003). These pathways can serve to con-centrate gas hydrate in porous media (i.e., the sand model), or insecondary porosity, such as fractures or faults. Researchers in theGulf of Mexico have long suggested that gas hydrate at seafloorexposures and in near-seafloor cores is probably concentratedaround sites of fluid venting (MacDonald et al., 2003; Roberts, 1995;Sager et al., 2003, 2004; Sassen et al., 2001). In a variation of thismodel, vents evolve from high flux (mud volcanos) to intermediateflux (gas hydrate-bearing) to low flux (primarily carbonate hardgrounds) (Roberts, 2001; Roberts and Carney, 1997). Recently, faultpathways have been re-emphasized as the sites of gas hydrateconcentration (e.g., focused flow model of Max et al., 2006). Com-mon to all of these explanations is the presence of pathways alongwhich fluids can migrate and cause gas hydrate to be concentratedas these fluids move into the HSZ. The gas hydrate inferred at KC151-2 is most compatible with this third, pathways-based modelbecause of their presumed association with fracture porosity in the220–300 mbsf interval (e.g., Cook et al., 2008). The seismic data areinsufficient to resolve steeply dipping structures such as fracturesand are therefore not appropriate for mapping the distribution ofthe fracture networks. However, like the older family of faults, theyappear to only occur in the lower package of units based on the RABimagery (Cook and Goldberg, 2006) and therefore are not conduitsfor fluids to migrate into the shallower sand units.
7.2. Source of sands in the Casey basin
The sands identified in KC 151-2 are porous units within theHSZ. Although they were not saturated with gas hydrate, theirpresence supports the hypothesis that shallow sands may be morecommon in the marine environment of the continental slope andcould be reservoirs for elevated gas hydrate saturations (Johnson
D.R. Hutchinson et al. / Marine and Petroleum Geology 25 (2008) 906–918916
and Smith, 2006). The question, then, is where do the sands comefrom and what is their likely form?
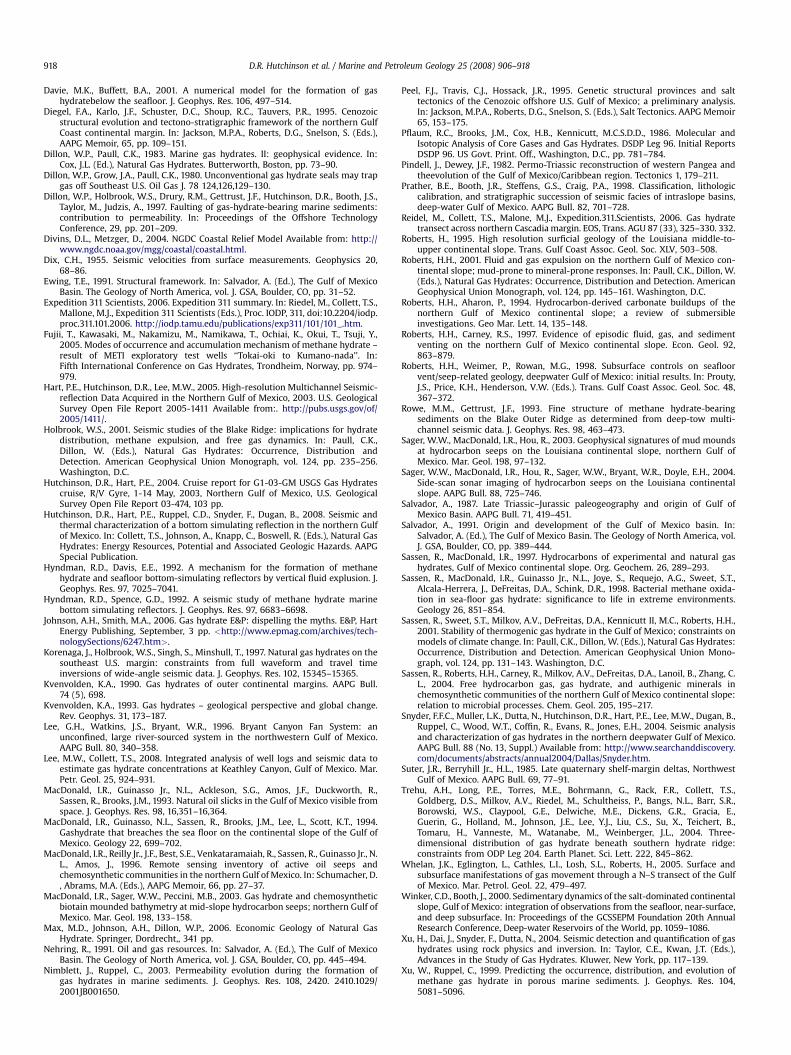
The location of the Casey basin provides a context for inter-preting the source of sand associated with units c and d. The basinis downslope from the Late Pleistocene western depocenter of theMississippi River, a fluvial deltaic system at the edge of the conti-nental shelf off western Louisiana (Berryhill et al., 1986; Colemanand Roberts, 1988). This shelf-edge delta developed during a sealevel low stand (i.e., during a glacial interval) and is dated between320 ka and 70 ka (Winker and Booth, 2000). The sand of this shelf-edge delta is the presumed source of multiple intraslope fans thatare well mapped on the upper continental slope of the northernGulf (Prather et al., 1998; Winker and Booth, 2000). This delta wasalso the source of active sediment transport down the Alaminos,Keathley, and Bryant canyons. Fig. 10 shows the location ofthe maximum progradation of the delta complex, together with theactive transport pathways down the slope as mapped by Winkerand Booth (2000). An unconnected pathway fragment between theKeathley and Bryant canyon pathways is directly upslope from theCasey basin and is a logical source of sand transport into this basin.
The 1-km spacing of seismic lines precludes mapping active orsubsurface channels or depositional packages of dimensionssmaller than the line spacing, and the geographic coverage of linesis insufficient to connect channel pathways from the upslopefragment to the Casey basin. Hence, this correlation remains to betested. Only one core sample was collected in hole KC 151-3 at thelevel of units c and d, so age data from drilling are not likely tofurther constrain the age. If correct, our interpretation suggests thatunits d and c, with baselapping and convergent geometries, are fansystems that were supplied while the western shelf-edge delta wasactive. The youngest units mapped, b and a, therefore represent thelatest Pleistocene and Holocene, respectively. This interpretation isconsistent with regional understanding of the age of the youngestsedimentary deposits (Coleman et al., 1991).
Fig. 10. Shaded bathymetry map of the northern Gulf of Mexico showing maximum extendeposition in the Alaminos, Keathley, and Bryant canyons (hatched pattern), the location obasin might have been the source for sands identified in the KC 151-2 drill hole.
The shallow seismic stratigraphy of minibasins in the northernGulf can rarely be correlated between basins (Beauboeuf and Fried-mann, 2000; Prather et al.,1998; Winker and Booth, 2000), indicatingthe importance of local factors (e.g., salt tectonism, mass wasting,sediment sources) in controlling depositional style and shape. If theminibasins mapped on the upper slope can serve as models of de-position for those of the middle and lower slope, such as the Caseybasin, then the sand units are most likely composed of deposits as-sociated with intraslope fans, channel environments, and mass-flowunits (Prather et al., 1998). Implicit in these active depositional en-vironments is considerable lateral and vertical heterogeneity causedby the diversity of depositional processes that occurred in the basin.
The challenge in finding concentrated gas hydrate saturations inthe northern Gulf of Mexico will be to find those deposits thatcontain massive, laterally extensive sands, such as might be trans-ported through canyon pathways, and for these sands to be locatedin regions where fluid conduits, such as faults, fractures, or vents,can transport methane-rich fluids into the sand deposits or wherethe permeable sands straddle the base of the HSZ and themselvesact as the conduits for methane-rich fluids. The dilemma in much ofthe northern Gulf is that currently active faults generally lie alongthe edges of the minibasins, near where the distal edges of sandydeposits are thinnest and are likely to be most discontinuous (i.e., ofmarginal reservoir quality). This depositional style does not pre-clude situations in which gas hydrate can concentrate in coarseunits, but it emphasizes the need to understand lithologies, sources,and fluid conduits in any model that predicts gas hydrate location(Davie and Buffett, 2001; Nimblett and Ruppel, 2003; Xu andRuppel, 1999). One intriguing observation in the Gulf is the exis-tence of older faults (e.g., ‘K’ in Fig. 7) that could provide transportpathways within the deeper portions of basins where the de-positional units are less thinned and discontinuous. Whether thesedeeper pathways tap into gas sources and can serve as conduits forfluids migrating into the shallower units remains to be tested.
t of the Late Pleistocene shelf-edge delta (dashed black line), pathways for sedimentf the Casey basin and KC 151-2 drill hole. An unconnected pathway north of the Casey

D.R. Hutchinson et al. / Marine and Petroleum Geology 25 (2008) 906–918 917
8. Conclusions
High-resolution 2D data from near the JIP Keathley Canyon KC151-2 drill site in the northern Gulf of Mexico provide the oppor-tunity to place the borehole-derived information within thecontext of the geologic setting. The drill site is located on theuplifted southeastern edge of an intraslope minibasin, the Caseybasin, at 1335 m water depth. Seismic stratigraphic analysis is usedto divide the uppermost kilometer of sediments into 7 stratal units.A major disconformity (horizon 5) with pronounced baselappinggeometry stands out as the most prominent surface in the data andseparates the 7 stratal units into two sequences. The three unitsidentified beneath horizon 5 correlate with fine-grained muds inthe drilling. Gas hydrates are associated with two of these deeper,older units and occupy near-vertical fractures or possibly porespace in cleaner lithologies (e.g., Cook et al., 2008). An older familyof faults also occurs within these three older units. The near-ver-tical fractures and the older generation of faults may be related, butthe multichannel data are not of sufficient resolution todemonstrate such an association.
At the time of horizon 5, the Casey basin experienced largevertical motions that resulted in the hiatus marked by horizon 5and in significant infilling and ponding of sediment in units c andd above the disconformity. Correlation of the seismic stratigraphicanalysis with borehole results shows that units c and d are probablyintercalated sands and muds that represent the thinned and distaledges of thicker sequences in the middle of the basin. These unitsare interpreted to represent turbidite and channel fill sequencesthat have lateral and vertical heterogeneity and variable reflectioncharacter. When compared to the broader evolution of the Gulf,these units probably correlate with deposits derived from thewestern depocenter and shelf-edge delta of the Mississippi Riverthat was most active in Late Pleistocene time and that was theprobable cause of sediment loading and salt withdrawal in this late-stage evolution of the basin.
The youngest units, a and b, mark a return to more subduedvertical motions, a fine-grained depositional environment, anda more stable basin. Unit a, which occurs at and beneath the seafloor,consists of hemipelagic drape. Offset of the seafloor along faults onthe salt-cored structural high w260 m east of the drill site indicatesfault motion has continued into recent times. The basin is currentlynearly filled with sediment, with less than 20 m depth separationbetween the southern sill at 1460 m compared to the deepest pointin the basin at 1470–1480 m. Hence the Casey basin is transformingfrom a ponded facies basin in the Late Pleistocene to one in whichdownslope transport will primarily bypass the basin. The southernsill is also subsiding as part of a graben structure, masking the olderstructural high that caused the ponding of the older units.
The heterogeneity and complexity of the site indicate the chal-lenges in identifying zones in which gas hydrate will be mostconcentrated. The lack of evidence for hydrate in the shallowercoarse-grained deposits suggests that the fracture network withinthe fine-grained muds does not provide conduits for fluid migra-tion to shallower units. Therefore, at this site, the existence ofsandier units within the HSZ is not sufficient to concentrate gashydrate despite the presence of gas hydrate in lower permeability,clay-rich units deeper in the section.
Acknowledgements
Partial support for the field and interpretive aspects of thisproject were provided by the Department of Energy, National En-ergy Technology Lab (NETL). WesternGeco (Schlumberger) gener-ously provided velocity information for converting travel times todepths. We thank E. Jones and the JIP partners for encouragementand insight during multiple meetings and discussions. W. Shedd,
J. Hunt, and colleagues at MMS were helpful in advising on tracklinelocations and permitting for the field program. N. Satyavani helpedwith initial mapping of stratal boundaries. We also thank the manycolleagues who clarified and helped in understanding the compli-cated occurrence of gas hydrate in the Gulf of Mexico. This paperhas been improved by reviews by W. Dillon, W. Barnhardt,W. Shedd and an anonymous reviewer.
References
Anderson, R.K., Scalan, R.S., Parker, P.L., Behrens, E.W., 1983. Seep oil and gas in Gulfof Mexico slope sediment. Science 222, 619–621.
Andreassen, K., Hart, P.E., Mac Kay, M., 1997. Amplitude versus offset modeling ofthe bottom simulating reflection associated with submarine gas hydrates. Mar.Geol. 137, 25–40.
Baba, K., Yamada, Y., 2004. BSRs and associated reflections as an indicator of gashydrate and free gas accumulation: an example of accretionary prism andforearc basin system along the Nankai Trough, off central Japan. Res. Geol. 54,11–24.
Bangs, N.L., Sawyer, D.S., Golovchenko, X., 1993. Free gas at the base of thegas hydrate zone in the vicinity of the Chile Triple Junction. Geology 21,905–908.
Beauboeuf, R.T., Friedmann, S.J., 2000. High-resolution seismic/sequence strati-graphic framework for the evolution of Pleistocene intra slope basins. WesternGulf of Mexico: depositional models and reservoir analogs. In: Proceedings ofthe GCSSEPM Foundation 20th Annual Research Conference, DeepwaterReservoirs of the World, pp. 40–60.
Berryhill, H.L., Suter, J.R., Hardin, N.A., 1986. Late Quaternary facies and structure,northern Gulf of Mexico: interpretations from seismic data. AAPG Stud. Geol.23, 1–289.
Bird, D.E., Burke, K., Hall, S.A., Casey, J.F., 2005. Gulf of Mexico tectonic history:hotspot tracks, crustal boundaries, and early salt distribution. AAPG Bull. 89 (3),311–328.
Booth, J.S., 1979. Recent history of mass wasting on the upper continental slopes,northern Gulf of Mexico, as interpreted from the consolidation states of thesediment. In: Doyle, L.J., Pilkey Jr., O.H. (Eds.), Geology of Continental Slopes.SEPM Special Publication, vol. 27, pp. 153–164.
Brooks, J., Kennicutt II., M.C., Fay, R.R., McDonald, T.J., Sassen, R., 1984. Thermogenicgas hydrates in the Gulf of Mexico. Science 225, 409–411.
Bryant, W.R., Bryant, J.R., Feeley, M.H., Simmons, G.R., 1990. Physiographic andbathymetric characteristics of the continental slope, Northwest Gulf of Mexico.Geo Mar. Lett. 10, 182–199.
Claypool, G.E., 2006. Gulf of Mexico Gas Hydrate Joint Industry Project (GOMJIP),2005. The Cruise of the Drilling Vessel Uncle John, Mobile, Alabama toGalveston, Texas, Atwater Valley Blocks 13/14 and Keathley Canyon Block 151,17 April to 22 May 2005 Available from: http://www.netl.doe.gov/technologies/oil-gas/publications/Hydrates/reports/GOMJIPCruise05.pdf.
Clennell, M.B., Hovland, M., Booth, J.S., Henry, P., Winters, W.J., 1999. Formation ofnatural gas hydrates in marine sediments 1. Conceptual model of gas hydrategrowth conditioned by host sediment properties. J. Geophys. Res. 104, 22985–23003.
Coleman, J.M., Roberts, H.H., 1988. Sedimentary development of the Louisianacontinental shelf related to sea level cycles: part I – sedimentary sequences andpart II – seismic stratigraphy. Geo Mar. Lett. 8, 63–119.
Coleman, J.M., Prior, D.B., Lindsay, J.F., 1983. Deltaic influences on shelf edgeinstability processes. In: Stanley, D.J., Moore, G.T. (Eds.), The Shelf Break; CriticalInterface on Continental Margins. SEPM Special Publication, vol. 33, pp.121–138.
Coleman, J.M., Roberts, H.H., Bryant, W.R., 1991. Late Quaternary sedimentation. In:Salvador, A. (Ed.), The Gulf of Mexico Basin. The Geology of North America, vol.J. GSA, Boulder, CO, pp. 325–352.
Collett, T.S., 2002. Energy resource potential of natural gas hydrates. AAPG Bull. 86,1971–1992.
Collett, T.S., Dallimore, S.R., 2000. Permafrost-associated gas hydrate. In: Max, M.D.(Ed.), Natural Gas Hydrate In Oceanic and Permafrost Environments. Kluwer,Dordrecht, pp. 43–60.
Cook, A., Goldberg, D., 2006. ChevronTexaco JIP Well-log Data Available from:https://cpln-www1.chevron.com/cvx/gasjip.nsf/WhatsNew/2FEABBD232E245D788257174000A9330?opendocument.
Cook, A.E., Goldberg, D., Kleinberg, R.L., 2008. Fracture-controlled gas hydratesystems in the northern Gulf of Mexico. Mar. Petr. Geol. 25, 932–941.
Cooper, A.K., Hart, P.E., 2003. High-resolution seismic-reflection investigation of thenorthern Gulf of Mexico gas-hydrate-stability zone. Mar. Petr. Geol. 19,1275–1293.
Dai, J., Xu, H., Snyder, F., Dutta, N., Herron, D., 2004. Detection and estimation of gashydrates using rock physics and seismic inversion; examples from the northerndeepwater Gulf of Mexico. The Leading Edge 23, 60–66.
Dallimore, S.R., Collett, T.S., 2005. Summary and implications of the Mallik 2002 gashydrate production research well program. In: Dallimore, S.R., Collett, T.S. (Eds.),Scientific Results from the Mallik 2002 Gas Hydrate Production Research WellProgram, Mackenzie Delta, Northwest Territories, Canada. Bull. Geol. Surv. Can.585, 1–36.
D.R. Hutchinson et al. / Marine and Petroleum Geology 25 (2008) 906–918918
Davie, M.K., Buffett, B.A., 2001. A numerical model for the formation of gashydratebelow the seafloor. J. Geophys. Res. 106, 497–514.
Diegel, F.A., Karlo, J.F., Schuster, D.C., Shoup, R.C., Tauvers, P.R., 1995. Cenozoicstructural evolution and tectono-stratigraphic framework of the northern GulfCoast continental margin. In: Jackson, M.P.A., Roberts, D.G., Snelson, S. (Eds.),AAPG Memoir, 65, pp. 109–151.
Dillon, W.P., Paull, C.K., 1983. Marine gas hydrates. II: geophysical evidence. In:Cox, J.L. (Ed.), Natural Gas Hydrates. Butterworth, Boston, pp. 73–90.
Dillon, W.P., Grow, J.A., Paull, C.K., 1980. Unconventional gas hydrate seals may trapgas off Southeast U.S. Oil Gas J. 78 124,126,129–130.
Dillon, W.P., Holbrook, W.S., Drury, R.M., Gettrust, J.F., Hutchinson, D.R., Booth, J.S.,Taylor, M., Judzis, A., 1997. Faulting of gas-hydrate-bearing marine sediments:contribution to permeability. In: Proceedings of the Offshore TechnologyConference, 29, pp. 201–209.
Divins, D.L., Metzger, D., 2004. NGDC Coastal Relief Model Available from: http://www.ngdc.noaa.gov/mgg/coastal/coastal.html.
Dix, C.H., 1955. Seismic velocities from surface measurements. Geophysics 20,68–86.
Ewing, T.E., 1991. Structural framework. In: Salvador, A. (Ed.), The Gulf of MexicoBasin. The Geology of North America, vol. J. GSA, Boulder, CO, pp. 31–52.
Expedition 311 Scientists, 2006. Expedition 311 summary. In: Riedel, M., Collett, T.S.,Mallone, M.J., Expedition 311 Scientists (Eds.), Proc. IODP, 311, doi:10.2204/iodp.proc.311.101.2006. http://iodp.tamu.edu/publications/exp311/101/101_.htm.
Fujii, T., Kawasaki, M., Nakamizu, M., Namikawa, T., Ochiai, K., Okui, T., Tsuji, Y.,2005. Modes of occurrence and accumulation mechanism of methane hydrate –result of METI exploratory test wells ‘‘Tokai-oki to Kumano-nada’’. In:Fifth International Conference on Gas Hydrates, Trondheim, Norway, pp. 974–979.
Hart, P.E., Hutchinson, D.R., Lee, M.W., 2005. High-resolution Multichannel Seismic-reflection Data Acquired in the Northern Gulf of Mexico, 2003. U.S. GeologicalSurvey Open File Report 2005-1411 Available from:. http://pubs.usgs.gov/of/2005/1411/.
Holbrook, W.S., 2001. Seismic studies of the Blake Ridge: implications for hydratedistribution, methane expulsion, and free gas dynamics. In: Paull, C.K.,Dillon, W. (Eds.), Natural Gas Hydrates: Occurrence, Distribution andDetection. American Geophysical Union Monograph, vol. 124, pp. 235–256.Washington, D.C.
Hutchinson, D.R., Hart, P.E., 2004. Cruise report for G1-03-GM USGS Gas Hydratescruise, R/V Gyre, 1-14 May, 2003, Northern Gulf of Mexico, U.S. GeologicalSurvey Open File Report 03-474, 103 pp.
Hutchinson, D.R., Hart, P.E., Ruppel, C.D., Snyder, F., Dugan, B., 2008. Seismic andthermal characterization of a bottom simulating reflection in the northern Gulfof Mexico. In: Collett, T.S., Johnson, A., Knapp, C., Boswell, R. (Eds.), Natural GasHydrates: Energy Resources, Potential and Associated Geologic Hazards. AAPGSpecial Publication.
Hyndman, R.D., Davis, E.E., 1992. A mechanism for the formation of methanehydrate and seafloor bottom-simulating reflectors by vertical fluid explusion. J.Geophys. Res. 97, 7025–7041.
Hyndman, R.D., Spence, G.D., 1992. A seismic study of methane hydrate marinebottom simulating reflectors. J. Geophys. Res. 97, 6683–6698.
Johnson, A.H., Smith, M.A., 2006. Gas hydrate E&P: dispelling the myths. E&P, HartEnergy Publishing, September, 3 pp. <http://www.epmag.com/archives/tech-nologySections/6247.htm>.
Korenaga, J., Holbrook, W.S., Singh, S., Minshull, T., 1997. Natural gas hydrates on thesoutheast U.S. margin: constraints from full waveform and travel timeinversions of wide-angle seismic data. J. Geophys. Res. 102, 15345–15365.
Kvenvolden, K.A., 1990. Gas hydrates of outer continental margins. AAPG Bull.74 (5), 698.
Kvenvolden, K.A., 1993. Gas hydrates – geological perspective and global change.Rev. Geophys. 31, 173–187.
Lee, G.H., Watkins, J.S., Bryant, W.R., 1996. Bryant Canyon Fan System: anunconfined, large river-sourced system in the northwestern Gulf of Mexico.AAPG Bull. 80, 340–358.
Lee, M.W., Collett, T.S., 2008. Integrated analysis of well logs and seismic data toestimate gas hydrate concentrations at Keathley Canyon, Gulf of Mexico. Mar.Petr. Geol. 25, 924–931.
MacDonald, I.R., Guinasso Jr., N.L., Ackleson, S.G., Amos, J.F., Duckworth, R.,Sassen, R., Brooks, J.M., 1993. Natural oil slicks in the Gulf of Mexico visible fromspace. J. Geophys. Res. 98, 16,351–16,364.
MacDonald, I.R., Guinasso, N.L., Sassen, R., Brooks, J.M., Lee, L., Scott, K.T., 1994.Gashydrate that breaches the sea floor on the continental slope of the Gulf ofMexico. Geology 22, 699–702.
MacDonald, I.R., Reilly Jr., J.F., Best, S.E., Venkataramaiah, R., Sassen, R., Guinasso Jr., N.L., Amos, J., 1996. Remote sensing inventory of active oil seeps andchemosynthetic communities in the northern Gulf of Mexico. In: Schumacher, D., Abrams, M.A. (Eds.), AAPG Memoir, 66, pp. 27–37.
MacDonald, I.R., Sager, W.W., Peccini, M.B., 2003. Gas hydrate and chemosyntheticbiotain mounded bathymetry at mid-slope hydrocarbon seeps; northern Gulf ofMexico. Mar. Geol. 198, 133–158.
Max, M.D., Johnson, A.H., Dillon, W.P., 2006. Economic Geology of Natural GasHydrate. Springer, Dordrecht,, 341 pp.
Nehring, R., 1991. Oil and gas resources. In: Salvador, A. (Ed.), The Gulf of MexicoBasin. The Geology of North America, vol. J. GSA, Boulder, CO, pp. 445–494.
Nimblett, J., Ruppel, C., 2003. Permeability evolution during the formation ofgas hydrates in marine sediments. J. Geophys. Res. 108, 2420. 2410.1029/2001JB001650.
Peel, F.J., Travis, C.J., Hossack, J.R., 1995. Genetic structural provinces and salttectonics of the Cenozoic offshore U.S. Gulf of Mexico; a preliminary analysis.In: Jackson, M.P.A., Roberts, D.G., Snelson, S. (Eds.), Salt Tectonics. AAPG Memoir65, 153–175.
Pflaum, R.C., Brooks, J.M., Cox, H.B., Kennicutt, M.C.S.D.D., 1986. Molecular andIsotopic Analysis of Core Gases and Gas Hydrates. DSDP Leg 96. Initial ReportsDSDP 96. US Govt. Print. Off., Washington, D.C., pp. 781–784.
Pindell, J., Dewey, J.F., 1982. Permo-Triassic reconstruction of western Pangea andtheevolution of the Gulf of Mexico/Caribbean region. Tectonics 1, 179–211.
Prather, B.E., Booth, J.R., Steffens, G.S., Craig, P.A., 1998. Classification, lithologiccalibration, and stratigraphic succession of seismic facies of intraslope basins,deep-water Gulf of Mexico. AAPG Bull. 82, 701–728.
Reidel, M., Collett, T.S., Malone, M.J., Expedition.311.Scientists, 2006. Gas hydratetransect across northern Cascadia margin. EOS, Trans. AGU 87 (33), 325–330. 332.
Roberts, H., 1995. High resolution surficial geology of the Louisiana middle-to-upper continental slope. Trans. Gulf Coast Assoc. Geol. Soc. XLV, 503–508.
Roberts, H.H., 2001. Fluid and gas expulsion on the northern Gulf of Mexico con-tinental slope; mud-prone to mineral-prone responses. In: Paull, C.K., Dillon, W.(Eds.), Natural Gas Hydrates: Occurrence, Distribution and Detection. AmericanGeophysical Union Monograph, vol. 124, pp. 145–161. Washington, D.C.
Roberts, H.H., Aharon, P., 1994. Hydrocarbon-derived carbonate buildups of thenorthern Gulf of Mexico continental slope; a review of submersibleinvestigations. Geo Mar. Lett. 14, 135–148.
Roberts, H.H., Carney, R.S., 1997. Evidence of episodic fluid, gas, and sedimentventing on the northern Gulf of Mexico continental slope. Econ. Geol. 92,863–879.
Roberts, H.H., Weimer, P., Rowan, M.G., 1998. Subsurface controls on seafloorvent/seep-related geology, deepwater Gulf of Mexico: initial results. In: Prouty,J.S., Price, K.H., Henderson, V.W. (Eds.). Trans. Gulf Coast Assoc. Geol. Soc. 48,367–372.
Rowe, M.M., Gettrust, J.F., 1993. Fine structure of methane hydrate-bearingsediments on the Blake Outer Ridge as determined from deep-tow multi-channel seismic data. J. Geophys. Res. 98, 463–473.
Sager, W.W., MacDonald, I.R., Hou, R., 2003. Geophysical signatures of mud moundsat hydrocarbon seeps on the Louisiana continental slope, northern Gulf ofMexico. Mar. Geol. 198, 97–132.
Sager, W.W., MacDonald, I.R., Hou, R., Sager, W.W., Bryant, W.R., Doyle, E.H., 2004.Side-scan sonar imaging of hydrocarbon seeps on the Louisiana continentalslope. AAPG Bull. 88, 725–746.
Salvador, A., 1987. Late Triassic–Jurassic paleogeography and origin of Gulf ofMexico Basin. AAPG Bull. 71, 419–451.
Salvador, A., 1991. Origin and development of the Gulf of Mexico basin. In:Salvador, A. (Ed.), The Gulf of Mexico Basin. The Geology of North America, vol.J. GSA, Boulder, CO, pp. 389–444.
Sassen, R., MacDonald, I.R., 1997. Hydrocarbons of experimental and natural gashydrates, Gulf of Mexico continental slope. Org. Geochem. 26, 289–293.
Sassen, R., MacDonald, I.R., Guinasso Jr., N.L., Joye, S., Requejo, A.G., Sweet, S.T.,Alcala-Herrera, J., DeFreitas, D.A., Schink, D.R., 1998. Bacterial methane oxida-tion in sea-floor gas hydrate: significance to life in extreme environments.Geology 26, 851–854.
Sassen, R., Sweet, S.T., Milkov, A.V., DeFreitas, D.A., Kennicutt II, M.C., Roberts, H.H.,2001. Stability of thermogenic gas hydrate in the Gulf of Mexico; constraints onmodels of climate change. In: Paull, C.K., Dillon, W. (Eds.), Natural Gas Hydrates:Occurrence, Distribution and Detection. American Geophysical Union Mono-graph, vol. 124, pp. 131–143. Washington, D.C.
Sassen, R., Roberts, H.H., Carney, R., Milkov, A.V., DeFreitas, D.A., Lanoil, B., Zhang, C.L., 2004. Free hydrocarbon gas, gas hydrate, and authigenic minerals inchemosynthetic communities of the northern Gulf of Mexico continental slope:relation to microbial processes. Chem. Geol. 205, 195–217.
Snyder, F.F.C., Muller, L.K., Dutta, N., Hutchinson, D.R., Hart, P.E., Lee, M.W., Dugan, B.,Ruppel, C., Wood, W.T., Coffin, R., Evans, R., Jones, E.H., 2004. Seismic analysisand characterization of gas hydrates in the northern deepwater Gulf of Mexico.AAPG Bull. 88 (No. 13, Suppl.) Available from: http://www.searchanddiscovery.com/documents/abstracts/annual2004/Dallas/Snyder.htm.
Suter, J.R., Berryhill Jr., H.L., 1985. Late quaternary shelf-margin deltas, NorthwestGulf of Mexico. AAPG Bull. 69, 77–91.
Trehu, A.H., Long, P.E., Torres, M.E., Bohrmann, G., Rack, F.R., Collett, T.S.,Goldberg, D.S., Milkov, A.V., Riedel, M., Schultheiss, P., Bangs, N.L., Barr, S.R.,Borowski, W.S., Claypool, G.E., Delwiche, M.E., Dickens, G.R., Gracia, E.,Guerin, G., Holland, M., Johnson, J.E., Lee, Y.J., Liu, C.S., Su, X., Teichert, B.,Tomaru, H., Vanneste, M., Watanabe, M., Weinberger, J.L., 2004. Three-dimensional distribution of gas hydrate beneath southern hydrate ridge:constraints from ODP Leg 204. Earth Planet. Sci. Lett. 222, 845–862.
Whelan, J.K., Eglington, L., Cathles, L.I., Losh, S.L., Roberts, H., 2005. Surface andsubsurface manifestations of gas movement through a N–S transect of the Gulfof Mexico. Mar. Petrol. Geol. 22, 479–497.
Winker, C.D., Booth, J., 2000. Sedimentary dynamics of the salt-dominated continentalslope, Gulf of Mexico: integration of observations from the seafloor, near-surface,and deep subsurface. In: Proceedings of the GCSSEPM Foundation 20th AnnualResearch Conference, Deep-water Reservoirs of the World, pp. 1059–1086.
Xu, H., Dai, J., Snyder, F., Dutta, N., 2004. Seismic detection and quantification of gashydrates using rock physics and inversion. In: Taylor, C.E., Kwan, J.T. (Eds.),Advances in the Study of Gas Hydrates. Kluwer, New York, pp. 117–139.
Xu, W., Ruppel, C., 1999. Predicting the occurrence, distribution, and evolution ofmethane gas hydrate in porous marine sediments. J. Geophys. Res. 104,5081–5096.
Related Documents


![[p.T] Petroleum Development Geology](https://static.cupdf.com/doc/110x72/577d34871a28ab3a6b8e3c29/pt-petroleum-development-geology.jpg)