DEVELOPMENT OF NATURAL PRODUCT BASED FLOCCULANT AGENT TO TREAT PETROLEUM REFINERY INDUSTRY WASTEWATER MARIA!! BINTI CHE MAMAT Thesis submitted in partial fulfilment of the requirements for the award of the degree of Bachelor of Chemical Engineering (Pure) Faculty of Chemical & Natural Resources Engineering UNIVERSITI MALAYSIA PAHANG JANUARY 2015 ©MARIAH BINTI CHE MAMAT (2015) III

Welcome message from author
This document is posted to help you gain knowledge. Please leave a comment to let me know what you think about it! Share it to your friends and learn new things together.
Transcript

DEVELOPMENT OF NATURAL PRODUCT BASED
FLOCCULANT AGENT TO TREAT PETROLEUM
REFINERY INDUSTRY WASTEWATER
MARIA!! BINTI CHE MAMAT
Thesis submitted in partial fulfilment of the requirements for the award of the degree of
Bachelor of Chemical Engineering (Pure)
Faculty of Chemical & Natural Resources Engineering UNIVERSITI MALAYSIA PAHANG
JANUARY 2015
©MARIAH BINTI CHE MAMAT (2015)
III

ABSTRACT
Spent caustic or used caustic soda generated from the scrubbing process in the petroleum refinery industry. Treatment is needed for spent caustic because it typically has high chemical demand (COD), oil-grease (OG) and Biochemical oxygen demand (BOD5) concentration, pH and temperature that exceeded the limit of Department of Environment (DOE) regulations. In this study, the spent caustic was treated by using adsorption method by using natural product such as charcoal and coconut husk based flocculants agent in batch mode. The benefits of natural product usage is a green technology approaches and cheaper. The treated spent caustic was tested for its COD, OG and BOD5 concentration, pH also the temperature to determine respectively the percentage of reduëtion measured using Spectrophotometer, Standard 5520B liquid-liquid partition-gravimetric method, Dissolved Oxygen meter (DO meter), and pH meter. Results show COD concentration for untreated spent caustic is at a range of 4910 - 13980 mg/L, OG concentration is 32 - 6285 mg/L, BOD5 concentration at range of 41 - 78 mg/L, pH at a range of 11.9 - 13.0, and temperature at range 20 ° C - 29 ° C. The highest percentages reduction by using charcoal and coconut husk was able to reduce 50.38 % (6885 mg/L) and 45.19 % (7605 mg/L) COD, 46.88 % (17 mg/L) and 21.88 % (25 mg/L) OG, 55.13 % (35 mg/L) and 45.51 % (42 mg/L) BOD5 , 60.05 % (5.15) and 48.02 % (6.70) pH, 20.88 % (23 °C) and 4.0 % (28 °C) temperature respectively. The optimum amount in large scale by using charcoal and coconut husk is 600 g and 800 g based flocculants agent soda ash, alum, and ferum sulphate that have a ratio of 0.05:0.42:0.53 with activated carbon and clay as additional adsorbents that have a ratio of 0.74:0.26, which able to reduced 91.78 % (1140 mg/L) and 81.19 % (2610 mg/L) COD concentration by recycle in eight times respectively. Flocculants agent was used in pre-treatment in order to increase adsorption method efficiency of natural product. Hence, natural product by using charcoal is more efficient than coconut husk. The information obtained from this study is useful for scale up purpose in the petroleum refming industry that choose adsorption method by using natural products based flocculants agent to treat spent caustic wastewater.
VIII

ABSTRAK
Sisa kaustik atau kaustik soda yang telah digunakan, dthasilkan daripada proses menyental dalam industry penapisan petroleum. Rawatan diperlukan untuk sisa kaustik kerana ia biasanya mempunyai nilai keperluan oksigen kimia (COD), mmyak dan gris (OG), oksigen biokimia (BODs), pH dan suhu yang melebihi had yang ditetapkan oleh Jabatan Alam Sekitar (JAS). Dalam kajian mi, sisa kaustik akan dirawat mengunakan kaedah penjerapan dengan mengunakan bahan semulajadi sebagai contoh arang dan sabut kelapa berasaskan ejen gumpalan secara kumpulan. Faedah penggunaan bahan semulajadi adalah sebagai pendekatan teknologi hijau dan murah. Sisa kaustik yang telah dirawat, diuji untuk nilai COD, 0G. BODs, pH juga suhu untuk menentukan peratusan pengurangan masing-masing dengan mengunakan spektrofotometer, Standard 5520B kaedah cair-cecair pembahagian-gravimetrik, meter oksigen terlarut (DO meter), dan meter pH. Kajian menunjukkan nilai COD untuk sisa kaustik yang belum dirawat antara 4910-13980 mg/L, nilai OG adalah 32 - 6285 mg/L, nilai BOD 5 antara 41 - 78 mg/L, nilai pH antara 11.9 - 13.0 dan nilai suhu antara 20 ° C - 29 ° C. Peratusan pengurangan paling tinggi dengan menggunakan arang dan sabut kelapa mampu mengurangkan 50.38 % (6885 mg/L) dan 45.19 % (7605 mg/L) COD, 46.88 % (17 mg/L) dan 21.88 % (25 mg/L) 0G. 55.13 % (35 mg/L) dan 45.51 % (42 mg/L) BOD5, 60.05 % (5.15) dan 48.02 % (6.70) pH, 20.88 % (23 °C) dan 4.0 % (28 °C) suhu masing-masing. Jumlah berat optimum dalam skala yang besar dengan menggunakan arang dan sabut kelapa adalah 600 g dan 800 g berasaskan ejen gumpalan abu soda, aluminium sulfat dan ferum sulfat yang mempunyai purata 0.05:0.42:0.53 dengan karbon teraktif dan tanah hat yang mempunyai purata 0.74:0.26, mampu mengurangkan 91.78 % (1140 mg/L) dan 81.19 % (2610 mg/L) % nilai COD dengan mengulangi sebanyak lapan kahi masing-masing. Ejen gumpalan digunakan dalam pra rawatan dan secara tidak langsung meningkatkan kecekapan kaedah penjerapan oleh bahan semulajadi. Oleh itu, bahan semulajadi dengan menggunakan arang lebih berkesan daripada sabut kelapa. Maklumat yang diperolehi daripada kajian mi, amat berguna untuk peningkatan skala dalam industri penapisan petroleum yang memihih kaedah penjerapan dengan menggunakan bahan semulajadi berasaskan ejen gumpalan untuk merawat air sisa kaustik.
Ix

TABLE OF CONTENTS
SUPERVISOR'S DECLARATION . IV STUDENT'S DECLARATION ................................................................................... V DEDICATION........................................................................................................... VI ACKNOWLEDGEMENT......................................................................................... VII ABSTRACT............................................................................................................. VIII ABSTRAK ................................................................................................................. ix TABLEOF CONTENTS ............................................................................................. X LISTOF FIGURES ................................................................................................... XII LISTOF TABLES ................................................................................................... XIII LIST OF SYMBOLS................................................................................................ XIV LIST OF ABBREVIATIONS.................................................................................... XV 1 INTRODUCTION ................................................................................................. 1
1.1 Motivation and statement of problem .............................................................. 1 1.2 Objectives ....................................................................................................... 3 1.3 Scope of Study................................................................................................ 3 1.4 Main contribution of This Study...................................................................... 4 1.5 Organization of This Thesis............................................................................. 4
2 LITERATURE REVIEW ......................................................................................6 2.1 Chapter Overview ........................................................................................... 6 2.2 Introduction to Spent Caustic .......................................................................... 6 2.3 Natural Product (Charcoal)............................................................................ 10 2.4 Natural Product (Coconut Husk).................................................................... 11 2.5 Chemical Oxygen Demand (COD) ................................................................ 12 2.6 Oil and Grease (OG) ..................................................................................... 15 2.7 Biochemical Oxygen Demand (BOD5) ........................................................... 17 2.8 pH ................................................................................................................. 17 2.9 Treatment Method of Spent Caustic ................................................................ 18 2.10 Adsorption.................................................................................................. 21 2.11 Additional Adsorbents .................................................................................. 24 2.12 Flocculants Agent...................................................................................... 25 2.13 Chapter Summary ...................................................................................... 26
3 MATERIALS AND METHODS .........................................................................27
3.1 Chapter Overview .........................................................................................27
3.2 Introduction .......................................................................... . ......................... 27
3.3 Chemicals .....................................................................................................27
3.4 Additional Adsorbents...................................................................................27
3.5 Natural Products............................................................................................28
3.6 Spent Caustic Wastewater Samples ...............................................................28
3.7 Analysis of Wastewater Samples...................................................................29
3.7.1 Chemical Oxygen Demand.....................................................................29
3.7.2 Oil and Grease .......................................................................................30
3.7.3 Biochemical Oxygen Demand (BOD5)...................................................30
3.7.4 pH & Temperature .................................................................................31
3.8 Preparation of Flocculants Agent (Stock Solution) ........................................32
3.9 Adsorption Method .......................................................................................33
X

3.10 Chapter Summary .34
4 RESULT AND DISCUSSION.............................................................................36 4.1 Experimental Studies..................................................................................... 36
4.1.1 Characteristic of Untreated Spent Caustic............................................... 36 4.1.2 Effect of Additional Adsorbents on the COD Reduction......................... 38 4.1.3 Effect amount of Charcoal on COD, 0G. BOD 5 , pH and Temperature
Reduction of Spent Caustic in Small Lab Scale ...................................... 39 4.1.4 Effect of Recycle on COD concentration Reduction by using Charcoal in
SmallLab Scale ..................................................................................... 41 4. 1.5 Effect amount of Coconut Husk on COD, OG, BOD5 , pH and
Temperature Reduction of Spent Caustic in Small Lab Scale.................. 43 4.1.6 Effect of Recycle on COD concentration Reduction by using Coconut
Husk in Small Lab Scale ........................................................................ 44 4.1.7 Effect of Recycle on COD concentration Reduction by using Charcoal in
BigLab Scale......................................................................................... 46 4.1.8 Effect of Recycle on COD concentration Reduction by using Coconut
Husk in Big Lab Scale............................................................................ 47 4.2 Summary ....................................................................................................... 49
CONCLUSION AND RECOMMENDATION .................................................... 52 5.1 Conclusion.................................................................................................... 52 5.2 Recommendation .......................................................................................... 53
REFRENCES.............................................................................................................. 54 APPENDICES............................................................................................................ 59 Al Calculation for COD Concentration of Untreated Spent Caustic....................... 59 A2 Calculation for OG Concentration of Untreated Spent Caustic ......................... 60 A3 Calculation for BOD5 Concentration of Untreated Spent Caustic...................... 61 A4 COD concentration of Treated Spent Caustic for Each Additional Adsorbent....... 62 AS Calculation for Percentage Reduction of COD Concentration in Treated Spent
Caustic for Each Additional Adsorbent ..................................................... 63 A6 pH, Temperature and COD Concentration of Treated Spent Caustic for Each
NaturalProduct .......................................................................................................... 64 A7 OG Concentration of Treated Spent Caustic for Each Natural Product ............... 65 A8 BOD5 Concentration of Treated Spent Caustic for Each Natural Product............ 66 A9 Calculation for Percentage Reduction of COD Concentration in Treated Spent
Caustic for Each Natural Product........................................................... 67 AlO Calculation for Percentage Reduction of OG Concentration in Treated Spent
Caustic for Each Natural Product......................................................... 68 Al 1 Calculation for Percentage Reduction of BODs Concentration in Treated Spent
Caustic for Each Natural Product......................................................... 69 Al 2 Calculation for Percentage Reduction of pH Concentration in Treated Spent
Caustic for Each Natural Product.......................................................... 70 A13 Calculation for Percentage Reduction of Temperature Concentration in Treated
Spent Caustic for Each Natural Product ................................................... 71 A14 COD concentration of Recycled Treated Spent Caustic for Each Natural Product in
Small Lab Scale and Big Lab Scale....................................................... 72 A15 Calculation for Percentage Reduction of COD Concentration in Recycled Treated
Spent Caustic for Each Natural Product in Small Lab Scale and Big Lab Scale........................................................................................... 73
XI

LIST OF FIGURES
Figure 2-1: Effect of spent caustic dumped in city of Abidjan. (Source: TexasTechnologyCorporation, 2012).....................................................................................8
Figure 2-2: Dilution of a dead stream as a result of spent caustic. (Source: Texas TechnologyCorporation, 2012)..................................................................................... 9
Figure 2-3: Charcoal mangrove bark........................................................................... 10
Figure 2-4: Coconut husk used as adsorbent to treat wastewater.................................. 12
Figure 2-5: Wet air oxidation process by Feich et al. (2012) ........................................ 18
Figure 2-6: Adsorption system...................................................................................... 24
Figure 2-7: Schematic representation of aluminium sulphate by Leopold and Freese (n.d) ............................................................................................................................ 25
Figure 3-1: Clay (Left) and activated carbon (Right) ................................................... 28
Figure 3-2: Charcoal (Left) and activated carbon from coconut husk (Right) ............... 28
Figure 3-3: Spent caustic wastewater sample............................................................... 29
Figure 3-4: COD digestion reactor (left) and spectrophotometer (right) ....................... 29
Figure 3-5: Distillation apparatus for determination of OG in spent caustic ................. 30
Figure 3-6: Dissolved Oxygen meter (DO meter)......................................................... 31
Figure3-7: pH meter................................................................................................... 32
Figure 3-8: The stock solution..................................................................................... 33
Figure 3-9: Adsorption apparatus small lab scale (Left) and adsorption apparatus big lab scale(Right)................................................................................................................ 34
Figure 3-10: Overall experimental process flow........................................................... 35
Figure 4-1: Untreated spent caustic wastewater sample ................................. ............... 37
Figure 42: Effect of clay and activated carbon on percentage reduction of COD concentration............................................................................................................... 39
Figure 4-3: Effect amount of charcoal on COD, OG, and BOD5 concentration, pH and temperature reduction in spent caustic ......................................................................... 40
Figure 4-4: Effect recycled of charcoal on COD concentration reduction of spent caustic ................................................................................................... 42
Figure 4-5: Effect amount of coconut husk on COD, OG, and BOD 5 concentration, pH and temperature reduction ........................................................................................... 43
Figure 4-6: Effect recycled of coconut husk on COD concentration reduction of spent caustic......................................................................................................................... 45
Figure 4-7: Effect recycled of coconut husk on COD concentration reduction of spent caustic......................................................................................................................... 47
Figure 4-8: Effect recycled of coconut husk on COD concentration reduction of spent caustic......................................................................................................................... 48
XII

Figure 4-9: Untreated spent caustic (Left) and Treated spent caustic by using charcoal (Right).........................................................................................................................50
Figure 4-10: Untreated spent caustic (Left) and Treated spent caustic by using activated carbon from coconut husk (Right) ...............................................................................51
LIST OF TABLES
Table 2-1: Typical spent caustic composition by Huaman et al. (2008)..........................7
Table 2-2: The composition of coconut husk (Balce, S., 1956) ....................................11
Table 2-3: Advantages and disadvantages of major oxidants used in COD determination byBoyles (1997)..........................................................................................................12
Table 274: Oil and grease concentration from several industries by Cheryan (1998).....15
Table 2-5: Oil and grease test method by Standard Methods for The Examination of Water and Wastewater (2005) .....................................................................................16
Table 2-6: Advantages and disadvantages of commonly used spent caustic treatment by Veerabhadraiah et al. (2011)........................................................................................19
Table 2-7: Comparison among wastewater treatment technologies (Zwain, H.M. et al., 2014)...........................................................................................................................21
Table 2-8: Types of Adsorption ................................................................................... 23
Table 2-9: Typical properties of activated carbon by Leopold and Freese (n.d)............24
Table 2-10: Typical chemical and physical properties of commercially available aluminium sulphate by Leopold and Freese (n.d).........................................................25
Table 4-1: Characteristics of untreated spent caustic....................................................36
Table 4-2: Characteristic comparison of untreated spent caustic with parameter . limits. 38
Table 4-3: Effect amount of charcoal on COD, OG, and BOD5 concentration, pH and temperature reduction ............................................................................ ....................... 40
Table 4-4: Effect recycled of charcoal on COD reduction............................................42
Table 4-5: Effect amount of coconut husk on COD, 00, and BOD5 concentration, pH and temperature reduction ...........................................................................................43
Table 4-6: Effect recycled of coconut husk on COD reduction ..................................... 45
Table 4-7: Effect recycled of charcoal on COD reduction............................................46
Table 4-8: Effect recycled of coconut husk on COD reduction.....................................48
Table 4-9: Highest percentage reduction of COD, OG, BOD 5 , pH and temperature achieved at different amount of natural product ............................................................ 49
XIII

LIST OF SYMBOLS
mg/L milligram per liter % percentage gIL gram per liter °C degree celcius g gram ML mililiter L liter mg milligram m3 meter cubic kg/m3 kilogram per meter cubic Kg kilogram RPM Revolution Per Minute
XIV

LIST OF ABBREVIATIONS
AG25 Acid Green 25 APHA American Public Health Association BOD5 Biochemical Oxygen Demand COD Chemical Oxygen Demand CNS Central Nervous System DOE Department of Environment EPER European Pollutant Emission Register GAC Granular Activated Carbon HR High Range KTU Kerosene Treating Unit LPG Liquefied Petroleum Gas OG Oil and Grease PAC Powdered Activated CarbonTOC Total Organic Carbon TSS Total Suspended Solid USEPA U.S. Environmental Protection Agency
xv

1 INTRODUCTION
1.1 Motivation and statement ofproblem Wastewater from the petroleum refining industry commonly has high chemical oxygen
demand (COD), oil-grease (OG), Biochemical oxygen demand (BOD 5) concentration
and pH. The wastewater can bring harm to the environment if it is released to the water
bodies without treatment. Therefore, the wastewater needs to meet the specification and
requirement of Malaysian's Department of Environment (DOE) before being release to
environment. According to Environment Quality for Sewage and Industrial Effluent
Regulations 1979 Third Schedule (2012), the acceptable conditions for discharge of
Industrial Effluent of standard B, for COD concentration in wastewater is 100 mg/L, for
OG concentration in wastewater is 10 mg/L, for BOD5 concentration in wastewater is
50 mg/L, for pH in wastewater is 5.5 - 9.0 and temperature in wastewater is 40 °C.
Spent caustic is one sort of wastewater in the petroleum refining industry. Spent caustic
is used caustic soda as well-known as sodium hydroxide. It is a made of sodium
hydroxide or potassium hydroxide, water, and contaminants. Spent caustic is a waste
industrial caustic solution that has become spent and is no longer useful (Harrafi et al.,
2012). It is commonly used in petroleum refinery industry and petrochemical industry
as scrubbing solutions for the removal of acid constituents such as hydrogen sulphide
(H2S), cresylic acids, naphthenic acid and mercaptans acids from the refined product
stream (Kumfer et al., 2010). Spent caustic is produced from refinery units such as
Kerosene Treating Unit (KTU) in the petroleum refining industry. Raw kerosene uses
caustic soda to remove cresylic for gasoline, napthenic for commercial kerosene and jet
fuel and hydrogen sulphide (H2S) for Liquefied Petroleum Gas (LPG) spent caustic
which is called refinery spent caustic when the acidic components are often mixed
(Harrafi et al., 2012). Spent caustic from the KTU typically have high COD
concentration, ranging from 50 000 to 150000 mg/L (Feich, Clark & Kumfer, n.d.). This
is because wastewater that contains spent caustic has a high sulfide concentration which
is known as strong oxidant and other chemicals such as cresylic acid, mercaptans, and
sodium salts of napthenic (Kumfer et al., 2010). It is highly toxic to both environment
and human as well. Spent caustic is highly corrosive due to the high pH because it
1

typically has pH more than 12 and sulphide concentration exceeding in 2-3 wt. %
(Heidarinasab & Hashemi, 2011). Furthermore, spent caustic from the KTU have high
OG concentration, ranging from 59 to 72 mg/L (Hawari et al., 2014). Spent caustic also
has high BODs concentration from KTU, ranging 323-33426 mg/L (Attiogbe et al.,
2002).
Releasing of untreated spent caustic can brings harm to the environment because the
acids constituents in a spent caustic are hazardous and corrosive. According to
European Pollutant Emission Register (EPER) and National encyclopaedia (2010), a
high chemical oxygen demand (COD) concentration in the water may be sign of an
oxygen lack, which can harm to fish and other aquatic species that need oxygen to live
(as cited in Chemical Oxygen Demand (COD-Cr), n.d). Furthermore, if wastewater that
contains high oil and grease (OG) concentration is discharged into water bodies, it can
leads to the formation of oil layer which can bring major pollution problem such as
reduction of photosynthesis and penetration. Besides that, it leads to decreased amount
of dissolved oxygen at the bottom of the water and this will give affect the survival of
aquatic life in the water because of there is no oxygen transfer from atmosphere to water
bodies (Alade et al., 2011). Spent caustic has a high of organic matter content or
biochemical oxygen demand (BOD) concentration. If the wastewater discharged into a
river, the bacteria in the river will oxidize the organic matter by consuming oxygen
from water. Therefore, the aquatic species will die because of oxygen deficiency
(Attiogbe et al., 2002).
According to (Texas Technology, 2006), there are a tragedy happen in the Ivory Coast
City of Abidjan about 500 metric tonnes (110000 gallons) of liquid spent caustic were
illegally dumped in the city causing deaths and injuries to local residents. After the
dumping of untreated spent caustic in various sites in the city of Abidjan, about 40000
people reported for medical help, from this tragedy also recorded ten people are died
and 9000 people were injured. Since the incident began in 2006, about 197 million
dollars have been spent on claims and remediation.
Thus, there are several treatment processes of spent caustic where it focuses on the
reduction of COD and other harmful chemical have been developed such as wet air
oxidation, chemical reagent oxidation, chemical reagent oxidation, catalytic oxidation,
2

incineration, chemical precipitation and (Veerabhadraiah et al., 2011). This study aims
to treat spent caustic by using adsorption method by using natural product based
flocculants agent. Several methods in environmental treatment application throughout
the world, adsorption is widely acceptable than the other methods. Among all type of
adsorption materials, adsorption with activated carbon material has been regarded as an
efficient and major technology, but the process is expensive. Therefore, more
approaches have been investigated for the development of low cost adsorbents with a
good sorption capacity to remove heavy metal ions from wastewater. Natural products
have the advantages of large quantities, low cost, and good sorption capacity. They are
always the unutilized materials but they have high potential to be used as adsorbents for
heavy metals removal (Zhang et al., 2014). Besides that, this study also hoped to
provide treatment alternatives and to widen the varieties for treatment of spent caustic in
the petroleum refinery industry.
1.2 Objectives
The following are the objectives of this research:
o This study aims to determine the effectiveness of natural product based
flocculants agent to treat the petroleum refinery industrial wastewater by using
adsorption method.
1.3 Scope of Study
The following are the scope of this research:
i) To analyse the COD, OG, BOD 5 concentration, pH and temperature reading in
wastewater that contains spent caustic from KTU at a petroleum refinery
company by using spectrophotometer, liquid-liquid partition-gravimetric
method, DO meter and pH meter respectively.
ii) To use adsorption method by using natural product based flocculants agent to
treat the spent caustic wastewater samples.
iii) To compare the performance of the natural product based flocculants agent in
terms of its effectiveness in reducing COD, OG, and BOD5 concentration,
pH and temperature reading.
iv) To analyse the COD, OG, BOD5 concentration, pH and temperature reading in
treated spent caustic wastewater.
3
1.4 Main contribution of This Study
The following are the contributions of this study:
i) The effectiveness of using chemical in flocculants agent and additional
adsorbent to reduce COD, 0G. BODs concentration, pH and temperature in
spent caustic wastewater.
ii) The best amount of natural product can be determined by treating spent caustic
wastewater specifically from KTU tank.
iii) This work also will add some options varieties in treating spent caustic from
KTU tank.
1.5 Organization of This Thesis
The structure of the rest of the thesis is outlined as follow:
Chapter 2 presents the literature review of this study. It started with the introduction of
spent caustic where it generally describes the types of spent caustic, typical spent
caustic composition, where does the spent caustic come from and effect spent caustic to
health and environment. This chapter continues introduce the natural product used is
charcoal that described charcoal processing and advantages of charcoal in reducing
heavy metals. Secondly, natural product used is coconut husk that described the
composition coconut husk, and the modification of coconut husk in treating wastewater.
After that, this chapter also introduces COD, where it describes the major oxidants used
in COD determination and the reactions behind the determination of COD.. This chapter
continues with the introduction of OG, BOD5 and pH. This chapter continues with the
treatment method of spent caustic, where the advantages and disadvantages of
commonly used spent caustic treatment have been listed. After that, this chapter also
introduced adsorption methods that have been used for the treatment of spent caustic in
this study. Some brief review on the chemical in additional adsorbent and flocculants
agent has been presented in this chapter.
Chapter 3 talks about material and methodology that have been used in this study. The
chapter is started off with an overview of the chapter and brief introduction about the
chapter. This chapter will brief about the chemicals, the additional adsorbent, the natural
products, the spent caustic wastewater samples and also the analysis of the sample.
4

Method to prepare the flocculants agent as stock solution and also adsorption process
will be explained as well.
This study continues with Chapter 4, where the results and discussions of this study are
presented.
Last but not least, Chapter 5 presents about the conclusion and recommendation of this
study.

2 LITERATURE REVIEW
2.1 Chapter Overview
This chapter introduces spent caustic wastewater. It also shows some previous study on
spent caustic and the treatment method of spent caustic such as wet air oxidation. This
chapter also reviews about the adsorption methods that are used to treat spent caustic
wastewater from KTU tank.
2.2 Introduction to Spent Caustic Caustic soda or commonly known as sodium hydroxide are used in the petroleum
refining industry and the petrochemical industry as scrubbing solutions for the removal
of acidic compounds. The spent caustic is produced continuously almost 85% by
volume in the treatment of kerosene (Ruaman et al., 2008). According to "Analysis of
Oxygen in Wet Air Oxidation of Spent Caustic Effluents" (n.d.), spent caustic typically
comes from the production of ethylene and the oil refining process, where aqueous
sodium hydroxide was consumed for the scrubbing of cracked gas. Furthermore, sodium
hydroxide also was used for the extraction or treatment of acidic impurities, such as
hydrogen sulphide (H2S), mercaptans and organic acids in hydrocarbon streams. Caustic
soda generally was used in ethylene plants in the petrochemical industries to remove
acid gases such as hydrogen sulphide (H2 S) and carbon dioxide (CO2) from the ethylene
gas (Maugans et al., 2010). In oil refinery, the spent caustic has a high pH which is
more than 12 and sodium concentration in 5-12% by weight (Alnaizy, 2008). Caustic
soda was generally used to remove hydrogen sulphide (H 2 S) and organic sulphur
compounds from hydrocarbon streams in the petroleum refining industry (Sipma et al.,
2004). Therefore, spent caustic is generated once the caustic soda has reacted and
removed undesired chemicals from the streams.
There are three types of spent caustic from petroleum refinery which are sulfidic spent
caustics, cresylic spent caustic and naphthenic spent caustics. Ethylene or liquefied
petroleum gas (LPG) produced sulfidic spent caustics that contain high concentrations
of sulphides and mercaptans from the caustic scrubbing (Kumfer et al., 2010). Cresylic
as well-known as phenolic spent caustics is generated when scrubbing of cracked gases
or gasoline is produced by fluidized bed catalytic cracking process with caustic that

contains phenols, cresols and xylenes with sulphides (Veerabhadraiah et al., 2011).
Naphthenic spent caustic produced from the caustic scrubbing of kerosene and diesel
products containing high concentrations of polycyclic organic compounds such as
naphthenic acids (Kumfer et al., 2010). In this study, the main focus is naphthenic spent
caustic which comes from the KTU. In the KTU, by using 1.5-2% solution of caustic
soda the raw kerosene is pre-washed to neutralize both the hydrogen sulphide (H2S) and
the naphthenic acids that present in the raw kerosene (Prakash, 2003). The scrubbing
process of raw kerosene by caustic soda are necessary to meet the acidity, mercaptan
and other specifications required for upgrading raw kerosene to jet fuel products which
is commercial kerosene, that are used by air transportations (Mohamadbeigy et al.,
2006).
Generally, spent caustic have different compositions that depended on the scrubbing
process. Table 2-1 shows the typical chemical characteristics of three types of spent
caustic.
Table 2-1: Typical spent caustic composition by Huaman et al. (2008)
Reported as (gIL)
Sulfidic Spent Caustics
Naphthenic Spent Caustics
Cresylic Spent Caustics
Chemical 02 7-110 50-100 165-230 Oxygen Demand, COD Total Organic C 0.02-4 11-25 23-60 Carbon, TOC Sulfide 5 2-53 <0.001 0-64 Sulfite S 0.002-0.48 0.004-0.009 0.8-1.6 Mercaptans CH3SH 0-28 <0.03 0-5.4 Thiosulfate S203 0-3.7 0.07-0.13 10-12 Iron Fe 0.005-0.025 0.025-0.03 0.025-0.03 Total Phenols C61160 0.003-0.02 2-10 14-20
("Acids and Caustic from Petroleum Refining Category", 2009) described spent caustic
solutions have high chemical oxygen demand as a result of all dissolved organics
present in the spent caustic. Depending upon the type and the composition of spent
caustic and for easy discussion, there are some effect of spent caustic to health and
environment. Sulphides and mercaptans have very strong odours. The odour thresholds
for these types of compound are generally in the order of magnitude of parts per billion.
Furthermore, hydrogen sulphide is very insidious because at low concentration as 30
mgIL make it destroys the sense of smell. At low concentration of 700 mg/L, death can
7

occur with a few breaths (Draper & Stark, 2012). Besides that, spent caustic wastewater
can cause serious corrosion to the eyes and it also lead to corneal capacity. It may also
cause serious irritation, redness and tearing, blurred vision and conjunctivitis and at last
blindness. Inflammation and blistering can produce if skin contact occurs. Severe bums
with deep ulcerations will happen. More than that, severe irritation of the respiratory
such as characterized by coughing, choking or shortness of breath can produced from
inhalation of mist or spray of spent caustic. In addition, inhalation of high
concentrations may cause central nervous system (CNS) depression or chemical
pneumonitis. In worst cases, it may cause immediate coma and death. It is fatal or
harmful when swallowed. As shown in Figure 2-1 the pictures of effect of spent caustic
dumped in city of Abidjan.
Figure 2-1: Effect of spent caustic dumped in city of Abidjan. (Source: Texas Technology Corporation, 2012)
There are some effects of spent caustic to environment. Spent caustic typically has high
toxicity to aquatic organism if releasing to water bodies due to an increase in pH. If
spent caustic is released to water or soil, constituents will remain in the soil because it is
not likely to volatilize to the atmosphere. Fate in the soil will depend on the amount
8
released of the receiving medium. Some constituents may display high mobility depend
on the properties of soil. (Philips, 2010) stated at a slower rate, the higher chain alpha
olefins may partition to the soil and sediment where degradation will occur. Therefore,
spent caustic can cause issues in biological treatment process. According to
(Heidarinasab & Hashemi, 2011) phenol in low concentrations as 400 mg/L have been
shown to inhibit the removal of COD, phosphorous and ammonia as well as contribute
negatively impact the settling characteristics of the sludge. As shown in Figure 2-2
dilution of a dead stream as a result of spent caustic.
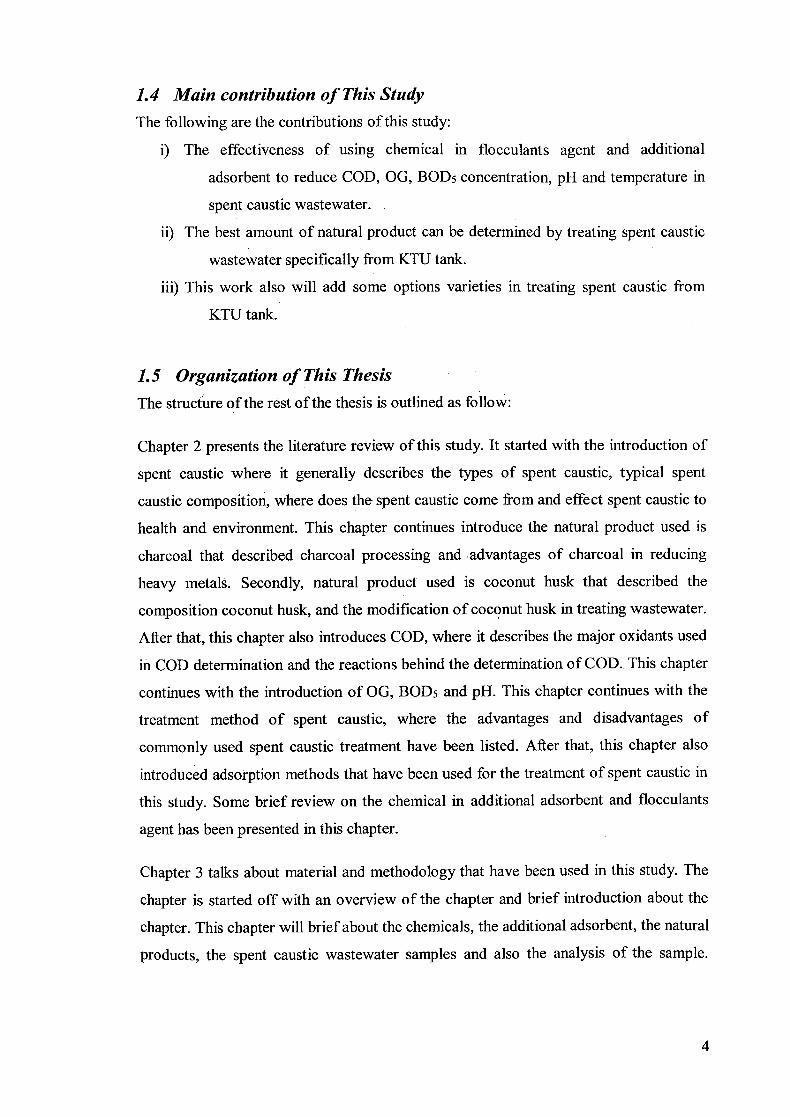
Figure 2-2: Dilution of a dead stream as a result of spent caustic. (Source: Texas Technology Corporation, 2012)
The spent caustic solution has high alkalinity and corrosively that may contribute to
health and environmental hazards. According to "Analysis of Oxygen in Wet Air
Oxidation of Spent Caustic Effluents" (n.d.), spent caustic is highly corrosive, have high
contaminants, have a significant odour source and therefore disruptive to the operation
of any downstream bio treatment facility and an environmental hazard that needs
processing. In this study, chemical oxygen demand (COD) concentration, oil-grease
(OG) concentration, biochemical oxygen demand (BOD5) concentration, pH and
temperature of spent caustic are being emphasized.
23 Natural Product (Charcoal)
Charcoal is widely used solid to remove pollutants in wastewater due to its own
characteristic such as high porosity, chemical structure and high surface area (Singh, U.
& Khausal, R.K., 2013). Charcoal from mangrove barks (Rhizophora apiculata) is
potential useful material as an adsorbent for removal of heavy metal. Charcoal as well-
known as activated carbon is commonly used adsorbent in wastewater treatment.
Generally, charcoal is provided from the factory making charcoal which is mangrove
bark needs processing. wildshores (2009) stated that the logs are placed in a kiln usually
in a shape like igloo. Then, the logs are smoked to remove the water from them. Other
mangrove wood is burnt such as non-Rhizophora species like Bruguiera is used to
create the smoke. As the mangrove timber are used for the production of charcoal,
during the production of charcoal the mangrove wood was debarked to reduce the ash
content of the charcoal produced (Rozaini C.A et al., 2010). Besides that, Rozaini C.A
et al., (2010) stated bark has high content of polyhydroxy polyphenolic group and
effectively to remove dye ions from water. Bark also contain carboxylic group which
can bonding dye ions by ion- exchange mechanisms. According to (Rumidatul and Alfi,
2006) reported that charcoal from wood as an adsorbent in wastewater treatment can
reduced 98.03% Biochemical Oxygen Demand (BOD5), 97.66% total suspended solid
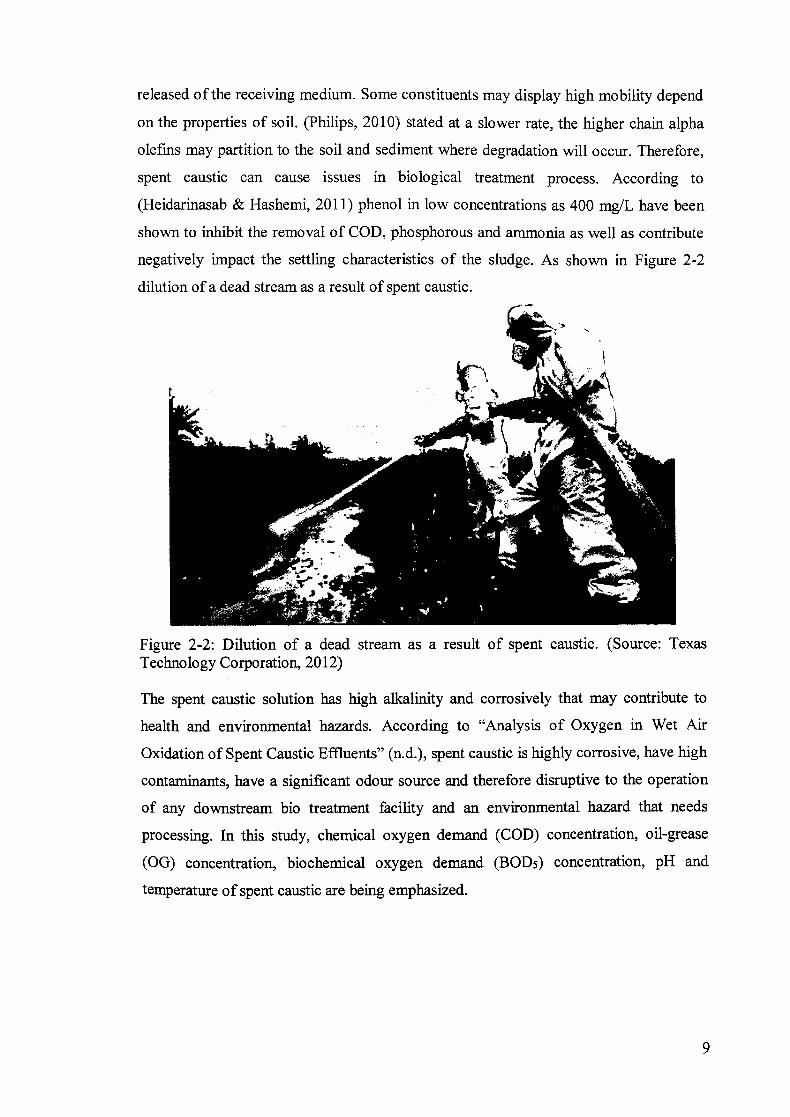
and 76.92% oil and grease (OG). Charcoal mangrove bark as shown in Figure 2-3 can
be used to treat heavy metal..
Figure 2-3:. Charcoal mangrove bark
10

2.4 Natural Product (Coconut Husk)
Coconut husk is a one type of adsorbent has capacity for removal several of pollutant.
Coconut husk is the mesocorp of coconut and it consists of 33-35% of husk. In
Malaysia, the land was being used for coconut plantation in year 2001 is about 151000
ha. Almost 5280 kg of dry husk were become available per hectare per year (Tan,
I.A.W. et al., 2008). The characteristic of coconut husk is 5-10 cm thick fibrous that
covering coconut fruit which 3.5 mm thickness of shell structure. The average weight of
coconut husk is 0.4 kg (Tejano, E.A, 1985). The composition of coconut husk is shown
in Table 2-2.
Table 2-2: The composition of coconut husk (Balce, S., 1956)
Constituent Percent (%) Moisture 15.0
Lignin 43.0 Ash 8.26
Alkalinity 37.5
According to (Tan, I.A.W. et al., 2008) coconut husk is widely used as a fuel for
coconut processing. Furthermore, it is used as a domestic fuel and also as a source of
fibre for rope and mats. Coconut husk is cheap and abundant agricultural waste and
proposed to convert coconut husk into activated carbon is better. Many researchers have
done the research by using agricultural waste in adsorption of heavy metals. The
coconut husk either treated or untreated was used as adsorbent to remove the Acid
Green 25 (AG25) dye from aqueous solution (Abdul Halim, H. N. & Mohd Yatim, N.S,
2011). They reported that coconut husk treated is more effective in removing anionic
dye (AG25) from synthetic wastewater. Other than that, activated carbon also can
produce by coconut husk. According to Tan, I.A.W. et al., (2008) stated coconut husk
based activated carbon can use in removal of 2, 4, 6-trichiorophenol (2, 4, 6-TCP) from
aqueous solution. The performance of coconut husk based activated carbon is 97.52%
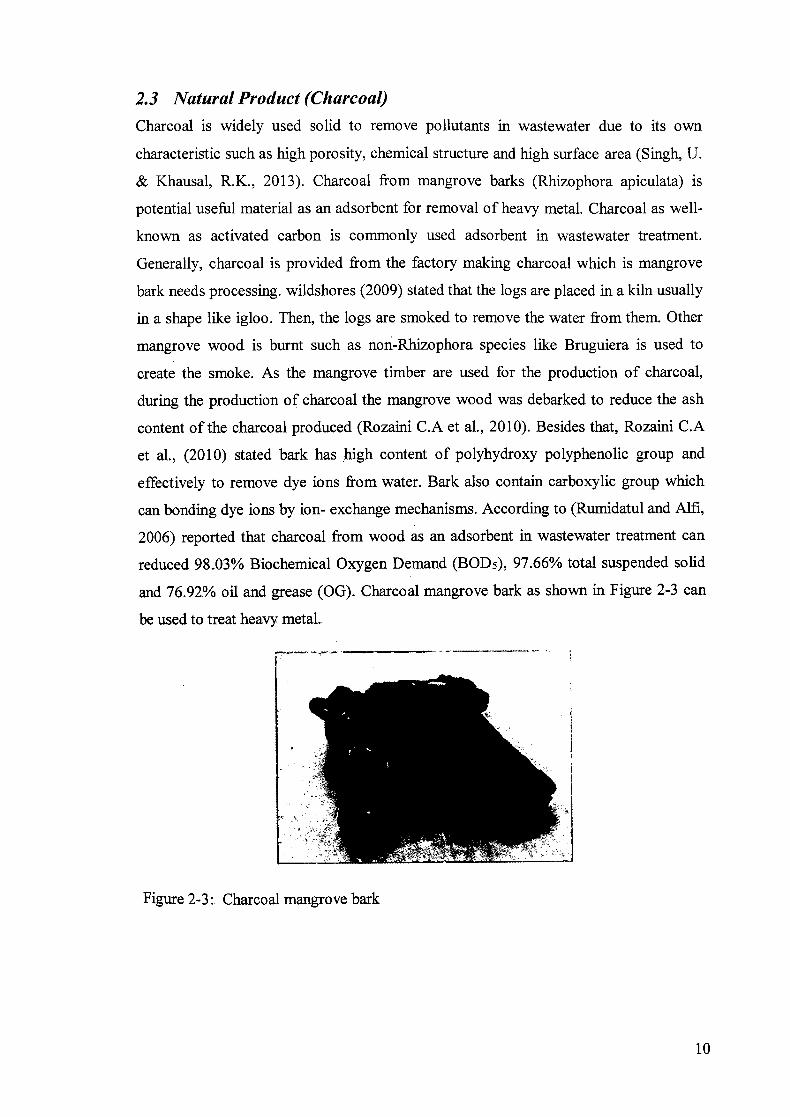
of removal efficiency for 200 mg/L concentration of solution. As shown in Figure 2-4 is
the coconut husk used as an adsorbent to treat wastewater.
11
Figure 2-4: Coconut husk used as adsorbent to treat wastewater
2.5 Chemical Oxygen Demand (COD) Chemical oxygen demand (COD) in spent caustic is one of the chemical characteristic
that being tested in this study. COD has been one of the important parameters in the
wastewater treatment. According to Boyles (1997), Chemical oxygen demand is defined
as a measure of the oxygen equivalent of the organic matter content of a sample that is
susceptible to oxidation by a strong chemical oxidant. Boyles (1997) also described that
the chemical oxygen demand test uses a strong chemical oxidant in an acid solution and
heat to oxidize organic carbon to carbon dioxide (CO2) and water (H 20). The reaction
mechanism can be summarized in equation (2.1):
Organic carbon .+ Oxidant CO + H20 (2.1)
There are many chemicals that have been used as a strong oxidant in COD test such as
potassium permanganate (KMn04), cerium (IV) sulfate (Ce(SO4)2), potassium
thiosulfate (K2S20), potassium iodate (K103), oxygen (02), potassium dichromate
(K2Cr207), manganese (III) sulfate (Mn(SO4)3). Each of the major oxidants used in
COD determination have their own advantages and disadvantages, which can be
summarized in Table 2-3.
Table 2-3: Advantages and disadvantages of major oxidants used in COD determination by Boyles (1997)
Oxidant - Advantages Disadvantages KMnO4 . Stable for several . Relatively slow-
months, Mn02 acting and is not must be excluded quantitative Is used in acidic, . Results may depend neutral and basic upon
IN

media sample size • Manganese is a • Does not oxidize
non-hazardous volatile metal acids or amino acids
• Incomplete oxidation of organic compounds
• Unstable in solution: Forms Mn02 precipitate which catalyzes reagent spending decomposition
Ce (SO4)2 • More complete • Incomplete oxidation of organic oxidation of many compounds organic compounds
• More stable than than KMn04 KMn04 • Poor reproducibility
• Photometric measurement at 320 NM where incompletely oxidized organic compounds interfere
• Relatively expensive
K2S20 • Oxidizes many • Requires elaborate organic nitrogen- equipment containing compounds more
• Widely used with completely than TOC other oxidants instrumentation • More labour
intensive • Relatively unstable
K103 • Strong oxidant • Difficult to use • Questionable
accuracy 02 • Oxygen • Elaborate
consumption equipment required measured directly
K2Cr207 • Accomplishes a • Some organic complete oxidation compounds are only when used with a partially oxidized catalyst and a two- • Some organic hour digestion compounds such as period. pyridine are not
• Stable at room oxidized temperature when • There can be protected from interference from
13

exposure to light NM(SO4)3 • One hour digestion
period • Correlates very well
with Dichromate COD and BOD test results • Is not
photosensitive • Is stable at room
temperature • Reagent contains no
hazardous metals and generates no hazardous metal waste
inorganic pollutants, mainly chloride ions
• Carcinogenic • Oxidizes
approximately 80% oxidation of most organic compounds
• Interference of most organic compounds, The reaction temperature is limited by thermal decomposition of the oxidant
The strong oxidants used in this work are potassium dichromate (K2Cr2O7). The
dichromate ions (Cr2012) form orange coloured solutions which will then reduce by
organics to chromic ions (Cr 3+), forming a green solution (Roby, 2007). The reaction
can be summarized in equation (2.2).
Organic + Cr207 2 10. Cr
(2.2) (Orange) (Green)
Spent caustic wastewater specifically from KTU tank has high COD and possibly high
OG concentration as well. (Felch, Clark & Kumfer, n.d.) have reported that spent
caustic wastewater from the KTU tank have high COD concentration ranging from 50
000 to 150000 mg/L, which is very high when compared to the regulation of the
Department of Environment, Malaysia that permits only 100 mg/L of COD
concentration in wastewater to be released to water bodies. According to Sipma et al.
(2004), the formation of elemental sulfur in spent caustic wastewater contributed to high
COD concentration. Hariz et al., (2013) also stated that the high concentrations of sulfur
compound resulting in high concentrations of COD in spent caustic wastewater.
COD is an important parameter for wastewater or surface water testing as it gives
information about the degree of water pollution by organic material ("Chemical Oxygen
Demand of Water", n.d.). Besides that, "Chemical Oxygen Demand" (n.d.) emphasized
that COD measurements are extremely useful to those concerned with water quality
since they represents the amount of oxygen necessary for the aerobic biological
14

oxidation of the organics in water sample to carbon dioxide (CO2) and water (H 20) if it
is assumed the organics are biodegradable. In addition, COD can be related to Total
Organic Carbon (TOC) and its value is about 2.5 times Biological Oxygen Demand
(BOD) value ("Experiment on Determination of Chemical Oxygen Demand", n.d.).
Besides that, the determination of COD was preferred than the determination of BOD as
it only takes about 3 hour to determine the COD concentration of water and wastewater,
compare to usual 5 days required for the measurement of BOD (Nanyang Technological
University, 2004).
2.6 Oil and Grease (0G.)
Oil and Grease (OG) as one of the most important pollutants in the oil processing
wastewater and are the most complicated to remove from the wastewater (Choong, Paul
and Jay (n.d.)). The term "Oil and Grease" has become the popular term replacing the
original term, which was "Fats, Oils and Grease", although both terms refer to the same
wastewater constituents ("Understanding Laboratory Wastewater Tests: I. Organics",
n.d.). OG is defined as any material recovered as a substance soluble in the solvent
(Standard Methods for The Examination of Water and Wastewater, 2005). According to
"Understanding Oil & Grease" (2012), the two main components of OG, which is
petroleum based hydrocarbons, that being referred as nonpolar material and fatty
compounds of animal or vegetable origin. (Irwin et al., 1997) have emphasized that OG
includes not only petroleum oils but also vegetable oils, natural oils, some sediments,
biota and decaying life forms that have high natural oils lipids. (Alade et al., 2011) have
stated that the oil contaminated wastewater comes from varied sources such as crude oil
production, oil refinery, petrochemical industry, metal processing, compressor
condensates, lubricants and cooling agents, car washing and restaurants. Table 2-4
shows the OG concentration from several industries.
Table 2-4: Oil and grease concentration from several industries by Cheryan (1998)
Industrial Sources Oil and Grease Concentration (mg/L) Food processing 3800 Food processing (Fish) 13700 Can Production (Forming) 200000 Wool Scouring 12200 Tanning Waste, Hide Curing 40200 Metal Finishing 6000 Petroleum Refinery 3200 Steel-Rolling Coolant 48700
15
Related Documents