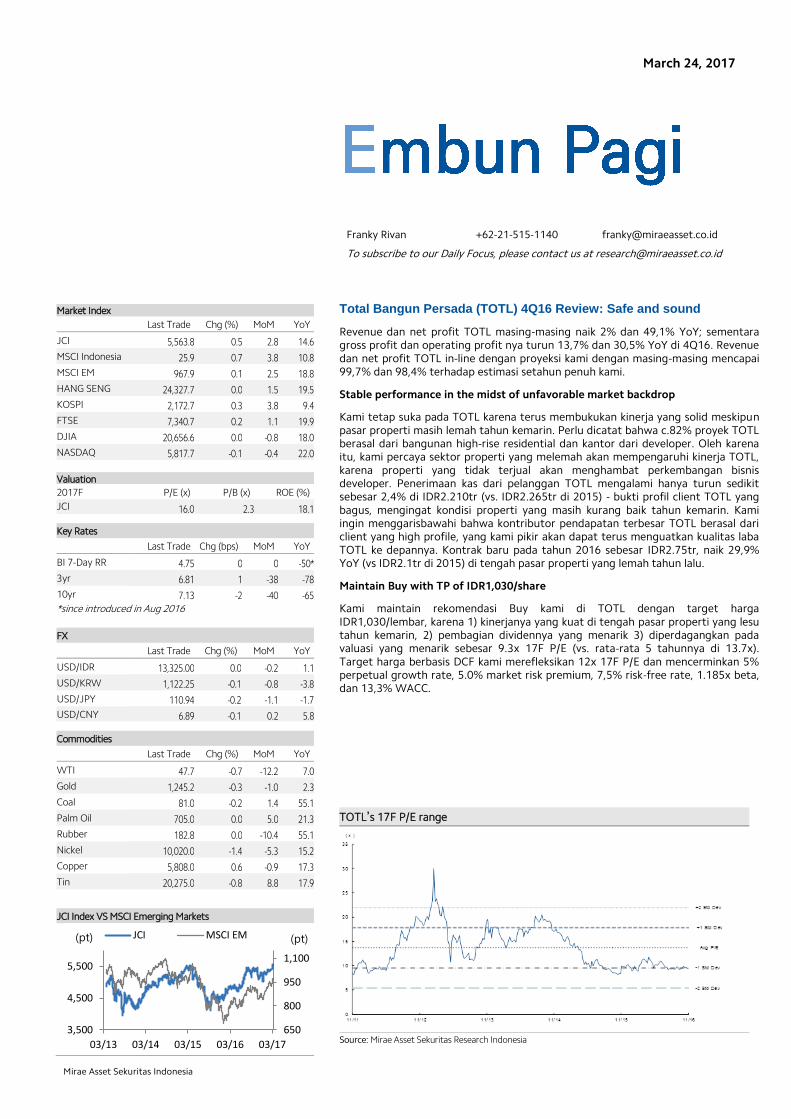
Franky Rivan +62-21-515-1140 [email protected] To subscribe to our Daily Focus, please contact us at [email protected] Mirae Asset Sekuritas Indonesia TOTL’s 17F P/E range Source: Mirae Asset Sekuritas Research Indonesia March 24, 2017 Total Bangun Persada (TOTL) 4Q16 Review: Safe and sound Revenue dan net profit TOTL masing-masing naik 2% dan 49,1% YoY; sementara gross profit dan operating profit nya turun 13,7% dan 30,5% YoY di 4Q16. Revenue dan net profit TOTL in-line dengan proyeksi kami dengan masing-masing mencapai 99,7% dan 98,4% terhadap estimasi setahun penuh kami. Stable performance in the midst of unfavorable market backdrop Kami tetap suka pada TOTL karena terus membukukan kinerja yang solid meskipun pasar properti masih lemah tahun kemarin. Perlu dicatat bahwa c.82% proyek TOTL berasal dari bangunan high-rise residential dan kantor dari developer. Oleh karena itu, kami percaya sektor properti yang melemah akan mempengaruhi kinerja TOTL, karena properti yang tidak terjual akan menghambat perkembangan bisnis developer. Penerimaan kas dari pelanggan TOTL mengalami hanya turun sedikit sebesar 2,4% di IDR2.210tr (vs. IDR2.265tr di 2015) - bukti profil client TOTL yang bagus, mengingat kondisi properti yang masih kurang baik tahun kemarin. Kami ingin menggarisbawahi bahwa kontributor pendapatan terbesar TOTL berasal dari client yang high profile, yang kami pikir akan dapat terus menguatkan kualitas laba TOTL ke depannya. Kontrak baru pada tahun 2016 sebesar IDR2.75tr, naik 29,9% YoY (vs IDR2.1tr di 2015) di tengah pasar properti yang lemah tahun lalu. Maintain Buy with TP of IDR1,030/share Kami maintain rekomendasi Buy kami di TOTL dengan target harga IDR1,030/lembar, karena 1) kinerjanya yang kuat di tengah pasar properti yang lesu tahun kemarin, 2) pembagian dividennya yang menarik 3) diperdagangkan pada valuasi yang menarik sebesar 9.3x 17F P/E (vs. rata-rata 5 tahunnya di 13.7x). Target harga berbasis DCF kami merefleksikan 12x 17F P/E dan mencerminkan 5% perpetual growth rate, 5.0% market risk premium, 7,5% risk-free rate, 1.185x beta, dan 13,3% WACC. Market Index Last Trade Chg (%) MoM YoY JCI 5,563.8 0.5 2.8 14.6 MSCI Indonesia 25.9 0.7 3.8 10.8 MSCI EM 967.9 0.1 2.5 18.8 HANG SENG 24,327.7 0.0 1.5 19.5 KOSPI 2,172.7 0.3 3.8 9.4 FTSE 7,340.7 0.2 1.1 19.9 DJIA 20,656.6 0.0 -0.8 18.0 NASDAQ 5,817.7 -0.1 -0.4 22.0 Valuation 2017F P/E (x) P/B (x) ROE (%) JCI 16.0 2.3 18.1 Key Rates Last Trade Chg (bps) MoM YoY BI 7-Day RR 4.75 0 0 -50* 3yr 6.81 1 -38 -78 10yr 7.13 -2 -40 -65 *since introduced in Aug 2016 FX Last Trade Chg (%) MoM YoY USD/IDR 13,325.00 0.0 -0.2 1.1 USD/KRW 1,122.25 -0.1 -0.8 -3.8 USD/JPY 110.94 -0.2 -1.1 -1.7 USD/CNY 6.89 -0.1 0.2 5.8 Commodities Last Trade Chg (%) MoM YoY WTI 47.7 -0.7 -12.2 7.0 Gold 1,245.2 -0.3 -1.0 2.3 Coal 81.0 -0.2 1.4 55.1 Palm Oil 705.0 0.0 5.0 21.3 Rubber 182.8 0.0 -10.4 55.1 Nickel 10,020.0 -1.4 -5.3 15.2 Copper 5,808.0 0.6 -0.9 17.3 Tin 20,275.0 -0.8 8.8 17.9 JCI Index VS MSCI Emerging Markets 650 800 950 1,100 3,500 4,500 5,500 03/13 03/14 03/15 03/16 03/17 (pt) JCI MSCI EM (pt)

Welcome message from author
This document is posted to help you gain knowledge. Please leave a comment to let me know what you think about it! Share it to your friends and learn new things together.
Transcript
Franky Rivan +62-21-515-1140 [email protected]
To subscribe to our Daily Focus, please contact us at [email protected]
Mirae Asset Sekuritas Indonesia
TOTL’s 17F P/E range
Source: Mirae Asset Sekuritas Research Indonesia
March 24, 2017
Total Bangun Persada (TOTL) 4Q16 Review: Safe and sound
Revenue dan net profit TOTL masing-masing naik 2% dan 49,1% YoY; sementara gross profit dan operating profit nya turun 13,7% dan 30,5% YoY di 4Q16. Revenue dan net profit TOTL in-line dengan proyeksi kami dengan masing-masing mencapai 99,7% dan 98,4% terhadap estimasi setahun penuh kami.
Stable performance in the midst of unfavorable market backdrop
Kami tetap suka pada TOTL karena terus membukukan kinerja yang solid meskipun pasar properti masih lemah tahun kemarin. Perlu dicatat bahwa c.82% proyek TOTL berasal dari bangunan high-rise residential dan kantor dari developer. Oleh karena itu, kami percaya sektor properti yang melemah akan mempengaruhi kinerja TOTL, karena properti yang tidak terjual akan menghambat perkembangan bisnis developer. Penerimaan kas dari pelanggan TOTL mengalami hanya turun sedikit sebesar 2,4% di IDR2.210tr (vs. IDR2.265tr di 2015) - bukti profil client TOTL yang bagus, mengingat kondisi properti yang masih kurang baik tahun kemarin. Kami ingin menggarisbawahi bahwa kontributor pendapatan terbesar TOTL berasal dari client yang high profile, yang kami pikir akan dapat terus menguatkan kualitas laba TOTL ke depannya. Kontrak baru pada tahun 2016 sebesar IDR2.75tr, naik 29,9% YoY (vs IDR2.1tr di 2015) di tengah pasar properti yang lemah tahun lalu.
Maintain Buy with TP of IDR1,030/share
Kami maintain rekomendasi Buy kami di TOTL dengan target harga IDR1,030/lembar, karena 1) kinerjanya yang kuat di tengah pasar properti yang lesu tahun kemarin, 2) pembagian dividennya yang menarik 3) diperdagangkan pada valuasi yang menarik sebesar 9.3x 17F P/E (vs. rata-rata 5 tahunnya di 13.7x). Target harga berbasis DCF kami merefleksikan 12x 17F P/E dan mencerminkan 5% perpetual growth rate, 5.0% market risk premium, 7,5% risk-free rate, 1.185x beta, dan 13,3% WACC.
Market Index
Last Trade Chg (%) MoM YoY
JCI 5,563.8 0.5 2.8 14.6
MSCI Indonesia 25.9 0.7 3.8 10.8
MSCI EM 967.9 0.1 2.5 18.8
HANG SENG 24,327.7 0.0 1.5 19.5
KOSPI 2,172.7 0.3 3.8 9.4
FTSE 7,340.7 0.2 1.1 19.9
DJIA 20,656.6 0.0 -0.8 18.0
NASDAQ 5,817.7 -0.1 -0.4 22.0
Valuation
2017F P/E (x) P/B (x) ROE (%)
JCI 16.0 2.3 18.1
Key Rates
Last Trade Chg (bps) MoM YoY
BI 7-Day RR 4.75 0 0 -50*
3yr 6.81 1 -38 -78
10yr 7.13 -2 -40 -65 *since introduced in Aug 2016
FX
Last Trade Chg (%) MoM YoY
USD/IDR 13,325.00 0.0 -0.2 1.1
USD/KRW 1,122.25 -0.1 -0.8 -3.8
USD/JPY 110.94 -0.2 -1.1 -1.7
USD/CNY 6.89 -0.1 0.2 5.8
Commodities
Last Trade Chg (%) MoM YoY
WTI 47.7 -0.7 -12.2 7.0
Gold 1,245.2 -0.3 -1.0 2.3
Coal 81.0 -0.2 1.4 55.1
Palm Oil 705.0 0.0 5.0 21.3
Rubber 182.8 0.0 -10.4 55.1
Nickel 10,020.0 -1.4 -5.3 15.2
Copper 5,808.0 0.6 -0.9 17.3
Tin 20,275.0 -0.8 8.8 17.9
JCI Index VS MSCI Emerging Markets
650
800
950
1,100
3,500
4,500
5,500
03/13 03/14 03/15 03/16 03/17
(pt) JCI MSCI EM (pt)
650
800
950
1,100
3,500
4,500
5,500
04/13 01/14 10/14 07/15 04/16
(pt) JCI MSCI EM (pt)
March 24, 2017
2
Embun Pagi
Mirae Asset Sekuritas Indonesia
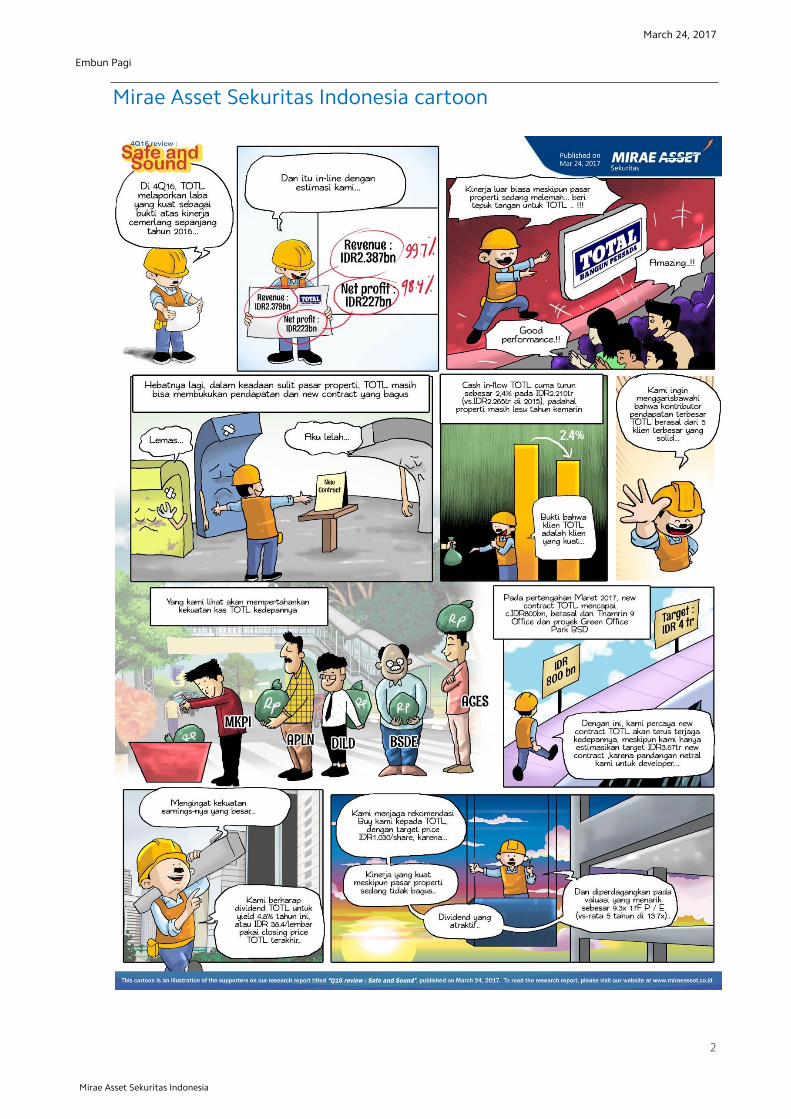
Mirae Asset Sekuritas Indonesia cartoon
March 24, 2017
3
Embun Pagi
Mirae Asset Sekuritas Indonesia
Local flashes
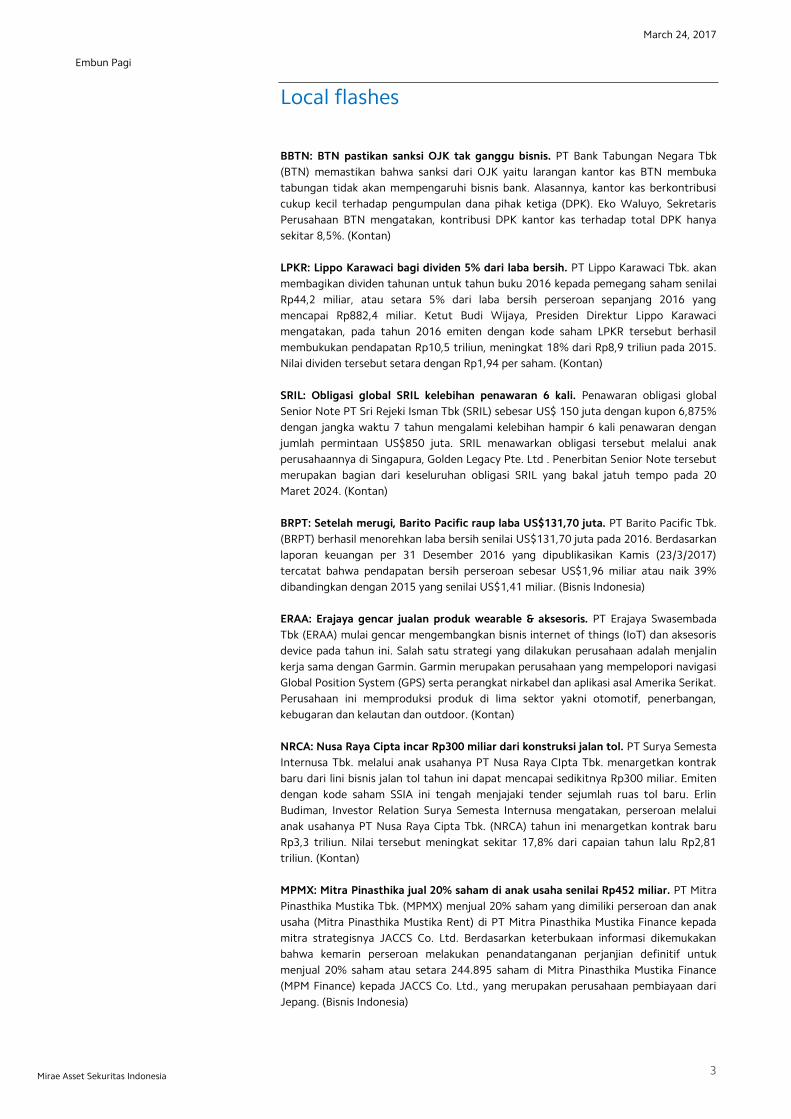
BBTN: BTN pastikan sanksi OJK tak ganggu bisnis. PT Bank Tabungan Negara Tbk
(BTN) memastikan bahwa sanksi dari OJK yaitu larangan kantor kas BTN membuka
tabungan tidak akan mempengaruhi bisnis bank. Alasannya, kantor kas berkontribusi
cukup kecil terhadap pengumpulan dana pihak ketiga (DPK). Eko Waluyo, Sekretaris
Perusahaan BTN mengatakan, kontribusi DPK kantor kas terhadap total DPK hanya
sekitar 8,5%. (Kontan)
LPKR: Lippo Karawaci bagi dividen 5% dari laba bersih. PT Lippo Karawaci Tbk. akan
membagikan dividen tahunan untuk tahun buku 2016 kepada pemegang saham senilai
Rp44,2 miliar, atau setara 5% dari laba bersih perseroan sepanjang 2016 yang
mencapai Rp882,4 miliar. Ketut Budi Wijaya, Presiden Direktur Lippo Karawaci
mengatakan, pada tahun 2016 emiten dengan kode saham LPKR tersebut berhasil
membukukan pendapatan Rp10,5 triliun, meningkat 18% dari Rp8,9 triliun pada 2015.
Nilai dividen tersebut setara dengan Rp1,94 per saham. (Kontan)
SRIL: Obligasi global SRIL kelebihan penawaran 6 kali. Penawaran obligasi global
Senior Note PT Sri Rejeki Isman Tbk (SRIL) sebesar US$ 150 juta dengan kupon 6,875%
dengan jangka waktu 7 tahun mengalami kelebihan hampir 6 kali penawaran dengan
jumlah permintaan US$850 juta. SRIL menawarkan obligasi tersebut melalui anak
perusahaannya di Singapura, Golden Legacy Pte. Ltd . Penerbitan Senior Note tersebut
merupakan bagian dari keseluruhan obligasi SRIL yang bakal jatuh tempo pada 20
Maret 2024. (Kontan)
BRPT: Setelah merugi, Barito Pacific raup laba US$131,70 juta. PT Barito Pacific Tbk.
(BRPT) berhasil menorehkan laba bersih senilai US$131,70 juta pada 2016. Berdasarkan
laporan keuangan per 31 Desember 2016 yang dipublikasikan Kamis (23/3/2017)
tercatat bahwa pendapatan bersih perseroan sebesar US$1,96 miliar atau naik 39%
dibandingkan dengan 2015 yang senilai US$1,41 miliar. (Bisnis Indonesia)
ERAA: Erajaya gencar jualan produk wearable & aksesoris. PT Erajaya Swasembada
Tbk (ERAA) mulai gencar mengembangkan bisnis internet of things (IoT) dan aksesoris
device pada tahun ini. Salah satu strategi yang dilakukan perusahaan adalah menjalin
kerja sama dengan Garmin. Garmin merupakan perusahaan yang mempelopori navigasi
Global Position System (GPS) serta perangkat nirkabel dan aplikasi asal Amerika Serikat.
Perusahaan ini memproduksi produk di lima sektor yakni otomotif, penerbangan,
kebugaran dan kelautan dan outdoor. (Kontan)
NRCA: Nusa Raya Cipta incar Rp300 miliar dari konstruksi jalan tol. PT Surya Semesta
Internusa Tbk. melalui anak usahanya PT Nusa Raya CIpta Tbk. menargetkan kontrak
baru dari lini bisnis jalan tol tahun ini dapat mencapai sedikitnya Rp300 miliar. Emiten
dengan kode saham SSIA ini tengah menjajaki tender sejumlah ruas tol baru. Erlin
Budiman, Investor Relation Surya Semesta Internusa mengatakan, perseroan melalui
anak usahanya PT Nusa Raya Cipta Tbk. (NRCA) tahun ini menargetkan kontrak baru
Rp3,3 triliun. Nilai tersebut meningkat sekitar 17,8% dari capaian tahun lalu Rp2,81
triliun. (Kontan)
MPMX: Mitra Pinasthika jual 20% saham di anak usaha senilai Rp452 miliar. PT Mitra
Pinasthika Mustika Tbk. (MPMX) menjual 20% saham yang dimiliki perseroan dan anak
usaha (Mitra Pinasthika Mustika Rent) di PT Mitra Pinasthika Mustika Finance kepada
mitra strategisnya JACCS Co. Ltd. Berdasarkan keterbukaan informasi dikemukakan
bahwa kemarin perseroan melakukan penandatanganan perjanjian definitif untuk
menjual 20% saham atau setara 244.895 saham di Mitra Pinasthika Mustika Finance
(MPM Finance) kepada JACCS Co. Ltd., yang merupakan perusahaan pembiayaan dari
Jepang. (Bisnis Indonesia)

March 24, 2017
4
Embun Pagi
Mirae Asset Sekuritas Indonesia
Technical analysis
Tasrul +62-21-515-1140 [email protected]
Jakarta Composite Index (JCI) – Limited Upside
IHSG akan menguji resistance di 5,585.
IHSG saat masih dalam pola uptrend jangka pendek relatif valid yang dimulai sejak
selama 49 hari terakhir dengan r-squared = 0.8026 dan bergerak normal dalam rentang
+/-1.32 std.deviasi dari centerline. Peluang IHSG bergerak di luar pergerakan normal
sekitar 19.74% atau sekitar 10 bar chart. Volatilitas normal pergerakan IHSG saat ini
sebesar +/-0.39% atau sekitar +/- 22 point. IHSG saat akan coba naik dan tembus
abnormal upper band sebagaimana terlihat pada Figure 1.
Summary
Item Data Item Data
Close (March 23, 2017) 5,563.8 (+0.5%) Trading range 5,542-5,585
Average index performance (%) 3.74 Target
Period 49 - Daily 5,585
r-squared 0.8026 - Weekly 5,614
Volatility (+/-, %) 0.39 - Monthly 5,629
Volatility (+/-, point) 21.5 Stop loss 5,542
Source: Mirae Asset Sekuritas Indonesia Research
Figure 1. Daily trend - Uptrend
Source: Mirae Asset Sekuritas Indonesia Research
Created w ith AmiBroker - advanced charting and technical analysis softw are. http://w w w .amibroker.com
Optimization Trading System - ©2010 Optimization Trading System - ©2010 Optimization Trading System - ©2010
5,585
5,542
^JKSE - Daily 3/23/2017 Open 5539.64, Hi 5576.67, Lo 5532.65, Close 5563.76 (0.5%) Upper Band = 5,538.96, Channel_prd = 5,492.89, Lower Band = 5,446.83, Upper Band = 5,572.18, Channel_prd = 5,492.89
5,563.76
5,538.96
5,492.89
5,492.89
5,482.8
5,446.83
5,413.61
5,572.18
24 31Nov 14 21 28 Dec 13 19 27 2017 9 16 23 30 Feb 13 20 27 Mar 13 20 Optimization Trading System - ©2010
^JKSE - Volume = 7,359,947,264.00, Avg.Volume = 8,217,658,880.00
7,359,947,264
8,217,658,880

March 24, 2017
5
Embun Pagi
Mirae Asset Sekuritas Indonesia
Aliran dana keluar dan volatilitas indeks turun untuk sementara akan terbatas.
Pada Figure 2, terlihat dari hasil optimalisasi terakhir, indikator MFI akan menguji
support trendline dan indikator W%R optimized naik terbatas dengan volume sekitar
rata-rata, dengan demikian potensi kenaikkan sementara akan terbatas Resistance
terdekat di 5,585 dan support di 5,542 yang sekaligus sebagai stop loss level.
Figure 2. Daily MFI optimized & W%R optimized
Source: Mirae Asset Sekuritas Indonesia Research
Created w ith AmiBroker - advanced charting and technical analysis softw are. http://w w w .amibroker.com
^JKSE - MFI Smoothed = 69.20
69.197
^JKSE - Will%R Smoothed = -14.11
-14.1097
Optimization Trading System - ©2010 Optimization Trading System - ©2010 Optimization Trading System - ©2010 Optimization Trading System - ©2010
5,585
5,542
^JKSE - Daily 3/23/2017 Open 5539.64, Hi 5576.67, Lo 5532.65, Close 5563.76 (0.5%) VWAP = 5,352.21, VWAP = 5,405.16, VWAP = 5,365.02, VWAP = 5,482.80
5,563.76
5,482.8
5,405.16
5,365.02
5,352.21
24 31Nov 14 21 28 Dec 13 19 27 2017 9 16 23 30 Feb 6 13 20 27 Mar 13 20 Optimization Trading System - ©2010
^JKSE - Volume = 7,359,947,264.00, Avg.Volume = 8,217,658,880.00
7,359,947,264
8,217,658,880
March 24, 2017
6
Embun Pagi
Mirae Asset Sekuritas Indonesia
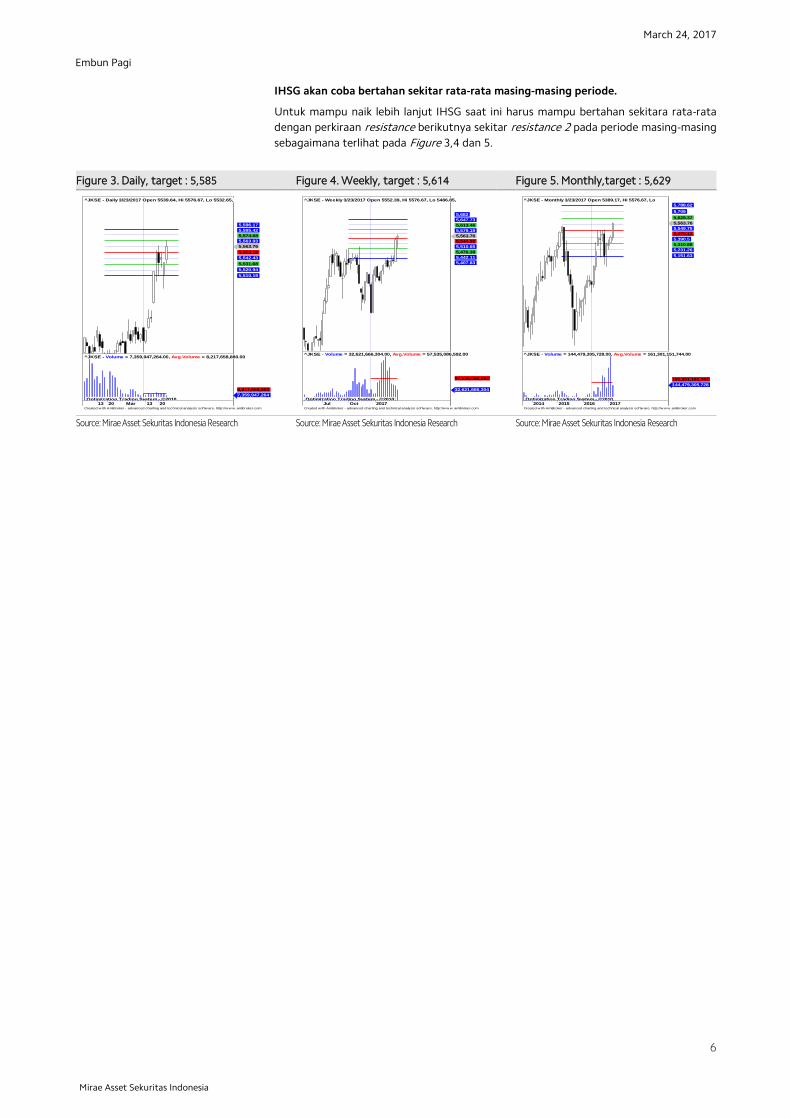
IHSG akan coba bertahan sekitar rata-rata masing-masing periode.
Untuk mampu naik lebih lanjut IHSG saat ini harus mampu bertahan sekitara rata-rata
dengan perkiraan resistance berikutnya sekitar resistance 2 pada periode masing-masing
sebagaimana terlihat pada Figure 3,4 dan 5.
Figure 3. Daily, target : 5,585 Figure 4. Weekly, target : 5,614 Figure 5. Monthly,target : 5,629
x
Source: Mirae Asset Sekuritas Indonesia Research
Source: Mirae Asset Sekuritas Indonesia Research
Source: Mirae Asset Sekuritas Indonesia Research
Created w ith AmiBroker - advanced charting and technical analysis softw are. http://w w w .amibroker.com
^JKSE - Daily 3/23/2017 Open 5539.64, Hi 5576.67, Lo 5532.65,
5,563.76
5,553.18
5,542.43
5,531.68
5,520.94
5,510.19
5,563.93
5,574.68
5,585.42
5,596.17
13 20 27Mar 13 20 Optimization Trading System - ©2010
^JKSE - Volume = 7,359,947,264.00, Avg.Volume = 8,217,658,880.00
7,359,947,264
8,217,658,880
Created w ith AmiBroker - advanced charting and technical analysis softw are. http://w w w .amibroker.com
^JKSE - Weekly 3/23/2017 Open 5552.39, Hi 5576.67, Lo 5486.85,
5,563.76
5,544.92
5,510.65
5,476.38
5,442.11
5,407.83
5,579.19
5,613.46
5,647.73
5,682
Jul Oct 2017 Optimization Trading System - ©2010
^JKSE - Volume = 32,621,666,304.00, Avg.Volume = 57,535,086,592.00
32,621,666,304
57,535,086,592
Created w ith AmiBroker - advanced charting and technical analysis softw are. http://w w w .amibroker.com
^JKSE - Monthly 3/23/2017 Open 5389.17, Hi 5576.67, Lo
5,563.76
5,549.75
5,470.13
5,390.5
5,310.88
5,231.26
5,151.63
5,629.37
5,709
5,788.62
2014 2015 2016 2017 Optimization Trading System - ©2010
^JKSE - Volume = 144,479,305,728.00, Avg.Volume = 161,301,151,744.00
144,479,305,728
161,301,151,744
March 24, 2017
7
Embun Pagi
Mirae Asset Sekuritas Indonesia
Stocks on our focus list
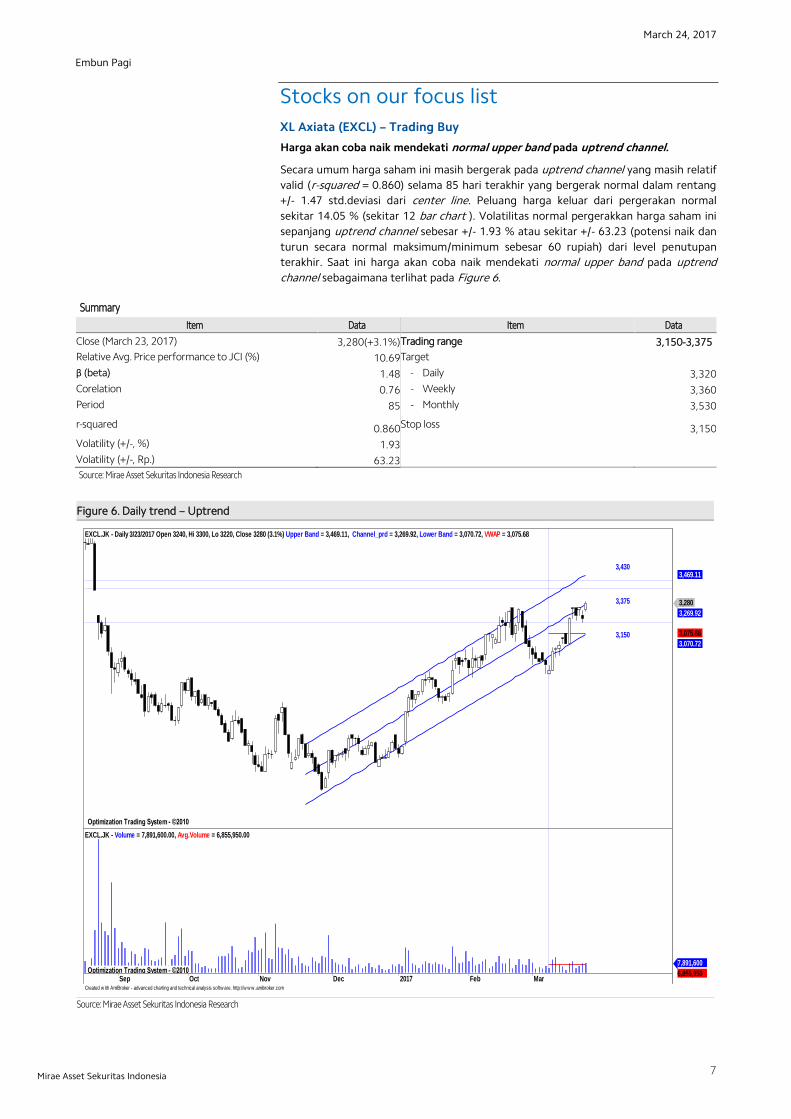
XL Axiata (EXCL) – Trading Buy
Harga akan coba naik mendekati normal upper band pada uptrend channel.
Secara umum harga saham ini masih bergerak pada uptrend channel yang masih relatif
valid (r-squared = 0.860) selama 85 hari terakhir yang bergerak normal dalam rentang
+/- 1.47 std.deviasi dari center line. Peluang harga keluar dari pergerakan normal
sekitar 14.05 % (sekitar 12 bar chart ). Volatilitas normal pergerakkan harga saham ini
sepanjang uptrend channel sebesar +/- 1.93 % atau sekitar +/- 63.23 (potensi naik dan
turun secara normal maksimum/minimum sebesar 60 rupiah) dari level penutupan
terakhir. Saat ini harga akan coba naik mendekati normal upper band pada uptrend
channel sebagaimana terlihat pada Figure 6.
Summary
Item Data Item Data
Close (March 23, 2017) 3,280(+3.1%) Trading range 3,150-3,375
Relative Avg. Price performance to JCI (%) 10.69 Target
β (beta) 1.48 - Daily 3,320
Corelation 0.76 - Weekly 3,360
Period 85 - Monthly 3,530
r-squared 0.860 Stop loss 3,150
Volatility (+/-, %) 1.93
Volatility (+/-, Rp.) 63.23
Source: Mirae Asset Sekuritas Indonesia Research
Figure 6. Daily trend – Uptrend
Source: Mirae Asset Sekuritas Indonesia Research
Created w ith AmiBroker - advanced charting and technical analysis softw are. http://w w w .amibroker.com
Optimization Trading System - ©2010 Optimization Trading System - ©2010
3,150
3,375
3,430
EXCL.JK - Daily 3/23/2017 Open 3240, Hi 3300, Lo 3220, Close 3280 (3.1%) Upper Band = 3,469.11, Channel_prd = 3,269.92, Lower Band = 3,070.72, VWAP = 3,075.68
3,280
3,269.92
3,075.68
3,070.72
3,469.11
Sep Oct Nov Dec 2017 Feb Mar Optimization Trading System - ©2010
EXCL.JK - Volume = 7,891,600.00, Avg.Volume = 6,855,950.00
7,891,600
6,855,950

March 24, 2017
8
Embun Pagi
Mirae Asset Sekuritas Indonesia
Aliran dana masuk dan volatilitas harga naik mulai terlihat.
Pada Figure 7, terlihat dari hasil optimalisasi terakhir, indikator MFI Optimized dan
indicator RSI Optimized cenderung naik dengan volume tembus rata-rata. Hal ini
mengindikasikan potensi kenaikkan masih terlihat. Resistance terdekat di 3,375.
Support terdekat di 3,150 yang sekaligus sebagai stop loss level.
Figure 7. Daily, MFI optimized & RSI optimized
Source: Mirae Asset Sekuritas Indonesia Research
Created w ith AmiBroker - advanced charting and technical analysis softw are. http://w w w .amibroker.com
EXCL.JK - MFI Smoothed = 54.40
54.3962
EXCL.JK - RSI Smoothed = 65.82
65.8171
Optimization Trading System - ©2010
3,270
3,150
3,375
3,430
EXCL.JK - Daily 3/23/2017 Open 3240, Hi 3300, Lo 3220, Close 3280 (3.1%) VWAP = 3,075.68
3,280
3,075.68
17 24 31Nov 14 21 28 Dec 13 19 27 2017 9 16 23 30 Feb 13 20 27 Mar 13 20 Optimization Trading System - ©2010
EXCL.JK - Volume = 7,891,600.00, Avg.Volume = 6,855,950.00
7,891,600
6,855,950

March 24, 2017
9
Embun Pagi
Mirae Asset Sekuritas Indonesia
Harga akan coba naik mendekati resistance 2 pada masing-masing periode.
Untuk naik lebih lanjut harga harus mampu bertahan minimal sekitar rata-rata dengan
target kenaikkan terdekat ke resistance 2 pada masing-masing periode sebagaimana
terlihat pada Figure 8,9 dan 10.
Figure 8. Daily ,target : 3,320 Figure 9. Weekly, target : 3,360 Figure 10. Monthly, target : 3,530
Source: Mirae Asset Sekuritas Indonesia Research
Source: Mirae Asset Sekuritas Indonesia Research
Source: Mirae Asset Sekuritas Indonesia Research
Created w ith AmiBroker - advanced charting and technical analysis softw are. http://w w w .amibroker.com
EXCL.JK - Daily 3/23/2017 Open 3240, Hi 3300, Lo 3220,
3,280
3,260
3,228.39
3,196.77
3,165.16
3,133.54
3,291.61
3,323.23
3,354.84
3,386.46
13 20 27Mar 13 20 Optimization Trading System - ©2010
EXCL.JK - Volume = 7,891,600.00, Avg.Volume = 6,855,950.00
7,891,600
6,855,950
Created w ith AmiBroker - advanced charting and technical analysis softw are. http://w w w .amibroker.com
EXCL.JK - Weekly 3/23/2017 Open 3250, Hi 3300, Lo 3150,
3,280
3,245
3,131.8
3,018.59
2,905.39
2,792.18
3,358.2
3,471.41
3,584.61
3,697.82
Jul Oct 2017 Optimization Trading System - ©2010
EXCL.JK - Volume = 24,021,000.00, Avg.Volume = 37,928,008.00
24,021,000
37,928,008
Created w ith AmiBroker - advanced charting and technical analysis softw are. http://w w w .amibroker.com
EXCL.JK - Monthly 3/23/2017 Open 2980, Hi 3300, Lo 2810,
3,280
3,092.5
2,872.98
2,653.46
2,433.93
2,214.41
3,312.02
3,531.54
3,751.07
3,970.59
2014 2015 2016 2017 Optimization Trading System - ©2010
EXCL.JK - Volume = 107,541,992.00, Avg.Volume = 184,931,696.00
107,541,992
184,931,696

March 24, 2017
10
Embun Pagi
Mirae Asset Sekuritas Indonesia
Bank China Construction Bank Indonesia (MCOR) – Trading Buy
Harga akan coba naik mendekati center line pada uptrend channel .
Secara umum harga saham ini juga masih bergerak dalam pola uptrend channel yang
masih relatif valid (r-squared = 0,854) selama 64 hari terakhir dan bergerak normal
dalam rentang +/- 1.45 std.deviasi dari center line. Peluang harga keluar dari
pergerakan normal sekitar 14.56 % (sekitar 9 bar chart ). Volatilitas normal pergerakan
harga saham ini sepanjang uptrend channel sebesar +/ 4.49 % atau sekitar +/- 13.92
(potensi naik dan turun secara normal maksimum/minimum sebesar 12-14 rupiah) dari
level penutupan terakhir. Saat ini harga akan coba naik mendekati center line pada
uptrend channnel sebagaimana terlihat pada Figure 11.
Summary
Item Data Item Data
Close (March 23, 2017) 310(+6.2%) Trading range 300-340
Relative Avg. Price performance to JCI (%) 13.96 Target
β (beta) 2.80 - Daily 316
Corelation 0.64 - Weekly 322
Period 64 - Monthly 332
r-squared 0.854 Stop loss 290
Volatility (+/-, %) 4.49
Volatility (+/-, Rp.) 13.92
Source: Mirae Asset Sekuritas Indonesia Research
Figure 11. Daily trend – Uptrend
Source: Mirae Asset Sekuritas Indonesia Research
Created w ith AmiBroker - advanced charting and technical analysis softw are. http://w w w .amibroker.com
Optimization Trading System - ©2010 Optimization Trading System - ©2010 Optimization Trading System - ©2010
300
340
MCOR.JK - Daily 3/23/2017 Open 294, Hi 314, Lo 294, Close 310 (6.2%) Upper Band = 367.84, Channel_prd = 331.84, Lower Band = 295.85, Upper Band = 372.48, Channel_prd = 331.84, Lower Band
310
295.849
291.203
320.71
331.843
331.843
367.837
372.482
31Nov 7 14 21 28 Dec 13 19 27 2017 9 16 23 30 Feb 6 13 20 27 Mar 13 20 Optimization Trading System - ©2010
MCOR.JK - Volume = 195,037,408.00, Avg.Volume = 122,105,912.00
195,037,408
122,105,912

March 24, 2017
11
Embun Pagi
Mirae Asset Sekuritas Indonesia
Aliran dana masuk dan volatilitas harga naik masih terlihat.
Pada Figure 12, terlihat dari hasil optimalisasi indikator MFI optimized dan indikator
W%R 0ptimized saat ini masih cenerung naik dengan volume tembus rata-rata Hal ini
mengindikasikan potensi kenaikkan masih terlihat. Resistance berikutnya di 330
sebelum ke 340. Support saat ini di 300 dan stop loss level di 290.
Figure 12. Daily, MFI optimized & RSI optimized
Source: Mirae Asset Sekuritas Indonesia Research
Created w ith AmiBroker - advanced charting and technical analysis softw are. http://w w w .amibroker.com
MCOR.JK - MFI Smoothed = 86.89 86.8948
MCOR.JK - Will%R Smoothed = -69.01
-69.0116
Optimization Trading System - ©2010
340
300
MCOR.JK - Daily 3/23/2017 Open 294, Hi 314, Lo 294, Close 310 (6.2%) VWAP = 320.71
310
320.71
Jul Aug Sep Oct Nov Dec 2017 Feb Mar Optimization Trading System - ©2010
MCOR.JK - Volume = 195,037,408.00, Avg.Volume = 122,105,912.00
195,037,408
122,105,912
March 24, 2017
12
Embun Pagi
Mirae Asset Sekuritas Indonesia
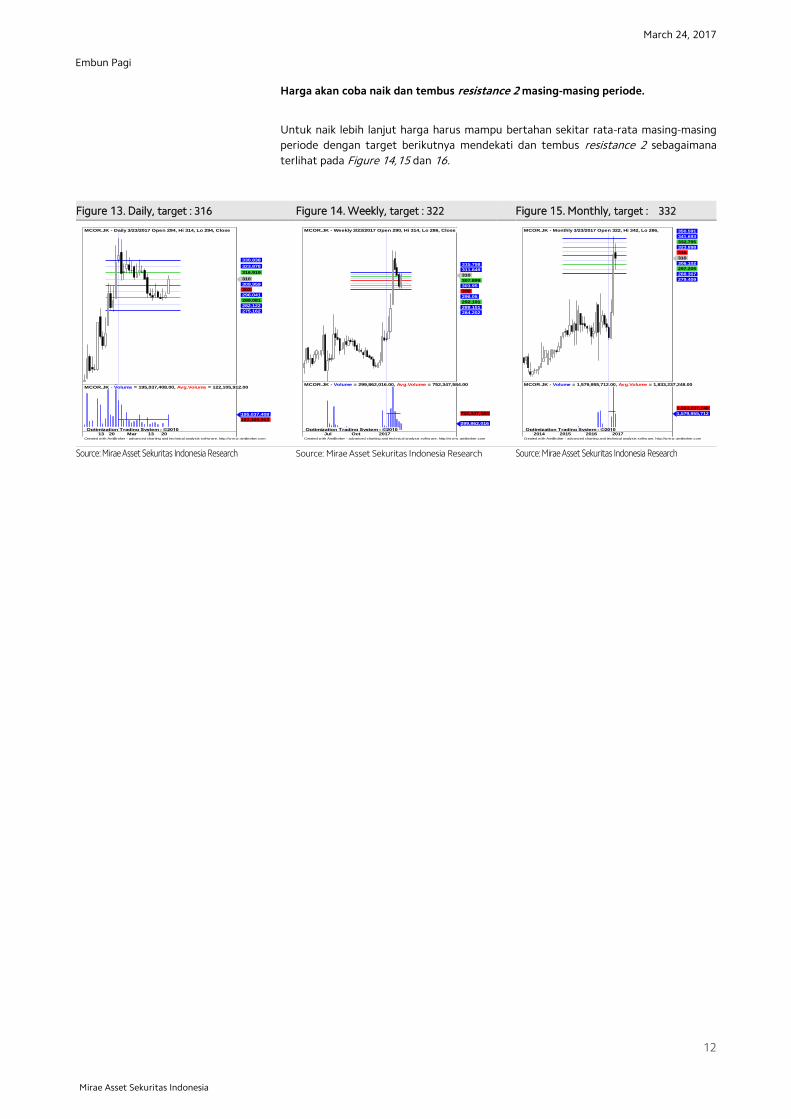
Harga akan coba naik dan tembus resistance 2 masing-masing periode.
Untuk naik lebih lanjut harga harus mampu bertahan sekitar rata-rata masing-masing
periode dengan target berikutnya mendekati dan tembus resistance 2 sebagaimana
terlihat pada Figure 14,15 dan 16.
Figure 13. Daily, target : 316 Figure 14. Weekly, target : 322 Figure 15. Monthly, target : 332
x
Source: Mirae Asset Sekuritas Indonesia Research
Source: Mirae Asset Sekuritas Indonesia Research
Source: Mirae Asset Sekuritas Indonesia Research
Created w ith AmiBroker - advanced charting and technical analysis softw are. http://w w w .amibroker.com
MCOR.JK - Daily 3/23/2017 Open 294, Hi 314, Lo 294, Close
310
309.959
303
296.041
289.081
282.122
275.162
316.919
323.878
330.838
13 20 27Mar 13 20 Optimization Trading System - ©2010
MCOR.JK - Volume = 195,037,408.00, Avg.Volume = 122,105,912.00
195,037,408
122,105,912
Created w ith AmiBroker - advanced charting and technical analysis softw are. http://w w w .amibroker.com
MCOR.JK - Weekly 3/23/2017 Open 290, Hi 314, Lo 286, Close
310
307.899
303.95
300
296.05
292.101
288.151
284.202
311.849
315.798
Jul Oct 2017 Optimization Trading System - ©2010
MCOR.JK - Volume = 299,862,016.00, Avg.Volume = 752,347,584.00
299,862,016
752,347,584
Created w ith AmiBroker - advanced charting and technical analysis softw are. http://w w w .amibroker.com
MCOR.JK - Monthly 3/23/2017 Open 322, Hi 342, Lo 286,
310
306.102
297.205
288.307
279.409
315
323.898
332.795
341.693
350.591
2014 2015 2016 2017 Optimization Trading System - ©2010
MCOR.JK - Volume = 1,579,955,712.00, Avg.Volume = 1,833,237,248.00
1,579,955,712
1,833,237,248

March 24, 2017
13
Embun Pagi
Mirae Asset Sekuritas Indonesia
Tiphone Mobile Indonesia (TELE) – Trading Buy
Harga akan coba naik mendekati normal lower band pada uptrend channel.
Secara umum harga saham ini akan coba naik mendekati normal lower band pada
uptrend channel yang masih relatif valid dengan r-squared = 0.939 selama 138 hari
terakhir dan bergerak normal dalam rentang +/-1.37 std.deviasi dari centerline. Peluang
harga keluar dari pergerakan normalnya sekitar 6.12 % (sekitar 8 bar chart ). Volatilitas
normal pergerakan harga saham ini sepanjang uptrend channel sebesar +/-1.91 % atau
sekitar +/- 17.38 (potensi naik dan turun secara normal maksimum/minimum sebesar
15-20 rupiah) dari level penutupan terakhir sebagaimana terlihat pada Figure 16.
Summary
Item Data Item Data
Close (March 23, 2017) 910(+2.2%) Trading range 890-945
Relative Avg. Price performance to JCI (%) 0.27 Target
β (beta) (0.68) - Daily 925
Corelation 0.38 - Weekly 935
Period 138 - Monthly 975
r-squared 0.939 Stop loss 880
Volatility (+/-, %) 1.91
Volatility (+/-, Rp.) 17.38
Source: Mirae Asset Sekuritas Indonesia Research
Figure 16. Daily Trend – Uptrend
Source: Mirae Asset Sekuritas Indonesia Research
Created w ith AmiBroker - advanced charting and technical analysis softw are. http://w w w .amibroker.com
Optimization Trading System - ©2010 Optimization Trading System - ©2010 Optimization Trading System - ©2010
960
945
890
TELE.JK - Daily 3/23/2017 Open 890, Hi 910, Lo 885, Close 910 (2.2%) Upper Band = 1,027.45, Channel_prd = 986.17, Lower Band = 944.89, Upper Band = 1,094.41, Channel_prd = 986.17, Lower Band
910
877.94
922.997
944.891
986.173
986.173
1,027.45
1,094.41
Jul Aug Sep Oct Nov Dec 2017 Feb Mar Optimization Trading System - ©2010
TELE.JK - Volume = 13,157,900.00, Avg.Volume = 10,426,610.00
13,157,900
10,426,610
March 24, 2017
14
Embun Pagi
Mirae Asset Sekuritas Indonesia
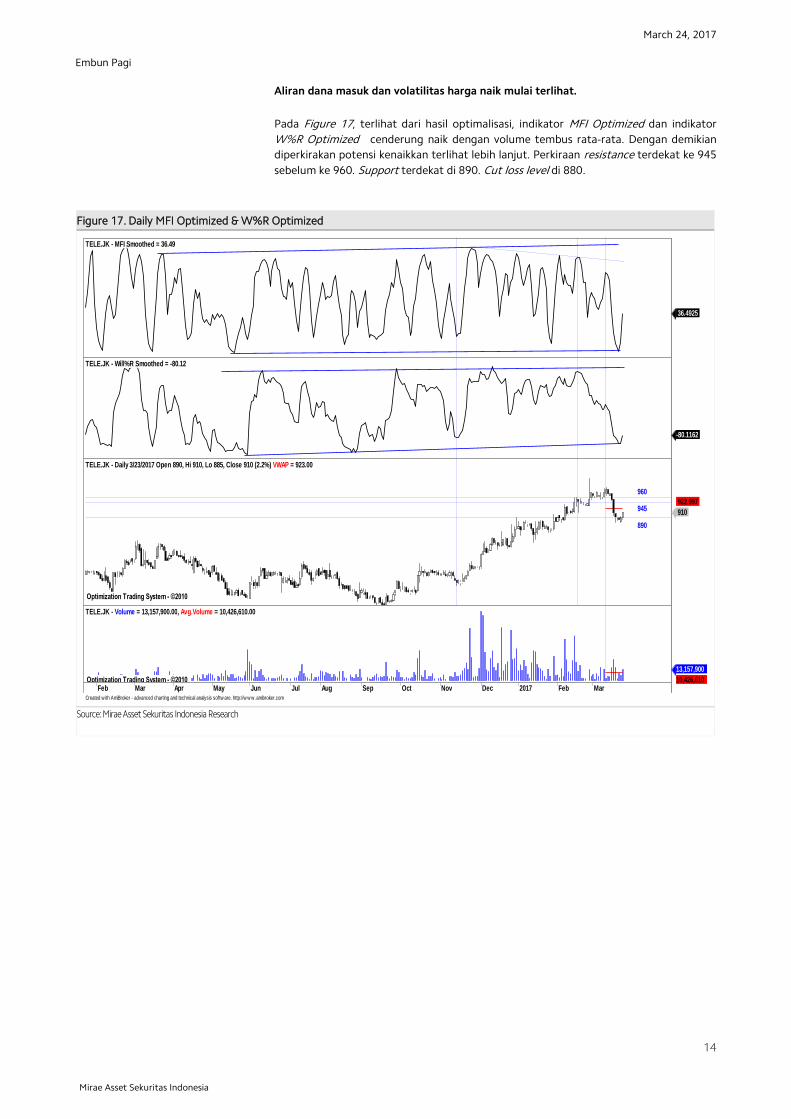
Aliran dana masuk dan volatilitas harga naik mulai terlihat.
Pada Figure 17, terlihat dari hasil optimalisasi, indikator MFI Optimized dan indikator
W%R Optimized cenderung naik dengan volume tembus rata-rata. Dengan demikian
diperkirakan potensi kenaikkan terlihat lebih lanjut. Perkiraan resistance terdekat ke 945
sebelum ke 960. Support terdekat di 890. Cut loss level di 880.
Figure 17. Daily MFI Optimized & W%R Optimized
Source: Mirae Asset Sekuritas Indonesia Research
Created w ith AmiBroker - advanced charting and technical analysis softw are. http://w w w .amibroker.com
TELE.JK - MFI Smoothed = 36.49
36.4925
TELE.JK - Will%R Smoothed = -80.12
-80.1162
Optimization Trading System - ©2010
890
960
945
TELE.JK - Daily 3/23/2017 Open 890, Hi 910, Lo 885, Close 910 (2.2%) VWAP = 923.00
910
922.997
Feb Mar Apr May Jun Jul Aug Sep Oct Nov Dec 2017 Feb Mar Optimization Trading System - ©2010
TELE.JK - Volume = 13,157,900.00, Avg.Volume = 10,426,610.00
13,157,900
10,426,610
March 24, 2017
15
Embun Pagi
Mirae Asset Sekuritas Indonesia
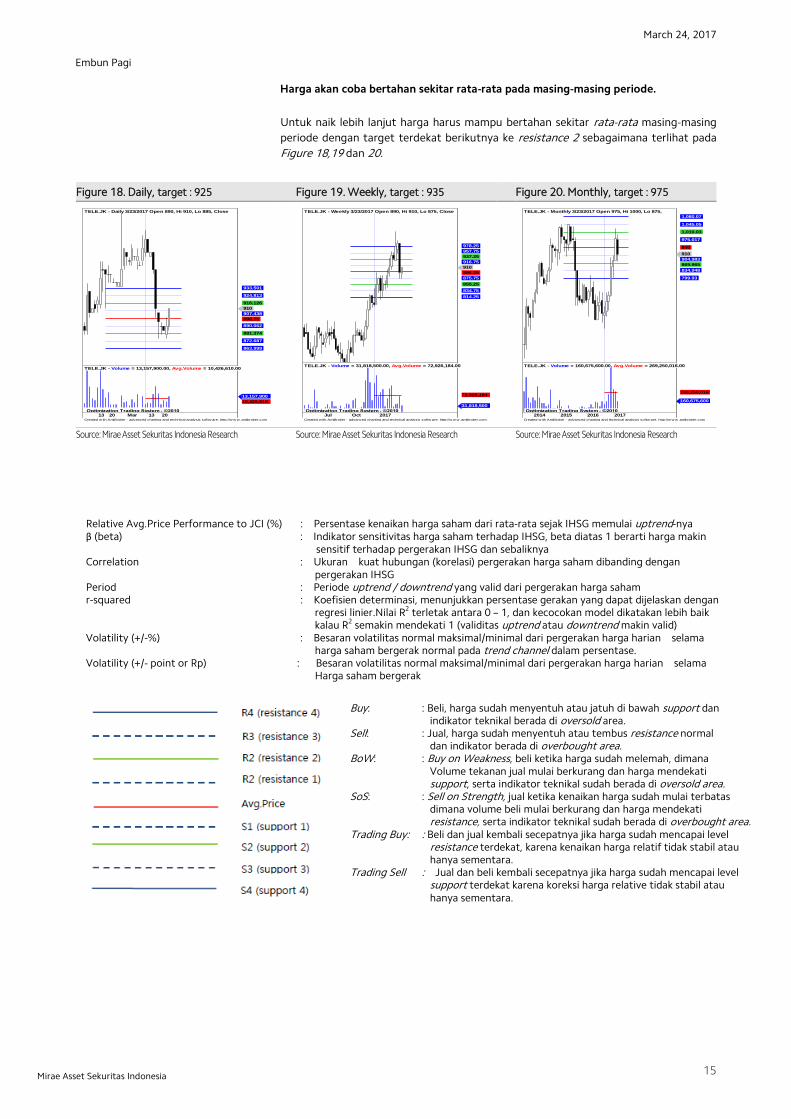
Harga akan coba bertahan sekitar rata-rata pada masing-masing periode.
Untuk naik lebih lanjut harga harus mampu bertahan sekitar rata-rata masing-masing
periode dengan target terdekat berikutnya ke resistance 2 sebagaimana terlihat pada
Figure 18,19 dan 20.
Figure 18. Daily, target : 925 Figure 19. Weekly, target : 935 Figure 20. Monthly, target : 975
Source: Mirae Asset Sekuritas Indonesia Research
Source: Mirae Asset Sekuritas Indonesia Research
Source: Mirae Asset Sekuritas Indonesia Research
analyzed by : Tasrul, [email protected], +62-21- 5151140
Relative Avg.Price Performance to JCI (%) : Persentase kenaikan harga saham dari rata-rata sejak IHSG memulai uptrend-nya β (beta) : Indikator sensitivitas harga saham terhadap IHSG, beta diatas 1 berarti harga makin sensitif terhadap pergerakan IHSG dan sebaliknya Correlation : Ukuran kuat hubungan (korelasi) pergerakan harga saham dibanding dengan pergerakan IHSG Period : Periode uptrend / downtrend yang valid dari pergerakan harga saham r-squared : Koefisien determinasi, menunjukkan persentase gerakan yang dapat dijelaskan dengan regresi linier.Nilai R2 terletak antara 0 – 1, dan kecocokan model dikatakan lebih baik kalau R2 semakin mendekati 1 (validitas uptrend atau downtrend makin valid) Volatility (+/-%) : Besaran volatilitas normal maksimal/minimal dari pergerakan harga harian selama harga saham bergerak normal pada trend channel dalam persentase. Volatility (+/- point or Rp) : Besaran volatilitas normal maksimal/minimal dari pergerakan harga harian selama Harga saham bergerak
Buy: : Beli, harga sudah menyentuh atau jatuh di bawah support dan indikator teknikal berada di oversold area. Sell: : Jual, harga sudah menyentuh atau tembus resistance normal dan indikator berada di overbought area. BoW: : Buy on Weakness, beli ketika harga sudah melemah, dimana Volume tekanan jual mulai berkurang dan harga mendekati support, serta indikator teknikal sudah berada di oversold area. SoS: : Sell on Strength, jual ketika kenaikan harga sudah mulai terbatas dimana volume beli mulai berkurang dan harga mendekati resistance, serta indikator teknikal sudah berada di overbought area. Trading Buy: : Beli dan jual kembali secepatnya jika harga sudah mencapai level resistance terdekat, karena kenaikan harga relatif tidak stabil atau hanya sementara. Trading Sell : Jual dan beli kembali secepatnya jika harga sudah mencapai level support terdekat karena koreksi harga relative tidak stabil atau hanya sementara.
Created w ith AmiBroker - advanced charting and technical analysis softw are. http://w w w .amibroker.com
TELE.JK - Daily 3/23/2017 Open 890, Hi 910, Lo 885, Close
910
907.438
898.75
890.062
881.374
872.687
863.999
916.126
924.813
933.501
13 20 27Mar 13 20 Optimization Trading System - ©2010
TELE.JK - Volume = 13,157,900.00, Avg.Volume = 10,426,610.00
13,157,900
10,426,610
Created w ith AmiBroker - advanced charting and technical analysis softw are. http://w w w .amibroker.com
TELE.JK - Weekly 3/23/2017 Open 890, Hi 910, Lo 875, Close
910
896.25
875.75
855.25
834.75
814.25
916.75
937.25
957.75
978.25
Jul Oct 2017 Optimization Trading System - ©2010
TELE.JK - Volume = 31,818,500.00, Avg.Volume = 72,926,184.00
31,818,500
72,926,184
Created w ith AmiBroker - advanced charting and technical analysis softw are. http://w w w .amibroker.com
TELE.JK - Monthly 3/23/2017 Open 975, Hi 1000, Lo 875,
910
904.983
869.965
834.948
799.93
940
975.017
1,010.03
1,045.05
1,080.07
2014 2015 2016 2017 Optimization Trading System - ©2010
TELE.JK - Volume = 160,675,600.00, Avg.Volume = 269,250,016.00
160,675,600
269,250,016

March 24, 2017
16
Embun Pagi
Mirae Asset Sekuritas Indonesia
Chart 21. JCI Vs. USD/IDR Chart 22. JCI performance (absolute vs. relative)
Source: Bloomberg, Mirae Asset Sekuritas Indonesia Note: Relative to MSCI EM Index
Source: Bloomberg, Mirae Asset Sekuritas Indonesia
Chart 23. Foreigner’s net purchase (EM) Chart 24. Energy price
Note: The latest figure for India are March 22nd, 2017
Source: Bloomberg, Mirae Asset Sekuritas Indonesia Source: Bloomberg, Mirae Asset Sekuritas Indonesia
Chart 25. Non-ferrous metal price Chart 26. Precious metal price
Source: Bloomberg, Mirae Asset Sekuritas Indonesia Source: Bloomberg, Mirae Asset Sekuritas Indonesia
13,000
13,200
13,400
13,600
13,800
4,700
4,900
5,100
5,300
5,500
5,700
12/22 1/19 2/16 3/16
(IDR) (pt) JCI (L) USD/IDR (R)
0.5 0.8
3.3
15.3
0.4 0.6 0.7
-3.7
-8
-4
0
4
8
12
16
20
1D 1W 1M 1Y
Absolute Relative(%, %p)
0
123 32
11
-8
32 129
1,275
321
123
-40
836
-200
0
200
400
600
800
1,000
1,200
1,400
Korea Taiwan Indonesia Thailand Philippines India
1 Day 5 Days (USDmn) (USDmn) (USDmn) (USDmn)
80
85
90
95
100
105
110
12/16 1/17 1/17 2/17 2/17 3/17 3/17
CPO WTI Coal(D-3M=100)
80
85
90
95
100
105
110
115
12/16 1/17 1/17 2/17 2/17 3/17 3/17
(D-3M=100) Copper Nickel Tin
90
95
100
105
110
115
120
12/16 1/17 1/17 2/17 2/17 3/17 3/17
Silver Gold Platinum(D-3M=100)
March 24, 2017
17
Embun Pagi
Mirae Asset Sekuritas Indonesia
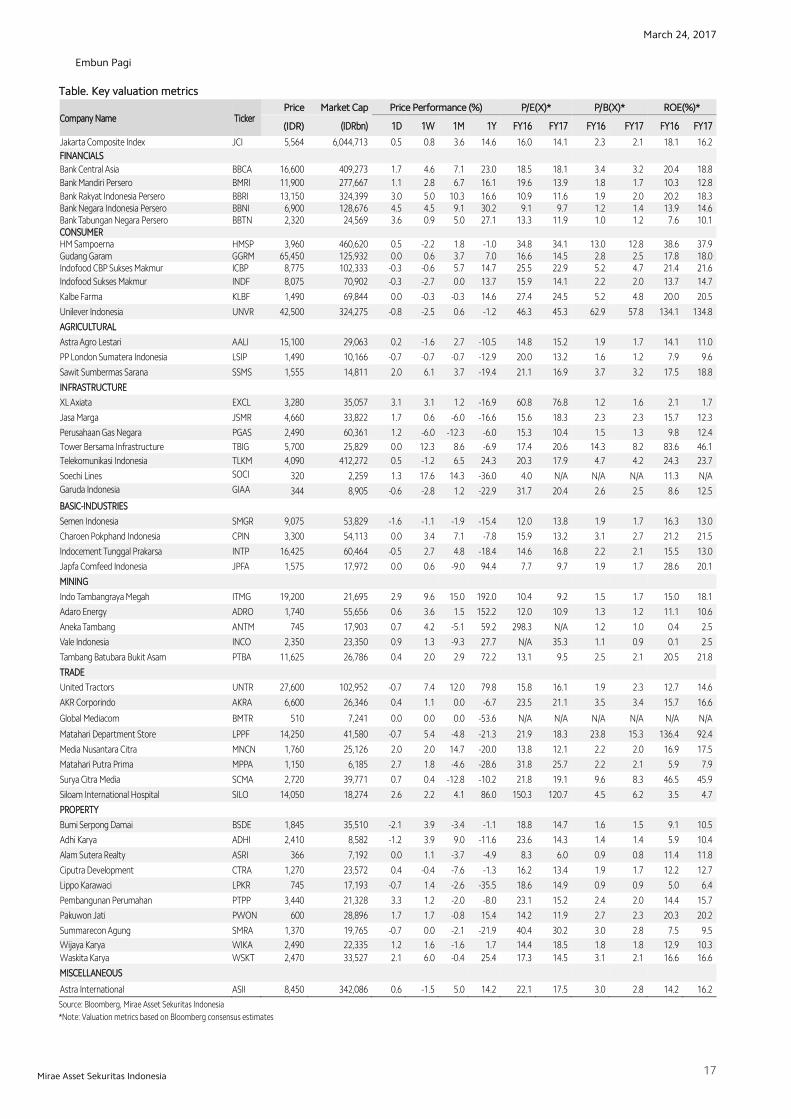
Table. Key valuation metrics
Company Name Ticker Price Market Cap Price Performance (%) P/E(X)* P/B(X)* ROE(%)*
(IDR) (IDRbn) 1D 1W 1M 1Y FY16 FY17 FY16 FY17 FY16 FY17
Jakarta Composite Index JCI 5,564 6,044,713 0.5 0.8 3.6 14.6 16.0 14.1 2.3 2.1 18.1 16.2
FINANCIALS
Bank Central Asia BBCA 16,600 409,273 1.7 4.6 7.1 23.0 18.5 18.1 3.4 3.2 20.4 18.8
Bank Mandiri Persero BMRI 11,900 277,667 1.1 2.8 6.7 16.1 19.6 13.9 1.8 1.7 10.3 12.8
Bank Rakyat Indonesia Persero BBRI 13,150 324,399 3.0 5.0 10.3 16.6 10.9 11.6 1.9 2.0 20.2 18.3 Bank Negara Indonesia Persero BBNI 6,900 128,676 4.5 4.5 9.1 30.2 9.1 9.7 1.2 1.4 13.9 14.6 Bank Tabungan Negara Persero BBTN 2,320 24,569 3.6 0.9 5.0 27.1 13.3 11.9 1.0 1.2 7.6 10.1 CONSUMER HM Sampoerna HMSP 3,960 460,620 0.5 -2.2 1.8 -1.0 34.8 34.1 13.0 12.8 38.6 37.9 Gudang Garam GGRM 65,450 125,932 0.0 0.6 3.7 7.0 16.6 14.5 2.8 2.5 17.8 18.0 Indofood CBP Sukses Makmur ICBP 8,775 102,333 -0.3 -0.6 5.7 14.7 25.5 22.9 5.2 4.7 21.4 21.6
Indofood Sukses Makmur INDF 8,075 70,902 -0.3 -2.7 0.0 13.7 15.9 14.1 2.2 2.0 13.7 14.7
Kalbe Farma KLBF 1,490 69,844 0.0 -0.3 -0.3 14.6 27.4 24.5 5.2 4.8 20.0 20.5
Unilever Indonesia UNVR 42,500 324,275 -0.8 -2.5 0.6 -1.2 46.3 45.3 62.9 57.8 134.1 134.8
AGRICULTURAL
Astra Agro Lestari AALI 15,100 29,063 0.2 -1.6 2.7 -10.5 14.8 15.2 1.9 1.7 14.1 11.0
PP London Sumatera Indonesia LSIP 1,490 10,166 -0.7 -0.7 -0.7 -12.9 20.0 13.2 1.6 1.2 7.9 9.6
Sawit Sumbermas Sarana SSMS 1,555 14,811 2.0 6.1 3.7 -19.4 21.1 16.9 3.7 3.2 17.5 18.8
INFRASTRUCTURE
XL Axiata EXCL 3,280 35,057 3.1 3.1 1.2 -16.9 60.8 76.8 1.2 1.6 2.1 1.7
Jasa Marga JSMR 4,660 33,822 1.7 0.6 -6.0 -16.6 15.6 18.3 2.3 2.3 15.7 12.3
Perusahaan Gas Negara PGAS 2,490 60,361 1.2 -6.0 -12.3 -6.0 15.3 10.4 1.5 1.3 9.8 12.4
Tower Bersama Infrastructure TBIG 5,700 25,829 0.0 12.3 8.6 -6.9 17.4 20.6 14.3 8.2 83.6 46.1
Telekomunikasi Indonesia TLKM 4,090 412,272 0.5 -1.2 6.5 24.3 20.3 17.9 4.7 4.2 24.3 23.7
Soechi Lines SOCI 320 2,259 1.3 17.6 14.3 -36.0 4.0 N/A N/A N/A 11.3 N/A
Garuda Indonesia GIAA 344 8,905 -0.6 -2.8 1.2 -22.9 31.7 20.4 2.6 2.5 8.6 12.5
BASIC-INDUSTRIES
Semen Indonesia SMGR 9,075 53,829 -1.6 -1.1 -1.9 -15.4 12.0 13.8 1.9 1.7 16.3 13.0
Charoen Pokphand Indonesia CPIN 3,300 54,113 0.0 3.4 7.1 -7.8 15.9 13.2 3.1 2.7 21.2 21.5
Indocement Tunggal Prakarsa INTP 16,425 60,464 -0.5 2.7 4.8 -18.4 14.6 16.8 2.2 2.1 15.5 13.0
Japfa Comfeed Indonesia JPFA 1,575 17,972 0.0 0.6 -9.0 94.4 7.7 9.7 1.9 1.7 28.6 20.1
MINING
Indo Tambangraya Megah ITMG 19,200 21,695 2.9 9.6 15.0 192.0 10.4 9.2 1.5 1.7 15.0 18.1
Adaro Energy ADRO 1,740 55,656 0.6 3.6 1.5 152.2 12.0 10.9 1.3 1.2 11.1 10.6
Aneka Tambang ANTM 745 17,903 0.7 4.2 -5.1 59.2 298.3 N/A 1.2 1.0 0.4 2.5
Vale Indonesia INCO 2,350 23,350 0.9 1.3 -9.3 27.7 N/A 35.3 1.1 0.9 0.1 2.5
Tambang Batubara Bukit Asam PTBA 11,625 26,786 0.4 2.0 2.9 72.2 13.1 9.5 2.5 2.1 20.5 21.8
TRADE
United Tractors UNTR 27,600 102,952 -0.7 7.4 12.0 79.8 15.8 16.1 1.9 2.3 12.7 14.6
AKR Corporindo AKRA 6,600 26,346 0.4 1.1 0.0 -6.7 23.5 21.1 3.5 3.4 15.7 16.6
Global Mediacom BMTR 510 7,241 0.0 0.0 0.0 -53.6 N/A N/A N/A N/A N/A N/A
Matahari Department Store LPPF 14,250 41,580 -0.7 5.4 -4.8 -21.3 21.9 18.3 23.8 15.3 136.4 92.4
Media Nusantara Citra MNCN 1,760 25,126 2.0 2.0 14.7 -20.0 13.8 12.1 2.2 2.0 16.9 17.5
Matahari Putra Prima MPPA 1,150 6,185 2.7 1.8 -4.6 -28.6 31.8 25.7 2.2 2.1 5.9 7.9
Surya Citra Media SCMA 2,720 39,771 0.7 0.4 -12.8 -10.2 21.8 19.1 9.6 8.3 46.5 45.9
Siloam International Hospital SILO 14,050 18,274 2.6 2.2 4.1 86.0 150.3 120.7 4.5 6.2 3.5 4.7
PROPERTY
Bumi Serpong Damai BSDE 1,845 35,510 -2.1 3.9 -3.4 -1.1 18.8 14.7 1.6 1.5 9.1 10.5
Adhi Karya ADHI 2,410 8,582 -1.2 3.9 9.0 -11.6 23.6 14.3 1.4 1.4 5.9 10.4
Alam Sutera Realty ASRI 366 7,192 0.0 1.1 -3.7 -4.9 8.3 6.0 0.9 0.8 11.4 11.8
Ciputra Development CTRA 1,270 23,572 0.4 -0.4 -7.6 -1.3 16.2 13.4 1.9 1.7 12.2 12.7
Lippo Karawaci LPKR 745 17,193 -0.7 1.4 -2.6 -35.5 18.6 14.9 0.9 0.9 5.0 6.4
Pembangunan Perumahan PTPP 3,440 21,328 3.3 1.2 -2.0 -8.0 23.1 15.2 2.4 2.0 14.4 15.7
Pakuwon Jati PWON 600 28,896 1.7 1.7 -0.8 15.4 14.2 11.9 2.7 2.3 20.3 20.2
Summarecon Agung SMRA 1,370 19,765 -0.7 0.0 -2.1 -21.9 40.4 30.2 3.0 2.8 7.5 9.5
Wijaya Karya WIKA 2,490 22,335 1.2 1.6 -1.6 1.7 14.4 18.5 1.8 1.8 12.9 10.3
Waskita Karya WSKT 2,470 33,527 2.1 6.0 -0.4 25.4 17.3 14.5 3.1 2.1 16.6 16.6
MISCELLANEOUS
Astra International ASII 8,450 342,086 0.6 -1.5 5.0 14.2 22.1 17.5 3.0 2.8 14.2 16.2
Source: Bloomberg, Mirae Asset Sekuritas Indonesia
*Note: Valuation metrics based on Bloomberg consensus estimates

March 24, 2017
18
Embun Pagi
Mirae Asset Sekuritas Indonesia
Sector performance
Top 10 market cap performance
Name Index Chg (%) Ticker Price Market Cap (IDRbn) Chg (%)
Agricultural 1,839.1 0.6 GEMS IJ 2990 17,588 12.83
Mining 1,482.8 1.5
MAYA IJ 3000 14,758 11.11
Basic-Industry 578.5 -0.1 INAF IJ 3300 10,228 8.20
Miscellaneous Industry 1,431.6 0.6 DOID IJ 855 7,118 6.21
Consumer Goods 2,408.9 0.0 MCOR IJ 310 5,156 6.2
Property & Construction 504.4 0.4
BSIM IJ 845 12,844 5.63
Infrastructure 1,097.4 0.5 JRPT IJ 860 11,825 4.88
Finance 881.2 1.1 INKP IJ 1210 6,620 4.76
Trade 906.1 0.3 NIKL IJ 2690 6,788 4.7
Composite 5,563.8 0.5 BBNI IJ 6900 128,676 4.55 Source: Bloomberg
Top 5 leading movers Top 5 lagging movers
Name Chg (%) Close Name Chg (%) Close
BBCA IJ 1.7 16,600 UNVR IJ -0.8 42,500
BBNI IJ 4.6 6,900 BBRI IJ -0.4 13,150
BMRI IJ 1.1 11,900 SMGR IJ -1.6 9,075
HMSP IJ 0.5 3,960 BSDE IJ -2.1 1,845
ASII IJ 0.6 8,450 UNTR IJ -0.7 27,600 Source: Bloomberg
Economic Calendar
Time Currency Detail Forecast Previous
12:00am CHF Gov Board Member Maechler Speaks
4:45am NZD Trade Balance 160M -285M
6:00am USD FOMC Member Kaplan Speaks
7:30am JPY Flash Manufacturing PMI 53.5 53.3
3:00pm EUR French Flash Manufacturing PMI 52.4 52.2
3:00pm EUR French Flash Services PMI 56.2 56.4
3:30pm EUR German Flash Manufacturing PMI 56.6 56.8
3:30pm EUR German Flash Services PMI 54.5 54.4
4:00pm EUR Flash Manufacturing PMI 55.3 55.4
4:00pm EUR Flash Services PMI 55.4 55.5
4:30pm GBP BBA Mortgage Approvals 44.9K 44.7K
7:00pm USD FOMC Member Evans Speaks
7:30pm CAD CPI m/m 0.2% 0.9%
7:30pm CAD Common CPI y/y 1.3%
7:30pm CAD Median CPI y/y 1.9%
7:30pm CAD Trimmed CPI y/y 1.7%
7:30pm CAD Core CPI m/m 0.1% 0.5%
7:30pm USD Core Durable Goods Orders m/m 0.5% 0.0%
7:30pm USD Durable Goods Orders m/m 1.1% 2.0%
8:45pm USD Flash Manufacturing PMI 54.9 54.2
8:45pm USD Flash Services PMI 53.9 53.8
Note: Time is based on Indonesian local time
Source: Forex Factory
March 24, 2017
19
Embun Pagi
Mirae Asset Sekuritas Indonesia
Disclaimers
This report is prepared strictly for private circulation only to clients of PT Mirae Asset Sekuritas Indonesia (MASI). It is purposed only to person having
professional experience in matters relating to investments. The information contained in this report has been taken from sources which we deem reliable. No
warranty (express or implied) is made to the accuracy or completeness of the information. All opinions and estimates included in this report constitute our
judgments as of this date, without regards to its fairness, and are subject to change without notice. However, none of MASI and/or its affiliated companies
and/or their respective employees and/or agents makes any representation or warranty (express or implied) or accepts any responsibility or liability as to, or
in relation to, the accuracy or completeness of the information and opinions contained in this report or as to any information contained in this report or any
other such information or opinions remaining unchanged after the issue thereof. We expressly disclaim any responsibility or liability (express or implied) of
MASI, its affiliated companies and their respective employees and agents whatsoever and howsoever arising (including, without limitation for any claims,
proceedings, action, suits, losses, expenses, damages or costs) which may be brought against or suffered by any person as a results of acting in reliance upon
the whole or any part of the contents of this report and neither MASI, its affiliated companies or their respective employees or agents accepts liability for any
errors, omissions or misstatements, negligent or otherwise, in the report and any liability in respect of the report or any inaccuracy therein or omission there
from which might otherwise arise is hereby expresses disclaimed.
This document is not an offer to sell or a solicitation to buy any securities. This firms and its affiliates and their officers and employees may have a position,
make markets, act as principal or engage in transaction in securities or related investments of any company mentioned herein, may perform services for or
solicit business from any company mentioned herein, and may have acted upon or used any of the recommendations herein before they have been provided
to you. © PT Mirae Asset Sekuritas Indonesia 2016.
Related Documents