BY MAMIE VOIGHT, ALEGNETA A. LONG, MARK HUELSMAN, AND JENNIFER ENGLE March 2014 A REPORT BY Institute for Higher Education Policy SUPPORTED BY The Bill & Melinda Gates Foundation Access and Success Accountability Diversity Finance Global Impact Mapping the Postsecondary Data Domain: Problems and Possibilities

Welcome message from author
This document is posted to help you gain knowledge. Please leave a comment to let me know what you think about it! Share it to your friends and learn new things together.
Transcript
BY MAMIE VOIGHT, ALEGNETA A. LONG, MARK HUELSMAN, AND JENNIFER ENGLE
March 2014A REPORT BY
Institute for Higher Education Policy
SUPPORTED BY
The Bill & Melinda Gates Foundation
Acce
ss a
nd S
ucce
ssAc
coun
tabi
lityD
iver
sity
Fina
nce
Glo
bal I
mpa
ct
Mapping the Postsecondary Data Domain:Problems and Possibilities
Table of ContentsExecutive Summary Why Do We Need Better Postsecondary Data? What Do We Mean By Postsecondary Data?What Do Students, Policymakers, and Institutions Need to Know? What Are the Core Postsecondary Questions and Measures–and are the Data Available? How Can We Better Use Postsecondary Data? What is Next on the Postsecondary Data Frontier?
This paper is a product of the Reimagining Aid Design and Delivery (RADD) Simplification and Transparency Consortium, funded by the Bill & Melinda Gates Foundation. Under this consortium, seven organizations joined together to explore ways to simplify the college admissions and financial aid process to make it simpler and more transparent. This paper represents the Institute for Higher Education Policy’s (IHEP’s) research and recommendations. While collaborations with the consortium informed this paper, an organization’s participation in the consortium does not necessarily signal full endorsement of this content. Consortium partners include: Center for Law and Social Policy, the College Board, Institute for Higher Education Policy, National College Access Network, New America, the U.S. Chamber of Commerce Foundation, and Young Invincibles. Acknowledgements
This report is the product of hard work and thoughtful contributions from a number of individuals and organizations. We would like to thank the Institute for Higher Education Policy (IHEP) staff who helped in this effort, including Michelle Asha Cooper, president; Melissa Moreland, research analyst; and Eunkyoung Park, former research analyst. We also thank Tia T. Gordon at TTG+PARTNERS for her communication efforts, Paula Amann for her editorial expertise, and Matthew Reed and Jessica Thompson from The Institute for College Access and Success (TICAS) for their thoughtful feedback on the report’s content. We especially thank the Reimagining Aid Design and Delivery (RADD) Simplification and Transparency members, all of whom have been strong partners throughout this project. Finally, we are grateful for the Gates Foundation’s support of the RADD project and, in particular, this research on postsecondary data. Although many have contributed their thoughts and feedback throughout the production of this report, the research and recommendations presented here are those of the authors alone.
• Which students have access to which colleges?• How many—and which—students complete college?• How much does college cost, and how do students pay?• What outcomes do students experience after college in
the workplace and society?
These might seem like straightforward questions to which we already have the answers. Yet, a careful mapping of federal data systems against these questions shows that while we have a solid base of understanding in some areas, we fall far short in others. In an attempt to fill these gaps, a series of voluntary data initiatives have arisen in recent years. These initiatives do not include all institutions or even all states, but they do signal an emerging consensus on the importance of answering the key questions outlined in this paper. Projects like Complete College America, Achieving the Dream, and Access to Success collect voluntary data from states, institu-tions, or systems on access and success measures. Other efforts like College Measures, the Project on Student Debt, and the Workforce Data Quality Campaign aim to improve and report cost, debt, and workforce results data.
Despite sometimes disparate decisions on definitions and technicalities, growing agreement on the critical questions and
Executive Summary
In a time of rising college costs and stagnating rates of completion, America’s students, policymakers, and colleges and universities need better information about our postsecondary education system. While their data needs do differ, each of these constituencies needs to be able to answer critical questions:
some core measures offers an opportunity to unify postsec-ondary data more broadly than is possible through voluntary initiatives. While the federal government could rework the underlying structure of existing postsecondary data systems, this paper examines current systems like the Integrated Post-secondary Education Data System (IPEDS) and the National Student Loan Data System (NSLDS) and proposes improve-ments to fill gaps in knowledge about postsecondary institu-tions and programs. Still others in the field are exploring alternative options such as state or regional approaches.
The core measures (see TABLE 1) and proposed improve-ments described in this paper will be useful for all constituen-cies: Students and families as they make college decisions, policymakers as they make funding and policy decisions, and institutions as they work to continuously improve the ways in which they serve students. Each group also could benefit from supplemental measures suited to their particular needs. This paper provides a framework for understanding those needs, evaluating how well existing data meet them, and recom-mending practical solutions that would greatly improve the existing data infrastructure.
01 INSTITUTE FOR HIGHER EDUCATION POLICY
Why Do We Need Better Postsecondary Data?
Recent years have seen the rollout of the White House’s College Scorecard, the U.S. Department of Education’s Financial Aid Shopping Sheet, and a number of websites—among them College Measures, College Results Online, and College Reality Check—aimed at helping students choose institutions that offer them a better return on their college investment. Today, federal and state policymakers are developing rating and funding systems intended to more directly influence institutions to ease costs and improve outcomes for students. Amid these and other efforts, demand has grown for more and better data to answer important questions about the value of a college education.
Yet, our current data systems were not designed with today’s needs in mind. In fact, significant gaps in the data on which we currently depend leave important questions unanswered:
• How many part-time, adult, military, remedial, and Pell grant students are successfully completing their degrees?
• Are students who do not graduate transferring to another school or dropping out altogether?
• How much are students learning in college, and how are they contributing to society after college?
• Are students leaving school with loan debt, and are they paying back their loans, especially students who do not complete?
• What types of jobs are students getting after college? Are they going to graduate school?
The higher education community seems to have reached consensus: Now more than ever, students need better information to help them make more informed postsecondary decisions. Too many of today’s college students are paying far too much at institutions that offer them far too few chances for success, an outcome neither students nor the country can afford.
02 MAPPING THE POSTSECONDARY DATA DOMAIN: PROBLEMS AND POSSIBILITIES
What Do We Mean by Postsecondary Data?
Fundamentally, most people mean “information” when talking about “data.” However, without a clear framework, postsecondary data conversations can devolve quickly into debates about numerators, denominators, definitions, and cohorts—sometimes losing focus on the purpose.
Clearly, these technical conversations are critical, as data avail-ability, definitions, and quality all shape effective data use, but these must not occur in a vacuum from a broader discussion about the goals we aim to achieve with better data. This paper offers a structure for organizing postsecondary data along several dimensions to map the existing data domain and to chart a course toward getting the information needed to improve higher educa-tion using existing data systems (see FIGURE 1).
First, before diving into the details, we need to articulate what QUESTIONS need answering with improved data. These questions may differ depending on the audience: Consumers1 trying to make better, more affordable choices about where to go to college; institutions trying to improve student outcomes; or policymakers trying to protect the public investment. To be sure, this is not a static nor straightforward process as the
1 Throughout this paper, the word “consumer” refers to students and in some cases, families. This interchangeable use of the words “consumer” and “student” should not be interpreted to mean that college is purely a consumer good, bestowing only private benefits on graduates. Rather, higher education creates thoughtful citizens who contribute to society as innovators, thinkers, artists, employees, parents, volunteers, taxpayers, and much, much more.
higher education enterprise does and should evolve over time to meet the changing needs of students. After identifying the relevant questions for today’s students, we then must identify MEASURES that can answer those questions, and at this point, definitions and technicalities become highly relevant. This paper draws on existing postsecondary data initiatives, as well as conversations with higher education data, research, and policy experts to outline the core questions for students, policy-makers, and institutions, and then proposes measures to answer those questions.
To populate the measures, we must rely on the collection and submission of data housed in DATABASES—either existing or new. The existing national postsecondary databases were built for different purposes at different times, making it challenging to adapt them to today’s needs. For example, the Integrated Postsecondary Education Data System (IPEDS) was designed to provide a national composite of the nation’s postsecondary system with reporting required for compliance to maintain Title
03 INSTITUTE FOR HIGHER EDUCATION POLICY
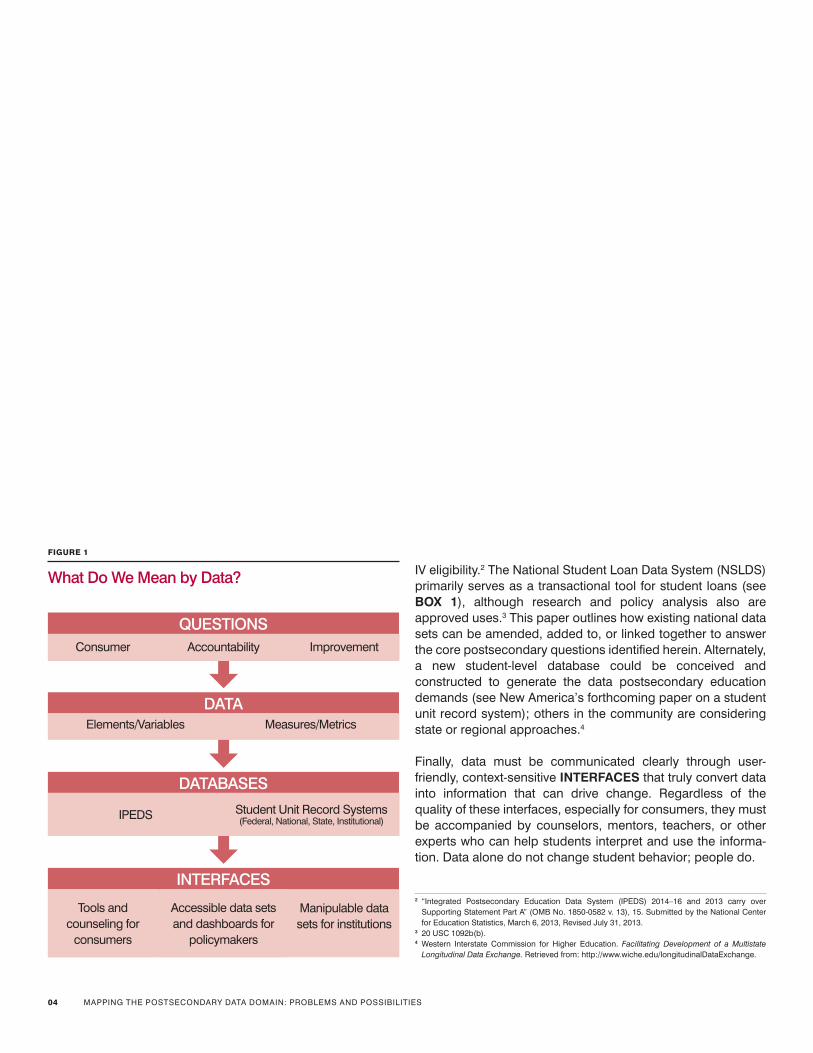
What Do We Mean by Data?
FIGURE 1
DATAElements/Variables Measures/Metrics
DATABASES
IPEDS Student Unit Record Systems(Federal, National, State, Institutional)
INTERFACES
Tools and counseling for
consumers
Accessible data sets and dashboards for
policymakers
Manipulable data sets for institutions
QUESTIONSConsumer Accountability Improvement
IV eligibility.2 The National Student Loan Data System (NSLDS) primarily serves as a transactional tool for student loans (see BOX 1), although research and policy analysis also are approved uses.3 This paper outlines how existing national data sets can be amended, added to, or linked together to answer the core postsecondary questions identified herein. Alternately, a new student-level database could be conceived and constructed to generate the data postsecondary education demands (see New America’s forthcoming paper on a student unit record system); others in the community are considering state or regional approaches.4
Finally, data must be communicated clearly through user-friendly, context-sensitive INTERFACES that truly convert data into information that can drive change. Regardless of the quality of these interfaces, especially for consumers, they must be accompanied by counselors, mentors, teachers, or other experts who can help students interpret and use the informa-tion. Data alone do not change student behavior; people do.
2 “Integrated Postsecondary Education Data System (IPEDS) 2014–16 and 2013 carry over Supporting Statement Part A” (OMB No. 1850-0582 v. 13), 15. Submitted by the National Center for Education Statistics, March 6, 2013, Revised July 31, 2013.
3 20 USC 1092b(b).4 Western Interstate Commission for Higher Education. Facilitating Development of a Multistate
Longitudinal Data Exchange. Retrieved from: http://www.wiche.edu/longitudinalDataExchange.
04 MAPPING THE POSTSECONDARY DATA DOMAIN: PROBLEMS AND POSSIBILITIES
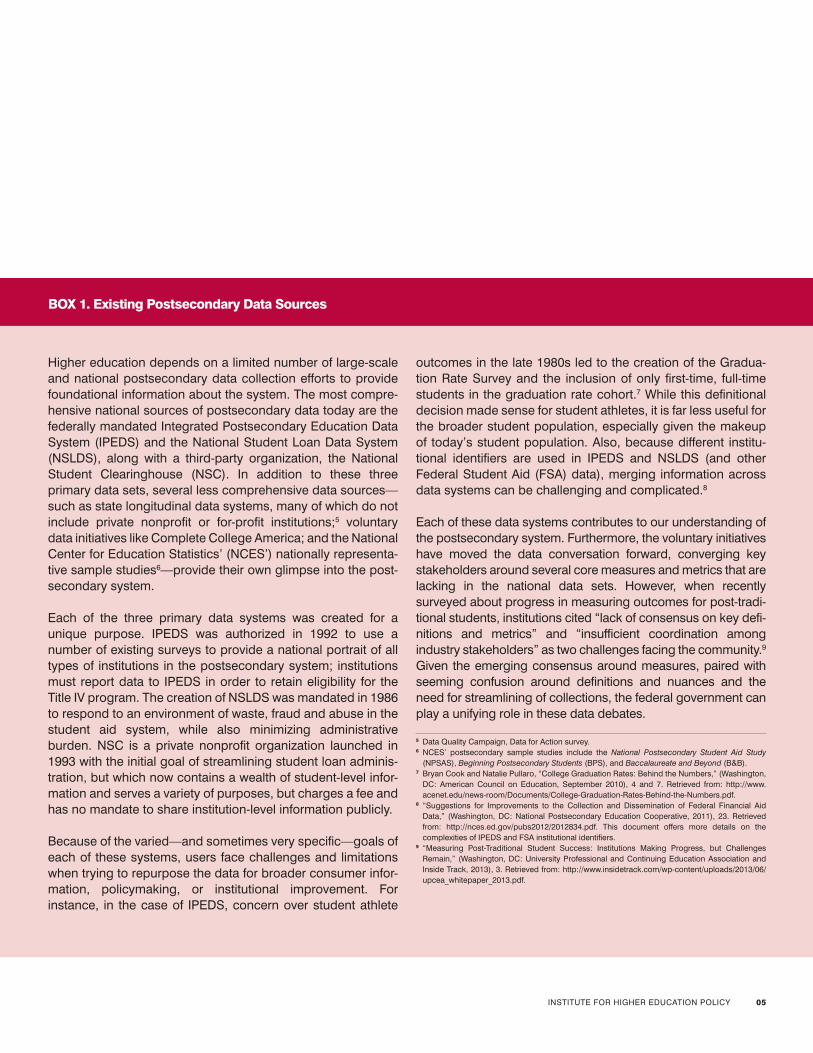
Higher education depends on a limited number of large-scale and national postsecondary data collection efforts to provide foundational information about the system. The most compre-hensive national sources of postsecondary data today are the federally mandated Integrated Postsecondary Education Data System (IPEDS) and the National Student Loan Data System (NSLDS), along with a third-party organization, the National Student Clearinghouse (NSC). In addition to these three primary data sets, several less comprehensive data sources—such as state longitudinal data systems, many of which do not include private nonprofit or for-profit institutions;5 voluntary data initiatives like Complete College America; and the National Center for Education Statistics’ (NCES’) nationally representa-tive sample studies6—provide their own glimpse into the post-secondary system.
Each of the three primary data systems was created for a unique purpose. IPEDS was authorized in 1992 to use a number of existing surveys to provide a national portrait of all types of institutions in the postsecondary system; institutions must report data to IPEDS in order to retain eligibility for the Title IV program. The creation of NSLDS was mandated in 1986 to respond to an environment of waste, fraud and abuse in the student aid system, while also minimizing administrative burden. NSC is a private nonprofit organization launched in 1993 with the initial goal of streamlining student loan adminis-tration, but which now contains a wealth of student-level infor-mation and serves a variety of purposes, but charges a fee and has no mandate to share institution-level information publicly.
Because of the varied—and sometimes very specific—goals of each of these systems, users face challenges and limitations when trying to repurpose the data for broader consumer infor-mation, policymaking, or institutional improvement. For instance, in the case of IPEDS, concern over student athlete
outcomes in the late 1980s led to the creation of the Gradua-tion Rate Survey and the inclusion of only first-time, full-time students in the graduation rate cohort.7 While this definitional decision made sense for student athletes, it is far less useful for the broader student population, especially given the makeup of today’s student population. Also, because different institu-tional identifiers are used in IPEDS and NSLDS (and other Federal Student Aid (FSA) data), merging information across data systems can be challenging and complicated.8
Each of these data systems contributes to our understanding of the postsecondary system. Furthermore, the voluntary initiatives have moved the data conversation forward, converging key stakeholders around several core measures and metrics that are lacking in the national data sets. However, when recently surveyed about progress in measuring outcomes for post-tradi-tional students, institutions cited “lack of consensus on key defi-nitions and metrics” and “insufficient coordination among industry stakeholders” as two challenges facing the community.9 Given the emerging consensus around measures, paired with seeming confusion around definitions and nuances and the need for streamlining of collections, the federal government can play a unifying role in these data debates.
5 Data Quality Campaign, Data for Action survey. 6 NCES’ postsecondary sample studies include the National Postsecondary Student Aid Study
(NPSAS), Beginning Postsecondary Students (BPS), and Baccalaureate and Beyond (B&B).7 Bryan Cook and Natalie Pullaro, “College Graduation Rates: Behind the Numbers,” (Washington,
DC: American Council on Education, September 2010), 4 and 7. Retrieved from: http://www.acenet.edu/news-room/Documents/College-Graduation-Rates-Behind-the-Numbers.pdf.
8 “Suggestions for Improvements to the Collection and Dissemination of Federal Financial Aid Data,” (Washington, DC: National Postsecondary Education Cooperative, 2011), 23. Retrieved from: http://nces.ed.gov/pubs2012/2012834.pdf. This document offers more details on the complexities of IPEDS and FSA institutional identifiers.
9 “Measuring Post-Traditional Student Success: Institutions Making Progress, but Challenges Remain,” (Washington, DC: University Professional and Continuing Education Association and Inside Track, 2013), 3. Retrieved from: http://www.insidetrack.com/wp-content/uploads/2013/06/upcea_whitepaper_2013.pdf.
BOX 1. Existing Postsecondary Data Sources
05 INSTITUTE FOR HIGHER EDUCATION POLICY
What Do Students, Policymakers, and Institutions Need to Know?
The million-dollar question facing all higher education constituencies involves the concept of “value.” Which colleges produce value or return on investment for students, as measured by inputs, outputs, and cost? While terms like “value” and “return on investment” tend to evoke economic and workforce concepts, measures of learning and social good can be incorporated as “outputs” as well, providing a more holistic perspective on college value. This question of value—which institutions provide it to which students in what quantities—permeates postsecondary discussions today and touches all actors in the system, including students, policymakers, and colleges and universities.
For students, the evidence is clear: On average, college gradu-ates have higher earnings and are less likely to face unemploy-ment than those without a postsecondary credential.10 Were student graduation, debt, and employment outcomes relatively similar across all institutions, then students might not require better data to inform decision-making. Yet, graduation rates and student debt do vary tremendously across institutions.11 And while comprehensive information on employment outcomes is unavailable, data on states participating in College Measures12 and on gainful employment programs13 indicate that labor market outcomes also vary considerably by institu-tion and program.
10 Bureau of Labor Statistics, Current Population Survey (2013), Employment Projections: Earnings and Unemployment Rates by Educational Attainment. (Washington, DC: Bureau of Labor Statis-tics, 2013). Retrieved from: http://www.bls.gov/emp/ep_chart_001.htm.
11 Mamie Lynch, Jennifer Engle, and José L. Cruz. “Priced Out: How the Wrong Financial-Aid Poli-cies Hurt Low-Income Students,” (Washington, DC: The Education Trust, 2011), 5, Figure 4. Retrieved from: http://www.edtrust.org/sites/edtrust.org/files/PricedOutFINAL.pdf; (2013). “Student Debt and the Class of 2012” (Oakland, Calif.: The Institute for College Access and Success, December 2013). http://projectonstudentdebt.org/files/pub/classof2012.pdf.
12 College Measures. Retrieved from: www.collegemeasures.org. 13 “2011 Gainful Employment Informational Rates” (Washington, DC: Federal Student Aid, U.S. Depart-
ment of Education, 2012). Retrieved from: http://studentaid.ed.gov/about/data-center/school/ge/data.
To select a college and course of study most likely to set students up for success, they need clear information about college access, outcomes, and cost.14 In fact, research shows that high-achieving, low-income students who receive informa-tion on college costs and financial aid options are more likely to take steps toward attending college, particularly institutions with strong outcomes.15 Similarly, when low-income parents receive information about college outcomes, they act on it, allowing graduation rates to trump even location when identi-fying colleges to encourage their children to attend.16 (For more information on students’ particular data needs, see BOX 2.)
14 “Will College Be Worth It?” (Washington, DC: Young Invincibles, 2013). Retrieved from: http://younginvincibles.org/2013/12/will-college-be-worth-it/. This report includes examples of the types of information students seek.
15 Sara Turner and Caroline Hoxby, “Expanding College Opportunities for High-Achieving, Low Income Students” (Stanford, Calif.: Stanford Institute for Economic Policy Research, 2013), 23–26. Retrieved from: http://siepr.stanford.edu/?q=/system/files/shared/pubs/papers/12-014paper.pdf.
16 Andrew P. Kelly and Mark Schneider, “Filling in the Blanks: How Information can Affect Choice in Higher Education” (Washington, DC: American Enterprise Institute, 2011), 15. Retrieved from: http://www.aei.org/files/2011/01/12/fillingintheblanks.pdf.
06 MAPPING THE POSTSECONDARY DATA DOMAIN: PROBLEMS AND POSSIBILITIES
Consumer information is a critical piece of our nation’s postsec-ondary data infrastructure, informing one of the biggest decisions of students’ lives. In addition, consumer information can act as a form of soft accountability, allowing some students to “vote with their feet” in the direction of institutions that serve them well. However, soft accountability is just that: Soft. While other consumer information efforts, such as public campaigns about the adverse health consequences of smoking, have substantially changed behavior—albeit slowly,17 college choices are fundamentally different. In the higher education context, many students—partic-ularly adults, members of the military, and low-income, first-gener-ation students—face very limited choices in where to go to college. Even with access to perfect information some of these students will remain place-bound, searching for colleges near their home and family, or at least within their state, where they qualify for in-state tuition.18 Real accountability and improvement requires action by policymakers and institutions.
And such accountability is warranted. Taxpayers invest billions of dollars in higher education through student financial aid, research and development, institutional tax exemptions, state and local spending and investment in Title III and V institutions and programs. To safeguard this substantial investment and protect students from subpar institutions, policymakers need better information on institutional costs, student prices, and
17 “The Health Consequences of Smoking—50 Years of Progress. A report of the Surgeon General” (Washington, DC, U.S. Department of Health and Human Services, 2014), 5. Retrieved from http://www.surgeongeneral.gov/library/reports/50-years-of-progress/exec-summary.pdf.
18 Amanda Griffith and Donna S. Rothstein, “Can’t get there from here: The decision to apply to a selective college,” Economics of Education Review 28 (2009) 620–628. The study contains research on how distance impacts college decisions. Retrieved from: http://eric.ed.gov/?id=EJ850771.
student outcomes—information that is more detailed and more nuanced than that used to inform students. For example, students need to know how much they must pay for college, but they do not need to know the total amount of Pell grant dollars or state appropriations received by their institutions. Nonetheless, those data on public investments are crucial for policymakers trying to determine how best to distribute scarce resources. (For more information on policymakers’ specific data needs, see BOX 3.)
Clearly, students and policymakers need access to critical infor-mation to guide thoughtful choices and policymaking. But in the end, both students and policymakers will have only indirect impacts on institutional performance. Some students may avoid institutions with poor outcomes, but such choices are not realistic for all students given location and cost constraints, as mentioned. In terms of policymaking, most accountability systems issue harsh sanctions only for the worst-of-the-worst performers, allowing some subpar or mediocre institutions and programs to continue operating without substantial consequences.19
For all institutions, though, continual improvement is critical—and thoughtful data use can inform and drive those efforts directly. Serving students and serving them well is arguably the core function of institutions of higher learning. But too many institutions are struggling to increase student success on their campuses. Better and more deliberate use of data can help
19 President Obama’s proposed rating systems may offer more broad-based accountability for insti-tutions at all levels of performance, depending on the design of the system and its penalties or incentives.
07 INSTITUTE FOR HIGHER EDUCATION POLICY
In addition to the core measures, students also need information about what experiences and supports colleges offer, including student services, opportunities to expand their learning, and venues to contribute to their communities and the greater so-ciety. In its College Access & Opportunity Guide, the Center for Student Opportunity advises students to ask a range of ques-tions including the following:
• Do all entering students have assigned academic advisors?• To what extent does the school help students deal with
their academic and social needs?• What percentage of students do community service? • What percentage of students study in other countries?• What percentage of students gain internship or co-op
experience before graduating?20
BOX 2. Additional Data for Students
While these questions will help students build an understanding of each campus environment, many students—particularly those receiving less guidance in the college search process—may not think to ask them. As a proactive step to inform students, institutions should provide clear information about the availability and student use of student support services, career services, experiential learning, and civic and community engagement. Minimally, institutions should break down data on student use of services by socioeconomic status and race/ethnicity, so as to ensure broad access to these programs and opportunities. All of this information should be easily acces-sible on websites and in marketing materials, as part of the mix of data available to students during the college search process.
20 Center for Student Opportunity, College Access & Opportunity Guide, 2010.
In this era of budget cuts and fiscal austerity, policymakers need to spend each public dollar wisely. To make thoughtful and productive decisions about where and how to invest funds from the public coffer, federal and state policymakers need better information on how institutions and states spend their own dollars, how public funds currently are distributed, and how these investments can best promote access and comple-tion, especially among underserved populations. For instance:
Targeting of State and Institutional Aid: While the federal Pell grant program targets students with the greatest need,21 states and institutions too often undermine this investment by spending their aid dollars on students who do not need the financial support.22 Existing data are not yet fine-grained enough to understand individual state and institutional aid practices. To make these data available, the net price by income component of the Student Financial Aid survey could disaggre-gate average grant aid by source to allow policymakers to examine which students the state and institution supports, and by how much.23 To make these data as useful as possible, the net price data would need to incorporate non-Title IV recipients.
Current Federal Investment: Institution-level information is avail-able on federal grant, loan, and work-study expenditures through the Federal Student Aid Data Center (http://studentaid.ed.gov/data-center). However, while national trends show that 35 percent of tax credit expenditures benefit families making more than $75,000 annually, more detailed data are not avail-able by state and institution.24 The Internal Revenue Service (IRS) likely could generate this more detailed information, disaggregated by student/family income, using the institution
BOX 3. Additional Data for Policymakers
name and address included on the 1098-T—the tax form insti-tutions must complete to allow students to claim education tax benefits.25 This process could be streamlined if the IRS added an IPEDS UnitID field to the filer portion of the 1098-T.
Investments to Promote Access and Completion: Measures of state investment per completion can be calculated using existing data sources,26 but other measures of investment per completion may be useful as well. These data on investments could be useful in quantifying the impact of public investment, but also should be interpreted with care and not used to measure program effectiveness inappropriately. For example, the population of students receiving Pell grants differs from the population of students receiving tax benefits in a number of ways, including the number and type of obstacles to success they face. As such, if dollars per completion proved to be lower for tax benefits than for Pell grants, that finding would not indi-cate that tax benefits are more efficient.
21 Federal Pell Grant program of the Higher Education Act-Background, Recent Changes, and Current Legislative Issues, Congressional Research Service, 5.31.2011. Retrieved from: http://www.nasfaa.org/EntrancePDF.aspx?id=5410.
22 Stephen Burd, “A Troubling Milestone for Higher Education” (Washington, DC: New America Foundation, 2011). Retrieved from: http://higheredwatch.newamerica.net/blogposts/2011/a_trou-bling_milestone_for_higher_education-59952. 40th Annual Survey Report on State-Sponsored Student Financial Aid: 2011-2012 Academic Year. (Washington, DC: National Association of State Student Grant and Aid Programs, 2013). Retrieved from: http://www.nassgap.org/viewrepository.aspx?categoryID=3#.
23 See technical report for other proposed changes to the net price data in IPEDS.24 “Trends in Student Aid,” (Washington, DC: The College Board 2013), 27. Retrieved from: https://
trends.collegeboard.org/sites/default/files/student-aid-2013-full-report.pdf. 25 1098-T. Internal Revenue Service. Retrieved from: http://www.irs.gov/pub/irs-pdf/f1098t.pdf. 26 The State Higher Education Executive Officers (SHEEO) reports annually on state higher educa-
tion appropriations. These data could be combined with IPEDS completion data to calculate investment per completion.
08 MAPPING THE POSTSECONDARY DATA DOMAIN: PROBLEMS AND POSSIBILITIES
campus leaders identify roadblocks and change institutional policies to pave the way for greater levels of student success. In fact, many institutional researchers and campus leaders already are leading the way by using fine-grained, campus-level data to inform institutional policy and program development.29 (For more details on institutional data needs, see BOX 4.)
While each of these constituencies—students, policymakers, and institutions—do have their own unique data needs (see all boxes), there does appear to be a core set of questions about
29 Joseph Yeado, Kati Haycock, Rob Johnstone, and Priyadarshini Chaplot. “Learning from High-Performing and Fast-Gaining Institutions” (Washington, DC, The Education Trust, 2014). Retrieved from http://www.edtrust.org/sites/edtrust.org/files/publications/files/PracticeGuide.pdf.
postsecondary education that applies to all of these actors, proving useful to these primary constituencies, as well as the media and other public interest groups. A review of the current data landscape, from voluntary national initiatives such as Complete College America and Access to Success30 to state dashboards and the federal College Scorecard, shows an emerging consensus around the general questions as well as signs of agreement on the measures to answer them.
30 IHEP reviewed a variety of voluntary initiatives, including Access to Success, Achieving the Dream, College Measures, Completion by Design, National Community College Benchmark Project, Predictive Analytics Reporting Framework, Student Accountability Measure, Transparency By Design, Voluntary Framework for Accountability, and Voluntary System of Accountability.
Colleges and universities hold a wealth of data beyond what is reported to governmental agencies, or even to voluntary initia-tives or accrediting bodies. And research has shown that delib-erate use of that data as part of a data-driven culture can be the impetus for substantial improvements in student outcomes.27 To develop effective institution- and department-level policies, colleges and universities need more specific, fine-grained data on student progression than are necessary for policymakers or students, including:
• Successful credit accumulation by semester or year• Year-to-year (or semester-to-semester) persistence• Developmental course sequence completion rates• Gateway course completion rates, disaggregated by
developmental education needs • Courses with high drop, failure, or withdrawal rates28
BOX 4. Additional Data for Institutions
Minimally, each metric should be disaggregated by race/ethnicity, socioeconomic status, and other indicators of interest for the campus. Close analysis of these key benchmarks can help institutions identify and remove early roadblocks to student success and change policies to smooth the pathway to a credential. Such improvement requires not only data collec-tion, but also close and continued coordination between the institutional research office and other key departments, such as student affairs, academic affairs, and financial aid. The real power of data—particularly at the institution level—comes from translating data into information so people can drive change.
27 Jennifer Engle, Replenishing Opportunity in America, “Case Studies: University of Wisconsin-Eau Claire and Florida State University”; Rima Brusi, Replenishing Opportunity in America, “Case Study: San Diego State University” (Washington, DC: The Education Trust, 2012). Retrieved from: http://www.edtrust.org/issues/higher-education/access-to-success.
28 Joseph Yeado, Kati Haycock, Rob Johnstone, and Priyadarshini Chaplot. “Top 10 Analyses to Provoke Discussion and Action on College Completion” (Washington, DC: The Education Trust, 2014). Retrieved from: http://www.edtrust.org/sites/edtrust.org/files/publications/files/Practice-Guide.pdf. See this paper for more on institutional use of data.
09 INSTITUTE FOR HIGHER EDUCATION POLICY
What are the Core Postsecondary Questions and Measures—and are the Data Available?
In the recent discourse about measuring value or return on investment in higher education, core questions have emerged around access, completion, cost, and outcomes. In recent years, voluntary initiatives attempting to answer these four questions have proliferated, often collecting and reporting information not publicly available in national data sets.
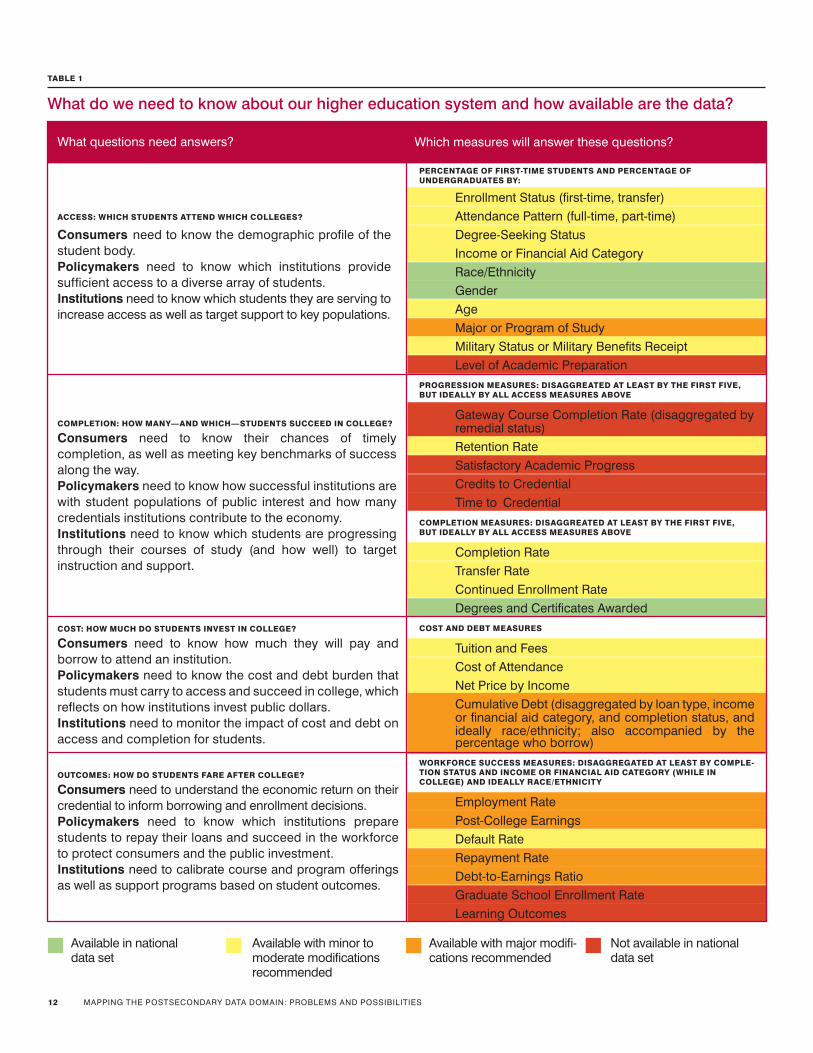
Yet, while the definitions differ across these initiatives, the measures themselves are quite similar. TABLE 1 maps the core set of questions to a common set of measures representing the essential information around which the field is beginning to converge in terms of what consumers, policymakers, and institu-tions need to know. The color coding provides a snapshot of the data’s current status in publicly accessible national data sets.
Data availability for each of these areas varies widely, from being fully available in national data sets to being available but needing varying degrees of modification to not being available at all (see TABLE 1). Data points on access, for example, are either readily available in national data sets such as IPEDS or could be refined fairly easily to answer core questions adequately. Data in other areas—such as progression and outcomes—are less readily available, but could be obtained or modified to meet today’s informational needs. For more details on the precise limitations of existing measures and specific
recommendations for improvement, see this paper’s accompa-nying technical report.
ACCESS: Which students are attending which colleges? The makeup of the student body provides critical context to consumers who want to know the demographic profile of the college; policymakers who need to understand which institu-tions are serving which populations; and institutions, as they set access goals and measure progress toward them. Not only does this demographic information on college enrollments allow interested parties to gauge status and progress on access-related metrics, but it also helps them understand who does or does not succeed at an institution.
As shown in TABLE 1, national data sets, specifically IPEDS, provide a strong base of information about college access, reporting sufficient data on enrollments by race/ethnicity and
10 MAPPING THE POSTSECONDARY DATA DOMAIN: PROBLEMS AND POSSIBILITIES
gender. Other key enrollment measures—such as enrollment status, attendance pattern, degree-seeking status, income or financial aid category, age, and military status or military bene-fits receipt—are available, but in need of minor or moderate improvements. For example, a number of these enrollment variables are available in the IPEDS Fall Enrollment Survey, but not the 12-Month Enrollment Survey, which is more inclusive of 21st-century-college students—many of whom do not begin college in the traditional fall semester. Data on enrollment by program of study poses larger challenges, requiring additional analysis and reporting by institutions.
Information on academic preparation is not adequately avail-able in national data sets. IPEDS includes only SAT/ACT scores, which are not relevant at many community colleges and other open-access institutions. However, dozens of states and hundreds of public institutions participating in initiatives such as Achieving the Dream, Complete College America,
and the Voluntary Framework of Accountability are reporting which students are placing into and/or receiving remedial education and completing gateway coursework, demon-strating potential feasibility for a national collection of this key indicator through IPEDS.
Given the current state of access data, several minor or moderate changes—and some more substantive revisions—could allow IPEDS to offer a clear picture of which students have access to which institutions.
COMPLETION: How many—and which—students succeed in college? When making a college decision, students need to know their chances of success at a particular institution to ensure their investment of time, money, and effort produces value in terms of a credential or productive transfer. At the same time, policy-makers require data on what proportion of students complete,
11 INSTITUTE FOR HIGHER EDUCATION POLICY
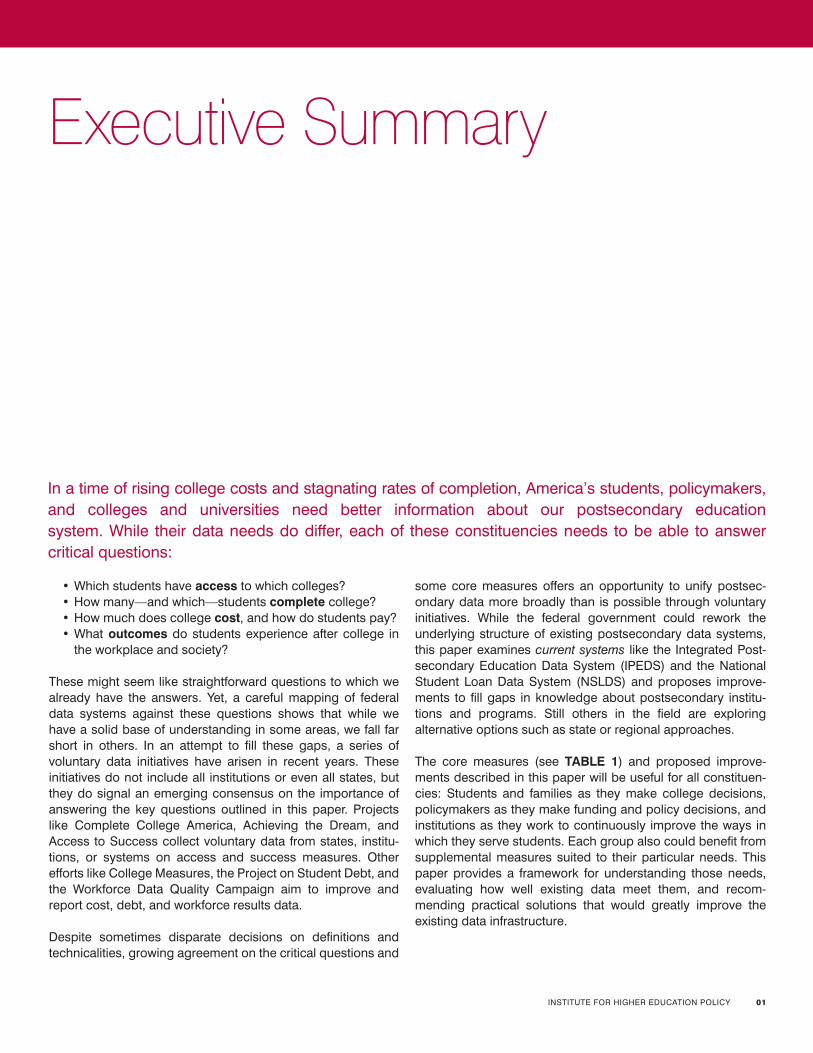
What do we need to know about our higher education system and how available are the data?
TABLE 1
ACCESS: WHICH STUDENTS ATTEND WHICH COLLEGES?
Consumers need to know the demographic profile of the student body.Policymakers need to know which institutions provide sufficient access to a diverse array of students.Institutions need to know which students they are serving to increase access as well as target support to key populations.
PERCENTAGE OF FIRST-TIME STUDENTS AND PERCENTAGE OF UNDERGRADUATES BY:
Enrollment Status (first-time, transfer) Attendance Pattern (full-time, part-time) Degree-Seeking Status Income or Financial Aid Category Race/Ethnicity Gender Age Major or Program of Study Military Status or Military Benefits Receipt Level of Academic Preparation
PROGRESSION MEASURES: DISAGGREATED AT LEAST BY THE FIRST FIVE, BUT IDEALLY BY ALL ACCESS MEASURES ABOVE
Gateway Course Completion Rate (disaggregated by remedial status) Retention Rate Satisfactory Academic Progress Credits to Credential Time to Credential
COMPLETION MEASURES: DISAGGREATED AT LEAST BY THE FIRST FIVE, BUT IDEALLY BY ALL ACCESS MEASURES ABOVE
Completion Rate Transfer Rate Continued Enrollment Rate Degrees and Certificates Awarded
COST AND DEBT MEASURES
Tuition and Fees Cost of Attendance Net Price by Income Cumulative Debt (disaggregated by loan type, income
or financial aid category, and completion status, and ideally race/ethnicity; also accompanied by the percentage who borrow)
WORKFORCE SUCCESS MEASURES: DISAGGREGATED AT LEAST BY COMPLE-TION STATUS AND INCOME OR FINANCIAL AID CATEGORY (WHILE IN COLLEGE) AND IDEALLY RACE/ETHNICITY
Employment Rate Post-College Earnings Default Rate Repayment Rate Debt-to-Earnings Ratio Graduate School Enrollment Rate Learning Outcomes
COMPLETION: HOW MANY—AND WHICH—STUDENTS SUCCEED IN COLLEGE?
Consumers need to know their chances of timely completion, as well as meeting key benchmarks of success along the way.Policymakers need to know how successful institutions are with student populations of public interest and how many credentials institutions contribute to the economy.Institutions need to know which students are progressing through their courses of study (and how well) to target instruction and support.
COST: HOW MUCH DO STUDENTS INVEST IN COLLEGE?
Consumers need to know how much they will pay and borrow to attend an institution.Policymakers need to know the cost and debt burden that students must carry to access and succeed in college, which reflects on how institutions invest public dollars.Institutions need to monitor the impact of cost and debt on access and completion for students.
OUTCOMES: HOW DO STUDENTS FARE AFTER COLLEGE?
Consumers need to understand the economic return on their credential to inform borrowing and enrollment decisions.Policymakers need to know which institutions prepare students to repay their loans and succeed in the workforce to protect consumers and the public investment.Institutions need to calibrate course and program offerings as well as support programs based on student outcomes.
Which measures will answer these questions? What questions need answers?
Available in national data set
Available with major modifi-cations recommended
Not available in national data set
Available with minor to moderate modifications recommended
12 MAPPING THE POSTSECONDARY DATA DOMAIN: PROBLEMS AND POSSIBILITIES
transfer, or are still enrolled—along with the total number of credentials awarded—to inform decisions about resource allocation and accountability. Institutions, in their continual efforts to improve, cannot do so without knowing their current level of performance with the students they serve. Further, it is critical to disaggregate completion data by key demographic characteristics, since all too often, low-income students and students of color face lower chances of college success than their classmates.31
Completion data are available in IPEDS and widely used, but they suffer from a series of oft-lamented—yet highly fixable—limitations (see TABLE 1). Existing graduation rates require moderate modifications to reflect the realities of today’s college-goers, who do not all enter as first-time, full-time students. Minor or moderate modifications also could produce better information on transfer rates that would measure student movement from community colleges to four-year institutions. The new outcome measures, scheduled to be added to IPEDS in the 2015–16 collection cycle, will provide additional informa-tion on part-time and transfer students. But, as we discuss in more detail in our technical report, these new measures do not align with the existing Graduation Rate Survey (GRS), and as a result, will not produce the data necessary to answer the following questions:
• How many students transfer from a community college to a four-year institution?
• What are the graduation rates for bachelor’s seeking-stu-dents who enter institutions as transfers?
• What proportion of first-time, part-time community college students graduate within two, three, four, or five years?
Aligning the two surveys would not only result in more usable data, but also reduce burden on institutions by streamlining the collection and reporting process.
Progression measures—which can provide crucial insights into student momentum, offering earlier indicators of student success than backward-looking completion measures32—would require more effort to be made available in a useful way. While the current IPEDS retention rates could be improved with minor to moderate effort, data do not yet exist at the national level on other key measures, including gateway course comple-tion rates, Satisfactory Academic Progress (SAP) rates, and credits or time to credential. These data could be incorporated
31 Mamie Lynch and Jennifer Engle, “Big Gaps, Small Gaps: Some Colleges and Universities Do Better Than Others in Graduating Hispanic Students” and “Big Gaps, Small Gaps: Some Colleges and Universities Do Better Than Others in Graduating African-American Students.” (Washington, DC: The Education Trust, August 2010). Retrieved from: http://www.edtrust.org/dc/publication/big-gaps-small-gaps-in-serving-hispanic-students and http://www.edtrust.org/dc/publication/big-gaps-small-gaps-in-serving-african-american-students.
32 Jeremy Offenstein, Colleen Moore and Nancy Shulock. “Advancing By Degrees: A Framework for Increasing College Completion.” (Washington, DC: The Education Trust, 2010). Retrieved from: http://www.edtrust.org/sites/edtrust.org/files/publications/files/AdvbyDegrees_0.pdf.
into IPEDS to signal their importance and provide useful infor-mation to consumers and policymakers. With the exception of SAP, each of these progression measures are currently being reported by participants in voluntary national initiatives, and a number of states have begun to utilize these measures in their performance-based funding systems.33
It would be ideal if the progression and completion measures were available disaggregated by all of the enrollment measures identified above, but as long as institution-level IPEDS surveys remain the primary data collection mechanism for higher education, it likely would be too burdensome to collect all of those permutations. Minimally, IPEDS should begin collecting information on the success of students by income or financial aid category, since a number of institutions are already doing so through voluntary collections, including to U.S. News and World Report, and are legally required to disclosure this infor-mation upon request.34
COST: How much do students invest in college, especially through debt? At a time when college tuition and fees are increasing faster than inflation, family income, and health care costs,35 data on college costs are critical to informing student decisions, public investment, and institutional policies. Students need clear information about how much college will cost—not just their first year, but their entire time at an institution—and how much they should expect to borrow. Policymakers in the federal government, states, and institutions need to know how much students and their families actually pay and borrow to attend college, and to understand the impact of growing cost and debt on college access and completion. Debt data are important in the aggregate, but even more instructive when disaggregated, especially by whether or not students complete the degrees they sought.
IPEDS already includes a substantial amount of information on college prices, and NSLDS includes data on cumulative debt loads. Tuition and fees and cost of attendance data accurately summarize sticker prices for first-time, full-time students, and
33 Dennis P. Jones, “Outcomes-Based Funding: The Wave of Implementation” (Washington, DC: National Center for Higher Education Management Systems for Complete College America, 2013). Retrieved from: http://www.completecollege.org/pdfs/Outcomes-Based-Funding-Report-Final.pdf.
34 Robert Morse and Diane Tolis, “Measuring Colleges’ Success Graduation Low-Income Students, Measuring Colleges’ Success Graduating Students with Subsidized Stafford Loans, Measuring Colleges’ Success Graduating Students with Higher-Income Students,” (U.S. News & World Report, 2013 and 2014). http://www.usnews.com/education/blogs/college-rankings-blog/2013/10/17/measuring-colleges-success-graduating-low-income-students, http://www.usnews.com/education/blogs/college-rankings-blog/2013/11/21/measuring-colleges-suc-cess-graduating-students-with-subsidized-stafford-loans, http://www.usnews.com/education/blogs/college-rankings-blog/2014/01/30/measuring-colleges-success-graduating-higher-in-come-students. Kevin Carey and Andrew P. Kelly, “The Truth Behind Higher Education Disclosure Laws,” (Washington, DC: Education Sector, 2011), 4. Retrieved from: http://www.educationsector.org/sites/default/files/publications/HigherEdDisclosure_RELEASE.pdf.
35 “College Costs Rising Four Times Faster Than Income, Two and a Half Times Faster Than Pell” (Washington, DC: Center for Law and Social Policy). http://www.clasp.org/issues/postsecondary/pages/college-costs-rising-four-times-faster-than-income-two-and-a-half-times-faster-than-pell#sthash.EZrEvnlf.dpuf.
13 INSTITUTE FOR HIGHER EDUCATION POLICY
Another critical component of college value is how much students learn at a particular institution. While graduation rates are a basic measure of quality, and employment outcomes approximate what students gain in the labor market from a program of study, learning outcomes may offer a truer measure of college quality. The purpose of college, after all, is to impart learning to students, so they can succeed in the workforce and
BOX 5. Questions abound about learning outcomes, but answers lag
society. A variety of efforts and tools, including the Degree Qual-ifications Profile, the Voluntary System of Accountability, and the Collegiate Learning Assessment are attempting to measure learning in practical ways. This area is ripe for research, and as these efforts continue to develop, measures of student learning should be incorporated into publicly available data sets to inform consumers, policymakers, and institutions.
net price adds further value by representing out-of-pocket costs for students. Through minor and moderate modifications, IPEDS could expand pricing information to include continuing and transfer students. After all, college is at least a two- or four-year investment for the majority of students, so families need access to more than one year of data. IPEDS also could improve net price data by incorporating non-aided students, a change that would require no more data collection from institu-tions, but would more accurately represent what students must pay for college.
The inclusion of cumulative debt in the College Scorecard using NSLDS was a positive step, but the figures include both completers and non-completers, producing confusing results for prospective students. An institution with high-dropout rates and high costs can show a similar debt number as a low-cost institution with high graduation rates simply because students are enrolled in the high-cost institution for a shorter period of time. Integrating cumulative debt data into IPEDS and disag-gregating it by completion status in particular, rather than relying on the limitations in NSLDS, would require more substantial, yet doable, changes.
OUTCOMES: How do students fare after college?On the whole, the evidence is clear that college produces a sound return on investment—not only in terms of income, but also improved social mobility, health outcomes, civic involve-ment, and employment benefits such as health insurance.36 However, available data show that at least completion and
36 Anthony Carnevale, Stephen J. Rose, and Ban Cheah. “The College Payoff: Education, Occupa-tions, Lifetime Earnings” (Washington, DC: The Georgetown University Center on Education and the Workforce, August 2011). Retrieved from: http://www9.georgetown.edu/grad/gppi/hpi/cew/pdfs/collegepayoff-complete.pdf. Sandy Baum, Jennifer Ma, and Kathleen Payea, “Education Pays 2013: The Benefits of Higher Education for Individuals and Society.” (New York, N.Y.: The College Board, October 2013). Retrieved from: https://trends.collegeboard.org/sites/default/files/education-pays-2013-full-report.pdf.
employment outcomes vary by institution and program, as noted previously.37 It is impractical to expect students and their families to make informed financial decisions about how much to pay and how much to borrow for college without some basic information on post-college employment, short- and long-term earnings, and loan repayment. Similarly, these types of data can help policymakers identify institutions and programs that are preparing students well for the workforce and for loan repayment, and sanction those setting students up for financial difficulties. Institutions can use these data to tweak program content, adjust job counseling policies, or rethink connections with industry to benefit their students in the long run.
Our current system makes data on outcomes less readily avail-able than access, completion, and cost data. For decades, the federal government has calculated and reported cohort default rates, which could be improved to meet today’s data needs with only minor modifications. Earnings and repayment data, on the other hand, are less readily available and have only been calculated at the federal level as part of gainful employ-ment regulations. As a result, collecting data on employment rates, post-college earnings, repayment rates, and debt-to-earnings ratios would require more substantial changes, either through new reporting by the U.S. Department of Education or expanding linkages with non-education federal data sets. Such linkages are possible and are detailed in this paper’s technical report and in the Center for Law and Social Policy’s forthcoming paper on workforce results data. Data on learning outcomes and other positive public outcomes of higher education are not yet widely available, but as research strengthens understanding of these data, they also will prove critical for all constituencies (see BOX 5).
37 “2011 Gainful Employment Informational Metrics,” (Washington, DC: Federal Student Aid, U.S. Department of Education). http://studentaid.ed.gov/about/data-center/school/ge/data.
14 MAPPING THE POSTSECONDARY DATA DOMAIN: PROBLEMS AND POSSIBILITIES
How Can We Better Use Postsecondary Data?
This paper, along with the accompanying technical report, attempt to bring clarity to calls for better data. However, “better data” can be a nebulous term that, on its own, fails to explain what information is lacking in our postsecondary system. In fact, some may argue that consumers, in particular, face too much data when trying to make college decisions.
The truth is, better data does not necessarily mean more data (though in some cases, as outlined in this paper, it does), but rather more useful data collected, compiled, and presented in a usable way.
The push for better collection and presentation of consumer information in higher education is not new. A number of federal initiatives—including the College Scorecard, Financial Aid Shopping Sheet, net price calculators, College Navigator, NSLDS Student Access portal, FAFSA IRS Data Retrieval Tool, IRS Get Transcript, FAFSA API, and the proposed Postsecondary Institution Rating System—have recently attempted to convert data and information into consumer-friendly tools and products to simplify the college application and financial aid process. Initial research on the net price calculators, College Scorecard, and Shopping Sheet indicates that to be effective, these tools must be easy to find and easy to use, define terms in plain language, present customized information wherever possible, use a streamlined design that is visually engaging, and make information relevant to students.38
38 Diane Cheng, “Adding it All Up 2012: Are College Net Price Calculators Easy to Find, Use, and Compare?” (Oakland, Calif.: The Institute for College Access and Success, 2012). 10–16.
Perhaps the most critical component of consumer tools is getting them into the hands of students. Even the best tool is useless if students do not know it exists. The Education Depart-ment must continue to explore outreach strategies—including counselor education, partnerships with college access programs and organizations, and coordination with states and other federal agencies—to ensure these tools are actually reaching students. In the same vein, we recommend that Congress mandate that all institutions use the Shopping Sheet to allow it to achieve its intended purpose of providing apples-to-apples comparisons across all colleges.
Retrieved from: http://www.ticas.org/files/pub/Adding_It_All_Up_2012.pdf. “No Clear Winner: Consumer Testing of Financial Aid Award Letters,”(Washington, DC: National Association of Student Financial Aid Administrators and JBL Associates, Inc., 2013), http://www.nasfaa.org/advo-cacy/award-letter/No_Clear_Winner__Consumer_Testing_of_Financial_Aid_Award_Letters_-_Summary___Report.aspx. Julie Morgan, “Improving the College Scorecard: Using Student Feedback to Create an Effective Disclosure,” (Washington, DC, Center for American Progress, 2012), http://www.americanprogress.org/issues/higher-education/report/2012/12/02/46306/improving-the-college-scorecard/. Julie Morgan and Gadi Dechter, “The New College Scorecard is a Much Needed Improvement,” (Washington, DC: Center for American Progress, 2012), http://www.americanprogress.org/issues/higher-education/news/2013/02/14/53493/the-new-college-scorecard-is-a-much-needed-improvement/.
15 INSTITUTE FOR HIGHER EDUCATION POLICY
Beyond distributing well-designed consumer tools, federally funded programs aimed at supporting students and institutions might also incorporate data requirements and data-use tools into their design to inform policymakers and program staff. The current reporting requirements for most federally funded grant programs are fairly basic and compliance oriented, but could be enhanced, especially by aligning them with the core measures identified in this paper. The U.S. Department of Education (or other relevant agency) could strengthen these requirements, make them as consistent as possible across programs, and compile the data in user-friendly tools that lend themselves toward data use rather than simple compliance. Programs could use these tools to evaluate and improve their performance. Programs to consider for enhanced reporting and data use include the following:
• GEAR UP• TRIO programs • Title III and Title V programs• College Access Challenge Grants• Race to the Top for higher education (proposed)• First in the World competition• Department of Labor’s Trade Adjustment Assistance Commu-
nity College and Career Training (TAACCCT) program• Department of Defense and Veteran’s Affairs
education programs
Finally, the Department of Education should consider the types of tools and support that institutions need to make more delib-erate use of the data they are required to report to national data sets—as well as the wealth of data available at the campus level—to drive improvement for their students. Developing interfaces that allow institutions to easily examine trends in their data over time and make comparisons with peer institu-tions could be done with existing IPEDS and NSLDS data. Initiatives and organizations like Achieving the Dream, the Education Delivery Institute, and the Center for Urban Educa-tion’s Equity Scorecard demonstrate effective models for working with institutions of higher education to apply data in practical ways. By incorporating data into routine processes on campus, institutional leaders can identify barriers to success for students, struggling programs, or administrative hurdles that they did not realize existed. As data uncover the nuances of campus policies and practices, administrators and faculty can adapt to offer students the best chances of success. For more on institutional use of data, (see BOX 4).
16 MAPPING THE POSTSECONDARY DATA DOMAIN: PROBLEMS AND POSSIBILITIES
What is Next on the Postsecondary Data Frontier?
Our current postsecondary data systems provide enough data to paint a broad picture of institutional performance, but they do not offer the detailed information necessary to answer core questions facing students, policymakers, and colleges and universities. We can no longer afford to leave vital questions unanswered. Rather, all constituents need clear answers to questions like the following:
• Which students attend which colleges?• How many and which students graduate and/or transfer? • What level of debt do students accumulate, and are they
able to repay it?• How successful are students after they leave college?
Better data on the core metrics outlined in this paper—and clear communication, interpretation, and use of those data—can answer these questions and lead to better outcomes through more informed student choice, strategic policymaker
investments, and deliberate institutional improvements. More-over, these improvements are highly attainable, as signaled by the plethora of voluntary initiatives that have already taken on this task among subsets of states, systems, and institutions. Building on the momentum of those efforts, we now need a comprehensive, nationwide approach to postsecondary data—one that will provide critical answers for key constituents. To accomplish this, we can enhance our current databases with measures designed to answer pressing postsecondary ques-tions for students, policymakers, and colleges and universities.

The Institute for Higher Education Policy (IHEP) is a nonpartisan, nonprofit organization committed to promoting access to and success in higher education for all students. Based in Washington, D.C., IHEP develops innovative policy- and practice-oriented research to guide policy-makers and education leaders, who develop high-impact policies that will address our nation’s most pressing education challenges.
INSTITUTE FOR HIGHER EDUCATION POLICY
1825 K Street, N.W., Suite 720Washington, DC 20006
202 861 8223 TELEPHONE
202 861 9307 FACSIMILE
www.ihep.org WEB
Related Documents