Mapping surface plasmon polariton propagation via counter-propagating light pulses Christoph Lemke, 1,* Till Leißner, 1 Stephan Jauernik, 1 Alwin Klick, 1 Jacek Fiutowski, 2 Jakob Kjelstrup-Hansen, 2 Horst-Günter Rubahn, 2 and Michael Bauer 1 1 Institut für Experimentelle und Angewandte Physik, Christian-Albrechts-Universität zu Kiel, 24098 Kiel, Germany 2 Mads Clausen Institute, NanoSYD, University of Southern Denmark, Alsion 2, DK-6400 Sønderborg, Denmark * [email protected] Abstract: In an interferometric time-resolved photoemission electron microscopy (ITR-PEEM) experiment, the near-field associated with surface plasmon polaritons (SPP) can be locally sensed via interference with ultrashort laser pulses. Here, we present ITR-PEEM data of SPP propagation at a gold vacuum interface recorded in a counter-propagating pump-probe geometry. In comparison to former work this approach provides a very intuitive real-time access to the SPP wave packet. The quantitative analysis of the PEEM data enables us to determine in a rather direct manner the propagation characteristics of the SPP. ©2012 Optical Society of America OCIS codes: (240.6675) Surface photoemission and photoelectron spectroscopy; (240.6680) Surface plasmons; (320.2250) Femtosecond phenomena. References and links 1. E. Ozbay, “Plasmonics: merging photonics and electronics at nanoscale dimensions,” Science 311(5758), 189– 193 (2006). 2. N. J. Halas, “Plasmonics: an emerging field fostered by nano letters,” Nano Lett. 10(10), 3816–3822 (2010). 3. M. L. M. Balistreri, H. Gersen, J. P. Korterik, L. Kuipers, and N. F. van Hulst, “Tracking femtosecond laser pulses in space and time,” Science 294(5544), 1080–1082 (2001). 4. O. Schmidt, M. Bauer, C. Wiemann, R. Porath, M. Scharte, O. Andreyev, G. Schönhense, and M. Aeschlimann, “Time-resolved two photon photoemission electron microscopy,” Appl. Phys. B 74(3), 223–227 (2002). 5. H. Gersen, T. J. Karle, R. J. P. Engelen, W. Bogaerts, J. P. Korterik, N. F. van Hulst, T. F. Krauss, and L. Kuipers, “Real-space observation of ultraslow light in photonic crystal waveguides,” Phys. Rev. Lett. 94(7), 073903 (2005). 6. R. J. P. Engelen, Y. Sugimoto, H. Gersen, N. Ikeda, K. Asakawa, and L. Kuipers, “Ultrafast evolution of photonic eigenstates in k-space,” Nat. Phys. 3(6), 401–405 (2007). 7. A. Kubo, N. Pontius, and H. Petek, “Femtosecond microscopy of surface plasmon polariton wave packet evolution at the silver/vacuum interface,” Nano Lett. 7(2), 470–475 (2007). 8. M. Bauer, C. Wiemann, J. Lange, D. Bayer, M. Rohmer, and M. Aeschlimann, “Phase propagation of localized surface plasmons probed by time-resolved photoemission electron microscopy,” Appl. Phys., A Mater. Sci. Process. 88(3), 473–480 (2007). 9. F. Meyer zu Heringdorf, L. Chelaru, S. Mollenbeck, D. Thien, and M. Horn von Hoegen, “Femtosecond photoemission microscopy,” Surf. Sci. 601(20), 4700–4705 (2007). 10. W. Swiech, G. H. Fecher, C. Ziethen, O. Schmidt, G. Schönhense, K. Grzelakowski, C. M. Schneider, R. Frömter, H. P. Oepen, and J. Kirschner, “Recent progress in photoemission microscopy with emphasis on chemical and magnetic sensitivity,” J. Electron Spectrosc. Relat. Phenom. 84, 171–188 (1997). 11. M. U. Wehner, M. H. Ulm, and M. Wegener, “Scanning interferometer stabilized by use of Pancharatnam’s phase,” Opt. Lett. 22(19), 1455–1457 (1997). 12. T. Leißner, K. Thilsing-Hansen, C. Lemke, S. Jauernik, J. Kjelstrup-Hansen, M. Bauer, and H.-G. Rubahn, “Surface plasmon polariton emission prompted by organic nanofibers on thin gold films,” Plasmonics, doi:10.1007/s11468-011-9301-9. 13. H. Ditlbacher, J. R. Krenn, N. Felidj, B. Lamprecht, G. Schider, M. Salerno, A. Leitner, and F. R. Aussenegg, “Fluorescence imaging of surface plasmon fields,” Appl. Phys. Lett. 80(3), 404–406 (2002). 14. P. Lalanne, J. P. Hugonin, H. T. Liu, and B. Wang, “A microscopic view of the electromagnetic properties of sub-lambda metallic surfaces,” Surf. Sci. Rep. 64(10), 453–469 (2009). 15. L. Zhang, A. Kubo, L. Wang, H. Petek, and T. Seideman, “Imaging of surface plasmon polariton fields excited at a nanometer-scale slit,” Phys. Rev. B 84(24), 245442 (2011). #165333 - $15.00 USD Received 23 Mar 2012; revised 13 Apr 2012; accepted 16 Apr 2012; published 23 May 2012 (C) 2012 OSA 4 June 2012 / Vol. 20, No. 12 / OPTICS EXPRESS 12877

Welcome message from author
This document is posted to help you gain knowledge. Please leave a comment to let me know what you think about it! Share it to your friends and learn new things together.
Transcript
Mapping surface plasmon polariton propagation
via counter-propagating light pulses
Christoph Lemke,1,*
Till Leißner,1 Stephan Jauernik,
1 Alwin Klick,
1 Jacek Fiutowski,
2
Jakob Kjelstrup-Hansen,2 Horst-Günter Rubahn,
2 and Michael Bauer
1
1Institut für Experimentelle und Angewandte Physik, Christian-Albrechts-Universität zu Kiel, 24098 Kiel, Germany 2Mads Clausen Institute, NanoSYD, University of Southern Denmark, Alsion 2, DK-6400 Sønderborg, Denmark
Abstract: In an interferometric time-resolved photoemission electron
microscopy (ITR-PEEM) experiment, the near-field associated with surface
plasmon polaritons (SPP) can be locally sensed via interference with
ultrashort laser pulses. Here, we present ITR-PEEM data of SPP
propagation at a gold vacuum interface recorded in a counter-propagating
pump-probe geometry. In comparison to former work this approach
provides a very intuitive real-time access to the SPP wave packet. The
quantitative analysis of the PEEM data enables us to determine in a rather
direct manner the propagation characteristics of the SPP.
©2012 Optical Society of America
OCIS codes: (240.6675) Surface photoemission and photoelectron spectroscopy; (240.6680)
Surface plasmons; (320.2250) Femtosecond phenomena.
References and links
1. E. Ozbay, “Plasmonics: merging photonics and electronics at nanoscale dimensions,” Science 311(5758), 189–
193 (2006).
2. N. J. Halas, “Plasmonics: an emerging field fostered by nano letters,” Nano Lett. 10(10), 3816–3822 (2010).
3. M. L. M. Balistreri, H. Gersen, J. P. Korterik, L. Kuipers, and N. F. van Hulst, “Tracking femtosecond laser
pulses in space and time,” Science 294(5544), 1080–1082 (2001).
4. O. Schmidt, M. Bauer, C. Wiemann, R. Porath, M. Scharte, O. Andreyev, G. Schönhense, and M. Aeschlimann,
“Time-resolved two photon photoemission electron microscopy,” Appl. Phys. B 74(3), 223–227 (2002).
5. H. Gersen, T. J. Karle, R. J. P. Engelen, W. Bogaerts, J. P. Korterik, N. F. van Hulst, T. F. Krauss, and L.
Kuipers, “Real-space observation of ultraslow light in photonic crystal waveguides,” Phys. Rev. Lett. 94(7),
073903 (2005).
6. R. J. P. Engelen, Y. Sugimoto, H. Gersen, N. Ikeda, K. Asakawa, and L. Kuipers, “Ultrafast evolution of
photonic eigenstates in k-space,” Nat. Phys. 3(6), 401–405 (2007).
7. A. Kubo, N. Pontius, and H. Petek, “Femtosecond microscopy of surface plasmon polariton wave packet
evolution at the silver/vacuum interface,” Nano Lett. 7(2), 470–475 (2007).
8. M. Bauer, C. Wiemann, J. Lange, D. Bayer, M. Rohmer, and M. Aeschlimann, “Phase propagation of localized
surface plasmons probed by time-resolved photoemission electron microscopy,” Appl. Phys., A Mater. Sci.
Process. 88(3), 473–480 (2007).
9. F. Meyer zu Heringdorf, L. Chelaru, S. Mollenbeck, D. Thien, and M. Horn von Hoegen, “Femtosecond
photoemission microscopy,” Surf. Sci. 601(20), 4700–4705 (2007).
10. W. Swiech, G. H. Fecher, C. Ziethen, O. Schmidt, G. Schönhense, K. Grzelakowski, C. M. Schneider, R.
Frömter, H. P. Oepen, and J. Kirschner, “Recent progress in photoemission microscopy with emphasis on
chemical and magnetic sensitivity,” J. Electron Spectrosc. Relat. Phenom. 84, 171–188 (1997).
11. M. U. Wehner, M. H. Ulm, and M. Wegener, “Scanning interferometer stabilized by use of Pancharatnam’s
phase,” Opt. Lett. 22(19), 1455–1457 (1997).
12. T. Leißner, K. Thilsing-Hansen, C. Lemke, S. Jauernik, J. Kjelstrup-Hansen, M. Bauer, and H.-G. Rubahn,
“Surface plasmon polariton emission prompted by organic nanofibers on thin gold films,” Plasmonics,
doi:10.1007/s11468-011-9301-9.
13. H. Ditlbacher, J. R. Krenn, N. Felidj, B. Lamprecht, G. Schider, M. Salerno, A. Leitner, and F. R. Aussenegg,
“Fluorescence imaging of surface plasmon fields,” Appl. Phys. Lett. 80(3), 404–406 (2002).
14. P. Lalanne, J. P. Hugonin, H. T. Liu, and B. Wang, “A microscopic view of the electromagnetic properties of
sub-lambda metallic surfaces,” Surf. Sci. Rep. 64(10), 453–469 (2009).
15. L. Zhang, A. Kubo, L. Wang, H. Petek, and T. Seideman, “Imaging of surface plasmon polariton fields excited
at a nanometer-scale slit,” Phys. Rev. B 84(24), 245442 (2011).
#165333 - $15.00 USD Received 23 Mar 2012; revised 13 Apr 2012; accepted 16 Apr 2012; published 23 May 2012(C) 2012 OSA 4 June 2012 / Vol. 20, No. 12 / OPTICS EXPRESS 12877
16. B. Wang, L. Aigouy, E. Bourhis, J. Gierak, J. P. Hugonin, and P. Lalanne, “Efficient generation of surface
plasmon by single-nanoslit illumination under highly oblique incidence,” Appl. Phys. Lett. 94(1), 011114
(2009).
17. V. V. Temnov, U. Woggon, J. Dintinger, E. Devaux, and T. W. Ebbesen, “Surface plasmon interferometry:
measuring group velocity of surface plasmons,” Opt. Lett. 32(10), 1235–1237 (2007).
18. P. B. Johnson and R. W. Christy, “Optical constants of the noble metals,” Phys. Rev. B 6(12), 4370–4379
(1972).
1. Introduction
Surface plasmon polaritons (SPP), propagating electromagnetic modes that are bound to a
metal-dielectric interface, are considered as one of the key ingredients of next-generation
nano-photonic devices [1]. This promising perspective is one of the driving forces for the
multitude of current research activities in the field of plasmonics [2]. With regard to high-
speed applications well-founded means for the development of SPP-based devices rely on a
comprehensive knowledge of the spatio-temporal characteristics of ultrashort SPP pulses and
their modifications during formation and propagation. Optical pump-probe schemes in
combination with near-field microscopy [3] and photoemission electron microscopy (PEEM)
[4] techniques provide experimental means to track and visualize the two-dimensional SPP
propagation in space and time at sub-µm lateral and femtosecond temporal resolution. The
potential of both approaches in tracking the ultrafast SPP dynamics has been demonstrated in
numerous works in the recent past [5–9].
For these types of experiments the PEEM technique is operated in an interferometric time-
resolved mode (ITR-PEEM), and usually the properties of the SPP are probed via spatio-
temporal interference while SPP wave packet and the probing laser pulse are co-propagating,
as illustrated in Fig. 1(a). The entanglement of different contributions to the PEEM signal in
this detection scheme implicates, however, a rather indirect data interpretation. In this work
we demonstrate experimentally that a counter-propagating PEEM detection mode, as
illustrated in Fig. 1(b), provides a much more intuitive access to the SPP wave packet
propagation. Particularly the group velocity and the phase velocity of the SPP can be deduced
from these data in a very direct manner.
2. Experimental
The ITR-PEEM experiments were performed with a photoemission electron microscope (IS
PEEM, Focus GmbH) [10] mounted in an ultrahigh vacuum µ-metal chamber (base pressure
1× 10⁻¹⁰ mbar) and providing a lateral resolution of better than 40 nm. The interferometer is
an actively stabilized Mach-Zehnder interferometer following a design described in detail in
reference [11]. The stability of the interferometer allows us to adjust the temporal delay
between the two excitation laser pulses with a timing accuracy of better than 30 attoseconds.
The interferometer is also used for characterization of the laser pulse profile via second
harmonic generation interferometric autocorrelation measurements. These measurements are
performed in parallel to the ITR-PEEM experiments. Laser pulses are delivered by a
commercial Ti:Sapphire laser system providing 15 fs pulses at 816 nm and a pulse energy of 6 nJ. The laser pulses are p-polarized and hit the sample at an angle θ = 65° with respect to the
sample surface normal. More details of the experimental setup are described in [12].
For the experiments in the counter-propagating scheme we used 60 nm thick gold films
evaporated onto a silicon substrate (see Fig. 1(f)). A 2.25 µm wide and 140 nm high gold bar
was fabricated on top of the gold film by means of electron beam lithography, gold deposition
via evaporation, and lift-off. The two edges of the gold bar can provide the wave vector
required to overcome the wave vector mismatch between laser field and SPP [13] and are
used in the experiment as defined and localized sources for SPP wave packet emission. For
some of the experiments a 45 nm thick film of para-Hexaphenylene (p6P) molecules was
evaporated onto the gold film. Reference measurements in the co-propagating scheme were
#165333 - $15.00 USD Received 23 Mar 2012; revised 13 Apr 2012; accepted 16 Apr 2012; published 23 May 2012(C) 2012 OSA 4 June 2012 / Vol. 20, No. 12 / OPTICS EXPRESS 12878
performed at a flat rectangular gold pattern on silicon (see Fig. 1(e)). In this case, the wave
vector required for SPP excitation was provided by an edge of the gold pattern.
Prior to the PEEM measurements, the sample was covered under UHV conditions with a
small amount of Cesium (coverage << 1 monolayer) from a well degassed resistively heated
SAES getter source. This treatment is required to lower the work function of the gold surface
from a value of about 5.5 eV to about 3 eV to facilitate a two-photon photoemission process
with the 816 nm light pulses.
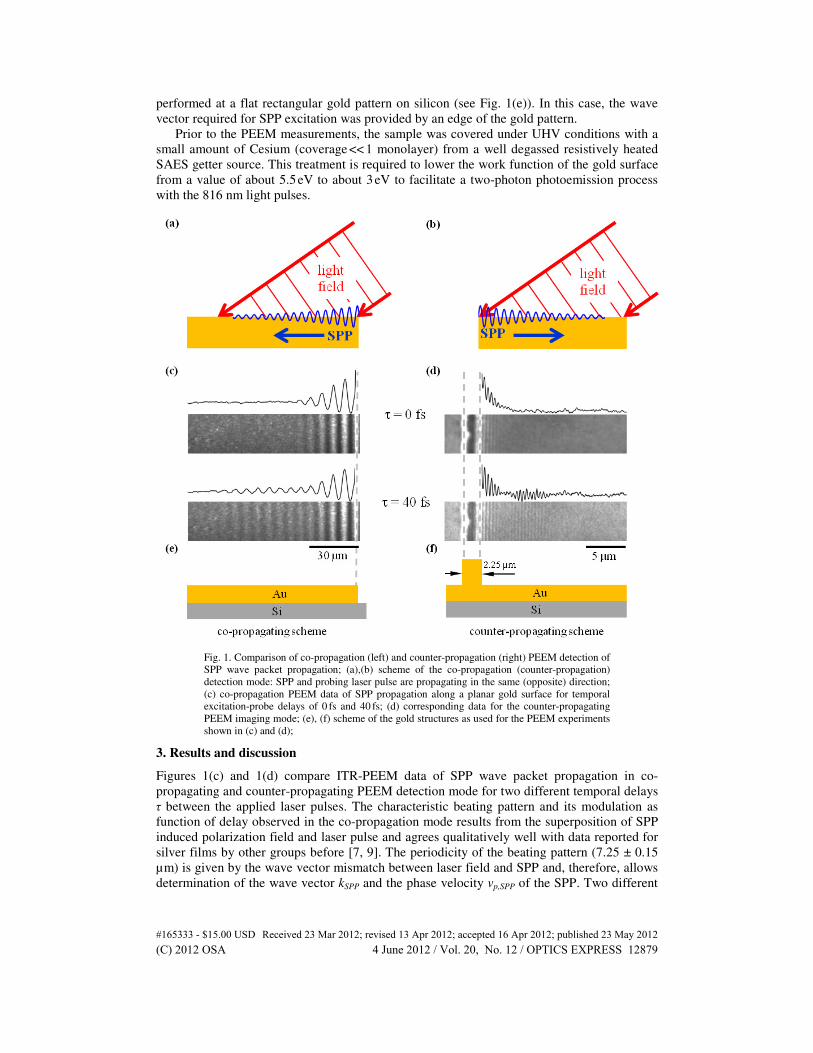
Fig. 1. Comparison of co-propagation (left) and counter-propagation (right) PEEM detection of
SPP wave packet propagation; (a),(b) scheme of the co-propagation (counter-propagation)
detection mode: SPP and probing laser pulse are propagating in the same (opposite) direction;
(c) co-propagation PEEM data of SPP propagation along a planar gold surface for temporal
excitation-probe delays of 0 fs and 40 fs; (d) corresponding data for the counter-propagating
PEEM imaging mode; (e), (f) scheme of the gold structures as used for the PEEM experiments
shown in (c) and (d);
3. Results and discussion
Figures 1(c) and 1(d) compare ITR-PEEM data of SPP wave packet propagation in co-
propagating and counter-propagating PEEM detection mode for two different temporal delays
τ between the applied laser pulses. The characteristic beating pattern and its modulation as
function of delay observed in the co-propagation mode results from the superposition of SPP
induced polarization field and laser pulse and agrees qualitatively well with data reported for
silver films by other groups before [7, 9]. The periodicity of the beating pattern (7.25 ± 0.15
µm) is given by the wave vector mismatch between laser field and SPP and, therefore, allows
determination of the wave vector kSPP and the phase velocity vp,SPP of the SPP. Two different
#165333 - $15.00 USD Received 23 Mar 2012; revised 13 Apr 2012; accepted 16 Apr 2012; published 23 May 2012(C) 2012 OSA 4 June 2012 / Vol. 20, No. 12 / OPTICS EXPRESS 12879
contributions in the imaged superposition field have to be distinguished: A dominating static
(delay-independent) term that starts right at the excitation edge of the gold film and that is
damped in the direction of SPP propagation. It is formed by the interference between SPP
wave packet and the laser pulse responsible for its excitation. Additionally, in the very
vicinity of the edge, this signal may also be affected or even dominated by contributions from
the excitation of so-called quasi-cylindrical waves (cw waves) [14]. An estimation based on
Eq. (20) given in reference [14] yields a maximum distance of ≈3.5 µm at which the
amplitude of the cw wave should dominate the SPP field. Indications for the presence of cw
contributions in the PEEM signal for plasmon excitation at a metallic edge have been reported
in reference [15].
It can be shown that the detected amplitude decay of the superposition field is governed
by the damping length of the SPP and, furthermore, by the mismatch in the group velocity
between SPP and laser pulse: As the laser pulse passes the SPP wave packet the intensity of
the probed superposition field gradually decreases.
The other contribution to the co-propagation PEEM signal arises from the interference
between second laser pulse and the SPP wave packet excited by the first laser pulse. It
consequently exhibits a distinct dependence on the temporal delay τ between the laser pulses,
which is adjusted by the interferometer. This signal is the actual probe of the SPP propagation
in this experimental scheme. The most distinct feature that can be associated with this
contribution is the increase in relative photoemission intensity at large distances from the
excitation edge as can be seen in Fig. 1(c) in the comparison of the data recorded at τ = 40 fs with the data recorded at time-zero: for large delays τ the second laser pulse probes the
propagating SPP wave packet at later times, i.e. more distant from the SPP excitation edge. It
is rather evident that the entanglement of the co-propagation signal and the dominating static
background in these data makes a quantitative analysis with respect to the SPP propagation
dynamics difficult.
In the counter-propagating SPP imaging mode the propagation signal is much less
affected by the static background as demonstrated in Fig. 1(d). Now, the laser field is incident
from the right and probes the SPP wave packet propagating in opposite direction. The most
distinct difference in comparison to Fig. 1(c) is the significantly shorter decay length of the
static superposition background (note the different length scales in Fig. 1(c) and Fig. 1(d)).
This is a direct consequence of the propagation of laser field and SPP wave packet in opposite
directions which guarantees that both fields overlap for a very short time, only, virtually given
by the temporal width of the excitation laser pulse. One observes, furthermore, a reduction in
the period of the beating pattern to a value of 423 nm ± 10 nm as the relative orientation of the
interacting wave vectors is changed. We would like to note that interference patterns arising
from the counter-propagation of the excitation laser field and the SPP wave have been
observed before for instance in a study on a 100 nm thick gold film using scanning near-field
optical microscopy [16]. Furthermore, recent FDTD simulations on the SPP excitation at
defined nanometer-scaled slits in a silver film provided also evidence for the existence of
such a signature in ITR-PEEM experiments [15].
#165333 - $15.00 USD Received 23 Mar 2012; revised 13 Apr 2012; accepted 16 Apr 2012; published 23 May 2012(C) 2012 OSA 4 June 2012 / Vol. 20, No. 12 / OPTICS EXPRESS 12880
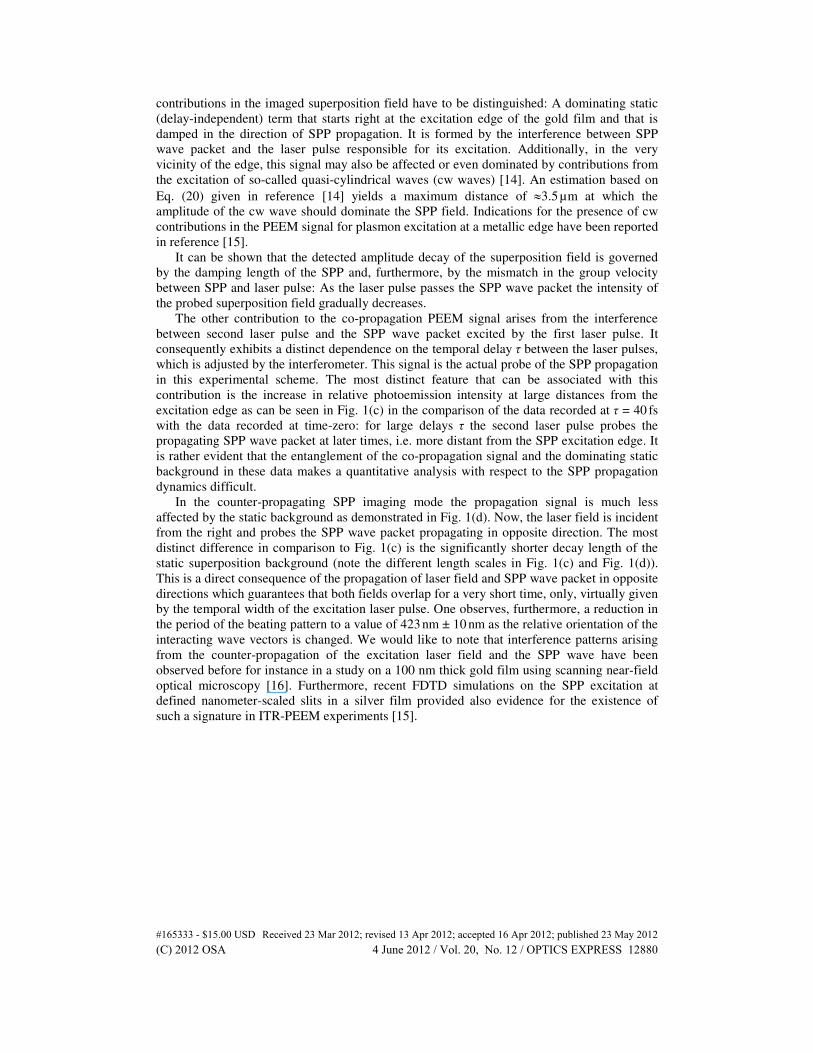
Fig. 2. (a) Delay-path diagram of SPP propagating at the gold-vacuum interface deduced from
the ITR-PEEM measurements, (b) corresponding delay-path diagram as deduced from an
analytic simulation (c) delay-path diagram of SPP propagating at the gold-p6P interface; note
that in the latter case the second SPP wave packet excited at the left hand edge of the gold bar
is not observable; the green dashed line in the graph marks a trace along an interference
maximum; the red dashed line follows the envelope maximum of the SPP-laser superposition
signal.
#165333 - $15.00 USD Received 23 Mar 2012; revised 13 Apr 2012; accepted 16 Apr 2012; published 23 May 2012(C) 2012 OSA 4 June 2012 / Vol. 20, No. 12 / OPTICS EXPRESS 12881
The efficient suppression of the static background signal in this imaging mode as
observed in our study enables one to obtain a much more distinct view onto the propagation
of the SPP wave packet. As seen in the image recorded at τ = 40 fs, the signal arising from the
interference between second laser pulse and propagating SPP wave packet excited by the first
laser pulse is now well separated from the static background and clearly resolved. Note that
the identical temporal delay applied to the two detection modes does not correspond to the
same SPP propagation distance. Counter-propagation snapshots recorded at varying temporal
delays τ between the two laser pulses allow one to directly follow the propagation of the SPP
wave packet. The results of such a pump-probe scan are summarized in Fig. 2(a) in terms of a
delay-path diagram. For this depiction photoemission intensity line profiles were deduced for
each delay τ by integration along the vertical axis of the PEEM image. In addition, the
displayed data are background corrected by subtraction of reference data recorded at τ = 0 fs
and each line profile is normalized to its maximum. At small propagation distances some
residuals of the static superposition background are still visible because of a non-perfect
background correction. Furthermore, at these distances the signal may also be affected by the
presence of cw waves.
The relevant signature in the delay-path diagram arises from the superposition signal
between first SPP and second laser pulse. It exhibits a linear slope which is governed by the
phase and the group velocity of the SPP. In more detail, the depiction shows that the
superposition signal contains two distinct contributions (see blue arrows), a dominating
leading beating pattern, followed by a weaker second beating pattern. We will see later that
the two signals arise from different SPP excitation processes at the gold bar. For now, we will
concentrate on the analysis of the dominant leading part of the cross-correlation signal. The
slope τ / xp of the straight line defined by an individual beating maximum resulting from
constructive interference (see for instance green dashed line in Fig. 2(a)) is governed by the
phase velocity of SPP and laser pulse. It can easily be shown that
,
sin( ) 1
p Vac p SPPx c v
τ θ = +
(1)
Here, vp,SPP is the phase velocity of the SPP and cVac is the velocity of the incident laser pulse.
The sine in the numerator of the first term projects cVac onto the surface plane and accounts
for the incidence angle θ of the laser pulse.
Correspondingly, the slope of the envelope maximum of the beating signal, τ / xg (see red
dashed line in Fig. 2(a)), is related to the group velocity vg,SPP of the SPP wave packet:
,
sin( ) 1
g Vac g SPPx c v
τ θ = +
(2)
The quantitative analysis of the data in Fig. 2(a) under consideration of the 816 nm wave
length of the excitation laser pulse yields vp,SPP = (0.979 ± 0.025)⋅cVac and vg,SPP = (0.939 ±
0.035)⋅cVac. xg was determined from Gaussian fits to the signal envelope following the beating
maxima as shown in Fig. 3. To avoid potential distortions of the fit by cw wave contributions
to the signal, we restricted the analysis to propagation distances > 9 µm. The numbers
obtained from this analysis are in good agreement with experimental data reported by
Temnov et al. [17] (vg,SPP ≈0.939⋅cVac) as well as values calculated under consideration of the
dielectric function of gold [18] (vp,SPP = 0.98⋅cVac and vg,SPP = 0.95⋅cVac). The mismatch
between vp,SPP and vg,SPP, which becomes in the experiment evident from the clear difference
in the slopes τ / xp and τ / xg, is indication for the dispersive character of the SPP propagation
and the continuous shift of the carrier-to-envelope phase as the plasmon propagates along the
gold surface.
#165333 - $15.00 USD Received 23 Mar 2012; revised 13 Apr 2012; accepted 16 Apr 2012; published 23 May 2012(C) 2012 OSA 4 June 2012 / Vol. 20, No. 12 / OPTICS EXPRESS 12882
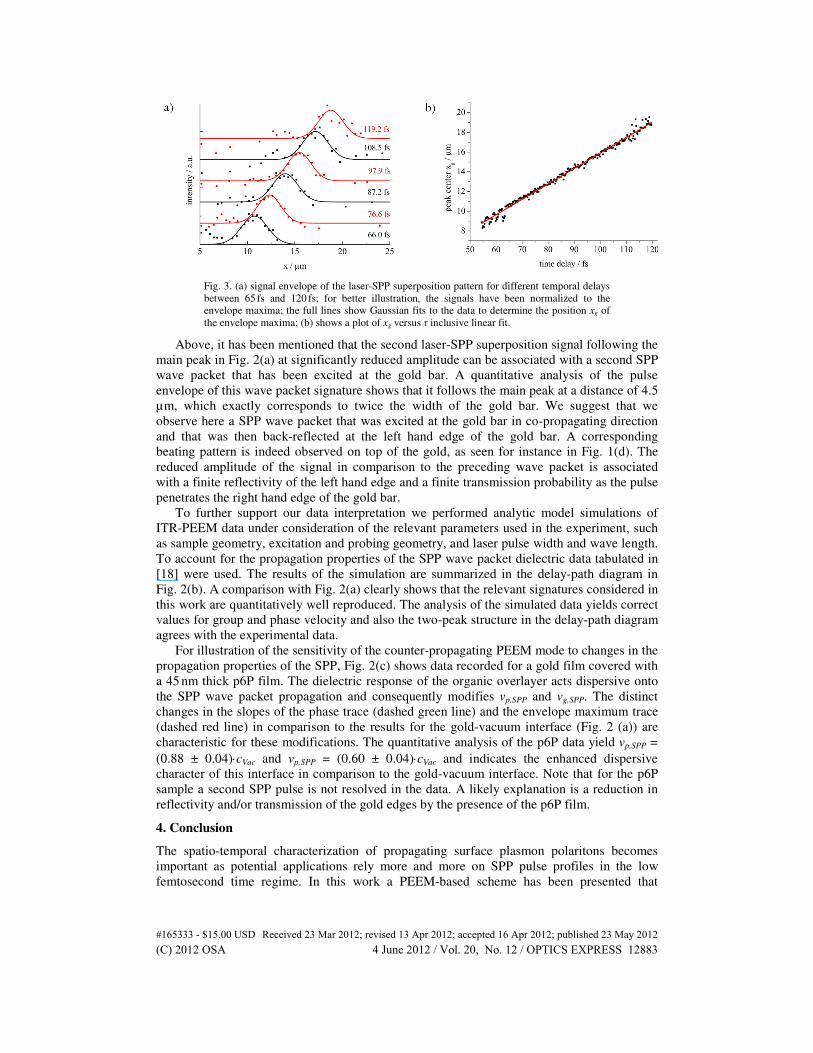
Fig. 3. (a) signal envelope of the laser-SPP superposition pattern for different temporal delays
between 65 fs and 120 fs; for better illustration, the signals have been normalized to the
envelope maxima; the full lines show Gaussian fits to the data to determine the position xg of
the envelope maxima; (b) shows a plot of xg versus τ inclusive linear fit.
Above, it has been mentioned that the second laser-SPP superposition signal following the
main peak in Fig. 2(a) at significantly reduced amplitude can be associated with a second SPP
wave packet that has been excited at the gold bar. A quantitative analysis of the pulse
envelope of this wave packet signature shows that it follows the main peak at a distance of 4.5
µm, which exactly corresponds to twice the width of the gold bar. We suggest that we
observe here a SPP wave packet that was excited at the gold bar in co-propagating direction
and that was then back-reflected at the left hand edge of the gold bar. A corresponding
beating pattern is indeed observed on top of the gold, as seen for instance in Fig. 1(d). The
reduced amplitude of the signal in comparison to the preceding wave packet is associated
with a finite reflectivity of the left hand edge and a finite transmission probability as the pulse
penetrates the right hand edge of the gold bar.
To further support our data interpretation we performed analytic model simulations of
ITR-PEEM data under consideration of the relevant parameters used in the experiment, such
as sample geometry, excitation and probing geometry, and laser pulse width and wave length.
To account for the propagation properties of the SPP wave packet dielectric data tabulated in
[18] were used. The results of the simulation are summarized in the delay-path diagram in
Fig. 2(b). A comparison with Fig. 2(a) clearly shows that the relevant signatures considered in
this work are quantitatively well reproduced. The analysis of the simulated data yields correct
values for group and phase velocity and also the two-peak structure in the delay-path diagram
agrees with the experimental data.
For illustration of the sensitivity of the counter-propagating PEEM mode to changes in the
propagation properties of the SPP, Fig. 2(c) shows data recorded for a gold film covered with
a 45 nm thick p6P film. The dielectric response of the organic overlayer acts dispersive onto
the SPP wave packet propagation and consequently modifies vp,SPP and vg,SPP. The distinct
changes in the slopes of the phase trace (dashed green line) and the envelope maximum trace
(dashed red line) in comparison to the results for the gold-vacuum interface (Fig. 2 (a)) are
characteristic for these modifications. The quantitative analysis of the p6P data yield vp,SPP =
(0.88 ± 0.04)⋅cVac and vp,SPP = (0.60 ± 0.04)⋅cVac and indicates the enhanced dispersive
character of this interface in comparison to the gold-vacuum interface. Note that for the p6P
sample a second SPP pulse is not resolved in the data. A likely explanation is a reduction in
reflectivity and/or transmission of the gold edges by the presence of the p6P film.
4. Conclusion
The spatio-temporal characterization of propagating surface plasmon polaritons becomes
important as potential applications rely more and more on SPP pulse profiles in the low
femtosecond time regime. In this work a PEEM-based scheme has been presented that
#165333 - $15.00 USD Received 23 Mar 2012; revised 13 Apr 2012; accepted 16 Apr 2012; published 23 May 2012(C) 2012 OSA 4 June 2012 / Vol. 20, No. 12 / OPTICS EXPRESS 12883

provides an efficient experimental access to the characterization of relevant propagation
properties of SPP wave packets. The present experimental configuration is particularly
suitable for the study of two-dimensional systems such as for instance multilayer systems,
where the interaction of SPP modes located at different interfaces becomes relevant. A further
aspect that was not addressed in this study is the effect of SPP pulse broadening in a strongly
dispersing environment. The signal probed in the counter-propagating PEEM scheme is
essentially a cross correlation signal so that a data analysis should in principle also provide
information of SPP pulse broadening effects. Even more, the phase sensitivity of the used
interferometric approach could in future experiments allow for quantitative insights into the
phase modulation of the SPP wave packet.
Acknowledgments
This work was funded by the Deutsche Forschungsgemeinschaft through Priority Program
1391 “Ultrafast Nanooptics” as well as the Danish Council for Independent Research (FTP –
Project No. 09-072949 ANAP).
#165333 - $15.00 USD Received 23 Mar 2012; revised 13 Apr 2012; accepted 16 Apr 2012; published 23 May 2012(C) 2012 OSA 4 June 2012 / Vol. 20, No. 12 / OPTICS EXPRESS 12884
Related Documents