Journal of Transportation Management Volume 11 | Issue 1 Article 3 4-1-1999 Mapping logistics practice using the product life cycle Stanley E. Fawce Brigham Young University Greg Magnan University of Seale Laura Birou e George Washington University Follow this and additional works at: hps://digitalcommons.wayne.edu/jotm Part of the Operations and Supply Chain Management Commons , and the Transportation Commons is Article is brought to you for free and open access by the Open Access Journals at DigitalCommons@WayneState. It has been accepted for inclusion in Journal of Transportation Management by an authorized editor of DigitalCommons@WayneState. Recommended Citation Fawce, Stanley E., Magnan, Greg . & Birou, Laura . (1999). Mapping logistics practice using the product life cycle. Journal of Transportation Management, 11(1), 1-22. doi: 10.22237/jotm/922924920

Welcome message from author
This document is posted to help you gain knowledge. Please leave a comment to let me know what you think about it! Share it to your friends and learn new things together.
Transcript

Journal of Transportation Management
Volume 11 | Issue 1 Article 3
4-1-1999
Mapping logistics practice using the product lifecycleStanley E. FawcettBrigham Young University
Greg MagnanUniversity of Seattle
Laura BirouThe George Washington University
Follow this and additional works at: https://digitalcommons.wayne.edu/jotm
Part of the Operations and Supply Chain Management Commons, and the TransportationCommons
This Article is brought to you for free and open access by the Open Access Journals at DigitalCommons@WayneState. It has been accepted forinclusion in Journal of Transportation Management by an authorized editor of DigitalCommons@WayneState.
Recommended CitationFawcett, Stanley E., Magnan, Greg . & Birou, Laura . (1999). Mapping logistics practice using the product life cycle. Journal ofTransportation Management, 11(1), 1-22. doi: 10.22237/jotm/922924920
MAPPING LOGISTICS PRACTICE USING THE PRODUCT LIFE CYCLE
Stanley E. Fawcett Brigham Young University
Greg Magnan Univeristy of Seattle
Laura BirouThe George Washington University
The dynamic nature of today's global economy places a premium on a firm's ability to anticipate and to respond to customer needs as well as changing competitive pressures. Within this environment, developing a successful logistics strategy can be critical to the firm's long-term competitive success. This paper looks at the potential for using the product life cycle (PLC) as a strategic framework in the logistics strategy planning process. Results of an empirical study that investigated the appropriate use of 43 logistics techniques across PLC stages are reported. The implementation status of the various logistics techniques is also considered.
INTRODUCTION
The competitive imperatives of a global marketplace make anticipating and responding to customer needs a challenging task (Blackwell 1997). Within today's dynamic market, an effective logistics strategy can help mitigate the competitive challenge and assist the firm in achieving high levels of customer satisfaction. Because an effective logistics strategy not only supports the firm's overall competitive efforts but can also lead directly to competitive advantage, logistics has recently gained considerable visibility as a viable competitive weapon. One senior manager at a Fortune 500 company acknowledged, “We've changed the way we develop products, manufacture, market, and advertise. The one
piece of the puzzle we haven't addressed is logistics. It's the next source of competitive advantage. The possibilities are just astounding” (Henkoff 1994).
An important aspect of competing through logistical capability is to put in place the right set of logistics practices to help the firm deliver high levels of customer value. Unfortunately, a multitude of logistics practices coupled with a complex competitive environment makes selecting appropriate logistical practices problematic. The fact that new “tools and techniques” come and go almost overnight exacerbates the challenge of managinglogistics for competitive impact. As a result, many firms have implemented a set of logistics practices that absorb scarce managerial time and
Spring 1999 1
financial capital only to find that they fail to deliver any real value to customers (Stock 1992). To help sort through the myriad logistics practices and identify those techniques that really yield customer value, managers should seek to carefully align the logistics strategy to the overall firm strategy. A strategic planning framework such as the product life cycle (PLC) can help managers more effectively manage logistics activities as a cohesive strategic weapon (Anderson 1991). Such a framework can help identify unique customer needs while creating a better understanding of the competitive environment. The resulting focus and alignment promises to enhance both logistics performance and customer satisfaction. Because the product life cycle is widely used and understood by managers in diverse industries and across functional areas, it is a convenient and practical vehicle to align logistics practice to the competitive needs of the firm.
This paper looks at the product life cycle as a tool for developing and implementing an effective logsitics strategy. Specifically, 43 different logistics practices are considered and matched to the life cycle stage where they are used most frequently. Further, the implementation status of each logistics practice is compared across the growth and maturity stages of the life cycle. The following section defines and discusses the PLC concept and its relationship to logistics management. The subsequent section looks at the research methodology and is followed by a discussion of relevant findings. Conclusions and managerial implications are then presented.
THE PRODUCT LIFE CYCLE AS A GUIDE TO LOGISTICAL MANAGEMENT
The PLC concept depicts the sales of a product from its market introduction to its decline and withdrawal from the market; that is, over its entire “life” (Kotler 1991). Most descriptions of the PLC include five distinct stages: design, introduction, growth, maturity, and decline. Each stage of the product life cycle implies a unique set of competitive, market, and product characteristics (see Table 1) (Wasson 1978). Volume and learning efficiencies as well as market acceptance and loyalty are the primary determinants of these characteristics. I nt u it ive appeal combined with consistent experience have led to the widespread acceptance and historically strong influence of the PLC concept on strategy development. This positive influence on strategy development is a strong force promoting the use of the PLC as an alignment mechanism. Ayres and Steger (1985) commented on the pervasive influence of the PLC:
The influence of the product cycle concept on management strategy in the last fifteen to twenty years—along with its concomitant experience curve and market share notions—has been enormous. Perhaps it has been the single most important set of strategic beliefs held by corporate management during the decades of the 1960s and 1970s.
Over the years, substantial research has highlighted the PLC’s suitability as a framework for strategy development. Studies
2 Journal of Transportation Management

TABLE 1CHARACTERISTICS OF PRODUCT LIFE CYCLE STAGES
Design
Introduction
Growth
Maturity
Decline
(Fox 1977)
Involves the development and test marketingof some product or service the company has never attempted to sell with full-scale efforts. Other attributes of this stage include: heavy R & D expenditures, uncertainty of the success of the proposed innovation, and preparation of a marketing plan.
Commences with the full-scale marketing of the product or service in its intended market or in a large region. This stage is also characterized by low unit sales, losses or low profits, uncertainty of length of stage, product vulnerability to attack form competing items or services, relatively few distributors, inexperienced personnel, product often manufactured in pilot plants, active product debugging, and initial promotions.
Begins when unit sales start increasing at a growing rate or at more than one percent monthly. Trial sales have been largely completed. This phase is also epitomized by substantial profits, existence of many distributors, widespread market coverage, less product vulnerability, use or development of full-scale production lines, heavy amount of manufacturing overtime, and adding new models to product line.
Occurs when sales volume continues to increase, but at a decreasing rate. Sales typically plateau and eventually decline slightly during the maturity stage. Unit sales may fluctuate within the range of plus or minus one percent monthly. This stage is also represented by profits leveling off and then declining, existence of many aggressive competitors, declining prices, production facilities or processes in need of repair or redesign, cost-price squeeze, development of new markets or new product models and sizes, and special sales inducements or concessions to customers.
Occurs when unit sales decline at an increasing rate or at more than one percent per month. Other attributes of this stage are declining profits, product substitution by distributors, sales and profit declines cannot be curtailed except in the very short run, promotional support is withdrawn, R& D budget is canceled, and manufacturing equipment is sold.
Spring 1999 3

by Hofei* (1975), Anderson and Zeithaml (1984), and Hambrick and Lei (1985) support the use of the PLC to guide the selection and implementation of different practices to enhance business unit performance over the life of a product. At the functional level, the PLC was first emphasized in manufacturing by Hayes and Wheelwright (1984; 1979) as a guide in developingthe product-process matrix. They suggested that, “the product life cycle can be used to summarize the customer and product requirements that must be satisfied by the manufacturing function and its product technology.” Moreover, they recognized that the PLC “highlights the need to change the priorities that govern manufacturing behavior as products and markets evolve” (Hayes 1984). Similarly, Kaminski and Rink (1984) proposed using the PLC concept to guide physical distribution strategy. They noted that the PLC could be used to gauge changing market conditions, guiding the formulation and implementation of physical distribution strategies and tactics. Similar suggestions regarding the role of the PLC have been made in marketing and purchasing (Cravens 1986; Kiser 1976).
Today's global marketplace—characterized by greater uncertainty and a reduction in allowed response time—places particular value on the predictive nature of the PLC (Wyland 1998). Indeed, advances in technology coupled with intensified competition and the emergence of demanding global consumers have greatly compressed product lifecycles (Cho 1996; Grant 1997; Lau 1995). The managerial impact of shorter life cycles can be dramatic. For instance, most new, technology-oriented products face serious competition from imitators within the first year of introduction. Getting a new product “on the shelf” in
geographically dispersed markets in a relatively short period of time is critical to gaining and maintaining market share. Firms are thus placing much greater emphasis on global product launches, which tend to be highly logistics dependent. Compressed life cycles thus require managers to design logistics strategies that can provide rapid and widespread geographic coverage at minimal cost.
Specifically, the PLC’s value to logistics decision makers comes from the fact that it provides an underlying structure to the life of products. The PLC is thus well positioned to act as a common denominator for the coordination of logistics and customer satisfaction strategies. That is, products in different stages of the life cycle require different types of logistical and technical support to facilitate market success. Once the life-cycle stage has been identified, fairly certain predictive guidelines can be drawn to assist the design and implementation of appropriate logistical processes (Thorelli 1981). For example, a product in the design stage would benefit from value analysis and total cost analysis coupled with the early consideration of packaging needs and future service requirements. During product introduction, logistical efforts would target rapid and responsive delivery to key customers—a high level of customer service is needed to gain favor with these influential market entry points. Success in the growth stage requires careful inventory management and scheduling to assure consistent, on-time delivery and achieve widespread market coverage. Finally, the emphasis in the maturity stage is on logistics cost reduction programs. Using the PLC as a planning framework to guide logistics decision making appears appropriate.
4 Journal of Transportation Management
STUDY METHODOLOGY
The primary objective of this research is to provide insight into the potential use of the PLC to strategically align logistics practices to the product/service requirements of customers. To gain this insight, a survey-based empirical methodology was used to collect data regarding logistics practice across a product’s life cycle. A single mailing to 500 senior-level managers from manufacturing companies was conducted. The sample was taken from the membership of the Council of Logistics Management. One hundred and thirty-three usable questionnaires were returned for a 28 percent response rate.
Survey Development
The survey instrument was developed after an extensive literature review and was refined through an initial pretest involving 15 industry and professional informants. The pre-test was specifically designed to improve question clarity and modify the list of logistics activities investigated. To make the data collection as easy and straightforward as possible, questions consistently employed seven-point scales. The final survey instrument asked logistics managers numerous questions related to how the PLC is used in their firm. The logistics managers were then asked to match 43 logistics practices to the most appropriate stage in the PLC. Information regardingthe implementation status for each of these 43 practices was also collected. To ensure consistency of understanding among the respondents, definitions of the 43 logistics techniques were included with each questionnaire. A detailed definition of the PLC concept, complete with descriptions of each PLC stage, was also included to provide a common reference base for the respondents.
Basic Demographics and Strategic Positioning
Respondents were asked to indicate where their primary products are positioned on the PLC curve. Almost two-thirds (65.5%) of the respondents noted that their products are in the maturity stage of the life cycle. Most of the remaining respondents (29.2%) reported that their primary products are in the growth stage. Additional demographic data that profile the respondent companies are displayed in Table 2. Two measures of firm size were evaluated— number of employees and annual sales. Both showed that firms of all sizes were included in the respondent base. Moreover, firms of all sizes provided similar responses regardingthe use of the PLC concept. Looking at general firm performance characteristics shows that the respondent firms are relatively successful when compared to leading competitors. Of note, respondents report the highest levels of performance in R&D aggressiveness and new product innovation, demonstrating a belief that long-term success requires new products entering the life cycle at all times.
Another perspective of the respondent firms’ strategic positioning is gained via the organizational adaptation model (Miles 1978). This model classifies firms as prospectors, analyzers, or defenders based on the aggressiveness of the firm's product-market strategy:
• Prospectors possess innovative and adaptive organizational cultures that are conducive to risk taking. They place a premium on being the first to market with new products and services and therefore respond rapidly to early signals of market
Spring 1999 5
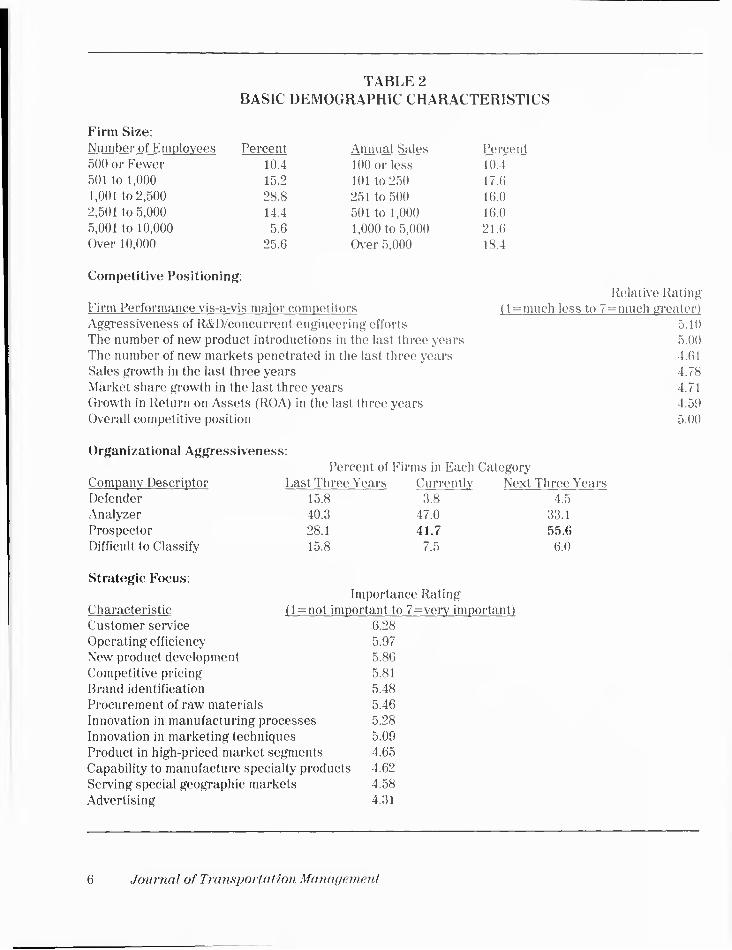
TABLE 2BASIC DEMOGRAPHIC CHARACTERISTICS
Firm Size:Number of Employees Percent500 or Fewer 10.4501 to 1,000 15.21,001 to 2,500 28.82,501 to 5,000 14.45,001 to 10,000 5.6Over 10,000 25.6
Annual Sales Percent100 or less 10.4101 to 250 17.6251 to 500 16.0501 to 1,000 16.01,000 to 5,000 21.6Over 5,000 18.4
Competitive Positioning:
Finn Performance vis-a-vis major competitorsAggressiveness of R&D/concurrent engineering effortsThe number of new product introductions in the last three yearsThe number of new markets penetrated in the last three yearsSales growth in the last three yearsMarket share growth in the last three yearsGrowth in Return on Assets (ROA) in the last three yearsOverall competitive position
Relative Rating (l = much less to 7 = much greater)
5.105.004.614.784.714.595.00
Organizational Aggressiveness:Percent of Firms in Each Category
Company Descriptor Last Three Years Currently Next Three YearsDefender 15.8 3.8 4.5Analyzer 40.3 47.0 33.1Prospector 28.1 41.7 55.6Difficult to Classify 15.8 7.5 6.0
Strategic Focus:
Characteristic Customer service Operating efficiency New product development Competitive pricing Brand identification Procurement of raw materials Innovation in manufacturing processes Innovation in marketing techniques Product in high-priced market segments Capability to manufacture specialty products Serving special geographic markets Advertising
Importance Rating(l = not important to 7-very important)
6.28 5.97 5.86 5.81 5.48 5.46 5.28 5.09 4.65 4.62 4.58 4.31
6 Journal of Transportation Management
needs or opportunities. Prospectors maintain a constantly changing set of products/services in the marketplace.
• Analyzers are seldom the first to market with new products or services; however, careful monitoring of more aggressive firms affords opportunities to quickly enter the market with a more cost-efficient or well- conceived product/service. This selective product/market approach allows for a relatively stable product/service base and thus improves efficiencies while allowing the firm to respond to selective market developments.
• Defenders concentrate on being the most efficient providers of an established set of products and services. These firms are not at the forefront of product introduction; rather, they introduce new products only after considerable evidence of potential success has been demonstrated. Low-cost and imitation are the keys to success for the defenders.
Respondents note that their firms have become more aggressive in their product-market strategies and expect the trend to continue. Future success will require more adaptable organizational cultures capable of gaining first mover advantages to capture greater market share and generate the cash flows needed to support future product and process innovation efforts. Finally, based on Porter’s (1980) paradigm, which suggests that firms compete on the dimensions of lowr-cost or differentiation, respondents were asked to indicate the importance of various strategic issues to firm competitiveness. The data show that firms are consciously attempting to balance a desire for differentiation with the need to be cost competitive. In fact, the six most important issues are evenly split between differentiation and cost strategies. Clearly, the competitive
environment is intense, requiring firms to provide real value to customers—unique products and services at the lowest possible costs.
LOGISTICS PRACTICE ACROSS THE PRODUCT LIFE CYCLE
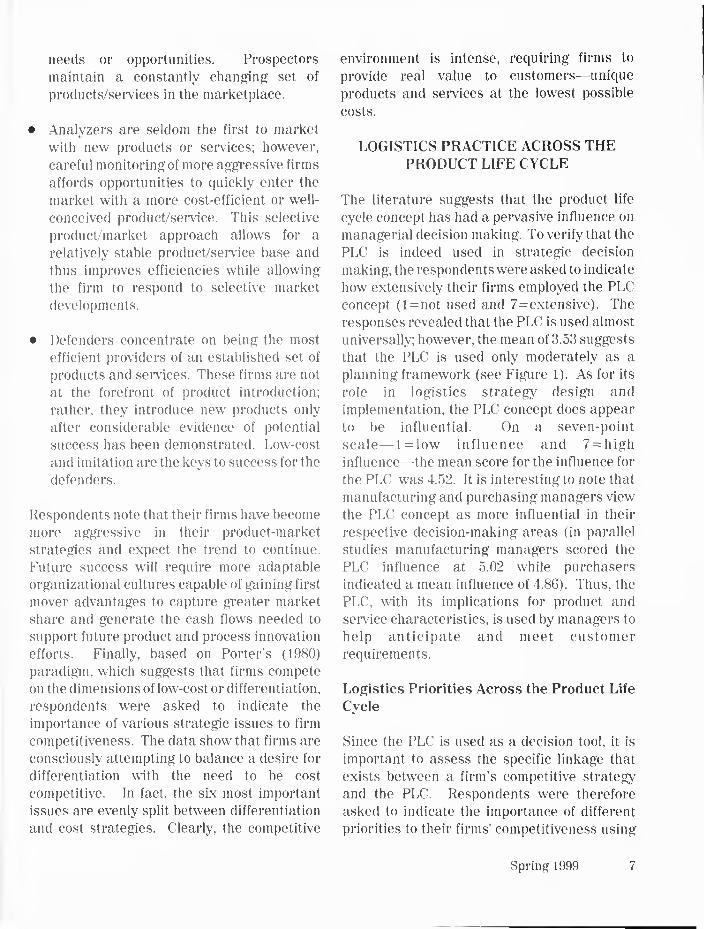
The literature suggests that the product life cycle concept has had a pervasive influence on managerial decision making. To verify that the PLC is indeed used in strategic decision making, the respondents were asked to indicate how extensively their firms employed the PLC concept (l = not used and 7=extensive). The responses revealed that the PLC is used almost universally; however, the mean of 3.53 suggests that the PLC is used only moderately as a planning framework (see Figure 1). As for its role in logistics strategy design and implementation, the PLC concept does appear to be influential. On a seven-point scale—l=low influence and 7 = high influence—the mean score for the influence for the PLC wras 4.52. It is interesting to note that manufacturing and purchasing managers view the PLC concept as more influential in their respective decision-making areas (in parallel studies manufacturing managers scored the PLC influence at 5.02 while purchasers indicated a mean influence of 4.86). Thus, the PLC, with its implications for product and service characteristics, is used by managers to help anticipate and meet customer requirements.
Logistics Priorities Across the Product Life Cycle
Since the PLC is used as a decision tool, it is important to assess the specific linkage that exists between a firm's competitive strategy and the PLC. Respondents were therefore asked to indicate the importance of different priorities to their firms' competitiveness using
Spring 1999 7
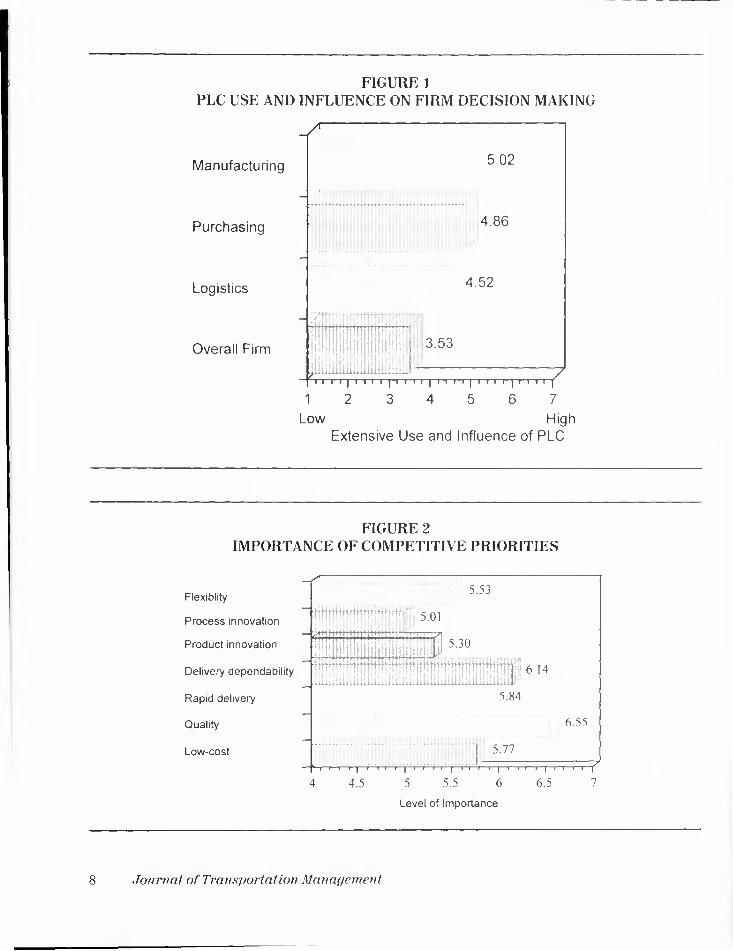
FIGURE 1PLC USE AND INFLUENCE ON FIRM DECISION MAKING
Manufacturing
Purchasing
Logistics
Overall Firm
Low HighExtensive Use and Influence of PLC
FIGURE 2IMPORTANCE OF COMPETITIVE PRIORITIES
Flexiblity
Process innovation
Product innovation
Delivery dependability
Rapid delivery
Quality
Low-cost
Level of Importance
8 Journal of Transportation Management

a seven-point scale (l = not important and 7=very important). The seven priorities of interest are shown in Figure 2. Quality is clearly viewed as the most important driver of competitive success. A high level of emphasis on consistently meeting promised delivery dates and reducing lead times shows a desire to be responsive to customer requests. Indeed, each of the seven priorities received a rating greater than five on a seven-point scale. Managers appear to recognize a need to meet higher levels of performance in order to meet increasing customer demands in the face of fierce competition. Today’s competitive rule is that firms must achieve higher performance standards in a number of areas to survive and prosper in today’s marketplace.
The information in Table 3 links each competitive priority to the stage of the product life cycle where it has the greatest impact on firm performance. Product innovation has its greatest impact in the design, introduction, and growth stages. Process innovation follows a similar pattern except that its influence extends into the maturity stage of the life cycle. Recent emphasis on process reengineering supports the idea that process innovation is not only important as part of concurrent engineering efforts but also as a major component of continuous improvement programs. Product quality is also viewed as important in the early stages of the life cycle, however, despite Taguchi's claim that 80 percent of all defects are designed into the product, logistics managers view quality as most important in the growth stage of the life cycle (Taguchi 1990). Rapid delivery is very important to the introduction and growth stages—if products are not available in these stages, market penetration is diminished and market share is quickly lost. Delivery dependability and flexible production become critical competitive drivers in the growth stage where product and service proliferation
become important to the firm's competitive strategy. Consistent and dependable delivery has become the most important logistics evaluation criterion in today's just-in-time environment (Bagchi 1988; Lieb 1988; Stock 1992). Because dependability is vital to JIT strategies and to the success of tightly coupled buyer-supplier relationships, it continues to be very important in the maturity stage. Finally, low-cost dominates the maturity stage.
To summarize, aligning competitive priorities to product life cycle stages reveals that logistics differentiation and service responsiveness is vital in the introduction and growth stages while cost and consistency are fundamental to success in the maturity stage. While logistics has long been managed as a cost center and thus done a fairly nice job of meeting the needs of the maturity stage, greater attention to logistics planningappears to be needed in the introduction and growth stages. That is, logistics managers must be more involved and influential in the design of product introduction and roll-out strategies. The need for carefnl and proactive logistics planning in the earlier stages of the product life cycle is particularly acute as companies increasingly strive to simultaneously introduce products into geographically-dispersed global markets.
From a logistics perspective, these findings highlight the logistics capabilities that must be developed to support the firm's overall product-market strategies as they evolve over time. Specifically, logistics must provide reach and responsiveness during the early life of a new product. Logistics failures early in the product’s life cycle can easily discourage customers and thereby cede market share to the competition. For example, when Gillete introduced its Excell razor in the early 1990s, its Superbowl advertising and early promotion created a level of consumer demand that
Spring 1999 9
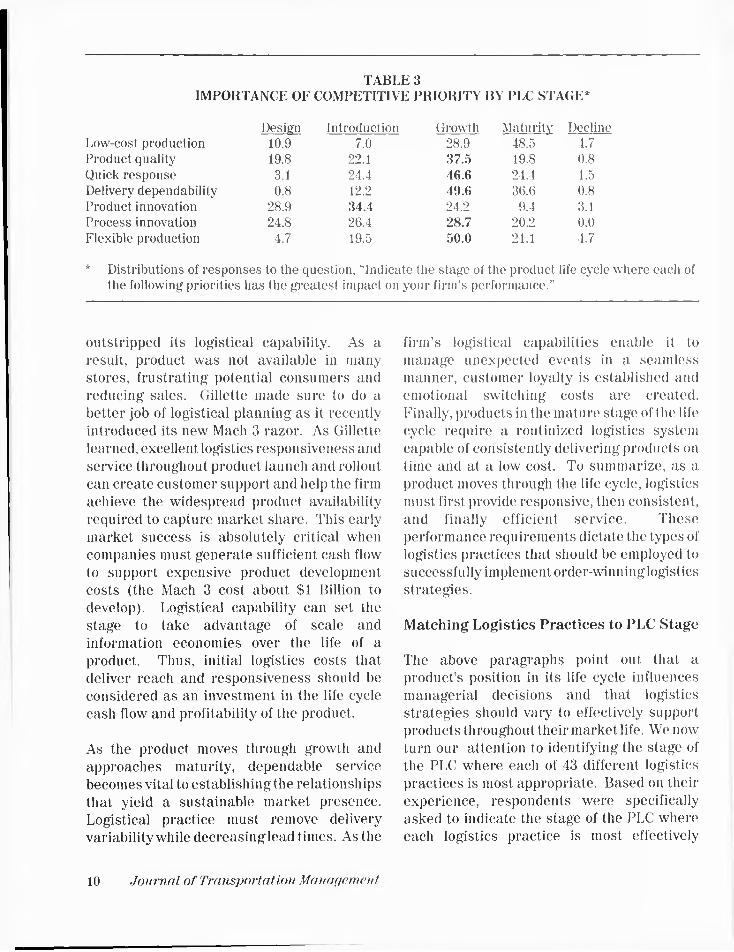
TABLE 3IMPORTANCE OF COMPETITIVE PRIORITY BY PLC STAGE*
Desien Introduction Growth Maturitv DeclineLow-cost production 10.9 7.0 28.9 48.5 4.7Product quality 19.8 22.1 37.5 19.8 0.8Quick response 3.1 24.4 46.6 24.4 1.5Delivery dependability 0.8 12.2 49.6 36.6 0.8Product innovation 28.9 34.4 24.2 9.4 3.1Process innovation 24.8 26.4 28.7 20.2 0.0Flexible production 4.7 19.5 50.0 21.1 4.7
Distributions of responses to the question, “Indicate the stage of the product life cycle where each of the following priorities has the greatest impact on your firm’s performance.”
outstripped its logistical capability. As a result, product was not available in many stores, frustrating potential consumers and reducing sales. Gillette made sure to do a better job of logistical planning as it recently introduced its new7 Mach 3 razor. As Gillette learned, excellent logistics responsiveness and service throughout product launch and rollout can create customer support and help the firm achieve the widespread product availability required to capture market share. This early market success is absolutely critical when companies must generate sufficient cash flow to support expensive product development costs (the Mach 3 cost about SI Billion to develop). Logistical capability can set the stage to take advantage of scale and information economies over the life of a product. Thus, initial logistics costs that deliver reach and responsiveness should be considered as an investment in the life cycle cash flow and profitability of the product.
As the product moves through growth and approaches maturity, dependable service becomes vital to establishingthe relationships that yield a sustainable market presence. Logistical practice must remove delivery variability while decreasing lead times. As the
firm’s logistical capabilities enable it to manage unexpected events in a seamless manner, customer loyalty is established and emotional switching costs are created. Finally, products in the mature stage of the life cycle require a routinized logistics system capable of consistently delivering products on time and at a low cost. To summarize, as a product moves through the life cycle, logistics must first provide responsive, then consistent, and finally efficient service. These performance requirements dictate the types of logistics practices that should be employed to successfully implement order-winninglogistics strategies.
Matching Logistics Practices to PLC Stage
The above paragraphs point out that a product's position in its life cycle influences managerial decisions and that logistics strategies should vary to effectively support products throughout their market life. We now turn our attention to identifying the stage of the PLC where each of 43 different logistics practices is most appropriate. Based on their experience, respondents were specifically asked to indicate the stage of the PLC where each logistics practice is most effectively
10 Journal of Transportation Management

TABLE 4USE OF LOGISTICS PRACTICES BY LIFE CYCLE STAGE
Logistics PracticeModeling (Simulation, Queuing, Optimization) Value Analysis/Engineering Bar CodingAutomation of Materials Handling Benchmarking Capacity Planning Cross-Functional Teams/Employees Cycle Countingdnventory Distribution Requirements Planning Electronic Data Interchange Employee InvolvementFacility Design (Dock, Terminal, Warehouse) Forecasting Shipping Requirements Inventory Management (Finished Goods)Job EnrichmentJust-In-Time TransportationManaging Delivery Schedules (Time Windows)Order Cycle Time ReductionPackaging Improvement ProgramsQuick Response ProgramsService Innovation •>Statistical Process Control (SPC)Strategic Alliances/Partnerships Team BuildingTotal Preventive Maintenance (TPM)Total Quality Management (TQM)Work MeasurementCarrier Base ReductionCarrier CertificationConsolidated ShipmentsCost Reduction ProgramsDistribution Center LocationingIncoming ReceivingdnspectionIntermodal TransportationInternational Freight ProgramsInventory Reduction ProgramsLoss and Damage ManagementProfit SharingSubcontractingThird-Party Logistics ServicesTotal Cost Analysis (Systems Analysis)Vehicle Routing and Scheduling Warehouse Productivity
Design Intro Growth Maturitv Decline32.2 19,8 24.0 21.5 2.534.2 18.0 23.1 22.2 2.515.3 34.7 30.6 18.5 0.810.4 16.0 40.8 32.8 0.017.1 19.5 36.6 24.4 2.411.2 21.6 51.2 15.2 0.818.2 26.5 33.8 21.5 0.04.0 12.4 42.2 38.9 2.5
15.4 20.3 40.6 22.7 0.814.8 24.6 39.3 21.3 0.021.2 28.8 37.3 12.7 0.022.8 16.3 30.1 27.6 3.310.4 30.4 38.4 20.0 0.87.3 17.1 39.8 35.0 0.8
12.8 18.8 33.3 32.5 2.612.3 17.2 36.1 32.0 2.56.7 15.8 49.2 27.5 0.88.3 18.2 41.3 32.2 0.0
12.3 13.9 38.5 33.6 1.611.5 31.8 38.5 18.0 0.012.4 15.7 38.8 31.4 1.720.2 16.0 38.7 22.7 2.514.7 13.9 44.3 23.8 3.325.4 26.2 36.9 10.7 0.815.8 20.8 30.8 30.8 1.727.3 21.5 32.2 19.0 0.010.0 14.2 40.0 32.5 3.35.0 5.9 25.4 62.7 0.84.3 18.8 32.5 41.0 1.72.5 10.7 35.3 48.4 3.33.3 10.6 24.4 51.2 10.6
13.1 14.8 32.8 36.9 2.514.7 26.2 21.3 31.1 6.612.7 6.0 31.0 43.1 6.013.6 17.8 28.8 39.8 0.03.3 11.5 23.8 50.0 11.56.7 13.3 32.5 45.0 2.5
13.8 12.9 31.9 32.7 8.615.1 19.3 23.5 30.3 11.817.1 23.1 19.7 31.6 8.629.2 17.5 22.5 30.8 0.011.2 19.8 29.3 36.2 3.56.6 13.9 36.1 43.4 0.0
Spring 1999 11

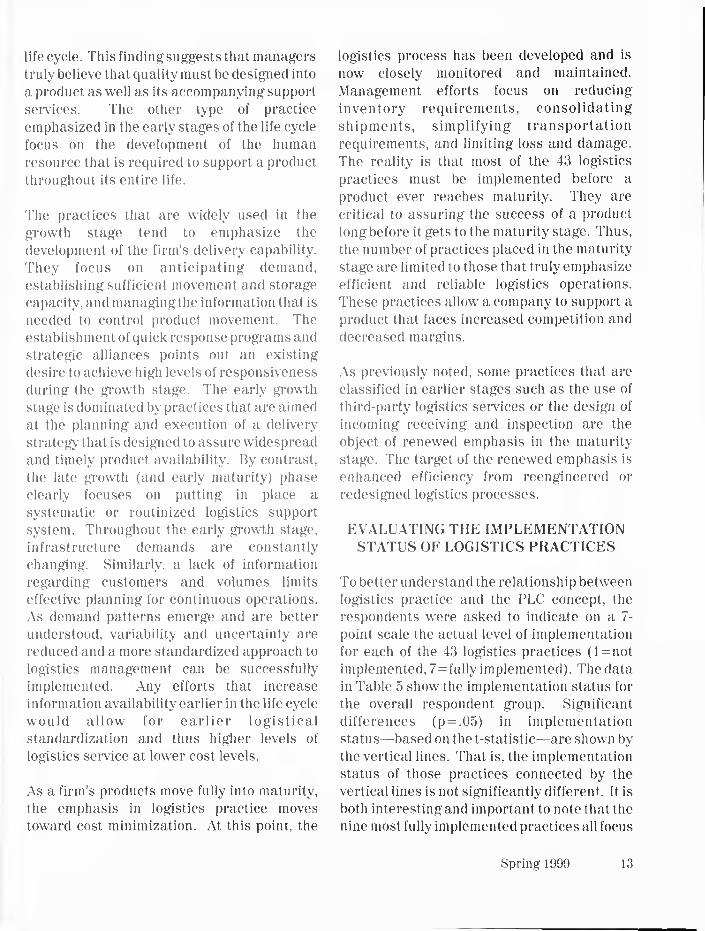
implemented. Table 4 presents the frequency distributions for the responses. The practices are listed based on their “most appropriate” stage starting with design at the top of the table and ending with maturity at the bottom. The stage most frequently identified as appropriate is bolded to make it easier to identify key stages of practice implementation.
Perhaps the first point that is evident from the data in Table 4 is that some disparity in opinion exists with respect to which stage is mostappropriate for each logistics practice. For practices such as carrier base reduction, a high level of agreement exists with 63 percent of the managers placing it in the maturity stage. For other practices, the responses are much more evenly distributed among the first four life cycle stages. Two specific circumstances lead to this more even distribution. First, some practices such as total cost analysis are used extensively in the design and introduction stages and then are re-emphasized in the maturity stage. Total cost analysis or life cycle costing is often performed in the early stages of product and process development to allocate resources and justify the development effort. Later, when the product/service package faces intense competitive pressure in the maturity stage, total cost analysis is once again emphasized in an effort to identify opportunities to reduce costs. Second, practices such as the use of cross-functional teams are introduced early in the life cycle and continue to be used throughout the remainder of the product's life. However, for many of these practices, the nature or task performed by the practice changes over the life of the product. In the case of cross-functional teams, the main objective in design is to provide information that can improve both a new product's performance and its deliverability. By
maturity, cross-functional teams play a significant role in improving the efficiency of logistics systems.
Overall, the responses demonstrate that logistics plays a limited role in the design stage with increased importance in the introduction stage. This finding supports the notion that new product development and marketing dominate a firm's approach to product launch. Through product launch, logistics has historically played a tangential support role. The responses also clearly show that by early growth, logistics plays an important role in supporting the product- market strategy. The distributions also highlight the importance of efficient and effective logistics support into and through maturity. Finally, it should be noted that none of the 43 practices was viewed to be highly appropriate or frequently used in the decline stage.
Despite some recent interest in reverse logistics, the responses suggest that relatively little emphasis is placed on closely or strategically managing products that are in the decline stage. The following paragraphs address the fit of logistics practices to the different life cycle stages.
The design/introduction stages are comprised of practices that are either used specifically in the new product development process or are integrative in nature. Practices and techniques used to design the logistics infrastructure and support system dominate this life-cycle stage. These practices include facility design, modeling, total cost analysis, and value analysis/value engineering. Getting third-party logistics companies involved in the logistics system design early in a product's life is important for companies that outsource much of their logistics support. Also, total quality management is widely used early in the
12 Journal of Transportation Management
life cycle. This finding suggests that managers truly believe that quality must be designed into a product as well as its accompanying support services. The other type of practice emphasized in the early stages of the life cycle focus on the development of the human resource that is required to support a product throughout its entire life.
The practices that are widely used in the growth stage tend to emphasize the development of the firm's delivery capability. They focus on anticipating demand, establishing sufficient movement and storage capacity, and managingthe information that is needed to control product movement. The establishment of quick response programs and strategic alliances points out an existing desire to achieve high levels of responsiveness during the growth stage. The early growth stage is dominated by practices that are aimed at the planning and execution of a delivery strategy that is designed to assure widespread and timely product availability. By contrast, the late growth (and early maturity) phase clearly focuses on putting in place a systematic or routinized logistics support system. Throughout the early growth stage, infrastructure demands are constantly changing. Similarly, a lack of information regarding customers and volumes limits effective planning for continuous operations. As demand patterns emerge and are better understood, variability and uncertainty are reduced and a more standardized approach to logistics management can be successfully implemented. Any efforts that increase information availability earlier in the life cycle would allow for earlier logistical standardization and thus higher levels of logistics service at lower cost levels.
As a firm's products move fully into maturity, the emphasis in logistics practice moves toward cost minimization. At this point, the
logistics process has been developed and is now closely monitored and maintained. Management efforts focus on reducing inventory requirements, consolidating shipments, simplifying transportation requirements, and limiting loss and damage. The reality is that most of the 43 logistics practices must be implemented before a product ever reaches maturity. They are critical to assuring the success of a product long before it gets to the maturity stage. Thus, the number of practices placed in the maturity stage are limited to those that truly emphasize efficient and reliable logistics operations. These practices allow a company to support a product that faces increased competition and decreased margins.
As previously noted, some practices that are classified in earlier stages such as the use of third-party logistics services or the design of incoming receiving and inspection are the object of renewed emphasis in the maturity stage. The target of the renewed emphasis is enhanced efficiency from reengineered or redesigned logistics processes.
EVALUATING THE IMPLEMENTATION STATUS OF LOGISTICS PRACTICES
To better understand the relationship between logistics practice and the PLC concept, the respondents were asked to indicate on a 7- point scale the actual level of implementation for each of the 43 logistics practices (l=not implemented, 7=fully implemented). The data in Table 5 show the implementation status for the overall respondent group. Significant differences (p = .05) in implementation status—based on the t-statistic—are shown by the vertical lines. That is, the implementation status of those practices connected by the vertical lines is not significantly different. It is both interestingand important to note that the nine most fully implemented practices all focus
Spring 1999 13
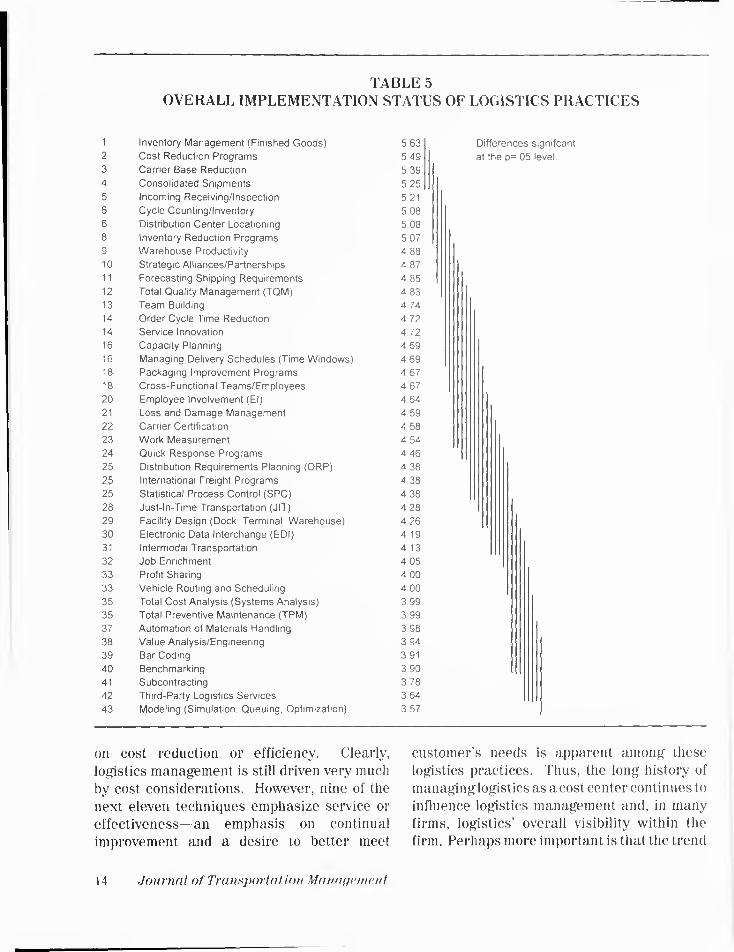
TABLE 5OVERALL IMPLEMENTATION STATUS OF LOGISTICS PRACTICES
1 Inventory Management (Finished Goods) 5 632 Cost Reduction Programs 5 493 Carrier Base Reduction 5 394 Consolidated Shipments 5.255 Incoming Receiving/Inspection 5 216 Cycle Counting/Inventory 5.086 Distribution Center Locationmg 5.088 Inventory Reduction Programs 5.079 Warehouse Productivity 4.8810 Strategic Alliances/Partnerships 4.8711 Forecasting Shipping Requirements 4 8512 Total Quality Management (TQM) 4.8313 Team Building 4.7414 Order Cycle Time Reduction 4.7214 Service Innovation 4.7216 Capacity Planning 4.6916 Managing Delivery Schedules (Time Windows) 4.6918 Packaging Improvement Programs 4.6718 Cross-Functional Teams/Employees 4.6720 Employee Involvement (El) 4 6421 Loss and Damage Management 4.5922 Carrier Certification 4.5823 Work Measurement 4.5424 Quick Response Programs 4 4625 Distribution Requirements Planning (DRP) 4.3825 International Freight Programs 4.3825 Statistical Process Control (SPC) 4.3828 Just-In-Time Transportation (JIT) 4.2829 Facility Design (Dock, Terminal, Warehouse) 4.2630 Electronic Data Interchange (EDI) 4 1931 Intermodal Transportation 4 1332 Job Enrichment 4.0533 Profit Sharing 4 0033 Vehicle Routing and Scheduling 4 0035 Total Cost Analysis (Systems Analysis) 3 9935 Total Preventive Maintenance (TPM) 3.9937 Automation of Materials Handling 3.9838 Value Analysis/Engineering 3 9439 Bar Coding 3 9140 Benchmarking 3.9041 Subcontracting 3.7842 Third-Party Logistics Services 3 6443 Modeling (Simulation, Queuing, Optimization) 3.57
Differences signifcant at the p=.05 level.
on cost reduction or efficiency. Clearly, logistics management is still driven very much by cost considerations. However, nine of the next eleven techniques emphasize service or effectiveness—an emphasis on continual improvement and a desire to better meet
customer’s needs is apparent among these logistics practices. Thus, the long history of managing logistics as a cost center continues to influence logistics management and, in many firms, logistics’ overall visibility within the firm. Perhaps more important is that the trend
14 Journal of Transportation Management
of using logistics to develop a differentiated service capability appears to be gaining credibility among the respondent firms. Certainly, the success of high-profile companies like Wal-Mart—which places logistics at the core of its competitive efforts to meet customer needs at the lowest total cost—has led many companies to closely examine how logistics can play a proactive role in their own competitive strategies (Nelson 1999).
Several practices deserve comment largely because of their relatively low level of implementation. In particular, neither total cost analysis with an implementation rank of 35 and an implementation score of 3.99 nor benchmarking with a rank of 40 and a score of 3.90 have been implemented as extensively as the trade literature has suggested. Other practices with lower than expected implementation levels included statistical process control (rank=27, score = 4.38), Just- In-Time transportation (rank = 28, score = 4.28), and electronic data interchange (rank=30, 4.19). Interestingly, while these practices are not as highly implemented as the authors had expected, each of these practices excepting EDI have relatively strong, significant impacts on firm performance (see Table 6). The performance relationships are discussed below.
Table 6 separates the respondents into two groups—growth and maturity—based on the position in the PLC of the firm's primary products. The implementation status of the 43 techniques is then compared across these two groups. That is, a strong majority of the respondents (87 firms) identified their primary products to be in the maturity stage. Most of the remaining respondents (39 firms) noted that their primary products are in the growth stage of the PLC. For many techniques (approximately half) very little difference in
implementation status was noted across firms whose primary products are in the growth versus maturity stages of the life cycle. Based on a difference score of .30 or greater, ten practices are more fully implemented by firms whose primary products are in the maturity stage. These ten practices are cost reduction programs, consolidated shipments, incoming receiving, forecasting shipping requirements, service innovation, cross-functional teams, loss and damage management, facility design, vehicle routing, and modeling. Two themes appear among these ten practices. First, an emphasis on cost management and reduction is evident. Second, firms with products in the maturity stage place a high level of importance on establishing a more routinized logistics system. The added emphasis on service innovation and cross functional teams also suggests that efforts are made to develop new service offerings that will potentially lead to a renewed opportunity to differentiate the prodnct/service package. This implementation pattern suggests that some attention is given to breaking out of the margin squeeze status that tends to prevail in the maturity stage of the life cycle by creating differential service offerings.
Using the difference score of .30 or greater, five logistics practices are implemented more fully by firms in the growth stage of the PLC. These practices are managing delivery schedules, statistical process control, value analysis, bar coding, and benchmarking. Each of these practices is used to help the firm design and manage its logistics activities to achieve better delivery capability, especially with respect to time competitiveness. Further, the greater use of these practices, and most particularly the greater emphasis on benchmarking, suggests a more aggressive stance on organizational learning. Some of this emphasis on learning comes from the fact that products in the growth stage often exhibit
Spring 1999 15
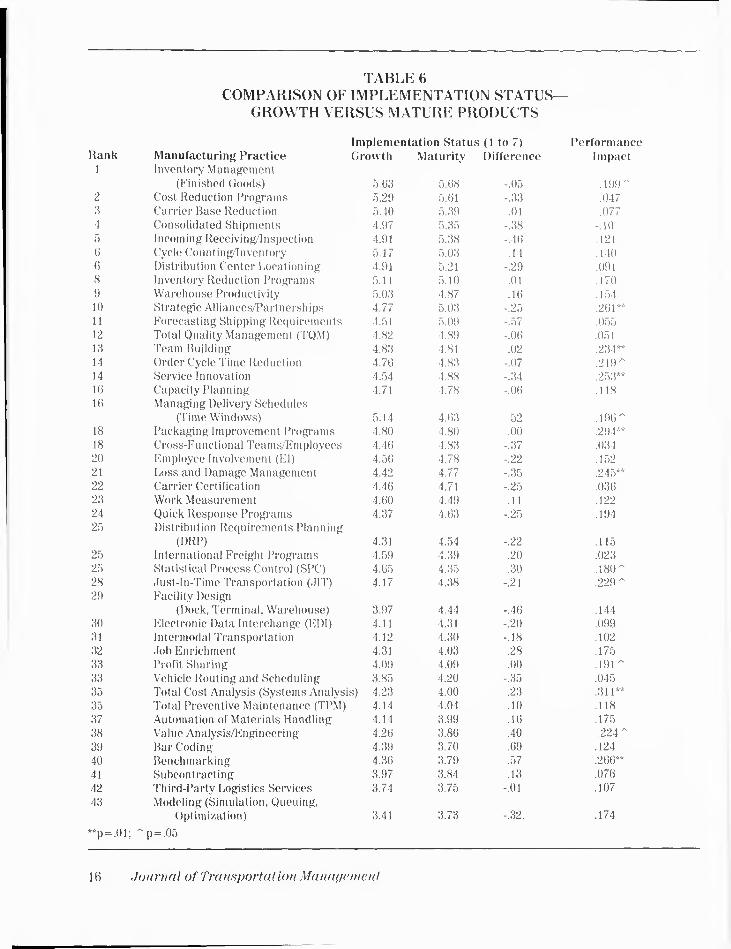
TABLE 6COMPARISON OF IMPLEMENTATION STATUS-
GROWTH VERSUS MATURE PRODUCTS
Implementation Status (1 to 7) PerformanceRank Manufacturing Practice Growth Maturity Difference Impact
1 Inventory Management(Finished Goods) 5.63 5.68 -.05 .199 "
2 Cost Reduction Programs 5.29 5.61 -.33 .0473 Carrier Base Reduction 5.40 5.39 .01 .0774 Consolidated Shipments 4.97 5.35 -.38 -.105 Incoming Receiving/Inspection 4.91 5.38 -.46 .1216 Cycle Counting/Inventory 5.17 5.03 .14 .1406 Distribution Center Locationing 4.91 5.21 -.29 .0918 Inventory Reduction Programs 5.11 5.10 .01 .1709 Warehouse Productivity 5.03 4.87 .16 .15410 Strategic Alliances/Partnerships 4.77 5.03 -.25 .261**11 Forecasting Shipping Requirements 4.51 5.09 -.57 .05512 Total Quality Management (TQM) 4.82 4.89 -.06 .05113 Team Building 4.83 4.81 .02 .234**14 Order Cycle Time Reduction 4.76 4.83 -.07 .219"14 Service Innovation 4.54 4.88 -.34 .253**16 Capacity Planning 4.71 4.78 -.06 .11816 Managing Delivery Schedules
(Time Windows) 5.14 4.63 .52 .196"18 Packaging Improvement Programs 4.80 4.80 .00 .294**18 Cross-Functional Teams/Employees 4.46 4.83 -.37 .03420 Employee Involvement (El) 4.56 4.78 -.22 .15221 Loss and Damage Management 4.42 4.77 -.35 .245**22 Carrier Certification 4.46 4.71 -.25 .03623 Work Measurement 4.60 4.49 .11 .12224 Quick Response Programs 4.37 4.63 -.25 .19425 Distribution Requirements Planning
(DRP) 4.31 4.54 -.22 .11525 International Freight Programs 4.59 4.39 .20 .02325 Statistical Process Control (SPC) 4.65 4.35 .30 .180"28 Just-In-Time Transportation (JIT) 4.17 4.38 -.21 .229"29 Facility Design
(Dock, Terminal, Warehouse) 3.97 4.44 -.46 .14430 Electronic Data Interchange (EDI) 4.11 4.31 -.20 .09931 Intermodal Transportation 4.12 4.30 -.18 .10232 Job Enrichment 4.31 4.03 .28 .17533 Profit Sharing 4.09 4.09 .00 .191"33 Vehicle Routing and Scheduling 3.85 4.20 -.35 .04535 Total Cost Analysis (Systems Analysis) 4.23 4.00 .23 .311**35 Total Preventive Maintenance (TPM) 4.14 4.04 .10 .11837 Automation of Materials Handling 4.14 3.99 .16 .17538 Value Analysis/Engineering 4.26 3.86 .40 .224"39 Bar Coding 4.39 3.70 .69 .12440 Benchmarking 4.36 3.79 .57 .266**41 Subcontracting 3.97 3.84 .13 .07642 Third-Party Logistics Services 3.74 3.75 -.01 .10743 Modeling (Simulation, Queuing,
Optimization) 3.41 3.73 -.32. .174
**p=.01; "p = .05
16 Journal of Transportation Management
a more fluid or flexible set of service requirements, requiring logistics system adaptability to support evolving customer requirements.
Finally, the right-most column of Table 6 consists of data regarding the performance impact of the 43 logistics practices. Performance relationships were measured using the correlation coefficient between each logistics practice and a four-item performance construct. The four items included in the performance construct were overall competitive position and three-year averages for sales growth, market share growth, and growth in return on assets. The Cronbach’s alpha score—a measure of internal consistency—for the performance construct was .89, indicating a high degree of construct reliability. Fifteen of the 43 logistics practices were significantly correlated with the performance construct at the p = .05 level. As already noted, several of these high-impact practices such as total cost management and benchmarking are not very highly implemented. Firms continue to have problems collecting data regarding all of the many logistics activities that comprise a complete, well-rounded measure of total costs. Interviews with several companies revealed that many use a simplified, three or four-item measure of total costs. While this simplified version of a total cost measure is useful for gauging total logistics costs, it does not provide the richness necessary for extensive trade-off analysis. Interviews also revealed that while some companies are aggressive benchmarkers, many others either place a priori confidence in their logistical abilities or find themselves too busy putting out day-to
day fires to concentrate on benchmarking initiatives.
From a broader perspective, the correlation data suggest that a disconnect exists between the extent of implementation and the impact on performance. Indeed, the fifteen activities that are significantly correlated with performance have an average implementation rank of 20. That is, with the exception of inventory management, many of the more high impact logistics activities are not highly implemented. Many opportunities to enhance logistics competitive impact appear to exist. Based on the correlation analysis, these opportunities are concentrated in three areas: time-based competition, relationship building within the supply chain, and human resource development.
CONCLUSIONS AND IMPLICATIONS
Logistics strategy has taken on increased importance in today's rapidly globalizing marketplace. A unique opportunity for logistics to not only add value but to provide strategic leverage has been created by the combination of more intense competition, greater distances encountered in manufacturing and delivering products, and higher levels of environmental uncertainty. Given the number of logistics practices and techniques that have been introduced in recent years and the complexity of an intensely competitive world, managers can benefit from a decision framework that can help them design and implement more effective logistics
Spring 1999 17
strategies. The desire to allocate scarce resources so that they deliver the greatest competitive impact increases the need for a useful planning framework. This research has explored the potential of the product life cycle to help logistics managers meet the planning needs of today's ever changing marketplace.
The findings from the empirical matching of logistics practices to PLC stages suggests that managers evaluate the appropriateness of logistics practices based on when a practice first becomes appropriate. Further, the fact that the majority of firms have products in different stages of the life cycle—all of which require logistics support—increases the difficulty of assigning any practice to a single life cycle stage. Nevertheless, the matching analysis provides a framework to guide strategy development and tactical practice.
• Logistics' involvement in the design and introduction stages currently focuses on helping design the service component of the product/service package. The key here is on the design of facilities and processes that will be used to deliver the product. The practices designated as appropriate at these early stages are consistent with concurrent or simultaneous engineering. Issues regardinginitial product launch also require input from logistics managers. Overall, the responses suggest that logistics plays a tangential and parallel, rather than a central, role in these first two stages of the PLC. The importance of product development and launch to firm competitiveness highlights an opportunity
for logistics to become more involved in theseearly stages.
• Logistics' involvement in the growth stage is principally to assure widespread market coverage combined with rapid and responsive delivery service. From this perspective, logistics takes on the responsibility of helping the firm achieve a differential competitive advantage based on availability and service. Clearly, logistics becomes a vital component of the firm's product-market strategy during the growth stage.
• Logistics' involvement in the maturity stage changes rather noticeably with the new focus being on cost management. The data suggest that toward the end of the growth stage, the logistics infrastructure reaches a point where it is generally in place and ready to support continued steady-state operations. Once this point is reached, logistics practices are routinized to provide consistent, cost-effective service. While logistics efficiency is the primary driver of management practice during product maturity, the responses suggest that increasing efforts are being targeted at designing innovative service options to renew competitiveness and extend product life.
• Logistics' involvement in the decline stage is once again somewhat limited. Indeed, logistics initiatives during decline focus almost exclusively on minimizing costs, especially as product is withdrawn from
18 Journal of Transportation Management
the market. The respondents suggested that minimal attention is given to strategically managing product once decline has become a reality.
The analysis of implementation status supported the notion that firms with products in different life cycle stages manage logistics practices differently. Firms in the growth stage emphasize techniques that help them get their products to market—where and when customers need them. The vital need is to be responsive in filling orders in a very dynamic and uncertain environment. That is, the firm needs to use logistics to achieve rapid and widespread geographic coverage without expending scarce resources that are needed to support the desired growth in market share. Firms in the maturity stage face continued demands for high-caliber delivery service coupled with the challenge of shrinking margins. To meet these logistics requirements, strategic efforts focus on
simplifying and standardizing the logistics support system. This routinization process is necessary to minimize cost while still providing expected service levels. In addition, the implementation status of the different logistics techniques highlighted the fact that logistics strategy must promote a process that leads to continual improvement in service- oriented capabilities, especially as they relate to delivery responsiveness at the lowest possible costs. Finally, the performance analysis reveals that new logistics trends, including cycle time compression and channel integration, are not only appropriate for today’s shorter cycle times but also positively enhance firm performance.
Well-designed logistics strategies that recognize the influence of the product life cycle will be able to help firms meet the challenge of managing perpetual change to meet the emerging needs of world consumers.
REFERENCES
Anderson, C. R. and C. P. Zeithaml (1984), “Stage of the Product Life Cycle. Business Strategy and Business Performance,” Academy of Management Journal, 27(1): 5-24.
Anderson, J. C., R. G. Schroeder, and G. Cleveland (1991), “The Process of Manufacturing Strategy: Some Empirical Observations and Conclusions,” International Journal of Operations and Production Management, 11(3): 86-110.
Ayres, R. U. and W. A. Steger (1985), “Rejuvenatingthe Life Cycle Concept,” The Journal of Business Strategy, 6: 66-76.
Bagchi, P. K., T. S. Raghunathan, and E. J. Bardi (1988), “The Implications of Just-in- Time Inventory Policies on Carrier Selection,”Logistics and Transportation Review, 23(4): 373-384.
Blackwell, R. D. (1997), From Mind to Market: Reinventing the Retail Supply Chain, New York: Harper Business.
Spring 1999 19

Cho, H., M. Jung, and M. Kim (1996), “Enabling Technologies of Agile Manufacturing and Its Related Activities in Korea,” Computers and Industrial Engineering, 30(3): 323-335.
Cravens, D. W. (1986), “Strategic Forces Affecting Marketing Strategy,” Business Horizons, (September October): 77-86.
P'ox, H. W. and D. R. Rink (1977), “Coordination of Purchasing with Sales Trends,” Journal of Purchasing and Materials Management,: 10-18.
Grant, E. B. and M. J. Gregory (1997), “Tacit Knowledge, the Life Cycle and International Manufacturing Transfer,” Technology Analysis and Strategic Management, 9(2): 149-161.
Hambrick, D. C. and D. Lei (1985), “Toward an Empirical Prioritization of Contingency Variables for Business Strategy,” Academy of Management Journal, 28(4): 763-788.
Hayes, R. and S. Wheelwright (1984), Restoring Our Competitive Edge: Competing Through Manufacturing. New York: John Wiley and Sons.
Hayes, R. H. and S. C. Wheelwright (1979), “Link Manufacturing Process and Product Life Cycles,” Harvard Business Review, 57:133-140.
Henkoff, R. (1994), “Delivering the Goods,” Fortune, (November 28): 64-78.
Hofer, C. (1975), “Toward a Contingency Theory of Strategy,” Academy of Management Journal, (December): 784- 810.
Kaminski, P. F. and I). R. Rink (1984), “PLC: The Missing Link Between Physical Distribution and Marketing Planning,” The International Journal of Physical D i s t r i t) u t i o n a n d M a t e r i a l s Management, 14(6): 77-92.
Kiser, G. E. and I). R. Rink (1976), “Use of the Product Life Cycle Concept in Development of Purchasing Strategies,” Journal of Purchasing and Materials Management, (Winter): 19-24.
Kotler, P. and G. Armstrong(1991),Principles of Marketing, (5th ed.), Englewood Cliffs, New Jersey: Printice Hall.
Lau, R. S. M. (1995), “Mass Customization: The Next Industrial Revolution,” Industrial Management, 37(5): 18.
Lieb, R. C. and R. A. Miller (1988), “JIT and Corporate Transportation Requirements,” Transportation Journal, 27(3): 5-10.
Miles, R. E., C. C. Snow, A. I). Meyer, and J. H.J. Coleman (1978), “Organizational Strategy, Structure, and Process,” Academy of Management Review, (July): 546-562.
20 Journal of Transportation Management
Nelson, E. (1999, March 11), “Logistics Whiz Rises at Wal-Mart,” Wall Street Journal: Bl, B8.
Porter, M. (1980), Competitive Strategy, New York: The Free Press.
Stock, J. and D. Lambert (1992), “Becoming a ‘World Class’ Company With Logistics Service Quality,” International Journal of Logistics Management, 3(1): 73-80.
Taguchi, CL and D. Clausing (1990), “Robust Quality,” Harvard Business Review, 68(1): 65-75.
Thorelli, H. B. and S. C. Burnett (1981), “The Nature of Product Life Cycles for Industrial Goods,” Journal of Marketing, 45(4): 97- 108.
Wasson, C. R. (1978), Dynamic Competitive Strategy and Product Life Cycles, Austin, TX: Austin Press.
Wyland, D. W. (1998), “Keep Your Product in Play: Introducing Full Life-cycleManagement,” Chain Store Age, 74(9): 186.
AUTHOR BIOGRAPHY
Stanley E. Fawcett is Professor of Global Supply Chain Management in the Marriott School at Brigham Young University. He received his Ph.D. from Arizona State University and taught for several years at Michigan State University before joining the faculty at the Marriott School. Stan has published numerous papers in leading logistics, operations, purchasing, and marketing journals. His research interests include international logistics, supply chain integration, and customer success.
AUTHOR BIOGRAPHY
GregMagnan is an assistant professor in the Albers School of Management at the University of Seattle. He received his Ph.D. in operations management from Michigan State University. Greg has published articles in leading purchasing and operations journals. His research interests focus on strategic operations and supply chain management.
Spring 1999 21

AUTHOR BIOGRAPHY
Laura Birou is an associate professor in the School of Business and Public Management at George Washington University. Laura received her Ph.D. from Michigan State University in purchasing and operations management. She is a frequent public speaker and author of several articles in purchasing and logistics management. Her research interests focus on strategic purchasing and supply chain management as well as ethics in materials management.
22 Journal of Transportation Management
Related Documents