Cycle Logistics Industry Survey 2016 Survey Analysis Report Cycle Logistics Industry Survey 2016 Developed and distributed by the European Cycle Logistics Federation Analysed by the Amsterdam University of Applied Sciences 15 August 2016 Amsterdam University of Applied Sciences Research Program Urban Technology Faculty of Technology Weesperzijde 190, 1097 DZ Amsterdam Postbus 1025, 1000 BA Amsterdam The Netherlands Project Team Susanne Balm (project leader) Martijn Kooi (data analist) Annemijn van Herwijnen (student assistant) Nathalie Gozems (student assistant) Contact Person AUAS Susanne Balm P: 00316-21157771 E: [email protected] W: http://www.hva.nl/urbantechnology Contact Person ECLF Gary Armstrong P: +44 7777 656142 E: [email protected] W: www.eclf.bike

Welcome message from author
This document is posted to help you gain knowledge. Please leave a comment to let me know what you think about it! Share it to your friends and learn new things together.
Transcript
Cycle Logistics Industry Survey 2016
Survey Analysis Report
Cycle Logistics Industry Survey 2016
Developed and distributed by the European Cycle Logistics Federation Analysed by the Amsterdam University of Applied Sciences 15 August 2016 Amsterdam University of Applied Sciences Research Program Urban Technology Faculty of Technology Weesperzijde 190, 1097 DZ Amsterdam Postbus 1025, 1000 BA Amsterdam The Netherlands Project Team Susanne Balm (project leader) Martijn Kooi (data analist) Annemijn van Herwijnen (student assistant) Nathalie Gozems (student assistant) Contact Person AUAS Susanne Balm P: 00316-21157771 E: [email protected] W: http://www.hva.nl/urbantechnology Contact Person ECLF Gary Armstrong P: +44 7777 656142 E: [email protected] W: www.eclf.bike
Urban Technology © 2012, Hogeschool van Amsterdam 30 June 2016 – Version 3.0
2
Cycle Logistics Industry Survey 2016
Table of contents
1. EXECUTIVE SUMMARY ................................................................................................................... 3
2. INTRODUCTION ............................................................................................................................... 4
3. INFORMATION ON THE DATA SET AND ANALYSIS ..................................................................... 4
4. ANALYSIS PART A: GENERAL QUESTIONS .................................................................................. 5
5. ANALYSIS PART A: SERVICES ....................................................................................................... 7
6. ANALYSIS PART A: FLEET ............................................................................................................ 11
7. ANALYSIS PART A: STAFF ............................................................................................................ 15
8. ANALYSIS PART A: INFORMATION TECHNOLOGY .................................................................... 20
9. ANALYSIS PART A: FINANCIAL .................................................................................................... 23
10. ANALYSIS PART B: OPERATIONAL DATA ................................................................................... 26
Urban Technology © 2012, Hogeschool van Amsterdam 30 June 2016 – Version 3.0
3
Cycle Logistics Industry Survey 2016
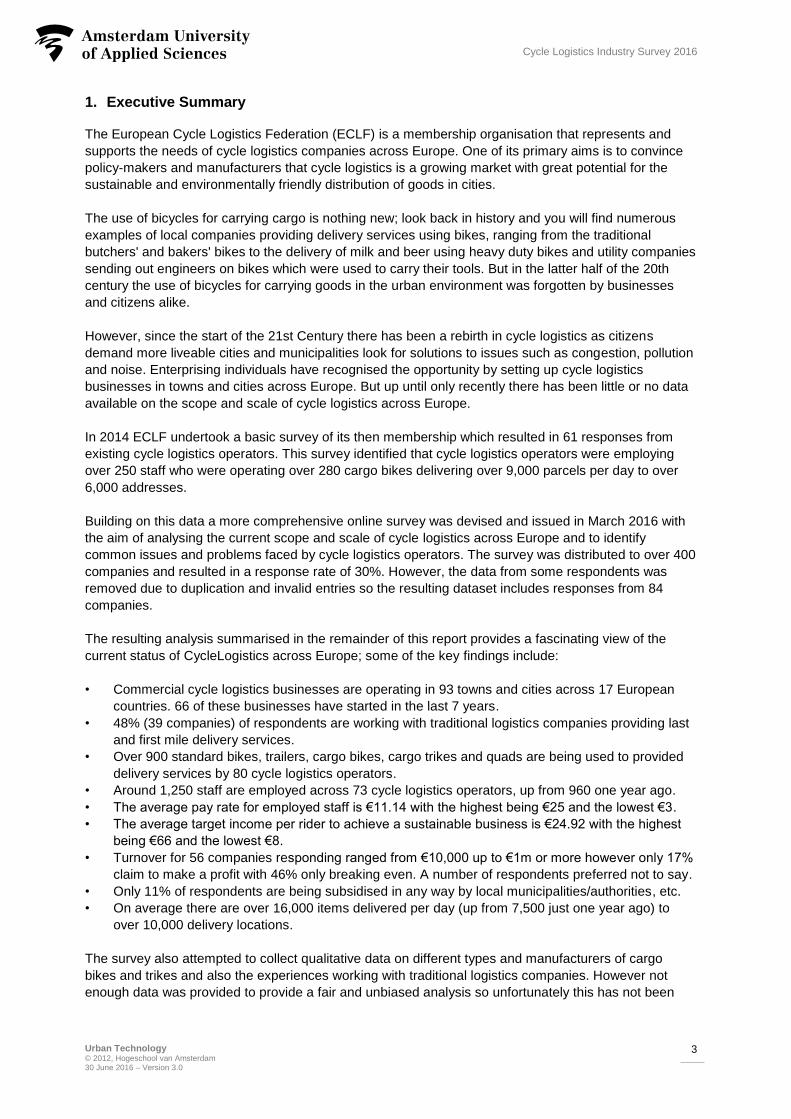
1. Executive Summary
The European Cycle Logistics Federation (ECLF) is a membership organisation that represents and
supports the needs of cycle logistics companies across Europe. One of its primary aims is to convince
policy-makers and manufacturers that cycle logistics is a growing market with great potential for the
sustainable and environmentally friendly distribution of goods in cities.
The use of bicycles for carrying cargo is nothing new; look back in history and you will find numerous
examples of local companies providing delivery services using bikes, ranging from the traditional
butchers' and bakers' bikes to the delivery of milk and beer using heavy duty bikes and utility companies
sending out engineers on bikes which were used to carry their tools. But in the latter half of the 20th
century the use of bicycles for carrying goods in the urban environment was forgotten by businesses
and citizens alike.
However, since the start of the 21st Century there has been a rebirth in cycle logistics as citizens
demand more liveable cities and municipalities look for solutions to issues such as congestion, pollution
and noise. Enterprising individuals have recognised the opportunity by setting up cycle logistics
businesses in towns and cities across Europe. But up until only recently there has been little or no data
available on the scope and scale of cycle logistics across Europe.
In 2014 ECLF undertook a basic survey of its then membership which resulted in 61 responses from
existing cycle logistics operators. This survey identified that cycle logistics operators were employing
over 250 staff who were operating over 280 cargo bikes delivering over 9,000 parcels per day to over
6,000 addresses.
Building on this data a more comprehensive online survey was devised and issued in March 2016 with
the aim of analysing the current scope and scale of cycle logistics across Europe and to identify
common issues and problems faced by cycle logistics operators. The survey was distributed to over 400
companies and resulted in a response rate of 30%. However, the data from some respondents was
removed due to duplication and invalid entries so the resulting dataset includes responses from 84
companies.
The resulting analysis summarised in the remainder of this report provides a fascinating view of the
current status of CycleLogistics across Europe; some of the key findings include:
• Commercial cycle logistics businesses are operating in 93 towns and cities across 17 European
countries. 66 of these businesses have started in the last 7 years.
• 48% (39 companies) of respondents are working with traditional logistics companies providing last
and first mile delivery services.
• Over 900 standard bikes, trailers, cargo bikes, cargo trikes and quads are being used to provided
delivery services by 80 cycle logistics operators.
• Around 1,250 staff are employed across 73 cycle logistics operators, up from 960 one year ago.
• The average pay rate for employed staff is €11.14 with the highest being €25 and the lowest €3.
• The average target income per rider to achieve a sustainable business is €24.92 with the highest
being €66 and the lowest €8.
• Turnover for 56 companies responding ranged from €10,000 up to €1m or more however only 17%
claim to make a profit with 46% only breaking even. A number of respondents preferred not to say.
• Only 11% of respondents are being subsidised in any way by local municipalities/authorities, etc.
• On average there are over 16,000 items delivered per day (up from 7,500 just one year ago) to
over 10,000 delivery locations.
The survey also attempted to collect qualitative data on different types and manufacturers of cargo
bikes and trikes and also the experiences working with traditional logistics companies. However not
enough data was provided to provide a fair and unbiased analysis so unfortunately this has not been
Urban Technology © 2012, Hogeschool van Amsterdam 30 June 2016 – Version 3.0
4
Cycle Logistics Industry Survey 2016
included in the final summary report. We consider this essential information to collect and in looking
forward will be exploring ways in which this data can be captured and fairly published.
Completion of the survey was entirely voluntary, could be completed anonymously and was targeted at
businesses we are aware of. Anecdotally we think there could easily be a further 80 cycle logistics
operators in Europe who we have yet to engage with and whose data it would be most valuable to
capture.
Finally, we would like to thank everyone who responded to the survey and the research program Urban
Technology from the Amsterdam University of Applied Sciences (AUAS) who assisted ECLF with the
analysis of the responses and the preparation of this report.
2. Introduction
To get a better idea of the scope, scale, opportunities and common problems of cycle logistics, ECLF
has distributed an online survey. The survey was open to respondents between March and April 2016.
The target audience are companies that use cargo bikes/trikes to undertake delivery work. The research
program Urban Technology from the Amsterdam University of Applied Sciences (AUAS) has assisted
ECLF with the analysis of the response. This report presents a graphical representation of the survey
answers. ECLF provided the data and the work has been carried out by researchers and student-
assistants from AUAS.
The Amsterdam University of Applied Sciences (AUAS) is located in The Netherlands and has around
43.000 students, 4.000 employees, 80 bachelor programs and 8 research programs that are carried out
together with academics and professionals. The research program Urban Technology explores and
develops solutions for complex problems that arise in cities. The multidisciplinary projects address
challenges relating to logistics and mobility, urban design, smart energy systems and circular economy.
3. Information on the data set and analysis
The survey consists of 97 questions divided in two parts. Part A has 28 questions and Part B has 69 questions. The survey has been distributed to more than 400 companies. In total 122 companies started the survey (response rate of approximately 30%) of which 38 respondents have been removed from the dataset as their answers were invalid. The final dataset includes 84 respondents that started with Part A. After finishing Part A, respondents were asked whether they would like to continue with Part B. In total 47 respondents started with Part B. None of the questions was compulsory, therefore the number of respondents (N) can differ per question. The graphical analysis is presented in 7 separate chapters. Some questions have been excluded from this report due to a lack of responses.
Analysis part A:
General questions
Services
Fleet
Staff
Information Technology
Financial Analysis part B:
Operational data
Urban Technology © 2012, Hogeschool van Amsterdam 30 June 2016 – Version 3.0
5
Cycle Logistics Industry Survey 2016
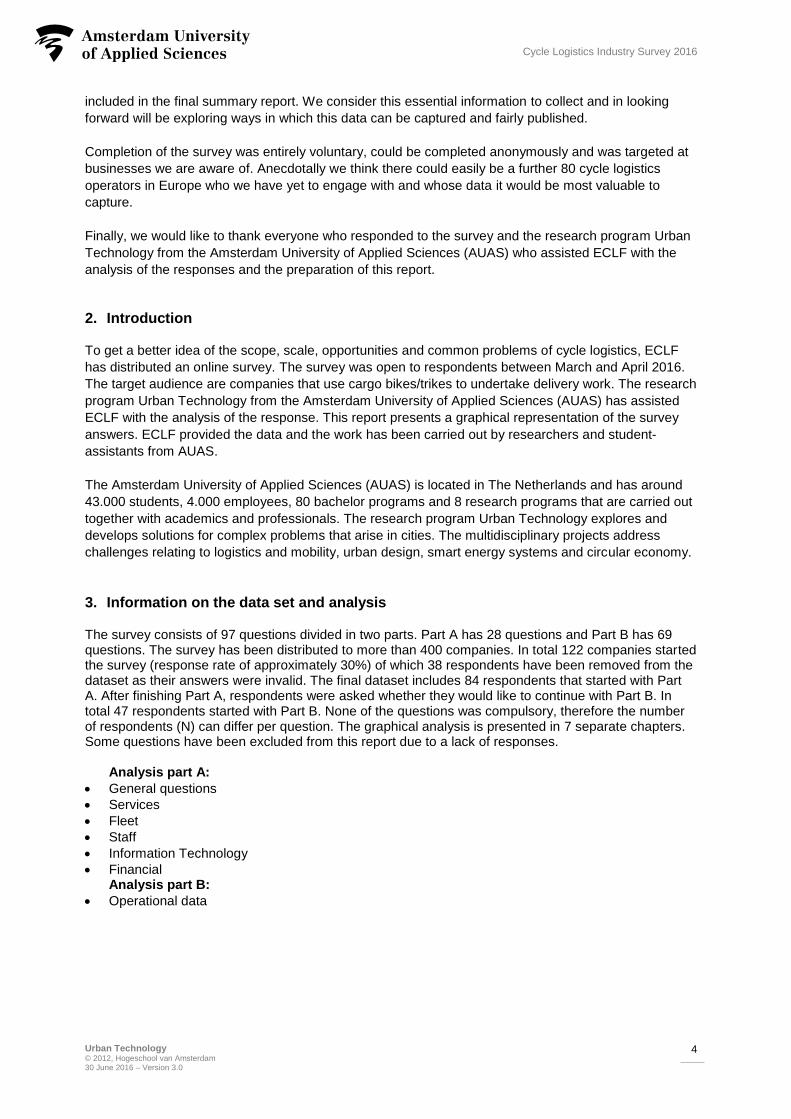
4. Analysis Part A: General questions
Figure 1 Q8a. Map of countries where cycle logistics companies currently operate
Country
Number of cities/towns where cycle logistics companies currently operate
Belgium 7
Czech Republic 12
Denmark 1
France 9
Germany 3
Greece 1
Hungary 1
Italy 15
The Netherlands 10
Romania 1
Slovakia 2
Slovenia 1
Spain 10
Sweden 2
Switzerland 1
UK 15
Ukraine 2
Table 1 Q8b. Table of cities/towns where cycle logistics companies currently operate
Urban Technology © 2012, Hogeschool van Amsterdam 30 June 2016 – Version 3.0
6
Cycle Logistics Industry Survey 2016
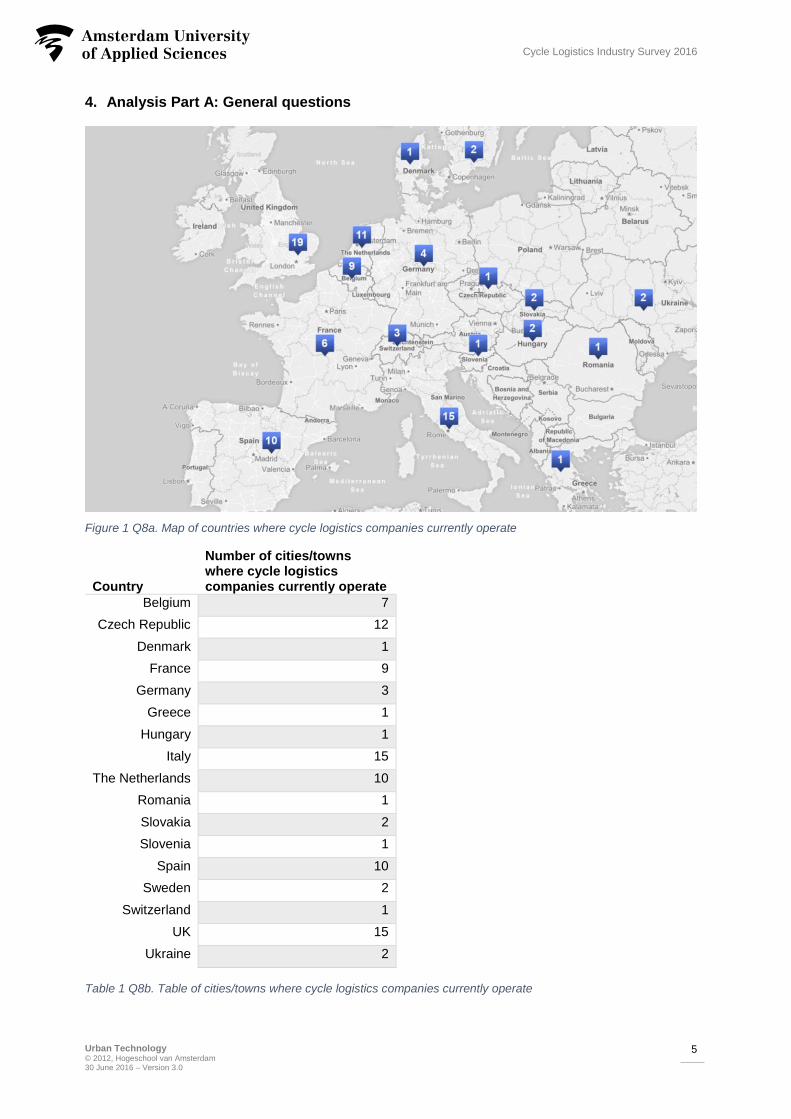
Examples of category ‘Other’: Cycling culture association, Community of goods etc.
1 12
1 1 1 1 1 1 1 1 1 1 12
1 1 1
32
7
1112
15
10
4
0
2
4
6
8
10
12
14
16
Num
ber
of
respondents
Q4. What year did the company first start operating? (N=84)
1 1 1 1 1 1 1 1 1 1 1 1
3
1 1 1
4
6
1011
18
13
4
0
2
4
6
8
10
12
14
16
18
20
Num
ber
of
respondents
Q5. What year did the company start providing cycle logistics solutions? (N=84)
6%
2%
1%
4%
7%
20%
23%
37%
0% 5% 10% 15% 20% 25% 30% 35% 40%
Other
Prefer not to say
Public Limited Company
Social Enterprise
Co-operative
Private Partnership
Sole Trader/Proprietor
Private Limited Company
% of respondents
Q6. What is the legal status of your company? (N=84)
Urban Technology © 2012, Hogeschool van Amsterdam 30 June 2016 – Version 3.0
7
Cycle Logistics Industry Survey 2016
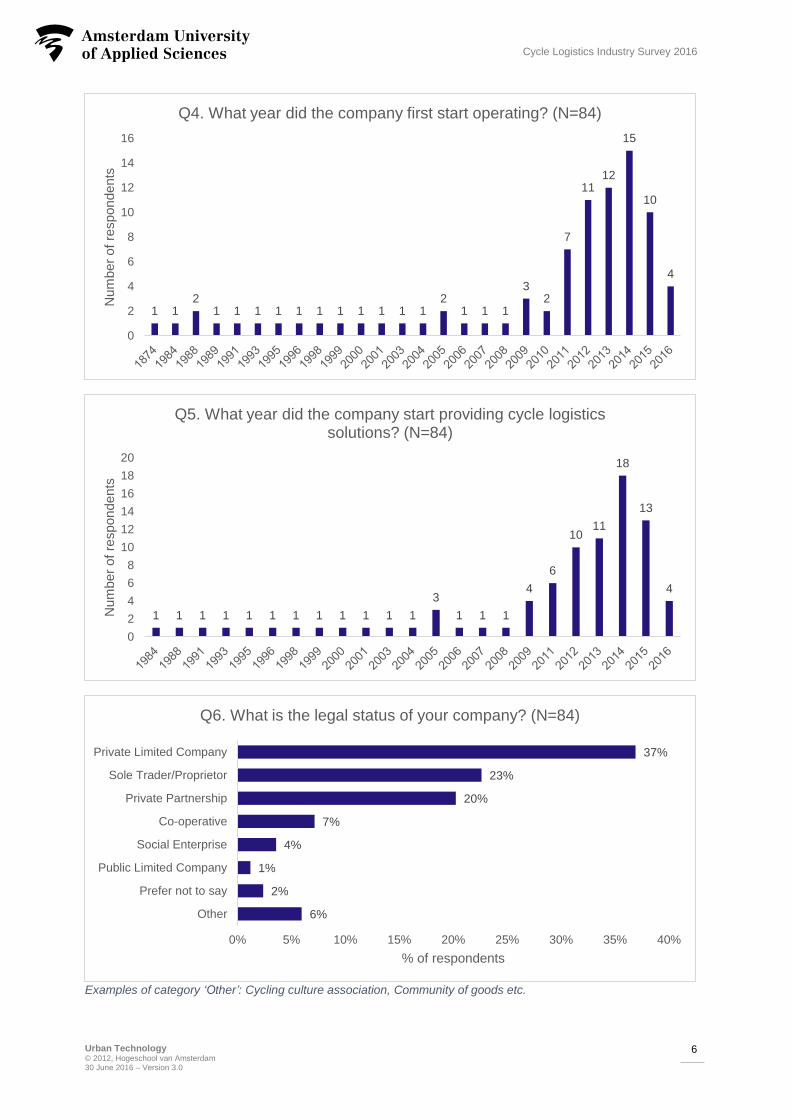
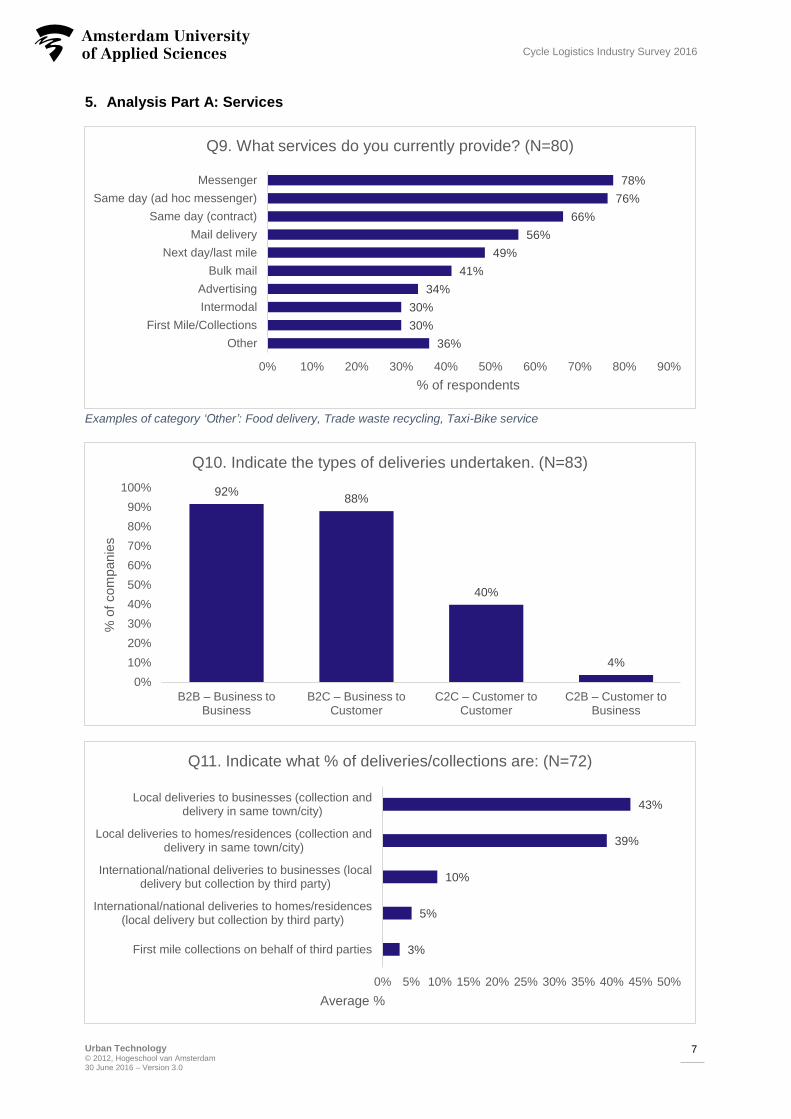
5. Analysis Part A: Services
36%
30%
30%
34%
41%
49%
56%
66%
76%
78%
0% 10% 20% 30% 40% 50% 60% 70% 80% 90%
Other
First Mile/Collections
Intermodal
Advertising
Bulk mail
Next day/last mile
Mail delivery
Same day (contract)
Same day (ad hoc messenger)
Messenger
% of respondents
Q9. What services do you currently provide? (N=80)
92%88%
40%
4%
0%
10%
20%
30%
40%
50%
60%
70%
80%
90%
100%
B2B – Business to Business
B2C – Business to Customer
C2C – Customer to Customer
C2B – Customer to Business
% o
f com
panie
s
Q10. Indicate the types of deliveries undertaken. (N=83)
3%
5%
10%
39%
43%
0% 5% 10% 15% 20% 25% 30% 35% 40% 45% 50%
First mile collections on behalf of third parties
International/national deliveries to homes/residences(local delivery but collection by third party)
International/national deliveries to businesses (localdelivery but collection by third party)
Local deliveries to homes/residences (collection anddelivery in same town/city)
Local deliveries to businesses (collection anddelivery in same town/city)
Average %
Q11. Indicate what % of deliveries/collections are: (N=72)
Examples of category ‘Other’: Food delivery, Trade waste recycling, Taxi-Bike service
Urban Technology © 2012, Hogeschool van Amsterdam 30 June 2016 – Version 3.0
8
Cycle Logistics Industry Survey 2016
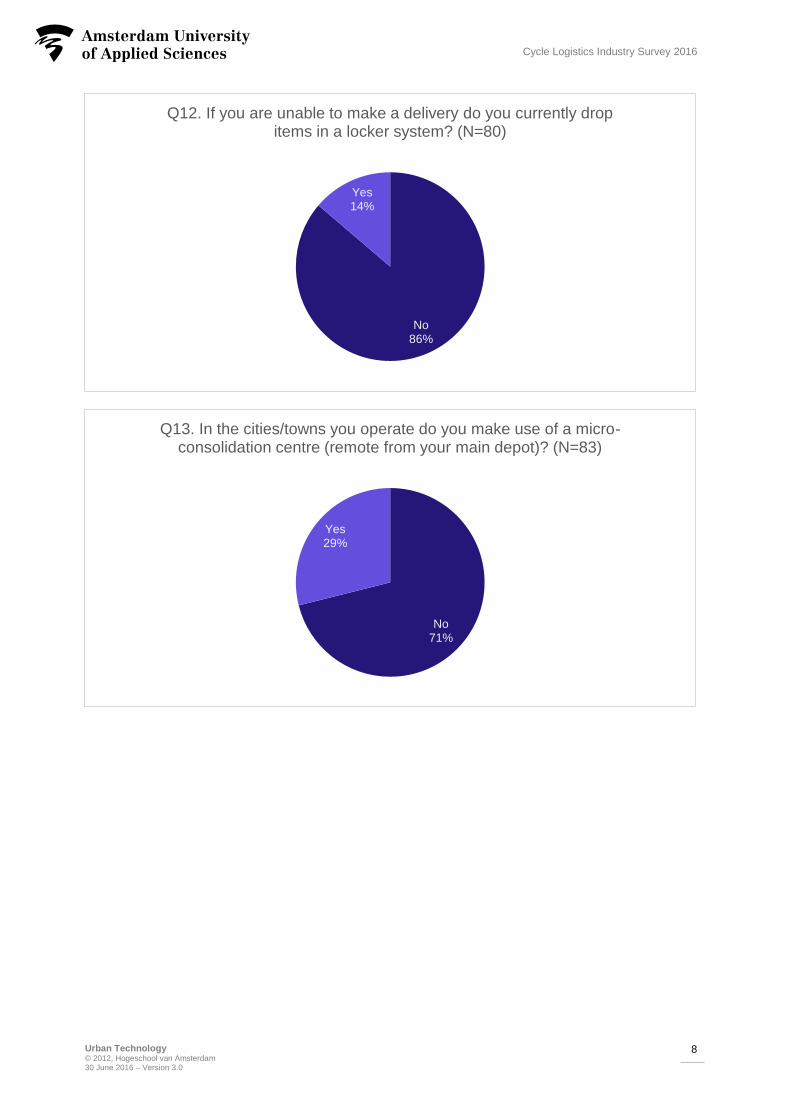
No86%
Yes14%
Q12. If you are unable to make a delivery do you currently drop items in a locker system? (N=80)
No71%
Yes29%
Q13. In the cities/towns you operate do you make use of a micro-consolidation centre (remote from your main depot)? (N=83)
Urban Technology © 2012, Hogeschool van Amsterdam 30 June 2016 – Version 3.0
9
Cycle Logistics Industry Survey 2016
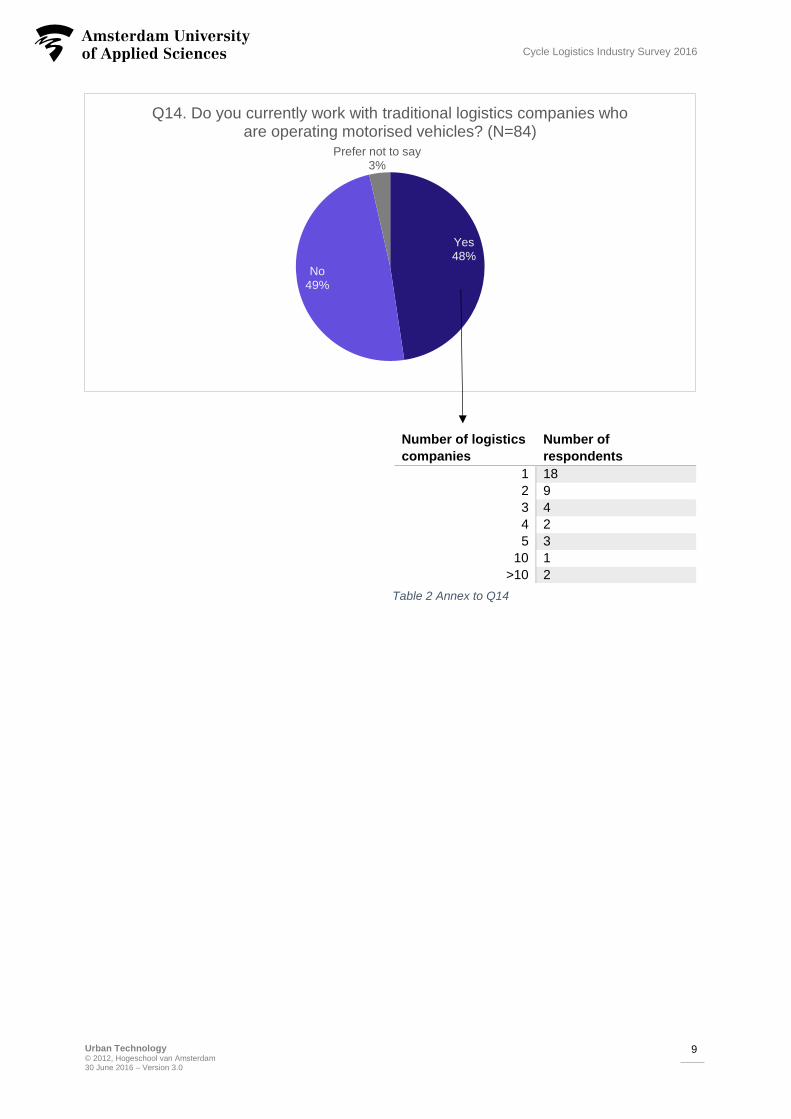
Yes48%
No49%
Prefer not to say3%
Q14. Do you currently work with traditional logistics companies who are operating motorised vehicles? (N=84)
Number of logistics
companies
Number of
respondents
1 18
2 9
3 4
4 2
5 3
10 1
>10 2
Table 2 Annex to Q14
Urban Technology © 2012, Hogeschool van Amsterdam 30 June 2016 – Version 3.0
10
Cycle Logistics Industry Survey 2016
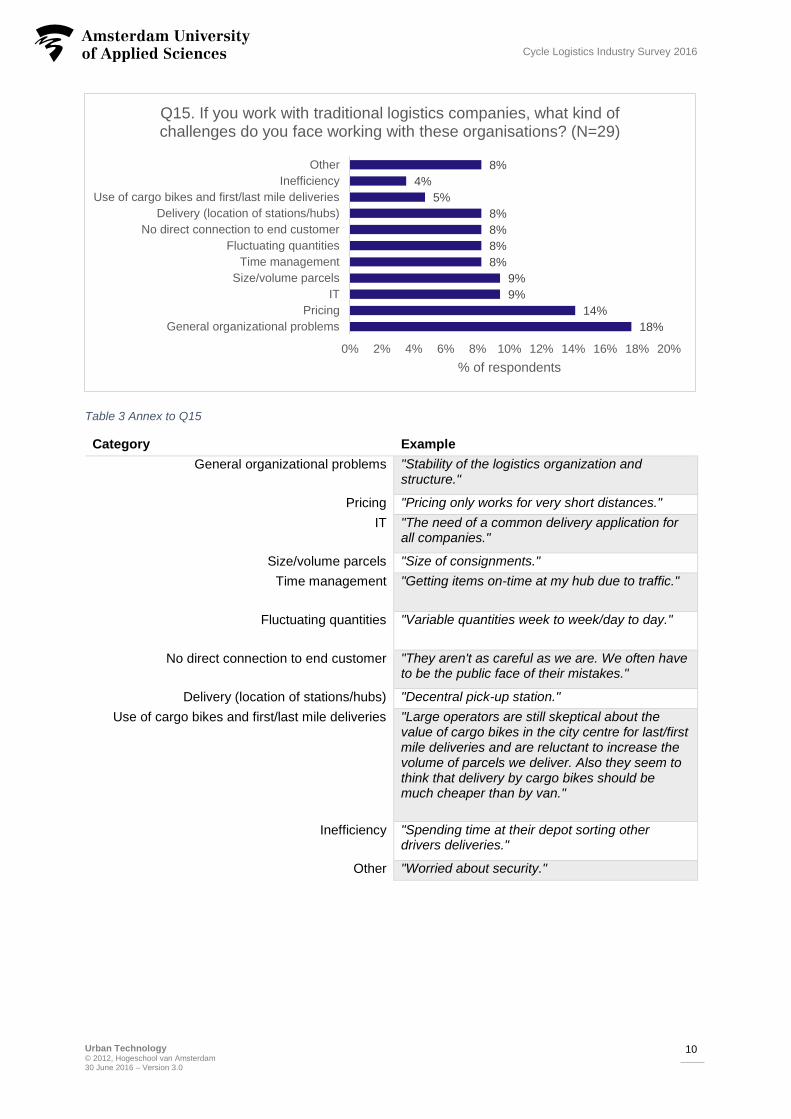
Table 3 Annex to Q15
Category Example
General organizational problems "Stability of the logistics organization and structure."
Pricing "Pricing only works for very short distances."
IT "The need of a common delivery application for all companies."
Size/volume parcels "Size of consignments."
Time management "Getting items on-time at my hub due to traffic."
Fluctuating quantities "Variable quantities week to week/day to day."
No direct connection to end customer "They aren't as careful as we are. We often have to be the public face of their mistakes."
Delivery (location of stations/hubs) "Decentral pick-up station."
Use of cargo bikes and first/last mile deliveries "Large operators are still skeptical about the value of cargo bikes in the city centre for last/first mile deliveries and are reluctant to increase the volume of parcels we deliver. Also they seem to think that delivery by cargo bikes should be much cheaper than by van."
Inefficiency "Spending time at their depot sorting other drivers deliveries."
Other "Worried about security."
18%
14%
9%
9%
8%
8%
8%
8%
5%
4%
8%
0% 2% 4% 6% 8% 10% 12% 14% 16% 18% 20%
General organizational problems
Pricing
IT
Size/volume parcels
Time management
Fluctuating quantities
No direct connection to end customer
Delivery (location of stations/hubs)
Use of cargo bikes and first/last mile deliveries
Inefficiency
Other
% of respondents
Q15. If you work with traditional logistics companies, what kind of challenges do you face working with these organisations? (N=29)
Urban Technology © 2012, Hogeschool van Amsterdam 30 June 2016 – Version 3.0
11
Cycle Logistics Industry Survey 2016
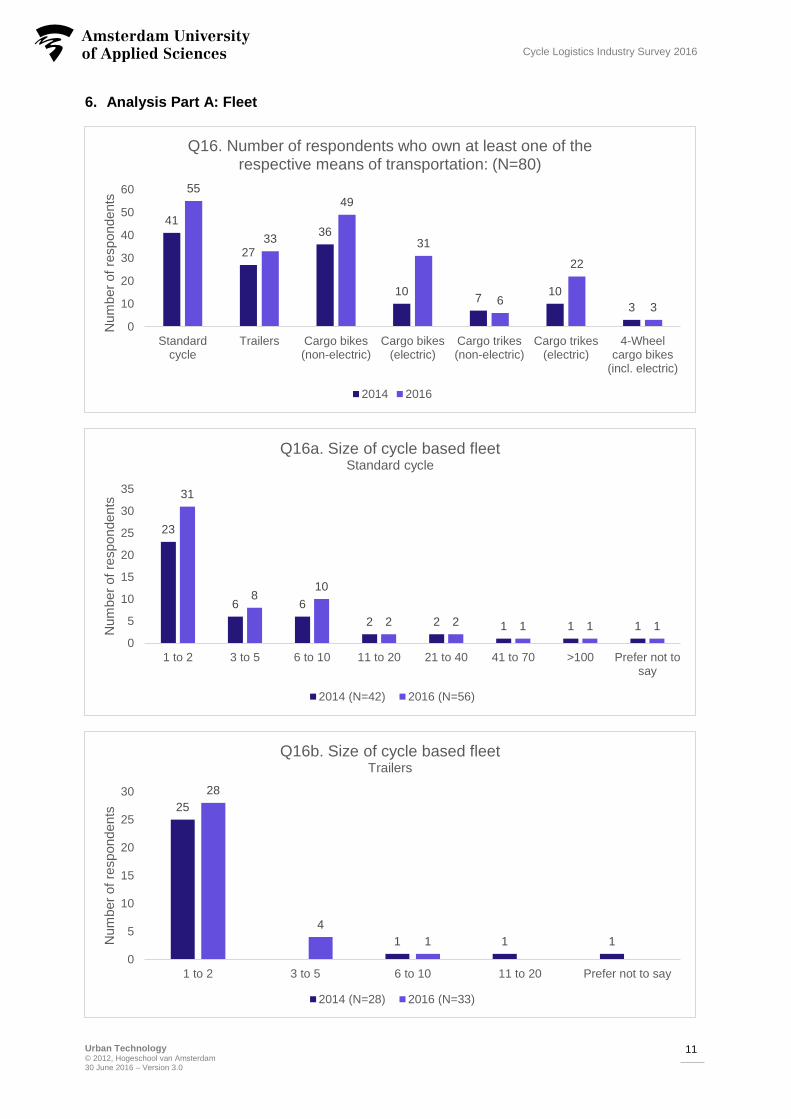
6. Analysis Part A: Fleet
41
27
36
107
10
3
55
33
49
31
6
22
3
0
10
20
30
40
50
60
Standardcycle
Trailers Cargo bikes(non-electric)
Cargo bikes(electric)
Cargo trikes(non-electric)
Cargo trikes(electric)
4-Wheelcargo bikes
(incl. electric)
Num
ber
of
respondents
Q16. Number of respondents who own at least one of the respective means of transportation: (N=80)
2014 2016
23
6 6
2 2 1 1 1
31
810
2 2 1 1 1
0
5
10
15
20
25
30
35
1 to 2 3 to 5 6 to 10 11 to 20 21 to 40 41 to 70 >100 Prefer not tosay
Num
ber
of
respondents
Q16a. Size of cycle based fleetStandard cycle
2014 (N=42) 2016 (N=56)
25
1 1 1
28
4
1
0
5
10
15
20
25
30
1 to 2 3 to 5 6 to 10 11 to 20 Prefer not to say
Num
ber
of
respondents
Q16b. Size of cycle based fleetTrailers
2014 (N=28) 2016 (N=33)
Urban Technology © 2012, Hogeschool van Amsterdam 30 June 2016 – Version 3.0
12
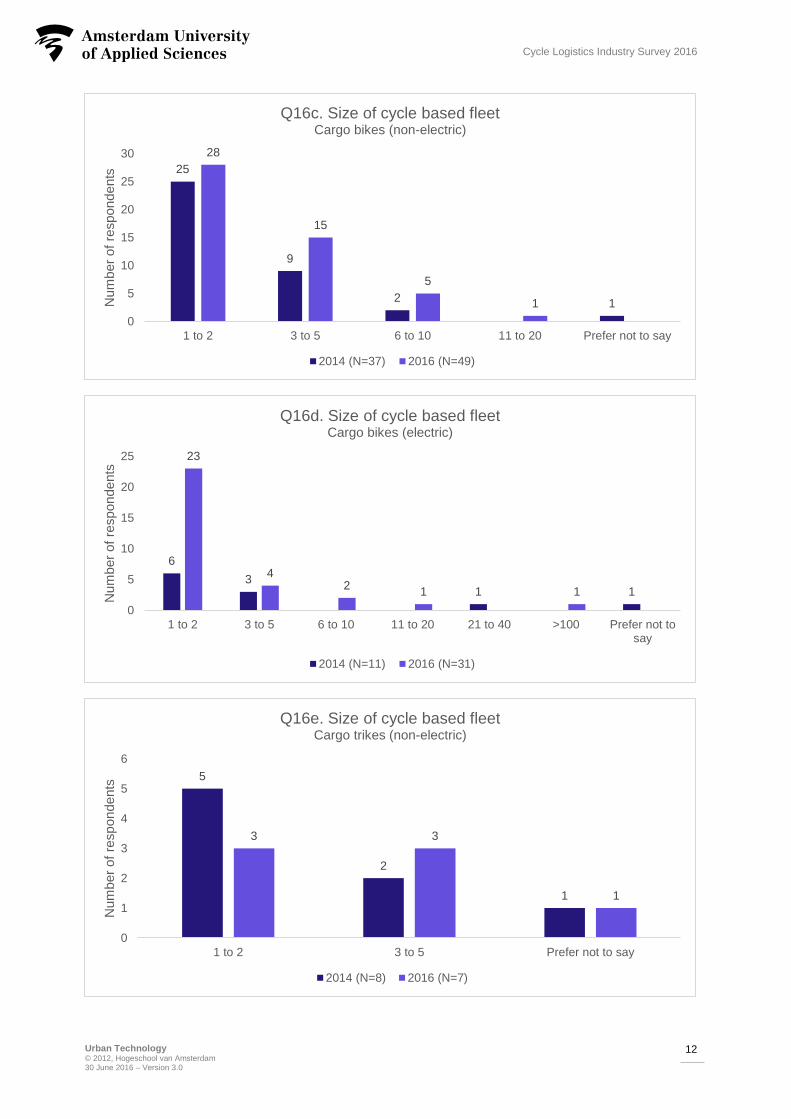
Cycle Logistics Industry Survey 2016
25
9
21
28
15
5
1
0
5
10
15
20
25
30
1 to 2 3 to 5 6 to 10 11 to 20 Prefer not to say
Num
ber
of
respondents
Q16c. Size of cycle based fleetCargo bikes (non-electric)
2014 (N=37) 2016 (N=49)
6
31 1
23
42
1 1
0
5
10
15
20
25
1 to 2 3 to 5 6 to 10 11 to 20 21 to 40 >100 Prefer not tosay
Num
ber
of
respondents
Q16d. Size of cycle based fleetCargo bikes (electric)
2014 (N=11) 2016 (N=31)
5
2
1
3 3
1
0
1
2
3
4
5
6
1 to 2 3 to 5 Prefer not to say
Num
ber
of
respondents
Q16e. Size of cycle based fleetCargo trikes (non-electric)
2014 (N=8) 2016 (N=7)
Urban Technology © 2012, Hogeschool van Amsterdam 30 June 2016 – Version 3.0
13
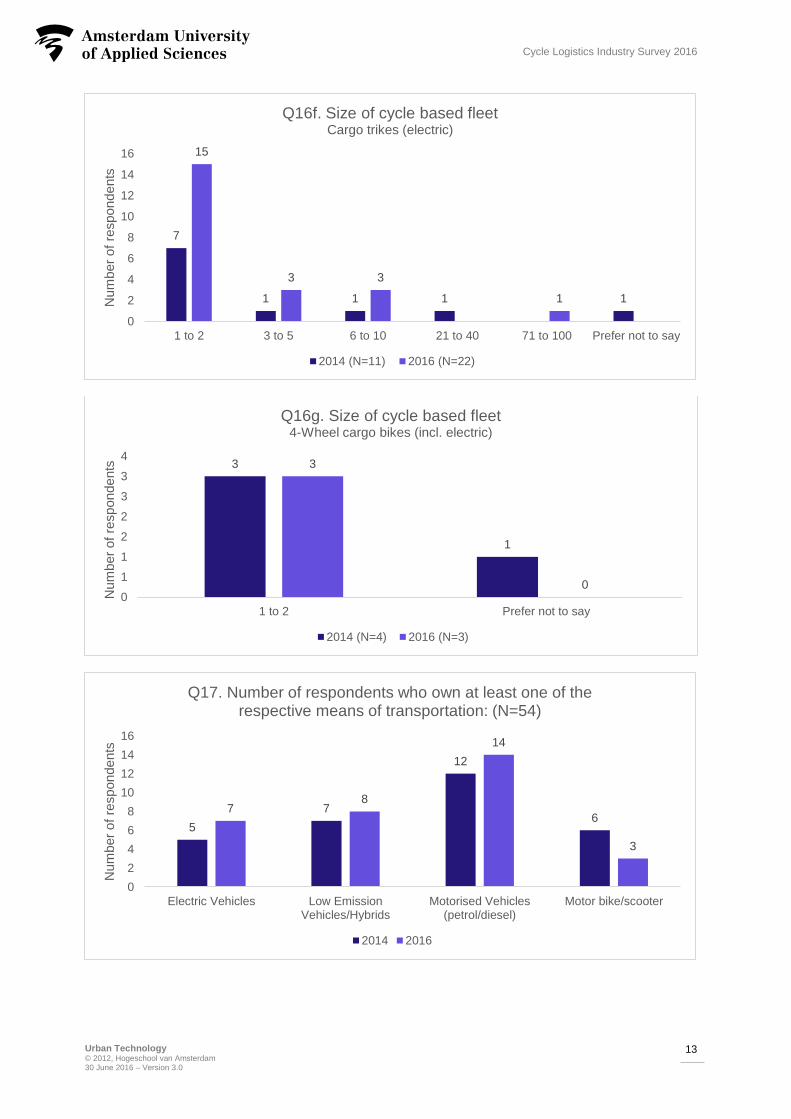
Cycle Logistics Industry Survey 2016
7
1 1 1 1
15
3 3
1
0
2
4
6
8
10
12
14
16
1 to 2 3 to 5 6 to 10 21 to 40 71 to 100 Prefer not to say
Num
ber
of
respondents
Q16f. Size of cycle based fleetCargo trikes (electric)
2014 (N=11) 2016 (N=22)
3
1
3
00
1
1
2
2
3
3
4
1 to 2 Prefer not to say
Num
ber
of
respondents
Q16g. Size of cycle based fleet4-Wheel cargo bikes (incl. electric)
2014 (N=4) 2016 (N=3)
5
7
12
67
8
14
3
0
2
4
6
8
10
12
14
16
Electric Vehicles Low EmissionVehicles/Hybrids
Motorised Vehicles(petrol/diesel)
Motor bike/scooter
Num
ber
of
respondents
Q17. Number of respondents who own at least one of the respective means of transportation: (N=54)
2014 2016
Urban Technology © 2012, Hogeschool van Amsterdam 30 June 2016 – Version 3.0
14
Cycle Logistics Industry Survey 2016
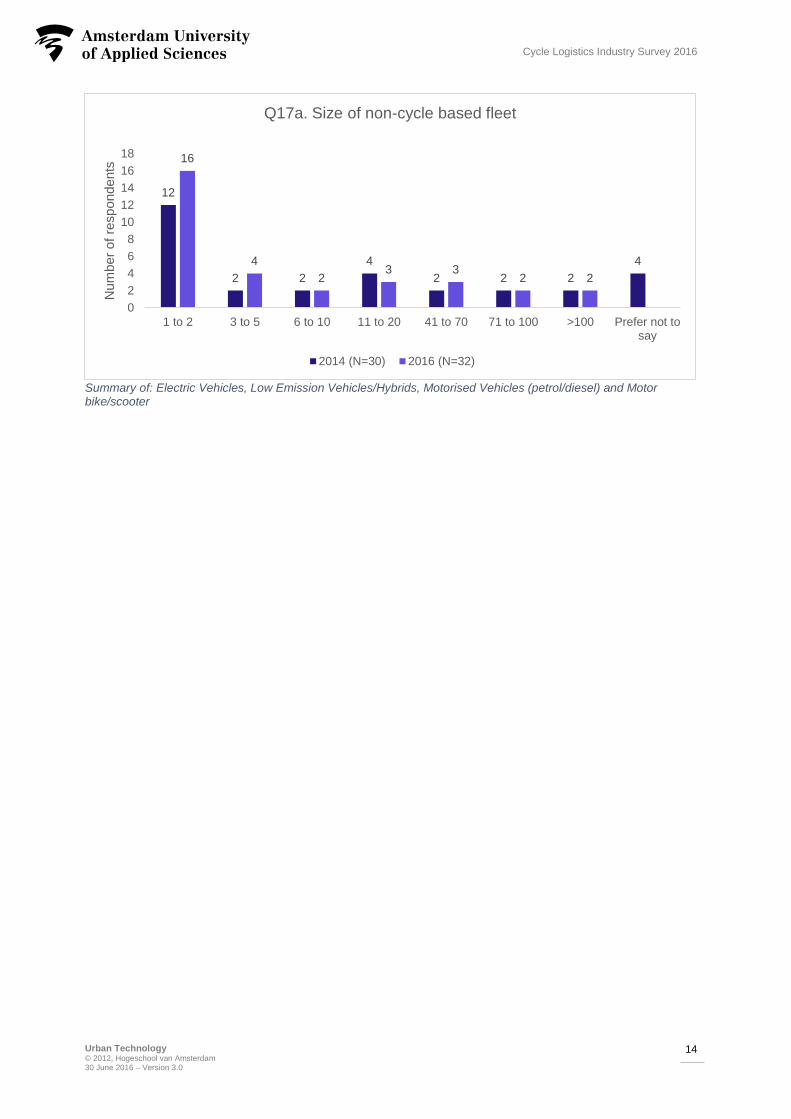
Summary of: Electric Vehicles, Low Emission Vehicles/Hybrids, Motorised Vehicles (petrol/diesel) and Motor bike/scooter
12
2 2
4
2 2 2
4
16
4
23 3
2 2
0
2
4
6
8
10
12
14
16
18
1 to 2 3 to 5 6 to 10 11 to 20 41 to 70 71 to 100 >100 Prefer not tosay
Num
ber
of
respondents
Q17a. Size of non-cycle based fleet
2014 (N=30) 2016 (N=32)
Urban Technology © 2012, Hogeschool van Amsterdam 30 June 2016 – Version 3.0
15
Cycle Logistics Industry Survey 2016
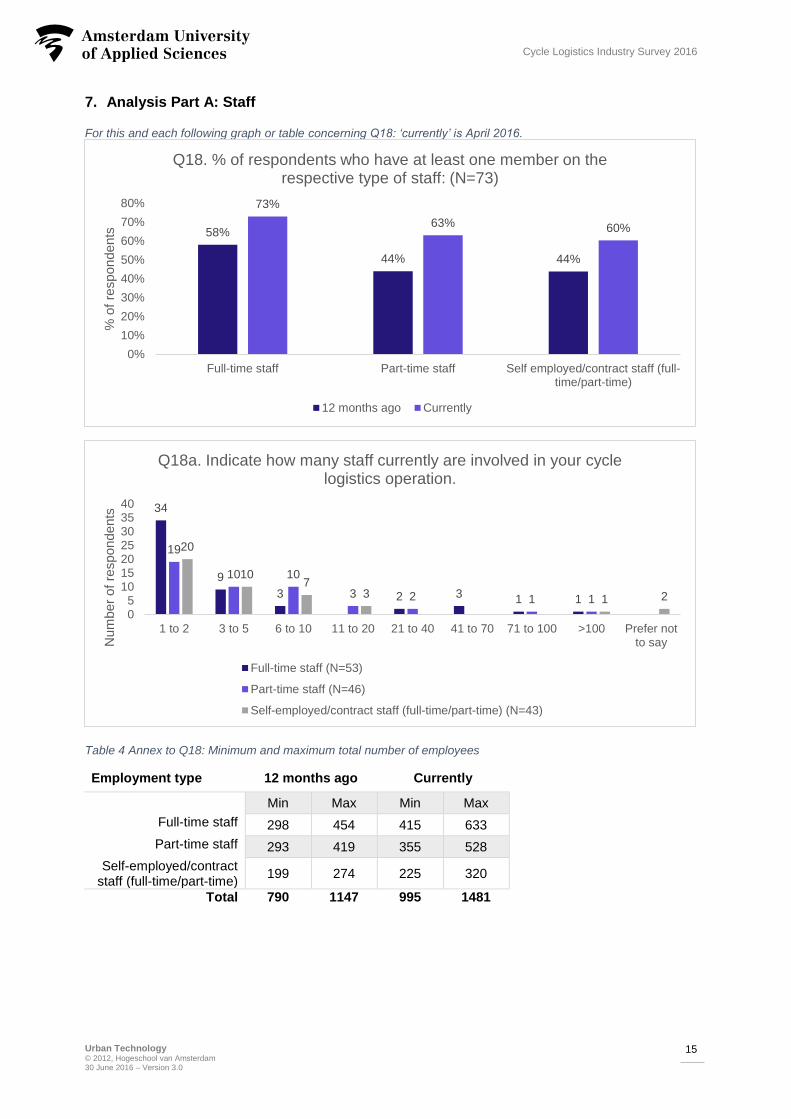
7. Analysis Part A: Staff
For this and each following graph or table concerning Q18: ‘currently’ is April 2016.
Table 4 Annex to Q18: Minimum and maximum total number of employees
Employment type 12 months ago Currently
Min Max Min Max
Full-time staff 298 454 415 633
Part-time staff 293 419 355 528
Self-employed/contract staff (full-time/part-time)
199 274 225 320
Total 790 1147 995 1481
58%
44% 44%
73%
63% 60%
0%
10%
20%
30%
40%
50%
60%
70%
80%
Full-time staff Part-time staff Self employed/contract staff (full-time/part-time)
% o
f re
spondents
Q18. % of respondents who have at least one member on the respective type of staff: (N=73)
12 months ago Currently
34
9
3 2 3 1 1
19
10 10
3 2 1 1
20
107
3 1 2
05
10152025303540
1 to 2 3 to 5 6 to 10 11 to 20 21 to 40 41 to 70 71 to 100 >100 Prefer notto sayN
um
ber
of
respondents
Q18a. Indicate how many staff currently are involved in your cycle logistics operation.
Full-time staff (N=53)
Part-time staff (N=46)
Self-employed/contract staff (full-time/part-time) (N=43)
Urban Technology © 2012, Hogeschool van Amsterdam 30 June 2016 – Version 3.0
16
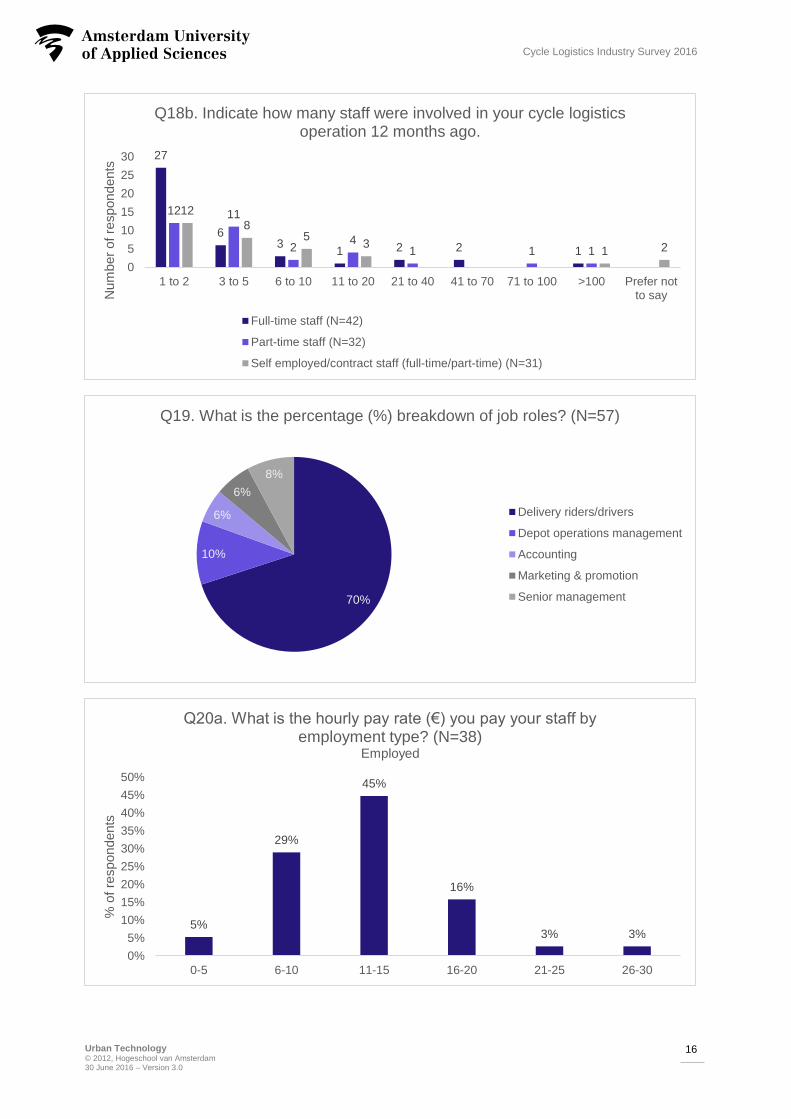
Cycle Logistics Industry Survey 2016
27
63
1 2 2 1
12 11
24
1 1 1
12
85
31 2
0
5
10
15
20
25
30
1 to 2 3 to 5 6 to 10 11 to 20 21 to 40 41 to 70 71 to 100 >100 Prefer notto sayN
um
ber
of
respondents
Q18b. Indicate how many staff were involved in your cycle logistics operation 12 months ago.
Full-time staff (N=42)
Part-time staff (N=32)
Self employed/contract staff (full-time/part-time) (N=31)
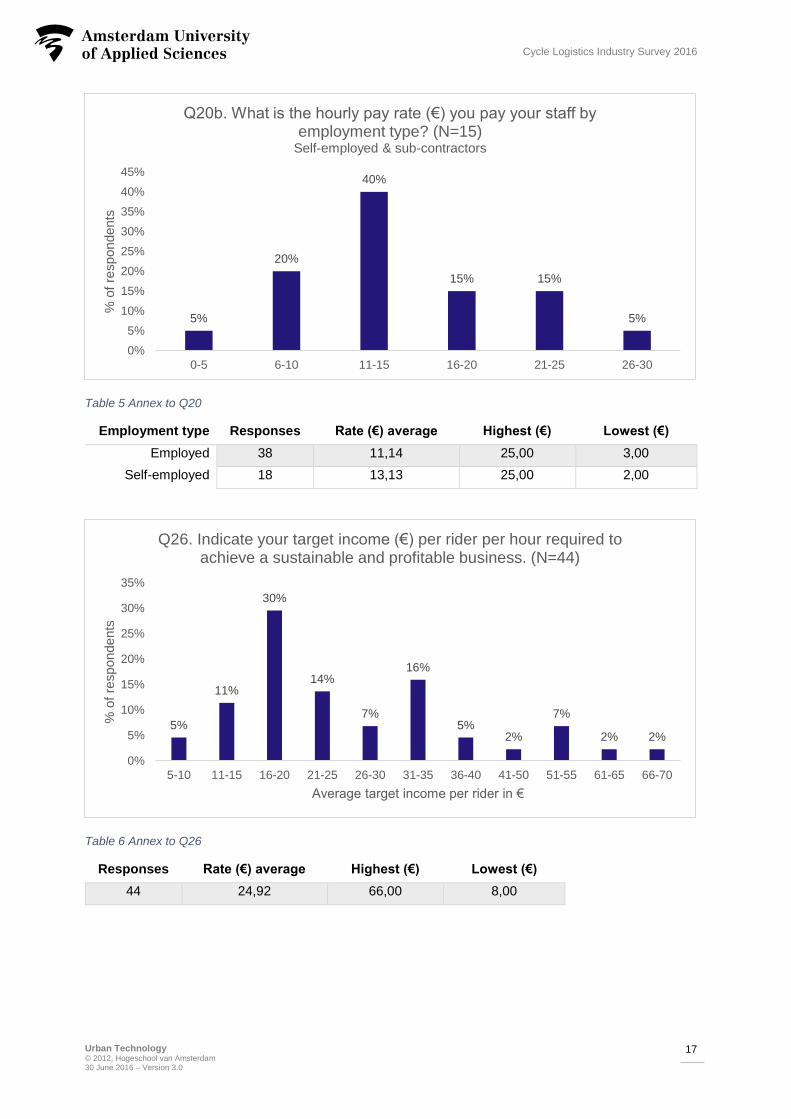
70%
10%
6%
6%
8%
Q19. What is the percentage (%) breakdown of job roles? (N=57)
Delivery riders/drivers
Depot operations management
Accounting
Marketing & promotion
Senior management
5%
29%
45%
16%
3% 3%
0%
5%
10%
15%
20%
25%
30%
35%
40%
45%
50%
0-5 6-10 11-15 16-20 21-25 26-30
% o
f re
spondents
Q20a. What is the hourly pay rate (€) you pay your staff by employment type? (N=38)
Employed
Urban Technology © 2012, Hogeschool van Amsterdam 30 June 2016 – Version 3.0
17
Cycle Logistics Industry Survey 2016
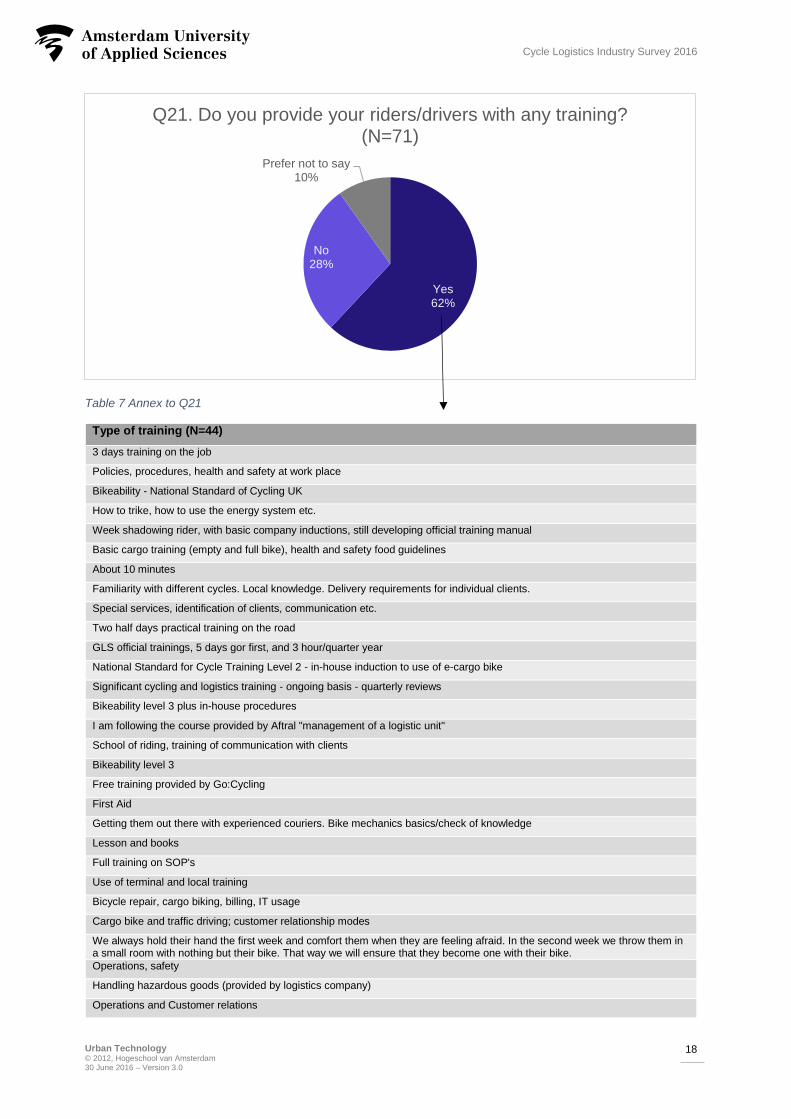
Table 5 Annex to Q20
Employment type Responses Rate (€) average Highest (€) Lowest (€)
Employed 38 11,14 25,00 3,00
Self-employed 18 13,13 25,00 2,00
Table 6 Annex to Q26
Responses Rate (€) average Highest (€) Lowest (€)
44 24,92 66,00 8,00
5%
20%
40%
15% 15%
5%
0%
5%
10%
15%
20%
25%
30%
35%
40%
45%
0-5 6-10 11-15 16-20 21-25 26-30
% o
f re
spondents
Q20b. What is the hourly pay rate (€) you pay your staff by employment type? (N=15)
Self-employed & sub-contractors
5%
11%
30%
14%
7%
16%
5%2%
7%
2% 2%
0%
5%
10%
15%
20%
25%
30%
35%
5-10 11-15 16-20 21-25 26-30 31-35 36-40 41-50 51-55 61-65 66-70
% o
f re
spondents
Average target income per rider in €
Q26. Indicate your target income (€) per rider per hour required to achieve a sustainable and profitable business. (N=44)
Urban Technology © 2012, Hogeschool van Amsterdam 30 June 2016 – Version 3.0
18
Cycle Logistics Industry Survey 2016
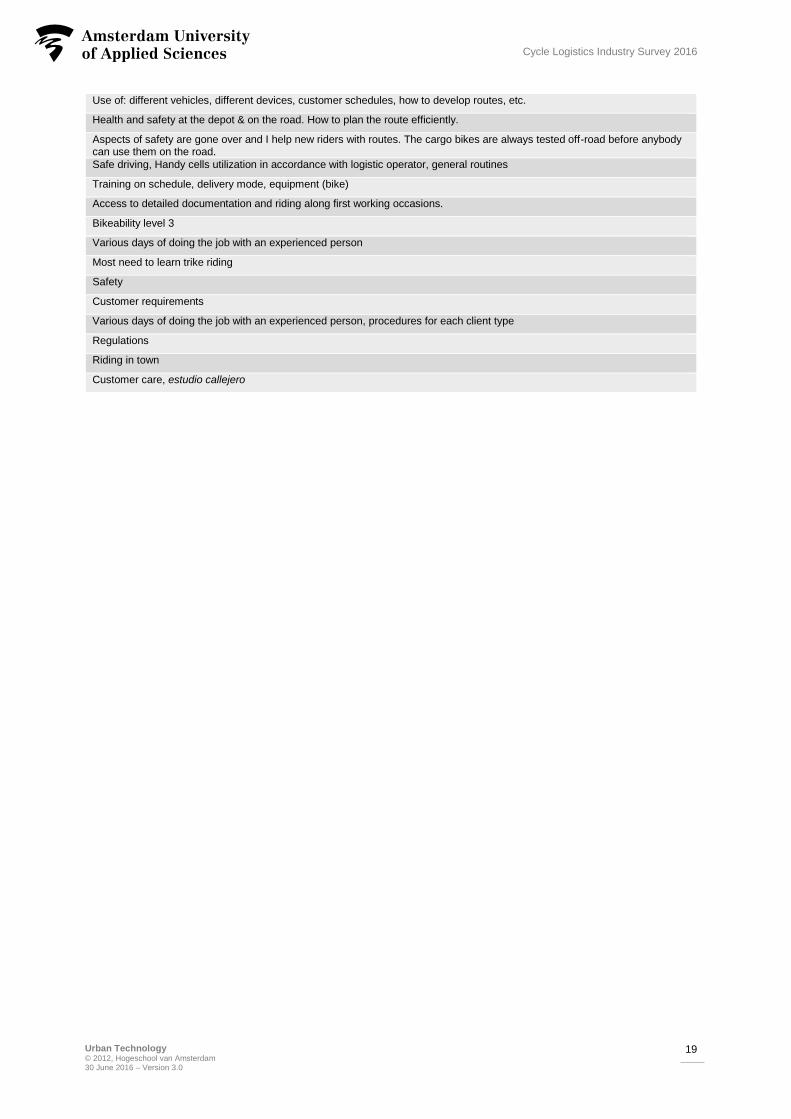
Table 7 Annex to Q21
Type of training (N=44)
3 days training on the job
Policies, procedures, health and safety at work place
Bikeability - National Standard of Cycling UK
How to trike, how to use the energy system etc.
Week shadowing rider, with basic company inductions, still developing official training manual
Basic cargo training (empty and full bike), health and safety food guidelines
About 10 minutes
Familiarity with different cycles. Local knowledge. Delivery requirements for individual clients.
Special services, identification of clients, communication etc.
Two half days practical training on the road
GLS official trainings, 5 days gor first, and 3 hour/quarter year
National Standard for Cycle Training Level 2 - in-house induction to use of e-cargo bike
Significant cycling and logistics training - ongoing basis - quarterly reviews
Bikeability level 3 plus in-house procedures
I am following the course provided by Aftral "management of a logistic unit"
School of riding, training of communication with clients
Bikeability level 3
Free training provided by Go:Cycling
First Aid
Getting them out there with experienced couriers. Bike mechanics basics/check of knowledge
Lesson and books
Full training on SOP's
Use of terminal and local training
Bicycle repair, cargo biking, billing, IT usage
Cargo bike and traffic driving; customer relationship modes
We always hold their hand the first week and comfort them when they are feeling afraid. In the second week we throw them in a small room with nothing but their bike. That way we will ensure that they become one with their bike.
Operations, safety
Handling hazardous goods (provided by logistics company)
Operations and Customer relations
Yes62%
No28%
Prefer not to say10%
Q21. Do you provide your riders/drivers with any training? (N=71)
Urban Technology © 2012, Hogeschool van Amsterdam 30 June 2016 – Version 3.0
19
Cycle Logistics Industry Survey 2016
Use of: different vehicles, different devices, customer schedules, how to develop routes, etc.
Health and safety at the depot & on the road. How to plan the route efficiently.
Aspects of safety are gone over and I help new riders with routes. The cargo bikes are always tested off-road before anybody can use them on the road.
Safe driving, Handy cells utilization in accordance with logistic operator, general routines
Training on schedule, delivery mode, equipment (bike)
Access to detailed documentation and riding along first working occasions.
Bikeability level 3
Various days of doing the job with an experienced person
Most need to learn trike riding
Safety
Customer requirements
Various days of doing the job with an experienced person, procedures for each client type
Regulations
Riding in town
Customer care, estudio callejero
Urban Technology © 2012, Hogeschool van Amsterdam 30 June 2016 – Version 3.0
20
Cycle Logistics Industry Survey 2016
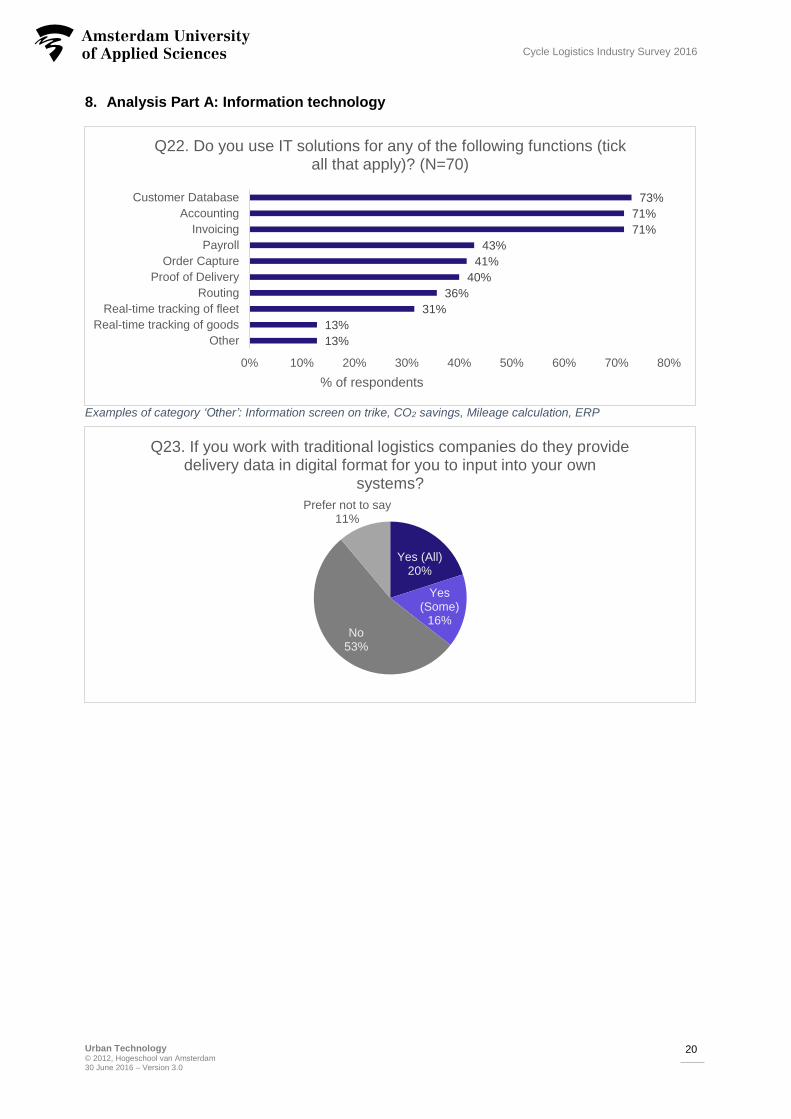
8. Analysis Part A: Information technology
Examples of category ‘Other’: Information screen on trike, CO2 savings, Mileage calculation, ERP 1
13%
13%
31%
36%
40%
41%
43%
71%
71%
73%
0% 10% 20% 30% 40% 50% 60% 70% 80%
Other
Real-time tracking of goods
Real-time tracking of fleet
Routing
Proof of Delivery
Order Capture
Payroll
Invoicing
Accounting
Customer Database
% of respondents
Q22. Do you use IT solutions for any of the following functions (tick all that apply)? (N=70)
Yes (All)20%
Yes (Some)
16%No
53%
Prefer not to say11%
Q23. If you work with traditional logistics companies do they provide delivery data in digital format for you to input into your own
systems?
Urban Technology © 2012, Hogeschool van Amsterdam 30 June 2016 – Version 3.0
21
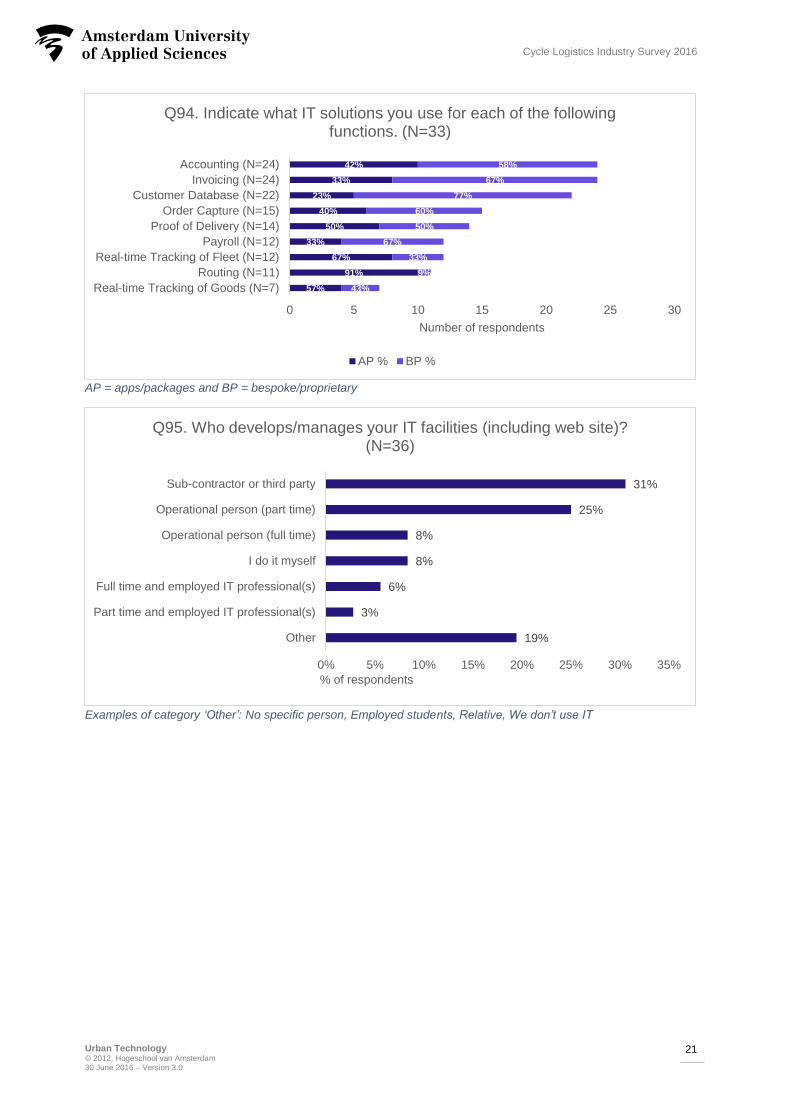
Cycle Logistics Industry Survey 2016
AP = apps/packages and BP = bespoke/proprietary
57%
91%
67%
33%
50%
40%
23%
33%
42%
43%
9%
33%
67%
50%
60%
77%
67%
58%
0 5 10 15 20 25 30
Real-time Tracking of Goods (N=7)
Routing (N=11)
Real-time Tracking of Fleet (N=12)
Payroll (N=12)
Proof of Delivery (N=14)
Order Capture (N=15)
Customer Database (N=22)
Invoicing (N=24)
Accounting (N=24)
Number of respondents
Q94. Indicate what IT solutions you use for each of the following functions. (N=33)
AP % BP %
19%
3%
6%
8%
8%
25%
31%
0% 5% 10% 15% 20% 25% 30% 35%
Other
Part time and employed IT professional(s)
Full time and employed IT professional(s)
I do it myself
Operational person (full time)
Operational person (part time)
Sub-contractor or third party
% of respondents
Q95. Who develops/manages your IT facilities (including web site)? (N=36)
Examples of category ‘Other’: No specific person, Employed students, Relative, We don’t use IT
Urban Technology © 2012, Hogeschool van Amsterdam 30 June 2016 – Version 3.0
22
Cycle Logistics Industry Survey 2016
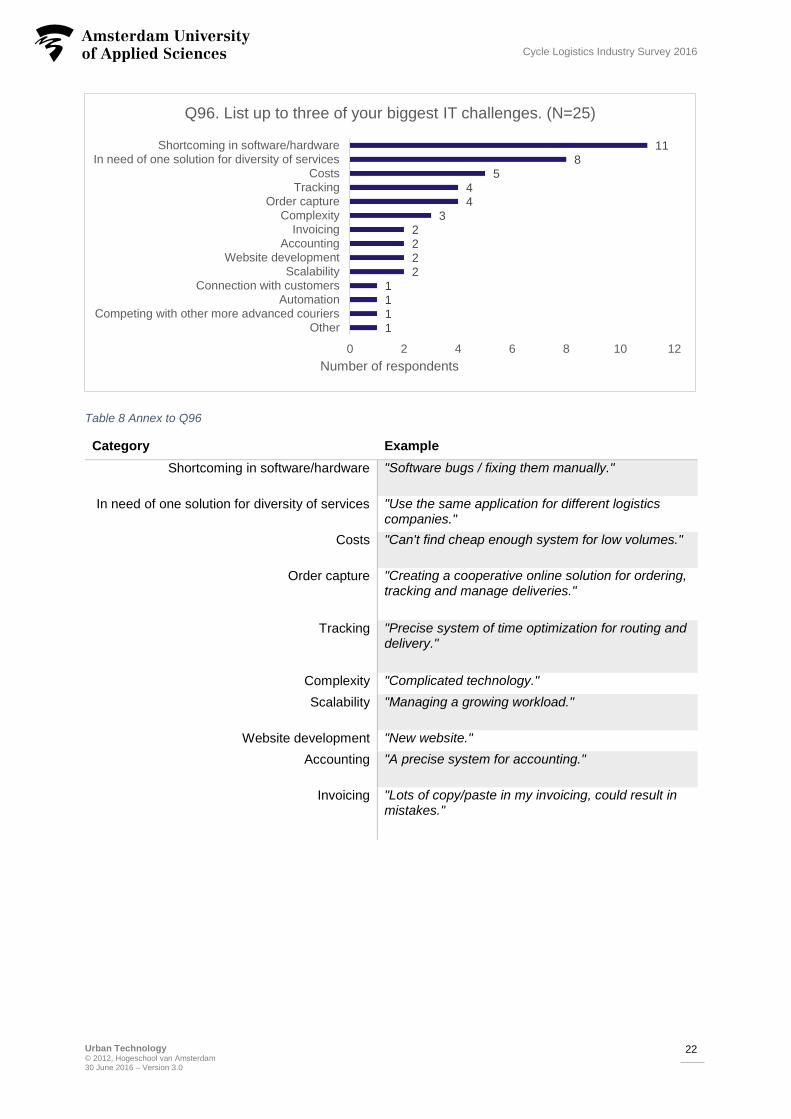
Table 8 Annex to Q96
Category Example
Shortcoming in software/hardware "Software bugs / fixing them manually."
In need of one solution for diversity of services "Use the same application for different logistics companies."
Costs "Can't find cheap enough system for low volumes."
Order capture "Creating a cooperative online solution for ordering, tracking and manage deliveries."
Tracking "Precise system of time optimization for routing and delivery."
Complexity "Complicated technology."
Scalability "Managing a growing workload."
Website development "New website."
Accounting "A precise system for accounting."
Invoicing "Lots of copy/paste in my invoicing, could result in mistakes."
1
111
22
22
3
44
58
11
0 2 4 6 8 10 12
OtherCompeting with other more advanced couriers
AutomationConnection with customers
ScalabilityWebsite development
Accounting
InvoicingComplexity
Order captureTracking
Costs
In need of one solution for diversity of servicesShortcoming in software/hardware
Number of respondents
Q96. List up to three of your biggest IT challenges. (N=25)
Urban Technology © 2012, Hogeschool van Amsterdam 30 June 2016 – Version 3.0
23
Cycle Logistics Industry Survey 2016
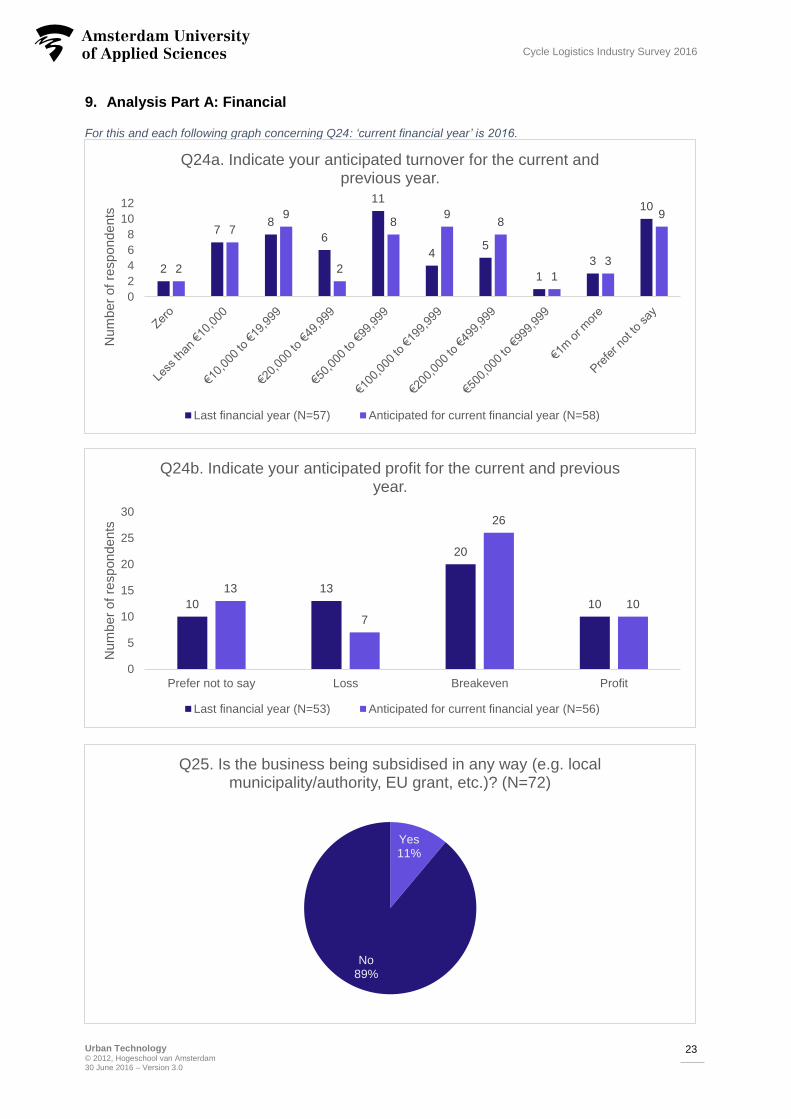
9. Analysis Part A: Financial
For this and each following graph concerning Q24: ‘current financial year’ is 2016.
2
78
6
11
45
1
3
10
2
7
9
2
89
8
1
3
9
0
2
4
6
8
10
12
Num
ber
of
respondents
Q24a. Indicate your anticipated turnover for the current and previous year.
Last financial year (N=57) Anticipated for current financial year (N=58)
10
13
20
10
13
7
26
10
0
5
10
15
20
25
30
Prefer not to say Loss Breakeven Profit
Num
ber
of
respondents
Q24b. Indicate your anticipated profit for the current and previous year.
Last financial year (N=53) Anticipated for current financial year (N=56)
Yes11%
No89%
Q25. Is the business being subsidised in any way (e.g. local municipality/authority, EU grant, etc.)? (N=72)
Urban Technology © 2012, Hogeschool van Amsterdam 30 June 2016 – Version 3.0
24
Cycle Logistics Industry Survey 2016
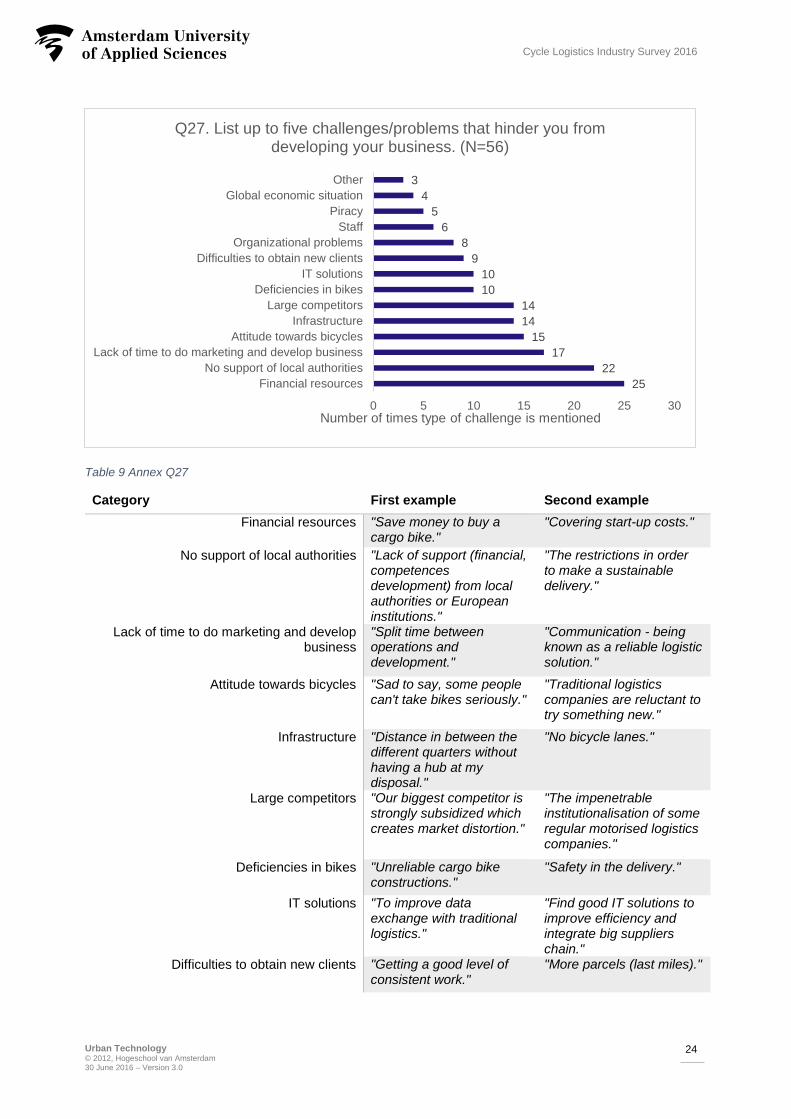
Table 9 Annex Q27
Category First example Second example
Financial resources "Save money to buy a cargo bike."
"Covering start-up costs."
No support of local authorities "Lack of support (financial, competences development) from local authorities or European institutions."
"The restrictions in order to make a sustainable delivery."
Lack of time to do marketing and develop business
"Split time between operations and development."
"Communication - being known as a reliable logistic solution."
Attitude towards bicycles "Sad to say, some people can't take bikes seriously."
"Traditional logistics companies are reluctant to try something new."
Infrastructure "Distance in between the different quarters without having a hub at my disposal."
"No bicycle lanes."
Large competitors "Our biggest competitor is strongly subsidized which creates market distortion."
"The impenetrable institutionalisation of some regular motorised logistics companies."
Deficiencies in bikes "Unreliable cargo bike constructions."
"Safety in the delivery."
IT solutions "To improve data exchange with traditional logistics."
"Find good IT solutions to improve efficiency and integrate big suppliers chain."
Difficulties to obtain new clients "Getting a good level of consistent work."
"More parcels (last miles)."
25
22
17
15
14
14
10
10
9
8
6
5
4
3
0 5 10 15 20 25 30
Financial resources
No support of local authorities
Lack of time to do marketing and develop business
Attitude towards bicycles
Infrastructure
Large competitors
Deficiencies in bikes
IT solutions
Difficulties to obtain new clients
Organizational problems
Staff
Piracy
Global economic situation
Other
Number of times type of challenge is mentioned
Q27. List up to five challenges/problems that hinder you from developing your business. (N=56)
Urban Technology © 2012, Hogeschool van Amsterdam 30 June 2016 – Version 3.0
25
Cycle Logistics Industry Survey 2016
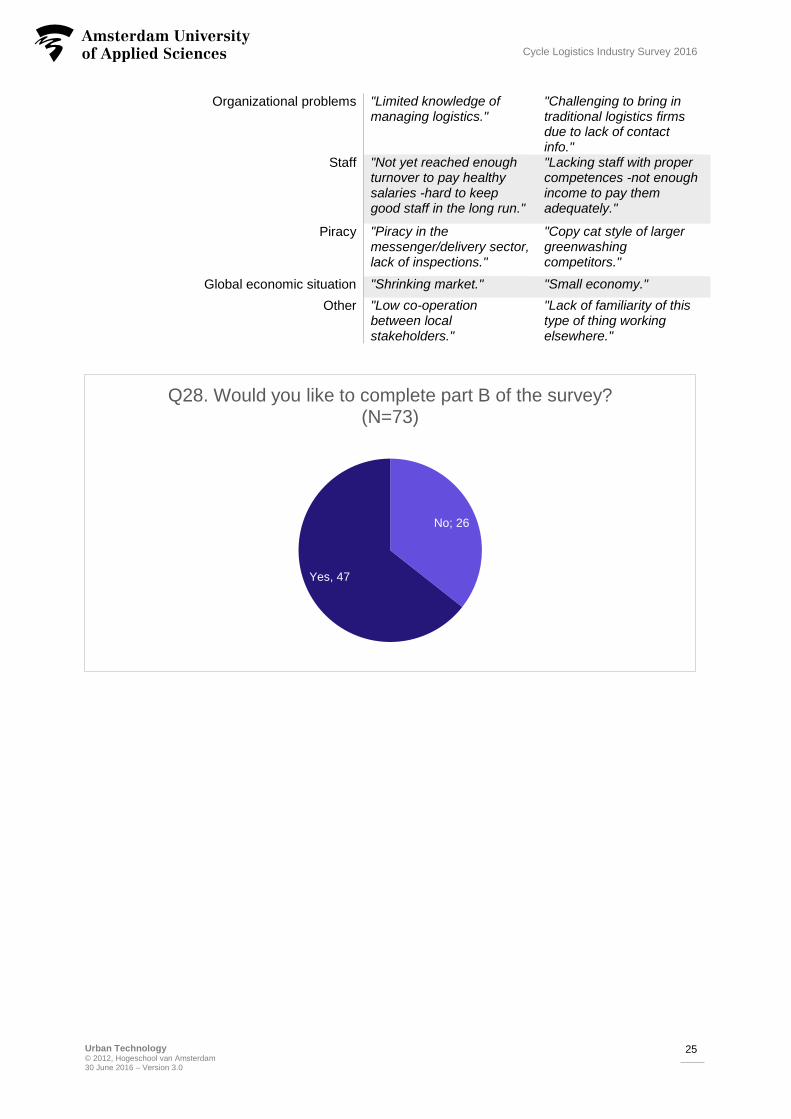
Organizational problems "Limited knowledge of managing logistics."
"Challenging to bring in traditional logistics firms due to lack of contact info."
Staff "Not yet reached enough turnover to pay healthy salaries -hard to keep good staff in the long run."
"Lacking staff with proper competences -not enough income to pay them adequately."
Piracy "Piracy in the messenger/delivery sector, lack of inspections."
"Copy cat style of larger greenwashing competitors."
Global economic situation "Shrinking market." "Small economy."
Other "Low co-operation between local stakeholders."
"Lack of familiarity of this type of thing working elsewhere."
No; 26
Yes, 47
Q28. Would you like to complete part B of the survey? (N=73)
Urban Technology © 2012, Hogeschool van Amsterdam 30 June 2016 – Version 3.0
26
Cycle Logistics Industry Survey 2016
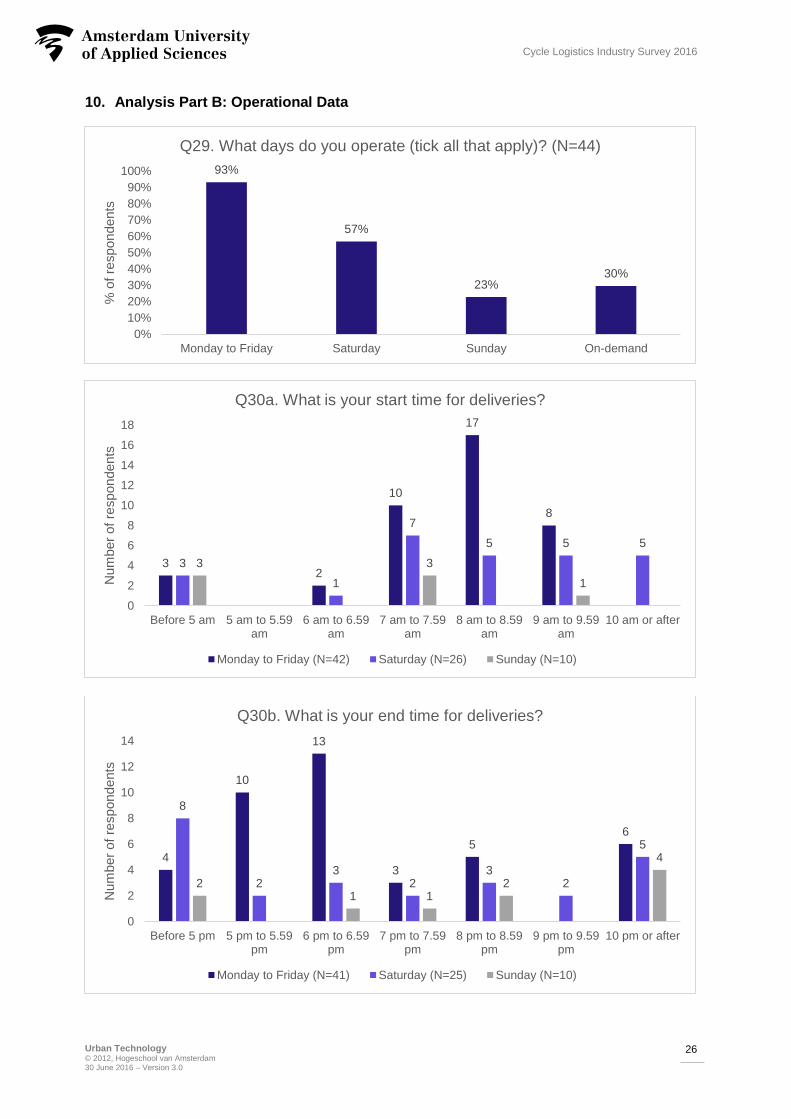
10. Analysis Part B: Operational Data
93%
57%
23%30%
0%
10%
20%
30%
40%
50%
60%
70%
80%
90%
100%
Monday to Friday Saturday Sunday On-demand
% o
f re
spondents
Q29. What days do you operate (tick all that apply)? (N=44)
32
10
17
8
3
1
7
5 5 5
3 3
1
0
2
4
6
8
10
12
14
16
18
Before 5 am 5 am to 5.59am
6 am to 6.59am
7 am to 7.59am
8 am to 8.59am
9 am to 9.59am
10 am or after
Num
ber
of
respondents
Q30a. What is your start time for deliveries?
Monday to Friday (N=42) Saturday (N=26) Sunday (N=10)
4
10
13
3
56
8
23
23
2
5
21 1
2
4
0
2
4
6
8
10
12
14
Before 5 pm 5 pm to 5.59pm
6 pm to 6.59pm
7 pm to 7.59pm
8 pm to 8.59pm
9 pm to 9.59pm
10 pm or after
Num
ber
of
respondents
Q30b. What is your end time for deliveries?
Monday to Friday (N=41) Saturday (N=25) Sunday (N=10)
Urban Technology © 2012, Hogeschool van Amsterdam 30 June 2016 – Version 3.0
27
Cycle Logistics Industry Survey 2016
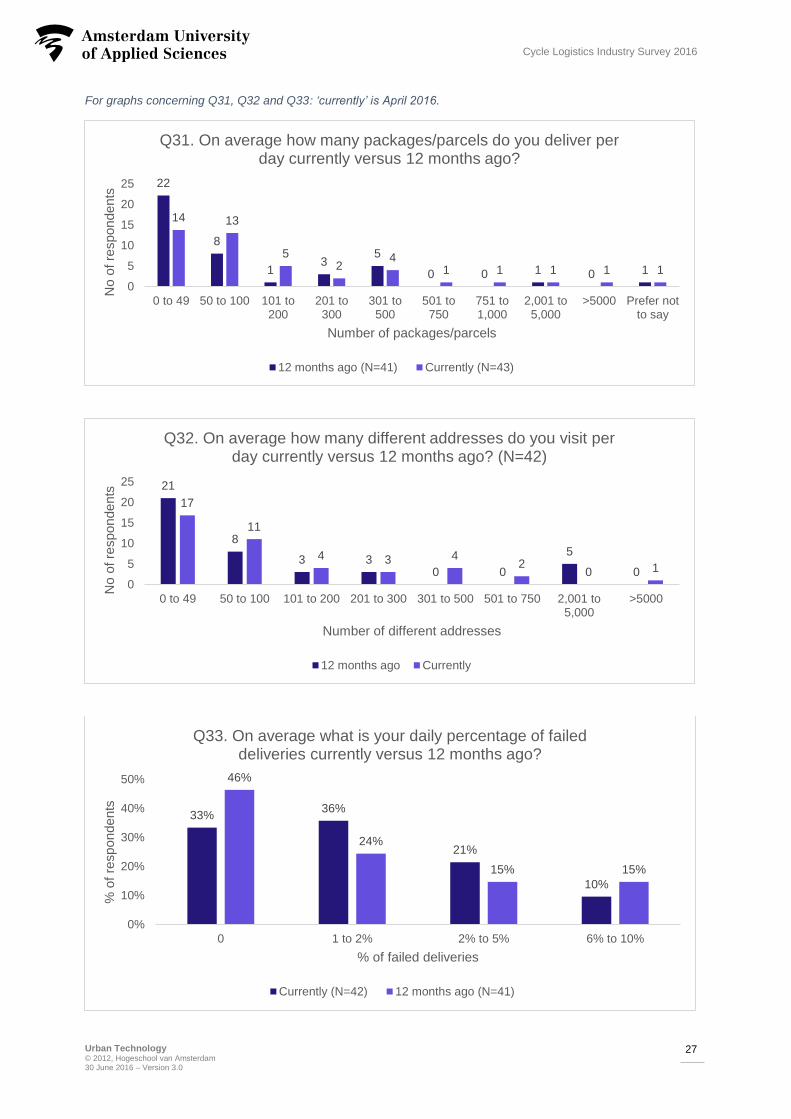
For graphs concerning Q31, Q32 and Q33: ‘currently’ is April 2016.
22
8
13
5
0 0 1 0 1
14 13
52
41 1 1 1 1
0
5
10
15
20
25
0 to 49 50 to 100 101 to200
201 to300
301 to500
501 to750
751 to1,000
2,001 to5,000
>5000 Prefer notto say
No o
f re
spondents
Number of packages/parcels
Q31. On average how many packages/parcels do you deliver per day currently versus 12 months ago?
12 months ago (N=41) Currently (N=43)
21
8
3 30 0
5
0
17
11
4 3 42
0 1
0
5
10
15
20
25
0 to 49 50 to 100 101 to 200 201 to 300 301 to 500 501 to 750 2,001 to5,000
>5000
No o
f re
spondents
Number of different addresses
Q32. On average how many different addresses do you visit per day currently versus 12 months ago? (N=42)
12 months ago Currently
33%36%
21%
10%
46%
24%
15% 15%
0%
10%
20%
30%
40%
50%
0 1 to 2% 2% to 5% 6% to 10%
% o
f re
spondents
% of failed deliveries
Q33. On average what is your daily percentage of failed deliveries currently versus 12 months ago?
Currently (N=42) 12 months ago (N=41)
Urban Technology © 2012, Hogeschool van Amsterdam 30 June 2016 – Version 3.0
28
Cycle Logistics Industry Survey 2016
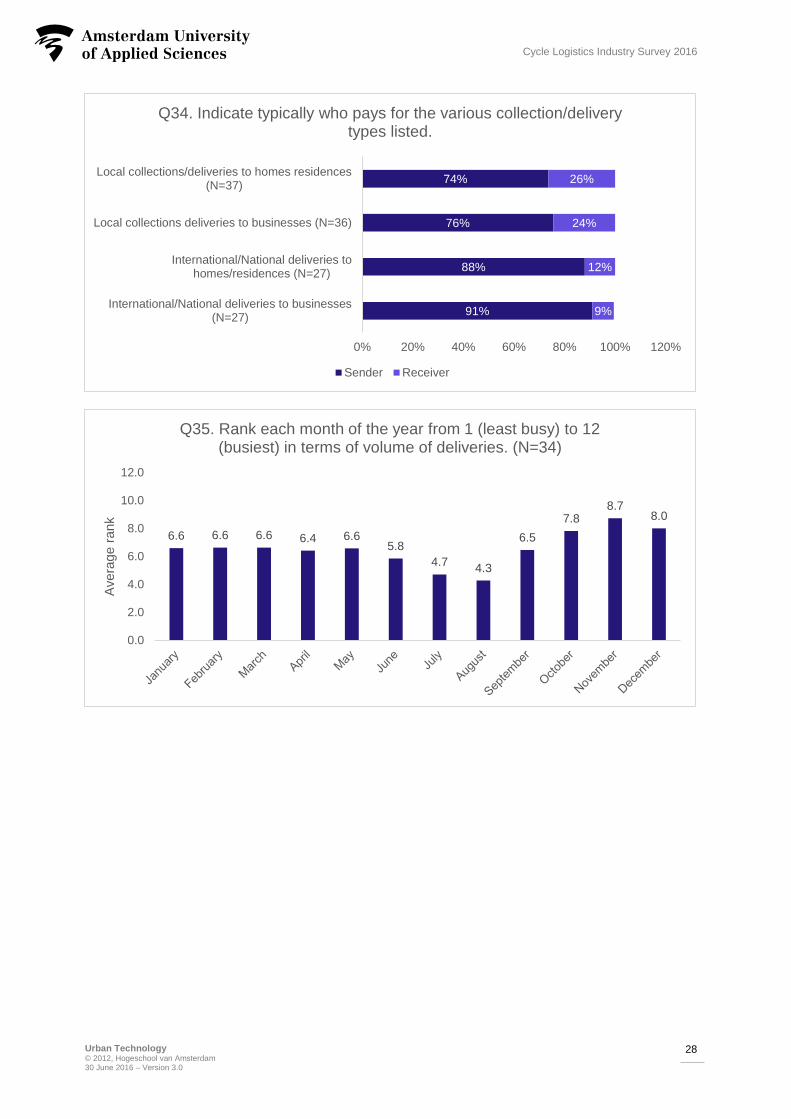
91%
88%
76%
74%
9%
12%
24%
26%
0% 20% 40% 60% 80% 100% 120%
International/National deliveries to businesses(N=27)
International/National deliveries tohomes/residences (N=27)
Local collections deliveries to businesses (N=36)
Local collections/deliveries to homes residences(N=37)
Q34. Indicate typically who pays for the various collection/delivery types listed.
Sender Receiver
6.6 6.6 6.6 6.4 6.65.8
4.74.3
6.5
7.88.7
8.0
0.0
2.0
4.0
6.0
8.0
10.0
12.0
Avera
ge r
ank
Q35. Rank each month of the year from 1 (least busy) to 12 (busiest) in terms of volume of deliveries. (N=34)
Urban Technology © 2012, Hogeschool van Amsterdam 30 June 2016 – Version 3.0
29
Cycle Logistics Industry Survey 2016
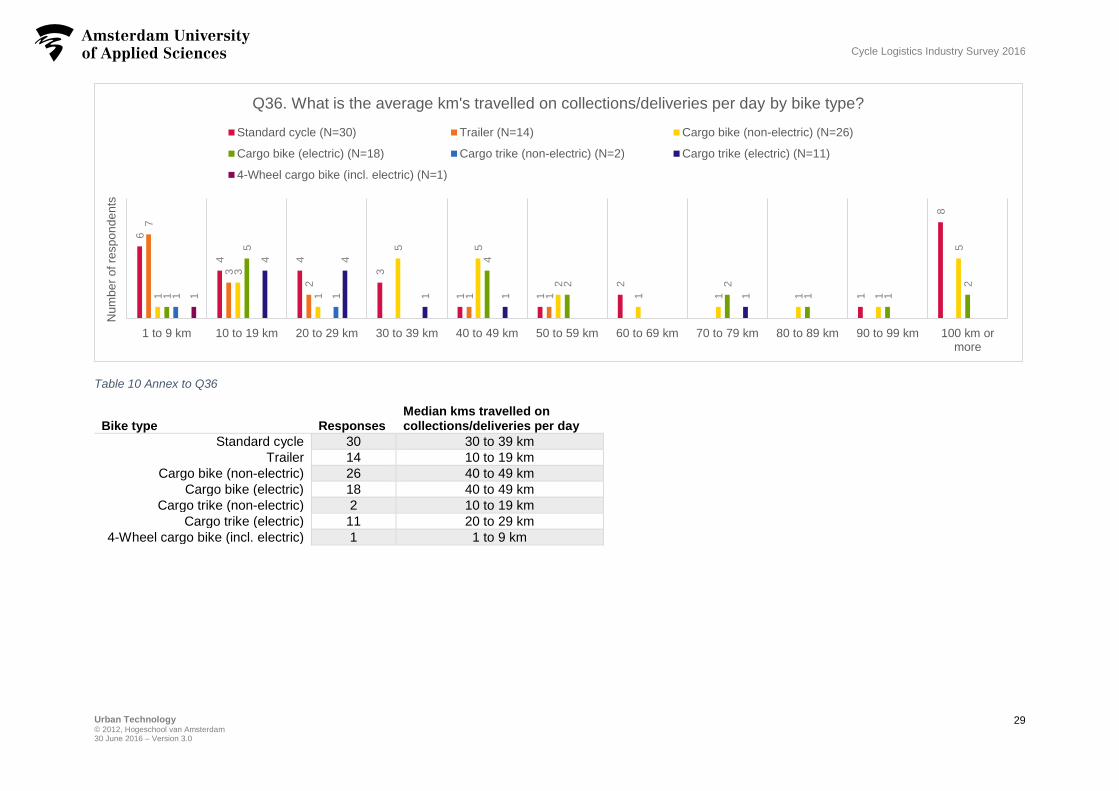
Table 10 Annex to Q36
Bike type
Responses
Median kms travelled on collections/deliveries per day
Standard cycle 30 30 to 39 km
Trailer 14 10 to 19 km
Cargo bike (non-electric) 26 40 to 49 km
Cargo bike (electric) 18 40 to 49 km
Cargo trike (non-electric) 2 10 to 19 km
Cargo trike (electric) 11 20 to 29 km
4-Wheel cargo bike (incl. electric) 1 1 to 9 km
6
4 4
3
1 1
2
1
8
7
3
2
1 11
3
1
5 5
2
1 1 1 1
5
1
5
4
2 2
1 1
2
1 1
4 4
1 1 11
1 to 9 km 10 to 19 km 20 to 29 km 30 to 39 km 40 to 49 km 50 to 59 km 60 to 69 km 70 to 79 km 80 to 89 km 90 to 99 km 100 km ormore
Num
be
r o
f re
sp
on
de
nts
Q36. What is the average km's travelled on collections/deliveries per day by bike type?
Standard cycle (N=30) Trailer (N=14) Cargo bike (non-electric) (N=26)
Cargo bike (electric) (N=18) Cargo trike (non-electric) (N=2) Cargo trike (electric) (N=11)
4-Wheel cargo bike (incl. electric) (N=1)
Urban Technology © 2012, Hogeschool van Amsterdam 30 June 2016 – Version 3.0
30
Cycle Logistics Industry Survey 2016
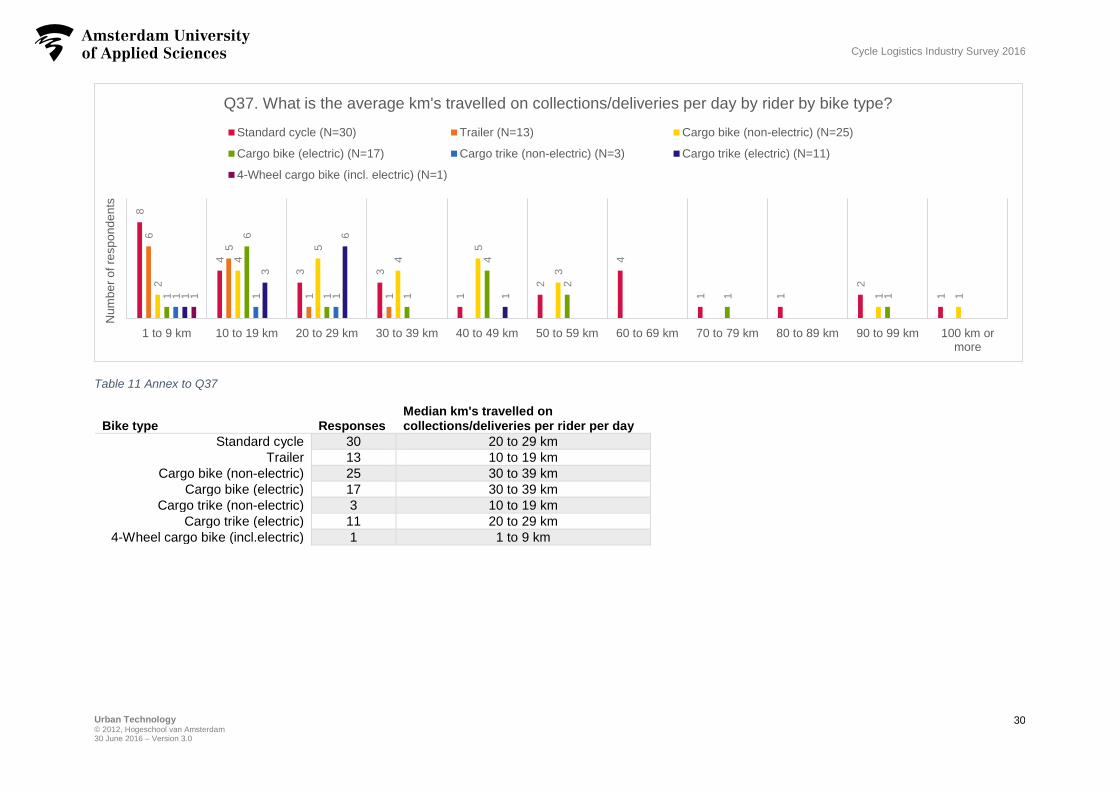
Table 11 Annex to Q37
Bike type
Responses
Median km's travelled on collections/deliveries per rider per day
Standard cycle 30 20 to 29 km
Trailer 13 10 to 19 km
Cargo bike (non-electric) 25 30 to 39 km
Cargo bike (electric) 17 30 to 39 km
Cargo trike (non-electric) 3 10 to 19 km
Cargo trike (electric) 11 20 to 29 km
4-Wheel cargo bike (incl.electric) 1 1 to 9 km
8
4
3 3
1
2
4
1 1
2
1
6
5
1 1
2
4
5
4
5
3
1 11
6
1 1
4
2
1 11 1 11
3
6
11
1 to 9 km 10 to 19 km 20 to 29 km 30 to 39 km 40 to 49 km 50 to 59 km 60 to 69 km 70 to 79 km 80 to 89 km 90 to 99 km 100 km ormore
Num
be
r o
f re
sp
on
de
nts
Q37. What is the average km's travelled on collections/deliveries per day by rider by bike type?
Standard cycle (N=30) Trailer (N=13) Cargo bike (non-electric) (N=25)
Cargo bike (electric) (N=17) Cargo trike (non-electric) (N=3) Cargo trike (electric) (N=11)
4-Wheel cargo bike (incl. electric) (N=1)
Urban Technology © 2012, Hogeschool van Amsterdam 30 June 2016 – Version 3.0
31
Cycle Logistics Industry Survey 2016
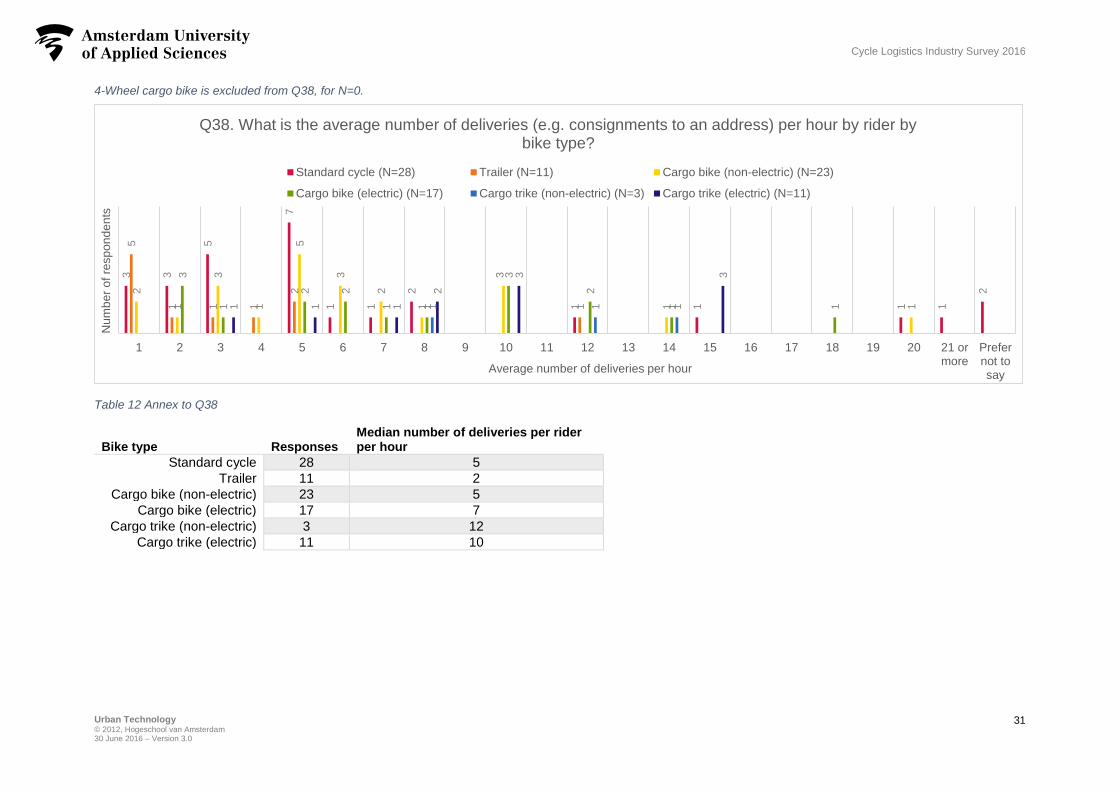
4-Wheel cargo bike is excluded from Q38, for N=0. 1
Table 12 Annex to Q38
Bike type
Responses
Median number of deliveries per rider per hour
Standard cycle 28 5
Trailer 11 2
Cargo bike (non-electric) 23 5
Cargo bike (electric) 17 7
Cargo trike (non-electric) 3 12
Cargo trike (electric) 11 10
3 3
5
7
1 1
2
1 1 1 1
2
5
1 1 1
2
1
2
1
3
1
5
3
2
1
3
1 1
3
1
2 2
1 1
3
2
1 11 1 11 1 1
2
3 3
1 2 3 4 5 6 7 8 9 10 11 12 13 14 15 16 17 18 19 20 21 ormore
Prefernot tosay
Num
be
r o
f re
sp
on
de
nts
Average number of deliveries per hour
Q38. What is the average number of deliveries (e.g. consignments to an address) per hour by rider by bike type?
Standard cycle (N=28) Trailer (N=11) Cargo bike (non-electric) (N=23)
Cargo bike (electric) (N=17) Cargo trike (non-electric) (N=3) Cargo trike (electric) (N=11)
Urban Technology © 2012, Hogeschool van Amsterdam 30 June 2016 – Version 3.0
32
Cycle Logistics Industry Survey 2016
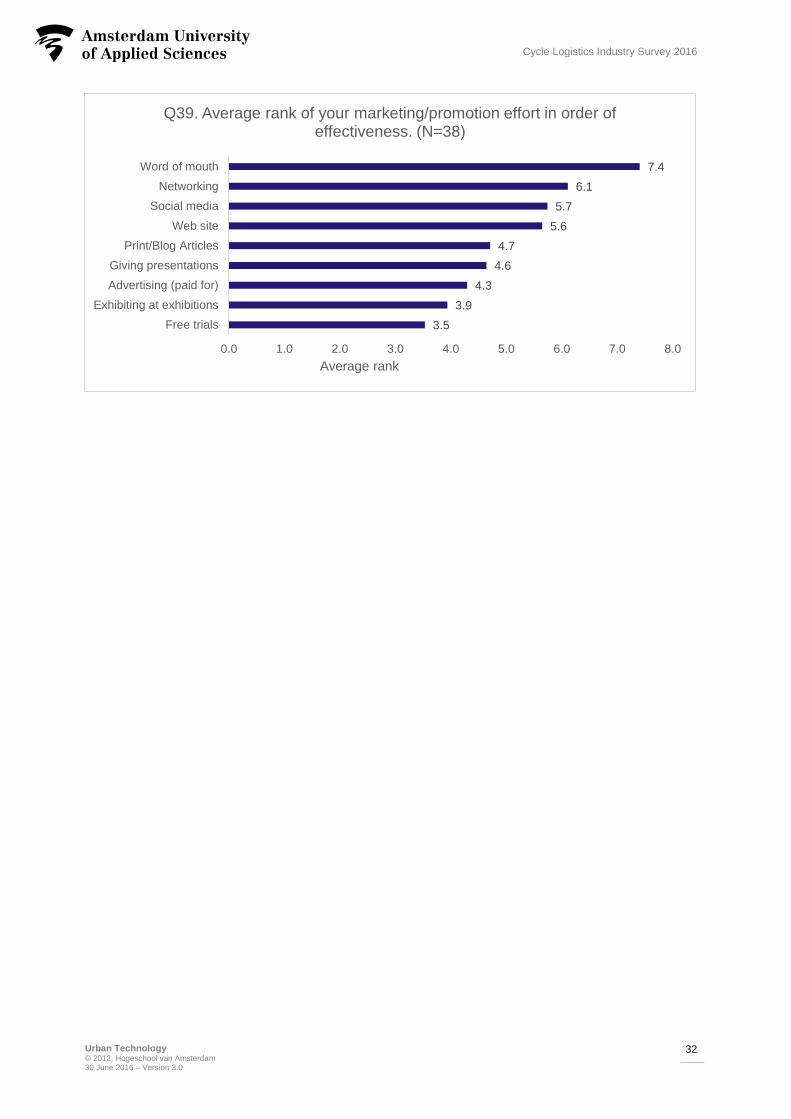
3.5
3.9
4.3
4.6
4.7
5.6
5.7
6.1
7.4
0.0 1.0 2.0 3.0 4.0 5.0 6.0 7.0 8.0
Free trials
Exhibiting at exhibitions
Advertising (paid for)
Giving presentations
Print/Blog Articles
Web site
Social media
Networking
Word of mouth
Average rank
Q39. Average rank of your marketing/promotion effort in order of effectiveness. (N=38)
Related Documents