Mapping Irrigation Potential from Renewable Groundwater in Africa: A Quantitative Hydrological Approach Yvan Altchenko & Karen G. Villholth Photo by Steve McCurrach / IWMI

Mapping Irrigation Potential from Renewable Groundwater in Africa: A Quantitative Hydrological Approach
Jul 31, 2015
Welcome message from author
This document is posted to help you gain knowledge. Please leave a comment to let me know what you think about it! Share it to your friends and learn new things together.
Transcript
Mapping Irrigation Potential from Renewable Groundwater in Africa: A Quantitative Hydrological Approach
Yvan Altchenko & Karen G. Villholth
Phot
o by
Ste
ve M
cCur
rach
/ IW
MI
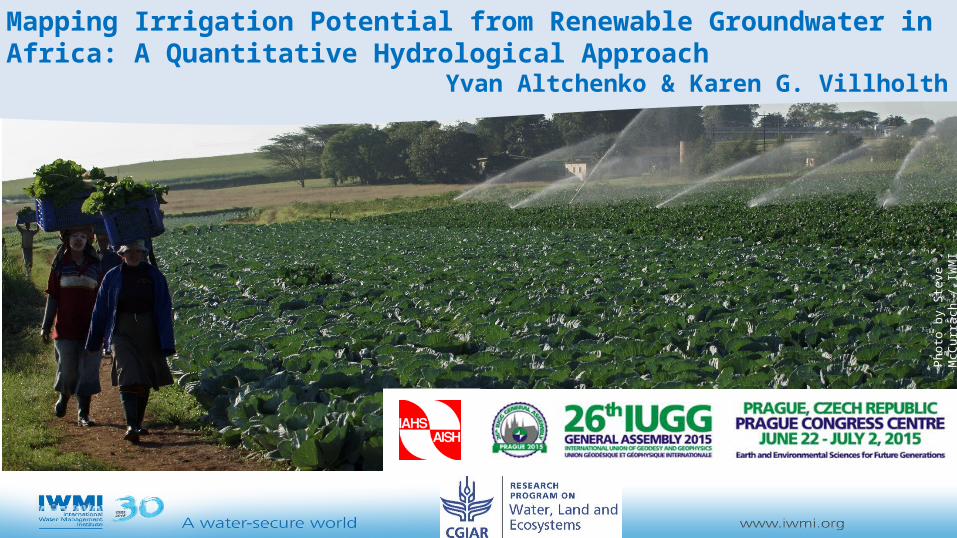
o Background Huge GW volumes in Africa (MacDonald et al, 2012) but not all
available for abstraction, and unevenly distributed
1 % of cultivated land is equipped for irrigation with GW while it is 14% in Asia, which has similar climate (Siebert et al., 2010)
Only approx. 2 mill. ha irrigated with GW presently
Groundwater provides an important buffer to climate variability and change
o Questions Where is the GW irrigation potential (GWIP) in Africa? How much cropland can GW irrigate?
o Objective To estimate the cropland area that renewable GW can irrigate in Africa (using Pavelic’ et al. (2012) water balance
approach)
o Some assumptions in computations GW is the only water source for irrigation (no conjunctive use with SW) GW is usable and accessible (no quality, yield, or socio-economic constraints) GW is locally available
(106 ha)
Asia Africa0
100
200
300
400
500
600
Cultivated land Total area equipped for Irrigation Area equipped for ir-rigation irrigated with groundwater
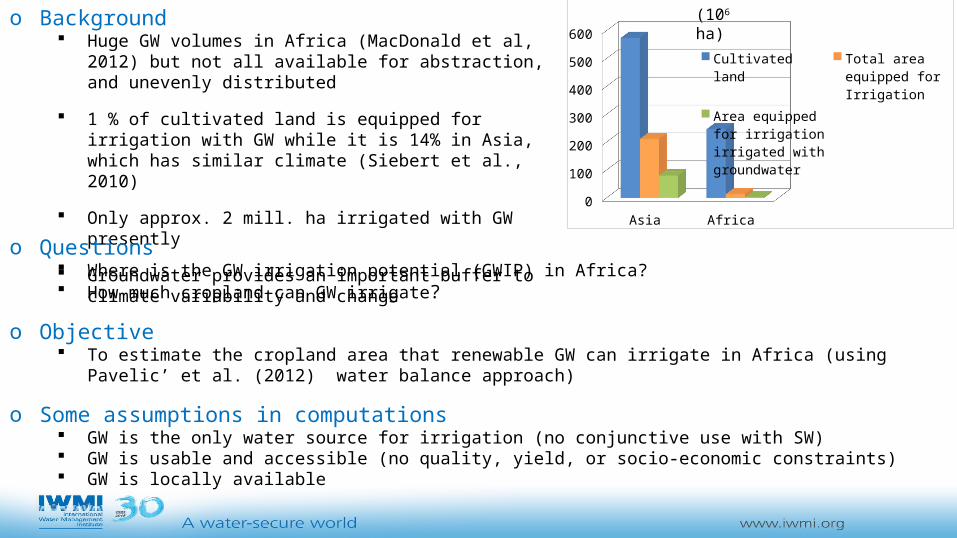
Methodology
o Hydrological data• Recharge• Water available for crop from rain (green water)
o Other GW uses• human activities (domestic, livestock, industrial)• environment
o Crop data• Surface of cropland• Crop distribution• Crop water demand• Irrigation efficiency
𝑮𝑾 𝑨𝒗𝒂𝒊𝒍𝒂𝒃𝒍𝒆=𝐺𝑊 h𝑅𝑒𝑐 𝑎𝑟𝑔𝑒 –𝐻𝑢𝑚𝑎𝑛𝐺𝑊 𝐷𝑒𝑚𝑎𝑛𝑑 – 𝐸𝑛𝑣𝑖𝑟𝑜𝑛 .𝐺𝑊 𝑅𝑒𝑞 .
Different geographical data compiled in GIS
n= crop
Cell size : 0.5 x 0.5 degree(≈ 50 km x 50 km)
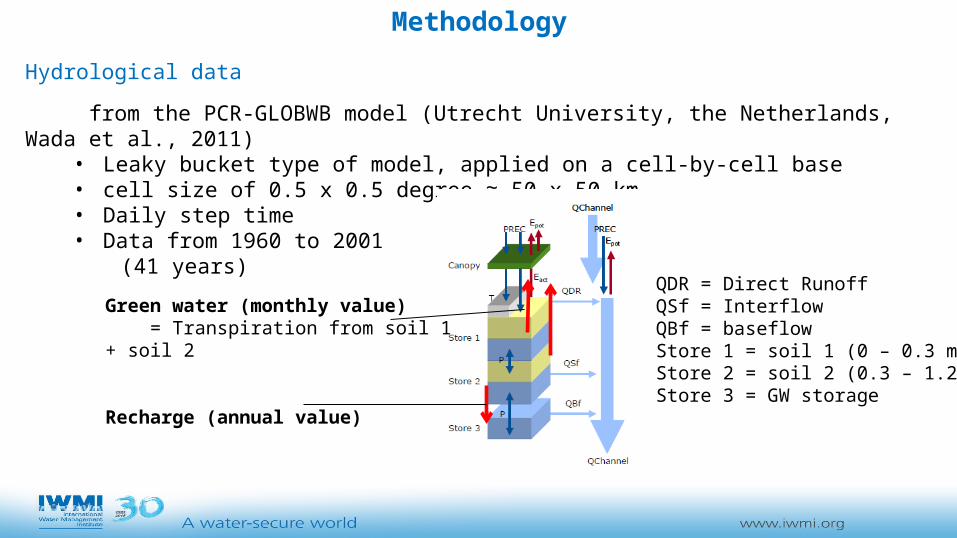
Hydrological data
from the PCR-GLOBWB model (Utrecht University, the Netherlands, Wada et al., 2011)• Leaky bucket type of model, applied on a cell-by-cell base• cell size of 0.5 x 0.5 degree ≈ 50 x 50 km• Daily step time• Data from 1960 to 2001
(41 years)
QDR = Direct RunoffQSf = InterflowQBf = baseflowStore 1 = soil 1 (0 – 0.3 m deep)Store 2 = soil 2 (0.3 – 1.2 m deep)Store 3 = GW storage
Green water (monthly value) = Transpiration from soil 1 + soil 2
Recharge (annual value)
Methodology
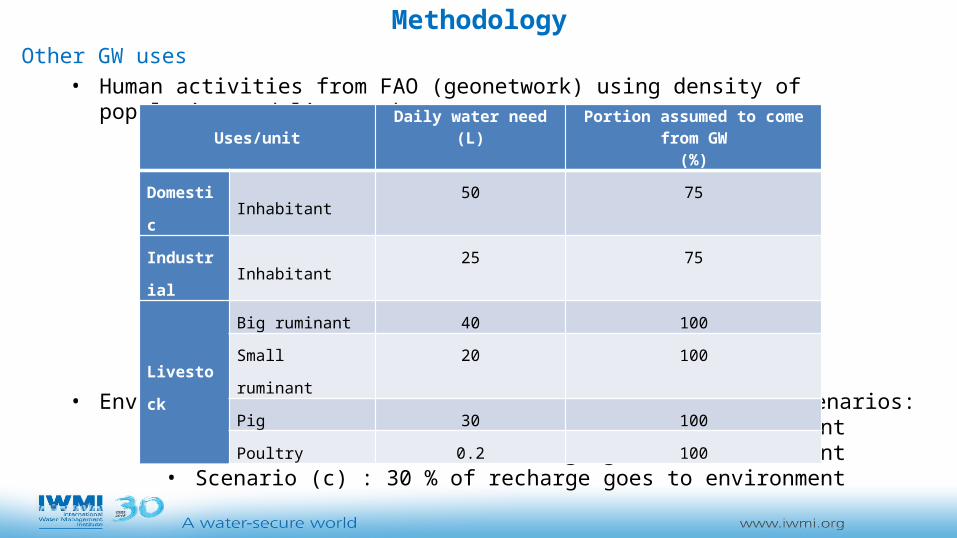
Other GW uses• Human activities from FAO (geonetwork) using density of population and livestock
• Environmental water need according to three different scenarios:• Scenario (a) : 70 % of recharge goes to environment• Scenario (b) : 50 % of recharge goes to environment• Scenario (c) : 30 % of recharge goes to environment
Methodology
Uses/unitDaily water need
(L)Portion assumed to come from GW
(%)
Domestic Inhabitant 50 75
Industrial Inhabitant 25 75
Livestock
Big ruminant 40 100
Small ruminant 20 100
Pig 30 100
Poultry 0.2 100
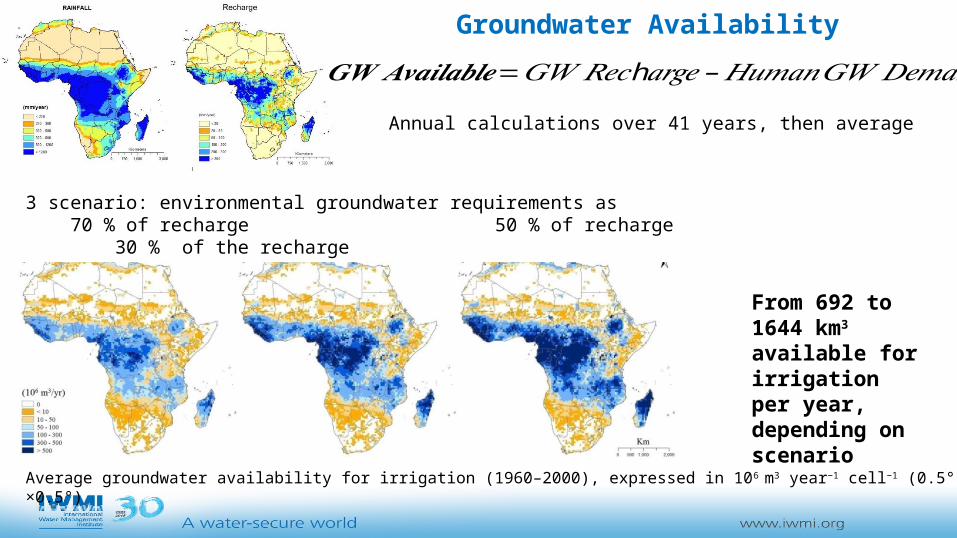
Groundwater Availability
Annual calculations over 41 years, then average
From 692 to 1644 km3 available for irrigation per year, depending on scenario
Average groundwater availability for irrigation (1960–2000), expressed in 106 m3 year−1 cell−1 (0.5° ×0.5°)
𝑮𝑾 𝑨𝒗𝒂𝒊𝒍𝒂𝒃𝒍𝒆=𝐺𝑊 h𝑅𝑒𝑐 𝑎𝑟𝑔𝑒 –𝐻𝑢𝑚𝑎𝑛𝐺𝑊 𝐷𝑒𝑚𝑎𝑛𝑑 – 𝐸𝑛𝑣𝑖𝑟𝑜𝑛 .𝐺𝑊 𝑅𝑒𝑞 .
3 scenario: environmental groundwater requirements as 70 % of recharge 50 % of recharge 30 % of the recharge
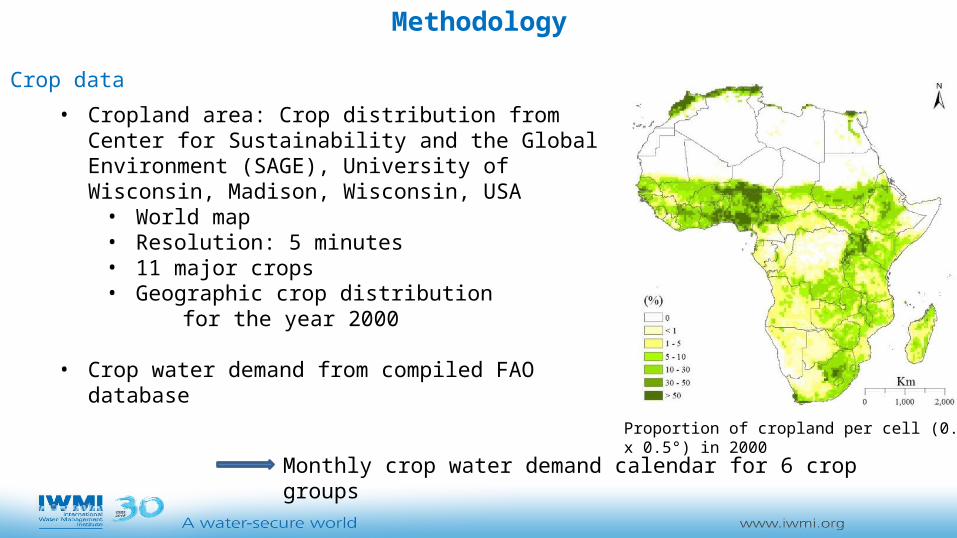
Crop data
• Cropland area: Crop distribution from Center for Sustainability and the Global Environment (SAGE), University of Wisconsin, Madison, Wisconsin, USA
• World map• Resolution: 5 minutes• 11 major crops • Geographic crop distribution for the year 2000
• Crop water demand from compiled FAO database
Monthly crop water demand calendar for 6 crop groups
Methodology
Proportion of cropland per cell (0.5° x 0.5°) in 2000
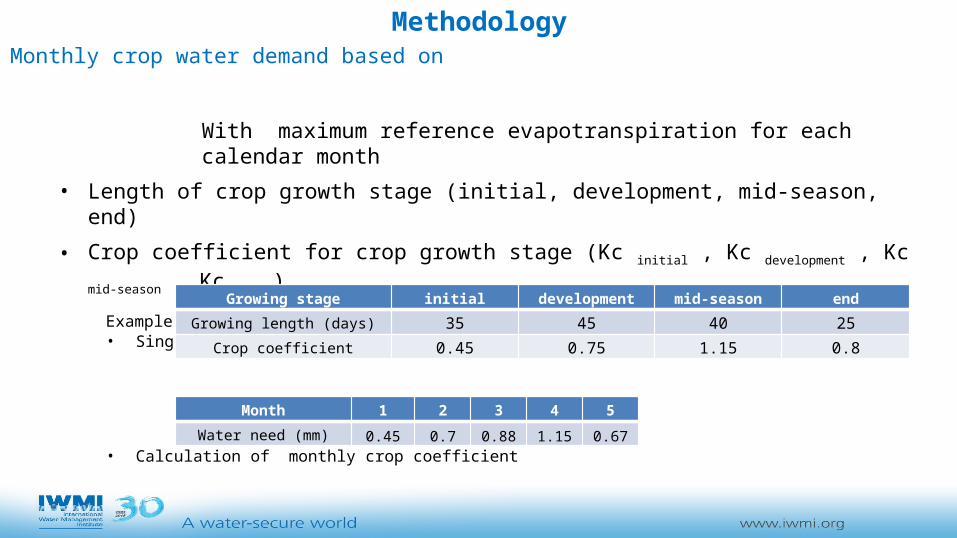
Monthly crop water demand based on
With maximum reference evapotranspiration for each calendar month
• Length of crop growth stage (initial, development, mid-season, end)
• Crop coefficient for crop growth stage (Kc initial , Kc development , Kc mid-season , Kc end )
Example: tomatoes• Single crop coefficient and growing length
• Calculation of monthly crop coefficient
• Planting and harvesting calendar
Growing stage initial development mid-season end
Growing length (days) 35 45 40 25
Crop coefficient 0.45 0.75 1.15 0.8
Month 1 2 3 4 5
Water need (mm) 0.45 0.7 0.88 1.15 0.67
Methodology
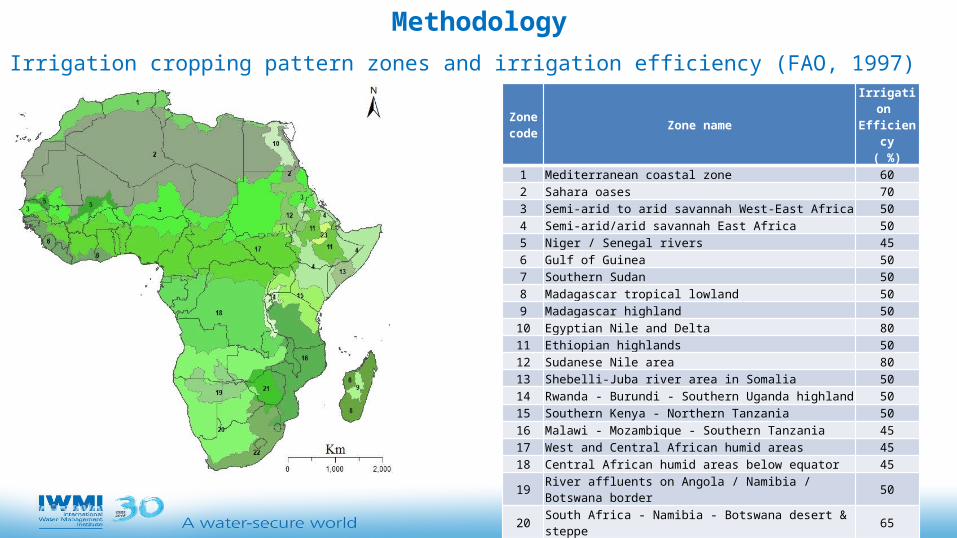
Zone code Zone name
Irrigation Efficiency
( %)1 Mediterranean coastal zone 602 Sahara oases 703 Semi-arid to arid savannah West-East Africa 504 Semi-arid/arid savannah East Africa 505 Niger / Senegal rivers 456 Gulf of Guinea 507 Southern Sudan 508 Madagascar tropical lowland 509 Madagascar highland 50
10 Egyptian Nile and Delta 8011 Ethiopian highlands 5012 Sudanese Nile area 8013 Shebelli-Juba river area in Somalia 5014 Rwanda - Burundi - Southern Uganda highland 5015 Southern Kenya - Northern Tanzania 5016 Malawi - Mozambique - Southern Tanzania 4517 West and Central African humid areas 4518 Central African humid areas below equator 4519 River affluents on Angola / Namibia / Botswana border 5020 South Africa - Namibia - Botswana desert & steppe 6521 Zimbabwe highland 6022 South Africa - Lesotho - Swaziland 6023 Awash river area 50
Irrigation cropping pattern zones and irrigation efficiency (FAO, 1997)
Methodology
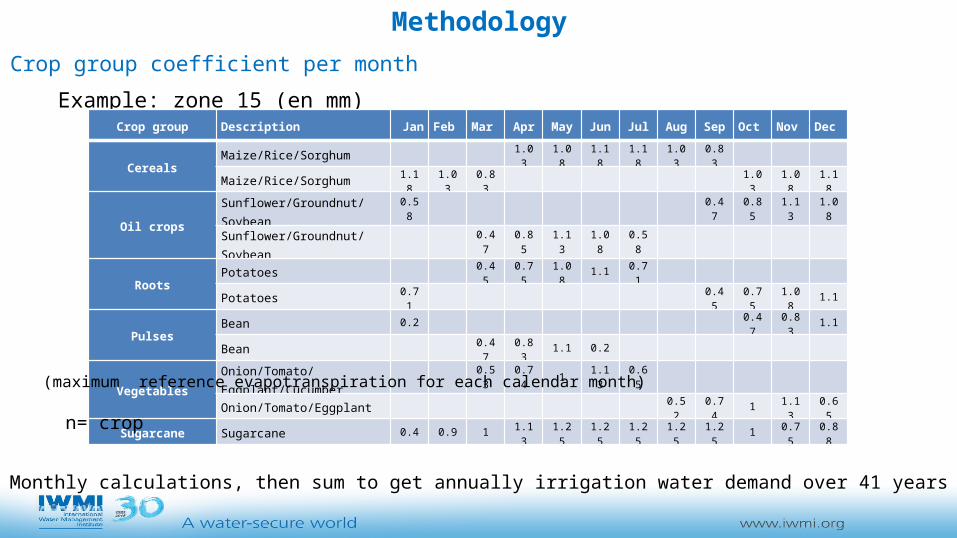
Crop group coefficient per month
Example: zone 15 (en mm)Crop group Description Jan Feb Mar Apr May Jun Jul Aug Sep Oct Nov Dec
CerealsMaize/Rice/Sorghum 1.03 1.08 1.18 1.18 1.03 0.83
Maize/Rice/Sorghum 1.18 1.03 0.83 1.03 1.08 1.18
Oil cropsSunflower/Groundnut/Soybean 0.58 0.47 0.85 1.13 1.08
Sunflower/Groundnut/Soybean 0.47 0.85 1.13 1.08 0.58
RootsPotatoes 0.45 0.75 1.08 1.1 0.71
Potatoes 0.71 0.45 0.75 1.08 1.1
PulsesBean 0.2 0.47 0.83 1.1
Bean 0.47 0.83 1.1 0.2
VegetablesOnion/Tomato/Eggplant/Cucumber 0.53 0.74 1 1.13 0.65
Onion/Tomato/Eggplant 0.52 0.74 1 1.13 0.65
Sugarcane Sugarcane 0.4 0.9 1 1.13 1.25 1.25 1.25 1.25 1.25 1 0.75 0.88
Methodology
n= crop
(maximum reference evapotranspiration for each calendar month)
Monthly calculations, then sum to get annually irrigation water demand over 41 years
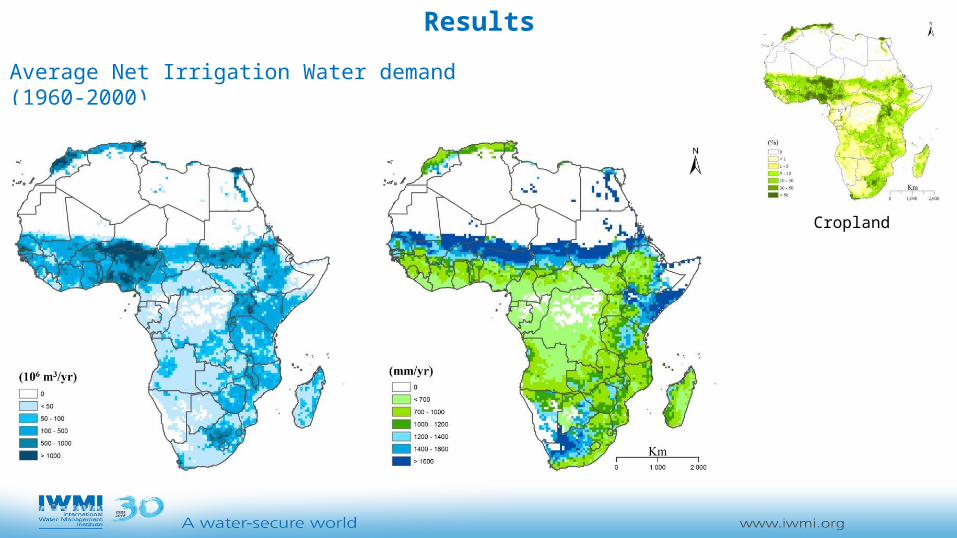
Average Net Irrigation Water demand (1960-2000)
Results
Cropland
Results
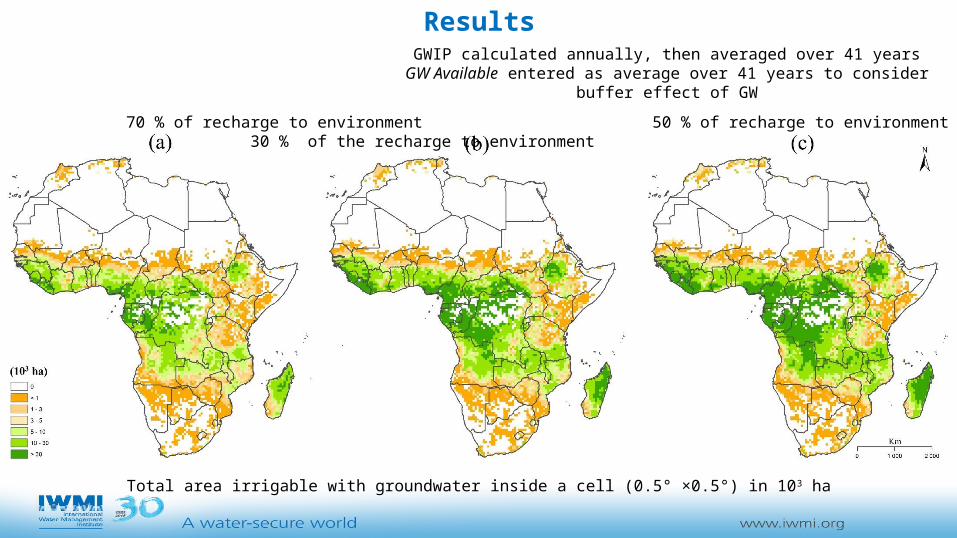
Total area irrigable with groundwater inside a cell (0.5° ×0.5°) in 103 ha
GWIP calculated annually, then averaged over 41 yearsGW Available entered as average over 41 years to consider buffer effect of GW
70 % of recharge to environment 50 % of recharge to environment 30 % of the recharge to environment
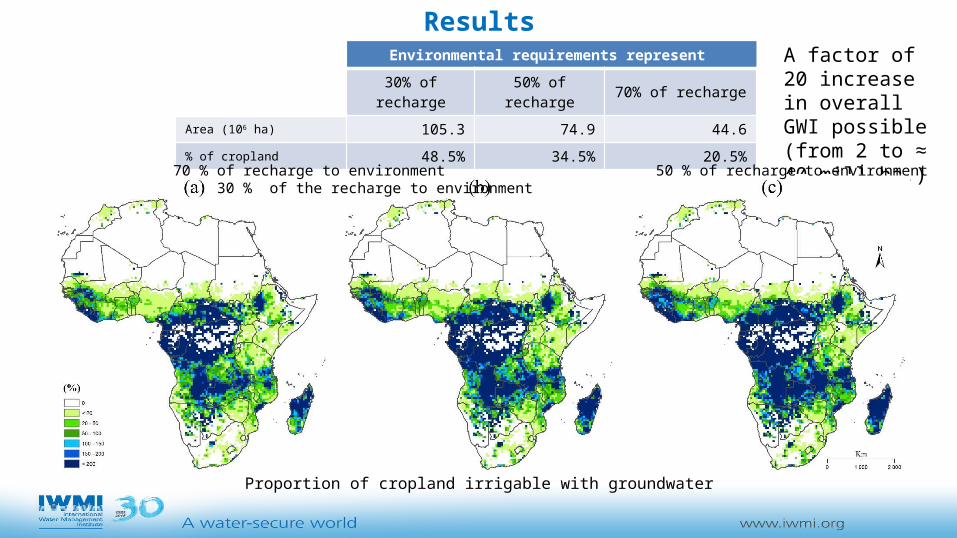
AFRICAEnvironmental requirements represent
30% of recharge 50% of recharge 70% of recharge
Area (106 ha) 105.3 74.9 44.6
% of cropland 48.5% 34.5% 20.5%
Proportion of cropland irrigable with groundwater
ResultsA factor of 20 increase in overall GWI possible (from 2 to ≈ 40 mill ha.)
70 % of recharge to environment 50 % of recharge to environment 30 % of the recharge to environment
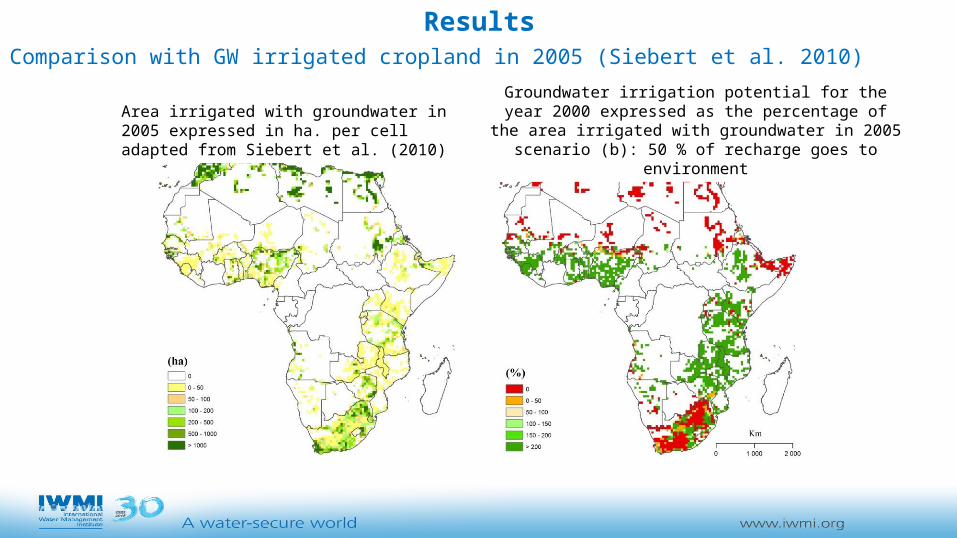
Comparison with GW irrigated cropland in 2005 (Siebert et al. 2010)
Results
Area irrigated with groundwater in 2005 expressed in ha. per cell adapted from Siebert et al. (2010)
Groundwater irrigation potential for the year 2000 expressed as the percentage of the area irrigated with groundwater in 2005
scenario (b): 50 % of recharge goes to environment
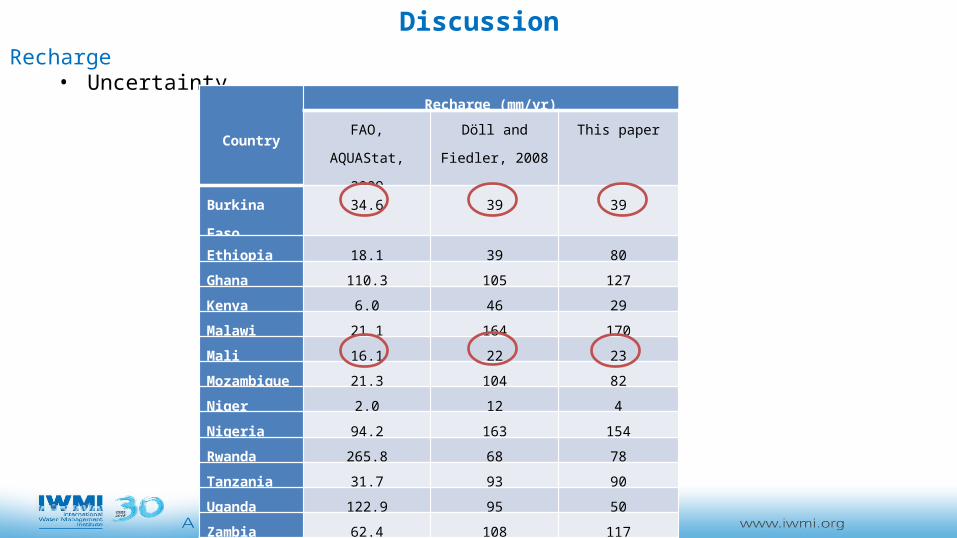
Recharge• Uncertainty
Country
Recharge (mm/yr)
FAO, AQUAStat, 2009
Döll and Fiedler, 2008
This paper
Burkina Faso 34.6 39 39
Ethiopia 18.1 39 80
Ghana 110.3 105 127
Kenya 6.0 46 29
Malawi 21.1 164 170
Mali 16.1 22 23
Mozambique 21.3 104 82
Niger 2.0 12 4
Nigeria 94.2 163 154
Rwanda 265.8 68 78
Tanzania 31.7 93 90
Uganda 122.9 95 50
Zambia 62.4 108 117
Discussion
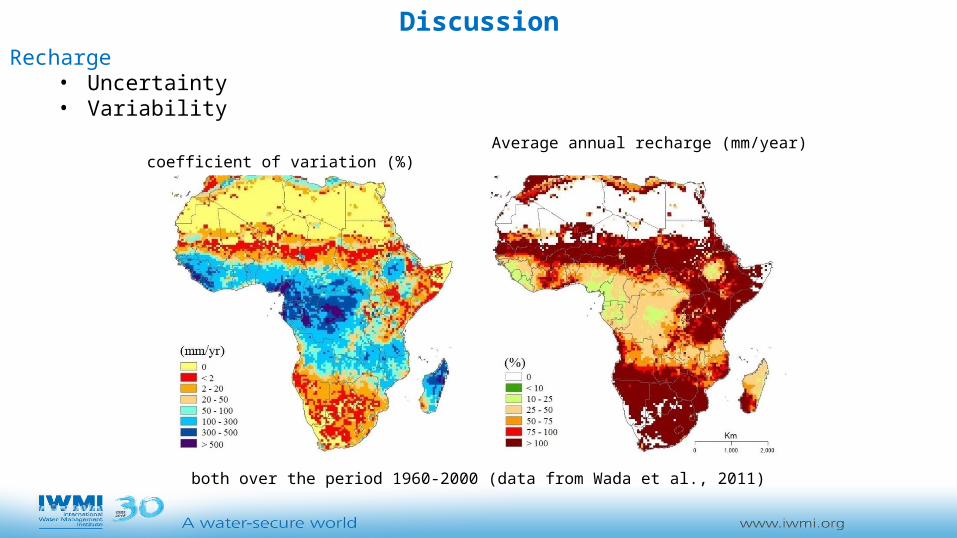
Recharge• Uncertainty• Variability
Discussion
both over the period 1960-2000 (data from Wada et al., 2011)
Average annual recharge (mm/year) coefficient of variation (%)
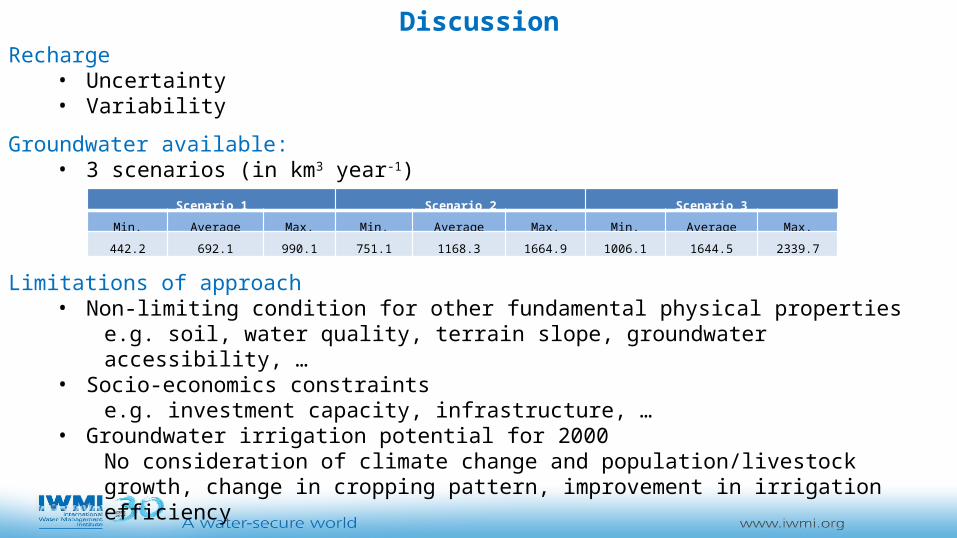
Recharge• Uncertainty• Variability
Groundwater available: • 3 scenarios (in km3 year-1)
Limitations of approach• Non-limiting condition for other fundamental physical properties
e.g. soil, water quality, terrain slope, groundwater accessibility, …• Socio-economics constraints
e.g. investment capacity, infrastructure, …• Groundwater irrigation potential for 2000
No consideration of climate change and population/livestock growth, change in cropping pattern, improvement in irrigation efficiency
Scenario 1 Scenario 2 Scenario 3
Min. Average Max. Min. Average Max. Min. Average Max.
442.2 692.1 990.1 751.1 1168.3 1664.9 1006.1 1644.5 2339.7
Discussion
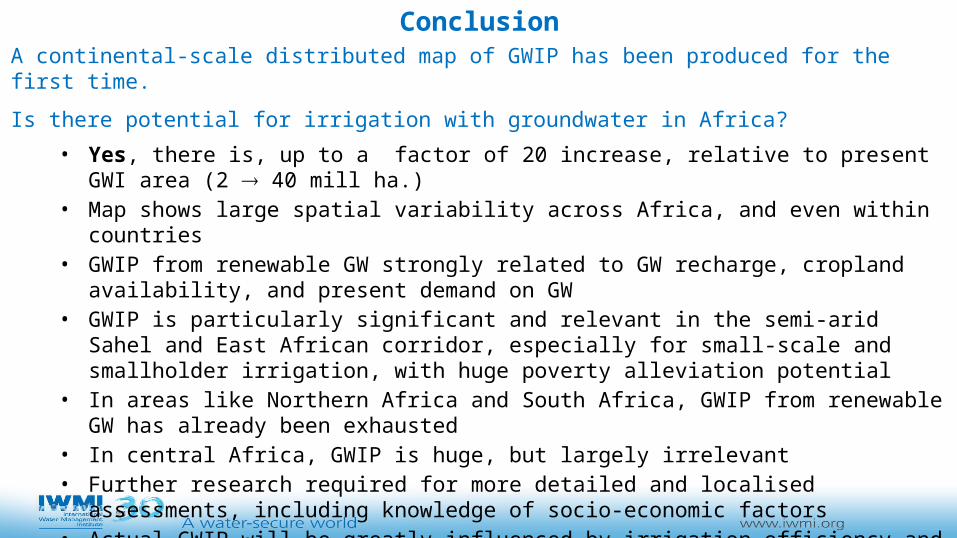
A continental-scale distributed map of GWIP has been produced for the first time.
Is there potential for irrigation with groundwater in Africa?
• Yes, there is, up to a factor of 20 increase, relative to present GWI area (2 40 mill ha.)• Map shows large spatial variability across Africa, and even within countries• GWIP from renewable GW strongly related to GW recharge, cropland availability, and present
demand on GW• GWIP is particularly significant and relevant in the semi-arid Sahel and East African corridor,
especially for small-scale and smallholder irrigation, with huge poverty alleviation potential• In areas like Northern Africa and South Africa, GWIP from renewable GW has already been
exhausted• In central Africa, GWIP is huge, but largely irrelevant• Further research required for more detailed and localised assessments, including knowledge of
socio-economic factors• Actual GWIP will be greatly influenced by irrigation efficiency and crop choices• Climate change might affect GW recharge and increase crop water demand
Conclusion
References
• Altchenko Y. and Villholth K.G (2015) Mapping irrigation potential from renewable groundwater in Africa – a quantitative hydrological approach. Hydrol. Earth Syst. Sci., 19, 1-13, Doi: 10.5194/hessd-19-1-2015
• Doll P. and Fiedler K. (2008) Global-scale modeling of groundwater recharge, Hydrol. Earth Syst. Sci. 12, 863–885 pp
• MacDonald A, Bonsor H, Dochartaigh B, Taylor R (2012) Quantitative maps of groundwater resources in Africa. Environ. Res. Lett. 7, doi:10.1088/1748-9326/7/2/024009
• Pavelic P., Smakhtin V., Favreau G., and Villholth K.G. (2012). Water-balance approach for assessing potential for smallholder groundwater irrigation in Sub-Saharan Africa. Water SA, 38(3), 399-406. doi.org/10.4314/wsa.v38i3.18
• Siebert S., Burke J., Faures J.M., Frenken K., Hoogeveen J., Döll P., and Portmann F.T. (2010). Groundwater use for irrigation - a global inventory. Hydrol. Earth Syst. Sci. Discuss., 7, 3977–4021.
• Wada Y., Van Beek, L, Viviroli D., Dürr H., Weingartner R. and Bierkens M.: Global monthly water stress: 2. Water demand and severity of water stress, Water Resour. Res., 47, W07517, doi:10.1029/2010WR009792, 2011.
Thank YouMerci
Phot
o by
X. C
ai /
IWM
I
Phot
o by
K. V
illho
lth /
IWM
I
Phot
o by
K. V
illho
lth /
IW
MI
Phot
o by
Y. A
ltche
nko
/ IW
MI
http://www.slideshare.net/IWMI_media
Related Documents