106 CHAPTER - FIVE GROUNDWATER IRRIGATION AND ITS IMPACT ON HYDROLOGY AND MORPHOLOGY 5.0 INTRODUCTION Murshidabad District is one of the worst affected areas of arsenic contamination in groundwater in the world. The other affected areas are Malda, Nadia, and North and South 24 Parganas districts of West Bengal. According to the water test report of Public Health Engineering Department in Murshidabad District 28,357 water samples have arsenic concentration above 0.05 mg/l in groundwater. 22 out of 26 blocks have arsenic concentration 9 (Samaddar and Subbarao, 2007). This district is also one of the worst affected areas in the world by arsenicosis. 6 Abhijit Mukherjee et. al., 2007 had documented the groundwater flow and a regional- scale hydrostratigraphy for a ~ 21,000 km 2 area of the arsenic affected districts of West Bengal. These districts include Murshidabad District, Nadia, North 24- Parganas and South 24- Parganas (including Kolkata). Eight 22- layer model scenarios of regional groundwater flow were developed based on the observed topography, seasonal conditions and inferred hydrostratigraphy. A comparative picture is drawn between the existence of seasonally variable, regional north- south flow across the basin prior to the onset of extensive pumping and severe pumping, therefore, distorting the flow pattern, inducing high vertical hydraulic gradients across wide cones of depression after 1970’s, a landmark period of Green Revolution. Downward flows of irrigational return flow and inflow from rivers have resulted in arsenic contamination in shallow ground water. Previously safe aquifers appear to have contaminated by a combination of mechanical mixing and chemical equilibrium.

Welcome message from author
This document is posted to help you gain knowledge. Please leave a comment to let me know what you think about it! Share it to your friends and learn new things together.
Transcript
106
CHAPTER - FIVE
GROUNDWATER IRRIGATION AND ITS IMPACT ON HYDROLOGY AND MORPHOLOGY
5.0 INTRODUCTION
Murshidabad District is one of the worst affected areas of arsenic contamination
in groundwater in the world. The other affected areas are Malda, Nadia, and North and
South 24 Parganas districts of West Bengal. According to the water test report of Public
Health Engineering Department in Murshidabad District 28,357 water samples have
arsenic concentration above 0.05 mg/l in groundwater. 22 out of 26 blocks have arsenic
concentration 9(Samaddar and Subbarao, 2007). This district is also one of the worst
affected areas in the world by arsenicosis.
6Abhijit Mukherjee et. al., 2007 had documented the groundwater flow and a
regional- scale hydrostratigraphy for a ~ 21,000 km2 area of the arsenic affected
districts of West Bengal. These districts include Murshidabad District, Nadia, North 24-
Parganas and South 24- Parganas (including Kolkata). Eight 22- layer model scenarios
of regional groundwater flow were developed based on the observed topography,
seasonal conditions and inferred hydrostratigraphy. A comparative picture is drawn
between the existence of seasonally variable, regional north- south flow across the basin
prior to the onset of extensive pumping and severe pumping, therefore, distorting the
flow pattern, inducing high vertical hydraulic gradients across wide cones of depression
after 1970’s, a landmark period of Green Revolution. Downward flows of irrigational
return flow and inflow from rivers have resulted in arsenic contamination in shallow
ground water. Previously safe aquifers appear to have contaminated by a combination
of mechanical mixing and chemical equilibrium.
107
5.1 FACTS AND FINDINGS ABOUT ARSENIC IN GROUNDWATER IN THE DISTRICT
Stuben et.al. 13(2003) had made a study in a small watershed at and around
Berhampore block in ‘bagri’ region of Murshidabad District. Groundwater from wells
and the main rivers crossing the area (Bhagirathi and Gobra) have been sampled in the
north of Murshidabad District covering an area about 200 square kilometers. The
concentration of major cations including Ca, Mg, K, Na and Fe were measured.
Fluoride, Cl-, NO3- and SO4
-2 concentration were also determined. According to the
relative molar portion of the dissolved ionic species, all samples are of Ca – HCO3 type.
River and groundwater samples are similar in their main hydro-geochemical
compositions, but the total amount of dissolved solids in river water is slightly lower in
Bhagirathi about 300 mg/l, Gobra about 500 mg/l and ground water is 700 mg/l
symptomatic of anthropogenic interference into the groundwater through soil due to
infiltrating, surface run-off. In this chapter the geo-chemical mechanism of arsenic
contamination in groundwater has been discussed, and emphasis on the effect of
changing land-use on groundwater since Green Revolution.
Mobilization of As (arsenic) in groundwater is mainly governed by low
temperature geochemical processes that involve leaching of naturally occurring ores.
Accumulation of As (arsenic) in soil and groundwater especially under anoxic
conditions, due to anthropogenic input or human activity (Bowell et. al., 1994; Azcue
et. al., 1995; Mariner et. al., 1997; Chakraborty et. al., 1998; Ashley and Lottermoser,
1999; Madhavan and Subramaniam, 2000; Stuben et.al. 2001 in 9Stuben et.al. 2003).
According to Mallick and Rajagopal, 1996; Das et.al, 1996; Mandal et.al. 1996;
Chowdhury et. al.; 1999) arsenic is released to the groundwater from sulfides mostly
pyrite which were oxidized primarily due to water level drawn down as a consequence
of intensive irrigation and groundwater exploitation. A group of scientist opines that
arsenic is released by the oxidation of pyrite or arseno-pyrite following the lowering of
water ground water level. The other view is that arsenic is released due to desorption
from or reductive dissolution of ferric oxy-hydroxide in reducing aquifer in
environment (KMPC, 2006). The widely accepted hypothesis by a group of researchers
from the Division of Land and Water Resources, Royal Institute of Technology,
108
Sweden is, arsenic is fixed on Fe-oxyhydroxides (FeOOH). Fe-oxyhydroxides
scavenges and immobilized arsenic in an aerated aquatic system but in the presence of
organic material and as a released; again due to the microbial mediated reductive
dissolution of Fe-oxyhydroxides arsenic is released from such Fe- oxyhydroxides under
reducing condition. The flooding method of irrigation gradually sealed the aquifer from
diffusion of oxygen.
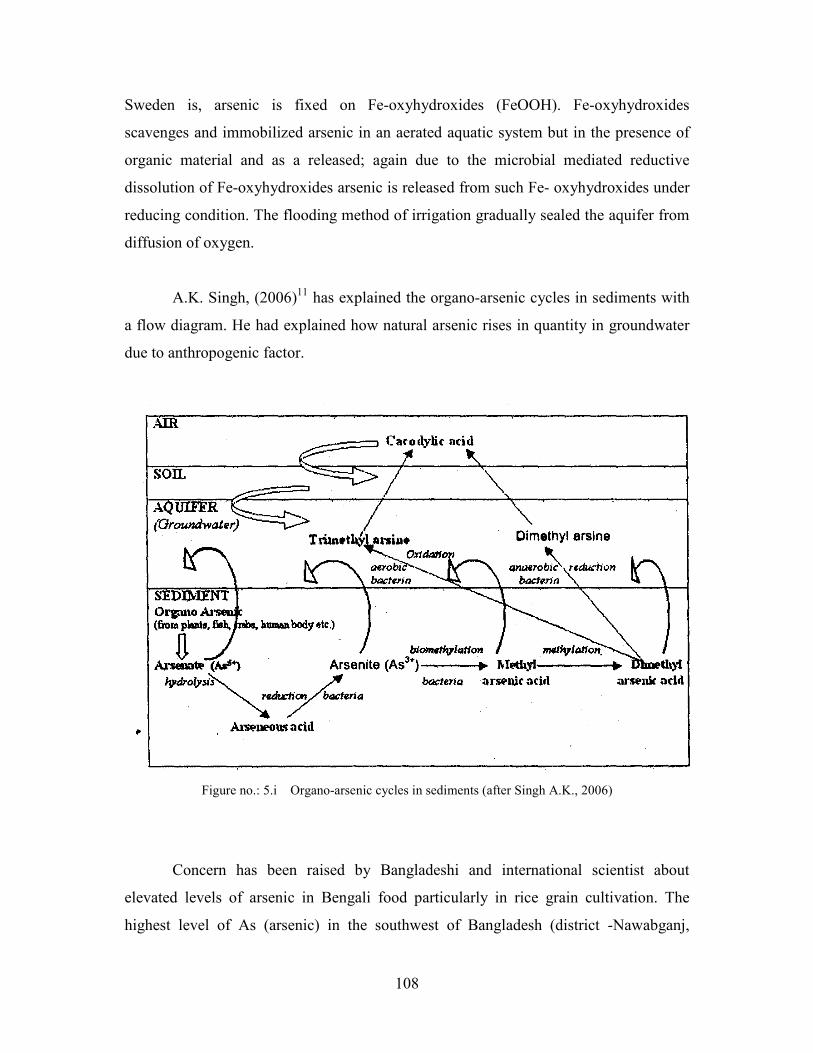
A.K. Singh, (2006)11 has explained the organo-arsenic cycles in sediments with
a flow diagram. He had explained how natural arsenic rises in quantity in groundwater
due to anthropogenic factor.
Figure no.: 5.i Organo-arsenic cycles in sediments (after Singh A.K., 2006)
Concern has been raised by Bangladeshi and international scientist about
elevated levels of arsenic in Bengali food particularly in rice grain cultivation. The
highest level of As (arsenic) in the southwest of Bangladesh (district -Nawabganj,
109
Faridpur, Rajbari and Gopalganj) share a common international boundary with
Murshidabad District of West Bengal therefore the soil and aquifer are quite similar. In
the rice survey both wet season crop ‘aman’ and dry season crop ‘boro’ were sampled
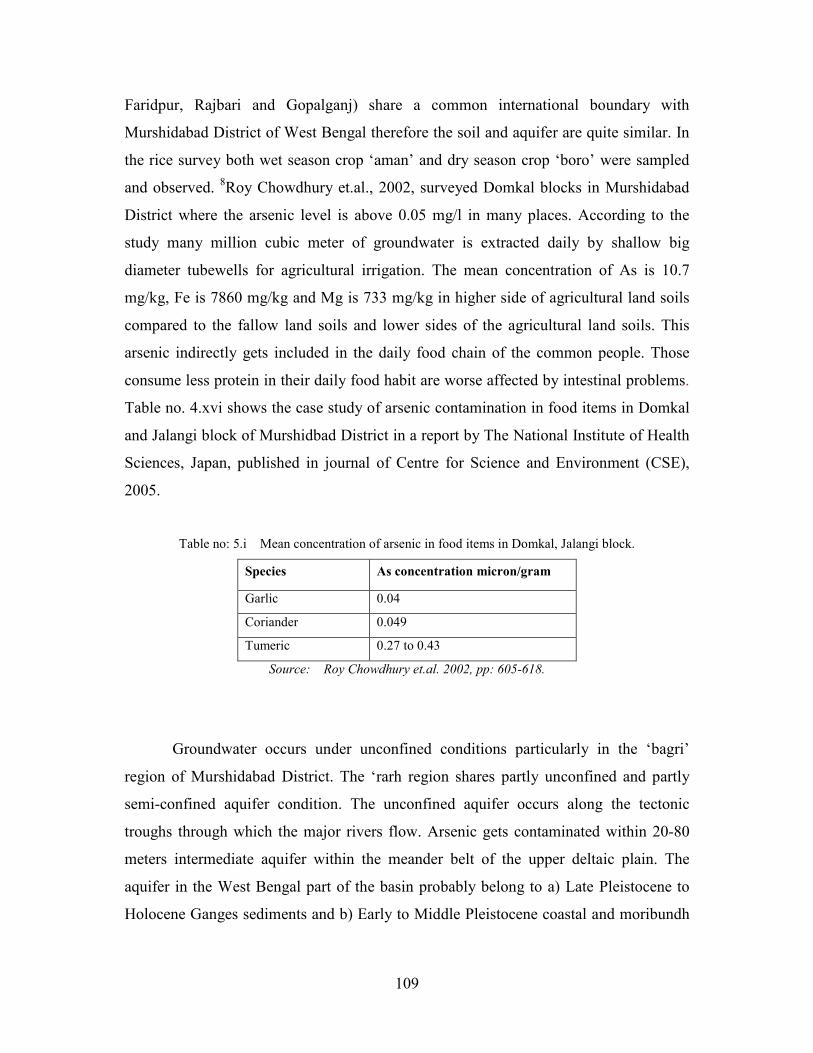
and observed. 8Roy Chowdhury et.al., 2002, surveyed Domkal blocks in Murshidabad
District where the arsenic level is above 0.05 mg/l in many places. According to the
study many million cubic meter of groundwater is extracted daily by shallow big
diameter tubewells for agricultural irrigation. The mean concentration of As is 10.7
mg/kg, Fe is 7860 mg/kg and Mg is 733 mg/kg in higher side of agricultural land soils
compared to the fallow land soils and lower sides of the agricultural land soils. This
arsenic indirectly gets included in the daily food chain of the common people. Those
consume less protein in their daily food habit are worse affected by intestinal problems.
Table no. 4.xvi shows the case study of arsenic contamination in food items in Domkal
and Jalangi block of Murshidbad District in a report by The National Institute of Health
Sciences, Japan, published in journal of Centre for Science and Environment (CSE),
2005.
Table no: 5.i Mean concentration of arsenic in food items in Domkal, Jalangi block.
Species As concentration micron/gram
Garlic 0.04
Coriander 0.049
Tumeric 0.27 to 0.43
Source: Roy Chowdhury et.al. 2002, pp: 605-618.
Groundwater occurs under unconfined conditions particularly in the ‘bagri’
region of Murshidabad District. The ‘rarh region shares partly unconfined and partly
semi-confined aquifer condition. The unconfined aquifer occurs along the tectonic
troughs through which the major rivers flow. Arsenic gets contaminated within 20-80
meters intermediate aquifer within the meander belt of the upper deltaic plain. The
aquifer in the West Bengal part of the basin probably belong to a) Late Pleistocene to
Holocene Ganges sediments and b) Early to Middle Pleistocene coastal and moribundh
110
Ganges delta deep aquifers composed of stacked, main- channel, medium to coarse
sands at depths more than 130 m.
Mukherjee, et. al. (2007), had tried to explain the flow and mechanism of groundwater
due to irrigation since the introduction of green revolution. The extensive exploitation
of groundwater after 1970’s in the up–gradient of mature delta, flushes and dilutes the
arsenic present at very slow rate. The regional flow occurs within the major system
from north to south down- gradient during the dry season probably due to the low
topographic gradient (~0.1 m/km). Very frequent pumping centers in the agricultural
fields and aquifer architectures dictated the hydraulic gradient of the study area. The
absence of continuous confining layers, pumping induces between relatively shallower
and deeper groundwater, which may lead to arsenic enriched water to spread downward.
The arsenic contaminated water when spread over the land surface partially gets
accumulated in crops and partially re-circulate in to the sub surface via enhanced
recharge. This mechanism of repeated extraction and recharging may worsen the
scenario of Murshidabad District in future.
Mukherjee (2006), has opined that the smaller rivers in the study area were
found to be mostly gaining from groundwater discharge. Presumably the groundwater
discharge to rivers has decreased because of pumping by deep tubewells and shallow
tubewells. As a consequence, the outflow from the shallow aquifers may have impacted
the chemistry of smaller rivers. River Bhairab, Dwarka, Pagla, Mayurakhi and many
other rivers may have the same story.
Mineralogical investigations have revealed that arsenic occurs in the silty clay as
well as in the sandy layers as coating on mineral grains. Therefore, it can be said that
more silting of river beds and surface water bodies, more will be the rate of
concentration of arsenic in ground water. Such hydromorphological problem directly
influences the water quality and food chain of the entire population.
Bhattacharya et.al.4 (1997), indicated that the major ions like calcium; magnesium and
bicarbonate with elevated contents of iron, phosphate and arsenic get contaminated with
water during pumping.
The alluvium near the river is sandier and periodic fluviatile action keeps the
alluvium stratified. There is a deposition of coarse sand in river – borne materials along
111
with plant cells and other organic materials cells which may contain considerable
amount of arsenic and other toxic elements. During the course of time arsenic elements
get released in the reducing environment by the process of bio-methylation and get
shelter within silty and clayey sediments. Studies done by Bhattacharya et.al. (1997),
Nickson et.al. (1998) put forward the hypothesis that the burial of sediments rich in
organic matter led to strongly reducing conditions in groundwater aquifer, which is
facilitated by high water table, fine-grained surface layers and widely practiced wetland
paddy cultivation, as well as microbial oxidation of sedimentary organic matter,
depleting thereby the dissolved oxygen in groundwater. Arsenic is released when
external addition of arsenic are reduced in anoxic groundwater and hence driven by
concentrations of sedimentary organic matter. This hypothesis somewhat matches with
A.K. Singh’s organo-arsenic cycles in sediments (2006).
Arsenic pollution is now gradually becoming a disaster for Murshidabad District
and besides other districts of West Bengal like North and South 24- Parganas. This soil-
water and species anomaly has suddenly appeared into the limelight after 1980’s.
Probably it had started from the use of groundwater irrigation since 1970’s otherwise
As (arsenic) in groundwater report was insignificant in literatures.
Proper knowledge of aquifer of the district can help in planning about the use of water
in agricultural and non-agricultural sector.
5.2 AQUIFER OF MURSHIDABAD DISTRICT.
A lithographic model on ‘bagri’ region of West Bengal was developed by A.
Mukherjee, (2007) published in Hydrogeology Journal; describe a detail about the
spatial trends in aquifer thickness and spatial variability. In Murshidabad District a thick
clay deposit covers the area at a depth of ~300 m below mean sea level (MSL). From
west to east the blocks Raghunathganj-II, Lalgola, Bhagawangola –I and II and
Raninagar-II in the ‘bagri’ region of Murshidabad District have sand layers at the top
and extends near the depth of about 65-75 m. Below this unconfined aquifer is a basal
clay aquitard extending from ~80 m to more than 300 m in the west and divide in to
112
multiple layers toward the east. Near Raninagar-II, the upper clay layer is very thin and
mostly replaced by a sandy clay horizon, which lies between thick sand layers. In west
this thick aquitard extends nearly to Beldanga. The noteworthy thing about this area is
the presence of isolated aquifers at depths of ~200 to 230m and ~ 240 to 265m
extending from Bhagawangola to Berhampore through Murshidabad District –Jiaganj
with the possibility of southward extension. These isolated aquifers have water
chemistry distinct from the shallower aquifer (Mukherjee, 2006; Mukherjee and Fryar,
2007 in Mukherjee et.al, 2007).
In the ‘rarh’ region of Murshidabad District the groundwater aquifer
arrangement is somewhat different from the ‘bagri’ region. 14Swadesh Pal and Osondu
C. Akoma in Ethiopian journal of Environmental studies and Management (vol. 2 no. 3,
2009) has discussed in details about the groundwater level and seasonal variation
around Hizal wetland. The groundwater table in the pre-monsoon period ranges from
18.29 m to 21.94 m. Water table depth is quite high in Mahalandi –I GramPanchayet of
Kandi Block and Kandi Municipalty is 18.29 m and 21.68 m respectively. Around Hizal
Wet Land area the ground water table is unexpectedly low about 19.20m – 20.42 m.
The standard deviation value and the co-efficient of variation of ground water table is
0.87 and 4.32% respectively which indicates a fair degree of uniformity of groundwater
table depth. In the monsoon period the spatial groundwater table depth value ranges
from 10.79 m to 13.84 m. Maximum values were recorded near Nabagram is 13.84 m.
Around Hizal area the groundwater table depth is about 10.79 m. Standard Deviation
Value is 0.98 and the co-efficient of variation of ground water table is 8.12%. These
results again reveal the spatial level of consistencies is quite scarce in comparison to the
pre- monsoon season. There is a wide range of water table fluctuation in ‘rarh’ area of
Murshidabad District. The relationship between the recharge and discharge due to
groundwater lifting is a fact of intimate debate. The depth of the water table is usually
deepest during the month of May and thereby a steady decline of ground water table
during summer due to massive drafting of water. The rainfall recharge relationship is
not very strong where r = 0.110 to 0.132. During monsoon again the water level rises up
from June to October.
113
Researchers said that probably Murshidabad District aquitard had formed due to
a major shift in the delta –building process of the Ganges – Brahmaputra. The top
surface of the Murshidabad District aquitard deepens toward east and south, it can be
vertically traced to a depth of at least 300 meters.
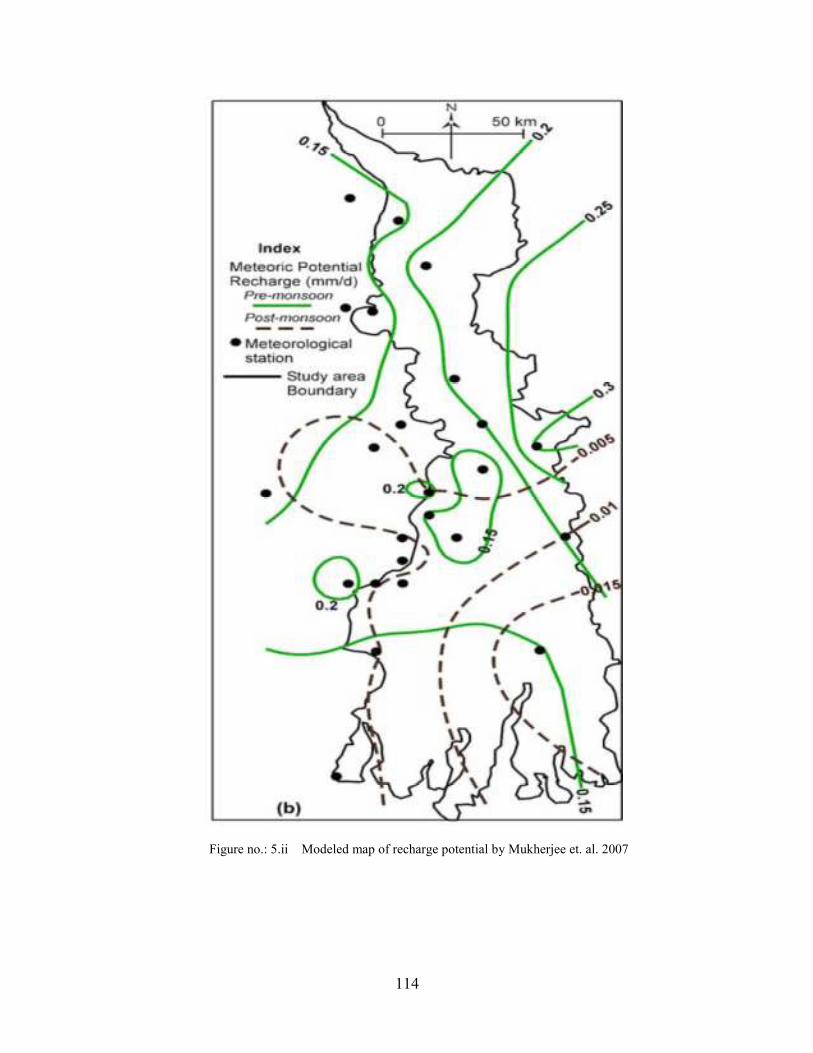
Map drawn by Mukherjee et. al. 2007 showed the meteorological stations in and
around the study area whose data were used in contouring the zonal meteoric potential
recharge (PR) used in the model. In Murshidabad District the total number of ground
water pumping tube- well including both deep tube well and shallow tube wells are
63424 (approx) nos. in 2007-08.
If the rate of pumping is 10 m3/h for 12 hours a day then the total water drafting
is 7625880 m3/day (approx) in Murshidabad District. The cones of depression expand
during the pre monsoon with the formation of prominent groundwater lows in Central
Murshidabad District i.e. Murshidabad District- Jiaganj, Berhampore, Hariharpara and
Domkal blocks whereas the ground water mounds in northern Murshidabad District
near Jangipur and Bhagawangola. In Figure no.5.ii, the recharge in the pre- monsoon
season ranges from .15 to 0.25 mm/d in mature part of the Bengal Delta (Murshidabad
District, Nadia and North 24 parganas district) in the pre- monsoon period. In the post
monsoon season the ground water recharge is mainly in the lower part of Bengal Delta.
Therefore, we can presume that rain water harvesting in the mature delta can boost up
the groundwater recharge and also help in post-monsoon season from lowering of water
table. The models proposed by researchers predict that the ground water drafting will
exceed the recharge within 2011 to 2021 barely discernible in Murshidabad District also
(see figure no. 5.iii).
114
Figure no.: 5.ii Modeled map of recharge potential by Mukherjee et. al. 2007
115
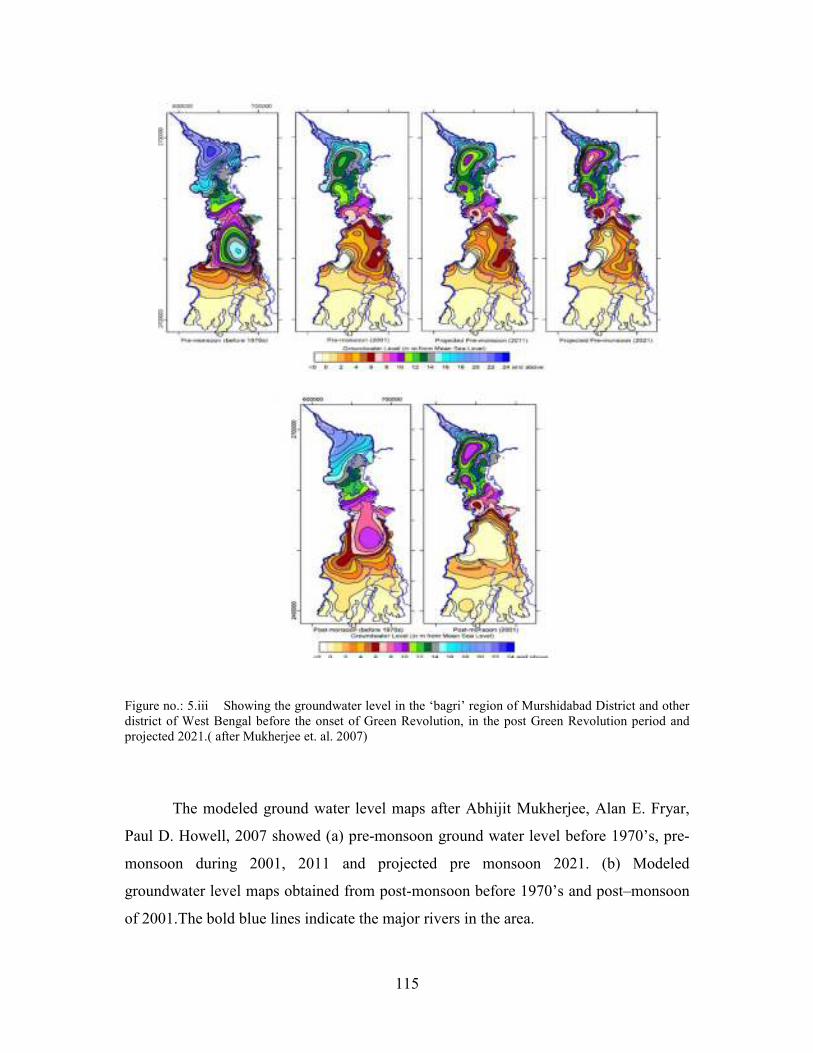
Figure no.: 5.iii Showing the groundwater level in the ‘bagri’ region of Murshidabad District and other district of West Bengal before the onset of Green Revolution, in the post Green Revolution period and projected 2021.( after Mukherjee et. al. 2007)
The modeled ground water level maps after Abhijit Mukherjee, Alan E. Fryar,
Paul D. Howell, 2007 showed (a) pre-monsoon ground water level before 1970’s, pre-
monsoon during 2001, 2011 and projected pre monsoon 2021. (b) Modeled
groundwater level maps obtained from post-monsoon before 1970’s and post–monsoon
of 2001.The bold blue lines indicate the major rivers in the area.
116
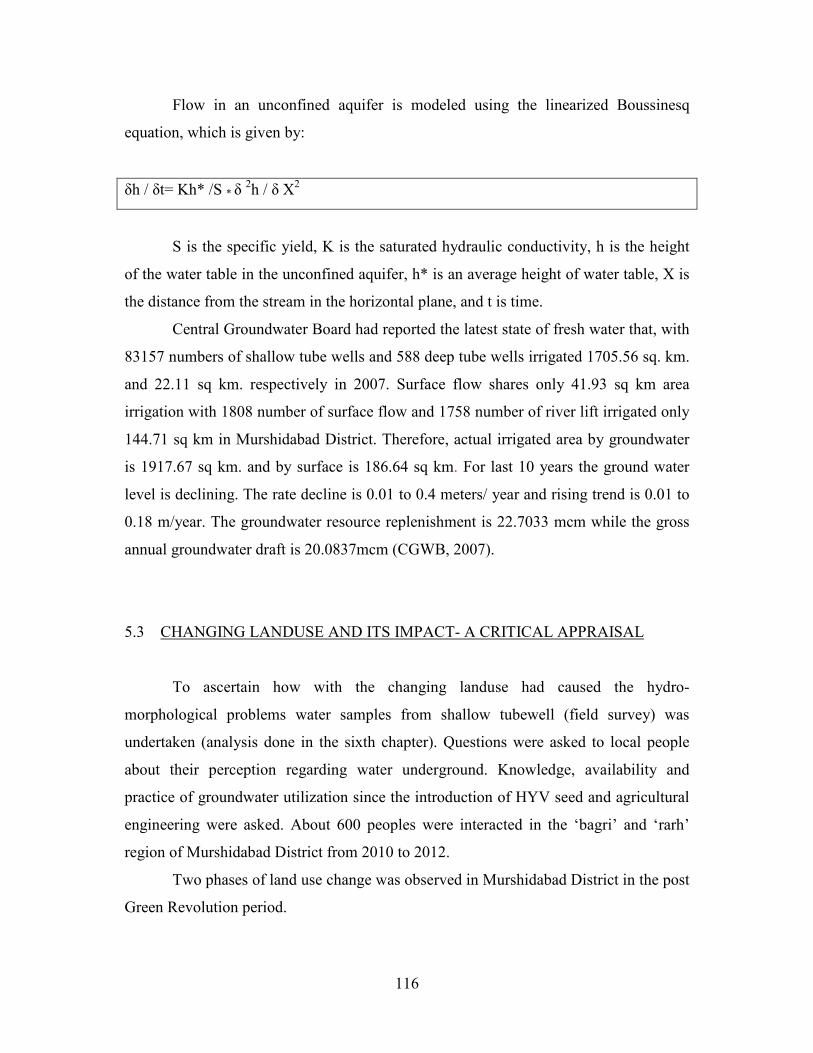
Flow in an unconfined aquifer is modeled using the linearized Boussinesq
equation, which is given by:
δh / δt= Kh* /S * δ 2h / δ X2
S is the specific yield, K is the saturated hydraulic conductivity, h is the height
of the water table in the unconfined aquifer, h* is an average height of water table, X is
the distance from the stream in the horizontal plane, and t is time.
Central Groundwater Board had reported the latest state of fresh water that, with
83157 numbers of shallow tube wells and 588 deep tube wells irrigated 1705.56 sq. km.
and 22.11 sq km. respectively in 2007. Surface flow shares only 41.93 sq km area
irrigation with 1808 number of surface flow and 1758 number of river lift irrigated only
144.71 sq km in Murshidabad District. Therefore, actual irrigated area by groundwater
is 1917.67 sq km. and by surface is 186.64 sq km. For last 10 years the ground water
level is declining. The rate decline is 0.01 to 0.4 meters/ year and rising trend is 0.01 to
0.18 m/year. The groundwater resource replenishment is 22.7033 mcm while the gross
annual groundwater draft is 20.0837mcm (CGWB, 2007).
5.3 CHANGING LANDUSE AND ITS IMPACT- A CRITICAL APPRAISAL
To ascertain how with the changing landuse had caused the hydro-
morphological problems water samples from shallow tubewell (field survey) was
undertaken (analysis done in the sixth chapter). Questions were asked to local people
about their perception regarding water underground. Knowledge, availability and
practice of groundwater utilization since the introduction of HYV seed and agricultural
engineering were asked. About 600 peoples were interacted in the ‘bagri’ and ‘rarh’
region of Murshidabad District from 2010 to 2012.
Two phases of land use change was observed in Murshidabad District in the post
Green Revolution period.
117
5.3(a) FIRST PHASE
After land ceiling, in early 1980’s the fallow land, and one cropping lands were
converted into multiple cropping land (almost 3 to 4 time) in a year with the help of
assured groundwater irrigation, HYV seed and chemical fertilizers. Peasants grew
subsistent food and also earned money from agricultural surplus. Orchards,
comparatively high relief cultivated land; road side cultivated land was converted
partially or entirely into settlement with improvement of accessibility. For earning cash
many traditional varieties of paddy cultivation were stopped, vegetable, wheat, mustard
cultivation started instead. ‘Boro’ paddy was becoming popular due to high rate of
production. 10Sen, J. (1988) has discussed that during 1974-75 only three mouzas in the
‘bagri’ region cultivated ‘boro’ paddy. By the middle of 1992-93 almost the entire
district cultivate the ‘boro’ rice which has brought piece meal to some blocks such as
Sagardighi, Burwan. The poor farmers irrigated their land with easy available
groundwater resource with the traditional knowledge and practice of nursing the crops.
Dulal Das, school peon of Jindighi High school of Sagardighi block belong to a
farmer’s family. He cultivate his hierarchical land, said that the ‘aus’ rice was
insufficient to feed the family earlier 1985. But with the introduction of ‘boro’
cultivation, they are now food surplus family more over earns some cash by selling the
high yielding variety of paddy.
Dayarampur mouza of Jalangi Block cultivate the ‘boro’ paddy due to its high
yield which can feed the large family size of this area, explained by Majid Sk, a local
amin. Although the soil quality does not permit such thirsty crop but there is no other
alternative staple food for the Bengali population. ’Boro’ rice had somehow meet the
food crisis of Murshidabad District, hence the entire West Bengal. But the maximum
use of groundwater irrigation during the lean season (February to May) has made this
crop cultivation uneconomical and a question arises about the feasibility of groundwater
irrigation. By 1990 the sugarcane cultivation had reduced, pulses in the riverine tracts
had reduced, instead crops such as ‘dhania’, ‘kalazira’, potato, vegetable, wheat, ‘boro’
rice and jute increased.
118
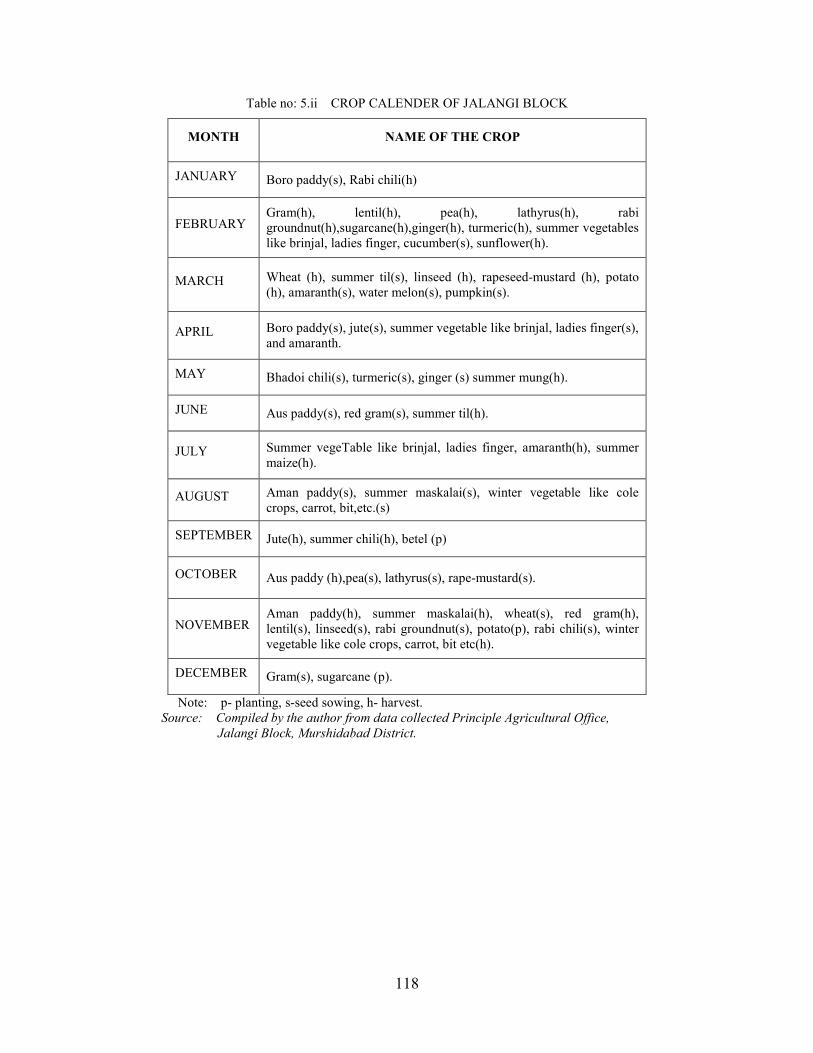
Table no: 5.ii CROP CALENDER OF JALANGI BLOCK
MONTH NAME OF THE CROP
JANUARY Boro paddy(s), Rabi chili(h)
FEBRUARY Gram(h), lentil(h), pea(h), lathyrus(h), rabi groundnut(h),sugarcane(h),ginger(h), turmeric(h), summer vegetables like brinjal, ladies finger, cucumber(s), sunflower(h).
MARCH Wheat (h), summer til(s), linseed (h), rapeseed-mustard (h), potato (h), amaranth(s), water melon(s), pumpkin(s).
APRIL Boro paddy(s), jute(s), summer vegetable like brinjal, ladies finger(s), and amaranth.
MAY Bhadoi chili(s), turmeric(s), ginger (s) summer mung(h).
JUNE Aus paddy(s), red gram(s), summer til(h).
JULY Summer vegeTable like brinjal, ladies finger, amaranth(h), summer maize(h).
AUGUST Aman paddy(s), summer maskalai(s), winter vegetable like cole crops, carrot, bit,etc.(s)
SEPTEMBER Jute(h), summer chili(h), betel (p)
OCTOBER Aus paddy (h),pea(s), lathyrus(s), rape-mustard(s).
NOVEMBER Aman paddy(h), summer maskalai(h), wheat(s), red gram(h), lentil(s), linseed(s), rabi groundnut(s), potato(p), rabi chili(s), winter vegetable like cole crops, carrot, bit etc(h).
DECEMBER Gram(s), sugarcane (p).
Note: p- planting, s-seed sowing, h- harvest. Source: Compiled by the author from data collected Principle Agricultural Office,
Jalangi Block, Murshidabad District.
119
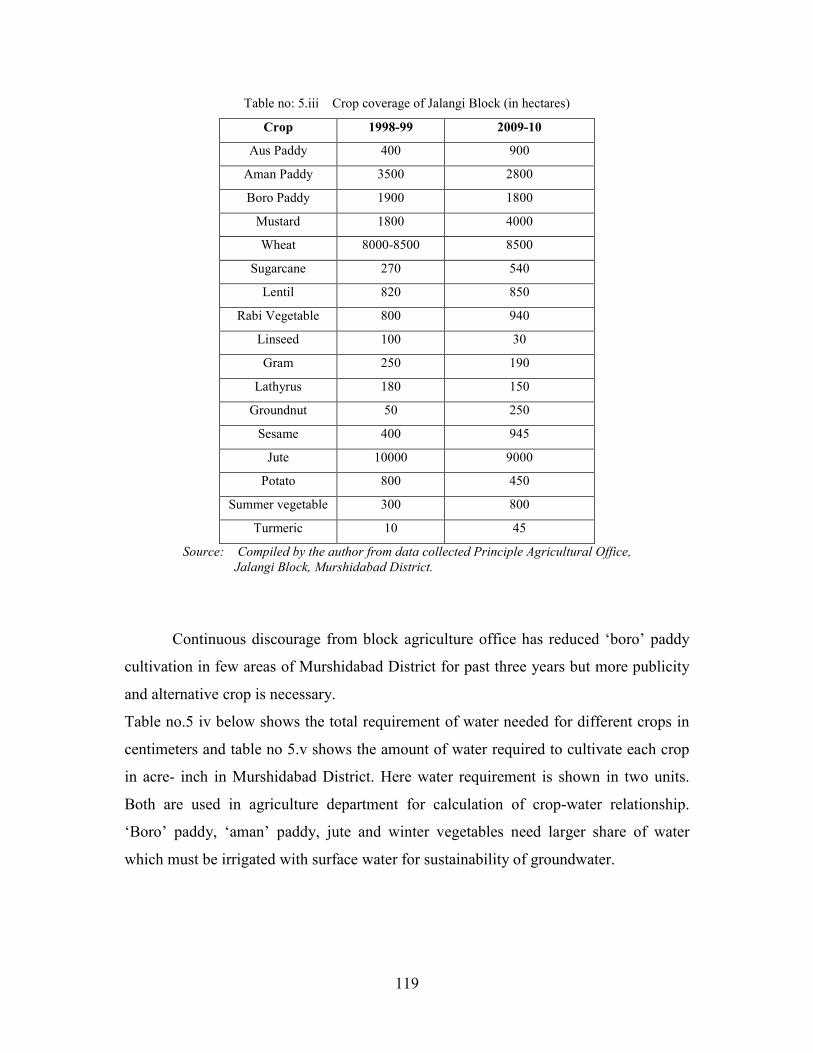
Table no: 5.iii Crop coverage of Jalangi Block (in hectares)
Crop 1998-99 2009-10
Aus Paddy 400 900
Aman Paddy 3500 2800
Boro Paddy 1900 1800
Mustard 1800 4000
Wheat 8000-8500 8500
Sugarcane 270 540
Lentil 820 850
Rabi Vegetable 800 940
Linseed 100 30
Gram 250 190
Lathyrus 180 150
Groundnut 50 250
Sesame 400 945
Jute 10000 9000
Potato 800 450
Summer vegetable 300 800
Turmeric 10 45
Source: Compiled by the author from data collected Principle Agricultural Office,
Jalangi Block, Murshidabad District.
Continuous discourage from block agriculture office has reduced ‘boro’ paddy
cultivation in few areas of Murshidabad District for past three years but more publicity
and alternative crop is necessary.
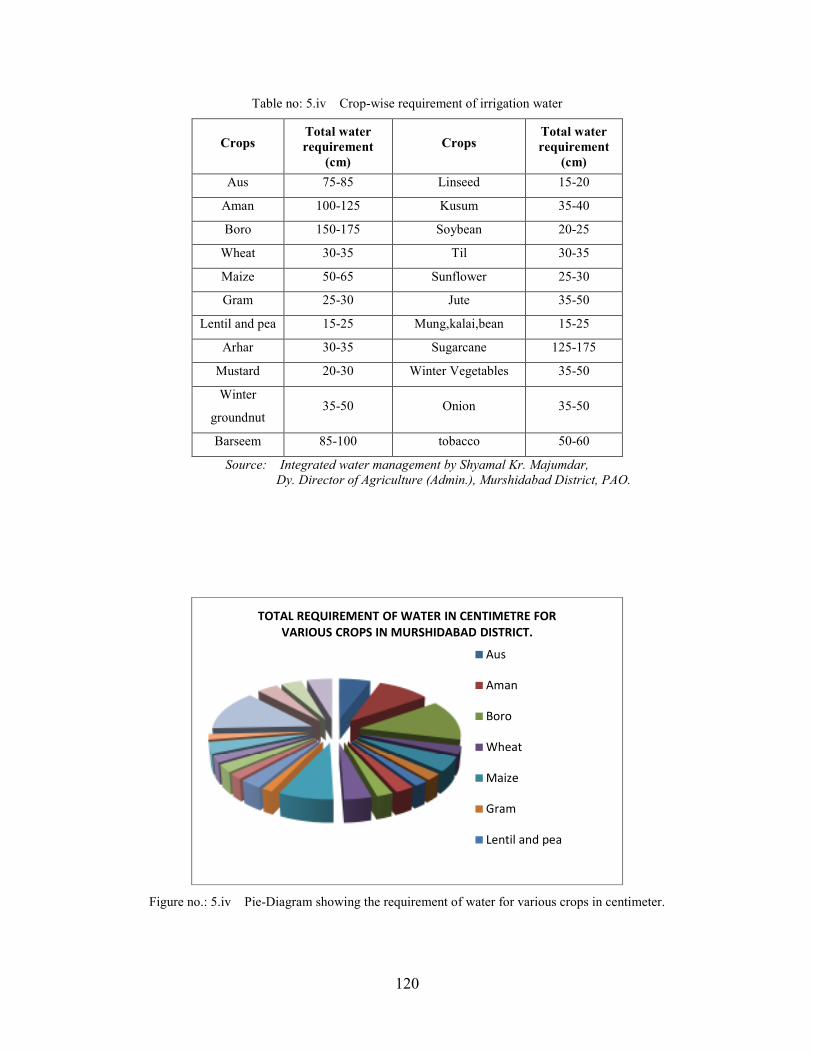
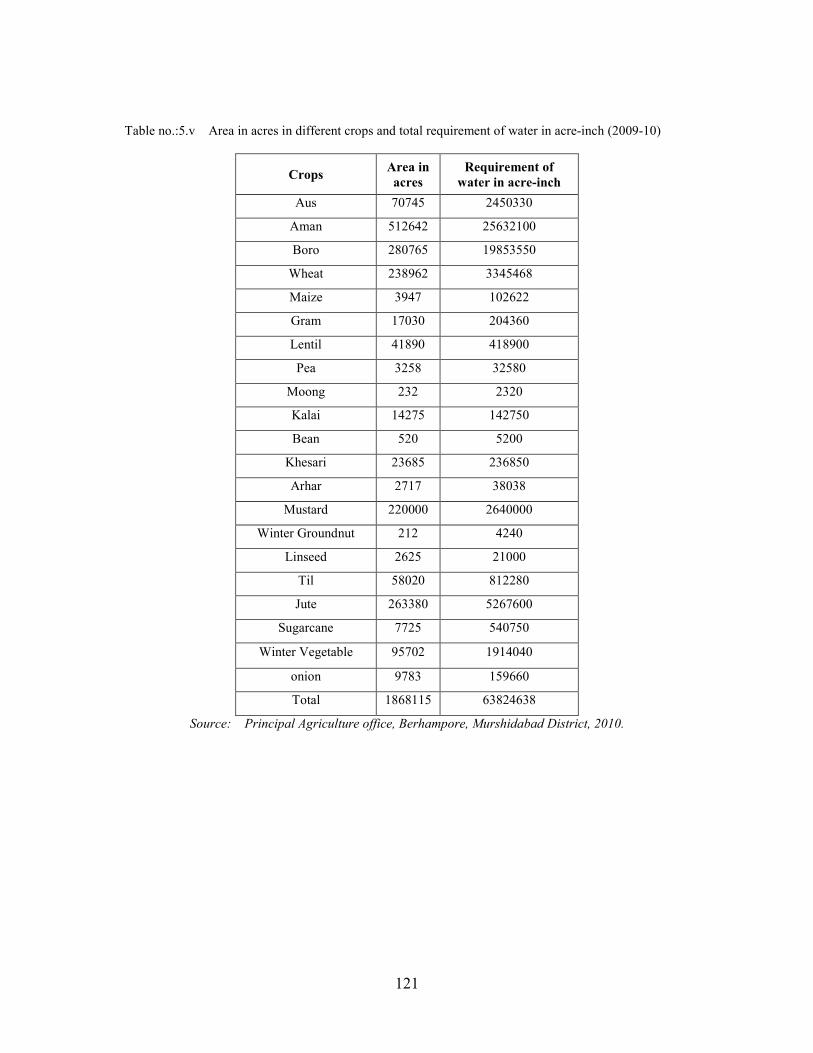
Table no.5 iv below shows the total requirement of water needed for different crops in
centimeters and table no 5.v shows the amount of water required to cultivate each crop
in acre- inch in Murshidabad District. Here water requirement is shown in two units.
Both are used in agriculture department for calculation of crop-water relationship.
‘Boro’ paddy, ‘aman’ paddy, jute and winter vegetables need larger share of water
which must be irrigated with surface water for sustainability of groundwater.
120
Table no: 5.iv Crop-wise requirement of irrigation water
Crops Total water
requirement
(cm)
Crops Total water
requirement
(cm)
Aus 75-85 Linseed 15-20
Aman 100-125 Kusum 35-40
Boro 150-175 Soybean 20-25
Wheat 30-35 Til 30-35
Maize 50-65 Sunflower 25-30
Gram 25-30 Jute 35-50
Lentil and pea 15-25 Mung,kalai,bean 15-25
Arhar 30-35 Sugarcane 125-175
Mustard 20-30 Winter Vegetables 35-50
Winter
groundnut 35-50 Onion 35-50
Barseem 85-100 tobacco 50-60
Source: Integrated water management by Shyamal Kr. Majumdar,
Dy. Director of Agriculture (Admin.), Murshidabad District, PAO.
Figure no.: 5.iv Pie-Diagram showing the requirement of water for various crops in centimeter.
TOTAL REQUIREMENT OF WATER IN CENTIMETRE FOR
VARIOUS CROPS IN MURSHIDABAD DISTRICT.
Aus
Aman
Boro
Wheat
Maize
Gram
Lentil and pea
121
Table no.:5.v Area in acres in different crops and total requirement of water in acre-inch (2009-10)
Crops Area in
acres
Requirement of
water in acre-inch
Aus 70745 2450330
Aman 512642 25632100
Boro 280765 19853550
Wheat 238962 3345468
Maize 3947 102622
Gram 17030 204360
Lentil 41890 418900
Pea 3258 32580
Moong 232 2320
Kalai 14275 142750
Bean 520 5200
Khesari 23685 236850
Arhar 2717 38038
Mustard 220000 2640000
Winter Groundnut 212 4240
Linseed 2625 21000
Til 58020 812280
Jute 263380 5267600
Sugarcane 7725 540750
Winter Vegetable 95702 1914040
onion 9783 159660
Total 1868115 63824638
Source: Principal Agriculture office, Berhampore, Murshidabad District, 2010.
122
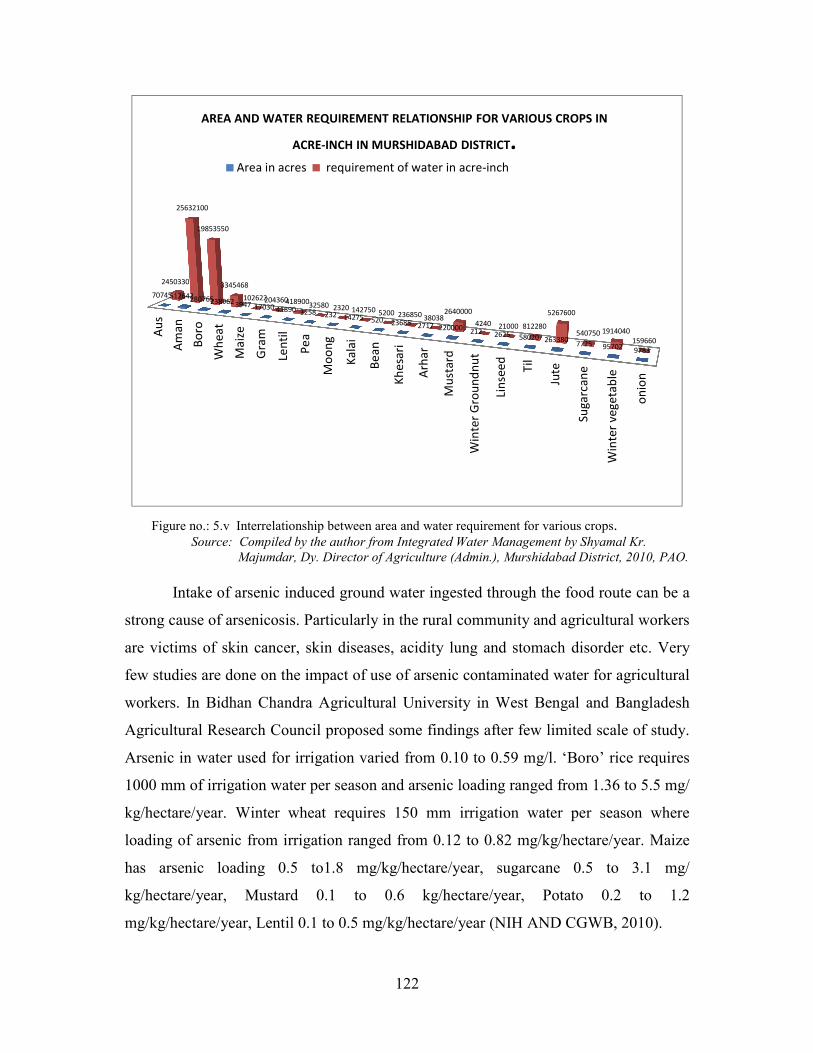
Figure no.: 5.v Interrelationship between area and water requirement for various crops. Source: Compiled by the author from Integrated Water Management by Shyamal Kr.
Majumdar, Dy. Director of Agriculture (Admin.), Murshidabad District, 2010, PAO.
Intake of arsenic induced ground water ingested through the food route can be a
strong cause of arsenicosis. Particularly in the rural community and agricultural workers
are victims of skin cancer, skin diseases, acidity lung and stomach disorder etc. Very
few studies are done on the impact of use of arsenic contaminated water for agricultural
workers. In Bidhan Chandra Agricultural University in West Bengal and Bangladesh
Agricultural Research Council proposed some findings after few limited scale of study.
Arsenic in water used for irrigation varied from 0.10 to 0.59 mg/l. ‘Boro’ rice requires
1000 mm of irrigation water per season and arsenic loading ranged from 1.36 to 5.5 mg/
kg/hectare/year. Winter wheat requires 150 mm irrigation water per season where
loading of arsenic from irrigation ranged from 0.12 to 0.82 mg/kg/hectare/year. Maize
has arsenic loading 0.5 to1.8 mg/kg/hectare/year, sugarcane 0.5 to 3.1 mg/
kg/hectare/year, Mustard 0.1 to 0.6 kg/hectare/year, Potato 0.2 to 1.2
mg/kg/hectare/year, Lentil 0.1 to 0.5 mg/kg/hectare/year (NIH AND CGWB, 2010).
Au
s
Am
an
Bo
ro
Wh
ea
t
Ma
ize
Gra
m
Len
til
Pe
a
Mo
on
g
Ka
lai
Be
an
Kh
esa
ri
Arh
ar
Mu
sta
rd
Win
ter
Gro
un
dn
ut
Lin
see
d
Til
Jute
Su
ga
rca
ne
Win
ter
ve
ge
tab
le
on
ion
707455126422807652389623947 17030 41890 3258 232 14275 520 23685 2717 220000212 2625 58020 263380
7725 957029783
2450330
25632100
19853550
3345468
10262220436041890032580 2320 142750 5200 236850 38038
2640000
4240 21000 812280
5267600
540750 1914040
159660
AREA AND WATER REQUIREMENT RELATIONSHIP FOR VARIOUS CROPS IN
ACRE-INCH IN MURSHIDABAD DISTRICT.Area in acres requirement of water in acre-inch
123
A report in 2Anandabazar Patrika (a renounced Bengali newspaper) dated 16
May 2012; Wednesday made a broad publication about groundwater irrigation by deep
tubewell and ground water status in West Bengal, India. In 2005, an act was passed by
the state government in order to preserve the groundwater resource. The report
explained that it is becoming costly to irrigate small farming land by shallow pumps by
small diesel pumps. Now, Ministry of Irrigation wanted to do another blunder by
allowing the farmers to extract water from more deep tubewells run by electricity to be
installed shortly. If this happens without prior creating groundwater recharge potency;
then no sooner time will come when ‘ground water piracy’ will be reported in West
Bengal also, especially in agriculture oriented district like Murshidabad.
Geologists fear about many other major calamities in West Bengal if the rate of
groundwater irrigation may not be reduced. If more water will be exploited there will be
disequilibrium in underground geological structure. Besides, arsenic contamination and
ground water fluctuation, scientists fear about the fact of earthquake in near future in
this district. A small shock can bring a major disaster to human resources.
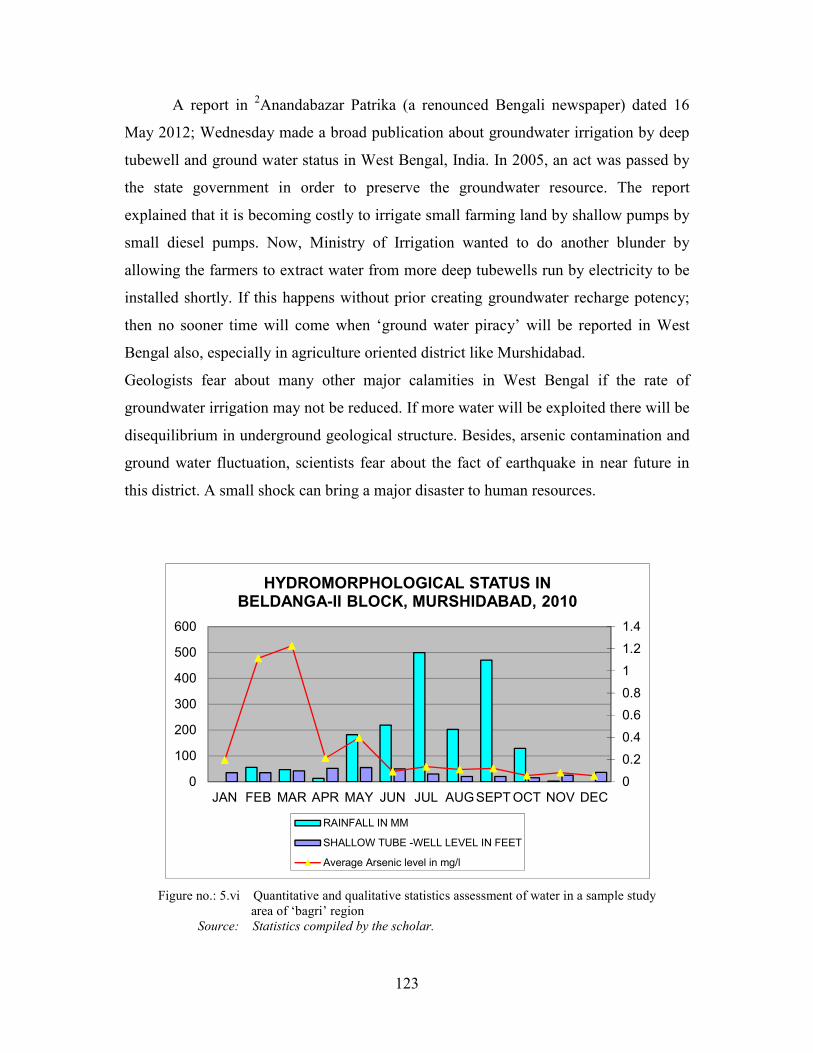
Figure no.: 5.vi Quantitative and qualitative statistics assessment of water in a sample study area of ‘bagri’ region Source: Statistics compiled by the scholar.
0
0.2
0.4
0.6
0.8
1
1.2
1.4
0
100
200
300
400
500
600
JAN FEB MAR APR MAY JUN JUL AUGSEPTOCT NOV DEC
HYDROMORPHOLOGICAL STATUS IN
BELDANGA-II BLOCK, MURSHIDABAD, 2010
RAINFALL IN MM
SHALLOW TUBE -WELL LEVEL IN FEET
Average Arsenic level in mg/l
124
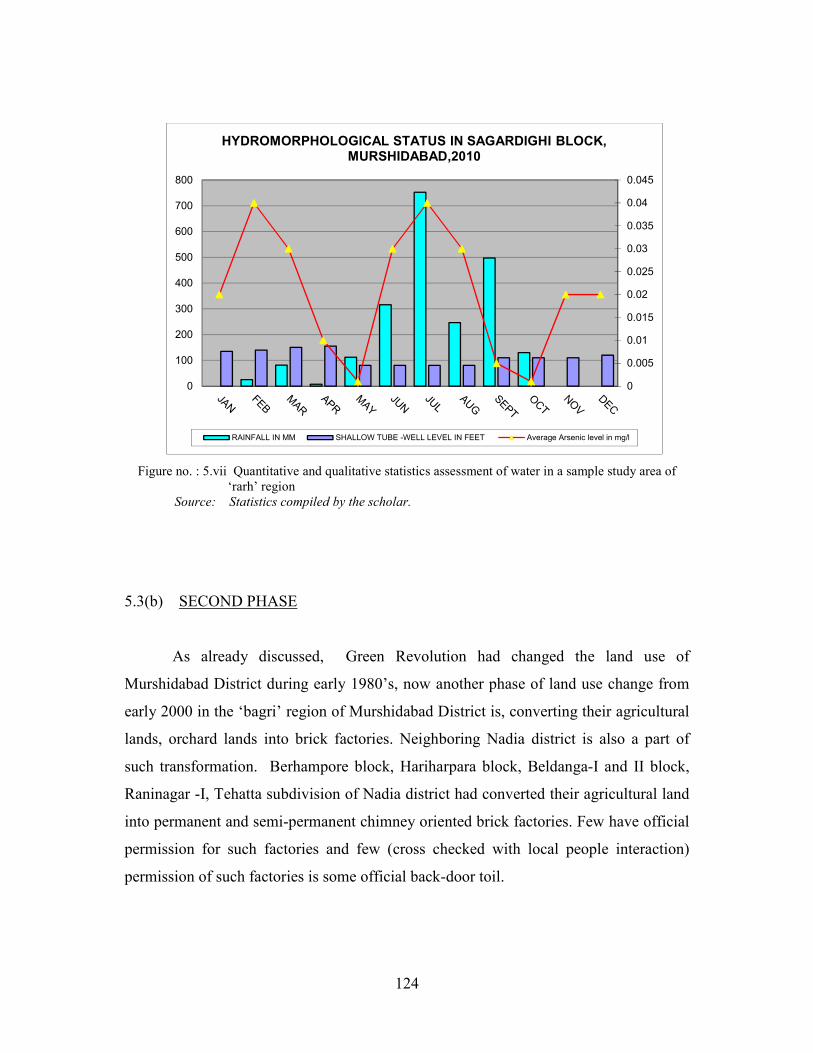
Figure no. : 5.vii Quantitative and qualitative statistics assessment of water in a sample study area of ‘rarh’ region Source: Statistics compiled by the scholar.
5.3(b) SECOND PHASE
As already discussed, Green Revolution had changed the land use of
Murshidabad District during early 1980’s, now another phase of land use change from
early 2000 in the ‘bagri’ region of Murshidabad District is, converting their agricultural
lands, orchard lands into brick factories. Neighboring Nadia district is also a part of
such transformation. Berhampore block, Hariharpara block, Beldanga-I and II block,
Raninagar -I, Tehatta subdivision of Nadia district had converted their agricultural land
into permanent and semi-permanent chimney oriented brick factories. Few have official
permission for such factories and few (cross checked with local people interaction)
permission of such factories is some official back-door toil.
0
0.005
0.01
0.015
0.02
0.025
0.03
0.035
0.04
0.045
0
100
200
300
400
500
600
700
800
HYDROMORPHOLOGICAL STATUS IN SAGARDIGHI BLOCK,
MURSHIDABAD,2010
RAINFALL IN MM SHALLOW TUBE -WELL LEVEL IN FEET Average Arsenic level in mg/l
125
Table no.:5.vi Tentative number of brick factory in Dumkol Block, Murshidabad District.
Name of the place Number of
brick
Factory
Type of chimney
Aminbad-GaraimarG.P.-Dumkol block 2 Permanent
Srikrishnapur-GaraimarG.P.-Dumkol block 1 Permanent
Mohonpur-GaraimarG.P.-Dumkol block 1 Local air chimney
Katakobara- Dumkol block 1 Local air chimney
Ajimganjgola. - Dumkol block 2 Permanent
Bhagirathpur- Dumkol block 5 Permanent+Local air chimney
Dhulauri- Dumkol block 2 Permanent
Jitpur- Dumkol block 5 Permanent
Juginda- Dumkol block 40 Permanent+Local air chimney
Total 57
Source: Field Study by the scholar, 2011.
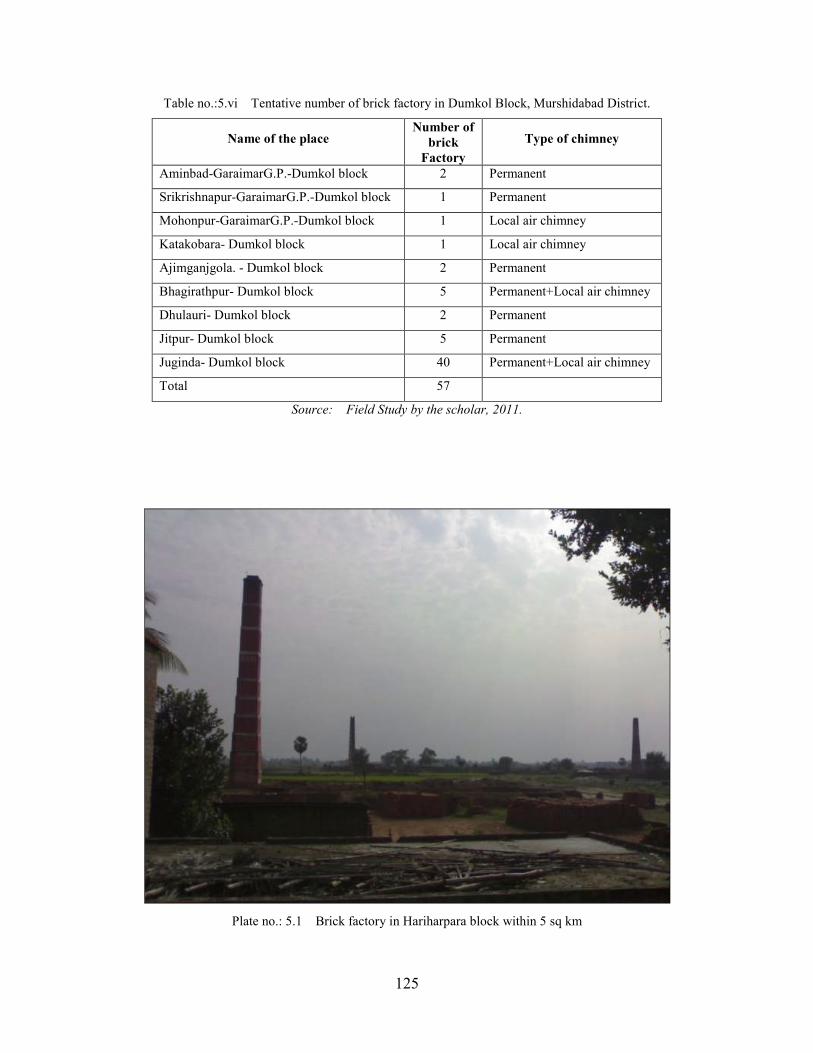
Plate no.: 5.1 Brick factory in Hariharpara block within 5 sq km
126
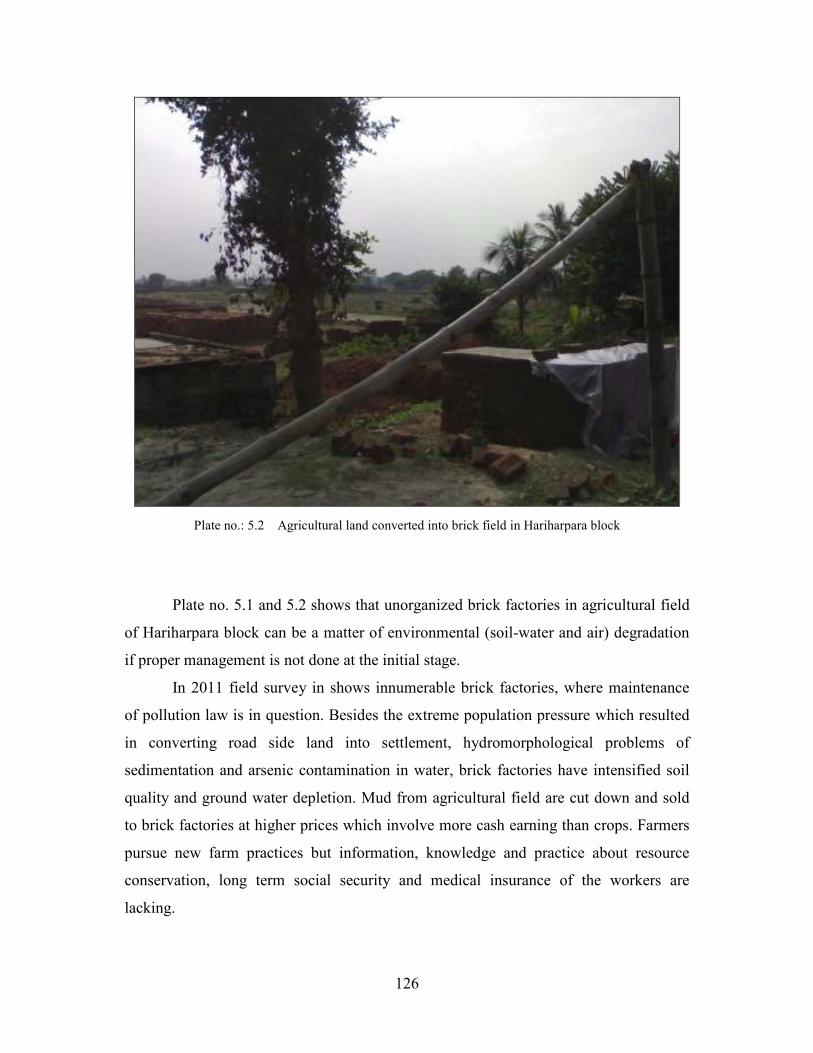
Plate no.: 5.2 Agricultural land converted into brick field in Hariharpara block
Plate no. 5.1 and 5.2 shows that unorganized brick factories in agricultural field
of Hariharpara block can be a matter of environmental (soil-water and air) degradation
if proper management is not done at the initial stage.
In 2011 field survey in shows innumerable brick factories, where maintenance
of pollution law is in question. Besides the extreme population pressure which resulted
in converting road side land into settlement, hydromorphological problems of
sedimentation and arsenic contamination in water, brick factories have intensified soil
quality and ground water depletion. Mud from agricultural field are cut down and sold
to brick factories at higher prices which involve more cash earning than crops. Farmers
pursue new farm practices but information, knowledge and practice about resource
conservation, long term social security and medical insurance of the workers are
lacking.
127
5.4 IS GROUNDWATER IRRIGATION FEASIBLE AT ALL BLOCKS OF MURSHIDABAD? - A DEBATE
Green revolution has brought food security for the time being in Murshidabad
District. Hydrological problem, land resource problem and social problem discussed in
this chapter reveals that another revolution is necessary to hold the dynamic
sustainability in the nature for no revolution is absolute forever.
Ximing Cai, Daene C., Mc Kinney, and Mark W. Rosegrant (2001) had
proposed indicators for measuring sustainability due to irrigation practice, which can
potentially create irreversible problem for economic and environmental status. They
emphasized on frequent data collection about groundwater quality and quantity. The
indicators for sustainability in irrigation water management are-
• Water supply system reliability, reversibility and vulnerability
• Environmental system integrity
• Equity in water sharing and
• Economic acceptability.
Hydrolic relationships provide a physical basis to evaluate water availability and
water quality conditions. The function of crop production connect water, soil and other
input with crop production which is fundamental block for estimating the demand for
and value of water in irrigation,
Accurate estimates of deep percolation, return flows, and their contaminants
concentration, groundwater levels are essential to evaluate the environmental effects of
irrigation. Assessing the damage resulting from the depletion of water over time is also
critical to evaluate the environmental effects of irrigation.
Therefore, if we try to draw a conclusion that whether groundwater is feasible
for irrigation, then a correlation has to be drawn among irrigation, groundwater level
128
and arsenic contamination in ground water for different years in the study area for
detailed analysis.
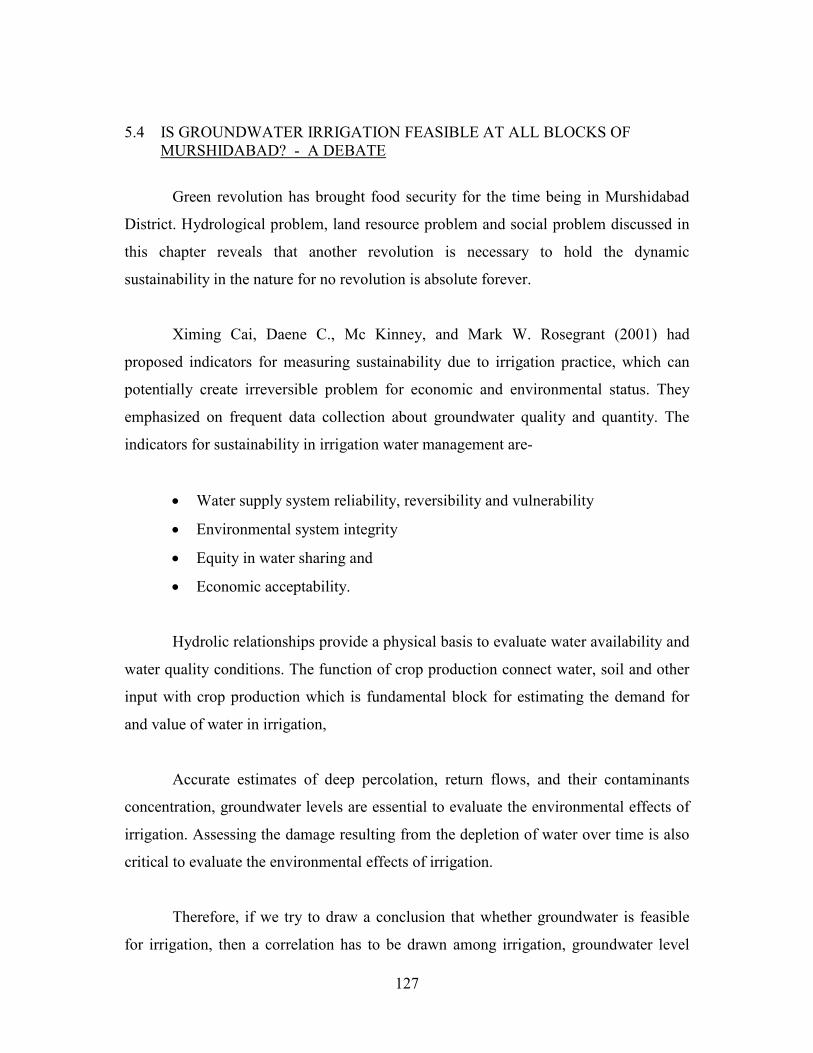
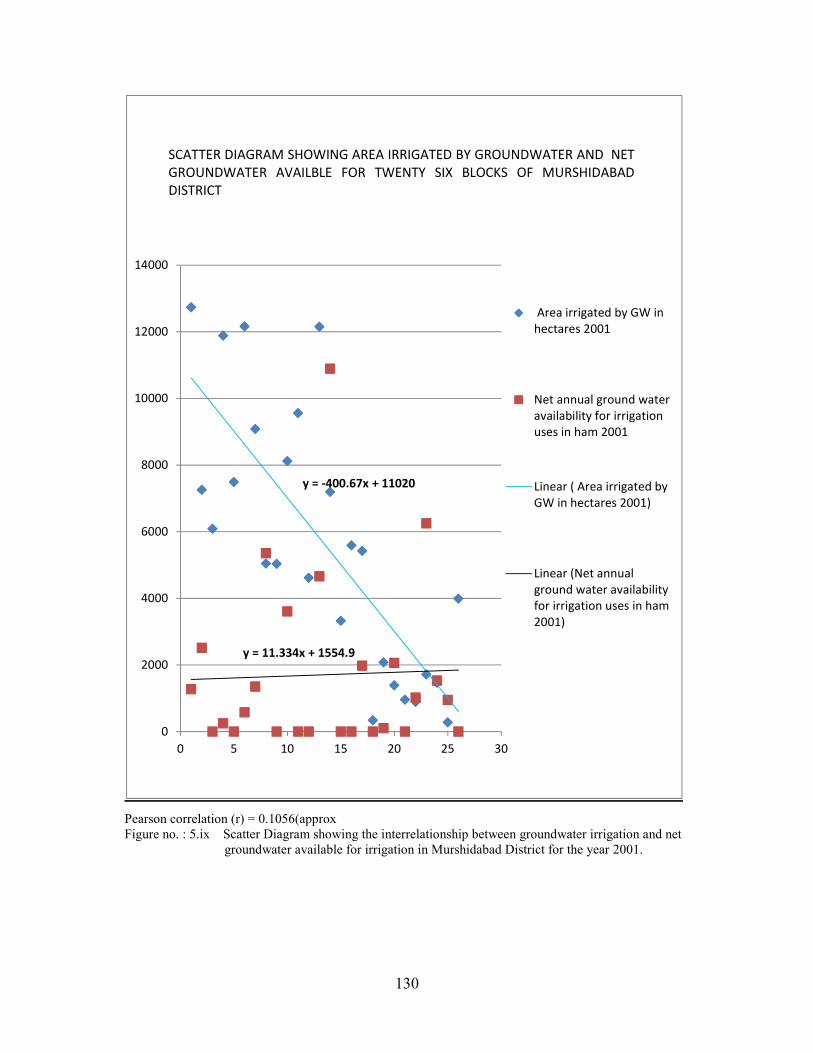
In the scatter diagram figure no. 5.ix, the area under groundwater irrigation was
low in 2001 compared with 2004. The groundwater availability changed distinctly after
2004. Without recharge the groundwater extraction can cause disaster in future. The
projected diagram in figure no.5.viii number shows that if the present rate of extraction
of groundwater continues without proper management then time will soon come when
Murshidabad’s groundwater will be endangered like Purulia, Bankura, Burdwan district
of West Bengal and many districts of Northern and Southern India.
Figure no.: 5.viii Projected decrement of groundwater availability in Murshidabad District. Method: Least square method. Source: computed by scholar.
-4500000
-4000000
-3500000
-3000000
-2500000
-2000000
-1500000
-1000000
-500000
0
500000
1 3 5 7 9 11 13 15 17 19 21 23 25 27
Pe
rce
nta
ge
of
gro
un
dw
ate
r a
va
ila
bil
ity
Blocks
Projected percentage of groundwater availability for irrigation in
Murshidabad District
% of decrement
2001- 2004
Projected % of
decrement 2001-
2016
129
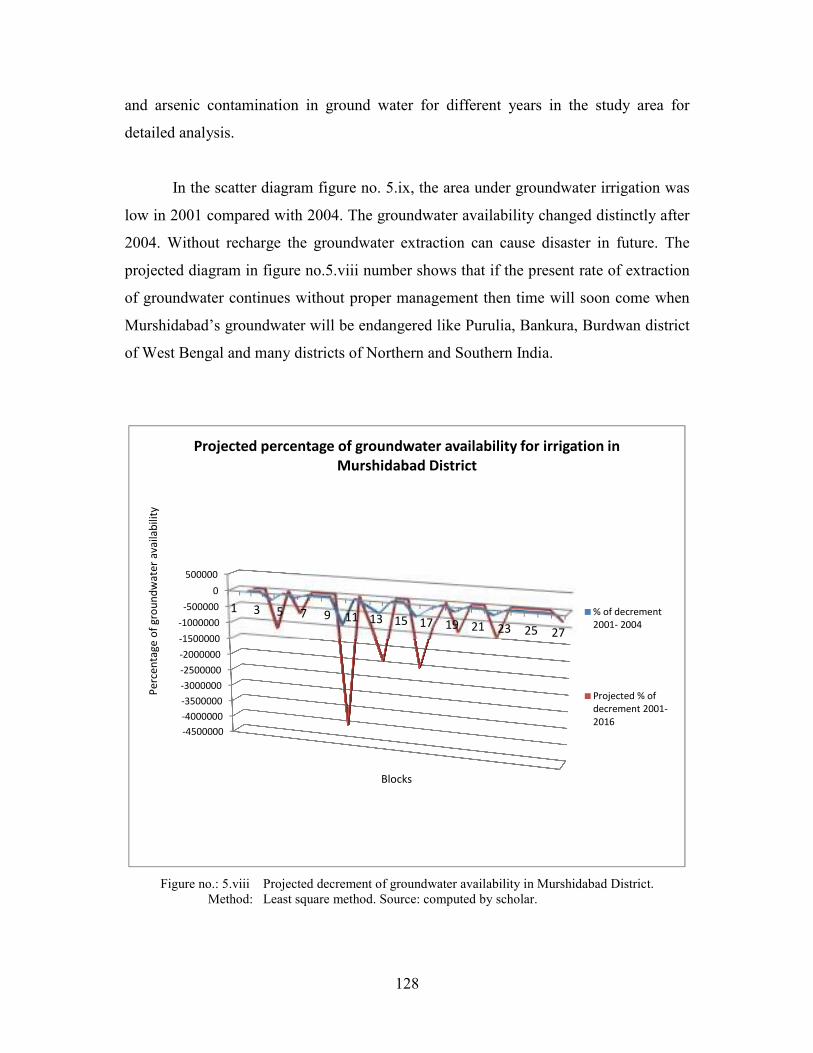
Table no.: 5.vii Projected decrement of availability of groundwater for future irrigation.
Linear regression equation of net annual ground water availability for future irrigation uses ( 2001-2004)
Linear regression equation of projected net annual ground water availability for future irrigation uses ( 2004-2016)
Y=-2E+09x+8E+10 Y=-6E+10x+2E+12
Method: Least squared method. Computed by the scholar.
Pearson r by the raw score method is calculated between area involved in
groundwater irrigation in 2001 and 2004 and net annual ground water availability for
future irrigation uses.
Pearson correlation (r) = 0.1056 (approx) for 2001 and Pearson correlation (r) =
0.18455 (approx) for 2004 shows that the interrelationship is positive but very weak.
The extractions of groundwater for irrigation in some of the blocks are very risky.
Berhampore, Bhagawangola-II, Domkal, Hariharpara Jalangi, Lalgola, Murshidabad-
Jiaganj, Nawda, Raninagar –I and Suti –II blocks had negative net annual ground water
available for irrigation in 2004. The important fact to be noted are most of the blocks
are in the ‘Bagri’ region of the district, the ground water status is in semi-critical
position and all of the blocks suffer from arsenic contamination in ground water. With
every year monsoon, the net groundwater available reach at satisfactory level but lack
of proper conservation and management of the easy available water is at jeopardy
situation in Murshidabad. The ‘rarh’ blocks are in worse condition in few areas. The
groundwater is at semi-critical to critical in position. This situation clearly signifies the
immediate need of groundwater recharge with renovation of natural reservoirs so that
rainwater harvesting can be done.
130
Pearson correlation (r) = 0.1056(approx Figure no. : 5.ix Scatter Diagram showing the interrelationship between groundwater irrigation and net groundwater available for irrigation in Murshidabad District for the year 2001.
y = -400.67x + 11020
y = 11.334x + 1554.9
0
2000
4000
6000
8000
10000
12000
14000
0 5 10 15 20 25 30
Area irrigated by GW in
hectares 2001
Net annual ground water
availability for irrigation
uses in ham 2001
Linear ( Area irrigated by
GW in hectares 2001)
Linear (Net annual
ground water availability
for irrigation uses in ham
2001)
SCATTER DIAGRAM SHOWING AREA IRRIGATED BY GROUNDWATER AND NET
GROUNDWATER AVAILBLE FOR TWENTY SIX BLOCKS OF MURSHIDABAD
DISTRICT

131
Pearson correlation(r) = 0.18455(approx) Figure no.: 5.x Scatter Diagram showing the interrelationship between groundwater irrigation and net groundwater available for irrigation in Murshidabad District for 2004.
y = -389x + 11125
y = 46.049x + 26.092
-10000
-5000
0
5000
10000
15000
20000
0 10 20 30
Area irrigated by GW in
hectares 2004
Net annual ground water
availability for irrigation
uses in ham 2004
Linear ( Area irrigated by
GW in hectares 2004)
Linear (Net annual ground
water availability for
irrigation uses in ham 2004)
SCATTER DIAGRAM SHOWING AREA IRRIGATED BY GROUNDWATER AND NET
GROUNDWATER AVAILBLE FOR TWENTY SIX BLOCKS OF MURSHIDABAD
DISTRICT
132
Table no.: 5.viii Table no.: 5.ix
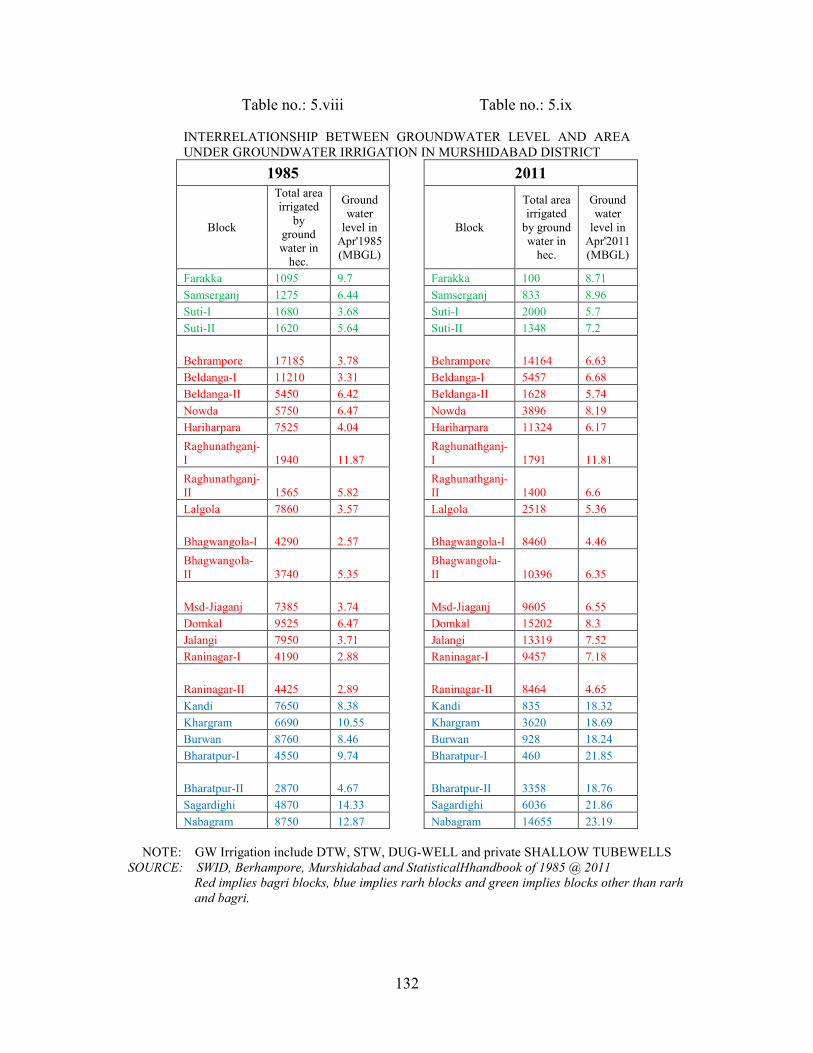
INTERRELATIONSHIP BETWEEN GROUNDWATER LEVEL AND AREA UNDER GROUNDWATER IRRIGATION IN MURSHIDABAD DISTRICT
1985
2011
Block
Total area irrigated
by ground water in
hec.
Ground water
level in Apr'1985 (MBGL)
Block
Total area irrigated
by ground water in
hec.
Ground water
level in Apr'2011 (MBGL)
Farakka 1095 9.7 Farakka 100 8.71
Samserganj 1275 6.44 Samserganj 833 8.96
Suti-I 1680 3.68 Suti-I 2000 5.7
Suti-II 1620 5.64 Suti-II 1348 7.2
Behrampore 17185 3.78 Behrampore 14164 6.63
Beldanga-I 11210 3.31 Beldanga-I 5457 6.68
Beldanga-II 5450 6.42 Beldanga-II 1628 5.74
Nowda 5750 6.47 Nowda 3896 8.19
Hariharpara 7525 4.04 Hariharpara 11324 6.17
Raghunathganj-I 1940 11.87
Raghunathganj-I 1791 11.81
Raghunathganj-II 1565 5.82
Raghunathganj-II 1400 6.6
Lalgola 7860 3.57 Lalgola 2518 5.36
Bhagwangola-I 4290 2.57 Bhagwangola-I 8460 4.46
Bhagwangola-II 3740 5.35
Bhagwangola-II 10396 6.35
Msd-Jiaganj 7385 3.74 Msd-Jiaganj 9605 6.55
Domkal 9525 6.47 Domkal 15202 8.3
Jalangi 7950 3.71 Jalangi 13319 7.52
Raninagar-I 4190 2.88 Raninagar-I 9457 7.18
Raninagar-II 4425 2.89 Raninagar-II 8464 4.65
Kandi 7650 8.38 Kandi 835 18.32
Khargram 6690 10.55 Khargram 3620 18.69
Burwan 8760 8.46 Burwan 928 18.24
Bharatpur-I 4550 9.74 Bharatpur-I 460 21.85
Bharatpur-II 2870 4.67 Bharatpur-II 3358 18.76
Sagardighi 4870 14.33 Sagardighi 6036 21.86
Nabagram 8750 12.87 Nabagram 14655 23.19
NOTE: GW Irrigation include DTW, STW, DUG-WELL and private SHALLOW TUBEWELLS
SOURCE: SWID, Berhampore, Murshidabad and StatisticalHhandbook of 1985 @ 2011
Red implies bagri blocks, blue implies rarh blocks and green implies blocks other than rarh
and bagri.
133
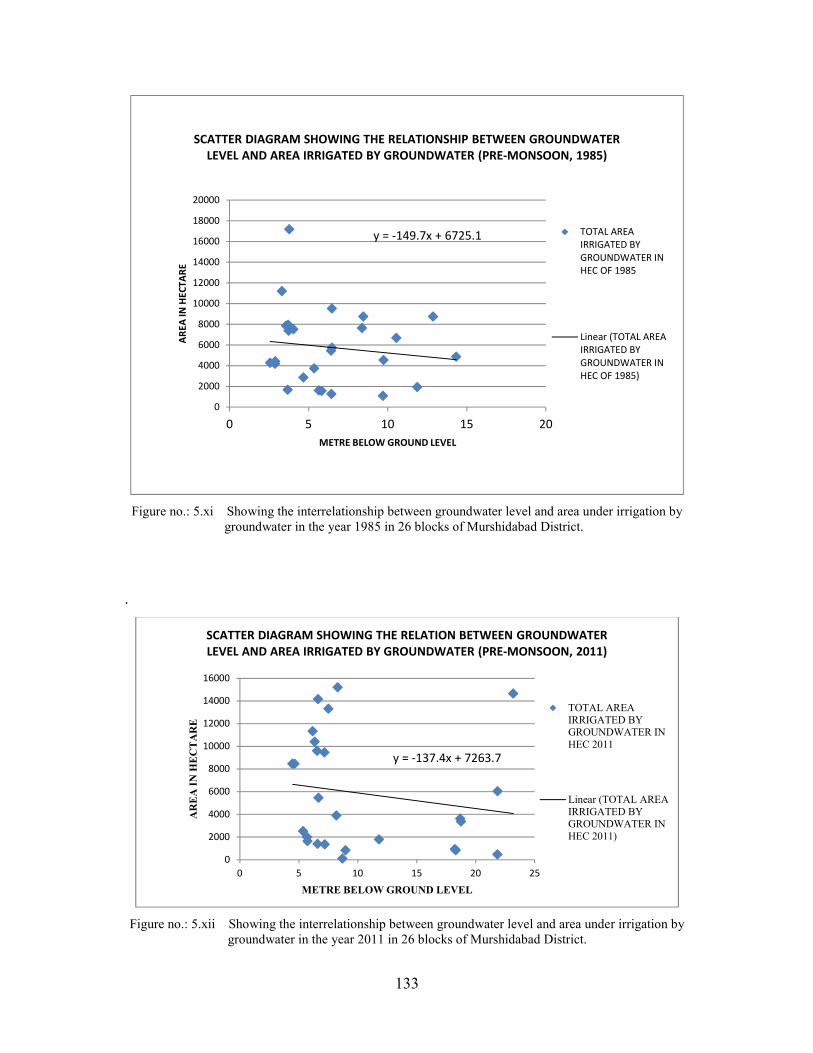
Figure no.: 5.xi Showing the interrelationship between groundwater level and area under irrigation by groundwater in the year 1985 in 26 blocks of Murshidabad District.
.
Figure no.: 5.xii Showing the interrelationship between groundwater level and area under irrigation by groundwater in the year 2011 in 26 blocks of Murshidabad District.
y = -149.7x + 6725.1
0
2000
4000
6000
8000
10000
12000
14000
16000
18000
20000
0 5 10 15 20
AR
EA
IN
HE
CT
AR
E
METRE BELOW GROUND LEVEL
SCATTER DIAGRAM SHOWING THE RELATIONSHIP BETWEEN GROUNDWATER
LEVEL AND AREA IRRIGATED BY GROUNDWATER (PRE-MONSOON, 1985)
TOTAL AREA
IRRIGATED BY
GROUNDWATER IN
HEC OF 1985
Linear (TOTAL AREA
IRRIGATED BY
GROUNDWATER IN
HEC OF 1985)
y = -137.4x + 7263.7
0
2000
4000
6000
8000
10000
12000
14000
16000
0 5 10 15 20 25
AREA IN H
ECTARE
METRE BELOW GROUND LEVEL
SCATTER DIAGRAM SHOWING THE RELATION BETWEEN GROUNDWATER
LEVEL AND AREA IRRIGATED BY GROUNDWATER (PRE-MONSOON, 2011)
TOTAL AREAIRRIGATED BYGROUNDWATER INHEC 2011
Linear (TOTAL AREAIRRIGATED BYGROUNDWATER INHEC 2011)
134
The ground water irrigation has increased in the post-green revolution era. In the
scatter diagram figure no. 5.xi in 1985 almost all blocks started the new technology of
groundwater irrigation with shallow tubewells and deep tubewells but in scatter diagram
figure no 5.xii in 2011 blocks of bagri’ region still totally depend on groundwater
irrigation.
In the ‘rarh’ blocks canal and ponds have been renovated but in the ‘bagri’
region the extraction of groundwater is still continuing without conserving
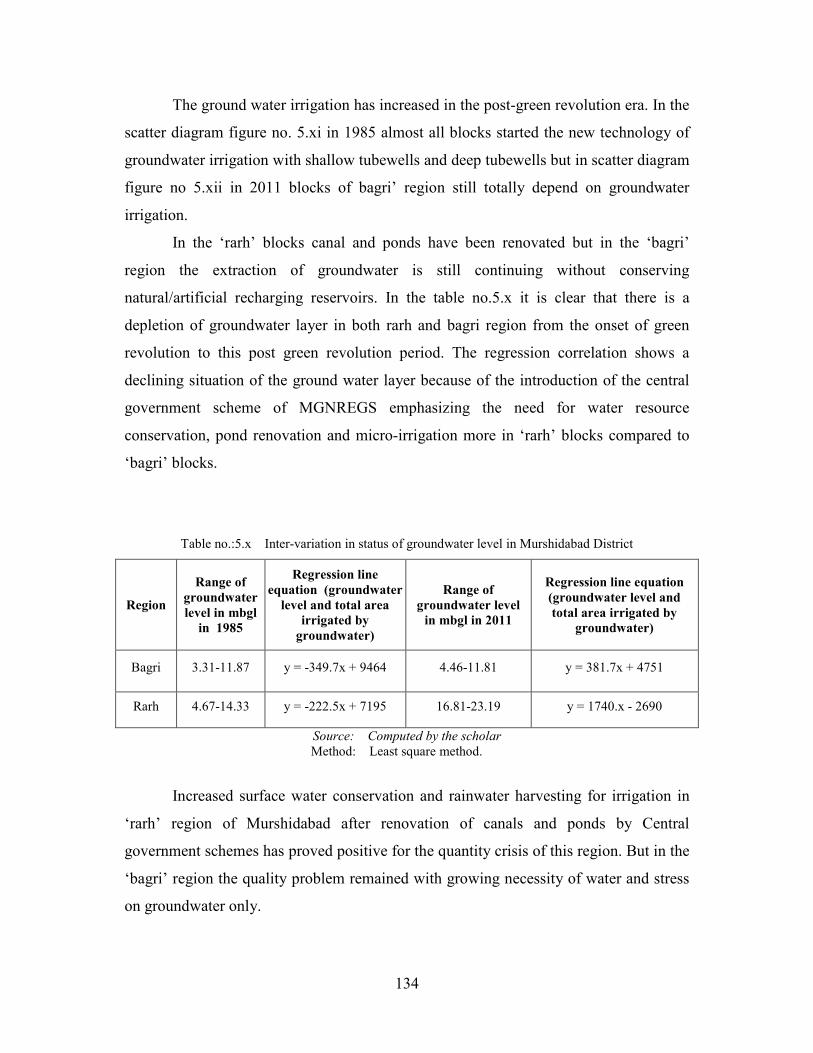
natural/artificial recharging reservoirs. In the table no.5.x it is clear that there is a
depletion of groundwater layer in both rarh and bagri region from the onset of green
revolution to this post green revolution period. The regression correlation shows a
declining situation of the ground water layer because of the introduction of the central
government scheme of MGNREGS emphasizing the need for water resource
conservation, pond renovation and micro-irrigation more in ‘rarh’ blocks compared to
‘bagri’ blocks.
Table no.:5.x Inter-variation in status of groundwater level in Murshidabad District
Region
Range of
groundwater
level in mbgl
in 1985
Regression line
equation (groundwater
level and total area
irrigated by
groundwater)
Range of
groundwater level
in mbgl in 2011
Regression line equation
(groundwater level and
total area irrigated by
groundwater)
Bagri 3.31-11.87 y = -349.7x + 9464 4.46-11.81 y = 381.7x + 4751
Rarh 4.67-14.33 y = -222.5x + 7195 16.81-23.19 y = 1740.x - 2690
Source: Computed by the scholar
Method: Least square method.
Increased surface water conservation and rainwater harvesting for irrigation in
‘rarh’ region of Murshidabad after renovation of canals and ponds by Central
government schemes has proved positive for the quantity crisis of this region. But in the
‘bagri’ region the quality problem remained with growing necessity of water and stress
on groundwater only.
135
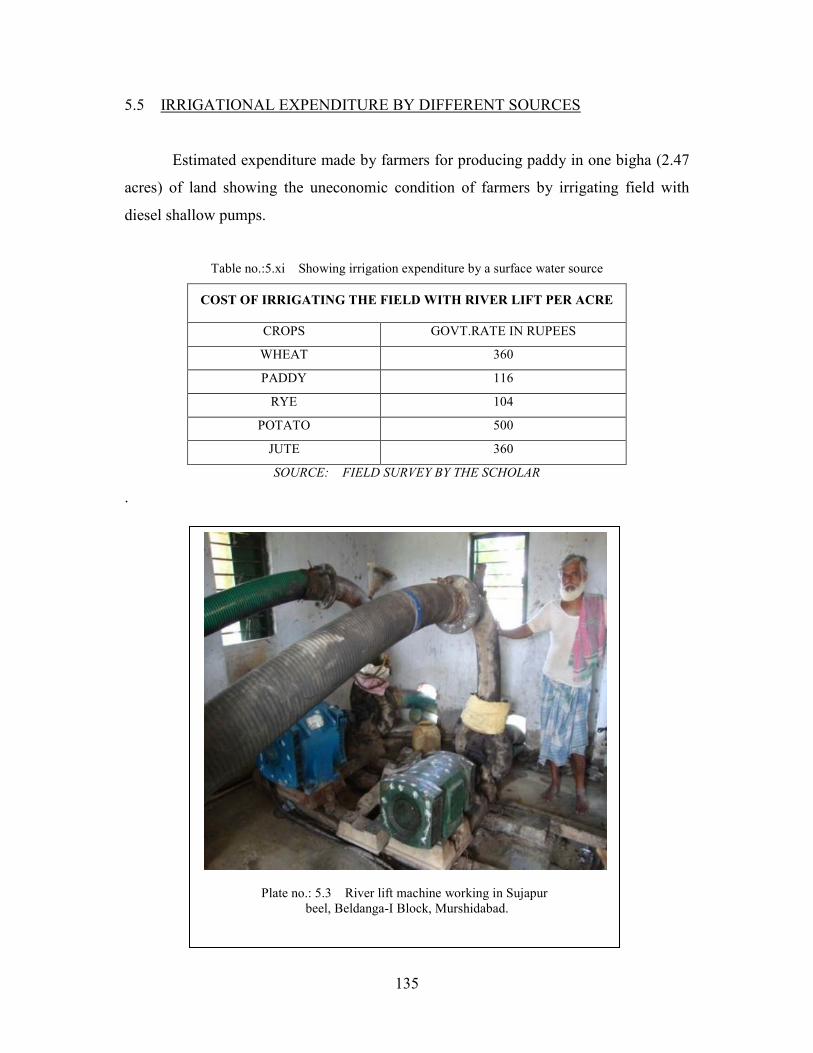
5.5 IRRIGATIONAL EXPENDITURE BY DIFFERENT SOURCES
Estimated expenditure made by farmers for producing paddy in one bigha (2.47
acres) of land showing the uneconomic condition of farmers by irrigating field with
diesel shallow pumps.
Table no.:5.xi Showing irrigation expenditure by a surface water source
COST OF IRRIGATING THE FIELD WITH RIVER LIFT PER ACRE
CROPS GOVT.RATE IN RUPEES
WHEAT 360
PADDY 116
RYE 104
POTATO 500
JUTE 360
SOURCE: FIELD SURVEY BY THE SCHOLAR
.
Plate no.: 5.3 River lift machine working in Sujapur beel, Beldanga-I Block, Murshidabad.
136
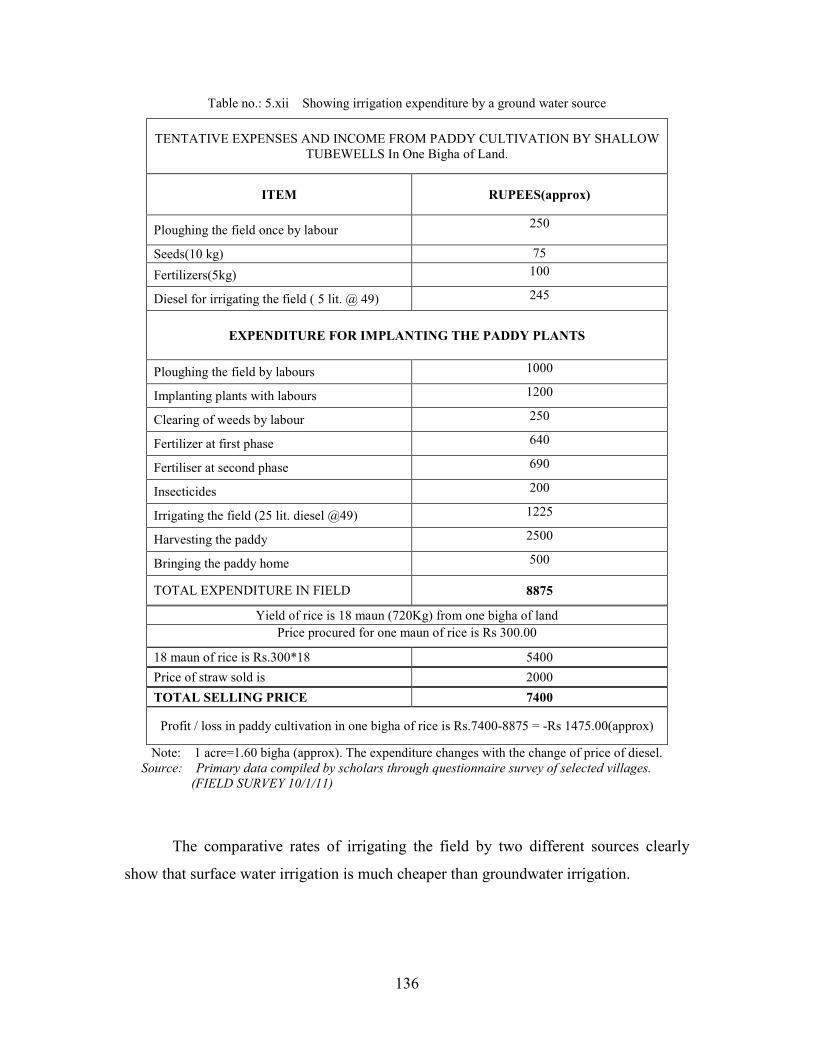
Table no.: 5.xii Showing irrigation expenditure by a ground water source
TENTATIVE EXPENSES AND INCOME FROM PADDY CULTIVATION BY SHALLOW TUBEWELLS In One Bigha of Land.
ITEM RUPEES(approx)
Ploughing the field once by labour 250
Seeds(10 kg) 75
Fertilizers(5kg) 100
Diesel for irrigating the field ( 5 lit. @ 49) 245
EXPENDITURE FOR IMPLANTING THE PADDY PLANTS
Ploughing the field by labours 1000
Implanting plants with labours 1200
Clearing of weeds by labour 250
Fertilizer at first phase 640
Fertiliser at second phase 690
Insecticides 200
Irrigating the field (25 lit. diesel @49) 1225
Harvesting the paddy 2500
Bringing the paddy home 500
TOTAL EXPENDITURE IN FIELD 8875
Yield of rice is 18 maun (720Kg) from one bigha of land
Price procured for one maun of rice is Rs 300.00
18 maun of rice is Rs.300*18 5400
Price of straw sold is 2000
TOTAL SELLING PRICE 7400
Profit / loss in paddy cultivation in one bigha of rice is Rs.7400-8875 = -Rs 1475.00(approx)
Note: 1 acre=1.60 bigha (approx). The expenditure changes with the change of price of diesel. Source: Primary data compiled by scholars through questionnaire survey of selected villages.
(FIELD SURVEY 10/1/11)
The comparative rates of irrigating the field by two different sources clearly
show that surface water irrigation is much cheaper than groundwater irrigation.
137
5.6 MICRO IRRIGATION AND WATER RESOURCES MANAGEMENT PROGRAMMS
Before 1990’s micro-water management specially includes various irrigational
schemes. A. Mitra has highlighted various irrigational schemes for the district in
Gazateer in India Census (1979). From 1965-66 to 1967-68 number of irrigation
schemes sanctioned was 58 tube wells (3 inches diameter), 916 small irrigation
schemes, 203 deep tube well schemes. 27 river lift schemes was sanction during 1965-
1969. From 1971-72 and 1975-76, 264 and 368 deep tube wells were sunk in ‘Bagri’
region i.e. the left hand of Bhagirathi River alone. In 1965-69, river lift alone had
benefited 243.2 hectares during Kharif season and 237.2 hectares during Rabi season. In
the year 1968-69 about 3135.6 hectares of land was benefited during the Kharif season
and during the Rabi season 4236 hectares of land was benefited through the various
irrigational schemes. From 1995-96 the Rural Infrastructural Development Fund (RIDF)
under the aegis of NABARD with corpus of rupees two thousand crores (Rs. 2000) had
started various schemes which provide loans to the State Government for financing
rural infrastructure projects including irrigating soil conservation and watershed
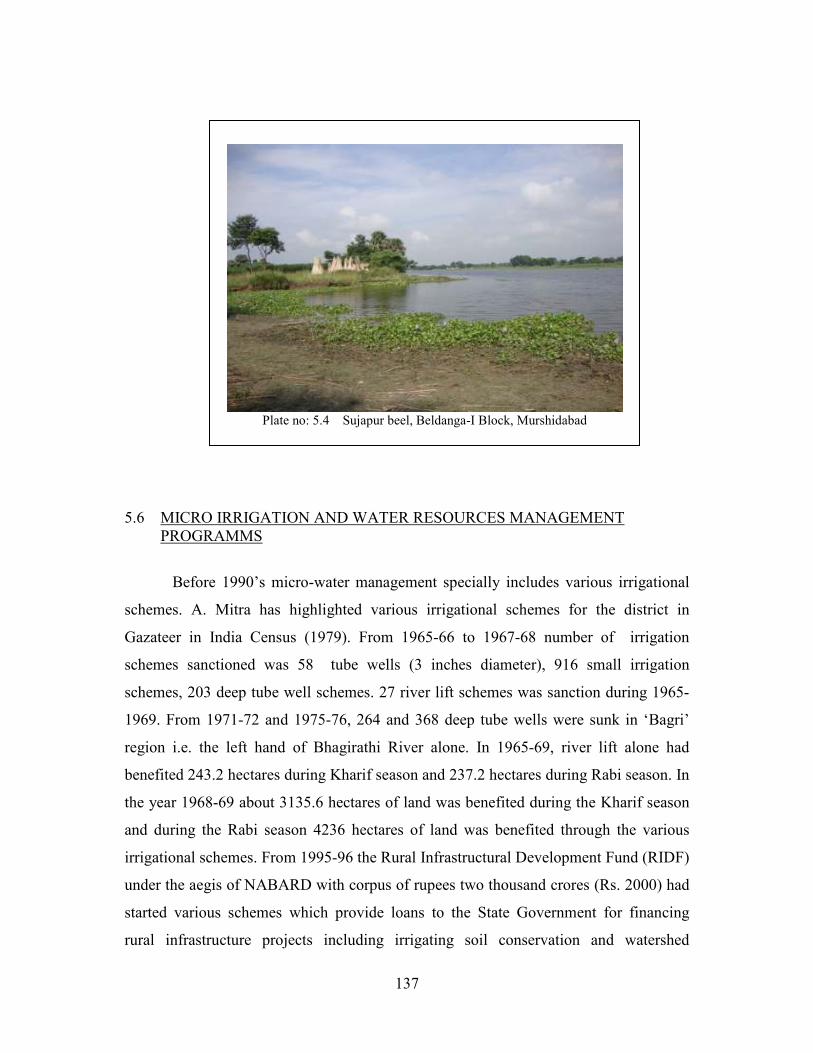
Plate no: 5.4 Sujapur beel, Beldanga-I Block, Murshidabad
138
management. Commercial banks were asked to deposit the shortfall of their target of
priority sector lending 18% to agriculture with the RIDF under the aegis of NABARD.
3From RIDF VII onwards, interest rate on Banks’ contributions to RIDF was linked
inversely to the extent of their shortfall in agricultural lending against the target of 18%,
to deter banks from considering RIDF contribution as an easier alternative to their own
lending. NABARD retains a margin of 0.5% and the balance interest spread earned is
credited to the watershed management fund. (Bhalla, G.S.; 2008, pp: 133).
All the major and medium sector water resource management is funded by either
State or Central Government. Institutional finance is available for the minor irrigation
sectors. In Murshidabad major problem between the potential for micro-water
management programmes and their utilization is the gap between potential and
utilization.
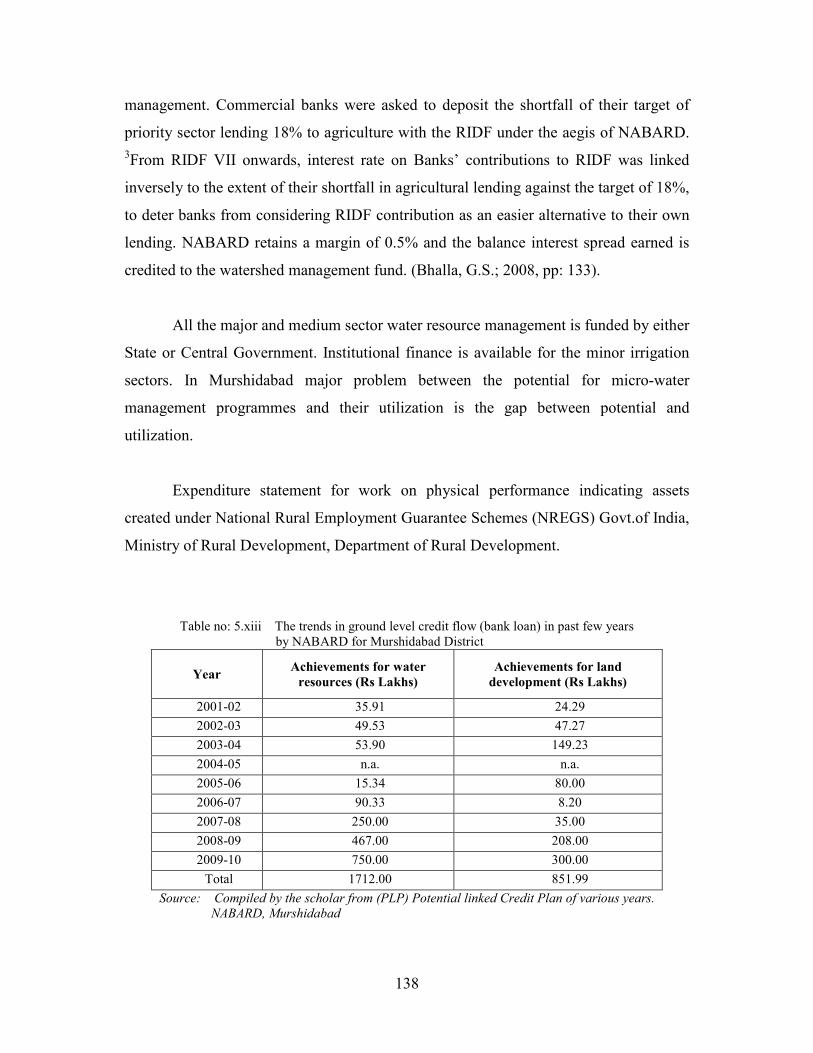
Expenditure statement for work on physical performance indicating assets
created under National Rural Employment Guarantee Schemes (NREGS) Govt.of India,
Ministry of Rural Development, Department of Rural Development.
Table no: 5.xiii The trends in ground level credit flow (bank loan) in past few years by NABARD for Murshidabad District
Year Achievements for water
resources (Rs Lakhs)
Achievements for land
development (Rs Lakhs)
2001-02 35.91 24.29
2002-03 49.53 47.27
2003-04 53.90 149.23
2004-05 n.a. n.a.
2005-06 15.34 80.00
2006-07 90.33 8.20
2007-08 250.00 35.00
2008-09 467.00 208.00
2009-10 750.00 300.00
Total 1712.00 851.99
Source: Compiled by the scholar from (PLP) Potential linked Credit Plan of various years.
NABARD, Murshidabad
139
Soil and water conservation measures taken up under Watershed Development
projects by Govt. of West Bengal are:
• Area development-cultivable wastelands are developed to arable lands
through bundings leveling, bench terracing etc.
• Water resource development- excavation/re-excavation of farm ponds, water
harvesting structure, and surface water bodies etc.
• Removal drainage congestion- To remove inundation in the coastal saline
zone during rainy season to allow cultivation of HYV seeds instead of local.
• Plantation of mango, guava, lemon and forest species saplings on wasteland.
The National Watershed Development Project in rain fed areas (NWDPRA) is a
major thrust programme launched by the department of agriculture and co-operation,
Govt. of India doing the 8th five years plan where 6 nos. of NWDPRA schemes were
initially started in ‘rarh’ region of Murshidabad.
Type of activities taken up for watershed development projects under National
Watershed Development Project for Rainfed Areas (NWDPRA) and River Valley
Project & Flood Prone River (RVP and FPR) are:
• Formation of self help group/user groups.
• Formation of watershed association.
• Formation of watershed committee.
• Registration of watershed association under the societies registration act.
• Opening of bank account of watershed association.
• Capacity building of watershed development team, SHGs/UGs and
watershed committee members.
• Opening of Bank account of SHGs/UGs.
• Transfer of project fund to the bank account of watershed association.
• Preparation of annual action plan/ strategic plan.
• Execution of schemes by the watershed association on Natural Resource
Management, Farm Production System, Livelihood Support System etc.
140
• Progress towards implementation of Integrated Watershed Management
Programme (IWMP) under SALNA has been formed on 1st January, 2010
under active consideration of State Government.
o Other developmental programmes of both the State and Central Govt. of
India, are Community Development Plans (CDP), Intensive Agriculture
development Agencies (IADP), High Yielding Varieties Programme
(HYVP), Small Farmers Development Agencies (SFDA), Marginal Farmers
Agricultural Labour Development Agencies (MFAL), Intensive Tribal
Development Programme (ITDP), Food for work, Integrated National Pest
Management, Integrated Nutrient Management and Mahatma Gandhi
National Rural Employment Guarantee Scheme (MGNREGA)
We are trying to discuss about Water Resource Development- excavation/re-
excavation of farm ponds, water harvesting structure, and surface water bodies etc. in
Murshidabad district for last few years.
5.7 MGNREGA AS A HELPING TOOL FOR MICROLEVEL WATER MANAGEMENT IN MURSHIDABAD DISTRICT
The Mahatma Gandhi National Rural Employment Guarantee Act (MGNREGA)
is the programme of Central Government with the assistant of the State Government for
the execution of the act. It directly touches lives of the poor and promotes inclusive
growth. The act aims at enhancing livelihood security of household in rural areas of the
country by providing at least one hundred days of guaranteed wage employment in a
financial year to every household whose adult members volunteer to do unskilled
manual work.
The act came into force on February 2, 2006 and implemented in a phased
manner. The auxiliary objective is strengthening rural resource management through
needs such as water conservation, land development, minor and micro irrigation, soil
conservation etc. The process is meant for strengthening the grass root processes of
democracy and infusing transparency and accountability in governance.
141
As per schedule of the act, the focus of MGNREGA shall be on the following
works,
1) Water conservation and water harvesting
2) Drought proofing, including afforestation and tree plantation
3) Irrigation canals, including micro and minor irrigation works.
4) Provision of irrigation facility to land owned by household belonging to
Sc/St, or to land of the beneficiaries of land reforms, or to land of the
beneficiaries under Indira Awas Yojana.
5) Renovation of traditional water bodies, including desilting of tanks.
6) Land development.
7) Flood control and protection works, including drainage in water logged
areas.
8) Rural connectivity to provide all weather access. The construction of roads
may include culvert where necessary, and within the village area may be
taken up along with drains.
9) Any work that may be notified by the Central Government in construction
with State Government.
In terms of implementation priority, the programme mandates that maximum
emphasis should be with a view to create Knowledge Resource Centers to enables
citizens access to information and articulation of rights as well as to strengthen the
infrastructure of Gram Panchayat and Block towards more transparent processes,
construction of Bharat Nirman Rajiv Gandhi Sewa Kendras (RGSK) has been notified.
The BNRGSK will be used for mobilization of MGNREGA workers, awareness
generation workshops, training and capacity building, convergence exercises.
MGNREGA records will be made available for inspection in BNRGSK. Training
material, booklets, primers and self- learning material regarding MGNREGA and other
development programmes will be provided in BNRGSK. This programme will also be
used for mobilization of self- help group, training and skill development activities under
the National Rural Livelihoods Mission. The BNRGSK will be fitted on IT (information
technology) equipments.
142
Therefore, in all respect both the local rural skilled and unskilled labour is
required for the development of the locality.
The ground truth is very few grampanchayat have done the work of mass
communication about the benefit of MGNREGS which is for the people and by the
people at micro-level.
5.7 (a) CASE STUDY IN THE ‘BAGRI’ REGION
Kashipur mouza is situated in Kashipur Grampanchayat, Beldanga –II block,
District Murshidabad, West Bengal, India. This mouza is a water abundant area. Before
the advent of green revolution periods the area is described as inundated area during
monsoon. This helped in renewal of soil fertility by depositing fertile silt and hence
bumper crop production without irrigation was possible just after monsoon. Jute
fermentation is an essential job for farmers immediately after monsoon rain. Beels,
Khals were often filled with water to help in this task. But for past few years people are
helpless and they extracted ground water to fill up their nearby ponds or khals for
fermenting jute plants due to rainfall vagaries. Almost in all purposes subsurface water
are used by local people, such as irrigation, drinking, domestic purpose etc. After green
revolution people used to cultivate ‘boro’ rice but now the cropping pattern has shifted
to wheat cultivation in winter in few areas. The yield per hectar has diminished. Senior
farmers quote that they had extracted 1maun (40 kg.) of rice from each ‘katha’(unit of
land) initially with chemical fertilizer use. But now it has reduced to ~0.9 maun per
‘katha’. They also said that shallow water bodies, ponds used to have water throughout
the year. Farmers think that something had happened that now a days they experiences
drying of ponds, water level fluctuations, and reduction of yield per hectare (recorded in
video of field survey). Uncontrolled flooding system of irrigation and ignorance and
lack of knowledge about groundwater flow in aquifer and its recharge increases the
arsenic level in water and therefore, researchers suspect to enter into the plants tissues
discussed in the earlier part of this chapter. The oxidation- reduction process and heavy
content of iron boost up the problem of arsenic. The people have hardly any way to
143
avoid the dangerous health effects caused due to arsenic contamination in groundwater.
They are engaged in hand to mouth arrangement and have least awareness and instance
to think on such issues. Pond irrigation or surface water irrigation is a myth to them.
Lack of education in modern agricultural method has made them ignorant, dependent on
governmental scientifically inventory schemes and on their fate. Lack of proper
management has made the mouzas totally dependent on groundwater irrigation.
Panchayat is running number of schemes on micro irrigation, water conservation and
management. The depth of the pond has not increased as a result shallow pond does not
have water holding capacity during the summer season. An NGO’s worker in the
Grampanchayat of Hariharpara proposed that if they are given contact to maintain the
pond and renovate them, the work will be more systematic and many literate jobless
will be engaged on the government’s aid.
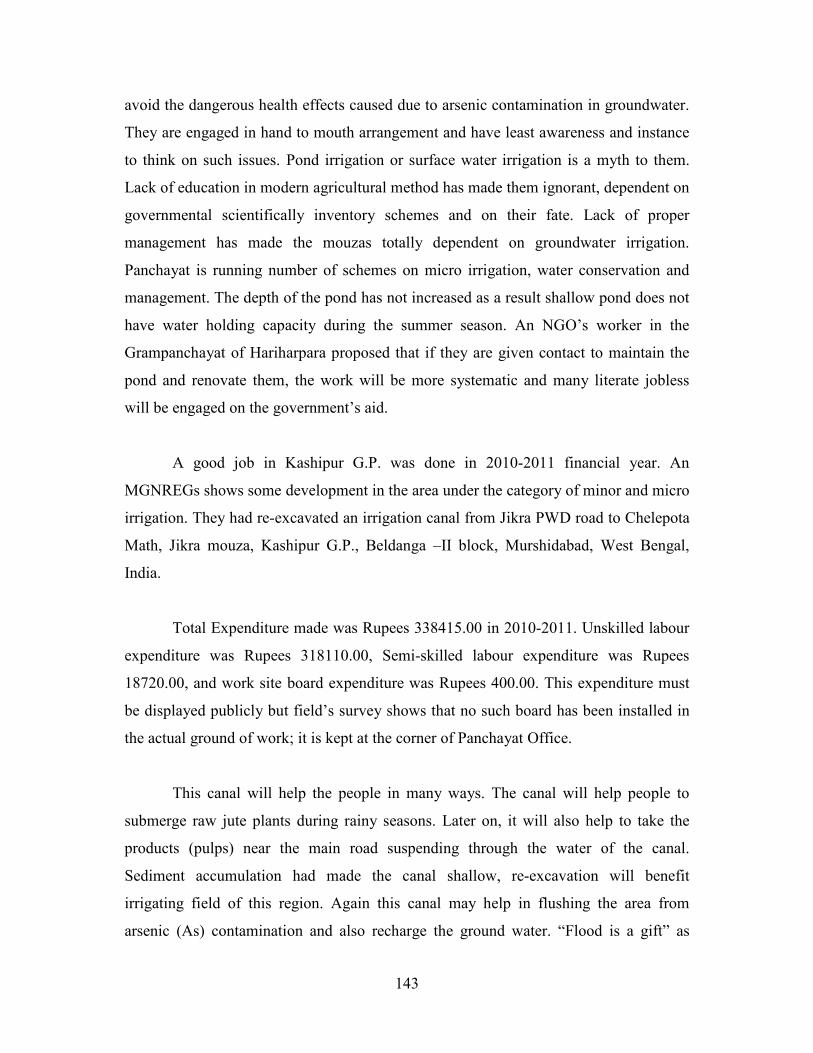
A good job in Kashipur G.P. was done in 2010-2011 financial year. An
MGNREGs shows some development in the area under the category of minor and micro
irrigation. They had re-excavated an irrigation canal from Jikra PWD road to Chelepota
Math, Jikra mouza, Kashipur G.P., Beldanga –II block, Murshidabad, West Bengal,
India.
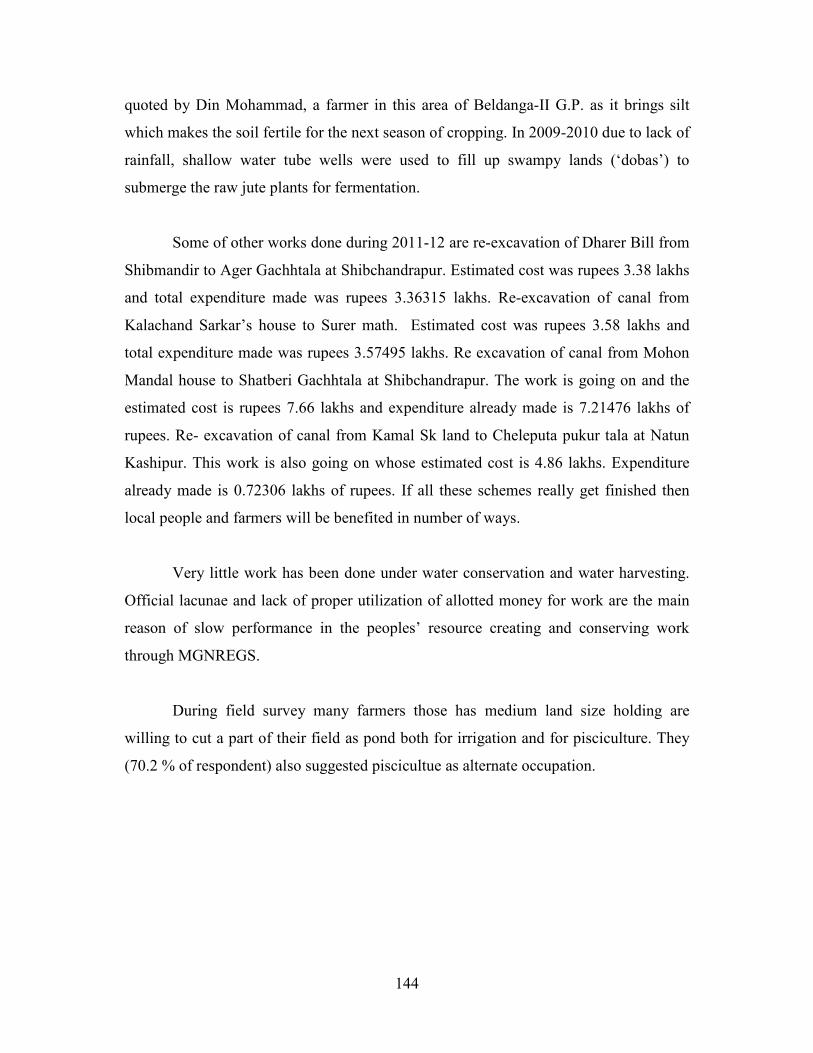
Total Expenditure made was Rupees 338415.00 in 2010-2011. Unskilled labour
expenditure was Rupees 318110.00, Semi-skilled labour expenditure was Rupees
18720.00, and work site board expenditure was Rupees 400.00. This expenditure must
be displayed publicly but field’s survey shows that no such board has been installed in
the actual ground of work; it is kept at the corner of Panchayat Office.
This canal will help the people in many ways. The canal will help people to
submerge raw jute plants during rainy seasons. Later on, it will also help to take the
products (pulps) near the main road suspending through the water of the canal.
Sediment accumulation had made the canal shallow, re-excavation will benefit
irrigating field of this region. Again this canal may help in flushing the area from
arsenic (As) contamination and also recharge the ground water. “Flood is a gift” as
144
quoted by Din Mohammad, a farmer in this area of Beldanga-II G.P. as it brings silt
which makes the soil fertile for the next season of cropping. In 2009-2010 due to lack of
rainfall, shallow water tube wells were used to fill up swampy lands (‘dobas’) to
submerge the raw jute plants for fermentation.
Some of other works done during 2011-12 are re-excavation of Dharer Bill from
Shibmandir to Ager Gachhtala at Shibchandrapur. Estimated cost was rupees 3.38 lakhs
and total expenditure made was rupees 3.36315 lakhs. Re-excavation of canal from
Kalachand Sarkar’s house to Surer math. Estimated cost was rupees 3.58 lakhs and
total expenditure made was rupees 3.57495 lakhs. Re excavation of canal from Mohon
Mandal house to Shatberi Gachhtala at Shibchandrapur. The work is going on and the
estimated cost is rupees 7.66 lakhs and expenditure already made is 7.21476 lakhs of
rupees. Re- excavation of canal from Kamal Sk land to Cheleputa pukur tala at Natun
Kashipur. This work is also going on whose estimated cost is 4.86 lakhs. Expenditure
already made is 0.72306 lakhs of rupees. If all these schemes really get finished then
local people and farmers will be benefited in number of ways.
Very little work has been done under water conservation and water harvesting.
Official lacunae and lack of proper utilization of allotted money for work are the main
reason of slow performance in the peoples’ resource creating and conserving work
through MGNREGS.
During field survey many farmers those has medium land size holding are
willing to cut a part of their field as pond both for irrigation and for pisciculture. They
(70.2 % of respondent) also suggested piscicultue as alternate occupation.
145
5.7 (b) CASE STUDY IN ‘RARH’ REGION
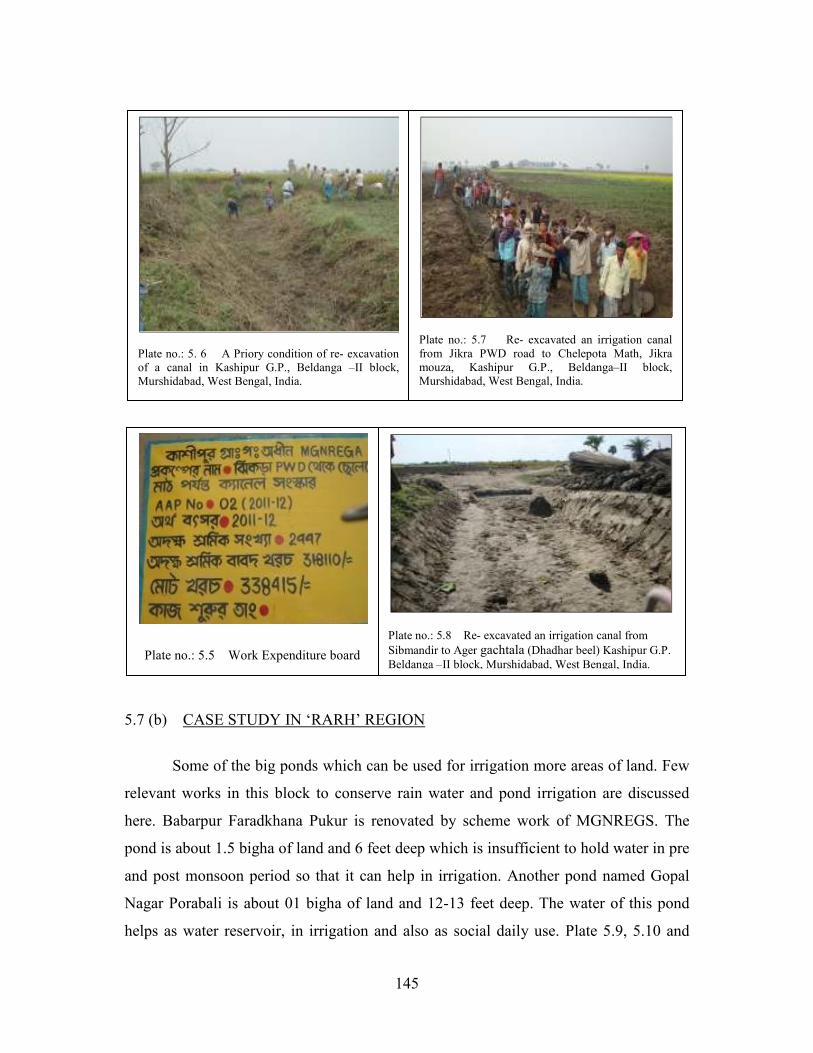
Some of the big ponds which can be used for irrigation more areas of land. Few
relevant works in this block to conserve rain water and pond irrigation are discussed
here. Babarpur Faradkhana Pukur is renovated by scheme work of MGNREGS. The
pond is about 1.5 bigha of land and 6 feet deep which is insufficient to hold water in pre
and post monsoon period so that it can help in irrigation. Another pond named Gopal
Nagar Porabali is about 01 bigha of land and 12-13 feet deep. The water of this pond
helps as water reservoir, in irrigation and also as social daily use. Plate 5.9, 5.10 and
Plate no.: 5. 6 A Priory condition of re- excavation of a canal in Kashipur G.P., Beldanga –II block, Murshidabad, West Bengal, India.
Plate no.: 5.7 Re- excavated an irrigation canal from Jikra PWD road to Chelepota Math, Jikra mouza, Kashipur G.P., Beldanga–II block, Murshidabad, West Bengal, India.
Plate no.: 5.8 Re- excavated an irrigation canal from
Sibmandir to Ager gachtala (Dhadhar beel) Kashipur G.P.
Beldanga –II block, Murshidabad, West Bengal, India.
Plate no.: 5.5 Work Expenditure board
146
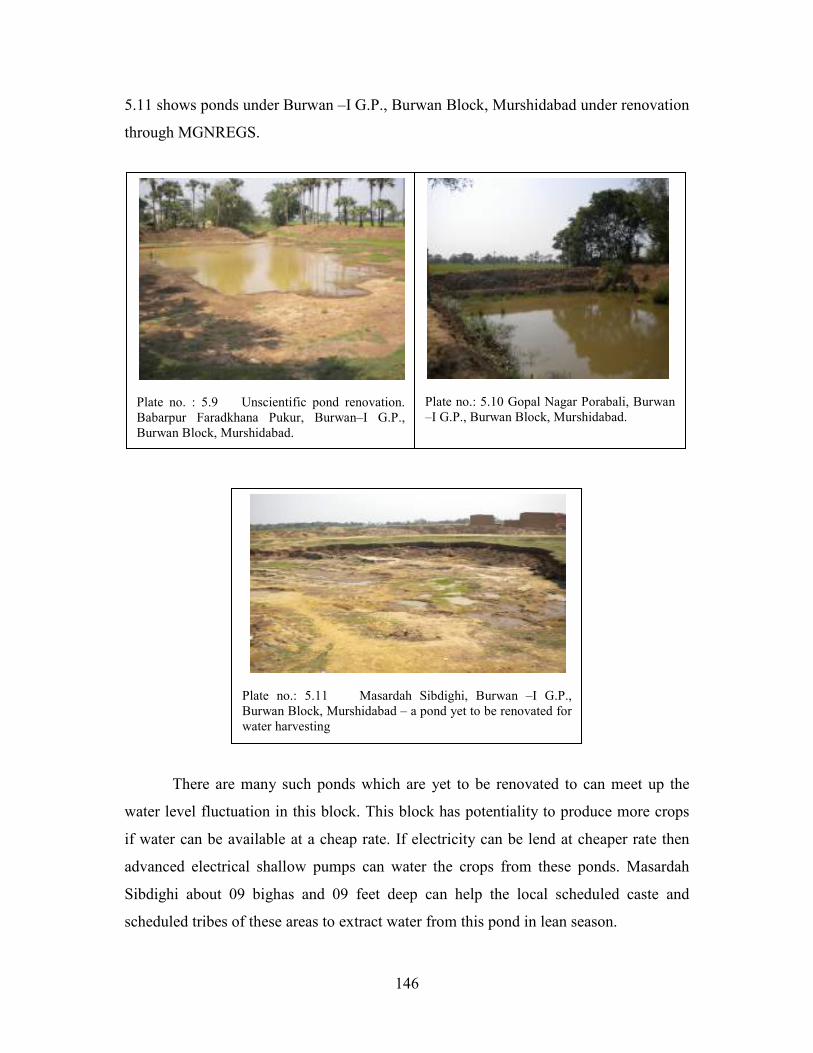
5.11 shows ponds under Burwan –I G.P., Burwan Block, Murshidabad under renovation
through MGNREGS.
There are many such ponds which are yet to be renovated to can meet up the
water level fluctuation in this block. This block has potentiality to produce more crops
if water can be available at a cheap rate. If electricity can be lend at cheaper rate then
advanced electrical shallow pumps can water the crops from these ponds. Masardah
Sibdighi about 09 bighas and 09 feet deep can help the local scheduled caste and
scheduled tribes of these areas to extract water from this pond in lean season.
Plate no. : 5.9 Unscientific pond renovation. Babarpur Faradkhana Pukur, Burwan–I G.P., Burwan Block, Murshidabad.
Plate no.: 5.10 Gopal Nagar Porabali, Burwan –I G.P., Burwan Block, Murshidabad.
Plate no.: 5.11 Masardah Sibdighi, Burwan –I G.P., Burwan Block, Murshidabad – a pond yet to be renovated for water harvesting
147
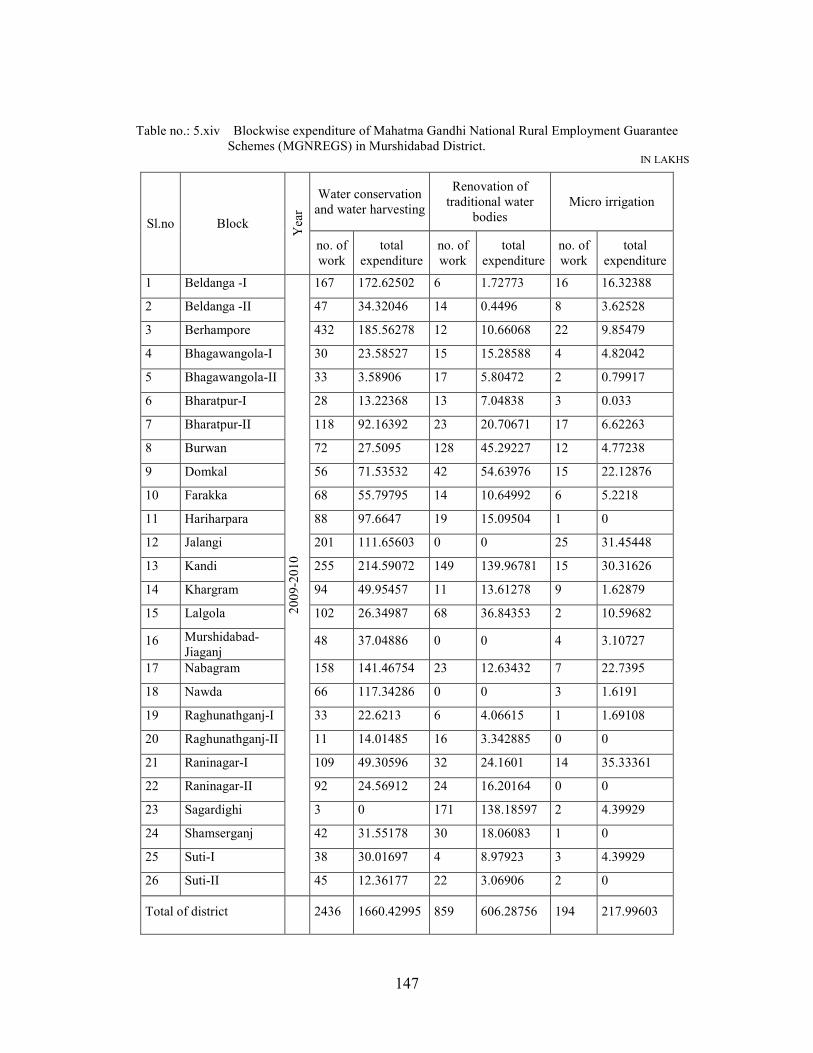
Table no.: 5.xiv Blockwise expenditure of Mahatma Gandhi National Rural Employment Guarantee Schemes (MGNREGS) in Murshidabad District.
IN LAKHS
Sl.no Block
Yea
r
Water conservation and water harvesting
Renovation of traditional water
bodies Micro irrigation
no. of work
total expenditure
no. of work
total expenditure
no. of work
total expenditure
1 Beldanga -I 2
00
9-2
01
0
167 172.62502 6 1.72773 16 16.32388
2 Beldanga -II 47 34.32046 14 0.4496 8 3.62528
3 Berhampore 432 185.56278 12 10.66068 22 9.85479
4 Bhagawangola-I 30 23.58527 15 15.28588 4 4.82042
5 Bhagawangola-II 33 3.58906 17 5.80472 2 0.79917
6 Bharatpur-I 28 13.22368 13 7.04838 3 0.033
7 Bharatpur-II 118 92.16392 23 20.70671 17 6.62263
8 Burwan 72 27.5095 128 45.29227 12 4.77238
9 Domkal 56 71.53532 42 54.63976 15 22.12876
10 Farakka 68 55.79795 14 10.64992 6 5.2218
11 Hariharpara 88 97.6647 19 15.09504 1 0
12 Jalangi 201 111.65603 0 0 25 31.45448
13 Kandi 255 214.59072 149 139.96781 15 30.31626
14 Khargram 94 49.95457 11 13.61278 9 1.62879
15 Lalgola 102 26.34987 68 36.84353 2 10.59682
16 Murshidabad- Jiaganj
48 37.04886 0 0 4 3.10727
17 Nabagram 158 141.46754 23 12.63432 7 22.7395
18 Nawda 66 117.34286 0 0 3 1.6191
19 Raghunathganj-I 33 22.6213 6 4.06615 1 1.69108
20 Raghunathganj-II 11 14.01485 16 3.342885 0 0
21 Raninagar-I 109 49.30596 32 24.1601 14 35.33361
22 Raninagar-II 92 24.56912 24 16.20164 0 0
23 Sagardighi 3 0 171 138.18597 2 4.39929
24 Shamserganj 42 31.55178 30 18.06083 1 0
25 Suti-I 38 30.01697 4 8.97923 3 4.39929
26 Suti-II 45 12.36177 22 3.06906 2 0
Total of district 2436 1660.42995 859 606.28756 194 217.99603
148
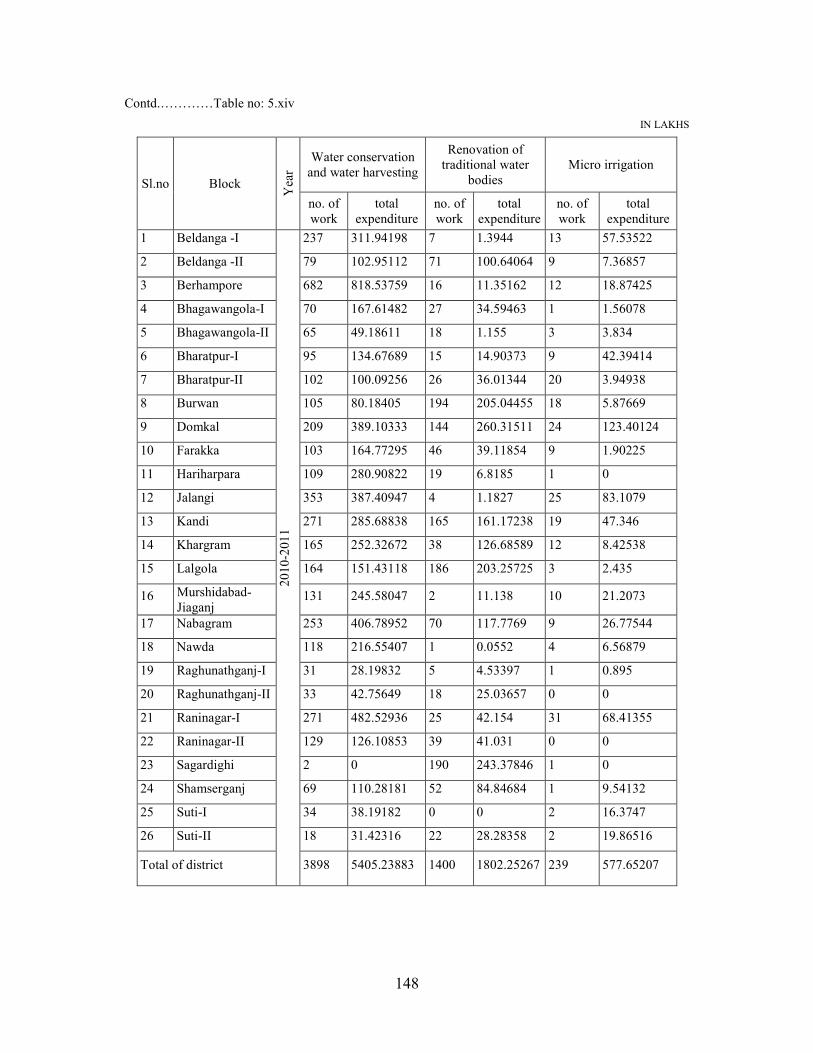
Contd.…………Table no: 5.xiv
IN LAKHS
Sl.no Block
Yea
r
Water conservation and water harvesting
Renovation of traditional water
bodies Micro irrigation
no. of work
total expenditure
no. of work
total expenditure
no. of work
total expenditure
1 Beldanga -I
20
10-2
01
1
237 311.94198 7 1.3944 13 57.53522
2 Beldanga -II 79 102.95112 71 100.64064 9 7.36857
3 Berhampore 682 818.53759 16 11.35162 12 18.87425
4 Bhagawangola-I 70 167.61482 27 34.59463 1 1.56078
5 Bhagawangola-II 65 49.18611 18 1.155 3 3.834
6 Bharatpur-I 95 134.67689 15 14.90373 9 42.39414
7 Bharatpur-II 102 100.09256 26 36.01344 20 3.94938
8 Burwan 105 80.18405 194 205.04455 18 5.87669
9 Domkal 209 389.10333 144 260.31511 24 123.40124
10 Farakka 103 164.77295 46 39.11854 9 1.90225
11 Hariharpara 109 280.90822 19 6.8185 1 0
12 Jalangi 353 387.40947 4 1.1827 25 83.1079
13 Kandi 271 285.68838 165 161.17238 19 47.346
14 Khargram 165 252.32672 38 126.68589 12 8.42538
15 Lalgola 164 151.43118 186 203.25725 3 2.435
16 Murshidabad- Jiaganj
131 245.58047 2 11.138 10 21.2073
17 Nabagram 253 406.78952 70 117.7769 9 26.77544
18 Nawda 118 216.55407 1 0.0552 4 6.56879
19 Raghunathganj-I 31 28.19832 5 4.53397 1 0.895
20 Raghunathganj-II 33 42.75649 18 25.03657 0 0
21 Raninagar-I 271 482.52936 25 42.154 31 68.41355
22 Raninagar-II 129 126.10853 39 41.031 0 0
23 Sagardighi 2 0 190 243.37846 1 0
24 Shamserganj 69 110.28181 52 84.84684 1 9.54132
25 Suti-I 34 38.19182 0 0 2 16.3747
26 Suti-II 18 31.42316 22 28.28358 2 19.86516
Total of district 3898 5405.23883 1400 1802.25267 239 577.65207
149
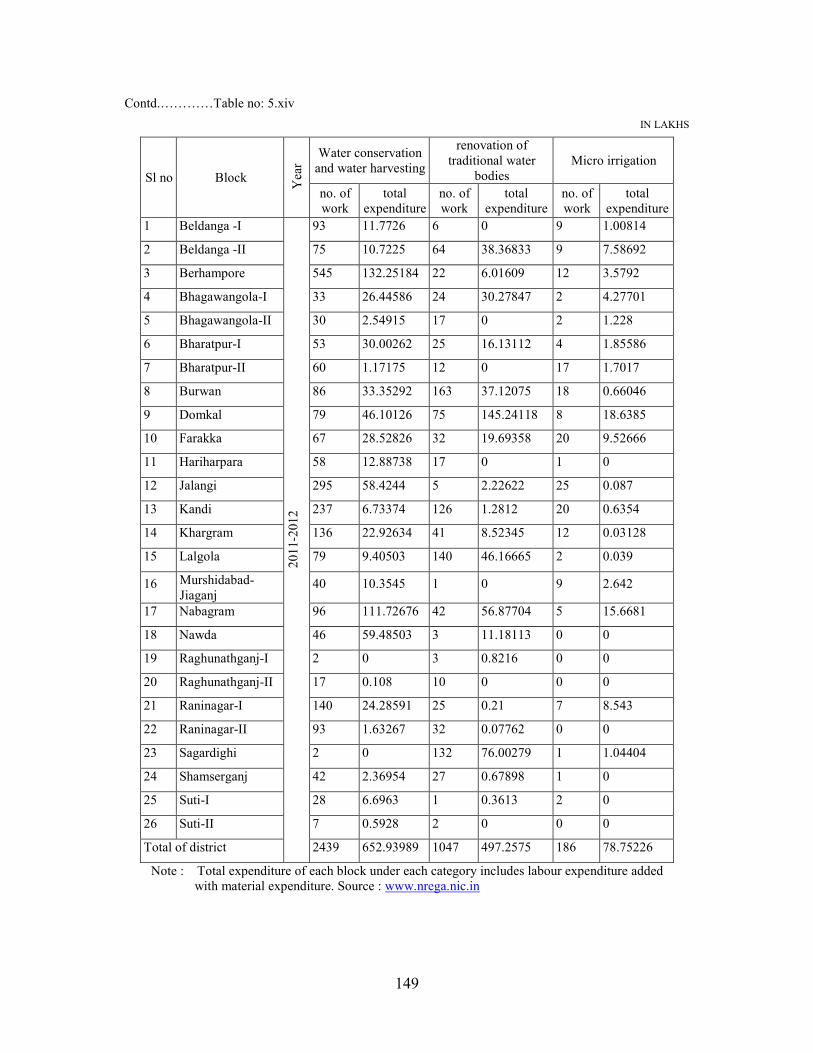
Contd.…………Table no: 5.xiv
IN LAKHS
Sl no Block
Yea
r
Water conservation and water harvesting
renovation of traditional water
bodies Micro irrigation
no. of work
total expenditure
no. of work
total expenditure
no. of work
total expenditure
1 Beldanga -I
20
11-2
01
2
93 11.7726 6 0 9 1.00814
2 Beldanga -II 75 10.7225 64 38.36833 9 7.58692
3 Berhampore 545 132.25184 22 6.01609 12 3.5792
4 Bhagawangola-I 33 26.44586 24 30.27847 2 4.27701
5 Bhagawangola-II 30 2.54915 17 0 2 1.228
6 Bharatpur-I 53 30.00262 25 16.13112 4 1.85586
7 Bharatpur-II 60 1.17175 12 0 17 1.7017
8 Burwan 86 33.35292 163 37.12075 18 0.66046
9 Domkal 79 46.10126 75 145.24118 8 18.6385
10 Farakka 67 28.52826 32 19.69358 20 9.52666
11 Hariharpara 58 12.88738 17 0 1 0
12 Jalangi 295 58.4244 5 2.22622 25 0.087
13 Kandi 237 6.73374 126 1.2812 20 0.6354
14 Khargram 136 22.92634 41 8.52345 12 0.03128
15 Lalgola 79 9.40503 140 46.16665 2 0.039
16 Murshidabad- Jiaganj
40 10.3545 1 0 9 2.642
17 Nabagram 96 111.72676 42 56.87704 5 15.6681
18 Nawda 46 59.48503 3 11.18113 0 0
19 Raghunathganj-I 2 0 3 0.8216 0 0
20 Raghunathganj-II 17 0.108 10 0 0 0
21 Raninagar-I 140 24.28591 25 0.21 7 8.543
22 Raninagar-II 93 1.63267 32 0.07762 0 0
23 Sagardighi 2 0 132 76.00279 1 1.04404
24 Shamserganj 42 2.36954 27 0.67898 1 0
25 Suti-I 28 6.6963 1 0.3613 2 0
26 Suti-II 7 0.5928 2 0 0 0
Total of district 2439 652.93989 1047 497.2575 186 78.75226
Note : Total expenditure of each block under each category includes labour expenditure added with material expenditure. Source : www.nrega.nic.in
150
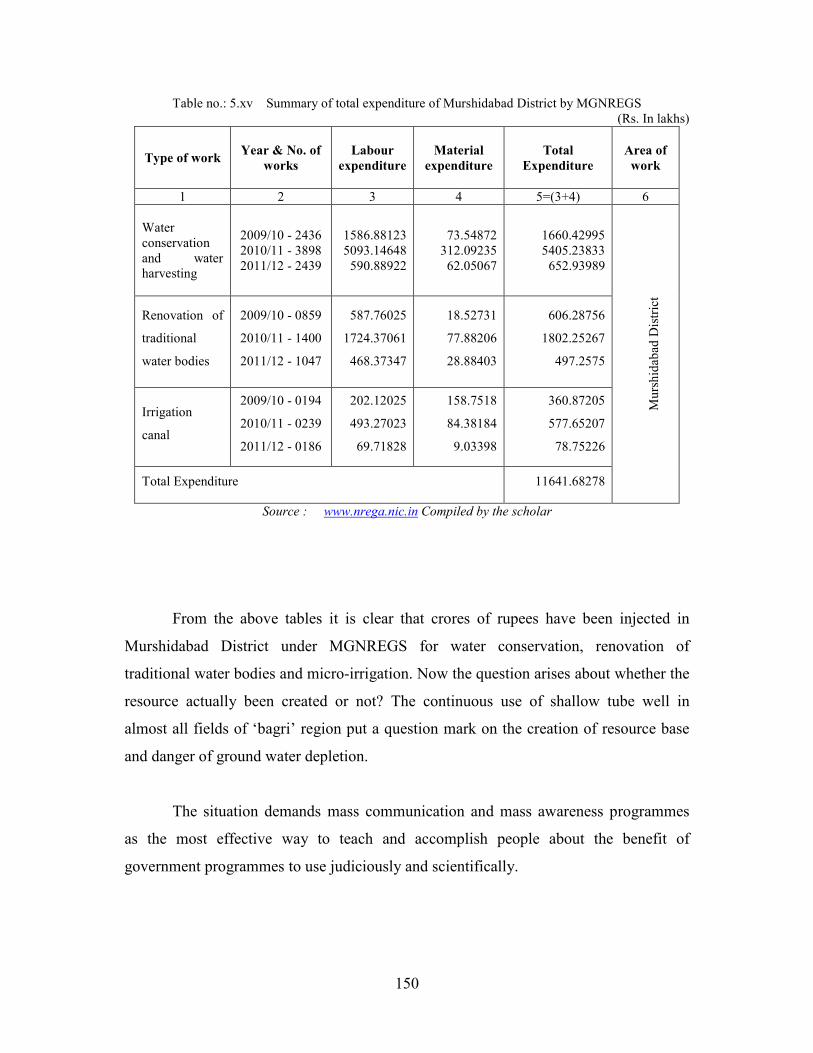
Table no.: 5.xv Summary of total expenditure of Murshidabad District by MGNREGS (Rs. In lakhs)
Type of work Year & No. of
works
Labour
expenditure
Material
expenditure
Total
Expenditure
Area of
work
1 2 3 4 5=(3+4) 6
Water conservation and water harvesting
2009/10 - 2436 2010/11 - 3898 2011/12 - 2439
1586.88123 5093.14648
590.88922
73.54872 312.09235 62.05067
1660.42995 5405.23833
652.93989
Mu
rsh
idab
ad D
istr
ict
Renovation of
traditional
water bodies
2009/10 - 0859
2010/11 - 1400
2011/12 - 1047
587.76025
1724.37061
468.37347
18.52731
77.88206
28.88403
606.28756
1802.25267
497.2575
Irrigation
canal
2009/10 - 0194
2010/11 - 0239
2011/12 - 0186
202.12025
493.27023
69.71828
158.7518
84.38184
9.03398
360.87205
577.65207
78.75226
Total Expenditure 11641.68278
Source : www.nrega.nic.in Compiled by the scholar
From the above tables it is clear that crores of rupees have been injected in
Murshidabad District under MGNREGS for water conservation, renovation of
traditional water bodies and micro-irrigation. Now the question arises about whether the
resource actually been created or not? The continuous use of shallow tube well in
almost all fields of ‘bagri’ region put a question mark on the creation of resource base
and danger of ground water depletion.
The situation demands mass communication and mass awareness programmes
as the most effective way to teach and accomplish people about the benefit of
government programmes to use judiciously and scientifically.
151
5.8 MASS AWARENESS PROGRAMMES CONDUCTED IN THE DISTRICT.
After all test and trial, only a few mass awareness programmes are done in
Murshidabad regarding present groundwater status and rainwater harvesting.
In Raninagar- I, 200 participants joined in mass awareness programmes by CGWB/
SGMA in 2003. In Bharatpur –II, 250 participants joined in Ground Water Management
and Rain Water Harvesting Programme. Kandi block with 17 participants organized by
CGWB programme was ground water Development and Management with special
reference to Rain Water Harvesting (WMTP).Exhibition organized by All India
Agriculture, Science and Industrial Expo- 2002 was conducted in Jangipur/
Raghunathganj block.
Various models, charts, maps were prepared by CGWB to aware the common
peoples.CGWB awareness programme delivered in Kandi block involved block level
officers and block level SAE. This programme was organized by Zilla Parisad
Murshidabad under MGNREGA schemes in 2007. The main theme was rain water
harvesting through excavation of ponds, tanks etc. for assured 100 days employment.
S.K. Acharyya, former director general in the Geological Survey of India in 2002, has
quoted that “reversion to surface water – based supply …. Will involve enormous
financial outlay and world nullify the investment of around Rs 10,000 crores (100
billion rupees or around $ 2 billion) already made in West Bengal alone over the last 30
years. It is necessary that such major policy shift should not be ad hoc, but a science
driven decision”
DO INSTITUTIONAL EDUCATION OF FARMERS HELP IN AGRICULTURAL DEVELOPMENT AND PLANNING?
Knowledge is basically two types: indigenous knowledge and scientific
knowledge. Wisdom and practice is influenced by indigenous knowledge and
technology is run by scientific knowledge. A space between the two knowledges can led
a society into obscurity. This had happened in this district regarding groundwater. There
are always transition costs in developing new or adapting old technologies, in learning
work and in breaking free from existing patterns of thoughts and practice. It also costs
152
time and money to rebuild depleted natural and social capital. 5(Desai,V.& Potter, R.B.;
2011, pp:168-69). Pre-scheduling, mass communication and mass awareness
programmes is the only way of amalgamation of indigenous knowledge and scientific
knowledge.
Farmers have indigenous knowledge and researchers have scientific knowledge.
Amalgamation of these knowledges and putting into practice is the only noble way of
sustainability.
Senior farmers are sometimes opposing to educate their children because they
think education has made the young generation reluctant to remain as farm labors.
Those farmers, who educate their children with all their ends, hope a secured job (govt.
/non-govt.) for their children as like as in urban areas. Our education system is such that
it is uprooting the rural youth from villages. The gradually increasing rural youth find
themselves a strangers in their own village and run to cities where they also becomes
job seekers along with the urban youth. All the efforts for rural development launched
since 1952 have colonial attitude towards rural areas and problems. The urban sector
presumably has to carry the burden of developing rural sector and there is little
involvement of rural people in planning and implementation. Most of the officers and
the workers (mostly having urban background) have failed to identify themselves with
the rural people. They are unaware of the language, mindset, perception and necessities
of these villagers. Their aspiration and problems are much different than urban region.
Workers of brick factory and ‘biri’ factory are mainly school going and few college
going students in Murshidabad District. The unorganized plants must be planned and
organized by administrators with local people’s organization so that no labour must be
below eighteen years of age. Voters’ identity card can help in such sorting. Most of the
farmers are of the idea that institutional education has no value in marginal workers
family. Increase in number of earning members in the family can support the economic
condition which institutional education cannot.
Local empowerment should be encouraged because water and soil relationship
are practically best known to the farmers in their own language. They know their land
like their palm lines. Vocational training in modern agriculture after twelfth standard in
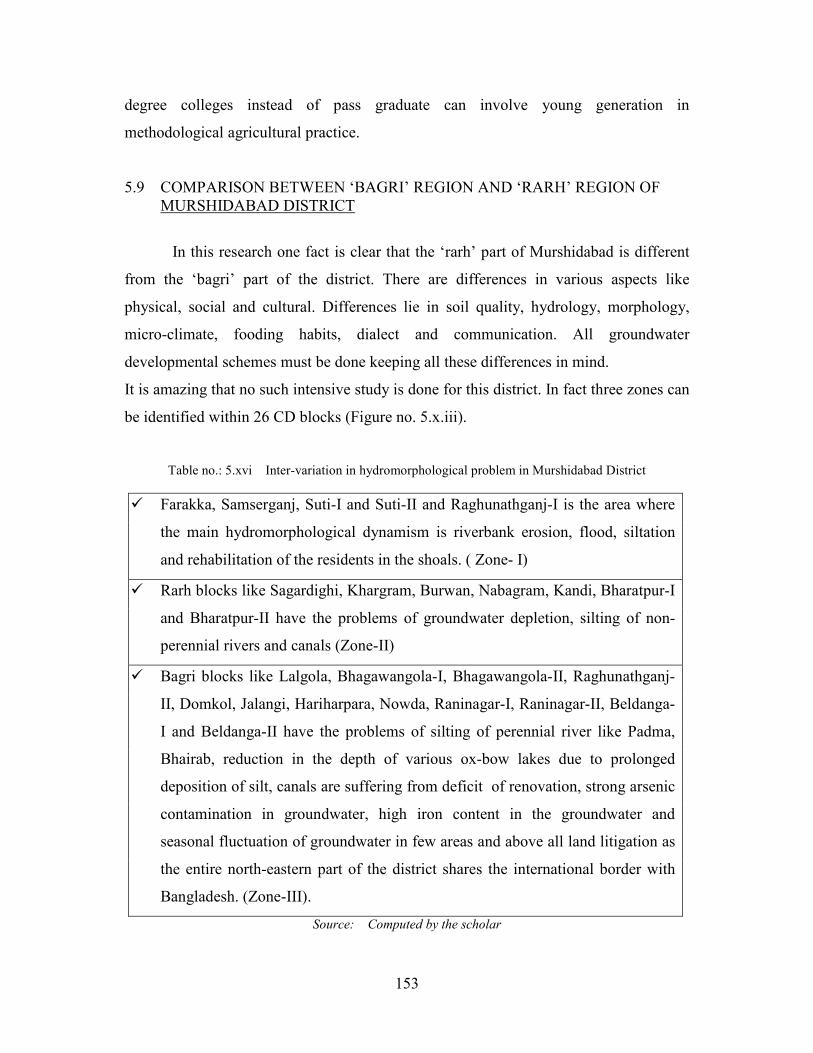
153
degree colleges instead of pass graduate can involve young generation in
methodological agricultural practice.
5.9 COMPARISON BETWEEN ‘BAGRI’ REGION AND ‘RARH’ REGION OF MURSHIDABAD DISTRICT
In this research one fact is clear that the ‘rarh’ part of Murshidabad is different
from the ‘bagri’ part of the district. There are differences in various aspects like
physical, social and cultural. Differences lie in soil quality, hydrology, morphology,
micro-climate, fooding habits, dialect and communication. All groundwater
developmental schemes must be done keeping all these differences in mind.
It is amazing that no such intensive study is done for this district. In fact three zones can
be identified within 26 CD blocks (Figure no. 5.x.iii).
Table no.: 5.xvi Inter-variation in hydromorphological problem in Murshidabad District
� Farakka, Samserganj, Suti-I and Suti-II and Raghunathganj-I is the area where
the main hydromorphological dynamism is riverbank erosion, flood, siltation
and rehabilitation of the residents in the shoals. ( Zone- I)
� Rarh blocks like Sagardighi, Khargram, Burwan, Nabagram, Kandi, Bharatpur-I
and Bharatpur-II have the problems of groundwater depletion, silting of non-
perennial rivers and canals (Zone-II)
� Bagri blocks like Lalgola, Bhagawangola-I, Bhagawangola-II, Raghunathganj-
II, Domkol, Jalangi, Hariharpara, Nowda, Raninagar-I, Raninagar-II, Beldanga-
I and Beldanga-II have the problems of silting of perennial river like Padma,
Bhairab, reduction in the depth of various ox-bow lakes due to prolonged
deposition of silt, canals are suffering from deficit of renovation, strong arsenic
contamination in groundwater, high iron content in the groundwater and
seasonal fluctuation of groundwater in few areas and above all land litigation as
the entire north-eastern part of the district shares the international border with
Bangladesh. (Zone-III).
Source: Computed by the scholar
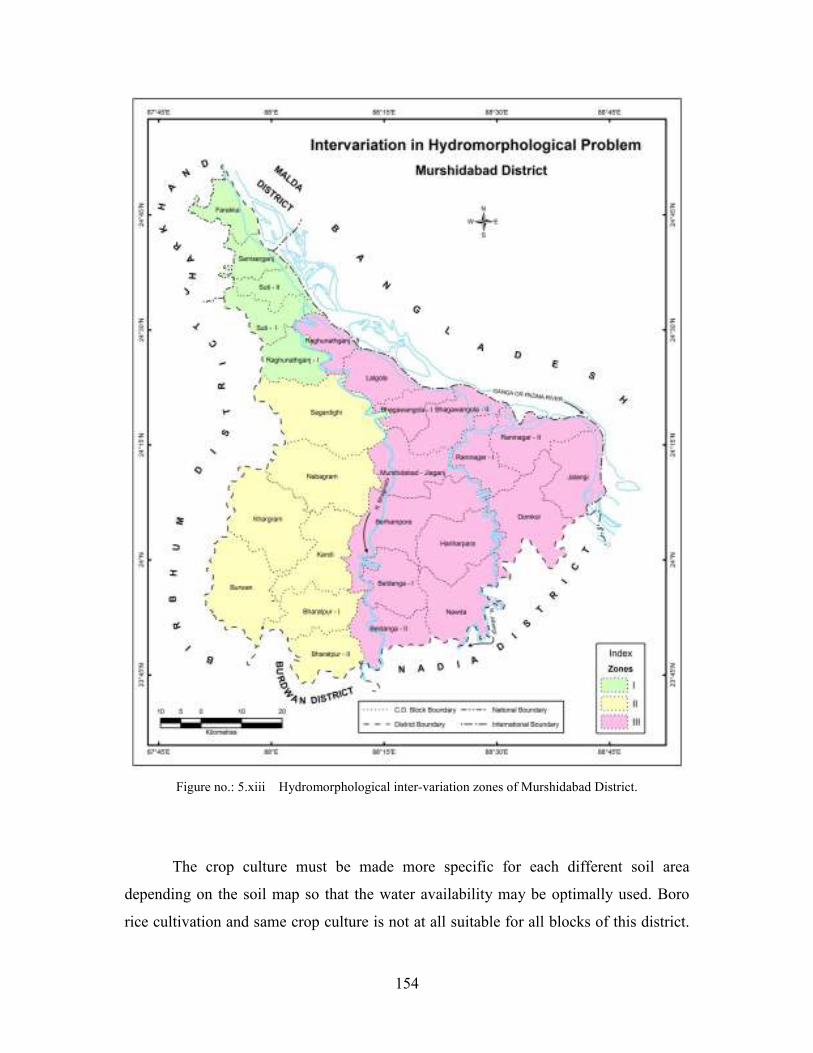
154
Figure no.: 5.xiii Hydromorphological inter-variation zones of Murshidabad District.
The crop culture must be made more specific for each different soil area
depending on the soil map so that the water availability may be optimally used. Boro
rice cultivation and same crop culture is not at all suitable for all blocks of this district.
155
Pulses, groundnuts, can be introduced in few blocks of ‘bagri’ region like Jalangi,
Dumkol, Raninagar-I and II. Maize, bajra, and other coarse cereals can be introduced in
Bharatpur-I and II , Khargram, Sagardighi, Burwan.
In the ‘rarh’ region number of canals help in irrigation but proper supply of
electricity can help more to cultivate potato and other winter vegetables with
groundwater irrigation keeping the recharge caution in planning. Pond at least 12-14
feet in depth can be excavated or renovated that it can help in rainwater harvesting and
irrigation. Ponds which are used for pisciculture should be marked differently.
In the ‘Bagri’ region huge desilting programmes have to be encouraged. This
will help for jute and also helps in flushing of arsenic from subsurface water. This will
also help in reducing tenacity of flood in few blocks like Lalgola, Bhagawangola-I,
Bhagawangola-II, Raghunathganj-I of this areas. The growing brick factories must be
organized and mark it as small-scale industry with proper norms for groundwater use.
Above all depending on the soil, hydrology and morphology the entire district (block
wise) has to be planned with wisdom.
5.10 CONCLUSION
In this thesis the study area excludes the block Farakka, Samserganj, Suti-I and
Suti-II and some part of Raghunathganj-I of Murshidabad district because these blocks
have the major issues of riverbank erosion and flood. Agricultural land areas are
diminishing in these blocks
Researchers, planners, administrators had put forward probable causes, effects
and consequences regarding the (groundwater) hydromorphological problems in the
study area but how much do common people know about such finding. It is they who
live and die with the problem but mass communication is totally neglected in this
district.
In the sixth chapter number of sample surveys was done to know about the
knowledge and perception about hydromorphological problems among the common
people.
156
. REFERENCES
1. “Mitigation and remedy of Groundwater Arsenic Menace in India: A Vision
Document.” (2010): By National Institute of Hydrology, Roorkee Central Groundwater
Board, and New Delhi. Ministry of Water Resources, Govt. of India. Pp: 133-135.
2. Anandabazar Patrika dated 16 May, 2012; Wednesday; pp: 1.
3. Bhalla,G.S,(2008); “Indian Agriculture Since Independence” National Book Trust,
India, New Delhi, pp:133.
4. Bhattacharya, P., Chaterjee, D. and Jack, G. (1997): “Occurrence of As- contaminated
groundwater in alluvial aquifers from the Delta Plain, eastern India: option for safe
drinking water supply.” International Journal of Water Resource Development. Vol. 13.
Pp: 79-92.
5. Desai, V. and Potter,R.B.(2011): “The Companion to Development Studied” Hodder
Education, Chennai, 2nd edition, pp: 149, 168-69.
6. Mukherjee, A.; Fryar, A.E.and Howell, P.D. (2007):"Regional Hydrostatigraphy and
groundwater flow modelling in the arsenic affected areas of the western Bengal Basin,
West Bengal, India. Hydrogeology Journal Springer- Verlag DOI 10.1007/s 10040-007-
0208-7.pp:6, 18.
7. Mukherjee,A.(2006):"Deeper groundwater chemistry and flow in the arsenic affected
western Bengal Basin, West Bengal, IndiaUnpublished, Ph D dissertation, University of
Kentuky, Lexinton from Mukherjee et.al.(2007).
8. Roychowdhury, T., Uchino, T., Tokunaga,H., Ando, M.( 2002): “Arsenic and Other
Heavy Metals in Soils from an Arsenic- affected area of West Bengal, India.”
Chemosphere; vol.49. pp: 605-618.
9. Samaddar, S.R. and Subbarao, C. (2007); “GIS Approach of Delineation and Risk
Assessment of Areas Affected by Arsenic Pollution in Drinking Water.” DOI: 10.1061/
(ASCE) 0733-9372(2007) 133:7(742).pp-1.
10. Sen.J.(1988):"Land Utilisation and Population Distribution- A case study of West
Bengal(1850-1985)”.Daya Publishing House, Delhi.
11. Singh, A.K. (2006): “Chemistry of Arsenic in Groundwater of Ganges- Brahmaputra
river Basin”. Current Science; Vol. 19 no. 5. Pp: 599-606.
157
12. Sisodia, M.L. and Agarwal, B.M. (1991):"Rural reconstruction through educational
innovation".Rural Development Strategy for Rural Development, edited by
C.R,Kothari, Delhi,pp:55-60.
13. Stiben, D.; Berner, Z., Chandrasekharam,D. and Karmakar, J.(2003):" Arsenic
enrichment in groundwater of West Bengal, India: geo chemocal evidencefor
mobilization of As under reducing condition". Applied Geochemistry, vol.18; pp: 1417-
1434.
14. Swadesh Pal and Osondu C. Akoma (2009): “Water Scarcity in Wetland Area within
Kandi Block of West Bengal: A Hrdro- Ecological Assessment.”; Ethiopian journal of
Environmental studies and Management, vol. 2 no. 3. pp:1-12.
15. Williams,P.N., Islam,M.R., Adomako, E.E., Raab, A. Hossain, S.A.,
Zhu,Y.G.,Feldmann and Meharg, A.A.( 2006): “ Increase in Rice Grain Arsenic for
Regions of Bangladesh Irrigating Paddies with elevated Arsenic in Groundwater.”
Environmental Science and Technology; Vol. 40 no. 16. Pp: 4903-4907.
Related Documents
![[hydrology] groundwater hydrology - david k. todd (2005).pdf](https://static.cupdf.com/doc/110x72/577c77961a28abe0548cb0b1/hydrology-groundwater-hydrology-david-k-todd-2005pdf.jpg)