Mapping Earth Mapping Earth Midterm Review Midterm Review Topics: Topics: Isolines Isolines Drawing isolines Drawing isolines Topography (Reading Contour Topography (Reading Contour maps) maps) – Finding Interval Finding Interval – Hills Hills – Steep/gradual slopes Steep/gradual slopes – Gradient Gradient – River Direction River Direction – Maximum/minimum elevation Maximum/minimum elevation – Depressions (hachured marks) Depressions (hachured marks) Profiles Profiles

Mapping Earth Midterm Review Topics: Isolines Drawing isolines Topography (Reading Contour maps) –Finding Interval –Hills –Steep/gradual slopes –Gradient.
Dec 18, 2015
Welcome message from author
This document is posted to help you gain knowledge. Please leave a comment to let me know what you think about it! Share it to your friends and learn new things together.
Transcript
Mapping Earth Mapping Earth Midterm ReviewMidterm Review
Topics:Topics:IsolinesIsolinesDrawing isolinesDrawing isolinesTopography (Reading Contour Topography (Reading Contour maps)maps)
–Finding IntervalFinding Interval
–HillsHills
–Steep/gradual slopesSteep/gradual slopes
–GradientGradient
–River DirectionRiver Direction
–Maximum/minimum elevationMaximum/minimum elevation
–Depressions (hachured marks)Depressions (hachured marks)ProfilesProfiles
IsolinesIsolines
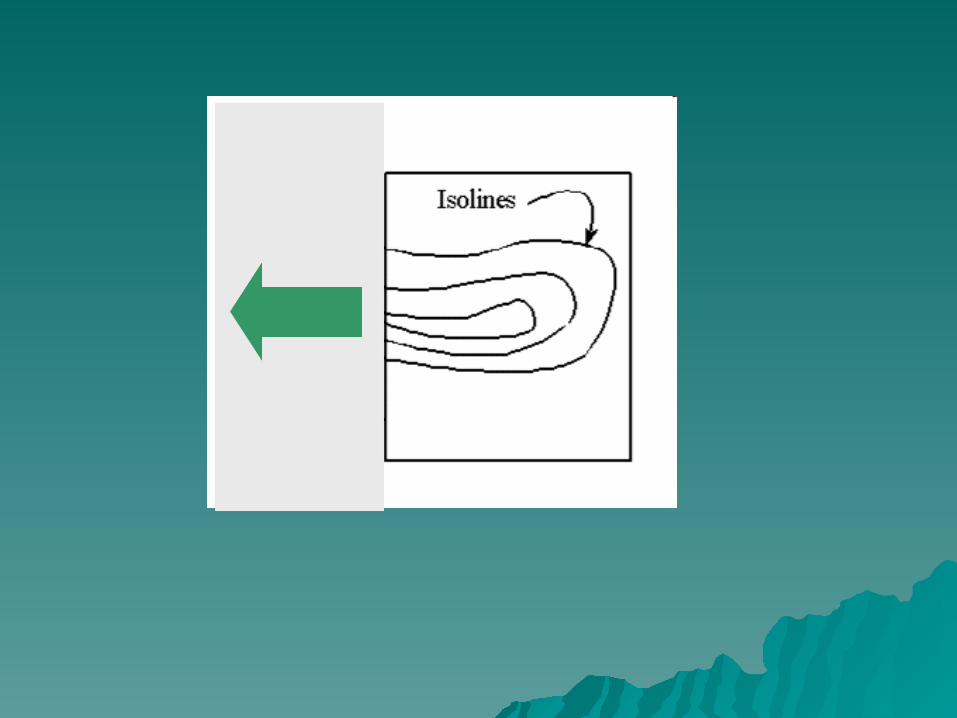
Connect points of equal valueConnect points of equal value– Isotherm: temperatureIsotherm: temperature– Isobars: barometric (air pressure)Isobars: barometric (air pressure)– Contour lines: elevationContour lines: elevation

Drawing IsolinesDrawing Isolines
Connect the points with the same Connect the points with the same valuevalue
Estimate between which other values Estimate between which other values the line should be drawnthe line should be drawn
Lines should be curved, not angularLines should be curved, not angular Extend lines to edge of mapExtend lines to edge of map Never cross isolinesNever cross isolines

Topography (Contour maps)Topography (Contour maps) 1-dimensional representation of a 3D 1-dimensional representation of a 3D
landscapelandscape Shows the shape of the landShows the shape of the land

Finding IntervalFinding Interval Difference between one contour line Difference between one contour line
and the nextand the next May be given on mapMay be given on map Labeled lines are Labeled lines are Index ContoursIndex Contours

Subtract the value of two consecutive Subtract the value of two consecutive Index Contour LinesIndex Contour Lines
Then count how many contour lines there Then count how many contour lines there are from one Index Contour to the next are from one Index Contour to the next (only count one of the Index Contours)(only count one of the Index Contours)
Divide the difference by the # of linesDivide the difference by the # of lines
300-200=100m
5 lines
100/5= 20m
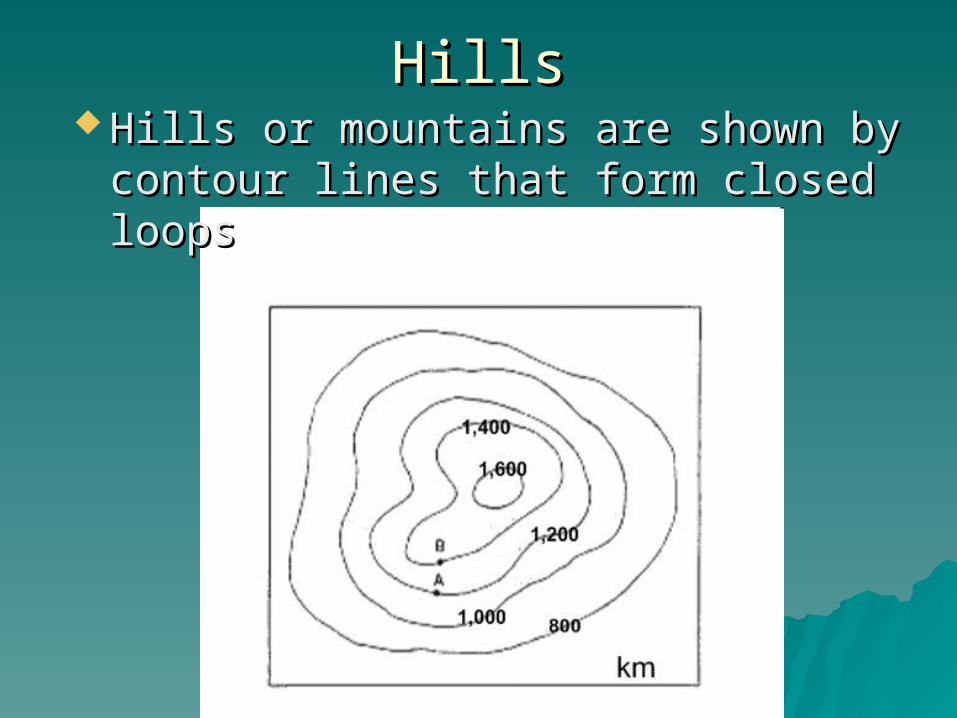
HillsHills Hills or mountains are shown by Hills or mountains are shown by
contour lines that form closed loopscontour lines that form closed loops
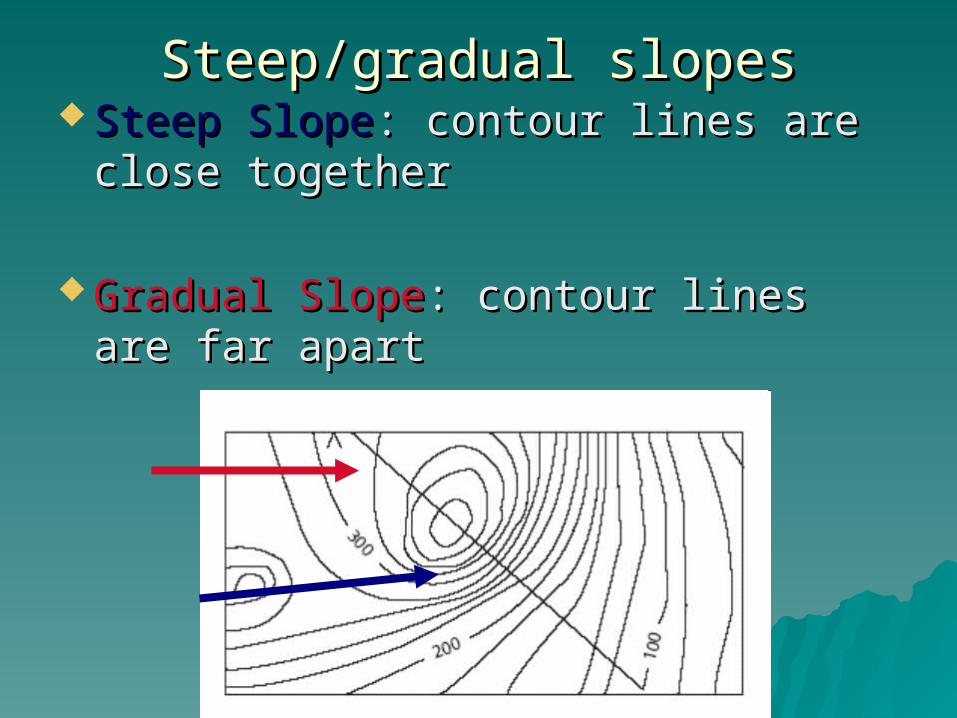
Steep/gradual slopesSteep/gradual slopes Steep SlopeSteep Slope: contour lines are close : contour lines are close
togethertogether
Gradual SlopeGradual Slope: contour lines are far : contour lines are far apartapart
GradientGradient
Difference in ElevationDifference in Elevation
Distance between two pointsDistance between two points
Label with given units!Label with given units!

River DirectionRiver Direction
Contour lines bend upstreamContour lines bend upstream

Ocean is Sea Level = 0 elevationOcean is Sea Level = 0 elevation
Depressions Depressions (hachured marks)(hachured marks)
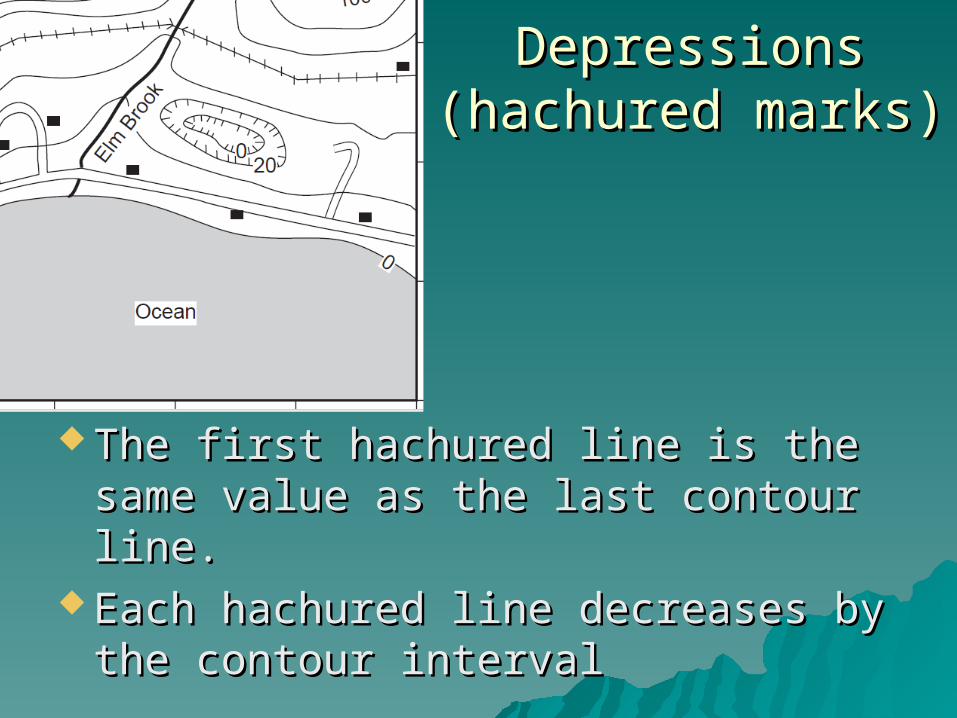
The first hachured line is the same The first hachured line is the same value as the last contour line.value as the last contour line.
Each hachured line decreases by the Each hachured line decreases by the contour intervalcontour interval

Ocean= Ocean= Interval =Interval = 11stst Hachured line = 20 Hachured line = 20 Elevation at point A=Elevation at point A=
010
10
Inferring Maximum/minimum elevationInferring Maximum/minimum elevation
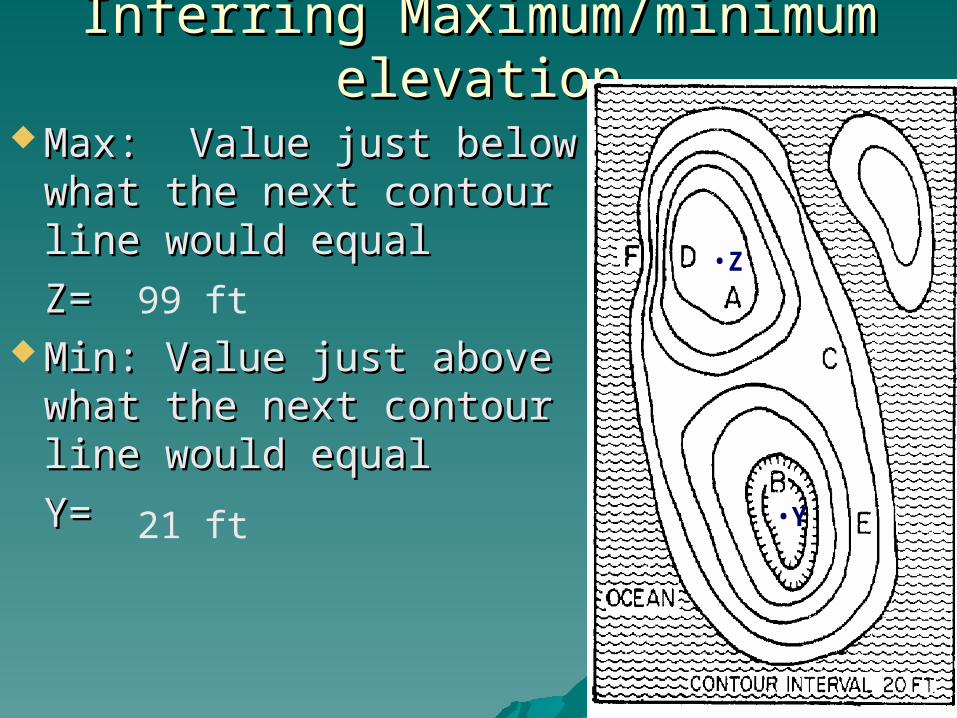
Max: Value just below Max: Value just below what the next contour what the next contour line would equalline would equal
Z=Z= Min: Value just above Min: Value just above
what the next contour what the next contour line would equalline would equal
Y=Y=
•Z
•Y
99 ft
21 ft
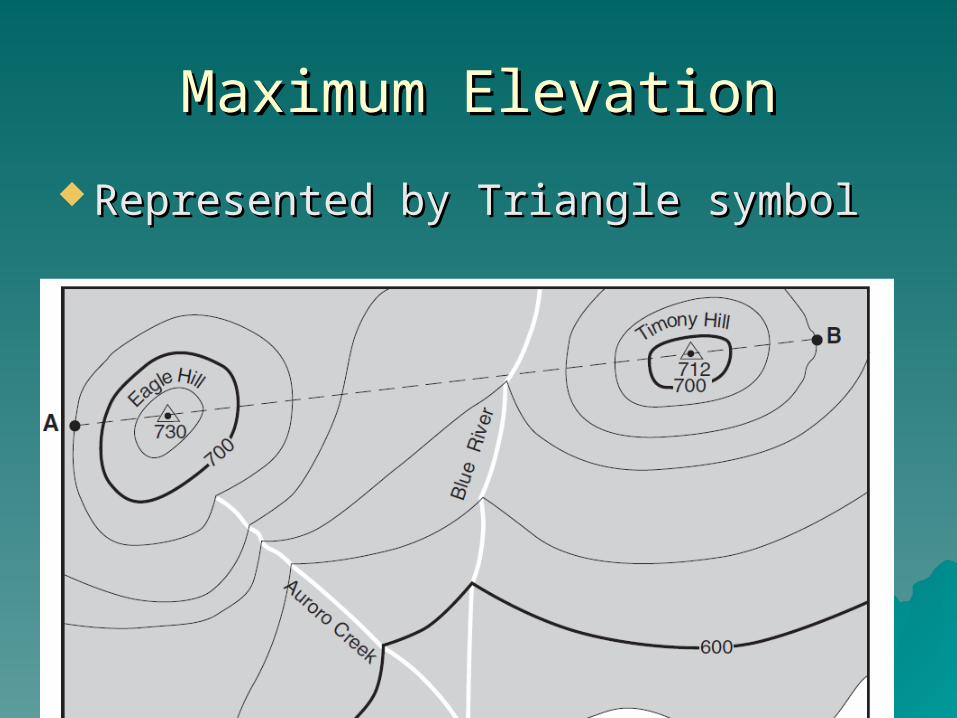
Maximum ElevationMaximum Elevation
Represented by Triangle symbolRepresented by Triangle symbol

ProfilesProfiles
Cross section (side view) of the Cross section (side view) of the contour mapcontour map
Use mark and slide methodUse mark and slide method Keep a STEADY handKeep a STEADY hand No numbers on x-axisNo numbers on x-axis Use contour interval onUse contour interval on
Y-axisY-axis


What is the contour interval? 20What direction is Mud Creek flowing?
SE
What is the max elevation at point E?139
Related Documents