Mapping and modelling trade-offs and synergies between grazing intensity and ecosystem services in rangelands using global-scale datasets and models Katalin Petz a,b, *, Rob Alkemade a,b , Michel Bakkenes a , Catharina J.E. Schulp c , Marijn van der Velde d,e , Rik Leemans b a PBL Netherlands Environmental Assessment Agency, PO Box 303, 3720 AH Bilthoven, The Netherlands b Environmental Systems Analysis Group, Wageningen University, PO Box 47, 6700AA Wageningen, The Netherlands c VU University Amsterdam, Institute for Environmental Studies (IVM), De Boelelaan 1087, 1081 HV Amsterdam, The Netherlands d European Commission, DG JRC, Institute for Environment and Sustainability, Ispra 21027, Italy e International Institute for Applied Systems Analysis, Ecosystems Services and Management Program, Schlossplatz 1, A-2361 Laxenburg, Austria 1. Introduction Rangelands are primarily natural grasslands, scrublands, woodlands, wetlands and (semi-)deserts (Alkemade et al., 2013) and cover almost half of the world’s land area (FAO, 2005). Vast rangeland areas are used and managed for pastoral livestock grazing with increasing intensity (MA, 2005; Steinfeld et al., 2006). Livestock production, which is the world’s principle land use, creates livelihoods for one billion poor people through their pastoralist livestock husbandry (Steinfeld et al., 2006). The largest extent of pastoral livestock grazing systems is found in savannas, grasslands, scrublands and (semi-)deserts (Asner et al., 2004). In these areas, people rely directly on ecosystem services (ESs), such as raw materials, food and water (Herrero et al., 2013a). Additionally, rangelands store a vast amount of carbon (Herrero et al., 2009; MA, 2005). ESs’ supply highly depends on the natural productivity and management of rangelands. Management deter- mines grazing intensity, the ratio between biomass grazed and biomass produced (Bouwman et al., 2005). Increasing livestock numbers and poor management cause widespread overgrazing and degradation of rangelands (Asner et al., 2004; Khan and Hanjra, 2009) and their ESs (MA, 2005; Steinfeld et al., 2006, 2010; White et al., 2000). This raises the concern of how to manage Global Environmental Change 29 (2014) 223–234 A R T I C L E I N F O Article history: Received 22 November 2013 Received in revised form 21 August 2014 Accepted 27 August 2014 Available online Keywords: Biodiversity Net primary production Carbon sequestration Erosion prevention Rangeland Livestock production A B S T R A C T Vast areas of rangelands across the world are grazed with increasing intensity, but interactions between livestock production, biodiversity and other ecosystem services are poorly studied. This study explicitly determines trade-offs and synergies between ecosystem services and livestock grazing intensity on rangelands. Grazing intensity and its effects on forage utilization by livestock, carbon sequestration, erosion prevention and biodiversity are quantified and mapped, using global datasets and models. Results show that on average 4% of the biomass produced annually is consumed by livestock. On average, erosion prevention is 10% lower in areas with a high grazing intensity compared to areas with a low grazing intensity, whereas carbon emissions are more than four times higher under high grazing intensity compared to low grazing intensity. Rangelands with the highest grazing intensity are located in the Sahel, Pakistan, West India, Middle East, North Africa and parts of Brazil. These high grazing intensities result in carbon emissions, low biodiversity values, low capacity for erosion prevention and unsustainable forage utilization. Although the applied models simplify the processes of ecosystem service supply, our study provides a global overview of the consequences of grazing for biodiversity and ecosystem services. The expected increasing future demand for livestock products likely increase pressures on rangelands. Global-scale models can help to identify targets and target areas for international policies aiming at sustainable future use of these rangelands. ß 2014 Elsevier Ltd. All rights reserved. * Corresponding author at: PBL Netherlands Environmental Assessment Agency, PO Box 303, 3720 AH Bilthoven, The Netherlands. Tel.: +31 611738467. E-mail addresses: [email protected], [email protected] (K. Petz), [email protected] (R. Alkemade), [email protected] (M. Bakkenes), [email protected] (Catharina J.E. Schulp), [email protected] (M. van der Velde), [email protected] (R. Leemans). Contents lists available at ScienceDirect Global Environmental Change jo ur n al h o mep ag e: www .elsevier .co m /loc ate/g lo envc h a http://dx.doi.org/10.1016/j.gloenvcha.2014.08.007 0959-3780/ß 2014 Elsevier Ltd. All rights reserved.

Welcome message from author
This document is posted to help you gain knowledge. Please leave a comment to let me know what you think about it! Share it to your friends and learn new things together.
Transcript
Global Environmental Change 29 (2014) 223–234
Mapping and modelling trade-offs and synergies between grazingintensity and ecosystem services in rangelands using global-scaledatasets and models
Katalin Petz a,b,*, Rob Alkemade a,b, Michel Bakkenes a, Catharina J.E. Schulp c,Marijn van der Velde d,e, Rik Leemans b
a PBL Netherlands Environmental Assessment Agency, PO Box 303, 3720 AH Bilthoven, The Netherlandsb Environmental Systems Analysis Group, Wageningen University, PO Box 47, 6700AA Wageningen, The Netherlandsc VU University Amsterdam, Institute for Environmental Studies (IVM), De Boelelaan 1087, 1081 HV Amsterdam, The Netherlandsd European Commission, DG JRC, Institute for Environment and Sustainability, Ispra 21027, Italye International Institute for Applied Systems Analysis, Ecosystems Services and Management Program, Schlossplatz 1, A-2361 Laxenburg, Austria
A R T I C L E I N F O
Article history:
Received 22 November 2013
Received in revised form 21 August 2014
Accepted 27 August 2014
Available online
Keywords:
Biodiversity
Net primary production
Carbon sequestration
Erosion prevention
Rangeland
Livestock production
A B S T R A C T
Vast areas of rangelands across the world are grazed with increasing intensity, but interactions between
livestock production, biodiversity and other ecosystem services are poorly studied. This study explicitly
determines trade-offs and synergies between ecosystem services and livestock grazing intensity on
rangelands. Grazing intensity and its effects on forage utilization by livestock, carbon sequestration,
erosion prevention and biodiversity are quantified and mapped, using global datasets and models.
Results show that on average 4% of the biomass produced annually is consumed by livestock. On average,
erosion prevention is 10% lower in areas with a high grazing intensity compared to areas with a low
grazing intensity, whereas carbon emissions are more than four times higher under high grazing
intensity compared to low grazing intensity. Rangelands with the highest grazing intensity are located in
the Sahel, Pakistan, West India, Middle East, North Africa and parts of Brazil. These high grazing
intensities result in carbon emissions, low biodiversity values, low capacity for erosion prevention and
unsustainable forage utilization. Although the applied models simplify the processes of ecosystem
service supply, our study provides a global overview of the consequences of grazing for biodiversity and
ecosystem services. The expected increasing future demand for livestock products likely increase
pressures on rangelands. Global-scale models can help to identify targets and target areas for
international policies aiming at sustainable future use of these rangelands.
� 2014 Elsevier Ltd. All rights reserved.
Contents lists available at ScienceDirect
Global Environmental Change
jo ur n al h o mep ag e: www .e lsev ier . co m / loc ate /g lo envc h a
1. Introduction
Rangelands are primarily natural grasslands, scrublands,woodlands, wetlands and (semi-)deserts (Alkemade et al., 2013)and cover almost half of the world’s land area (FAO, 2005). Vastrangeland areas are used and managed for pastoral livestockgrazing with increasing intensity (MA, 2005; Steinfeld et al., 2006).Livestock production, which is the world’s principle land use,
* Corresponding author at: PBL Netherlands Environmental Assessment Agency,
PO Box 303, 3720 AH Bilthoven, The Netherlands. Tel.: +31 611738467.
E-mail addresses: [email protected], [email protected] (K. Petz),
[email protected] (R. Alkemade), [email protected] (M. Bakkenes),
[email protected] (Catharina J.E. Schulp), [email protected]
(M. van der Velde), [email protected] (R. Leemans).
http://dx.doi.org/10.1016/j.gloenvcha.2014.08.007
0959-3780/� 2014 Elsevier Ltd. All rights reserved.
creates livelihoods for one billion poor people through theirpastoralist livestock husbandry (Steinfeld et al., 2006). The largest
extent of pastoral livestock grazing systems is found in savannas,
grasslands, scrublands and (semi-)deserts (Asner et al., 2004). In
these areas, people rely directly on ecosystem services (ESs), such
as raw materials, food and water (Herrero et al., 2013a).
Additionally, rangelands store a vast amount of carbon (Herrero
et al., 2009; MA, 2005). ESs’ supply highly depends on the natural
productivity and management of rangelands. Management deter-
mines grazing intensity, the ratio between biomass grazed and
biomass produced (Bouwman et al., 2005). Increasing livestock
numbers and poor management cause widespread overgrazing
and degradation of rangelands (Asner et al., 2004; Khan and
Hanjra, 2009) and their ESs (MA, 2005; Steinfeld et al., 2006, 2010;
White et al., 2000). This raises the concern of how to manage
K. Petz et al. / Global Environmental Change 29 (2014) 223–234224
livestock production without compromising the environment andensure sustainable global food production (Herrero et al., 2013a;Herrero and Thornton, 2013).
Over the past decades, biodiversity decline and degradation ofecosystems and their services has brought about the formulation ofspecific international policy targets. Targets were set towardsachieving zero net land degradation by 2030, also by addressingthe interactions with biodiversity and climate change (Gisladottirand Stocking, 2005; United Nations Convention to CombatDesertification, 2012). Also the 2020 Aichi Targets of theConvention on Biological Diversity (CBD; Larigauderie et al.,2012; Mace et al., 2010) aim to enhance the benefits frombiodiversity and ESs, particularly water-related benefits (Target14) and climate change mitigation and adaptation (Target 15)through reducing pressure and restoring and safeguardingbiodiversity and ecosystems. Such international agreements serveas guidelines for national and regional policies aimed to promotethe restoration and sustainable management of ecosystems andESs.
A continuous increase of livestock grazing intensity, partlydriven by global demand for livestock products, may further impairbiodiversity, strengthen climate change (i.e. through additionalcarbon emissions or lowered sequestration capacity), acceleratesoil erosion and decrease water quality on rangelands (Dorroughet al., 2007; Herrero and Thornton, 2013; Steinfeld et al., 2006;White et al., 2000). Insight is required on the global extent of thesemanagement-related trade-offs between these ESs as to informpolicy making on the state and trends of these ESs. A geographi-cally explicit assessment can show where efforts are needed toachieve the international targets. Sustainable rangeland manage-ment could minimize the trade-offs and may even stimulatesynergies between multiple ESs (e.g. simultaneous enhancementof food production, biodiversity and other ESs). Understanding thespatial pattern of livestock grazing intensity and its effects on ESssupply is necessary to manage rangelands sustainably. However,the spatial pattern of grazing intensity is poorly known andcomprehensive global data on grazing systems are scarce(Kuemmerle et al., 2013). The few studies about the impact ofgrazing on ecological and hydrological processes or on ESs arequalitative (e.g. Asner et al., 2004), are not spatially explicit andcomprehensive (e.g. Steinfeld et al., 2010), cover only a specificaspect (e.g. Herrero et al., 2013b), or are limited to smallgeographic area (e.g. Ford et al., 2012; Dorrough et al., 2007). Asystems perspective supported by synthesized knowledge on theeffect of livestock management on biodiversity, ecologicalprocesses and human well-being, can support international policymaking and achieve sustainable food production (Herrero andThornton, 2013). The ES-based approach can provide suchsynthesized information (MA, 2003) and by considering multipleESs, the trade-off analysis between agriculture and biodiversitywill be complete (Grau et al., 2013). Linking a robust quantificationof ESs to grazing intensity would be a first step in identifying andquantifying the various trade-offs and possible synergies.
This study aims to quantify trade-offs and synergies betweenforage utilization for livestock production, carbon sequestration(or emissions), erosion prevention and biodiversity over a gradientof grazing intensity. We studied rangelands where livestock isproduced. Depending on their grazing intensity, different livestockproduction systems are possible: (1) grazing-based, (2) crop feed-based or (3) mixed systems (Bouwman et al., 2006; Herrero et al.,2009). The studied areas include original vegetation and excludeconverted lands and human-made pastures. The productivity ofthese areas thus directly relates to the natural production capacity(Easdale and Aguiar, 2012; MA, 2005). These rangelands stretchfrom tropical to temperate regions and are characterized mainly bygrazing-based and mixed livestock production systems. We
delineate areas where grazing and livestock production arecurrently unsustainable, meaning that ESs are impaired bylivestock grazing. This is achieved by analysing livestock grazingintensity and its consequences for ESs using global datasets andintegrated models, such as the Integrated Model to Assess theGlobal Environment (IMAGE; PBL, 2006) and the Global Biodiver-sity Model framework (GLOBIO3; Alkemade et al., 2009). Thesemodels have been used earlier for global international environ-mental and biodiversity science-policy assessments (Leadley,2010; OECD, 2012; UNEP, 2007). We will show how such globalmodelling helps to bridge data gaps regarding the management ofglobal rangelands.
2. Methods
Fig. 1 shows the conceptual framework of the processes relatedto ES provision in rangelands. Based on a review of literature, dataand models, we summarized the relations among the input data,livestock density and ESs. We first collected all available globalbiophysical and socio-economic data relevant for ES modelling(Appendix A), and selected and delineated rangelands using globalmaps (Section 2.1). Second, we quantified grazing intensity(Section 2.2). Third, we established relationships with ESs (Section2.3). Fourth, we analyzed the trade-offs and synergies between ESsunder varying grazing intensity and, finally, we performed asensitivity analysis to quantify the effects of model inputs on ESsoutputs (Section 2.4).
2.1. Data sources and delineation of rangelands
We used spatial data on biophysical properties and livestockdensity (Table 1). The selected datasets have a resolution higherthan 300, the common resolution of global assessment models, suchas IMAGE. These datasets were combined with intermediateoutputs from the IMAGE (Table 1).
The extent of rangeland ecosystems was derived from theGlobal Land Cover (GLC; JRC, 2003) database and global biome mapby Olson et al. (2001). Following Alkemade et al.’s (2013) approach,we used GLC to select vegetation types characteristic for range-lands (selected classes are: (1) shrub cover, closed-open, ever-green, (2) shrub cover, closed-open, deciduous, (3) herbaceouscover, close-open, (4) sparse herbaceous or sparse shrub cover, and(5) regularly flooded shrub and/or herbaceous cover). After this, weused Olson et al’s (2001) biome classification to select rangelandbiomes to restrict our areas to natural vegetation and exclude man-made pastures. The biome classes selected are (1) desert, (2)tropical and subtropical grassland, savannas and shrubland, (3)temperate grassland, savannas and shrubland, (4) montanegrassland, savannas and shrubland, and (5) mediterranean forests,woodlands and scrubs.
2.2. Quantifying grazing intensity
Grazing intensity was calculated as the ratio between biomassgrazed and biomass available for grazing. The grazed biomass is theplant biomass consumed by livestock and depends on livestockdensity. The available biomass depends on net primary production(NPP) and on the biome’s edibility. Livestock density data wereobtained from FAO (2007) (Fig. 2). We aggregated differentlivestock types into Tropical Livestock Units (TLU). The TLU is awidely used indicator to quantify different livestock types andsizes. We converted grazer densities, namely cattle, buffalo, sheepand goat into TLUs and then summed them. 1 TLU equals 250 kgbody weight (de Leeuw and Tothill, 1990) and conversion factorswe used are: one goat or sheep = 0.1 TLU, one cattle = 0.6 TLU andone buffalo = 0.5 TLU (FAO, 2012). NPP was estimated from
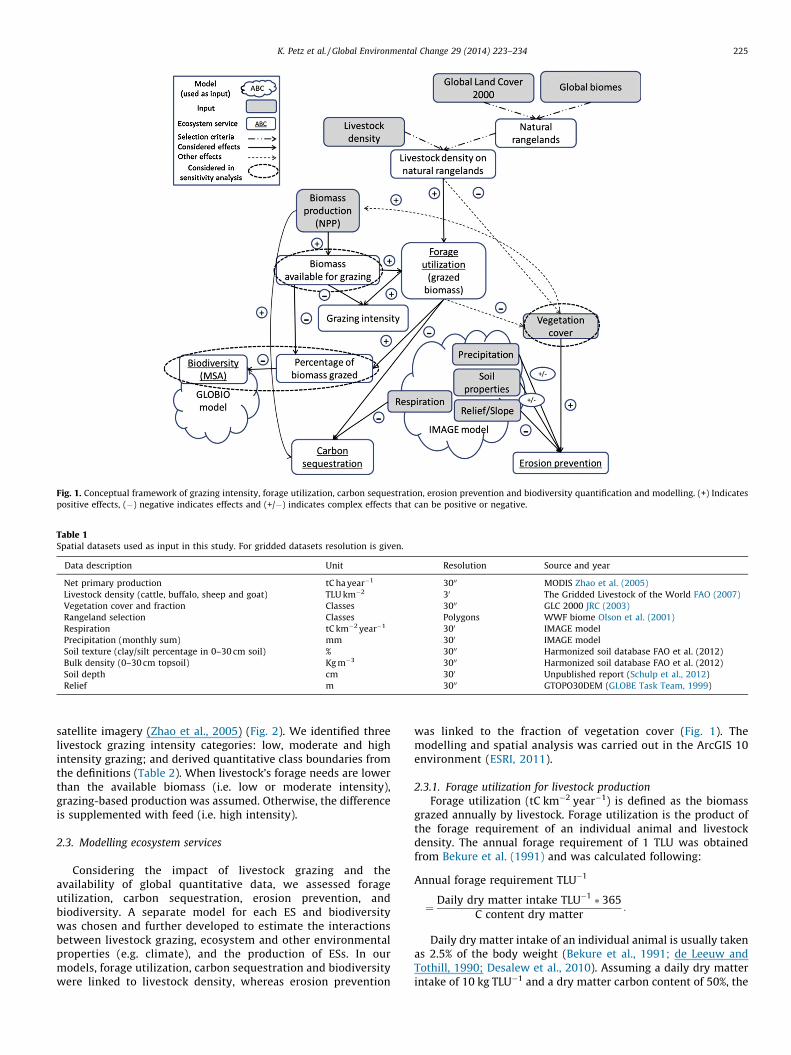
Fig. 1. Conceptual framework of grazing intensity, forage utilization, carbon sequestration, erosion prevention and biodiversity quantification and modelling. (+) Indicates
positive effects, (�) negative indicates effects and (+/�) indicates complex effects that can be positive or negative.
Table 1Spatial datasets used as input in this study. For gridded datasets resolution is given.
Data description Unit Resolution Source and year
Net primary production tC ha year�1 3000 MODIS Zhao et al. (2005)
Livestock density (cattle, buffalo, sheep and goat) TLU km�2 30 The Gridded Livestock of the World FAO (2007)
Vegetation cover and fraction Classes 3000 GLC 2000 JRC (2003)
Rangeland selection Classes Polygons WWF biome Olson et al. (2001)
Respiration tC km�2 year�1 300 IMAGE model
Precipitation (monthly sum) mm 300 IMAGE model
Soil texture (clay/silt percentage in 0–30 cm soil) % 3000 Harmonized soil database FAO et al. (2012)
Bulk density (0–30 cm topsoil) Kg m�3 3000 Harmonized soil database FAO et al. (2012)
Soil depth cm 300 Unpublished report (Schulp et al., 2012)
Relief m 3000 GTOPO30DEM (GLOBE Task Team, 1999)
K. Petz et al. / Global Environmental Change 29 (2014) 223–234 225
satellite imagery (Zhao et al., 2005) (Fig. 2). We identified threelivestock grazing intensity categories: low, moderate and highintensity grazing; and derived quantitative class boundaries fromthe definitions (Table 2). When livestock’s forage needs are lowerthan the available biomass (i.e. low or moderate intensity),grazing-based production was assumed. Otherwise, the differenceis supplemented with feed (i.e. high intensity).
2.3. Modelling ecosystem services
Considering the impact of livestock grazing and theavailability of global quantitative data, we assessed forageutilization, carbon sequestration, erosion prevention, andbiodiversity. A separate model for each ES and biodiversitywas chosen and further developed to estimate the interactionsbetween livestock grazing, ecosystem and other environmentalproperties (e.g. climate), and the production of ESs. In ourmodels, forage utilization, carbon sequestration and biodiversitywere linked to livestock density, whereas erosion prevention
was linked to the fraction of vegetation cover (Fig. 1). Themodelling and spatial analysis was carried out in the ArcGIS 10environment (ESRI, 2011).
2.3.1. Forage utilization for livestock production
Forage utilization (tC km�2 year�1) is defined as the biomassgrazed annually by livestock. Forage utilization is the product ofthe forage requirement of an individual animal and livestockdensity. The annual forage requirement of 1 TLU was obtainedfrom Bekure et al. (1991) and was calculated following:
Annual forage requirement TLU�1
¼ Daily dry matter intake TLU�1 � 365
C content dry matter:
Daily dry matter intake of an individual animal is usually takenas 2.5% of the body weight (Bekure et al., 1991; de Leeuw andTothill, 1990; Desalew et al., 2010). Assuming a daily dry matterintake of 10 kg TLU�1 and a dry matter carbon content of 50%, the
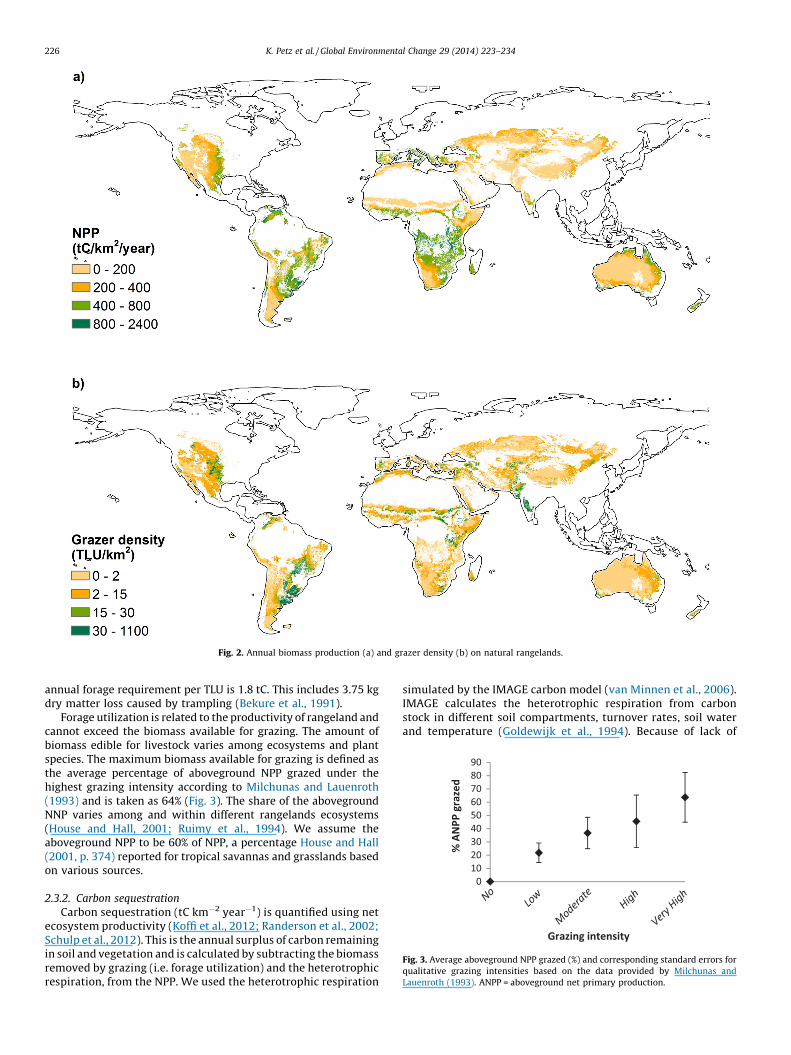
Fig. 2. Annual biomass production (a) and grazer density (b) on natural rangelands.
0102030405060708090
% A
NPP
gra
zed
Grazing intensity
Fig. 3. Average aboveground NPP grazed (%) and corresponding standard errors for
qualitative grazing intensities based on the data provided by Milchunas and
Lauenroth (1993). ANPP = aboveground net primary production.
K. Petz et al. / Global Environmental Change 29 (2014) 223–234226
annual forage requirement per TLU is 1.8 tC. This includes 3.75 kgdry matter loss caused by trampling (Bekure et al., 1991).
Forage utilization is related to the productivity of rangeland andcannot exceed the biomass available for grazing. The amount ofbiomass edible for livestock varies among ecosystems and plantspecies. The maximum biomass available for grazing is defined asthe average percentage of aboveground NPP grazed under thehighest grazing intensity according to Milchunas and Lauenroth(1993) and is taken as 64% (Fig. 3). The share of the abovegroundNNP varies among and within different rangelands ecosystems(House and Hall, 2001; Ruimy et al., 1994). We assume theaboveground NPP to be 60% of NPP, a percentage House and Hall(2001, p. 374) reported for tropical savannas and grasslands basedon various sources.
2.3.2. Carbon sequestration
Carbon sequestration (tC km�2 year�1) is quantified using netecosystem productivity (Koffi et al., 2012; Randerson et al., 2002;Schulp et al., 2012). This is the annual surplus of carbon remainingin soil and vegetation and is calculated by subtracting the biomassremoved by grazing (i.e. forage utilization) and the heterotrophicrespiration, from the NPP. We used the heterotrophic respiration
simulated by the IMAGE carbon model (van Minnen et al., 2006).IMAGE calculates the heterotrophic respiration from carbonstock in different soil compartments, turnover rates, soil waterand temperature (Goldewijk et al., 1994). Because of lack of
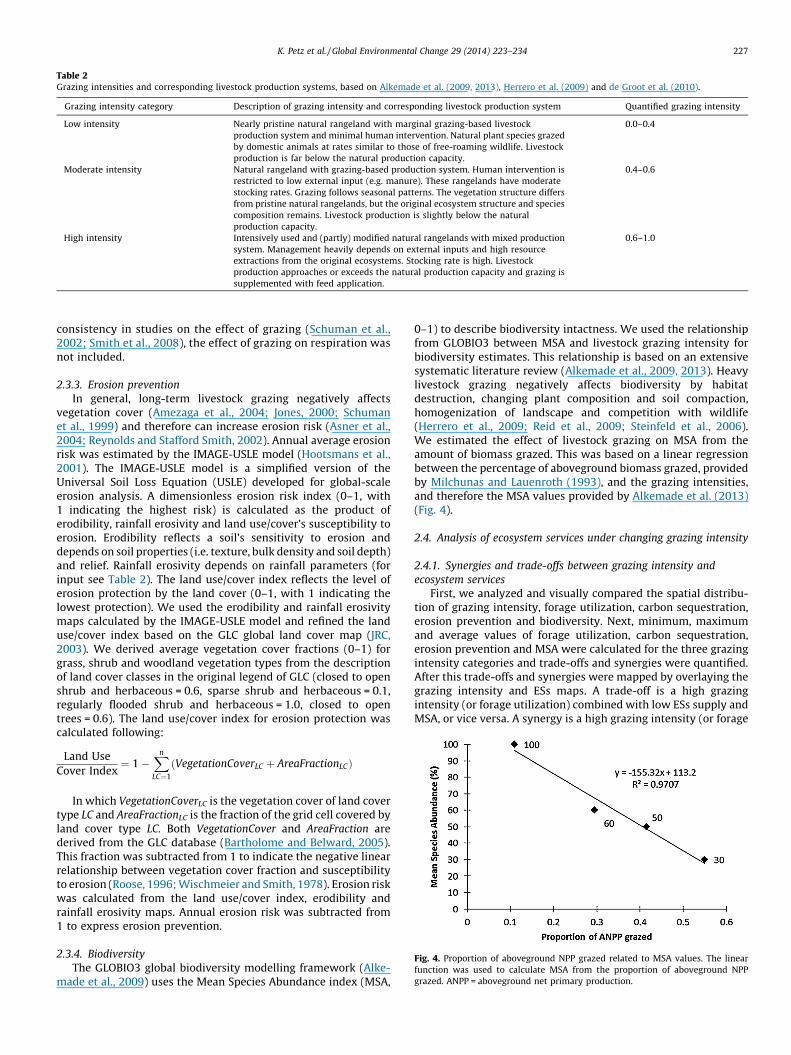
Fig. 4. Proportion of aboveground NPP grazed related to MSA values. The linear
function was used to calculate MSA from the proportion of aboveground NPP
grazed. ANPP = aboveground net primary production.
Table 2Grazing intensities and corresponding livestock production systems, based on Alkemade et al. (2009, 2013), Herrero et al. (2009) and de Groot et al. (2010).
Grazing intensity category Description of grazing intensity and corresponding livestock production system Quantified grazing intensity
Low intensity Nearly pristine natural rangeland with marginal grazing-based livestock
production system and minimal human intervention. Natural plant species grazed
by domestic animals at rates similar to those of free-roaming wildlife. Livestock
production is far below the natural production capacity.
0.0–0.4
Moderate intensity Natural rangeland with grazing-based production system. Human intervention is
restricted to low external input (e.g. manure). These rangelands have moderate
stocking rates. Grazing follows seasonal patterns. The vegetation structure differs
from pristine natural rangelands, but the original ecosystem structure and species
composition remains. Livestock production is slightly below the natural
production capacity.
0.4–0.6
High intensity Intensively used and (partly) modified natural rangelands with mixed production
system. Management heavily depends on external inputs and high resource
extractions from the original ecosystems. Stocking rate is high. Livestock
production approaches or exceeds the natural production capacity and grazing is
supplemented with feed application.
0.6–1.0
K. Petz et al. / Global Environmental Change 29 (2014) 223–234 227
consistency in studies on the effect of grazing (Schuman et al.,2002; Smith et al., 2008), the effect of grazing on respiration wasnot included.
2.3.3. Erosion prevention
In general, long-term livestock grazing negatively affectsvegetation cover (Amezaga et al., 2004; Jones, 2000; Schumanet al., 1999) and therefore can increase erosion risk (Asner et al.,2004; Reynolds and Stafford Smith, 2002). Annual average erosionrisk was estimated by the IMAGE-USLE model (Hootsmans et al.,2001). The IMAGE-USLE model is a simplified version of theUniversal Soil Loss Equation (USLE) developed for global-scaleerosion analysis. A dimensionless erosion risk index (0–1, with1 indicating the highest risk) is calculated as the product oferodibility, rainfall erosivity and land use/cover’s susceptibility toerosion. Erodibility reflects a soil’s sensitivity to erosion anddepends on soil properties (i.e. texture, bulk density and soil depth)and relief. Rainfall erosivity depends on rainfall parameters (forinput see Table 2). The land use/cover index reflects the level oferosion protection by the land cover (0–1, with 1 indicating thelowest protection). We used the erodibility and rainfall erosivitymaps calculated by the IMAGE-USLE model and refined the landuse/cover index based on the GLC global land cover map (JRC,2003). We derived average vegetation cover fractions (0–1) forgrass, shrub and woodland vegetation types from the descriptionof land cover classes in the original legend of GLC (closed to openshrub and herbaceous = 0.6, sparse shrub and herbaceous = 0.1,regularly flooded shrub and herbaceous = 1.0, closed to opentrees = 0.6). The land use/cover index for erosion protection wascalculated following:
Land Use
Cover Index¼ 1 �
Xn
LC¼1
ðVegetationCoverLC þ AreaFractionLCÞ
In which VegetationCoverLC is the vegetation cover of land covertype LC and AreaFractionLC is the fraction of the grid cell covered byland cover type LC. Both VegetationCover and AreaFraction arederived from the GLC database (Bartholome and Belward, 2005).This fraction was subtracted from 1 to indicate the negative linearrelationship between vegetation cover fraction and susceptibilityto erosion (Roose, 1996; Wischmeier and Smith, 1978). Erosion riskwas calculated from the land use/cover index, erodibility andrainfall erosivity maps. Annual erosion risk was subtracted from1 to express erosion prevention.
2.3.4. Biodiversity
The GLOBIO3 global biodiversity modelling framework (Alke-made et al., 2009) uses the Mean Species Abundance index (MSA,
0–1) to describe biodiversity intactness. We used the relationshipfrom GLOBIO3 between MSA and livestock grazing intensity forbiodiversity estimates. This relationship is based on an extensivesystematic literature review (Alkemade et al., 2009, 2013). Heavylivestock grazing negatively affects biodiversity by habitatdestruction, changing plant composition and soil compaction,homogenization of landscape and competition with wildlife(Herrero et al., 2009; Reid et al., 2009; Steinfeld et al., 2006).We estimated the effect of livestock grazing on MSA from theamount of biomass grazed. This was based on a linear regressionbetween the percentage of aboveground biomass grazed, providedby Milchunas and Lauenroth (1993), and the grazing intensities,and therefore the MSA values provided by Alkemade et al. (2013)(Fig. 4).
2.4. Analysis of ecosystem services under changing grazing intensity
2.4.1. Synergies and trade-offs between grazing intensity and
ecosystem services
First, we analyzed and visually compared the spatial distribu-tion of grazing intensity, forage utilization, carbon sequestration,erosion prevention and biodiversity. Next, minimum, maximumand average values of forage utilization, carbon sequestration,erosion prevention and MSA were calculated for the three grazingintensity categories and trade-offs and synergies were quantified.After this trade-offs and synergies were mapped by overlaying thegrazing intensity and ESs maps. A trade-off is a high grazingintensity (or forage utilization) combined with low ESs supply andMSA, or vice versa. A synergy is a high grazing intensity (or forage
K. Petz et al. / Global Environmental Change 29 (2014) 223–234228
utilization) combined with high ESs supply and MSA. Meaningfulthresholds for high and low values were identified based ondefinitions and literature:
� Grazing intensity: <0.4 is low and >0.6 is high (derived from thedefinitions given in Table 2).� Carbon sequestration: <0 is emission and >0 is sequestration
(derived from the general definition of carbon sequestration andemission).� Erosion prevention: <0.7 low/moderate and >0.7 is high
(1-erosion sensitivity following the classification of Hootsmanset al., 2001).� MSA: <0.7 low/moderate and >0.7 high (based on Alkemade
et al., 2009).
2.4.2. Sensitivity analysis
To test the robustness of the modelling approach, we analyzedhow sensitive each ES and biodiversity is to changes in modelinputs by selecting and testing three key inputs that cover all ESsand biodiversity. The following changes in the three inputs weremade and their effects on outputs were analyzed:
� Reducing the ‘maximum biomass available for grazing’ substan-tially (from 64% to 32% of the aboveground NPP) to reflect thestandard deviation of the data provided by Milchunas andLauenroth (1993) and to investigate its consequences for forageutilization, carbon sequestration and MSA.� Modifying the ‘% of aboveground NPP grazed – MSA’ relation to
investigate the consequences of the standard deviation ofaboveground NPP grazed provided by Milchunas and Lauenroth(1993) for MSA (Figs. 3 and 4). First the minimum(y = �248.37x + 114.31) and then the maximum abovegroundNPP grazed value (y = �113.78x + 112.44) was taken for corre-sponding management intensities.� Changing the ‘vegetation cover fraction’ input map to investigate
the consequences of the different vegetation classificationsystems and map resolutions for erosion prevention:
- GLC map with herbaceous, shrub and tree classes, resolution1 km � 1 km (JRC, 2003).
- MODIS tree cover map, resolution 500 m � 500 m (Hansen et al.,2003).
- MODIS MOD12C1 0.25 Degree Land Cover: combined ‘grass’ and‘closed shrublands’ maps, resolution 28 km � 28 km (http://webmap.ornl.gov/wcsdown/).
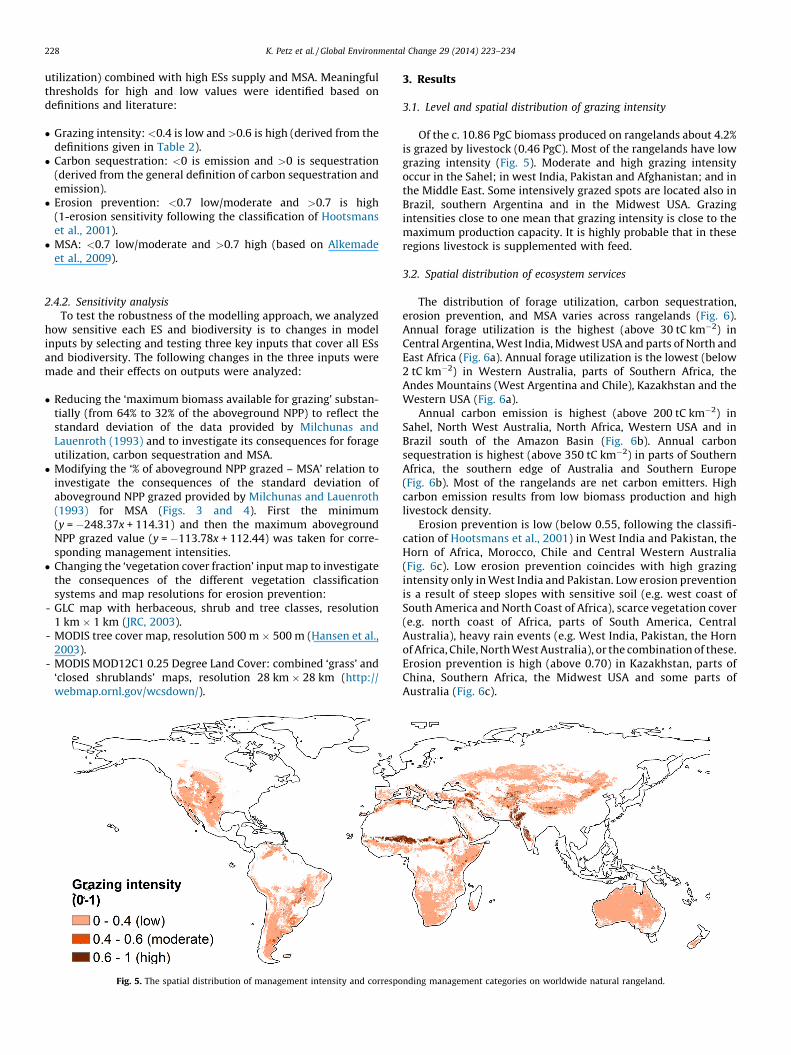
Fig. 5. The spatial distribution of management intensity and correspo
3. Results
3.1. Level and spatial distribution of grazing intensity
Of the c. 10.86 PgC biomass produced on rangelands about 4.2%is grazed by livestock (0.46 PgC). Most of the rangelands have lowgrazing intensity (Fig. 5). Moderate and high grazing intensityoccur in the Sahel; in west India, Pakistan and Afghanistan; and inthe Middle East. Some intensively grazed spots are located also inBrazil, southern Argentina and in the Midwest USA. Grazingintensities close to one mean that grazing intensity is close to themaximum production capacity. It is highly probable that in theseregions livestock is supplemented with feed.
3.2. Spatial distribution of ecosystem services
The distribution of forage utilization, carbon sequestration,erosion prevention, and MSA varies across rangelands (Fig. 6).Annual forage utilization is the highest (above 30 tC km�2) inCentral Argentina, West India, Midwest USA and parts of North andEast Africa (Fig. 6a). Annual forage utilization is the lowest (below2 tC km�2) in Western Australia, parts of Southern Africa, theAndes Mountains (West Argentina and Chile), Kazakhstan and theWestern USA (Fig. 6a).
Annual carbon emission is highest (above 200 tC km�2) inSahel, North West Australia, North Africa, Western USA and inBrazil south of the Amazon Basin (Fig. 6b). Annual carbonsequestration is highest (above 350 tC km�2) in parts of SouthernAfrica, the southern edge of Australia and Southern Europe(Fig. 6b). Most of the rangelands are net carbon emitters. Highcarbon emission results from low biomass production and highlivestock density.
Erosion prevention is low (below 0.55, following the classifi-cation of Hootsmans et al., 2001) in West India and Pakistan, theHorn of Africa, Morocco, Chile and Central Western Australia(Fig. 6c). Low erosion prevention coincides with high grazingintensity only in West India and Pakistan. Low erosion preventionis a result of steep slopes with sensitive soil (e.g. west coast ofSouth America and North Coast of Africa), scarce vegetation cover(e.g. north coast of Africa, parts of South America, CentralAustralia), heavy rain events (e.g. West India, Pakistan, the Hornof Africa, Chile, North West Australia), or the combination of these.Erosion prevention is high (above 0.70) in Kazakhstan, parts ofChina, Southern Africa, the Midwest USA and some parts ofAustralia (Fig. 6c).
nding management categories on worldwide natural rangeland.
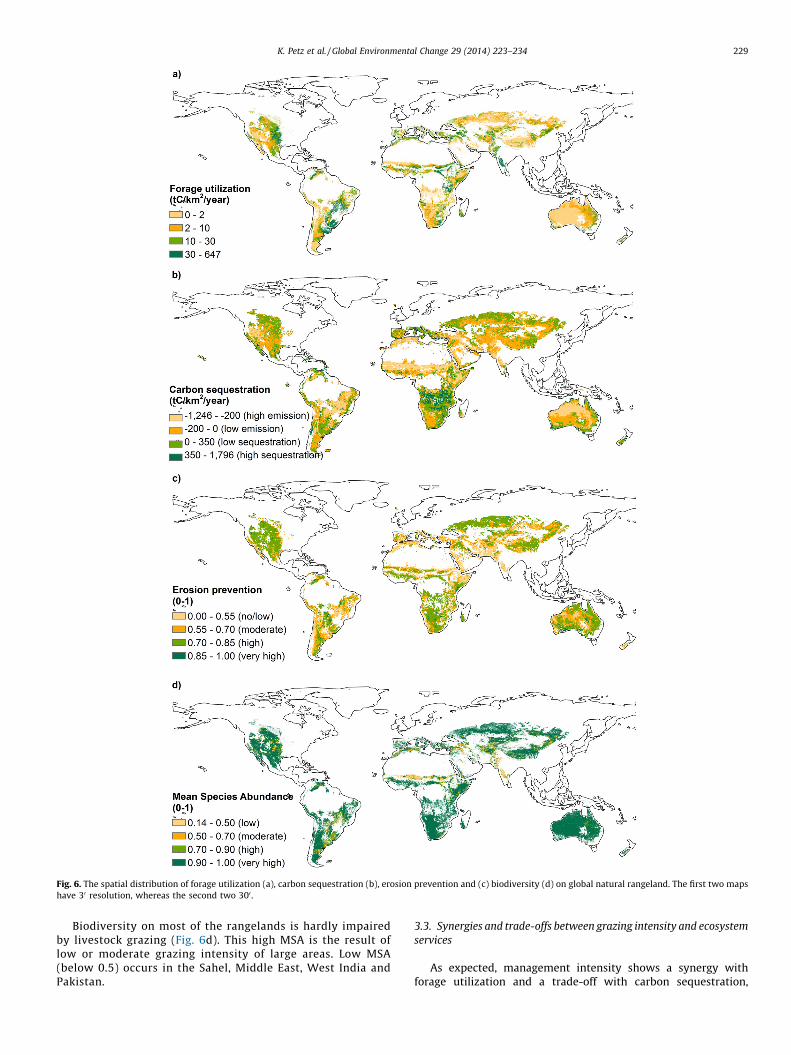
Fig. 6. The spatial distribution of forage utilization (a), carbon sequestration (b), erosion prevention and (c) biodiversity (d) on global natural rangeland. The first two maps
have 30 resolution, whereas the second two 300 .
K. Petz et al. / Global Environmental Change 29 (2014) 223–234 229
Biodiversity on most of the rangelands is hardly impairedby livestock grazing (Fig. 6d). This high MSA is the result oflow or moderate grazing intensity of large areas. Low MSA(below 0.5) occurs in the Sahel, Middle East, West India andPakistan.
3.3. Synergies and trade-offs between grazing intensity and ecosystem
services
As expected, management intensity shows a synergy withforage utilization and a trade-off with carbon sequestration,
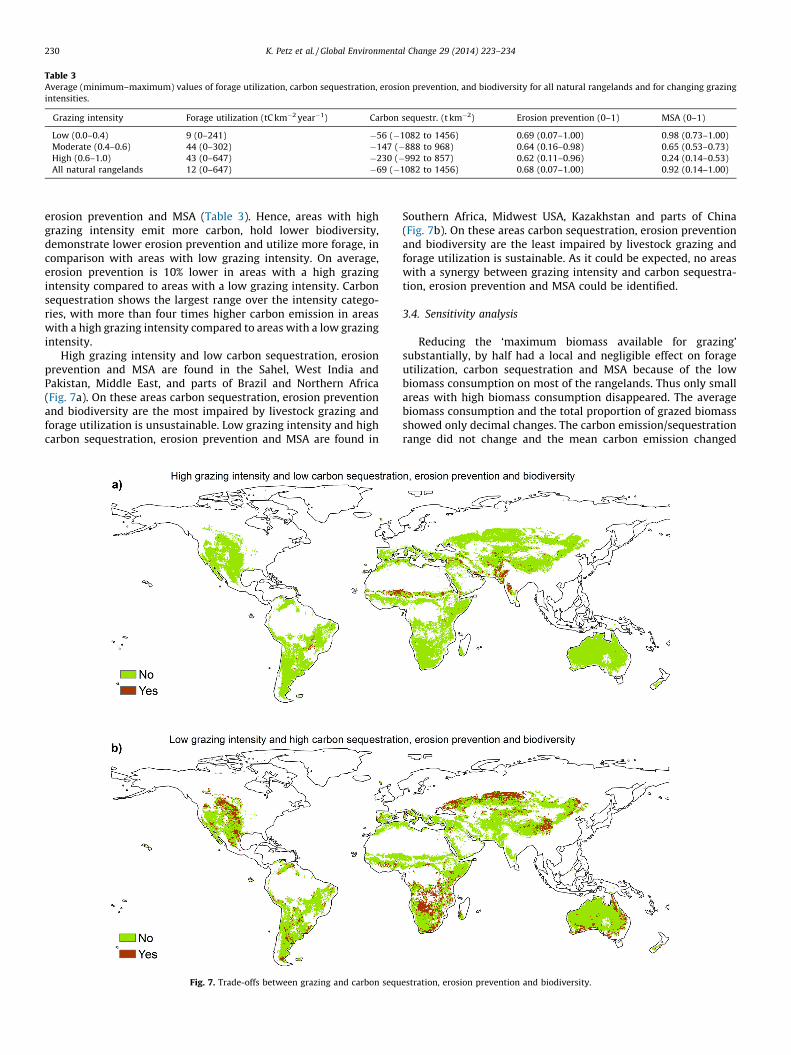
Table 3Average (minimum–maximum) values of forage utilization, carbon sequestration, erosion prevention, and biodiversity for all natural rangelands and for changing grazing
intensities.
Grazing intensity Forage utilization (tC km�2 year�1) Carbon sequestr. (t km�2) Erosion prevention (0–1) MSA (0–1)
Low (0.0–0.4) 9 (0–241) �56 (�1082 to 1456) 0.69 (0.07–1.00) 0.98 (0.73–1.00)
Moderate (0.4–0.6) 44 (0–302) �147 (�888 to 968) 0.64 (0.16–0.98) 0.65 (0.53–0.73)
High (0.6–1.0) 43 (0–647) �230 (�992 to 857) 0.62 (0.11–0.96) 0.24 (0.14–0.53)
All natural rangelands 12 (0–647) �69 (�1082 to 1456) 0.68 (0.07–1.00) 0.92 (0.14–1.00)
K. Petz et al. / Global Environmental Change 29 (2014) 223–234230
erosion prevention and MSA (Table 3). Hence, areas with highgrazing intensity emit more carbon, hold lower biodiversity,demonstrate lower erosion prevention and utilize more forage, incomparison with areas with low grazing intensity. On average,erosion prevention is 10% lower in areas with a high grazingintensity compared to areas with a low grazing intensity. Carbonsequestration shows the largest range over the intensity catego-ries, with more than four times higher carbon emission in areaswith a high grazing intensity compared to areas with a low grazingintensity.
High grazing intensity and low carbon sequestration, erosionprevention and MSA are found in the Sahel, West India andPakistan, Middle East, and parts of Brazil and Northern Africa(Fig. 7a). On these areas carbon sequestration, erosion preventionand biodiversity are the most impaired by livestock grazing andforage utilization is unsustainable. Low grazing intensity and highcarbon sequestration, erosion prevention and MSA are found in
Fig. 7. Trade-offs between grazing and carbon sequ
Southern Africa, Midwest USA, Kazakhstan and parts of China(Fig. 7b). On these areas carbon sequestration, erosion preventionand biodiversity are the least impaired by livestock grazing andforage utilization is sustainable. As it could be expected, no areaswith a synergy between grazing intensity and carbon sequestra-tion, erosion prevention and MSA could be identified.
3.4. Sensitivity analysis
Reducing the ‘maximum biomass available for grazing’substantially, by half had a local and negligible effect on forageutilization, carbon sequestration and MSA because of the lowbiomass consumption on most of the rangelands. Thus only smallareas with high biomass consumption disappeared. The averagebiomass consumption and the total proportion of grazed biomassshowed only decimal changes. The carbon emission/sequestrationrange did not change and the mean carbon emission changed
estration, erosion prevention and biodiversity.
K. Petz et al. / Global Environmental Change 29 (2014) 223–234 231
negligibly. Areas with low MSA values slightly expanded in Sahel,West India and Pakistan.
The modification of the ‘% aboveground NPP grazing – MSA’relation had a small effect. Using the minimum values of theaboveground NPP grazed decreased the average MSA from 0.92 to0.87, and using the maximum values of the aboveground NPPgrazed increased the average MSA to 0.95. The spatial distributionof MSA values did not change.
The map of the vegetation cover fraction had a bigger effect onthe spatial pattern of erosion prevention than on the average valueof erosion prevention. The value range of erosion preventionslightly decreased with the MODIS tree cover map (0.13–1.00) anddecreased even further with the MODIS grass and shrub covermaps (0.29–1.00) compared to the GLC map (0.07–1.00). Opposedto the GLC map, none of the MODIS maps covers rangelandscompletely. The MODIS tree cover map has the smallest coverageand the corresponding erosion map shows low erosion preventionin the Horn of Africa, Chile and North Australia. This is similar tothe erosion map based on the GLC map. The erosion map derivedfrom the MODIS grass and shrub maps indicates low erosionprevention in the Horn of Africa, Midwest USA and Kazakhstan-Mongolia-Inner-China. This differs from the erosion map based onthe GLC map. We attribute these relatively big differences in theerosion maps to inconsistencies in coverage and vegetation typesand the inputs classifications.
4. Discussion
The impact of livestock grazing on global grasslands anddrylands and their ESs has been documented in global assessments(MA, 2005; White et al., 2000) and recent scientific literature(Herrero and Thornton, 2013). Because of the data gaps and thelimitations of current spatial dataset, management patterns andtheir impacts on ESs are, generally, quantified using spatial models.Our approach and results are likely credible as we used widelyaccepted global datasets and robust model parameters andassumptions. Our methodology’s limitation and strengths, theresults’ validity and policy and management relevance arediscussed below.
4.1. Advances of the applied modelling method
Global mapping and modelling of ESs have been limited to afew, mainly provisioning and regulating services including foodprovision, water availability and carbon storage and sequestration(Naidoo et al., 2008; Schulp et al., 2012). We investigated these ESstogether with biodiversity, and placed them in the context ofrangeland management and grazing intensity. The impacts ofgrazing on biodiversity have been well-documented (Reid et al.,2009). Existing land-use statistics on grazing land are limited tolivestock densities, and data about the extent of grazing land andthe spatial pattern and amount of biomass grazed are missing (Erbet al., 2009; Kuemmerle et al., 2013). This study thus goes beyondcurrent knowledge by quantifying grazed biomass and studyingthe impacts of livestock production and its sustainability in thecontext of natural production capacities using ESs.
This study combined spatial datasets and data from meta-analysis with model relations. Model relations bridge data gapsand generate extensive spatial information, when quantitative orempirical data are missing or are available only from a small suiteof cases. Applying empirical relationships to ecosystem propertiesis a common ESs modelling approach (e.g. Schulp and Alkemade,2011; Maes et al., 2012).
Our approach has several advances. Biodiversity intactness wasestimated by GLOBIO3 that uses general relationships for effects ofland use, infrastructure, climate change and fragmentation (PBL,
2006). This prior study reclassified GLC land cover/use classes tobiodiversity impacts. As an improvement to this, we established acontinuous relationship between grazed biomass and MSA toobtain a more refined picture on grazing effects. The 30 resolutionat which we mapped forage utilization and biodiversity, is higherthan the resolution at which most global models operate. Therefined land use/cover index we used to quantify and map erosionprevention is also an improvement compared to the rough landcover and crop classes that Hootsmans et al. (2001) used. Futureresearch may focus on the inclusion of additional ESs and socio-economic data (Appendix A).
4.2. Uncertainties of global datasets
Combining different datasets in a model may induce uncer-tainties in the final results. Global datasets are often estimatedfrom base data sources with modelling techniques and involve acertain error. One should be aware of the uncertainty involved inglobal-scale datasets and data products. The uncertainties ofinputs and modelling relations propagates into model outputs andcan have large effects on the results, especially when it comes toglobal datasets (Schulp and Alkemade, 2011).
Globally, due to the limited data availability the same datasetsare often used for multiple purposes. For example, similarly theoriginal MSA values presented by Alkemade et al. (2009), the MSAvalues we derived from the proportion of grazed biomass are partlydependent on land cover and grazing intensity. Because of thesedata constrains, autocorrelations can be inherent to the modellingapproach globally.
High-resolution and high-accuracy spatial data are key forglobal ES modelling. Although the spatial resolution of globalmodels is often limited to 300 (Verburg et al., 2012), this studyshowed that higher resolution (30) modelling is also possible.Higher resolution, however, does not necessarily mean higheraccuracy. The lower resolution GLC land cover map, for example,has a higher thematic accuracy than the more detailed GlobCoverland cover map (Fritz et al., 2011).
Although proper validation of global datasets is extremelydifficult due to differences in temporal and spatial consistencies,classification systems and scaling (Kuemmerle et al., 2013;Verburg et al., 2011), these datasets remain the sole informationsources when it comes to global environmental modelling. Theglobal livestock density map is based on partly incomplete nationallivestock statistics and was created using disaggregation andmodelling techniques (FAO, 2007). It also cannot be used tocorrelate livestock density with biomass production because thelatter was already used to disaggregate the national livestocknumbers (Kuemmerle et al., 2013). Nevertheless, as no alternativedataset for livestock density is available (Appendix A), the FAOlivestock density map is the best possible dataset to analyze feedrequirements and quantify and distribute environmental impactsof livestock production (FAO, 2007).
The effects of uncertainties of the input data can be addressedadequately with a sensitivity analysis. The sensitivity analysisrevealed that maps of vegetation cover fraction strongly alter theresults, while the impact of uncertainties in the other inputs wasrelatively limited. The results are therefore considered robust.
4.3. Grazed biomass close to prior estimates
The areas contributing most to the global livestock productionare outside rangelands (i.e. feed-based systems in Europe, Indiaand USA). Nevertheless, grass consumption accounts for close tohalf of feed use in grazing-based and mixed livestock productionsystems (Herrero et al., 2013b). In Latin America, the Middle East,the Indian subcontinent, and East Asia, grazing is dominated by
K. Petz et al. / Global Environmental Change 29 (2014) 223–234232
domesticated animals in extensive grazing-based productionsystems (Bouwman et al., 1997; Herrero et al., 2013b).
The few global studies that estimated annually grazed biomassshow big variations depending on the definition of grazing landand applied methods (Haberl et al., 2007). Although our estimate(0.46 PgC) is on the lower side, it is of the same order of magnitudeas previous estimates calculated from feed balances (1.2 PgC and0.4 PgC (Haberl et al., 2007), 2.4 PgC (Imhoff et al., 2004)). Bondeauet al. (2007) estimated the annual grazed biomass at �3.8 PgC onall grazed land for the year 2000 with the global LPJ model. Thisestimate is very high because high livestock intensity wassimulated. We studied only rangelands (i.e. grazing areas withnatural vegetation), while other studies included a larger extent ofgrazing land, explaining our low estimate. Additionally, we used alivestock density map derived from actual statistics, thus closelymatching actual livestock numbers.
About 3–10% of the consumable NPP is eaten by wild animals(Bouwman et al., 1997). This is comparable to the average biomassconsumption we calculated for livestock (c. 4.2%). It would beworth to investigate the effect of livestock grazing on wildlife andthe effect of wildlife grazing on biomass. This is particularlyrelevant for areas where wild grazers are abundant and over-grazing is a problem, such as Africa and Australia.
4.4. Interpretation of ecosystem services results and comparison with
other studies
To assess the credibility of the results, model results werecompared with independent datasets and model outputs, wherepossible. We visually compared ESs value ranges and patterns withother studies. The pattern of our forage utilization map agrees withthe global grassland (meat) production map of Naidoo et al. (2008),as both indicate high values for Central Argentina, West India,Midwest USA and parts of East Africa. This is not surprising, asNaidoo et al. (2008) based the calculations also on the FAO’s livestockdensity map (2007). The forage utilization map shows also a similarpattern with the grazed biomass consumption map derived frommodelled grassland productivity by Herrero et al. (2013b).
The carbon sequestration we estimated is seemingly low, asmost rangelands were found to emit carbon. Savannas andgrasslands sequester less carbon or even emit carbon as aconsequence of dry weather (Potter et al., 2012) grazing anddegradation (Grace et al., 2006; Steinfeld et al., 2006). Our carbonsequestration estimates agree with the high carbon emission inSahel, parts of Brazil, Central Australia and Pakistan-Indiaindicated by Naidoo et al. (2008). At the same time, our resultsshow net sequestration for Southern Africa whereas Naidoo et al.(2008) showed net emission. The high NPP and low intensityexplain our carbon sequestration result for Southern Africa.Similarly to Naidoo et al. (2008), we also found a negativerelationship between grassland (meat) production and carbonsequestration.
Much of the rangelands fall under biodiversity hotspots andconservation priority areas (Myers et al., 2000), including the areasimpaired by livestock grazing in North Africa and India (Fig. 6d).Although the relationship between grazing intensity and MSA ismodelled to be negative, light grazing can also increase speciesdiversity locally and can be a mean to conserve biodiversity(Steinfeld et al., 2006). Our estimated effect of livestock grazing onMSA seems low. Our results only show the effect of grazing itself.However, grazing is related to additional indirect pressures, suchas land use change and fragmentation. Generally the conversion oforiginal ecosystems to agriculture is the main cause of habitat lossand biodiversity loss (Pereira et al., 2012), while the impact ofgrazing itself is only a small fraction of the impact on biodiversity.This is also supported by prior GLOBIO3 model results (PBL, 2006).
Higher erosion prevention was projected for areas with highertree cover, and lower erosion prevention was projected for areaswith higher bare cover. This is a much more refined picture oferosion prevention compared to the original results by Hootsmanset al. (2001). The pattern of erosion prevention agrees with theglobal erosion modelling results of Yang et al. (2003), whoestimated similarly low erosion prevention for Pakistan–India,parts of South America, North Africa and the Horn of Africa. At thesame time, they estimated higher erosion prevention for Australiaand lower erosion prevention for the Western USA and parts ofSouth Africa. As we demonstrated that the erosion model used inthis study is sensitive to the input vegetation cover map, this smalldifference may come from the differences in input datasets. Also,Yang et al. (2003) used another erosion risk model (RUSLE vs.IMAGE-USLE).
The on-going transformation and degradation of rangelandsand intensified livestock management leads to loss of biodiversity(Pereira et al., 2012; Steinfeld et al., 2010) and to net carbon loss tothe atmosphere (Grace et al., 2006; White et al., 2000). Our studyemphasizes the big pressures certain regions face, especially theSahel, Middle East, and parts of India and North Africa. Campbelland Stafford Smith (2000) identified semi-arid and subtropicalgrassland (e.g. Sahel, Mongolia and China) as regions most exposedto environmental change, because of their sensitive vegetation andthe increasing pressure due to food production requirements.Sahel is among the regions that experience the biggest increasealso in crop production areas (Phalan et al., 2013).
4.5. Implications for policy making and management
Rangeland decision makers, such as land managers and nationalor international policy makers, need information about the naturalproductivity of rangelands and livestock grazing effects to developregion-specific policies and management strategies (Campbell andStafford Smith, 2000). Policies and management strategies affectmultiple ecosystems and ESs, while data are often available onlyfrom one or a few ecosystems (Campbell and Stafford Smith, 2000).Therefore, spatially explicit global studies that study managementeffects and quantify trade-offs and synergies among ESs haveimportant implications for land managers and policy makers.Spatial data and GIS has been used to diagnose conservationproblems and develop solutions for them, as well as to analyze theimpact of management decisions on biodiversity and ESs at coarsescales (Swetnam and Reyers, 2011).
Our spatially explicit modelling approach allows the evaluationof different policy options, and helps developing future outlooksassessing progress towards international policy targets and loca-tion-specific solutions for global livestock production, biodiversityconservation and climate change. The results thus inform policymakers on ESs trade-offs and may guide better priority setting.Currently sustainably grazed areas (e.g. Southern Africa and parts ofCentral Asia, among others) are valuable for conservation in order tomaintain the long-term provision of ESs. Opposed to this, areasfacing forage shortage, erosion, degraded biodiversity and highcarbon emissions (e.g. Sahel, Middle East, Northern Africa, Pakistanand West India) face often also undernourishment (Rockstrom et al.,2007) and will have problems meeting future food demands(Herrero and Thornton, 2013). In these areas mixed productionsystems are dominating (Herrero et al., 2013b). Therefore, theseareas would require the application of (additional) feed supplementto meet demand for livestock products and a more efficient resourceuse to halt biodiversity decline and decrease carbon emission at thesame time. Regional and national policies should target farmers inthese areas to invest in mixed production systems and carefullyintensify production to minimize environmental impacts (Herreroet al., 2010).
K. Petz et al. / Global Environmental Change 29 (2014) 223–234 233
5. Conclusion
We quantified trade-offs and synergies by quantifying andmapping the consequences of grazing management for ESs andbiodiversity on rangelands. Supported by the comparison withother studies, our livestock density, NPP and vegetation coverfraction-based results are a first-order estimate of the effect ofgrazing intensity on ESs. Results show that increased livestock andgrazing intensity triggers higher carbon emissions, and lowererosion prevention and biodiversity. Areas with high carbonsequestration, erosion prevention and biodiversity (e.g. SouthernAfrica and parts of Central Asia) are currently sustainably grazedand are valuable for conservation. Opposed to this, restoration, lessintensive grazing and feed supplement are applicable on areaswhere one or more of these ESs or biodiversity are impaired andthe natural production capacity is therefore unsustainable (e.g.Sahel, Middle East, Northern Africa, Pakistan and West India).
Our study is among the first studies to quantify and relate the spatialpatterns of ESs to rangelands management. The characterization ofrangeland management is generally difficult compared to croplandsdue to the complexity of rangeland ecosystems (e.g. wide diversity inplant communities, soils and landscapes), diverse grazing practices andinconsistent responses to grazing intensity (Schuman et al., 2002;Smith et al., 2008). Although models are simplifications of real worldprocesses and the underlying data and assumptions contain uncer-tainties, we emphasize that model applications provide policy relevantinformation to protect biodiversity and manage ESs. This studycombined available spatial datasets withquantitative information frommeta-analysis studies and models. This efficiently quantifies the spatialdistribution of ESs when quantitative empirical information is scarce.This was already suggested by earlier studies (Rounsevell et al., 2012;Verburg et al., 2011), but now also concretely demonstrated.
We conclude that global modelling enables the understandingof grazing patterns and their quantitative impacts on ESs andtherefore helps to identify areas that are (most) threatened bylivestock grazing. In these areas, particularly, policy making andrangeland management will have an important role in improvingthe provision of ESs and human well-being in the future. Livestockand environmental trade-offs are expected to increase furthersignificantly in the future as a result of increasing demand forlivestock products (Herrero et al., 2009). This increasing demandwill likely put rangelands under an even bigger pressure. Thisstudy is therefore an important start to facilitate sustainablerangeland management and biodiversity conservation.
Acknowledgements
This work was conducted as part of the Young ScientistsSummer Program 2012 at the International Institute for AppliedSystems Analysis (IIASA), Laxenburg, Austria. The author thanksthe IIASA staff for providing this research opportunity. Further-more, the authors would also like to thank the staff of PBLNetherlands Environmental Assessment Agency for making thisresearch possible through technical support, discussions andproviding model data.
Appendix A. Supplementary data
Supplementary data associated with this article can be found, in
the online version, at doi:10.1016/j.gloenvcha.2014.08.007.
References
Alkemade, R., Reid, R.S., van den Berg, M., de Leeuw, J., Jeuken, M., 2013. Assessingthe impacts of livestock production on biodiversity in rangeland ecosystems.Proc. Natl. Acad. Sci., http://dx.doi.org/10.1073/pnas.1011013108.
Alkemade, R., van Oorschot, M., Miles, L., Nellemann, C., Bakkenes, M., ten Brink, B.,2009. GLOBIO3: a framework to investigate options for reducing global terres-trial biodiversity loss. Ecosystems 12, 374–390.
Amezaga, I., Mendarte, S., Albizu, I., Besga, G., Garbisu, C., Onaindia, M., 2004.Grazing intensity, aspect, and slope effects on limestone grassland structure.Rangel. Ecol. Manag. 57, 606–612.
Asner, G.P., Elmore, A.J., Olander, L.P., Martin, R.E., Harris, A.T., 2004. Grazingsystems, ecosystem responses, and global change. Annu. Rev. Environ. Resour.29, 261–299.
Bartholome, E., Belward, A.S., 2005. GLC2000: a new approach to global land covermapping from Earth observation data. Int. J. Remote Sens. 26, 1959–1977.
Bekure, S., de Leeuw, P.N., Gradin, B.E., Neate, P.J.H., 1991. Maasai Herding: AnAnalysis of the Livestock Production System of Maasai Pastoralists in EasternKajiado District, Kenya. ILCA System Studies 4 ILCA (International LivestockCentre for Africa), Addis Ababa, Ethiopia.
Bondeau, A., Smith, P.C., Zaehle, S., Schaphoff, S., Lucht, W., Cramer, W., Gerten, D.,2007. Modelling the role of agriculture for the 20th century global terrestrialcarbon balance. Global Change Biol. 13, 679–706.
Bouwman, A., Lee, D., Asman, W., Dentener, F., Van Der Hoek, K., Olivier, J., 1997. Aglobal high-resolution emission inventory for ammonia. GlobalBiogeochem. Cycles 11, 561–587.
Bouwman, A.F., Van der Hoek, K.W., Eickhout, B., Soenario, I., 2005. Exploringchanges in world ruminant production systems. Agric. Syst. 84, 121–153.
Bouwman, A.F., Van der Hoek, K.W., Van Drecht, G., 2006. Modelling livestock–crop-land use interactions in global agricultural production systems. In: Bouwman,A.F., Kram, T., Goldewijk, KK. (Eds.), Integrated Modelling of Global Environ-mental Change. An Overview of IMAGE 2.4. Netherlands Environmental Assess-ment Agency, Bilthoven, The Netherlands, pp. 77–92.
Campbell, B.D., Stafford Smith, D.M., 2000. A synthesis of recent global changeresearch on pasture and rangeland production: reduced uncertainties and theirmanagement implications. Agric. Ecosyst. Environ. 82, 39–55.
de Leeuw, P.N., Tothill, J.C., 1990. The Concept of Rangeland Carrying Capacity inSub-Saharan Africa: Myth or Reality. Overseas Development Institute, PastoralDevelopment Network London, London.
De Groot, R.S., Alkemade, R., Braat, L., Hein, L., Willemen, L., 2010. Challenges inintegrating the concept of ecosystem services and values in landscape planningmanagement and decision making. Ecological Complexity 7 (3) 260–272.
Desalew, T., Tegegne, A., Nigatu, L., Teka, W., 2010. Rangeland Condition and FeedResources in Metema District, North Gondar Zone, Amhara Region,Ethiopia. IPMS (Improving Productivity and Market Success) of EthiopianFarmers Project Working Paper 25International Livestock Research Institute(ILRI), Nairobi, Kenya, pp. 90.
Dorrough, J., Moll, J., Crosthwaite, J., 2007. Can intensification of temperate Austra-lian livestock production systems save land for native biodiversity? Agric.Ecosyst. Environ. 121, 222–232.
Easdale, M.H., Aguiar, M.R., 2012. Regional forage production assessment in arid andsemi-arid rangelands – a step towards social–ecological analysis. J. Arid Envi-ron. 83, 35–44.
Erb, K.-H., Krausmann, F., Gaube, V., Gingrich, S., Bondeau, A., Fischer-Kowalski, M.,Haberl, H., 2009. Analyzing the global human appropriation of net primaryproduction – processes, trajectories, implications. An introduction. Ecol. Econ.69, 250–259.
ESRI, 2011. ArcGIS Desktop: Release 10. Environmental Systems Research Institute,Redlands, CA.
FAO, 2005. Grassland of the World. FAO, Rome.FAO, 2007. In: Wint, G.R.W., Robinson, T.P. (Eds.), Gridded Livestock of the World
2007. FAO, Rome, p. 131.FAO, 2012. In: Otte, J., Costales, A., Dijkman, J., Pica-Ciamarra, U., Robinson, T., Ahuja,
V., Ly, C., Roland-Holst, D. (Eds.), Livestock Sector Development for PovertyReduction: An Economic and Policy Perspective – Livestock’s Many Virtues.FAO, Rome.
Ford, H., Garbutt, A., Jones, D.L., Jones, L., 2012. Impacts of grazing abandonment onecosystem service provision: coastal grassland as a model system. Agric.Ecosyst. Environ. 162, 108–115.
Fritz, S., See, L., McCallum, I., Schill, C., Obersteiner, M., van der Velde, M., Boettcher,H., Havlık, P., Achard, F., 2011. Highlighting continued uncertainty in global landcover maps for the user community. Environ. Res. Lett. 6, 044005.
Gisladottir, G., Stocking, M., 2005. Land degradation control and its global environ-mental benefits. Land Degrad. Dev. 16, 99–112.
GLOBE Task Team, Hastings, D.A., Dunbar, P.K., Elphingstone, G.M., Bootz, M.,Murakami, H., Maruyama, H., Masaharu, H., Holland, P., Payne, J., Bryant,N.A., Logan, T.L., Muller, J.-P., Schreier, G., MacDonald, J.S., 1999. The GlobalLand One-kilometer Base Elevation (GLOBE) Digital Elevation Model. In: Na-tional Oceanic and Atmospheric Administration. National Geophysical DataCenter, Colorado, USA.
Goldewijk, K.K., Van Minnen, J., Kreileman, G., Vloedbeld, M., Leemans, R., 1994.Simulating the carbon flux between the terrestrial environment and the atmo-sphere. Water Air Soil Pollut. 76, 199–230.
Grace, J., Jose, J.S., Meir, P., Miranda, H.S., Montes, R.A., 2006. Productivity andcarbon fluxes of tropical savannas. J. Biogeogr. 33, 387–400.
Grau, R., Kuemmerle, T., Macchi, L., 2013. Beyond ‘land sparing versus landsharing’: environmental heterogeneity, globalization and the balance be-tween agricultural production and nature conservation. Curr. Opin. Environ.Sustain. 5, 477–483.
Haberl, H., Erb, K.H., Krausmann, F., Gaube, V., Bondeau, A., Plutzar, C., Gingrich, S.,Lucht, W., Fischer-Kowalski, M., 2007. Quantifying and mapping the human
K. Petz et al. / Global Environmental Change 29 (2014) 223–234234
appropriation of net primary production in earth’s terrestrial ecosystems.Proc. Natl. Acad. Sci. 104, 12942–12947.
Hansen, M.C., DeFries, R.S., Townshend, J.R.G., Carroll, M., Dimiceli, C., Sohlberg, R.A.,2003. Global percent tree cover at a spatial resolution of 500 meters: first resultsof the MODIS vegetation continuous fields algorithm. Earth Interact. 7, 1–15.
Herrero, M., Grace, D., Njuki, J., Johnson, N., Enahoro, D., Silvestri, S., Rufino, M.C.,2013a. The roles of livestock in developing countries. Animal 7, 3–18.
Herrero, M., Havlık, P., Valin, H., Notenbaert, A., Rufino, M.C., Thornton, P.K.,Blummel, M., Weiss, F., Grace, D., Obersteiner, M., 2013b. Biomass use, produc-tion, feed efficiencies, and greenhouse gas emissions from global livestocksystems. Proc. Natl. Acad. Sci., http://dx.doi.org/10.1073/pnas.1308149110.
Herrero, M., Thornton, P.K., 2013. Livestock and global change: emerging issues forsustainable food systems. Proc. Natl. Acad. Sci. 110, 20878–20881.
Herrero, M., Thornton, P.K., Gerber, P., Reid, R.S., 2009. Livestock, livelihoods and theenvironment: understanding the trade-offs. Curr. Opin. Environ. Sustain. 1,111–120.
Herrero, M., Thornton, P.K., Notenbaert, A.M., Wood, S., Msangi, S., Freeman, H.A.,Bossio, D., Dixon, J., Peters, M., van de Steeg, J., Lynam, J., Rao, P.P., Macmillan, S.,Gerard, B., McDermott, J., Sere, C., Rosegrant, M., 2010. Smart investments insustainable food production: revisiting mixed crop–livestock systems. Science327, 822–825.
Hootsmans, R.M., Bouwman, A.F., Leemans, R., Kreileman, G.J.J., 2001. ModellingLand Degradation in IMAGE 2. RIVM Report 481508009 National Institute forPublic Health and the Environment (RIVM), Bilthoven, The Netherlands, pp. 33.
House, J.I., Hall, D.O., 2001. 16 – Productivity of tropical savannas and grasslands. In:Roy, J., Saugier, B., Mooney, H.A. (Eds.), Terrestrial Global Productivity. Academ-ic Press, San Diego, pp. 363–400.
Imhoff, M.L., Bounoua, L., Ricketts, T., Loucks, C., Harriss, R., Lawrence, W.T., 2004.Global patterns in human consumption of net primary production. Nature 429,870–873.
Jones, A., 2000. Effects of cattle grazing on North American arid ecosystems: aquantitative review. Western North Am. Nat. 60, 155–164.
JRC, 2003. Global Land Cover 2000 Database. European Commission, Joint ResearchCentre. Available at: http://bioval.jrc.ec.europa.eu/products/glc2000/data_ac-cess.php.
Khan, S., Hanjra, M.A., 2009. Footprints of water and energy inputs in food produc-tion – global perspectives. Food Policy 34, 130–140.
Koffi, E.N., Rayner, P.J., Scholze, M., Beer, C., 2012. Atmospheric constraints on grossprimary productivity and net ecosystem productivity: results from a carbon-cycle data assimilation system. Global Biogeochem. Cycles 26, GB1024.
Kuemmerle, T., Erb, K., Meyfroidt, P., Muller, D., Verburg, P.H., Estel, S., Haberl, H.,Hostert, P., Jepsen, M.R., Kastner, T., Levers, C., Lindner, M., Plutzar, C., Verkerk,P.J., van der Zanden, E.H., Reenberg, A., 2013. Challenges and opportunities inmapping land use intensity globally. Curr. Opin. Environ. Sustain. 5, 484–493.
Larigauderie, A., Prieur-Richard, A.-H., Mace, G.M., Lonsdale, M., Mooney, H.A.,Brussaard, L., Cooper, D., Cramer, W., Daszak, P., Dıaz, S., Duraiappah, A.,Elmqvist, T., Faith, D.P., Jackson, L.E., Krug, C., Leadley, P.W., Le Prestre, P.,Matsuda, H., Palmer, M., Perrings, C., Pulleman, M., Reyers, B., Rosa, E.A., Scholes,R.J., Spehn, E., Turner Ii, B.L., Yahara, T., 2012. Biodiversity and ecosystemservices science for a sustainable planet: the DIVERSITAS vision for 2012–20.Curr. Opin. Environ. Sustain. 4, 101–105.
Leadley, P., 2010. Biodiversity Scenarios: Projections of 21st Century Change inBiodiversity, and Associated Ecosystem Services: A Technical Report for theGlobal Biodiversity Outlook 3. UNEP/Earthprint.
MA, 2003. Ecosystems and Human Well-Being: A Framework for Assessment,Millennium Ecosystem Assessment (MA). Island Press, Washington, DC.
MA, 2005. Ecosystems and Human Well-Being – Current State & Trends. Millenni-um Ecosystem Assessment (MA), vol. 1. Island Press, Washington, DC.
Mace, G.M., Cramer, W., Dıaz, S., Faith, D.P., Larigauderie, A., Le Prestre, P., Palmer,M., Perrings, C., Scholes, R.J., Walpole, M., Walther, B.A., Watson, J.E.M., Mooney,H.A., 2010. Biodiversity targets after 2010. Curr. Opin. Environ. Sustain. 2, 3–8.
Maes, J., Paracchini, M.L., Zulian, G., Dunbar, M.B., Alkemade, R., 2012. Synergies andtrade-offs between ecosystem service supply, biodiversity, and habitat conser-vation status in Europe. Biol. Conserv. 155, 1–12.
Milchunas, D.G., Lauenroth, W.K., 1993. Quantitative effects of grazing on vegeta-tion and soils over a global range of environments. Ecol. Monogr. 63, 327–366.
Myers, N., Mittermeier, R.A., Mittermeier, C.G., da Fonseca, G.A.B., Kent, J., 2000.Biodiversity hotspots for conservation priorities. Nature 403, 853–858.
Naidoo, R., Balmford, A., Costanza, R., Fisher, B., Green, R.E., Lehner, B., Malcolm, T.R.,Ricketts, T.H., 2008. Global mapping of ecosystem services and conservationpriorities. Proc. Natl. Acad. Sci. 105, 9495–9500.
OECD, 2012. OECD Environmental Outlook to 2050. OECD Publishing.Olson, D.M., Dinerstein, E., Wikramanayake, E.D., Burgess, N.D., Powell, G.V.N.,
Underwood, E.C., D’amico, J.A., Itoua, I., Strand, H.E., Morrison, J.C., Loucks,C.J., Allnutt, T.F., Ricketts, T.H., Kura, Y., Lamoreux, J.F., Wettengel, W.W., Hedao,P., Kassem, K.R., 2001. Terrestrial ecoregions of the world: a new map of life onearth. Bioscience 933–938.
PBL, 2006. In: Bouwman, A.F., Kram, T., Goldewijk, K.K. (Eds.), Integrated Modellingof Global Environmental Change. An Overview of IMAGE 2.4. NetherlandsEnvironmental Assessment Agency, Bilthoven, The Netherlands.
Pereira, H.M., Navarro, L.M., Martins, I.S., 2012. Global biodiversity change: the bad,the good, and the unknown. Annu. Rev. Environ. Resour. 37, 25–50.
Phalan, B., Bertzky, M., Butchart, S.H., Donald, P.F., Scharlemann, J.P., Stattersfield,A.J., Balmford, A., 2013. Crop expansion and conservation priorities in tropicalcountries. PLoS ONE 8, e51759.
Potter, C., Klooster, S., Genovese, V., Hiatt, C., Boriah, S., Kumar, V., Mithal, V., Garg,A., 2012. Terrestrial ecosystem carbon fluxes predicted from MODIS satellitedata and large-scale disturbance modeling. Int. J. Geosci. 3, 469–479.
Randerson, J.T., Chapin, F.S., Harden, J.W., Neff, J.C., Harmon, M.E., 2002. Netecosystem production: a comprehensive measure of net carbon accumulationby ecosystems. Ecol. Appl. 12, 937–947.
Reid, R.S., Bedelian, C., Said, M.Y., Kruska, R.L., Mauricio, R.M., Castel, V., Olson, J.,Thornton, P.K., 2009. In: Steinfeld, H., Mooney, H.A., Schneider, F., Neville, L.E.(Eds.), Global Livestock Impacts on Biodiversity, Livestock in a ChangingLandscape. Drivers, Consequences, and Responses, vol. 1. Island Press,Washington, DC, pp. 111–137.
Reynolds, J.F., Stafford Smith, D.M., 2002. Do humans cause deserts? In: Reynolds,J.F., Stafford Smith, D.M. (Eds.), Global Desertification: Do Humans CauseDeserts? Dahlem Workshop Report 88. Dahlem University Press, Berlin.
Rockstrom, J., Lannerstad, M., Falkenmark, M., 2007. Assessing the water challengeof a new green revolution in developing countries. Proc. Natl. Acad. Sci. 104,6253–6260.
Roose, E., 1996. Land Husbandry – Components and Strategy, vol. 70. FAO, Rome,Italy.
Rounsevell, M.D.A., Pedroli, B., Erb, K.-H., Gramberger, M., Busck, A.G., Haberl, H.,Kristensen, S., Kuemmerle, T., Lavorel, S., Lindner, M., Lotze-Campen, H., Metz-ger, M.J., Murray-Rust, D., Popp, A., Perez-Soba, M., Reenberg, A., Vadineanu, A.,Verburg, P.H., Wolfslehner, B., 2012. Challenges for land system science. LandUse Policy 29, 899–910.
Ruimy, A., Saugier, B., Dedieu, G., 1994. Methodology for the estimation of terrestrialnet primary production from remotely sensed data. J. Geophys. Res.: Atmos. 99,5263–5283.
Schulp, C.J.E., Alkemade, R., 2011. Consequences of uncertainty in global-scale landcover maps for mapping ecosystem functions: an analysis of pollination effi-ciency. Remote Sens. 3, 2057–2075.
Schulp, C.J.E., Alkemade, R., Klein Goldewijk, K., Petz, K., 2012. Mapping ecosystemfunctions and services in Eastern Europe using global-scale data sets. Int. J.Biodivers. Sci. Ecosyst. Serv. Manag. 8, 156–168.
Schuman, G., Reeder, J., Manley, J., Hart, R., Manley, W., 1999. Impact of grazingmanagement on the carbon and nitrogen balance of a mixed-grass rangeland.Ecol. Appl. 9, 65–71.
Schuman, G.E., Janzen, H.H., Herrick, J.E., 2002. Soil carbon dynamics and potentialcarbon sequestration by rangelands. Environ. Pollut. 116, 391–396.
Smith, P., Martino, D., Cai, Z., Gwary, D., Janzen, H., Kumar, P., McCarl, B., Ogle, S.,O’Mara, F., Rice, C., Scholes, B., Sirotenko, O., Howden, M., McAllister, T., Pan, G.,Romanenkov, V., Schneider, U., Towprayoon, S., Wattenbach, M., Smith, J., 2008.Greenhouse gas mitigation in agriculture. Philos. Trans. R. Soc. B: Biol. Sci. 363,789–813.
Steinfeld, H., Gerber, P., Wassenaar, T., Castel, V., Rosales, M., De Haan, C., 2006.Livestock’s Long Shadow. FAO, Rome, Italy.
Steinfeld, H., Mooney, H.A., Schneider, F., Neville, L.E., 2010. Livestock in a ChangingLandscape. Drivers, Consequences, and Responses, vol. 1. Island Press,Washington, DC.
Swetnam, R.D., Reyers, B., 2011. Meeting the challenge of conserving Africa’sbiodiversity: the role of GIS, now and in the future. Landscape and UrbanPlanning 100, 411–414.
UNEP, 2007. Global Environment Outlook (GEO-4): Environment for Development.United Nations Environment Programme. Available at: http://www.unep.org/geo/geo4.asp.
United Nations Convention to Combat Desertification, 2012. Zero Net Land Degra-dation: Sustainable Development Goal for Rio+20. Policy Brief, pp. 32.
van Minnen, J.G., Strengers, B., Eickhout, B., 2006. Simulating carbon exchangebetween terrestrial biosphere and the atmosphere. In: Bouwman, A.F., Kram, T.,Goldewijk, K.K. (Eds.), Integrated Modelling of Global Environmental Change.An Overview of IMAGE 2.4. Netherlands Environmental Assessment Agency,Bilthoven, The Netherlands, pp. 113–130.
Verburg, P., van Asselen, S., van der Zanden, E., Stehfest, E., 2012. The representationof landscapes in global scale assessments of environmental change.Landsc. Ecol. 28, 1067–1080.
Verburg, P.H., Neumann, K., Nol, L., 2011. Challenges in using land use and landcover data for global change studies. Global Change Biol. 17, 974–989.
White, R., Murray, S., Rohweder, M., 2000. Pilot Analysis of Global Ecosystems(PAGE). Grassland Ecosystems World Resources Institute, Washington, DC.
Wischmeier, W.H., Smith, D.D., 1978. Predicting Rainfall Erosion Losses – A Guide toConservation Planning. US Department of Agriculture, Washington, DC.
Yang, D., Kanae, S., Oki, T., Koike, T., Musiake, K., 2003. Global potential soil erosion withreference to land use and climate changes. Hydrol. Proc. 17, 2913–2928.
Zhao, M., Heinsch, F.A., Nemani, R.R., Running, S.W., 2005. Improvements of theMODIS terrestrial gross and net primary production global data set. RemoteSens. Environ. Manag. 95, 164–176.
Related Documents