Managing with KPIs and KRIs Prepared for: StratexSystems Webinar Series 1 November 2012

Managing with KPIs and KRIs Prepared for: StratexSystems Webinar Series 1 November 2012.
Dec 22, 2015
Welcome message from author
This document is posted to help you gain knowledge. Please leave a comment to let me know what you think about it! Share it to your friends and learn new things together.
Transcript
Managing with KPIs and KRIs
Prepared for:
StratexSystems Webinar Series1 November 2012
Page 2
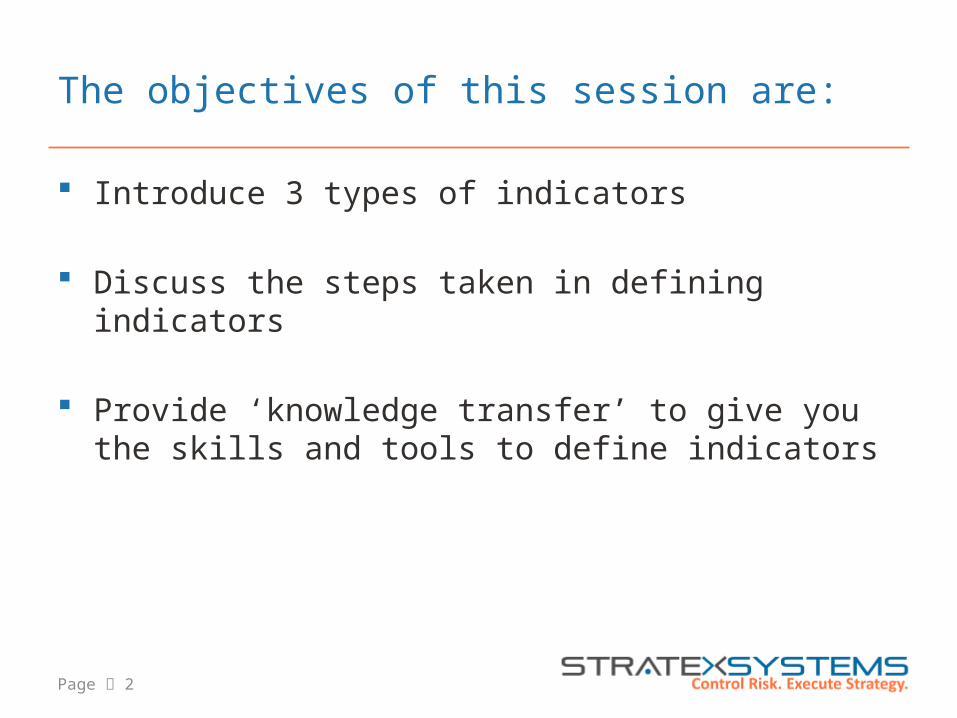
The objectives of this session are:
Introduce 3 types of indicators
Discuss the steps taken in defining indicators
Provide ‘knowledge transfer’ to give you the skills and tools to define indicators
Page 3
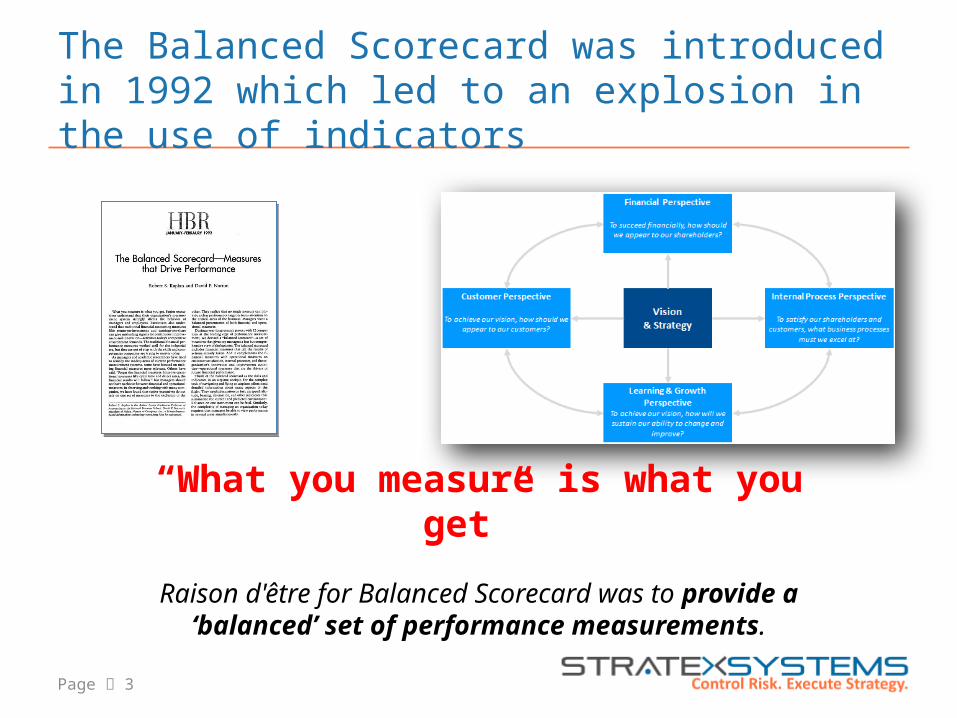
The Balanced Scorecard was introduced in 1992 which led to an explosion in the use of indicators
“What you measure is what you get”
Raison d'être for Balanced Scorecard was to provide a ‘balanced’ set of performance measurements.
Page 4
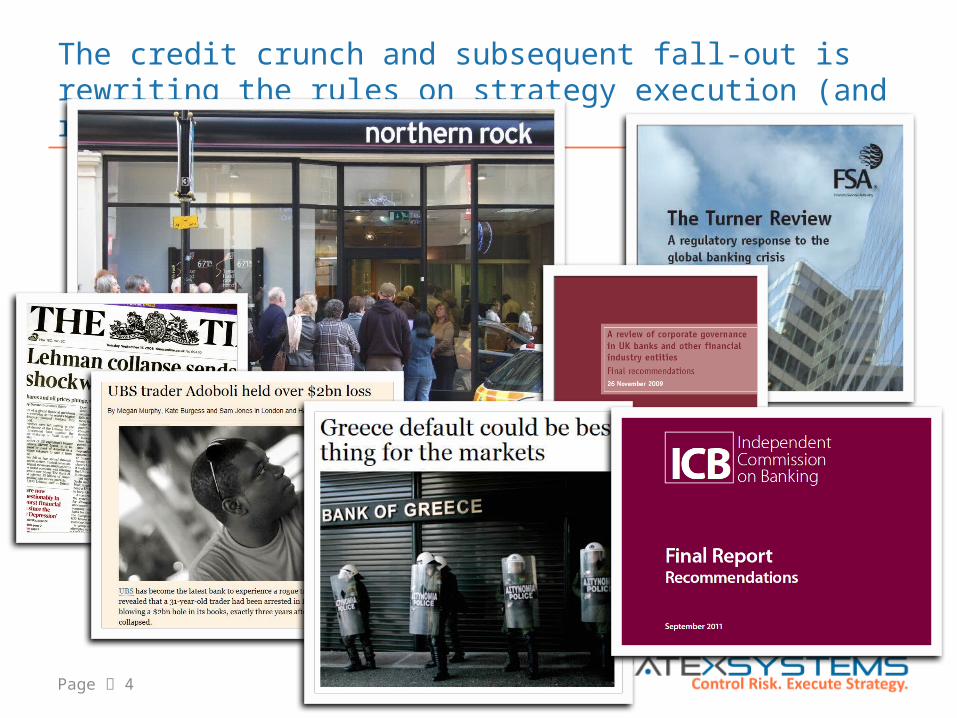
The credit crunch and subsequent fall-out is rewriting the rules on strategy execution (and risk management)
Page 5
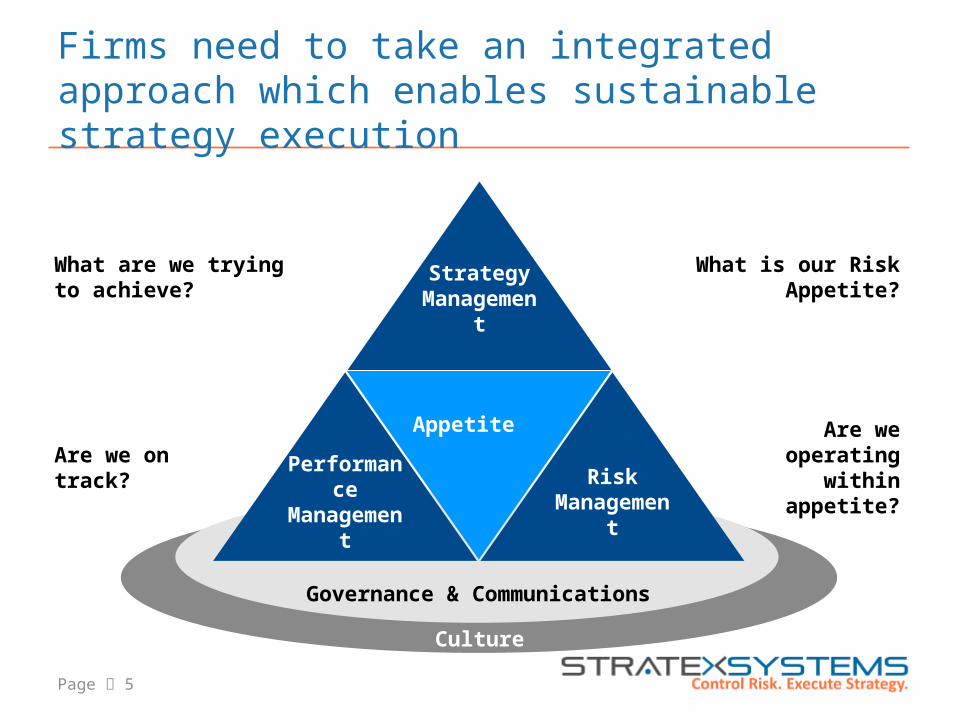
Firms need to take an integrated approach which enables sustainable strategy execution
Performance Management
Risk Management
Strategy Management
Appetite
What are we trying to achieve?
Are we on track?
What is our Risk Appetite?
Are we operating within appetite?
Governance & Communications
Culture
Page 6
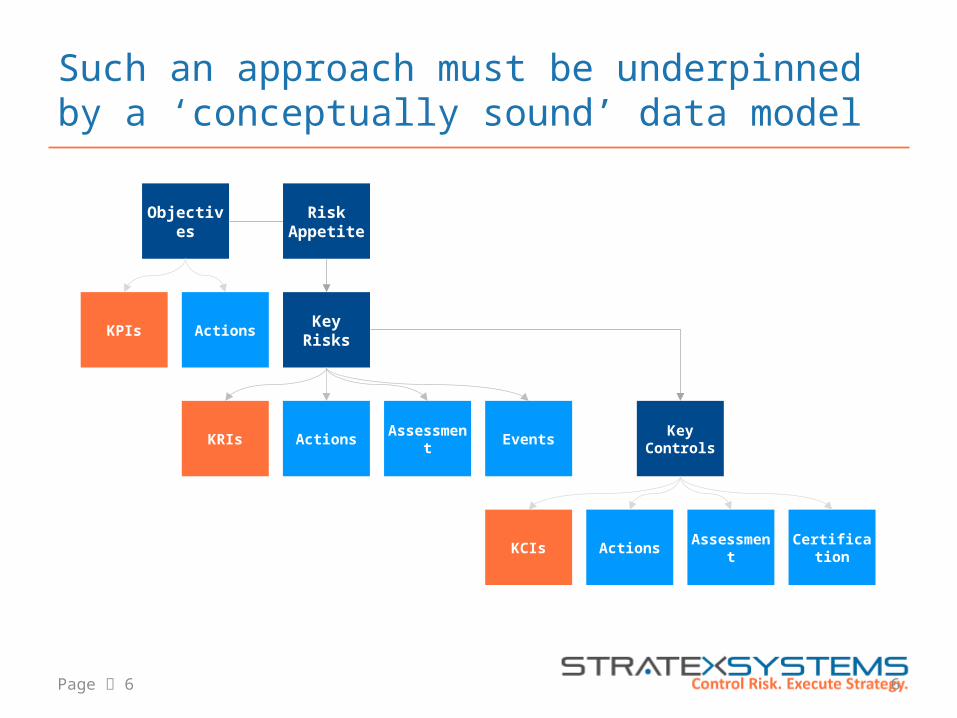
Such an approach must be underpinned by a ‘conceptually sound’ data model
6
Objectives
KPIs Actions Key Risks
KRIs Actions Assessment Key Controls
KCIs Actions Assessment
Events
Certification
Risk Appetite
Page 7
What is an indicator?
An Indicator is a numeric value produced through the combination of measures which provides business insight.
Indicators inform management discussions and provides an indication of past, present or future state of the business, from a perspective of: Performance (KPIs) Risk (KRIs) Control (KCIs)
Defining indicators and measures enables: more focused and timely responses to emerging issues better informed business decisions
Page 8
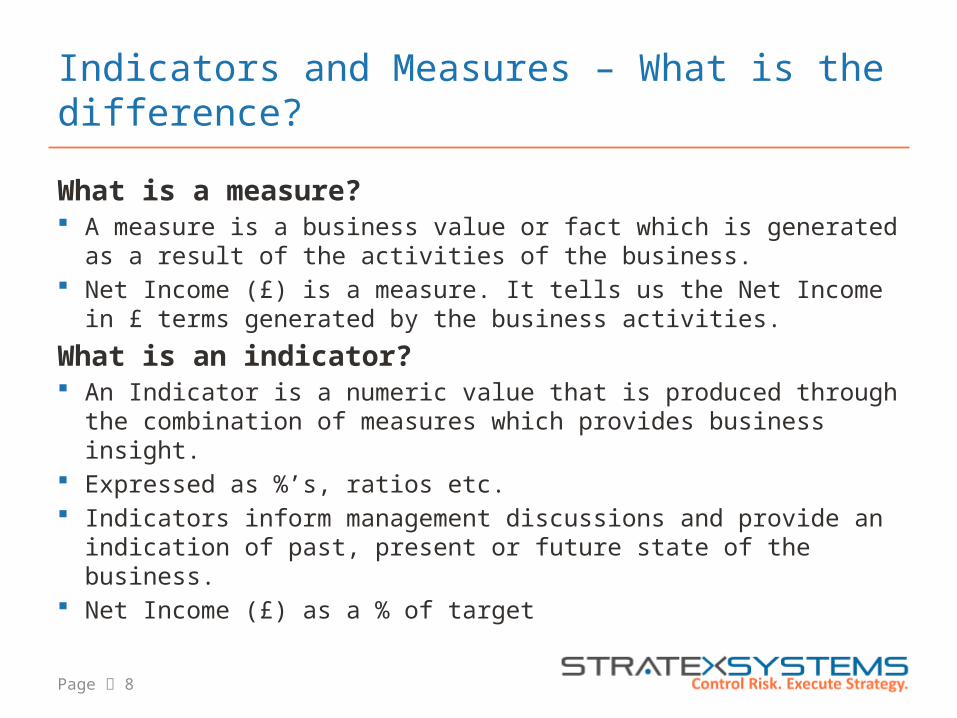
Indicators and Measures – What is the difference?
What is a measure? A measure is a business value or fact which is generated
as a result of the activities of the business. Net Income (£) is a measure. It tells us the Net Income in
£ terms generated by the business activities.
What is an indicator? An Indicator is a numeric value that is produced through
the combination of measures which provides business insight.
Expressed as %’s, ratios etc. Indicators inform management discussions and provide an
indication of past, present or future state of the business. Net Income (£) as a % of target
Page 9
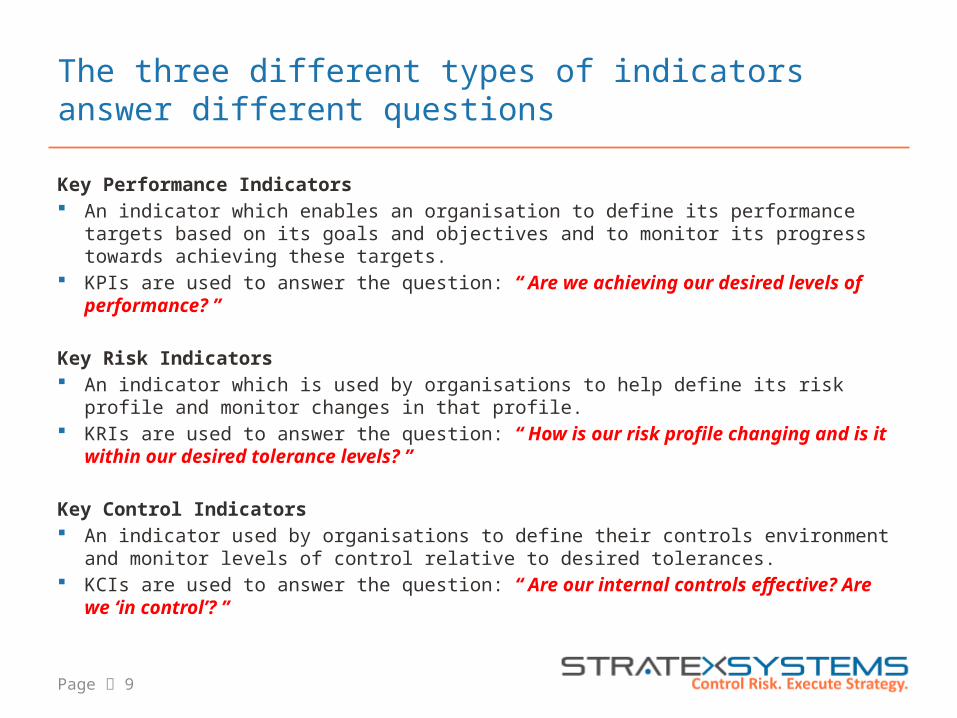
The three different types of indicators answer different questions
Key Performance Indicators An indicator which enables an organisation to define its performance targets
based on its goals and objectives and to monitor its progress towards achieving these targets.
KPIs are used to answer the question: “ Are we achieving our desired levels of performance? ”
Key Risk Indicators An indicator which is used by organisations to help define its risk profile and
monitor changes in that profile. KRIs are used to answer the question: “ How is our risk profile changing
and is it within our desired tolerance levels? ”
Key Control Indicators An indicator used by organisations to define their controls environment and
monitor levels of control relative to desired tolerances. KCIs are used to answer the question: “ Are our internal controls
effective? Are we ‘in control’? ”
Page 10
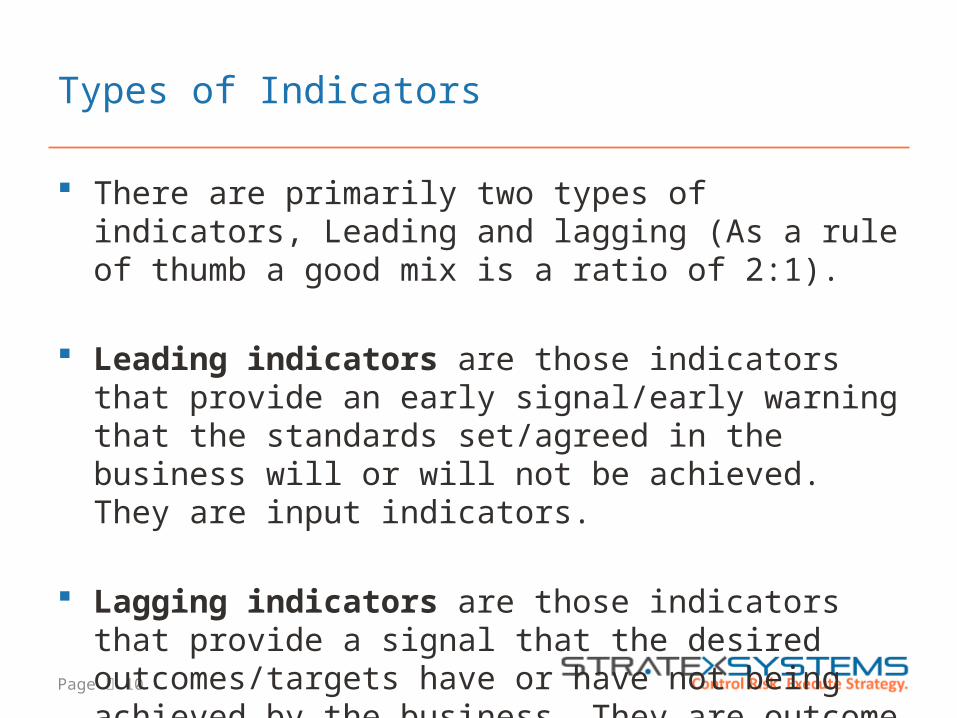
Types of Indicators
There are primarily two types of indicators, Leading and lagging (As a rule of thumb a good mix is a ratio of 2:1).
Leading indicators are those indicators that provide an early signal/early warning that the standards set/agreed in the business will or will not be achieved. They are input indicators.
Lagging indicators are those indicators that provide a signal that the desired outcomes/targets have or have not being achieved by the business. They are outcome indicators.
Page 11
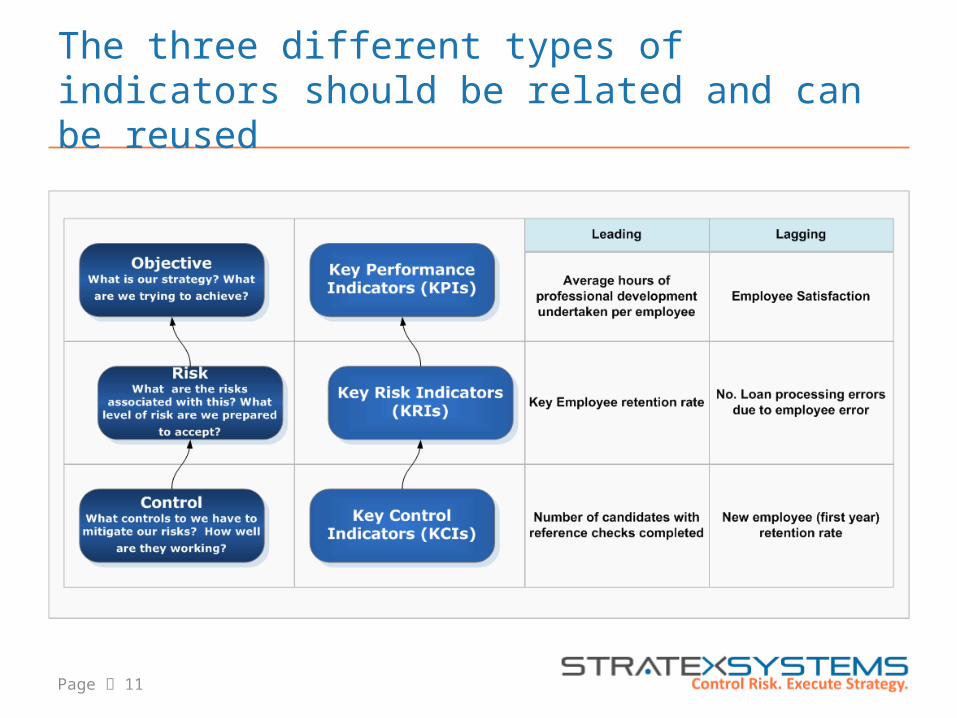
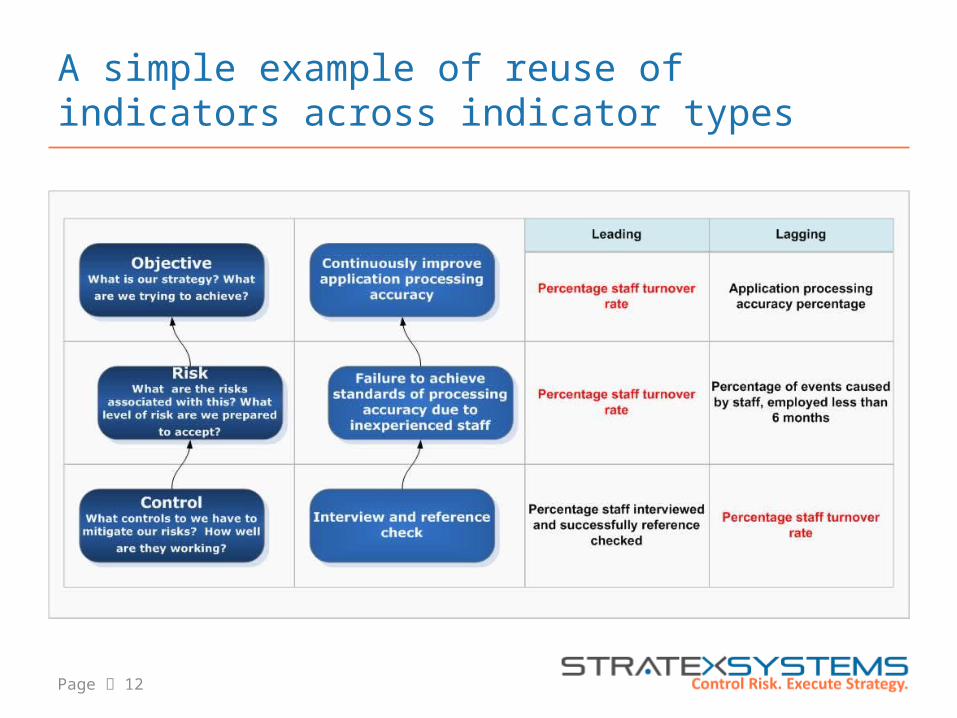
The three different types of indicators should be related and can be reused
Page 12
A simple example of reuse of indicators across indicator types
Defining Indicators
Page 14
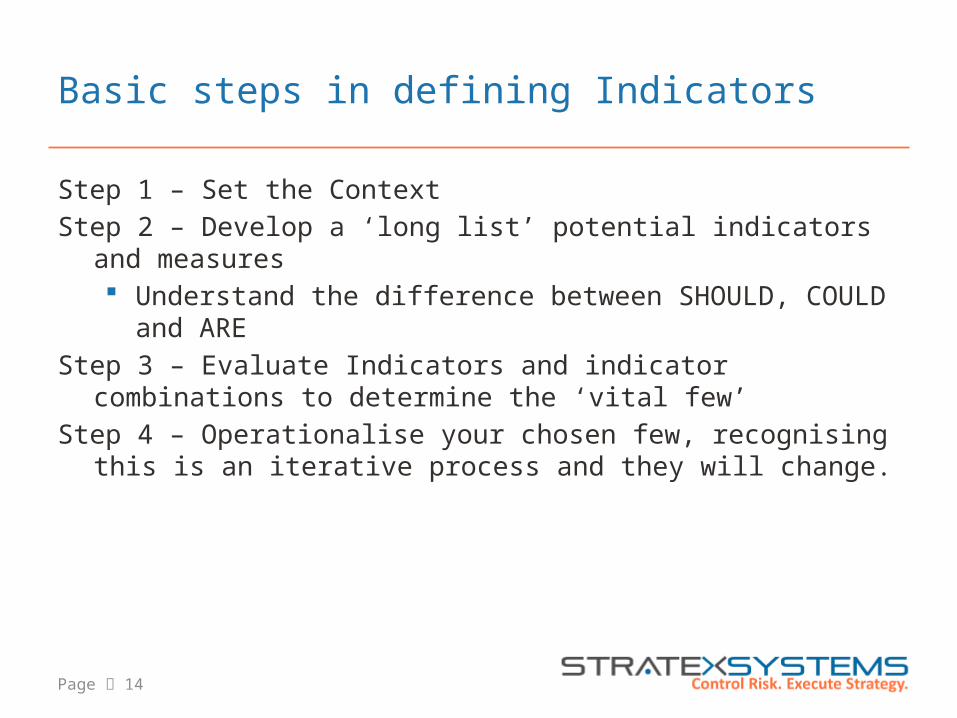
Basic steps in defining Indicators
Step 1 – Set the ContextStep 2 – Develop a ‘long list’ potential indicators and
measures Understand the difference between SHOULD, COULD and
ARE Step 3 – Evaluate Indicators and indicator combinations to
determine the ‘vital few’Step 4 – Operationalise your chosen few, recognising this is an
iterative process and they will change.
Page 15
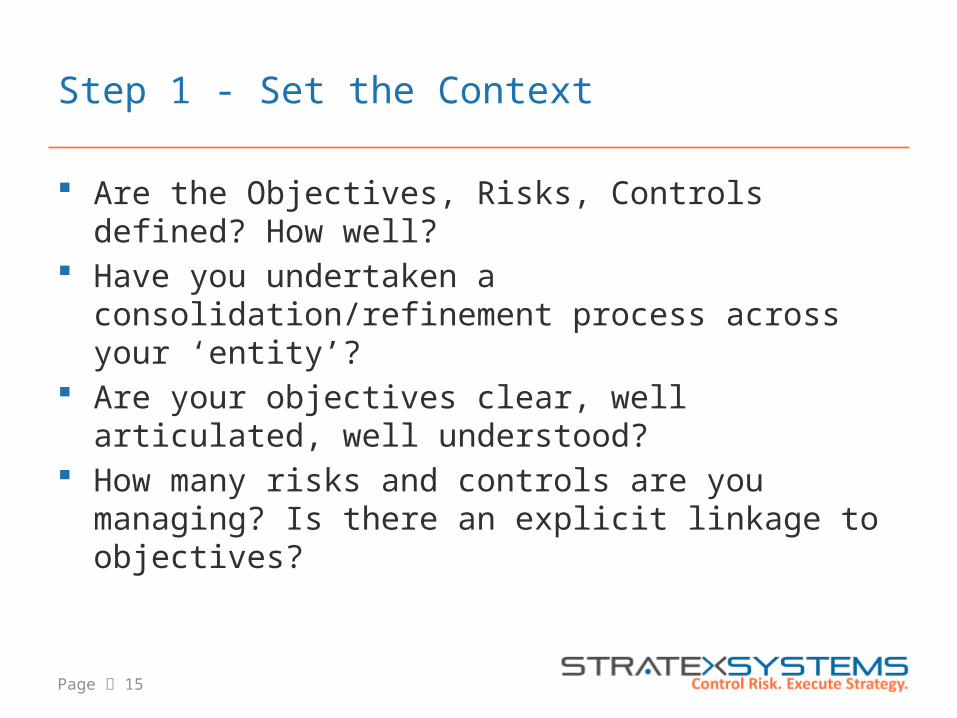
Step 1 - Set the Context
Are the Objectives, Risks, Controls defined? How well?
Have you undertaken a consolidation/refinement process across your ‘entity’?
Are your objectives clear, well articulated, well understood?
How many risks and controls are you managing? Is there an explicit linkage to objectives?
Page 16
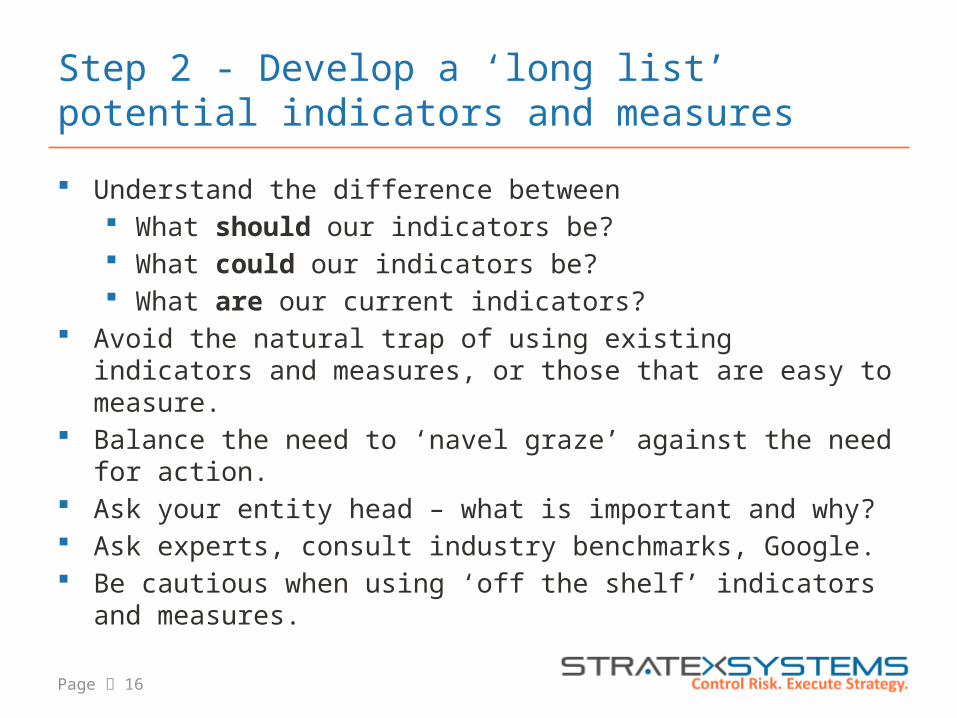
Step 2 - Develop a ‘long list’ potential indicators and measures
Understand the difference between What should our indicators be? What could our indicators be? What are our current indicators?
Avoid the natural trap of using existing indicators and measures, or those that are easy to measure.
Balance the need to ‘navel graze’ against the need for action.
Ask your entity head – what is important and why? Ask experts, consult industry benchmarks, Google. Be cautious when using ‘off the shelf’ indicators and
measures.
Page 17
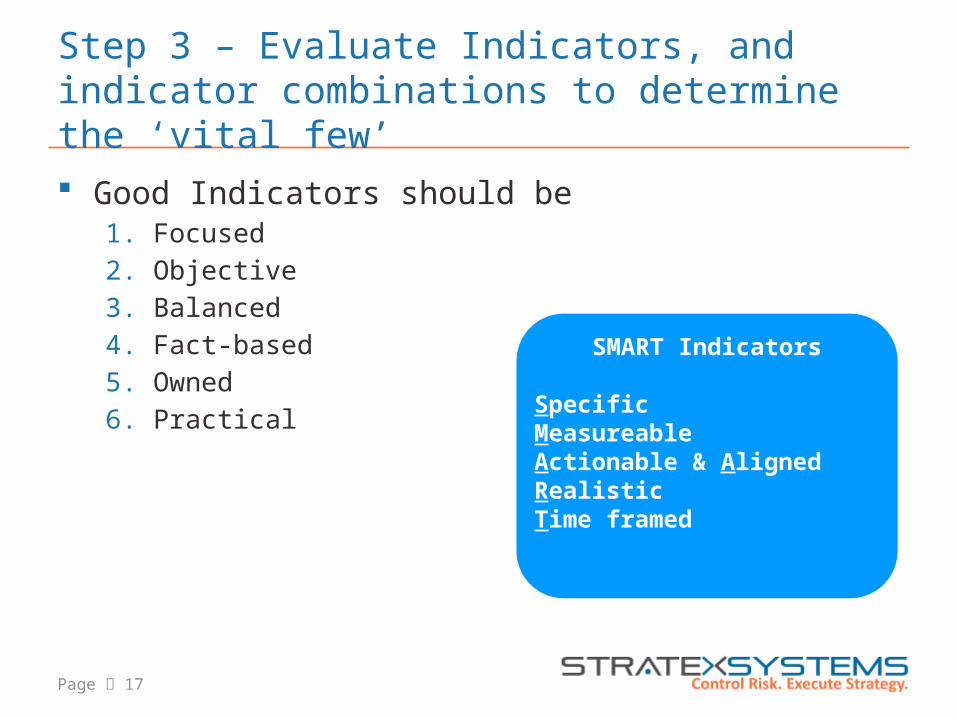
Step 3 – Evaluate Indicators, and indicator combinations to determine the ‘vital few’
Good Indicators should be 1. Focused2. Objective3. Balanced4. Fact-based5. Owned6. Practical
SMART Indicators
SpecificMeasureableActionable & AlignedRealisticTime framed
Page 18
Step 4 – Operationalise your chosen few, recognising this is an iterative process and they will change. Defining Indicators can become a time consuming
process – don’t attempt to develop a ‘perfect’ set! Adopt an iterative approach. Accept they will and should change. Use initial set of indicators for approximately 3
months (3 cycles) then review.
Page 19
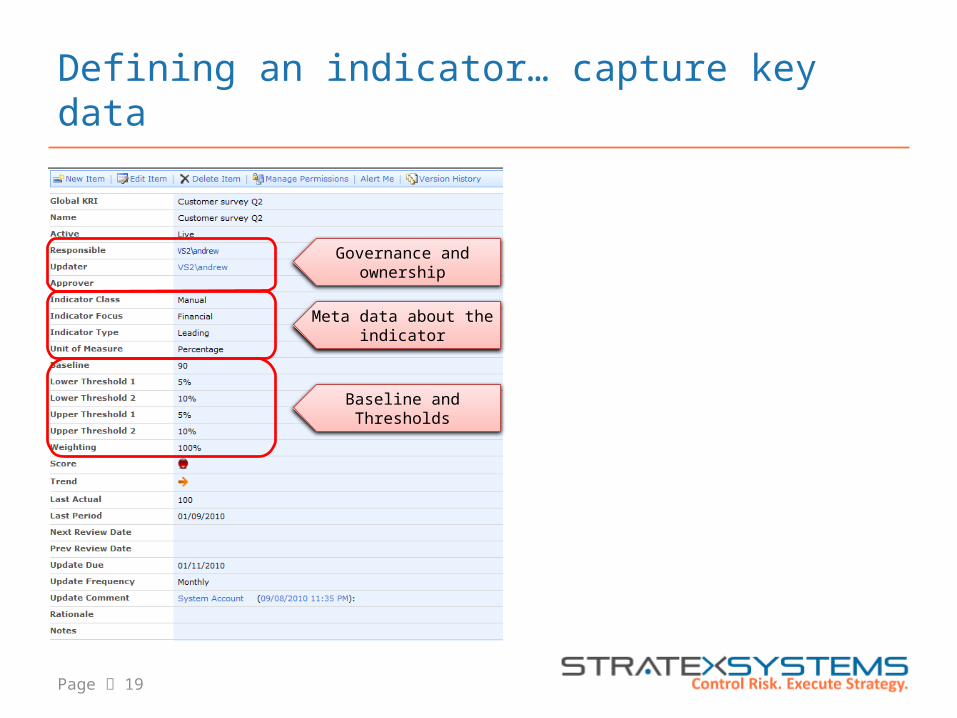
Defining an indicator… capture key data
Governance and ownership
Meta data about the indicator
Baseline and Thresholds
Page 20
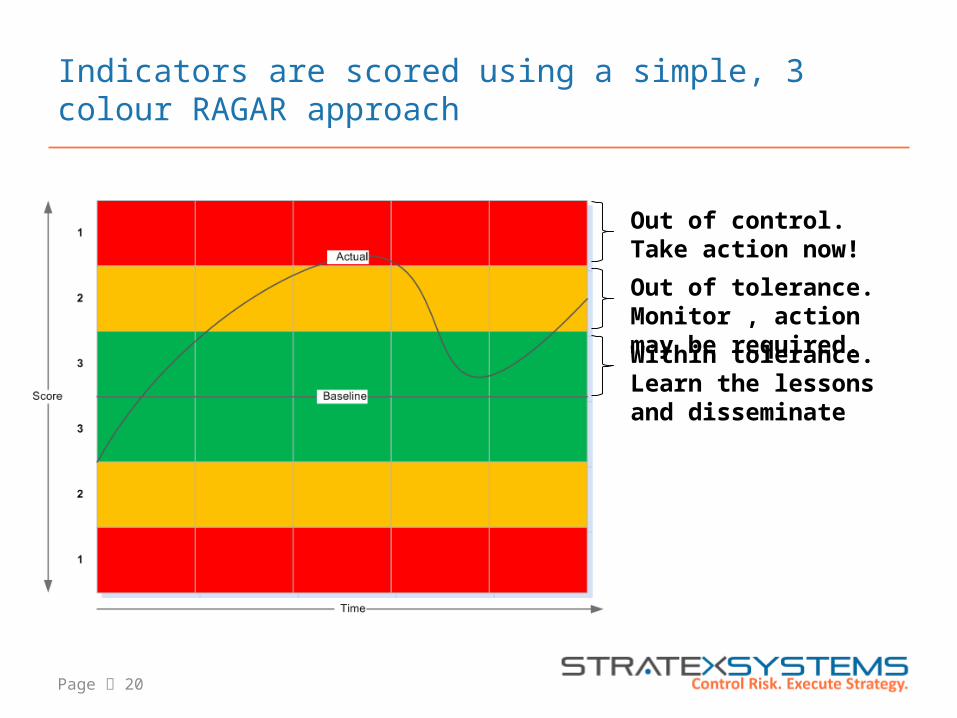
Indicators are scored using a simple, 3 colour RAGAR approach
Out of control. Take action now!
Out of tolerance. Monitor , action may be required.
Within tolerance. Learn the lessons and disseminate
Page 21
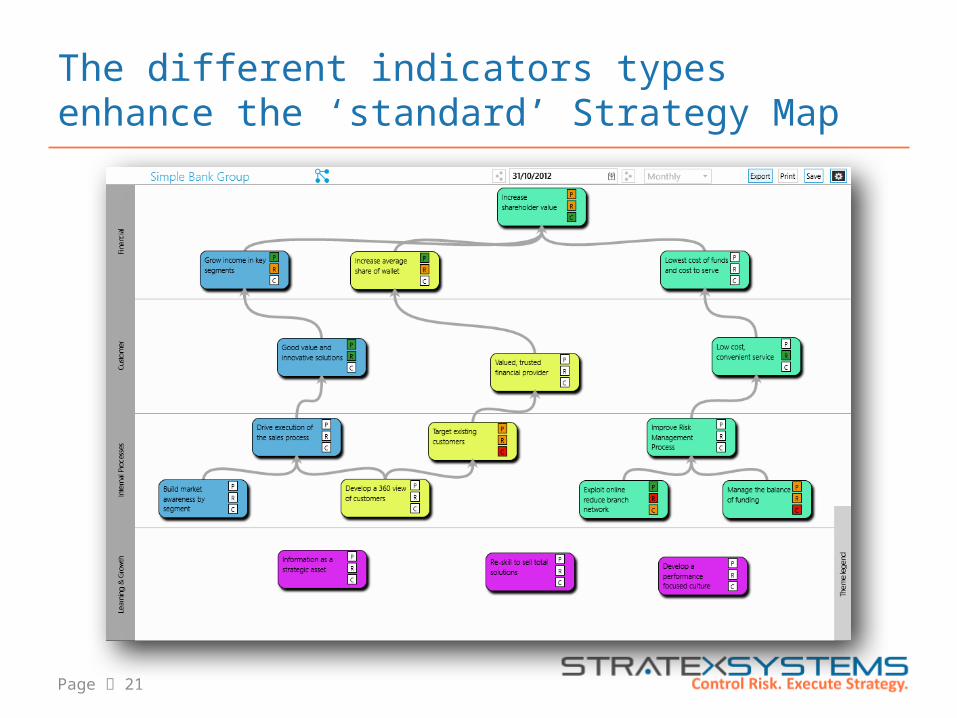
The different indicators types enhance the ‘standard’ Strategy Map
Page 22
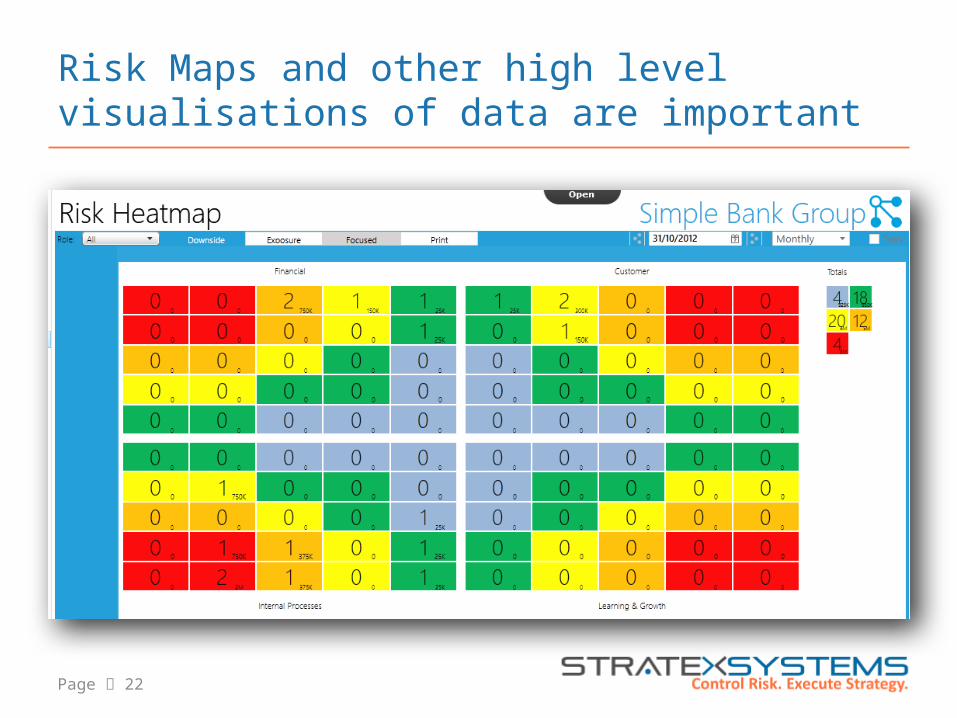
Risk Maps and other high level visualisations of data are important
Page 23
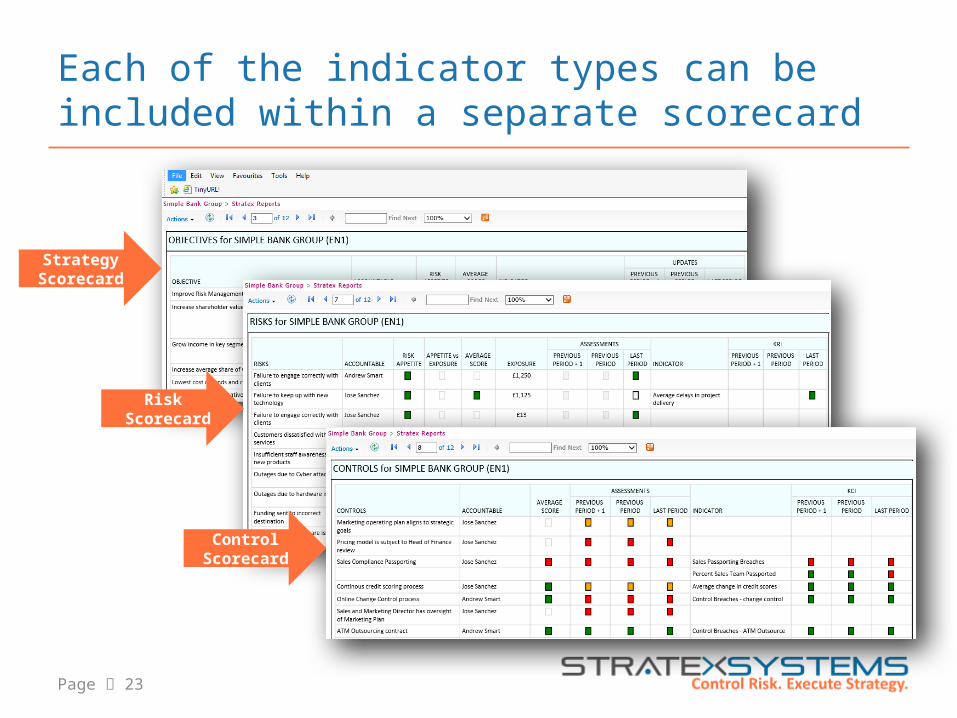
Each of the indicator types can be included within a separate scorecard
Strategy Scorecard
Risk Scorecard
Control Scorecard
Page 24
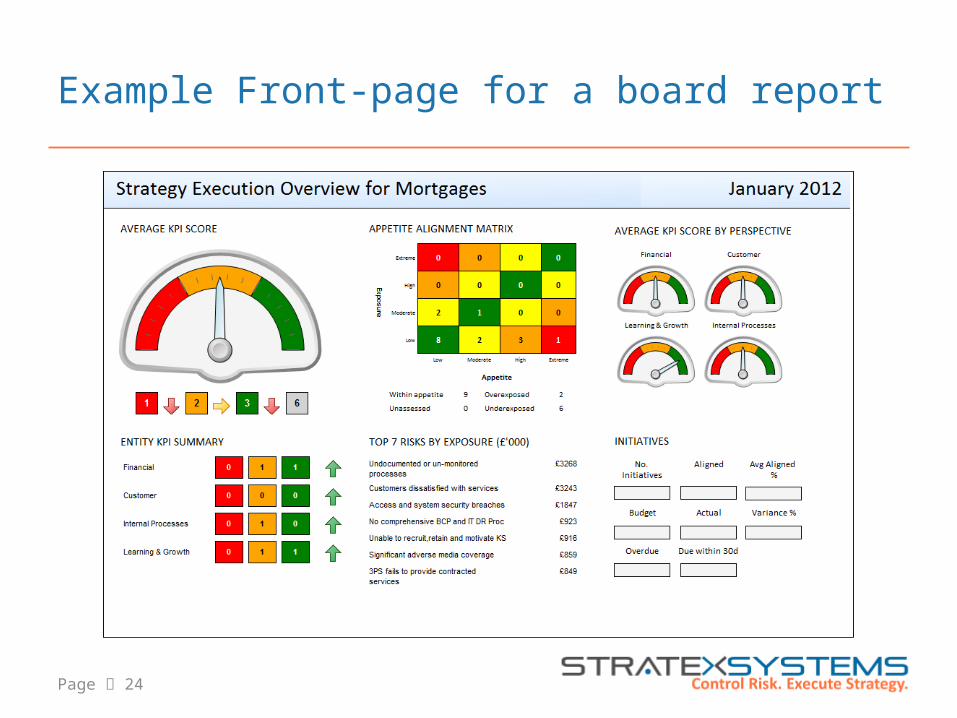
Example Front-page for a board report
Page 25
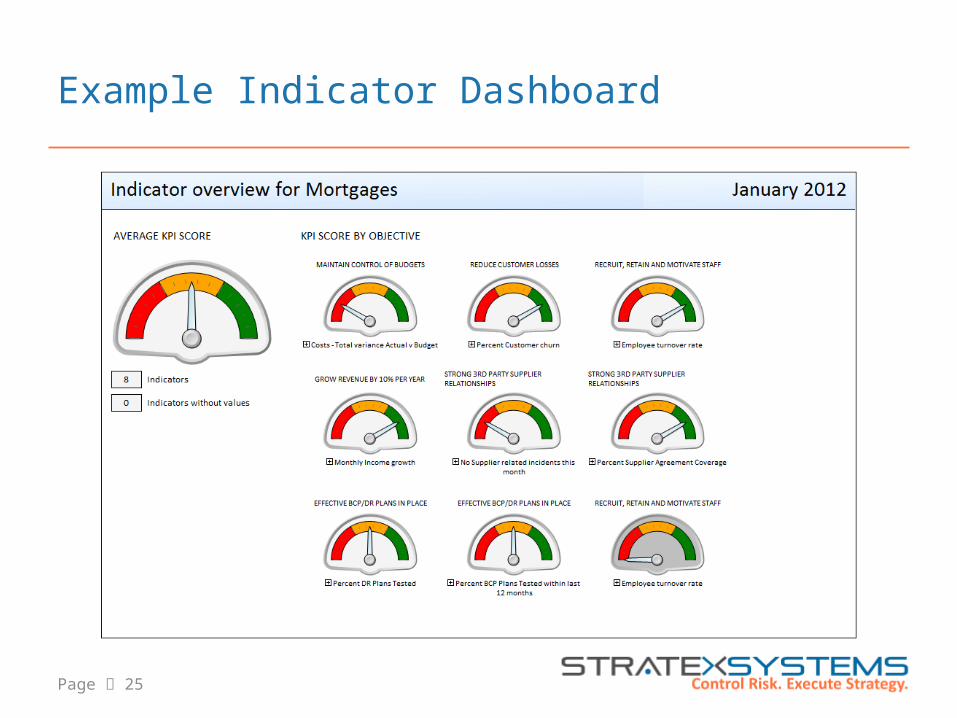
Example Indicator Dashboard
Page 26
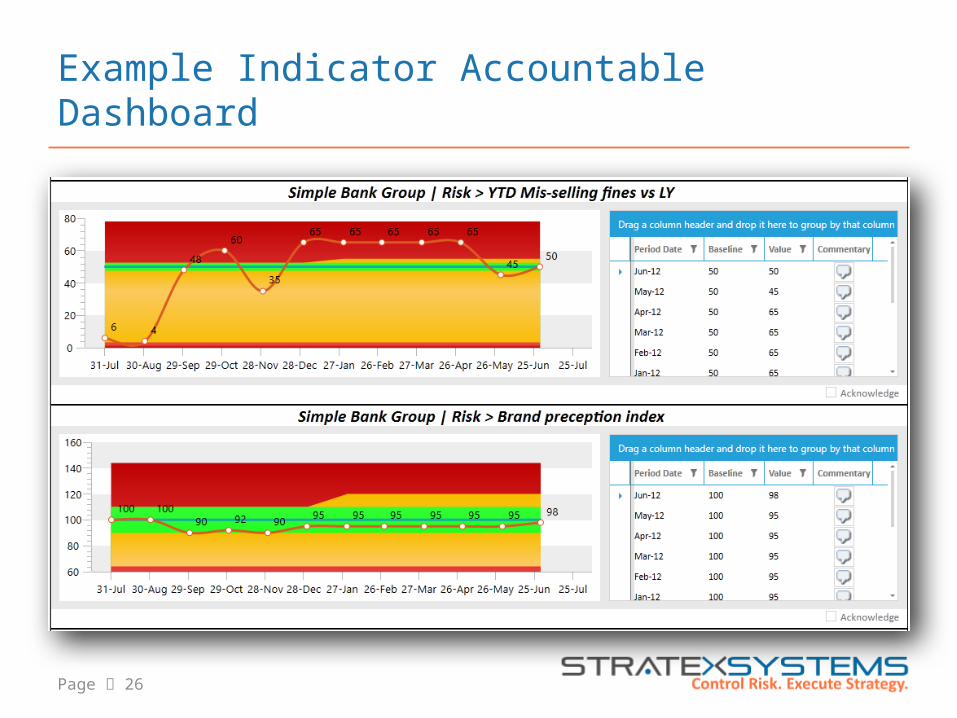
Example Indicator Accountable Dashboard
Page 27
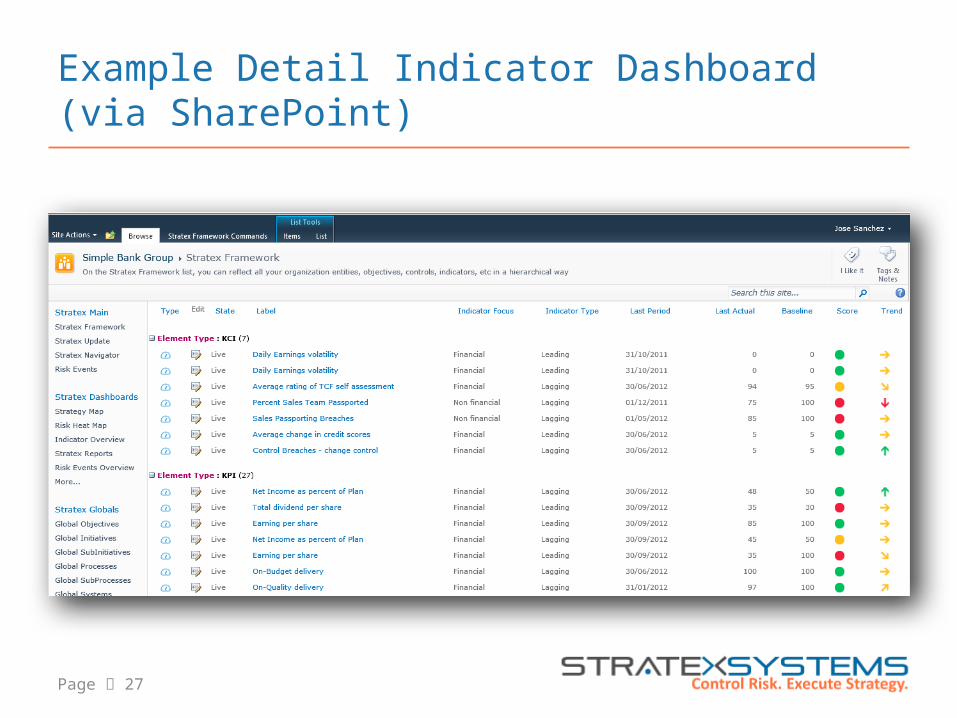
Example Detail Indicator Dashboard (via SharePoint)
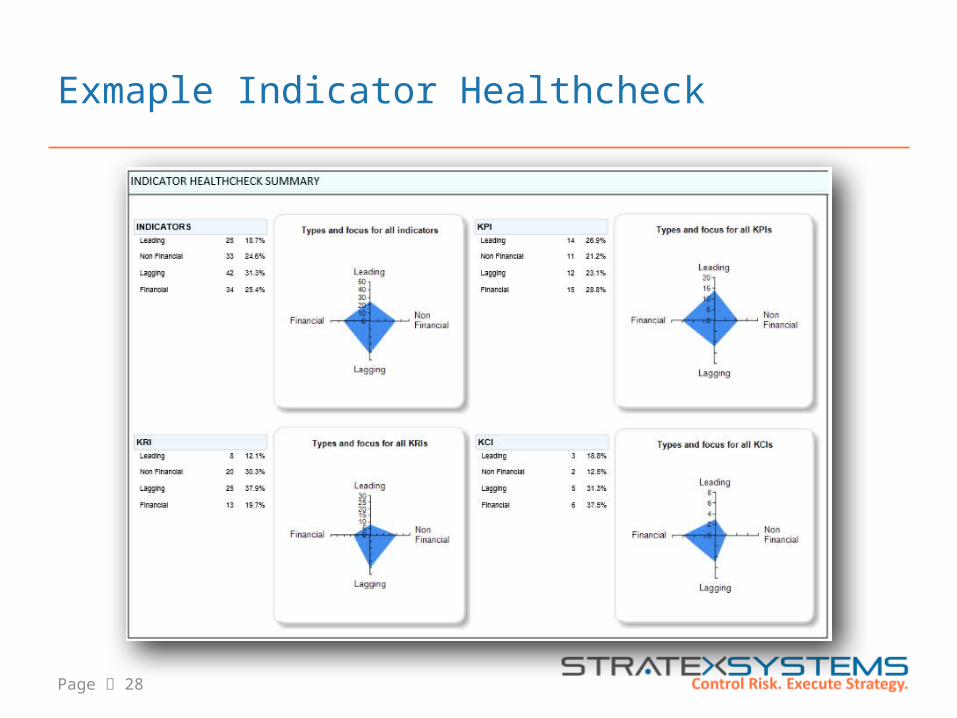
Page 28
Exmaple Indicator Healthcheck
Page 29
Q&A
Page 30
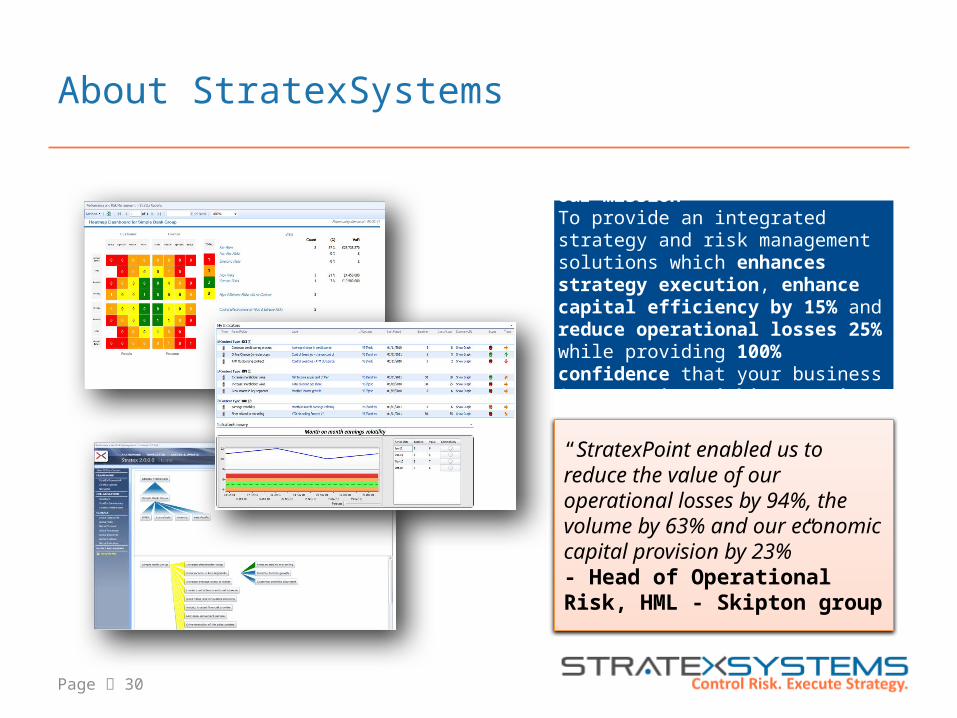
About StratexSystems
“StratexPoint enabled us to reduce the value of our operational losses by 94%, the volume by 63% and our economic capital provision by 23%” - Head of Operational Risk, HML - Skipton group
Our missionTo provide an integrated strategy and risk management solutions which enhances strategy execution, enhance capital efficiency by 15% and reduce operational losses 25% while providing 100% confidence that your business is operating within appetite.
Page 31
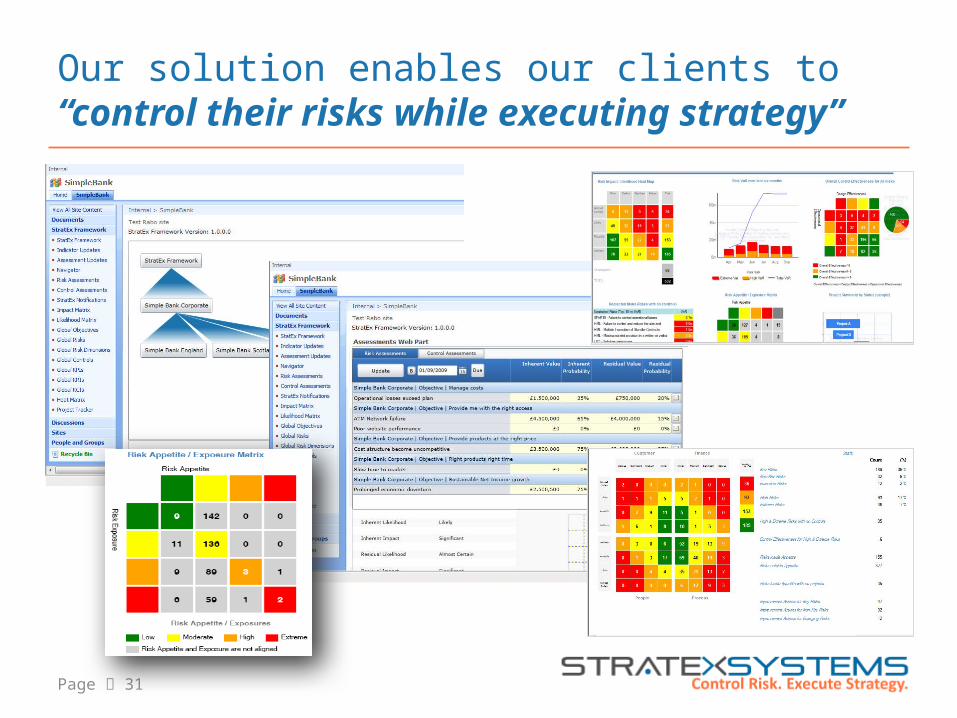
Our solution enables our clients to “control their risks while executing strategy”
Page 32
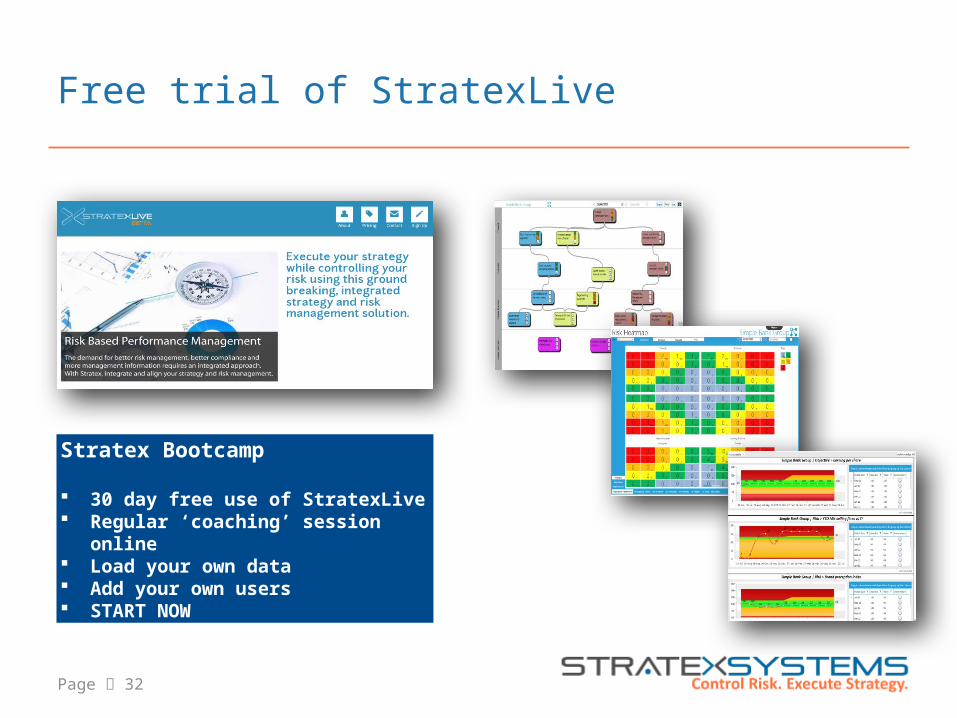
Free trial of StratexLive
Stratex Bootcamp
30 day free use of StratexLive Regular ‘coaching’ session online Load your own data Add your own users START NOW
Page 33
End

Page 34
Additional Slides
Page 35
Good indicators are focused
Providing a ‘signal’ on specific, desirable results or outcomes.
Articulating the indicator as a true indicator, rather than a measure provides focus. Rather than ‘Total Operational Losses’ consider
Operational Losses as a % of Revenue Can work in isolation or in combination with other
indicators.
Page 36
Good indicators are Objective
There should be no ambiguity as to what the indicator is measuring.
There should be general agreement on how the indicator should be interpreted.
Documenting the indicator with notes, rationale etc.
Page 37
Good indicators are Balanced
Generally should use a combination of Leading and Lagging indicators.
Use a combination of financially and non-financially orientated indicators.
Consider your total number of indicators and their balance between performance, risks and controls.
• Sometimes a single indicator can be ok!
Page 38
Good indicators are Fact-based
Where possible, indicators should generally use ‘hard’ facts / numbers.
Fact-based indictors are not as open to interpretation or ambiguity as ‘soft’ numbers.
However ‘soft’ facts and ‘gut’ feel have a vital role to play in decision making. They should supplement ‘hard’ facts via management discussions.
Good example: Net Promoter Score
Page 39
Good indicators are Owned
Indicators use a partial RACI (Accountable inferred from the parent Performance, Risk or Control)
Indicators have an updater, if manual. Indicators can have an approver (often this is the
accountable of the parent Performance, Risk or Control)
Page 40
Good indicators are Practical
An indicator is only practical if data can be collected in a timely fashion, at a reasonable, acceptable cost... Or there is a plan to make this happen!
Indicators should inform the organisational discussion.
Indicators should focus on the ‘vital few’ - it is not practical to have indicators for everything.
It is not practical (or desirable) to have indicators for everything or to develop a perfect set of indicators.
Related Documents