Managing Quantity, Quality and Timing in Cane Sugar Production: Ex Post Marketing Permits or Ex Ante Production Contracts? Sandhyarani Patlolla Ph.D. Candidate Department of Agricultural and Resource Economics University of California, Davis E-mail: [email protected] Selected Paper prepared for presentation at the Agricultural & Applied Economics Association’s 2010 AAEA, CAES & WAEA Joint Annual Meeting, Denver, Colorado, July 25-27, 2010. Copyright 2010 by Sandhyarani Patlolla. All rights reserved. Readers may make verbatim copies of this document for non-commercial purposes by any means, provided this copyright notice appears on all such copies.

Welcome message from author
This document is posted to help you gain knowledge. Please leave a comment to let me know what you think about it! Share it to your friends and learn new things together.
Transcript
Managing Quantity, Quality and Timing in Cane Sugar Production:
Ex Post Marketing Permits or Ex Ante Production Contracts?
Sandhyarani Patlolla
Ph.D. Candidate Department of Agricultural and Resource Economics
University of California, Davis
E-mail: [email protected]
Selected Paper prepared for presentation at the Agricultural & Applied Economics Association’s 2010
AAEA, CAES & WAEA Joint Annual Meeting, Denver, Colorado, July 25-27, 2010.
Copyright 2010 by Sandhyarani Patlolla. All rights reserved. Readers may make verbatim copies of this document
for non-commercial purposes by any means, provided this copyright notice appears on all such copies.
1
Abstract
Sugarcane produced in India is utilized to manufacture three sweetening agents: sugar, gur, and
khandsari. Sugar processors must comply with a floor price for cane, but gur and khandsari
producers are exempt from the floor price. Thus, any effect of the sugar processor’s choice of
procurement method on the incentives facing farmers will depend on the expected cane price in
these competing unregulated markets. In Andhra Pradesh (AP), India, private sugar processors
use an unusual form of vertical coordination. Rather than conventional pre-planting contracts,
they issue ‘permits’ to selected cane growers a few weeks before harvest. I explore the potential
motivations behind this choice of sugar processors and hypothesize that the probabilistic permit
system is the low-cost way of procuring high-quality cane. I develop a theoretical model of the
AP cane procurement market that incorporates the floor price policy that applies only to the cane
used for sugar processing, and compare processor profits under the probabilistic ex post permit
system and ex ante production contracts. The model predicts that both the quality of cane
procured and the profits from unit cane purchase are higher when the processor uses ex post
permits. These gains come at the expense of increased cultivation costs incurred by the farmers. I
test and confirm the predictions of the theoretical model using data from a household survey
conducted in fall 2008.
2
Managing Quantity, Quality and Timing in Cane Sugar Production:
Ex Post Marketing Permits or Ex Ante Production Contracts?
Agricultural cash crops, including sugarcane, have become increasingly important in India since
independence. Improvements in the marketing infrastructure have aided the evolution of
agriculture from subsistence farming to a commercial endeavor. Although the majority of
farmgate sales are still done on the spot market, growth in the agro-processing sector has been
accompanied by the increased use of alternative procurement methods. For highly perishable
agricultural products that require processing soon after harvest, the choice of procurement
channel plays a vital role in the profitability of a processing firm. An individual firm’s choice
depends on a number of considerations, such as (i) the ability of the procurement channel to
facilitate the supply of produce at regular and timely manner that meets the processing unit’s
capacity, (ii) its ability to deliver product that satisfies the processor’s quality requirements, and
(iii) the magnitude of its transaction costs.
Vertical coordination can aid processors in managing the timing of input deliveries and
the quality of the delivered production. In India’s tropical state of Andhra Pradesh (AP), private
sugar processors use an unusual form of vertical coordination. Rather than conventional pre-
planting contracts, they issue ‘permits’ to selected cane growers a few weeks before harvest.
These permits allow growers to deliver a specified amount of cane to the factory during a
specified period of time. The objective of this essay is to analyze the relative advantages of this
choice of procurement method for a sugar processor compared to the use of pre-planting
production contracts, spot market purchases, and integrated production.
The Indian government’s regulations regarding sugarcane sales vary across buyers. This
variation affects processors’ profit-maximizing choice of procurement method. Most of the cane
3
production in India is utilized to manufacture three sweetening agents: plantation white-sugar
(‘sugar’, hereafter), gur, and khandsari.1 The Indian government implements a floor price that
sugar processors must pay for the cane that meets a specified base quality.2 However, gur and
khandsari producers are exempt from these price regulations.3 Thus, any effect of a sugar
processor’s choice of procurement method on the incentives facing farmers will depend on the
expected cane price in the competing unregulated market.
Another regulation that may affect farmers’ incentives is that the government defines a
‘reserve area’ for each factory based on its crushing capacity. Within its reserve area, a sugar
processor has the right of first refusal on all sugarcane. If a factory is willing to buy cane in its
reserve area at the effective minimum price or higher, farmers may not use it for other purposes
themselves, or sell it to other buyers, except for seed. The processor may extend its cane
collection area outside its reserve area, even if it does not purchase all the cane produced in its
reserve area. Private factories in AP almost always collect cane outside their reserve areas
without purchasing all the cane in their reserve areas.
In AP, processors implement the permit system through fieldmen they employ for each
mandal in their cane-collection area.4 Each fieldman inspects cane fields in his mandal, and
determines to whom to award a permit. The permit specifies the cane delivery date to the factory,
the transportation method, and the price. If a farmer does not obtain a permit, he must sell his
1 Gur and khandsari are traditional sweetening agents produced in India. Gur is a non-crystallized sweetener that
contains sugar and molasses. In khandsari molasses is separated using hand-driven centrifuges, but compared to
sugar it is less refined. 2 Quality is measured in terms of the sugar recovery rate. The sugar recovery rate is defined as units of sugar
produced from one unit of cane. In most years, the government announced a baseline floor price for a 8.5 percent
sugar recovery rate. Once the baseline floor price is fixed, the government sets a factory-specific floor price at least
as large as the baseline floor price and depends on the factory’s characteristics, such as its sugar recovery rate in the
previous season, processing costs, and returns from sugar and its by-products. 3 In the last few years, very little cane has been utilized for khandsari production in Andhra Pradesh. I will refer to
both markets in AP as gur in rest of the essay. 4 In India states are divided into districts, and districts are divided into mandals. Each mandal includes a few
villages.
4
cane in the gur market. For the cane producer, the timing of the permit-granting process helps
him to plan alternative marketing arrangements if he does not receive a permit. However, at the
time of planting, he has no guarantee of getting a permit, so he must make his acreage allocation
decision without knowing the market in which he will sell his cane.
Sugarcane degrades relatively quickly after harvest, so a factory’s cane collection area is
limited geographically. In a normal cropping season, the cane production in a factory’s cane
collection area is greater than the factory’s capacity, which means not all cane producers can
obtain permits for all of their production. When cane’s marginal revenue product in gur is below
the government-mandated floor price, as is often the case, farmers compete for a permit in order
to obtain a better price for their cane. As the expected difference between the floor price and the
price in the gur market increases, farmers have a greater incentive to compete for a permit. Given
these market conditions, the following puzzle arises: why do sugar processors in AP create
uncertainty among farmers by using ex post permits instead of offering ex ante production
contracts? I explore potential motivations behind this choice of private factories.
Very few economic analyses of the sugar processing industry in India have been
completed. Most of the focus has been on sugar cooperatives in the state of Maharashtra
(Banerjee et al. 2001; Lalvani 2008). Some studies have compared the technical efficiency of
sugar processors across organizational forms, including private factories, cooperatives, and
public (state-owned) factories (Ferrantino and Ferrier 1995; Ferrantino, Ferrier, and Linvill
1995). To my knowledge, no studies have addressed the specific cane procurement methods
followed by private sugar processors. This paper contributes to the literature by examining the
incentives underlying the cane procurement method used in Andhra Pradesh and by discussing
5
the differences between AP and other sugarcane growing states that may influence processors’
choice of procurement method.
I develop a theoretical model of the AP cane procurement market that incorporates the
government-mandated floor price for the sugar processor, and compare processor’s profits under
the probabilistic ex post permit system and deterministic ex ante production contracts. The model
predicts that both the quality of cane procured and the processor’s profits from unit cane
purchase are higher when it uses ex post permits. These gains come at the expense of increased
cultivation costs incurred by farmers. The model also demonstrates that, as the expected price
difference between the floor price and the price in the unregulated market increases, farmers
have greater incentive to invest in quality-enhancing production practices, which benefits the
processor.
I test the predictions of the theoretical model using data from a household survey
conducted in fall 2008. For estimation, I use farmer-members of sugar cooperatives as proxies
for farmers with ex ante contracts because their cooperative membership creates a special kind of
ex ante contract to supply cane to the factory. Empirical results suggest that the cane cultivation
costs of farmers in the cane collection areas of private factories that use ex post permits are
significantly higher than the cane cultivation costs of farmer-members of sugar cooperatives.
Further, the cost difference increases as the gap between the floor price and the price in the
unregulated market increases. The results also suggest that the quality of cane purchased by the
private factories is significantly higher than the quality of cane purchased by the cooperative
firms. These results provide strong support for the theoretical prediction that a factory’s choice
of ex post permits is more profitable.
The paper has the following structure. Section 1 reviews related research on procurement
6
methods followed in different agro-processing industries in developing countries, focusing on
India. In section 2, I propose a hypothesis that explains the use of permits for cane procurement,
and discuss production practices that promote cane quality in AP. Section 3 develops a
theoretical model to explain why ex post permits are more profitable to processors compared to
ex ante contract. Section 4 provides an empirical analysis to test the predictions and discusses
potential alternative hypotheses regarding the existence of permit system. Section 5 describes the
uniqueness of ex post permits in AP. It provides possible reasons why other states have not
adopted ex post permits, and why alternative procurement methods are less attractive than ex
post permits to sugar processors in AP. Section 6 concludes by summarizing the main results and
suggesting the possible improvements for the present system.
1. Related Research
Contract farming has become a common organizational structure for many agribusiness firms in
developing countries. For the processors, contracting serves as a way to ensure quality,
coordination and desired product attributes (Kirsten and Sartorius 2002). Whether or not it can
benefit small farmers in developing countries is still controversial. Studies show that contract
farming enables small farmers in developing countries to overcome some of the barriers that they
face, such as access to capital and credit (Carter 1989; Hudson 2000; Kirsten and Sartorius 2002;
Boucher and Guirkinger 2007) and information and new technology (Goldsmith 1985).
Empirical analyses also show that contracts provide significant benefits to farmers through
increased farm incomes (Glover and Kusterer 1990; Warning and Key 2002).
On the other hand, obstacles to successful usage of contract farming such as high
transaction costs and the potential for defaults on contract agreements may offset benefits to
7
small farmers. A firm’s decision to use contracts over other means of procurement depends
highly on the transaction costs (Simmons 2002). Owing to transaction costs, contracting firms
tend to favor farmers with bigger farm size, access to irrigation and family labor (Key and
Runsten 1999; Karaan 2002; Winters, Simmons, and Patrick 2005; Prowse 2008). To the extent
that firms are biased towards larger and wealthy growers, Little and Watts (1994) expressed
concerns that poorer farmers may be left out of the development process. Many authors also
report that there are defaults on contract agreements by both buyers and producers (Kirsten and
Sartorius 2002; Poulton et al. 2004; Tschirley, Zulu, and Shaffer 2004), which undermine long-
term sustainability. For these and other reasons, Key and Runsten (1999) argue that overall,
contract farming in developing countries often fails.
Given its disadvantages, utilizing alternative institutional structures in contract farming
may help to overcome some of the problems in developing countries. Studies reported that
contracting is successful when NGOs act as intermediaries between firms and the growers
(Glover and Kusterer 1990; Singh 2000b) and when a firm deals with grower groups rather than
individuals (Winters, Simmons, and Patrick 2005) because institutions that represent many
farmers reduce firms’ transaction costs as well as farmers’ default rates.
1.1 Overview of Contract Farming in India
The use of agricultural contracts in India is a fairly recent development. In the early 1990s, food-
processing firms started to improve their supply-chain efficiency by using marketing and
production contracts for horticultural crops (Dileep, Grover, and Rai 2002; Singh 2003). With
8
one reported exception in Punjab, all of these contracts are oral, rather than written (Singh 2002;
Dev and Rao 2004).5
Most of the studies on agricultural contracts in India have compared the economic
aspects of a contracted crop with the same crop when not grown under contract (Haque 1999;
Dileep and Grover 2000; Dev and Rao 2004) or with a competing traditional crop in that region
(Bhalla and Singh 1996; Chidambaram 1997; Rangi and Siddhu 2000). All of these studies found
that growers’ net returns under contract farming are higher. However, whether or not these
contracts can provide sustained benefits to the producers and the processors in India is hotly
debated (Singh 2003; Chakraborthy 2009).
Some studies have cautioned against drawing favorable conclusions regarding the
economic effects of these contracts based on short-term results. Often firms start with initial
farmer-friendly conditions and tighten them later (Dev and Rao 2004). Singh (2002) concluded
that, although contracting led to higher farm incomes in Punjab state, it is difficult to sustain
these contracts because of the mistrust between farmers and firms. When open market prices are
high during bad seasons processors are often discouraged by farmers reneging on contracts
(Dileep, Grover, and Rai 2002; Singh 2003). In India, enforcing the contract rules using the legal
system is very difficult (Singh 2003). Providing financial incentives for better quality, harvest
timing, and care of the crop may help reduce contractual defaults by farmers (Glover and
Kusterer 1990).
None of the studies of Indian contract farming to date have reported the use of incentive
contracts that specify premium schedules for improved quality. All the contract farming that
exists in India is purely on a fixed unit price for output that meets a specified quality. Extensive
5 Singh (2002) reported that in Punjab even the biggest food-processing companies in the state such as Pepsi Food
Company, and Hindustan Lever Ltd followed oral contracts. The sole exception was Nijjer Agro Foods Ltd., which
used a written contract.
9
input control has not been practiced in India, although in some cases, processors provide a few
inputs in order to promote uniform quality, such as seed and other technology (Singh 2000a).
1.2 Overview of Sugarcane Marketing
Although sugarcane is an important cash crop worldwide, and one that requires immediate
processing, there is limited research explaining the nature of cane marketing. Nothard, Ortmann,
and Meyer (2005) reported that in South Africa, third-party contractors provide coordination
between millers and small-scale sugarcane growers by managing the timing of cane deliveries.
These contractors provide services for harvesting and transportation operations to 15 percent of
total cane produced in South Africa.
In most cane-producing countries, farmers’ cane payments are based on revenue-sharing
arrangements, in contrast to the farmers in India who receive a fixed per unit cane price that is
not linked to the actual sugar price (Todd, Forber, and Digges 2004). In Brazil and Mexico the
revenue-sharing cane payments are based on the average quality of cane delivered to the factory.
In Australia, Jamaica, Mauritius, Thailand and South Africa cane payments are based on an
individual grower’s cane quality. Economic theory predicts that the latter type of contracts are
more effective in terms of increasing cane quality by providing incentives to individual growers.
2. Ex Post Permits and Cane Farming in Andhra Pradesh
In Andhra Pradesh, private factories account for more than 80 percent of the state’s total sugar
production. Generally, the government-mandated floor price paid by sugar factories is higher
than the cane prices in the gur markets. Thus, cane farmers prefer to sell their cane to a sugar
factory. However, the average cane production in a factory’s cane collection area is higher than
10
its capacity, meaning that not all cane farmers receive the floor price. Thus, farmers make
production decisions under market uncertainty, and each year an estimated 20-25 percent of cane
produced in the state is sold in the gur market.
One explanation for why a processor creates this uncertainty is that ex post permits help
the processor circumvent the floor price. Under the probabilistic permit system, farmers know
that fieldmen issue permits depending on cane quality and distance to the mill.6 Thus, my
hypothesis is that farmers have an incentive to produce higher quality cane in order to increase
their chances of getting a permit. In other words, ex post permits create competition among the
farmers to receive a higher price, providing them an incentive to improve quality.
Price premia for higher quality represent an alternative incentive instrument. In addition
to setting factory-specific minimum cane prices, the government also announces a premium
schedule for higher qualities of cane supplied by the farmers. Processors argue that price
premiums are prohibitively expensive to implement due to the large number of farmers each
supplying a small amount of cane. Factories are required to report the quality of delivered cane
in terms of pol% to the government on a daily basis.7 But they do not measure the pol% of cane
supplied by each farmer and do not pay a premium for higher quality.
If a processor can procure higher quality cane using an incentive instrument other than a
premium, he may profit from the higher sugar recovery rate, depending on the cost of providing
the incentive. An average cane farmer delivers a very small quantity of cane at a time and
measuring the sucrose content of cane delivered by each farmer individually is too costly.8
6 During the pre-harvest survey to issue permits, fieldmen use an instrument called ‘refractometer’ to measure the
average brix of cane. A higher brix is considered an indicator of higher cane quality. 7 Before processing sugar, factories perform a chemical analysis using a polarimeter to measure sucrose content of
cane. The polarimeter reading is called as pol%. Processing converts sucrose in cane into sugar, so pol% of cane is
used as a measure of raw cane quality. 8 In AP, the average cane field is 1.76 acres, and produces 35 to 40 tonnes of cane per acre. Compared to per-acre
cane production, individual cane deliveries are relatively small with an average of 1.5 tonnes and 6 tonnes per load
11
Issuing a permit to a farmer based on testing his field once is less costly than testing his
individual deliveries at the factory gate. In other words, the permit system provides a cheaper
way to obtain higher quality cane because in addition to lowering the cost of testing cane quality,
a processor can avoid extra premium payments required by the government.
The opportunity to receive a better cane price may motivate farmers to improve cane
quality. However, producing higher quality involves extra effort by the farmers. Cane is a long-
duration,9 input-intensive crop and requires continuous management throughout the cropping
season in order to increase yield and quality. Apart from the timely usage of non-labor inputs,
such as irrigation, manure, other fertilizers, and pesticides, cane quality is mostly a function of
labor-intensive production practices that prevent lodging and manage pests and diseases, all of
which affect cane quality. Cane farmers in AP may invest in these production practices in order
to increase cane quality and hence their probability of obtaining a permit and expected price.
Recommended production practices that are followed at least to some extent by all the
cane farmers in AP include
(i) Need-based propping in cane at regular intervals to help prevent lodging, and improve
quality.10
Cane lodging is an important problem in AP cane production. It leads to bud
sprouts, aerial root formation, and pest infestation, all of which reduce cane quality.
(ii) The removal of red-rot affected stubbles and smutted clumps, and destroying them by
burning helps in controlling red-rot and smuts, common diseases in AP that lower sucrose
content.
of bullock-cart and tractor, respectively. Individual deliveries are even smaller relative to factories’ daily production
capacity; in AP capacity ranges from 1,000 to over 8,000 tonnes of cane per day. 9 Depending on the variety, cane normally matures in ten to twelve months.
10 Propping is a practice where cane plants in the adjacent rows are tied together using bottom dried, and partially
dried leaves.
12
(iii) The removal of and use of “earthing-up” practices to reduce the growth of late-formed
tillers called ‘water-shoots’,11
which harbor pests such as the inter-node borer.12
(iv) Removal of lower leaves containing the pupae of canefly and whitefly, pests that reduce
sugarcane quality.
These practices are costly and are difficult for a processor to monitor. However, farmers
who can perform these practices most efficiently are likely to undertake them to increase their
chances of receiving a permit.
3. Theoretical Model
In this section, I develop a model to evaluate a processor’s choice of ex post permits rather than
ex ante production contracts. The marginal processing cost of sugar from cane ( c ) is assumed to
be constant, and the processor is a perfect competitor in the sugar market, taking the price of
sugar ( SP ) as given. SP − c denotes the unit sugar price less processing cost. I set SP − c = 1 ,
and normalize other terms, accordingly.
Let p
fdenote the exogenous floor price for cane set by the government for the sugar
processor. In order to receive the floor price, farmers are required to supply at least the base level
of quality. Define θ as a measure of quality. Set the government-specified base level of quality
as the lower bound for θ and normalize it to zero. The processor is assumed to recover 1+ θ
unit of sugar from each unit of cane of quality θ . Under these assumptions, the processor’s profit
from the purchase of unit cane can be written as: 1+ θ − p
f. For the processor, obtaining higher
quality cane increases his revenue due to the additional sugar output per unit of cane purchased.
11
Earthing-up is a practice where soil from both sides of the furrows is collected and placed around the base of the
plants. 12
The AP Sugarcane Inspectors Association Diary (2008) reported that pest infestation and disease reduce the sugar
recovery rate. For instance, a 1 percent infestation of borers reduces the recovery rate by 0.725 percent.
13
I assume that farmers are heterogeneous in the amount of land they own, and there are n
farmers in a factory cane collection area. The quality of cane produced by a farmer and the
amount of land he owns are expected to affect his production cost per unit cane. Suppose farmer
i owns L
i units of total land, then farmer’s production cost per unit cane,
C
i, can be specified as:
C
i= C
iθ
i; L
i( ) i = 1,...,n
where iθ is the quality of cane produced by farmer i . The effort or cost to produce a unit cane of
the base quality is assumed to be constant per a given amount of land owned by a farmer. The
farmer’s production cost per unit cane is a non-decreasing function of the quality he produces, or
∂Ci
∂θi
≥ 0 . The amount of land owned by a farmer is expected to influence his cane production
cost because small farmers have access to more family labor per unit of land than large farmers
do. Mangala and Chengappa (2008) showed that small farmers manage non-mechanized farm
operations more efficiently than large farmers do. As discussed earlier, in cane cultivation
quality-enhancing farm operations involve minimal or no mechanization. Thus, it is expected
that small farmers produce a given quality at lower cost. So, the per unit cost of producing cane
of a given quality will increase with an increase in farm size
∂Ci
∂Li
≥ 0
.
13
All farmers receive the same floor price from the same sugar processor. An individual
farmer’s profit function can be specified as the difference between the cane price paid by the
factory and his production cost per unit cane. The farmer maximizes his expected profit ( π
i) per
13
Since the farmers are heterogeneous in the amount of land they own, their cane acreage allocation decisions are
also expected to vary by their land endowment. As the amount of labor available per unit of land is higher for small
farmers, I assume that unit cost of producing cane with a given quality is affected by the total farm size instead of
actual cane acreage.
14
unit cane by choosing a quality ( θ
i) to produce. Using this primary setting, I compare the
processor’s profits from using ex post permit system and ex ante production contracts.
4.1 Ex ante contracts
Suppose a contract requires farmers to supply at least the base quality in order to receive the
floor price. Then farmer i ’s profit-maximization problem from unit cane production can be
written as:
Maxθ
i
πi
= pf
− Ci
θi; L
i( )
s.t. θ
i≥ 0 .
In this case, the farmer’s profit-maximizing choice of θ
i is always zero, because price is
independent of quality and the per unit cost of production is an increasing function of quality
∂Ci
∂θi
≥ 0
. Thus, the processor’s maximum profit from purchasing each unit of cane from
farmer i using ex ante contracts equals 1− p
f.
4.2 Ex post permits
Under the system of ex post permits, an individual farmer’s expected cane price depends on his
probability of obtaining a permit. I assume that the quantity of cane produced in a factory’s cane
collection area is greater than its processing capacity, so the probability of getting a permit is less
than one. Let i
δ denote the ith
farmer’s probability of obtaining a permit to sell the cane to a
factory, so that the expected net price of cane received by farmer i is:
P
i= δ
ip
f+ 1− δ
i( )pg
15
where pg is the exogenous net price received from selling sugarcane in the unregulated gur
market, and is assumed to be strictly lower than the floor price ( p
f). Farmer i ’s expected profit
from unit cane production under ex post permits is
π
i= δ
ip
f+ 1− δ
i( )pg
− C
iθ
i; L
i( ) 1,...,i n= .
Farmer i’s probability of getting a permit is a function of the quality of the cane he
produces ( θ
i) and of the quality of the cane produced by all other farmers in the region (
θ
k for
all k ≠ i ). As the quality produced by a farmer ( θ
i) increases, his chance of receiving a permit
also increases
∂δi
θ1,...,θ
n( )∂θ
i
≥ 0
. As the quality of the cane produced by all other farmers
increases, i
δ decreases
∂δi
θ1,...,θ
n( )∂θ
k
≤ 0
. Given this specification and assuming that farmers
are risk neutral, the profit-maximization problem for farmer i under ex post permit system can
be expressed as:
( ) ( )( ) ( )1 1,..., 1 ,..., ;
s.t. 0
i i n f i n g i i i
i
i
Max p p C Lπ δ θ θ δ θ θ θθ
θ
= + − − ≥
i = 1,...,n.
The Kuhn-Tucker conditions for this profit maximization problem can be written as:
( )( ) ( )
( )( ) ( )
1
1
,..., ;0
0
,..., ;0
∂ ∂− − ≤
∂ ∂
≥
∂ ∂ − − = ∂ ∂
i n i i i
f g
i i
i
i n i i i
i f g
i i
C Lp p
C Lp p
δ θ θ θ
θ θ
θ
δ θ θ θθ
θ θ
1,..., .=i n
16
Solving all of the farmers’ maximization problems simultaneously, I obtain θ *
i, the cane
quality produced by farmer i as a function of the difference between the floor price and the
expected cane price in the unregulated market, and the amount of land owned by each farmer:
( )ngfii LLpp ,...,),( 1
** −= θθ 1,...,i n= .
Because the probability of getting a permit given a specified quality of cane produced and cane
prices in the two markets are independent of farm size, marginal revenue does not vary across
farmers. All else equal, an individual farmer’s marginal probability of obtaining a permit as a
function of quality is increasing when evaluated at 0i
θ = . Consequently, the marginal revenue
from increasing quality evaluated at i
θ equals zero is also strictly positive:
( )( )1
0
,...,0
i
i nf g
i
p p
θ
δ θ θ
θ=
∂− >
∂.
On the other hand, the marginal cost of increasing quality varies across the farmers
because smaller farmers are more efficient in producing a given quality. When evaluated at
0i
θ = , farmer i ’s marginal cost of increasing quality ( )ib is assumed to be constant such that
( )0,ib ∈ ∞ : ( )
0
;
i
i i ii
i
C Lb
θ
θ
θ=
∂=
∂ i = 1,...,n .
Given that ( )0,ib ∈ ∞ , and p
f is strictly greater than pg , I expect that there will be at least a
few farmers with ( )( )1
0
,...,
i
i ni f g
i
b p p
θ
δ θ θ
θ=
∂< −
∂ and their profit maximizing choice of
θ *
i will
be positive.
The processor’s profit from purchasing each unit of cane from farmer i using ex post
permits equals 1+ θ
i
* − pf. Thus, the processor’s profit under ex post permits (
1+ θ
i
* − pf) is
17
greater than or equal to the profit from using ex ante contracts ( 1− p
f). Because cost is an
increasing function of cane quality
∂Ci
∂θi
≥ 0
, farmers’ cultivation costs under ex post permits
are greater than or equal to their cultivation cost under ex ante contracts. In other words, the
increase in processor’s profit under ex post permits is associated with an increased cost to
farmers.
The farmer’s profit-maximizing quality increases with an increase in the difference
between the floor price and the price in the unregulated market
∂θi
*
∂ pf
− pg( )
≥ 0
.
Consequently, his unit cultivation cost increases as well. As the expected difference between the
floor price and the cane price in the unregulated market increases, farmers have a greater
incentive to invest in quality-enhancing production practices.
4. Empirical Analysis
The theoretical model concluded that the processor’s per unit profit from cane purchased and
farmers’ unit production costs are higher under ex post permits than under ex ante contracts. In
this section I test the latter hypothesis. There are no private factories that use ex ante contracts in
AP, so I cannot test the hypothesis using a direct comparison. Instead, I used farmer-members of
sugar cooperatives to proxy for the farmers with ex ante contracts. Cooperative membership is a
special kind of ex ante contract. Even though the members of the cooperative have a proportional
profit share, each farmer’s supply is a very small fraction of the total cane purchased by the
cooperative. This leads to a moral hazard problem (Holmstrom 1982). Cooperative members
have no incentive to improve their cane quality above the minimum specified level, as is the case
18
for farmers with ex ante contracts in my theoretical model. Cooperatives in AP do not collect
cane from non-members. Thus, cultivation costs are expected to be higher for farmers who sell to
a private factory than for farmers who sell to a cooperative, all else equal.
I test a more nuanced variant of this hypothesis based on the differences in incentives
facing farmers in reserve and non-reserve areas within a private factory’s cane collection area.
Compared to the farmers in a private factory’s reserve area, who are closer to the factory,
farmers in a private factory’s non-reserve area have to work harder to receive a permit. Thus, I
hypothesize that cultivation costs are higher in a private factory’s non-reserve area than in its
reserve area, which in turn has higher cultivation costs than in a cooperative’s cane collection
area. For estimation, I used the primary data from a household survey conducted in AP. In the
next sub-section, I present the sampling procedure used for the survey and selected descriptive
statistics.
4.1 Survey and data description
In fall 2008, I conducted a household survey using in-person interviews that provides individual
farming details for the cropping season 2007-08. All the interviews were completed using a
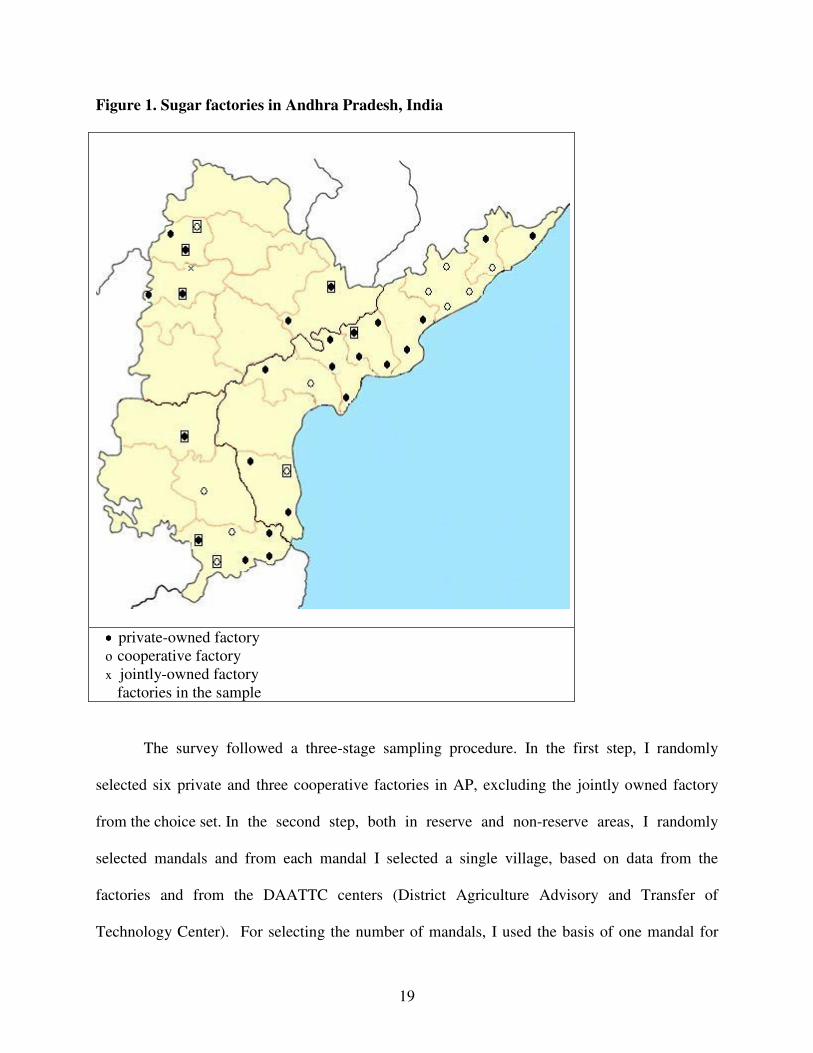
standard questionnaire. In AP there is more than one factory per district. During 2007-08, there
were 38 sugar factories operating in 14 districts of AP, including 11 cooperatives, 25 privately
owned factories and one factory owned jointly by the state government and private investors
(Figure 1).14
The daily cane crushing capacity per factory ranged from 1000 to 8000 tonnes, with
an average of 2700 tonnes.
14
Previously, the government had sole possession of the factory and in 2008 it was owned jointly with private
investors. The joint ownership during the survey period was part of the privatization process.
19
Figure 1. Sugar factories in Andhra Pradesh, India
•••• private-owned factory
ο cooperative factory
x jointly-owned factory
� factories in the sample
The survey followed a three-stage sampling procedure. In the first step, I randomly
selected six private and three cooperative factories in AP, excluding the jointly owned factory
from the choice set. In the second step, both in reserve and non-reserve areas, I randomly
selected mandals and from each mandal I selected a single village, based on data from the
factories and from the DAATTC centers (District Agriculture Advisory and Transfer of
Technology Center). For selecting the number of mandals, I used the basis of one mandal for
20
approximately 600 tonnes of daily crushing capacity of a factory. A total of 38 villages were
selected from the nine factories, with 19 in private factory reserve areas, 10 in private factory
non-reserve areas and 9 in cooperative factory areas.15
On average, for each factory I selected
two-thirds of the villages from its reserve area and at least one village from outside the reserve
area.
In the final step of sampling, I chose ten farmers randomly in each village, using the list
of households in the village’s Public Distribution System (PDS) records. In the final sample
there are 205 sugarcane farmers. In addition to these primary survey data, I used secondary data
on gur prices and factory-specific floor prices for cane obtained from the National Federation of
Cooperative Sugar Factories Limited (NFCSF) and factory-specific pol% of cane obtained from
NFCSF and Sugar Technologists Association of India (STAI) publications.
In the sample, I do not have to address farmers’ self-selection into a factory reserve or
non-reserve area for the following reasons. Factories are spatially separated and the government
tightly regulates the entry of new factories through the licensing process. Cooperative formation
was undertaken by local elites, rather than by large numbers of individual producers. Local elites
campaigned to convince farmers to join cooperatives, which the members of the elite then led.
Given this process of institutional formation, it is not individual farmers’ characteristics that
caused them to form cooperative. In addition, both cooperative and private factories exist in the
same districts, meaning that formation of cooperatives is not influenced by the geographical
characteristics. Given that a cooperative exists, farmers cannot self-select into cooperative
membership. Cane is a highly perishable and bulky product, so transporting it longer distances is
not a feasible option for farmers. Reserve and non-reserve areas are defined geographically by
15
Although reserve areas are defined for cooperatives, in AP these areas are irrelevant because cooperatives collect
cane only from their members.
21
the central government, so I do not need to address the possibility of self-selection into reserve
and non-reserve areas. Farmers do not move from their villages to have their choice of factory
and/or to fall in to a reserve or non-reserve area.
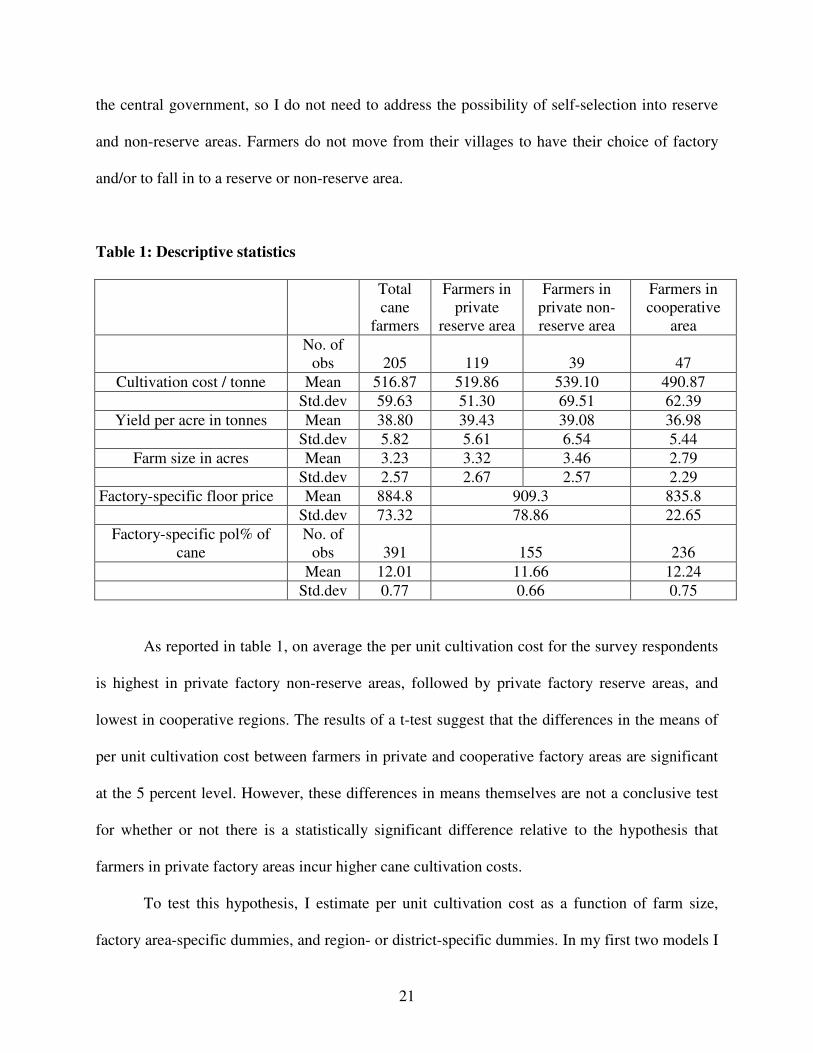
Table 1: Descriptive statistics
Total
cane
farmers
Farmers in
private
reserve area
Farmers in
private non-
reserve area
Farmers in
cooperative
area
No. of
obs 205 119 39 47
Cultivation cost / tonne Mean 516.87 519.86 539.10 490.87
Std.dev 59.63 51.30 69.51 62.39
Yield per acre in tonnes Mean 38.80 39.43 39.08 36.98
Std.dev 5.82 5.61 6.54 5.44
Farm size in acres Mean 3.23 3.32 3.46 2.79
Std.dev 2.57 2.67 2.57 2.29
Factory-specific floor price Mean 884.8 909.3 835.8
Std.dev 73.32 78.86 22.65
Factory-specific pol% of
cane
No. of
obs 391 155 236
Mean 12.01 11.66 12.24
Std.dev 0.77 0.66 0.75
As reported in table 1, on average the per unit cultivation cost for the survey respondents
is highest in private factory non-reserve areas, followed by private factory reserve areas, and
lowest in cooperative regions. The results of a t-test suggest that the differences in the means of
per unit cultivation cost between farmers in private and cooperative factory areas are significant
at the 5 percent level. However, these differences in means themselves are not a conclusive test
for whether or not there is a statistically significant difference relative to the hypothesis that
farmers in private factory areas incur higher cane cultivation costs.
To test this hypothesis, I estimate per unit cultivation cost as a function of farm size,
factory area-specific dummies, and region- or district-specific dummies. In my first two models I
22
distinguish between farmers in private factory areas and farmers in cooperative factory areas. In
the latter two I distinguish among farmers in private factory reserve areas, farmers in private
factory non-reserve areas, and farmers in cooperative factory areas. In all models, my base
factory area type is cooperative; I expect the coefficients on the private factory area type in the
first two models and the coefficients on the private reserve area type and private non-reserve
area- type in the latter two models to be positive. Farm size measures heterogeneity among the
cane growers. As discussed in the theoretical analysis, farmers with smaller landholdings are
expected to be more cost efficient in producing a given quality of cane. Therefore, the expected
sign on the coefficient of the farm size variable is positive. Either regional or district-specific
dummies are used for controlling variation across the different geographic areas.
Theory predicts that an increase in the expected difference between the floor price and
the cane price in the unregulated gur market increases the cultivation costs of the farmers in
private factory regions that use ex post permits. In order to test this hypothesis, in my second set
of empirics, I estimate per unit cultivation cost including interaction variables for the difference
between the cane price in two markets and the factory area type. Gur market prices are reported
only at the state level each year, so I assume that these prices did not vary within my sample.
Farm size and regional dummies are also included in these estimations. Because the floor price is
factory-specific and the data include nine factories from seven districts, I cannot use district-
specific dummies in these models to control variation across the different geographic areas.
My theoretical model also predicts that the quality of cane purchased by a private factory
that uses ex post permits is higher than that of a factory that uses ex ante contracts. To test this
hypothesis, in my third set of empirics, I estimate pol% of cane including a private factory
ownership dummy. In all the models my base factory-type is cooperative; I expect the coefficient
23
on private factory ownership to be positive. Regional and seasonal dummies are used to control
for variations across different geographic areas and seasons, respectively.
4.2 Estimation results
I estimate all three sets of my empirical models using ordinary least squares (OLS). To account
for the possibility of heteroskedasticity I estimated robust standard errors. In the first two sets of
empirical models (table 3 and 4) where I used survey data, the robust standard errors are cluster
corrected on villages to account for the multiple farmers within each village in the sample. All of
the coefficients have the anticipated signs and most of them are significant at conventional
levels. The overall F-test statistics suggest that the regression models fit the data well.
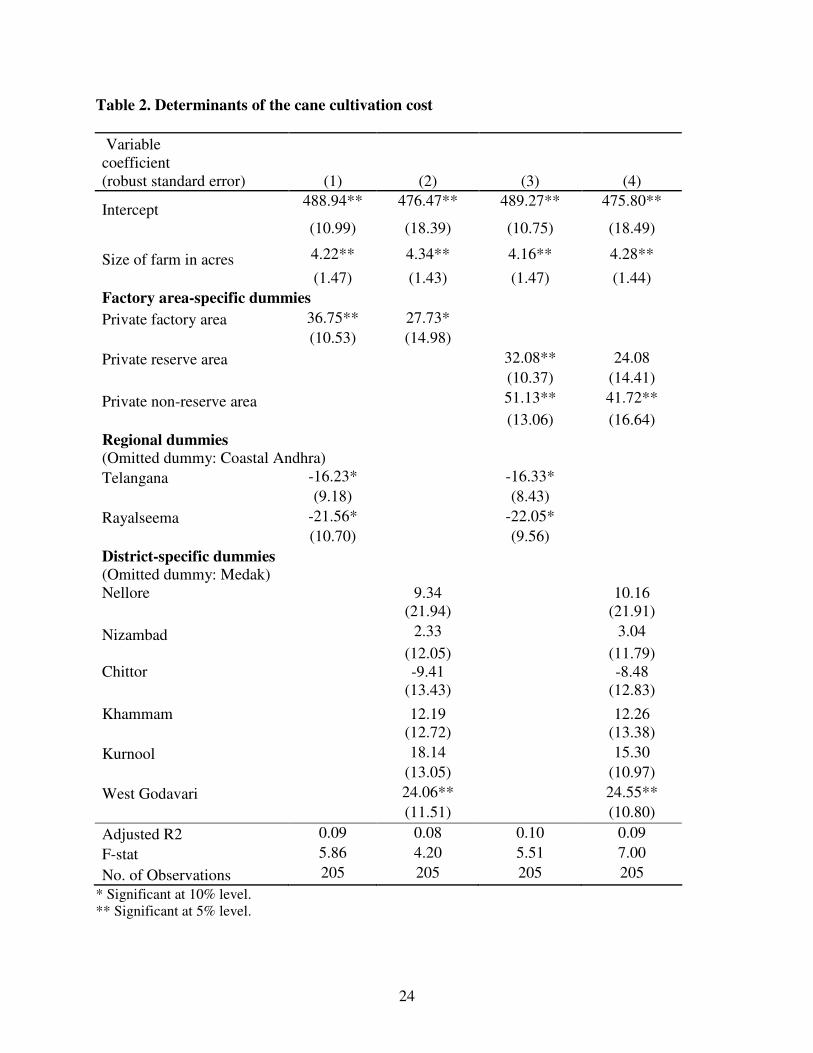
Estimation results for the first set of regressions that include factory area-specific
dummies are presented in table 2. With one exception in model 4, the coefficients of the area-
specific dummies are significantly different, at least at the 10 percent level. The first two models
suggest that all else equal, the unit cost of cane cultivation is significantly higher in private
factory areas. Models three and four suggest that all else equal, the unit cost of cane cultivation is
highest in private factory non-reserve areas followed by private factory reserve areas and are
lowest in cooperative area. The results are consistent with the hypothesis that farmers spend
more on cultivation costs under the permit system than under cooperative membership.
Consistent with my predictions, the coefficient on the farm size variable is positive and
statistically significant.
24
Table 2. Determinants of the cane cultivation cost
Variable
coefficient
(robust standard error) (1) (2) (3) (4)
Intercept 488.94** 476.47** 489.27** 475.80**
(10.99) (18.39) (10.75) (18.49)
Size of farm in acres 4.22** 4.34** 4.16** 4.28**
(1.47) (1.43) (1.47) (1.44)
Factory area-specific dummies
Private factory area 36.75** 27.73*
(10.53) (14.98)
Private reserve area 32.08** 24.08
(10.37) (14.41)
Private non-reserve area 51.13** 41.72**
(13.06) (16.64)
Regional dummies
(Omitted dummy: Coastal Andhra)
Telangana -16.23* -16.33*
(9.18) (8.43)
Rayalseema -21.56* -22.05*
(10.70) (9.56)
District-specific dummies
(Omitted dummy: Medak)
Nellore 9.34 10.16
(21.94) (21.91)
Nizambad 2.33 3.04
(12.05) (11.79)
Chittor -9.41 -8.48
(13.43) (12.83)
Khammam 12.19 12.26
(12.72) (13.38)
Kurnool 18.14 15.30
(13.05) (10.97)
West Godavari 24.06** 24.55**
(11.51) (10.80)
Adjusted R2 0.09 0.08 0.10 0.09
F-stat 5.86 4.20 5.51 7.00
No. of Observations 205 205 205 205
* Significant at 10% level.
** Significant at 5% level.
25
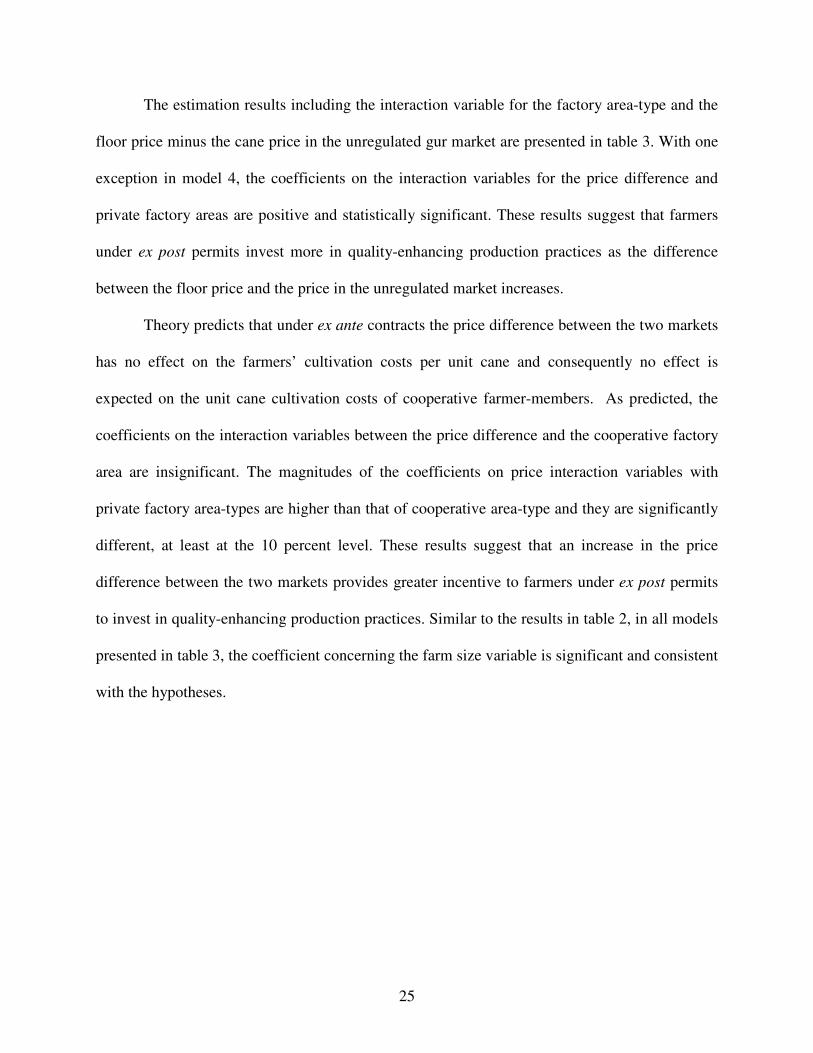
The estimation results including the interaction variable for the factory area-type and the
floor price minus the cane price in the unregulated gur market are presented in table 3. With one
exception in model 4, the coefficients on the interaction variables for the price difference and
private factory areas are positive and statistically significant. These results suggest that farmers
under ex post permits invest more in quality-enhancing production practices as the difference
between the floor price and the price in the unregulated market increases.
Theory predicts that under ex ante contracts the price difference between the two markets
has no effect on the farmers’ cultivation costs per unit cane and consequently no effect is
expected on the unit cane cultivation costs of cooperative farmer-members. As predicted, the
coefficients on the interaction variables between the price difference and the cooperative factory
area are insignificant. The magnitudes of the coefficients on price interaction variables with
private factory area-types are higher than that of cooperative area-type and they are significantly
different, at least at the 10 percent level. These results suggest that an increase in the price
difference between the two markets provides greater incentive to farmers under ex post permits
to invest in quality-enhancing production practices. Similar to the results in table 2, in all models
presented in table 3, the coefficient concerning the farm size variable is significant and consistent
with the hypotheses.
26
Table 3: Determinants of the cane cultivation cost: including interaction variables for
( )−f gp p and the factory area-type
Variable
coefficient (robust standard error) (1) (2) (3) (4)
Intercept 480.25** 480.57** 489.79** 491.06**
(12.89) (11.40) (24.55) (23.85)
Size of farm in acres 4.27** 4.16** 4.29** 4.18**
(1.48) (1.48) (1.48) (1.49)
Interaction variables for ( )−f gp p and the factory area-type
( )f gp p− X private factory area 0.14** 0.12*
(0.04) (0.07)
( )f gp p− X cooperative factory area -0.02 -0.02 -0.06 -0.06
(0.10) (0.09) (0.14) (0.13)
( )f gp p− X private reserve area 0.12** 0.10
(0.04) (0.06)
( )f gp p− X private non-reserve area 0.19** 0.17**
(0.05) (0.07)
Regional dummies (Omitted dummy: Coastal Andhra)
Telangana -5.56 -5.87
(11.75) (11.46)
Rayalseema -6.85 -7.72
(14.08) (13.74)
Adjusted R2 0.10 0.10 0.09 0.10
F-stat 9.75 9.29 6.26 8.23
No. of Observations 205 205 205 205
* Significant at 10% level.
** Significant at 5% level.
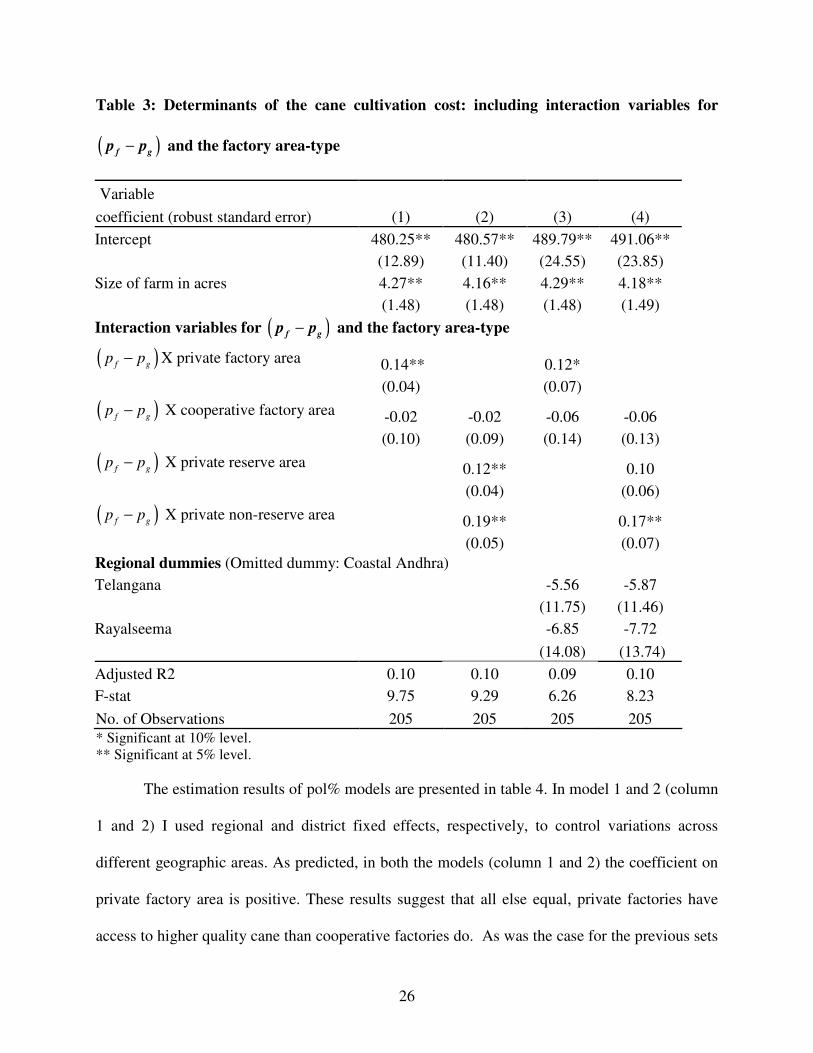
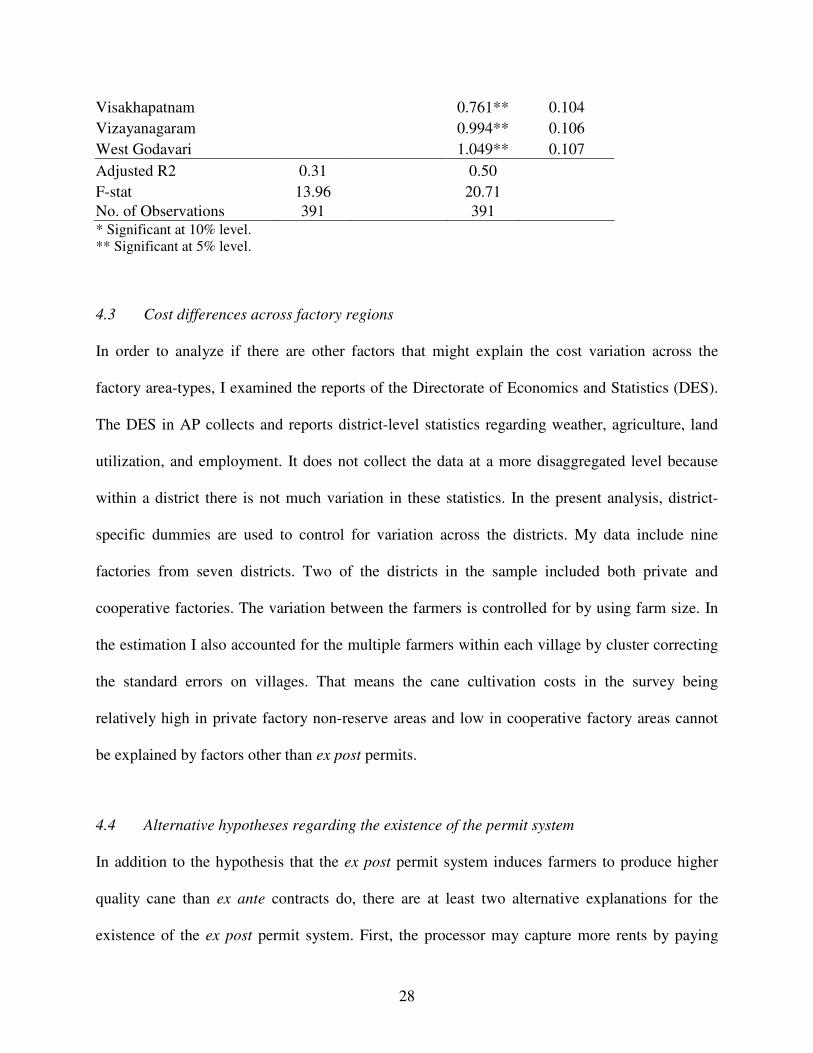
The estimation results of pol% models are presented in table 4. In model 1 and 2 (column
1 and 2) I used regional and district fixed effects, respectively, to control variations across
different geographic areas. As predicted, in both the models (column 1 and 2) the coefficient on
private factory area is positive. These results suggest that all else equal, private factories have
access to higher quality cane than cooperative factories do. As was the case for the previous sets
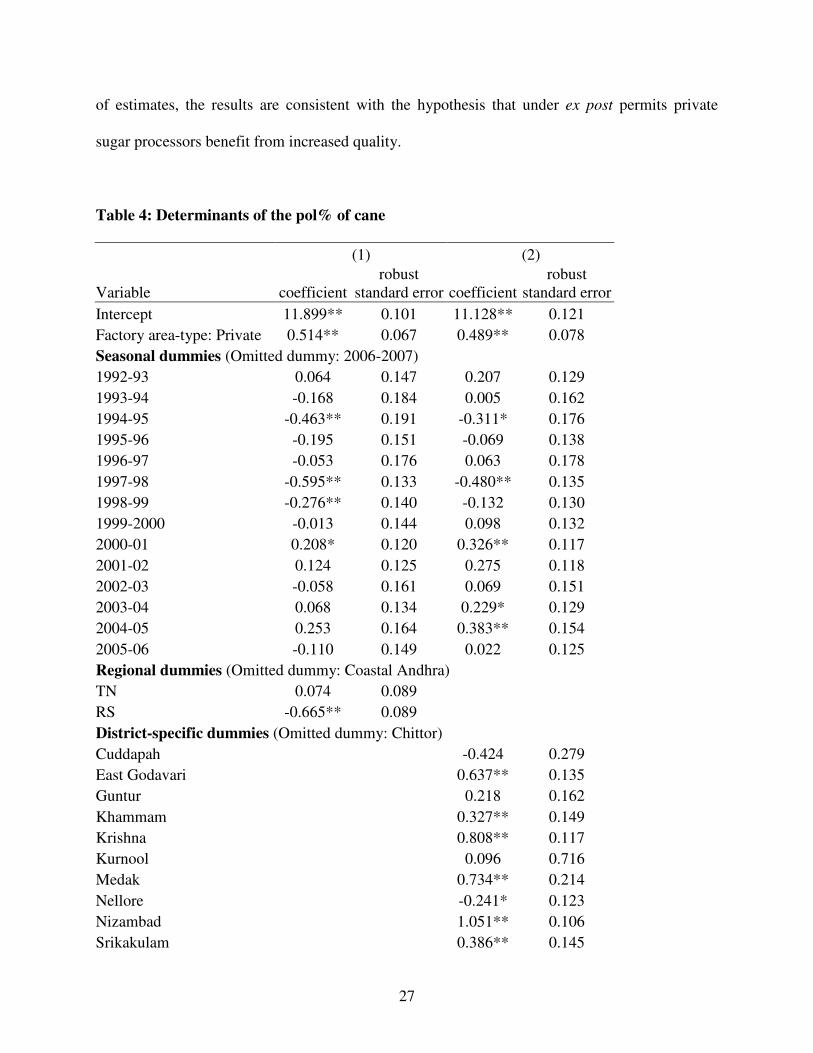
27
of estimates, the results are consistent with the hypothesis that under ex post permits private
sugar processors benefit from increased quality.
Table 4: Determinants of the pol% of cane
(1) (2)
Variable coefficient
robust
standard error coefficient
robust
standard error
Intercept 11.899** 0.101 11.128** 0.121
Factory area-type: Private 0.514** 0.067 0.489** 0.078
Seasonal dummies (Omitted dummy: 2006-2007)
1992-93 0.064 0.147 0.207 0.129
1993-94 -0.168 0.184 0.005 0.162
1994-95 -0.463** 0.191 -0.311* 0.176
1995-96 -0.195 0.151 -0.069 0.138
1996-97 -0.053 0.176 0.063 0.178
1997-98 -0.595** 0.133 -0.480** 0.135
1998-99 -0.276** 0.140 -0.132 0.130
1999-2000 -0.013 0.144 0.098 0.132
2000-01 0.208* 0.120 0.326** 0.117
2001-02 0.124 0.125 0.275 0.118
2002-03 -0.058 0.161 0.069 0.151
2003-04 0.068 0.134 0.229* 0.129
2004-05 0.253 0.164 0.383** 0.154
2005-06 -0.110 0.149 0.022 0.125
Regional dummies (Omitted dummy: Coastal Andhra)
TN 0.074 0.089
RS -0.665** 0.089
District-specific dummies (Omitted dummy: Chittor)
Cuddapah -0.424 0.279
East Godavari 0.637** 0.135
Guntur 0.218 0.162
Khammam 0.327** 0.149
Krishna 0.808** 0.117
Kurnool 0.096 0.716
Medak 0.734** 0.214
Nellore -0.241* 0.123
Nizambad 1.051** 0.106
Srikakulam 0.386** 0.145
28
Visakhapatnam 0.761** 0.104
Vizayanagaram 0.994** 0.106
West Godavari 1.049** 0.107
Adjusted R2 0.31 0.50
F-stat 13.96 20.71
No. of Observations 391 391 * Significant at 10% level.
** Significant at 5% level.
4.3 Cost differences across factory regions
In order to analyze if there are other factors that might explain the cost variation across the
factory area-types, I examined the reports of the Directorate of Economics and Statistics (DES).
The DES in AP collects and reports district-level statistics regarding weather, agriculture, land
utilization, and employment. It does not collect the data at a more disaggregated level because
within a district there is not much variation in these statistics. In the present analysis, district-
specific dummies are used to control for variation across the districts. My data include nine
factories from seven districts. Two of the districts in the sample included both private and
cooperative factories. The variation between the farmers is controlled for by using farm size. In
the estimation I also accounted for the multiple farmers within each village by cluster correcting
the standard errors on villages. That means the cane cultivation costs in the survey being
relatively high in private factory non-reserve areas and low in cooperative factory areas cannot
be explained by factors other than ex post permits.
4.4 Alternative hypotheses regarding the existence of the permit system
In addition to the hypothesis that the ex post permit system induces farmers to produce higher
quality cane than ex ante contracts do, there are at least two alternative explanations for the
existence of the ex post permit system. First, the processor may capture more rents by paying
29
lower wages to fieldmen, who can then collect bribes from farmers in exchange for permits. As
discussed earlier, the sugar processors are obligated to pay a floor price which is higher than the
unregulated market price, so cane producers have an incentive to bribe fieldmen to receive a
permit, and do so, as reported by survey respondents. To capture these extra rents, processor
could pay wages to fieldmen that take into account the extra remuneration they receive from
cane producers in the form of bribes for obtaining permits. In this way, the processor may
capture the rents but is not involved directly in collecting rents from farmers. It would be illegal
for a processor to charge a fee to the farmers to sell their cane to factory because it would
circumvent the floor price. Thus, it would necessary for the factory to collect these rents
indirectly.
From interviews with private processors I learned that each fieldman issues permits for
750 to 1000 tonnes of cane per month. The survey data suggest that in the last five years the
yearly average bribe per tonne of cane ranged between Rs.0.32 and Rs. 1.34. Although these are
non-zero amounts, the average magnitude of bribes is almost negligible compared to the cane
prices paid by the factories, which range from Rs.850 to Rs.1150 per tonne. In other words, even
in the year with the highest bribes, they account for less than 0.15 percent of the cane price.
Apart from the cost of purchasing cane, sugar production includes other operational costs
that account for 30 to 40 percent of total costs. When these total costs of producing sugar are
considered, the percentage of bribes is even lower. The data do not support the hypothesis that a
processor may capture rents through bribes to any substantial extent. In contrast to the lack of
any significant advantage from bribes, ex post permits provide a much bigger magnitude of
benefits to the processor through cane quality enhancement. Thus, the hypothesis of paying
30
lower wages to fieldmen in order to capture extra rents is not a convincing explanation of the
permit system.
A second alternative hypothesis is that the probabilistic permit system may ensure a
sufficient quantity of cane to meet factory capacity requirements. Each farmer has a specific
probability of receiving a permit based on the total production in the factory cane collection area.
As I discussed before, the farmer’s expected price of cane increases as the probability of getting
a permit rises and, needless to say, production decisions depend on expected prices. In general, if
a processor chooses to use pre-planting contracts he has to consider the capacity limits of the
processing unit. In other words, the processor cannot assign contracts for more raw product than
his facility can handle. In the event that contract farmers fail to meet the requirements of the unit
due to a bad crop year, the processor has to depend on the spot market.
However, depending on the spot market is problematic. If the sugar processor chooses to
assign the maximum number of contracts to meet the requirements of the factory, other farmers’
production decisions depend only on the expected cane price in the gur market, which is lower
than the factory’s floor price. Thus, cane production by non-contracted farmers is expected to be
lower. In the event that the processor has to depend on the spot market, there may not be enough
cane available. Thus, the hypothesis is that a processor will encourage excess production of cane
by using ex post permits in order to increase the expected supply of cane in his factory’s cane
collection area.
In order to analyze this alternative hypothesis, I examine factory capacity utilization by
the cooperative factories. Similar to the ex ante contract system, cooperatives’ cane acreage
allocation is associated with the factory’s capacity. Thus, the effect of production shocks on
cooperatives is the same as on private factories that use ex ante contacts. If capacity utilization
31
by private factories is significantly higher than that by cooperatives, we can conclude that
probabilistic permit system increases cane supply to the factory.
Andhra Pradesh Sugar and Cane Commission’s (APSCC) annual publications report each
factory’s capacity utilization and sugar recovery rates.16
The results of t-test using APSCC data
suggest that the difference in capacity utilization between private and cooperative factories is
insignificant at the 10 percent level. So, this alternative hypothesis is not supported by the data.
In contrast to the lack of any difference in the capacity utilization, private factories in AP
achieved significantly higher sugar recovery rates than cooperatives did.
5. Why are Ex Post Permits Unique to AP?
The sugar processors in AP have used this permit system for almost three decades. Although the
results of the empirical analysis support the theoretical prediction that ex post permits are more
profitable than ex ante contracts in AP, sugar processors in other states do not follow this
method. Why, if the permit system is profitable for processors in AP, has it not been adopted by
cane processors in other states?
To address the uniqueness of the procurement method in AP, I first explore possible
reasons for why the ex post permits are not adopted in other major cane producing states in India.
Then, I discuss why the ex post permits are preferred to alternative procurement methods
available to the private sugar processors in AP.
16
APSCC assumes a crushing season of 130 days per annum as optimal for the state. Capacity utilization is
calculated as the ratio of total cane processed by a factory to its 130 days crushing capacity. For the present analysis,
I used data of all the sugar factories in AP for the crushing seasons from 2001-2002 to 2005-2006.
32
5.1 Ex post permits versus procurement methods followed in other states
The top six sugar producing states, Maharashtra, Uttar Pradesh, Karnataka, Tamil Nadu, Andhra
Pradesh and Gujarat, account for more than 90 percent of total sugar production in India.
However, processors’ cane procurement methods vary across these states, and are highly
influenced by linkages among social classes, the distribution of land among these social classes,
and average farm size.
Under the Industrial Act (1956), licensing of new factories in the cooperative sector was
given first preference by the Indian government in the application process. So, if socio-economic
conditions in a state are favorable for formation of sugar cooperatives, then the opportunities for
private firms to enter sugar processing will be limited. The important factors that ease the
formation of sugar cooperatives is that either the majority of farmers belong to a dominant caste
in the region, or they have large farms. If both large and small farmers belong to the dominant
caste, as is the case in Maharashtra, that will enable close bonding among all size groups of
farmers within each village, facilitating the formation of sugar cooperatives (Attwood 1992).17
Regardless of farmers’ caste, large farmers have more options for credit, and are willing to invest
in commercial crops such as sugarcane. So in the states where the majority of farmers are large
farmers such as in Gujarat, farmers invest in sugar cooperatives.18
In these states cooperative
members grow most of the cane. Cooperatives must accept all deliveries from their members as
long as they meet minimum quality requirements.
17
Maharashtra is the largest sugar-producing state in India. A single dominant caste, ‘Marathas’, constitutes the
majority of the rural population including both small and large farmers. In Maharashtra, all cane is processed into
sugar and 90 percent of the sugar is produced by cooperatives. 18
According to the Indian Agricultural Census, farmers owning less than 4.94 acres are defined as small farmers. In
Gujarat, more than 60 percent of the farmers are large farmers with the highest average farm sizes (5.56 acres)
among the major cane producing states. In Gujarat, all cane production is utilized by the sugar cooperatives.
33
Even in states where sugar production is dominated by cooperatives, there are a few
private factories which could still use the ex post permits. But the second factor that is crucial in
using ex post permits is the availability of supply to the private processors at the floor price in
excess of the factories’ crushing capacities. In Maharashtra and Gujarat, there is no gur or
khandsari manufacturing and cane is utilized only for sugar. Thus, there is no surplus cane
available above the factories’ capacity limit. Consequently, even the private factories in these
states are unable to use this ex post procurement method.
Two southern states, Tamil Nadu and Karnataka, produce more cane than the states’ total
sugar factories’ crushing capacities. However, at the floor price there is no surplus cane available
to the sugar factories because they face much more competition than factories in AP do. There is
a high demand for gur manufactured in Tamil Nadu (TN) and a correspondingly high price, so
cane growers prefer manufacturing gur to selling their cane to the sugar factories at the floor
price (Lakshmanan 2003). In Karnataka, most of the cane is produced in the northwestern region
bordering Maharashtra where processors face competition from Maharashtran sugar
cooperatives.19
The competition increases the market price for cane above the floor price, so
there is no surplus cane available at the floor price to meet the factories’ capacity requirements.
This provides a valid explanation for non-utilization of ex post permits in these states.
The third important factor in using ex post permits is transaction costs. For private
factories, having access to a supply greater than its capacity at the floor price is a necessary but
not sufficient condition to use the permit system. If transaction costs are higher than the expected
benefits from using ex post permits, then private factories have no incentive to use them. For
instance, Uttar Pradesh (UP) is the largest cane-producing state in India and has the lowest
19
The cooperatives in western Maharashtra send their own harvesting and transport team for cane collection,
providing tough competition for local private factories in Karnataka. The strength of the Maharashtran cooperatives
is demonstrated by the fact that the factories in northwestern Karnataka even pay cane transportation costs.
34
average farm size (1.98 acres), and lowest literacy rate (46 percent) among the major cane-
producing states. Dealing with thousands of illiterate small farmers involves relatively high
transaction costs for a factory. Consistent with this fact, in UP the factory’s interaction with
farmers is limited to the time of purchase (Amin 1984). Private factories in UP accept cane in its
order of delivery, even though cane quality decreases as the time between harvesting and
processing increases. In AP, in contrast the literacy rate is 53 percent and the average farm size is
3.06 acres which appears to be large enough to cover the transaction costs of using ex post
permits.
In summary, unlike other states in India, private processors in AP can benefit from using
ex post permits, due to: (i) the existence of only a limited number of sugar cooperatives, (ii)
access to surplus cane above their capacity limits at the floor price, and (iii) a large enough
average farm size to cover the transaction costs of using ex post permits. These distinctive
features of AP explain the uniqueness of ex post permits in the state.
5.2 Why are alternative procurement methods less preferred in AP?
In theory, sugar processors in AP could procure cane using a variety of ex ante contracts.
Processors could issue ex ante contracts that can specify any or all of the following requirements:
(i) a minimum required quality, (ii) the use of particular production practices which promote
quality, or (iii) incentive contracts that reward farmers based on their individual product quality.
(i) Contracts with minimum required quality: A processor could design a contract that
specifies a minimum required quality. If the processor specifies the same quality as the
government requires to receive the floor price, then cane growers have no incentive to
improve the quality. This is the base case of ex ante contracts discussed in the theoretical
35
section. Alternatively, if a processor specifies a higher quality than the government
minimum requirement, it could be obligated by the government to pay the price that is
adjusted for the extra premium for all farmers.20
Under this type of contract a processor
may have to pay for any realized quality improvement, unlike the permit system.
(ii) Contracts with required production practices: A processor could design a contract that
requires farmers to undertake specific production practices. Occasionally, processors
educate farmers about quality-enhancing production practices. Nonetheless, these
practices are not included in contractual agreements by sugar processors in India.21
The
presence of moral hazard on the part of the grower in undertaking these required practices
is the main reason for non-utilization of such contracts. Monitoring production practices
is a way to address this moral hazard problem. However, because a processor deals with
thousands of farmers, the cost of monitoring would be prohibitive. In contrast, with ex
post permits, a processor can limit individual farm inspections to a single visit when a
permit is either issued or not. Thus, the processors do not prefer contracts with required
production practices.
(iii) Incentive contracts: A processor could follow an incentive schedule for premium quality.
As noted earlier, it is costly to monitor the quality of individual delivery at factory gate.
Another issue with this type of incentive contract is that farmers may believe that
processor is offering quality incentives in order to manipulate the price.22
In addition, this
20
In AP state cane commissionerate office, Mr. Venkat Rao, Assistant Cane Commissioner, whom I interviewed,
indicated that because of this possibility none of the factories in India specify higher cane quality explicitly. 21
Factories in Karnataka and Tamil Nadu use informal oral contracts to procure cane. Even in these states, besides
meeting government specified qualities, the only other requirement is farmers to grow factory specified varieties for
guaranteed purchase. 22
District Agriculture Advisory and Transfer of Technology Center (DAATTC) officials in Medak, whom I
interviewed, suggested that farmers do not like differential payments from the same buyer. Given that the processor
has to depend on thousands of farmers for the raw material, gaining their trust is very important for long-term
success.
36
type of contract does not provide any advantage of circumventing the floor price, because
the government sets the premium schedule.
In contrast, with ex post permits a processor does not require higher quality cane directly,
and instead induces the farmers to improve quality in order to increase their probability of
obtaining a permit. Of course, another alternative is that a processor could use the spot market,
but under this option it is difficult, if not impossible, to manage the timing of input deliveries. An
inability to manage delivery timing effectively may increase the time gap between harvesting
and processing, which causes cane quality to deteriorate. This discussion establishes that ex post
permits is the most profitable option for the sugar processors in AP. Paired with the earlier
discussion of the factors discouraging the use of ex post permits in other cane-producing states,
this discussion explains why the use of this system is unique to AP.
6. Summary and Conclusions
In this paper I developed a theoretical model of the AP cane procurement market that
incorporates the government-mandated floor price policy that applies only to the cane used for
sugar processing, and compared the processor’s profits under the probabilistic ex post permit
system and ex ante production contracts. The main conclusion is that ex post permits creates
competition among the farmers to increase cane quality that brings higher profits to the processor
at the expense of higher costs to the farmers. This hypothesis is tested and not rejected using data
from a survey of 205 cane farmers.
Theory also predicts that as the expected price difference between the floor price and
price in the unregulated market increases, farmers have a greater incentive to invest in quality-
enhancing production practices, which benefits the processor. The positive effect of this expected
37
price difference on the farmer’s cultivation cost in private factory region is supported by the
empirical analysis.
When there is no premium schedule (in practice) for quality improvement under the price
floor policy, the expected price in the unregulated market will have a significant influence on
processor’s procurement choice. I find that in Andhra Pradesh, where these unregulated market
prices are below the floor price for a specified base quality level, government intervention
creates perverse incentives for a processor to employ ex post opportunism. Although higher
overall cane quality is achieved through permits, only the processor benefits from this system,
while farmers face market uncertainty and bear the extra costs of quality enhancement.
This explains the necessity for market assurance to the farmers to increase their welfare.
Given the present conditions, I suggest the following practices for enhancing vertical
coordination that will help the farmers as well as processors. The utilization of grower groups
rather than dealing with individuals in contracting may help in providing market assurance for
farmers by negotiating arrangements, such as production, harvesting and transportation. In
addition, such arrangements would reduce processor’s transaction costs. Similar to the case of
cooperative-members, grower groups may provide closer communication between farmers and
factory management to administer delivery timing more effectively that minimizes post-harvest
quality losses compare to dealing with each farmer separately. Encouraging farmers to self-select
into these groups who monitor each other may also reduce the potential moral hazard problems
that exist in production contracts.
38
References
Amin, S. 1984. Sugarcane and Sugar in Gorakhpur: An Inquiry into Peasant Production for
Capitalist Enterprise in Colonial India. New Delhi: Oxford University Press.
Attwood, D.W. 1992. Raising Cane: The Political Economy of Sugar in Western India. New
Delhi: Oxford University Press.
Balla, G.S., and G. Singh. 1996. Impact of GATT on Punjab Agriculture: Institute of
Development and Communications. Delhi: Ajanta Press.
Banerjee, A., D. Mookherjee, K. Munshi, and D. Ray. 2001. “Inequality, Control Rights, and
Rent Seeking: Sugar Cooperatives in Maharashtra.” Journal of Political Economy
109(1):138-190.
Boucher, S., and C. Guirkinger. 2007. “Risk, Wealth and Sectoral Choice in Rural Credit
Markets.” American Journal of Agricultural Economics 89(4):991-1004.
Carter, M.R. 1989. “The Impact of Credit on Peasant Productivity and Differentiation in
Nicaragua.” Journal of Development Economics 31:13-36.
Chakraborthy, D. 2009. “Contract Farming in India: Unique Solution to Multilayer Agricultural
Problems?” Review of Market Integration 1(1):83-102.
Chidambaram, M. 1997. “A Study of Export Potentials for Gherkins (Hybrid Cucumber) in
Tamil Nadu.” Working Paper, Center for Agriculture and Rural Development,
Department of Agricultural Economics, Tamil Nadu Agricultural University,
Coimbatore, India.
Dev, S.M., and N.C. Rao. 2004. “Food Processing in Andhra Pradesh: Opportunities and
Challenges.” Working Paper, Center for Economic Social Studies (CESS), Hyderabad,
India.
Dileep, B.K., and R.K. Grover. 2000. “An Economic Analysis of Tomato Production under
Contract vis-à-vis Non-Contract Farming System.” Indian Journal of Agricultural
Economics 55(3):350-351.
Dileep, B.K., R.K. Grover, and K.N. Rai. 2002. “Contract Farming in Tomato: An Economic
Analysis.” Indian Journal of Agricultural Economics 57(2):197-210.
Ferrantino, M.J., and G.D. Ferrier. 1995. “The Technical Efficiency of Vacuum-pan Sugar
Industry of India: An Application of Stochastic Frontier Production Function Using Panel
Data.” European Journal of Operational Research 80:639-653.
Ferrantino, M.J., G.D. Ferrier, and C.B. Linvill. 1995. “Organizational Form and Efficiency:
Evidence from Indian Sugar Manufacturing.” Journal of Comparative Economics 21:29-
53.
39
Glover, D., and K. Kusterer. 1990. Small Farmers, Big Business: Contract Farming and Rural
Development. London: Macmillan Co.
Goldsmith, A. 1985. “The Private Sector and Rural Development: Can Agribusiness Help the
Small Farmers? World Development 13(10):1125-1138.
Haque, T. 1999. “Contract Farming in India.” Unpublished, National Center for Agricultural
Economics and Policy Research, New Delhi.
Holmstrom, B. 1989. “Moral Hazard in Teams.” The Bell Journal of Economics 13(2):324-340.
Hudson, D. 2000. “Contracting in Agriculture: A Primer for Leaders.” Research Report No.
2000-007, Dept. of Agr. Econ., Mississippi State University.
India, Andhra Pradesh Sugar and Cane Commission. 2008. AP Sugarcane Inspectors Association
Diary. Government Printing Department.
Karaan, M. 2002. “Transaction Costs in Contract Farming Models for Mussel and Oyster
Farming in South Africa: Organizational and Management Implications.” Aquaculture
Economics and Management 6(5):397-409.
Key, N., and D. Runsten. 1999. “Contract Farming, Smallholders and Rural Development in
Latin America: The Organization of Agro-processing Firms and the Scale of Outgrower
Production.” World Development 27:381-401.
Kirsten, J., and K. Sartorius. 2002. “Linking Agribusiness and Small-scale Farmers in
Developing Countries: Is There a New Role for Contract Farming? Development Southern
Africa 19(4):503-529.
Lakshmanan, S. 2003. “Economic Analysis of Jaggery Preparation with Particular Reference to
Athani Village of Erode District, Tamil Nadu.” Indian Journal of Agricultural Economics
53(2):253-254.
Lalvani, L. 2008. “Sugar Cooperatives in Maharashtra: A Political Economy Perspective.”
Journal of Development Studies 44(10):1474-1505.
Little, P.D., and M.J. Watts, ed. 1994. Living under Contract. Madison: University of Wisconsin
Press.
Mangala, K.P., and P.G. Chengappa. 2008. “A Novel Agribusiness Model for Backward
Linkages with Farmers: A Case of Food Retail Chain.” Agricultural Economics Research
Review 21:363-370.
Nothard, B.W., G.F. Ortmann, and E. Meyer. 2005. “Attributes of Small-scale Sugarcane
Contractors That Influence in Their Service Quality in Kwazulu-Natal.” Agrekon
44(3):402-422.
40
Poulton, C., P. Gibbon, B. Hanyani-Mlambo, J. Kydd, W. Maro, M.N. Larsen, A. Osorio, D.
Tschirley, and B. Zulu. 2004. “Competition in Coordination in Liberalized African Cotton
Market Systems.” World Development 32:519-536.
Prowse, M. 2008. “Making Contract Farming Work with Cooperatives: Producer Organizations
and Poverty Reduction.” Capacity 34:1-6.
Rangi, P.S., and M.S. Sidhu. 2000. “A Study of Contract Farming of Tomato in Punjab.”
Agricultural Marketing 42(4):15-23.
Simmons, P. 2002. “Overview of Smallholder Contract Farming in Developing Countries.”
Working Paper No. 02-04, Agricultural and Development Economics Division of the
Food and Agriculture Organization of the United Nations.
Singh, S. 2000a. “Contract Farming for Agricultural Diversification in the Indian Punjab.”
Indian Journal of Agricultural Economics 55(3):283-294.
Singh, S. 2000b. “Contract Farming in Developing Countries: A Review.” Journal of Social and
Economic Development 3(2):255-263.
Singh, S. 2002. “Contracting Out Solutions: Political Economy of Contract Farming in the Indian
Punjab.” World Development 30(9):1621-1638.
Singh, V. 2003. “Contract Farming Ventures in India: A Few Successful Cases.” Spice 1(4):1-6.
Todd, M., G. Forber, and P. Digges. 2004. Sugarcane, second edition. Glyn James, ed. Blackwell
Publishing Company.
Tschirley, D., B. Zulu, and J. Shaffer. 2004. “Cotton in Zambia: An Assessment of its
Organization, Performance, Current Policy Initiatives and Challenges for the Future.”
Working Paper No. 10, Michigan State University.
Warning, M., and N. Key. 2002. “The Social Performance and Distributional Consequences of
Contract Farming: An Equilibrium Analysis of the Arachide de Bouche Program in
Senegal.” World Development 30:255-263.
Winters, P., P. Simmons, and I. Patrick. 2005. “Evaluation of Hybrid Seed Contract between
Smallholders and a Multinational Company in East Java, Indonesia.” Journal of
Development Studies 41(1):62-89.
Related Documents