Management Quality and Carbon Performance of Aluminium Producers Simon Dietz, Valentin Jahn, Michal Nachmany, Jolien Noels and Rory Sullivan February 2019

Welcome message from author
This document is posted to help you gain knowledge. Please leave a comment to let me know what you think about it! Share it to your friends and learn new things together.
Transcript

Management Quality and
Carbon Performance of
Aluminium Producers
Simon Dietz, Valentin Jahn, Michal Nachmany, JolienNoels and Rory Sullivan
February 2019

Key messagesThis slide set reports on TPI’s latest assessment; our first of the world’s largest publicly listed companies involved in aluminium
production.
The 12 aluminium producers we assess are at various steps on the TPI Management Quality staircase, from acknowledging climate
change as a business issue (Level 1) to strategic assessment (Level 4). As a whole, the sector’s Management Quality is close to the
average of all companies in the TPI database. However, the 12 aluminium producers perform better on average than other carbon-
intensive manufacturing sectors such as cement, paper and steel.
All the leading companies in this sector are listed in OECD countries and several are diversified with major operations in e.g. mining other
commodities. By contrast, more than half of global primary aluminium production is located in China.
Carbon Performance data for the aluminium sector are limited. This reflects a lack of emissions disclosure of, and limited target-setting
for, aluminium production specifically.
Aluminium producers’ emissions intensity varies widely, due mainly to the source of electricity used for smelting.
Only 3 aluminium producers have an emissions intensity that is currently aligned with the Paris Agreement benchmarks: Alcoa, NorskHydro and Rio Tinto. Norsk Hydro’s current emissions intensity is almost as low as the Below 2C benchmark in 2030.
Only 2 companies have a target to reduce their emissions intensity of aluminium production that extends to at least 2020: Alcoa and UC Rusal. Neither is aligned with the benchmarks.

About the Transition
Pathway Initiative

About TPI and this slide setTPI is a global initiative led by Asset Owners and supported by Asset Managers.
Aimed at investors, it assesses companies’ progress on the transition to a low-
carbon economy, supporting efforts to address climate change.
Established in January 2017, TPI is now supported by more than 40 investors with
over £10.3/$13.3 trillion AUM.
Using companies’ publicly disclosed data, TPI:
• Assesses the quality of companies’ management of their carbon emissions and
of risks and opportunities related to the low-carbon transition, in line with the
recommendations of TCFD;
• Assesses how companies’ planned or expected future Carbon Performance
compares to international targets and national pledges made as part of the
2015 UN Paris Agreement;
• Publishes the results via an open-access online tool:
www.transitionpathwayinitiative.org.
This slide set presents our latest assessment; TPI’s first assessment of the
aluminium sector.
TPI Partners
The Grantham Research Institute on Climate Change and the Environment, a research centre at the London School of Economics and Political Science (LSE), is TPI’s academic partner. It has developed the assessment framework, provides company assessments, and hosts the online tool.
FTSE Russell is TPI’s data partner. FTSE Russell is a leading global provider of benchmarking, analytics solutions and indices.
The Principles for Responsible Investment (PRI) provides a secretariat to TPI. PRI is an international network of investors implementing the six Principles for Responsible Investment.

Research Funding Partners
We would like to thank our Research Funding Partners for their ongoing support to the TPI and their enabling the research behind this report and its publication.

TPI Design
Principles
Company assessments are based only on publicly available information: disclosure-based
Outputs should be useful to Asset Owners and Asset Managers, especially with limited resources: accessible and easy to use
Aligned with existing initiatives and disclosure frameworks, such as CDP and TCFD: not seeking to add unnecessarily to reporting burden
Pitched at a high level of aggregation: corporation-level
Overview of the TPI Tool
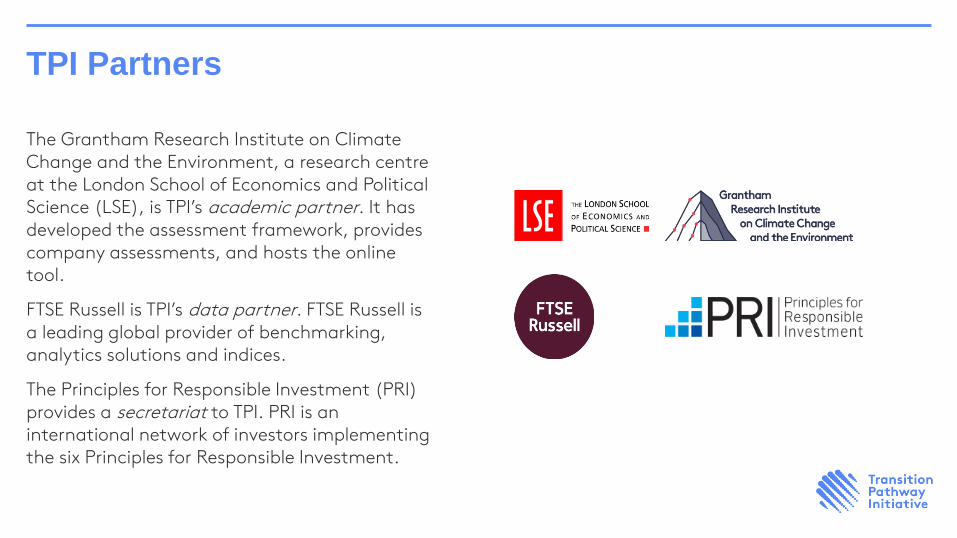
TPI’s company assessments are divided into 2 parts:
1. Management Quality covers companies’ management/governance of greenhouse gas emissions and the risks and opportunities arising from the low-carbon transition;
2. Carbon Performance assessment involves quantitative benchmarking of companies’ emissions pathways against the international targets and national pledges made as part of the 2015 UN Paris Agreement, for example limiting global warming to below 2°C.
Both of these assessments are based on company disclosures.

Management QualityLevel 0
Unaware
Level 1
Awareness
Level 2
Building capacity
Level 3
Integrating into operational
decision making
Level 4
Strategic assessment
Company has set long-term quantitative targets (>5 years) for reducing its GHG emissions
Company has nominated a board member/committee with explicit responsibility for oversight of the climate change policy
Company has incorporated ESG issues into executive remuneration
Company has set quantitative targets for reducing its GHG emissions
Company has incorporated climate change risks and opportunities in its strategy
Company has set GHG emission reduction targets
Company reports on its Scope 3 GHG emissions
Company undertakes climate scenario planning
Company explicitly recognises climate change as a relevant risk/opportunity for the business
Company has published info. on its operational GHG emissions
Company has had its operationalGHG emissions data verified
Company discloses an internal carbon price
Company does not recognise climate change as a significant issue for the business
Company has a policy (or equivalent) commitment to action on climate change
Company supports domestic & international efforts to mitigate climate change
Company has a process to manage climate-related risks
Company discloses Scope 3 GHG emissions from use of sold products (selected sectors only)
TPI’s Management Quality framework is based on 16-17 indicators, each of which tests whether a company has implemented a particular carbon management practice. These 16-17 indicators are used to map companies on to 5 levels/steps. The data are provided by FTSE Russell.

Carbon Performance
TPI’s Carbon Performance Assessment tests the
alignment of company targets with the Paris
Agreement goals, using the same approach as Science-
Based Targets.
TPI uses 3 benchmark scenarios:
1. Paris Pledges, consistent with emissions reductions
pledged by countries as part of the Paris
Agreement (i.e. NDCs);
2. 2 Degrees, consistent with the overall aim of the
Paris Agreement, albeit at the low end of the
range of ambition;
3. Below 2 Degrees, consistent with a more
ambitious interpretation of the Paris Agreement’s
overall aim.
Benchmarking is sector-specific and based on
emissions intensity.
Company A is not aligned with any Paris benchmark
Company B is eventually aligned with the Paris Pledges, but neither 2°C
nor Below 2°C
Company C is aligned with all Paris benchmarks, including Below 2°C

Latest results:
Management Quality of
aluminium producers

Management Quality level
Level 0
Unaware
Level 1
Awareness
Level 2
Building capacity
Level 3
Integrating into
operational decision
making
Level 4
Strategic assessment
3 companies
4 companiesAlcoa
Rio Tinto
South322 company
Alumina
Arconic
Nippon Light Metal
Norsk Hydro
3 companiesUACJ
UC Rusal
0 companiesChalco
China Zhongwang
Press Metal

Management Quality level
Aluminium producers’ average Management Quality score is 2.6, meaning
that the average company in this sector is just over halfway between building
capacity (Level 2) and integrating climate change into operational decision
making (Level 3).
Aluminium producers’ average Management Quality score of 2.6 is about the
same as the average score of all companies in the TPI database.* However,
the aluminium sector scores better on average than other carbon-intensive
manufacturing sectors such as cement, paper and steel.
Five out of 12 aluminium producers are on Levels 1 and 2, while the remaining
7 companies are on Levels 3 and 4. All the leaders in this sector are listed in
OECD countries and several of them are diversified, with major operations in
e.g. mining other commodities. By contrast, more than half of global primary
aluminium production is located in China.
No company satisfies all Management Quality criteria: there are not yet any
4* aluminium producers.
* As of February 2019

Management Quality:
indicator by indicator
Most aluminium producers implement the basic carbon
management practices; fewer take the more advanced
steps. We see this general pattern in all TPI sectors.
The 12 companies in the aluminium sector are more likely
than the average TPI company to have set quantified, long-
term emissions targets (Q13) and to have undertaken
climate scenario planning (Q16), although the absolute
number of companies undertaking climate scenario planning
remains low (4 out of 12).
Conversely aluminium producers are less likely than the
average TPI company to disclose Scope 3 emissions (Q8)
and to have incorporated ESG issues into executive
remuneration (Q14).
None of the 12 aluminium producers discloses an internal
carbon price (Q17).
0 2 4 6 8 10 12
L0|1. Acknowledge?
L1|2. Explicitly recognise as risk/opportunity?
L1|3. Policy commitment to act?
L2|4. Emissions targets?
L2|5. Disclosed Scope 1&2 emissions?
L3|6. Board responsibility?
L3|7. Quantitative emissions targets?
L3|8. Disclosed any Scope 3 emissions?
L3|9. Had operational emissions verified?
L3|10. Support domestic and intl. mitigation?
L3|11. Process to manage climate risks?
L3|12. Disclosed use of product emissions?
L4|13. Long-term emissions targets?
L4|14. Incorporated ESG into executive remuneration?
L4|15. Climate risks/opportunities in strategy?
L4|16. Undertakes climate scenario planning?
L4|17. Discloses an internal price of carbon?
Number of companies scoring Yes (blue) and No (red)
Not applicable

Latest results: Carbon
Performance of aluminium
producers

Scope of Carbon
Performance assessmentOur emissions intensity measure in this sector is Scope 1 + 2
greenhouse gas emissions from aluminium production, per tonne of
aluminium produced.* The majority of emissions are in Scope 2.
We focus on the two most emissions-intensive stages of aluminium
production; refining and smelting. We also take emissions from
aluminium recycling into account.
Aluminium producers that are involved in neither refining nor
smelting fall outside the scope of our assessment: Arconic, China
Zhongwang and Nippon Light Metal
*Primary and secondary aluminium
Bauxite Alumina AluminiumEnd
productSmelting fabricating
Recycling
Refining
Aluminium producers’ Carbon
Performance versus the
benchmarks
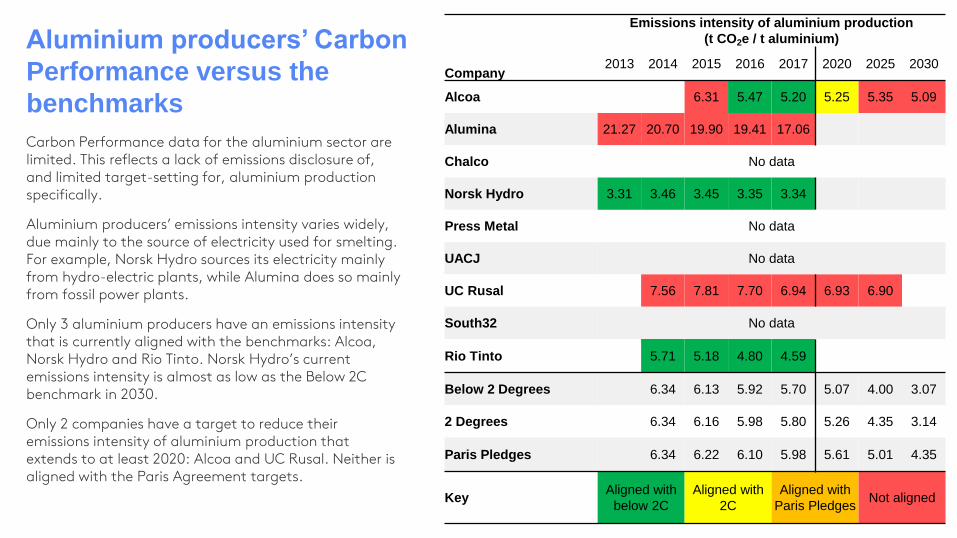
Carbon Performance data for the aluminium sector are limited. This reflects a lack of emissions disclosure of, and limited target-setting for, aluminium production specifically.
Aluminium producers’ emissions intensity varies widely, due mainly to the source of electricity used for smelting. For example, Norsk Hydro sources its electricity mainly from hydro-electric plants, while Alumina does so mainly from fossil power plants.
Only 3 aluminium producers have an emissions intensity that is currently aligned with the benchmarks: Alcoa, Norsk Hydro and Rio Tinto. Norsk Hydro’s current emissions intensity is almost as low as the Below 2C benchmark in 2030.
Only 2 companies have a target to reduce their emissions intensity of aluminium production that extends to at least 2020: Alcoa and UC Rusal. Neither is aligned with the Paris Agreement targets.
Company
Emissions intensity of aluminium production
(t CO2e / t aluminium)
2013 2014 2015 2016 2017 2020 2025 2030
Alcoa 6.31 5.47 5.20 5.25 5.35 5.09
Alumina 21.27 20.70 19.90 19.41 17.06
Chalco No data
Norsk Hydro 3.31 3.46 3.45 3.35 3.34
Press Metal No data
UACJ No data
UC Rusal 7.56 7.81 7.70 6.94 6.93 6.90
South32 No data
Rio Tinto 5.71 5.18 4.80 4.59
Below 2 Degrees 6.34 6.13 5.92 5.70 5.07 4.00 3.07
2 Degrees 6.34 6.16 5.98 5.80 5.26 4.35 3.14
Paris Pledges 6.34 6.22 6.10 5.98 5.61 5.01 4.35
KeyAligned with
below 2C
Aligned with
2C
Aligned with
Paris PledgesNot aligned

Disclaimer
1. All information contained in this report and on the TPI website is derived from publicly available
sources and is for general information use only. Information can change without notice and The
Transition Pathway Initiative does not guarantee the accuracy of information in this report or on
the TPI website, including information provided by third parties, at any particular time.
2. Neither this report nor the TPI website provides investment advice and nothing in the report or on
the site should be construed as being personalised investment advice for your particular
circumstances. Neither this report nor the TPI website takes account of individual investment
objectives or the financial position or specific needs of individual users. You must not rely on this
report or the TPI website to make a financial or investment decision. Before making any financial
or investment decisions, we recommend you consult a financial planner to take into account your
personal investment objectives, financial situation and individual needs.
3. This report and the TPI website contain information derived from publicly available third party
websites. It is the responsibility of these respective third parties to ensure this information is
reliable and accurate. The Transition Pathway Initiative does not warrant or represent that the
data or other information provided in this report or on the TPI website is accurate, complete or up-
to-date, and make no warranties and representations as to the quality or availability of this data
or other information.
4. The Transition Pathway Initiative is not obliged to update or keep up-to-date the information that
is made available in this report or on its website.
5. If you are a company referenced in this report or on the TPI website and would like further
information about the methodology used in our publications, or have any concerns about
published information, then please contact us. An overview of the methodology used is available
on our website.
6. Please read the Terms and Conditions which apply to use of the website.
Related Documents