MANAGED CARE DIGEST SERIES ® HOSPITALS/SYSTEMS DIGEST PUBLIC PAYER DIGEST HMO-PPO DIGEST S I N C E 1 9 8 7 2nd Edition Type 2 Diabetes Report | 2014 Central Florida Presented by in partnership with the Florida Health Care Coalition

Welcome message from author
This document is posted to help you gain knowledge. Please leave a comment to let me know what you think about it! Share it to your friends and learn new things together.
Transcript
MANAGED CARE DIGEST SERIES®
H O S P I T A L S / S Y S T E M S D I G E S T P U B L I C P A Y E R D I G E S T H M O - P P O D I G E S TSINCE 1987
2nd Edition
Type 2 Diabetes Report|2014Central Florida
Presented by
in partnership with the
Florida Health Care Coalition
2 CENTRAL FLORIDA TYPE 2 DIABETES REPORT, 2014 MANAGED CARE DIGEST SERIES® www.flhcc.org
FLORIDA TYPE 2 DIABETES REPORT
CONTENTS
Steve Montgomery 407-694-3080Account Executive, Sanofi US [email protected]
Patient Demographics ................... 3–4
Use of Services ..................................... 5
ALOS/Inpatient Charges .................... 6
Professional Charges ...................... 7–8
Pharmacotherapy ........................ 9–10
Persistency/Readmissions ................. 11
ADA/EASD Position Statement ........ 12
IntroductionSanofi US (Sanofi), in conjunction with the Florida Health Care Coalition, is pleased to present the second edition of the Central Florida Type 2 Diabetes Report for 2014, an overview of key demographic, utilization, charge and pharmacotherapy measures for Type 2 diabetes patients in key local markets in central Florida. The report also provides state and national benchmarks that can help providers and employers identify opportunities to better serve the needs of their patients. All data are drawn from the Sanofi Managed Care Digest Series®.
Sanofi, as sponsor of this report, maintains an arm’s-length relationship with the organizations that prepare this report and carry out the research. The desire of Sanofi is that the information in this report be completely independent and objective.
This report features a number of examples of patient-level, disease-specific data on Type 2 diabetes that can be provided using the Managed Care Digest Series® as a resource. Type 2 diabetes (a chronic disease marked by high levels of glucose in the blood) was chosen as the focus of this resource, as the Centers for Disease Control estimates that 90% to 95% of all Americans with diabetes—translating to 5% to 7% of the U.S. population—have the Type 2 variety.
All data in this report (covering 2010 through 2013) were gathered by IMS Health, Parsippany, NJ, a leading provider of innovative health care data products and analytic services. The data provide employers with independent, third-party information against which they benchmark their own data on patient demographics, professional and facility charges, service utilization and pharmacotherapy.
MethodologyIMS Health generated data for this Managed Care Digest Series® report
Provided by Sanofi US
Bridgewater, NJ
Developed and produced by Forte Information Resources LLC
Denver, CO
www.forteinformation.com
Data provided by IMS Health
Parsippany, NJ
www.managedcaredigest.com
CONTACTS
using mostly health care professional and
institutional insurance claims, representing
more than 7.7 million unique Type 2
diabetes patients nationally in 2013 with
a diagnosis in the 250.00–250.92 range.
Data from physicians of all specialties
and from all hospital types are included.
Per-case average length of stay
and inpatient charge data come from
IMS Health’s Hospital Procedure/
Diagnosis (HPD) Database. This database
contains an extensive set of hospital
inpatient and outpatient discharge
records, including actual diagnoses
and procedures for about 75% of
discharges nationwide (including 100%
of Medicare-reimbursed discharges).
IMS Health also gathers data on
prescription activity from the National
Council for Prescription Drug Programs
(NCPDP). These data account for some
2 billion prescription claims annually,
or more than 50% of the prescription
universe. These prescription data
represent the sampling of prescription
activity from a variety of sources, including
retail chains, mass merchandisers and
pharmacy benefit managers. Cash,
mail-order, Medicaid and third-party
transactions are tracked.
DATA INTEGRITY
Data arriving into IMS Health are put
through a rigorous process to ensure
that data elements match to valid
references, such as product codes,
ICD-9 (diagnosis) and CPT-4 (procedure)
codes, and provider and facility data.
Through its patient encryption
methods, IMS Health creates a unique,
random numerical identifier for each
patient, then strips away all patient-
specific health information that is
protected under the Health Insurance
Portability and Accountability Act (HIPAA).
The identifier allows IMS Health to track
disease-specific diagnosis and procedure
activity across the various settings where
patient care is provided.
MANAGED CARE DIGEST SERIES
®
SINCE 1987
WWW.FLHCC.ORG MANAGED CARE DIGEST SERIES® CENTRAL FLORIDA TYPE 2 DIABETES REPORT, 2014 3
Pre-Diabetes Diabetes0%
3%
6%
9%
12%
Perc
en
tag
e o
f Po
pu
latio
n
1.2% 1.2% 1.2%
9.5%
10.7%10.4%
2008 2009 2010
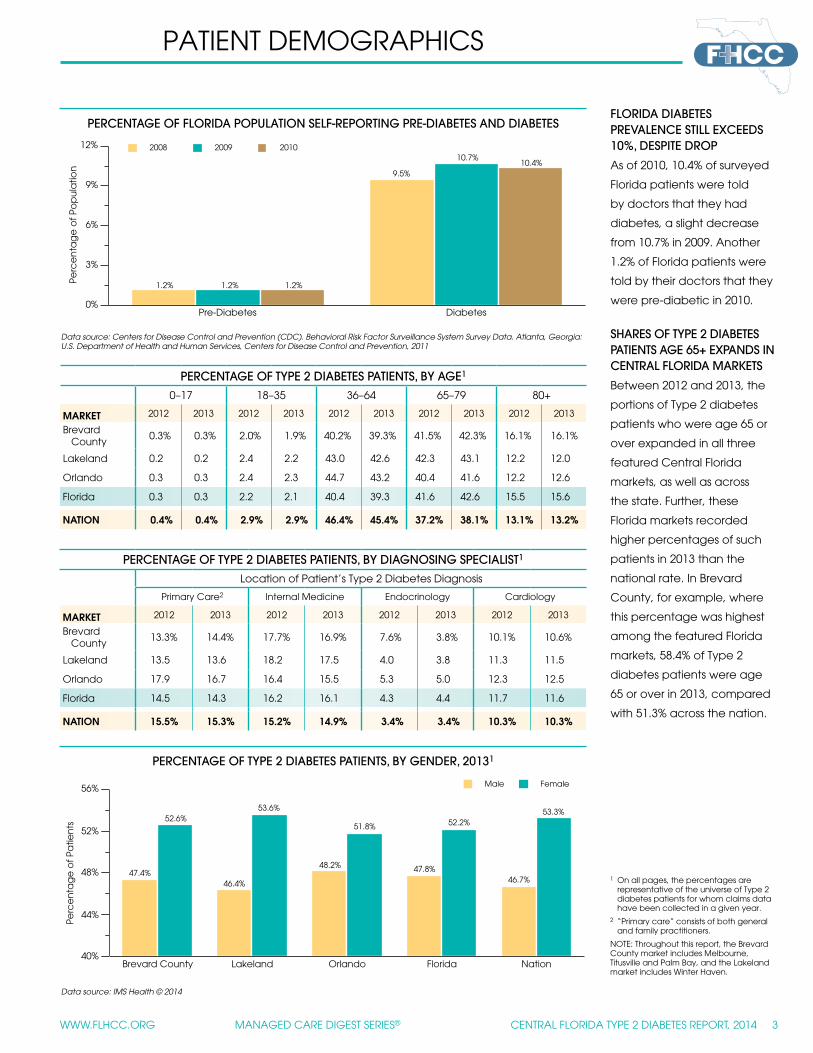
FLORIDA DIABETES PREVALENCE STILL EXCEEDS 10%, DESPITE DROP
As of 2010, 10.4% of surveyed
Florida patients were told
by doctors that they had
diabetes, a slight decrease
from 10.7% in 2009. Another
1.2% of Florida patients were
told by their doctors that they
were pre-diabetic in 2010.
SHARES OF TYPE 2 DIABETES PATIENTS AGE 65+ EXPANDS IN CENTRAL FLORIDA MARKETS
Between 2012 and 2013, the
portions of Type 2 diabetes
patients who were age 65 or
over expanded in all three
featured Central Florida
markets, as well as across
the state. Further, these
Florida markets recorded
higher percentages of such
patients in 2013 than the
national rate. In Brevard
County, for example, where
this percentage was highest
among the featured Florida
markets, 58.4% of Type 2
diabetes patients were age
65 or over in 2013, compared
with 51.3% across the nation.
PATIENT DEMOGRAPHICS
Data source: IMS Health © 2014
PERCENTAGE OF TYPE 2 DIABETES PATIENTS, BY GENDER, 20131
1 On all pages, the percentages are representative of the universe of Type 2 diabetes patients for whom claims data have been collected in a given year.
2 “Primary care” consists of both general and family practitioners.
NOTE: Throughout this report, the Brevard County market includes Melbourne, Titusville and Palm Bay, and the Lakeland market includes Winter Haven.
PERCENTAGE OF TYPE 2 DIABETES PATIENTS, BY AGE1
0–17 18–35 36–64 65–79 80+
MARKET 2012 2013 2012 2013 2012 2013 2012 2013 2012 2013
Brevard County
0.3% 0.3% 2.0% 1.9% 40.2% 39.3% 41.5% 42.3% 16.1% 16.1%
Lakeland 0.2 0.2 2.4 2.2 43.0 42.6 42.3 43.1 12.2 12.0
Orlando 0.3 0.3 2.4 2.3 44.7 43.2 40.4 41.6 12.2 12.6
Florida 0.3 0.3 2.2 2.1 40.4 39.3 41.6 42.6 15.5 15.6
NATION 0.4% 0.4% 2.9% 2.9% 46.4% 45.4% 37.2% 38.1% 13.1% 13.2%
PERCENTAGE OF TYPE 2 DIABETES PATIENTS, BY DIAGNOSING SPECIALIST1
Location of Patient’s Type 2 Diabetes Diagnosis
Primary Care2 Internal Medicine Endocrinology Cardiology
MARKET 2012 2013 2012 2013 2012 2013 2012 2013
Brevard County
13.3% 14.4% 17.7% 16.9% 7.6% 3.8% 10.1% 10.6%
Lakeland 13.5 13.6 18.2 17.5 4.0 3.8 11.3 11.5
Orlando 17.9 16.7 16.4 15.5 5.3 5.0 12.3 12.5
Florida 14.5 14.3 16.2 16.1 4.3 4.4 11.7 11.6
NATION 15.5% 15.3% 15.2% 14.9% 3.4% 3.4% 10.3% 10.3%
Brevard County Lakeland Orlando Florida Nation40%
44%
48%
52%
56%
Perc
en
tag
e o
f Pa
tien
ts
47.4%
52.6%
46.4%
53.6%
48.2%
51.8%
47.8%
52.2%
46.7%
53.3%
Male Female
PERCENTAGE OF FLORIDA POPULATION SELF-REPORTING PRE-DIABETES AND DIABETES
Data source: Centers for Disease Control and Prevention (CDC). Behavioral Risk Factor Surveillance System Survey Data. Atlanta, Georgia: U.S. Department of Health and Human Services, Centers for Disease Control and Prevention, 2011

4 CENTRAL FLORIDA TYPE 2 DIABETES REPORT, 2014 MANAGED CARE DIGEST SERIES® www.flhcc.org
MEDICARE-COVERED SHARE
OF CENTRAL FLORIDA TYPE 2
DIABETES PATIENTS EXPANDS
For all three Central Florida
markets and the state as
a whole, the percentages
of Type 2 diabetes patients
covered by Medicare grew
between 2012 and 2013.
Data source: IMS Health © 2014
FLORIDA TYPE 2 DIABETES PATIENTS ARE MORE APT TO HAVE >2 COMPLICATIONS
Despite a slight decline in
Brevard County between
2012 and 2013, the shares of
Type 2 diabetes patients with
more than two complications
topped the corresponding
national average (20.6%) in all
four profiled Florida markets
in 2013. Type 2 diabetes
patients in Lakeland, Orlando
and across the state were
more prone to be diagnosed
with cardiovascular disease,
neuropathy or nephropathy
complications than their
counterparts across the U.S.
1 Includes HMOs, PPOs, point-of-service plans and exclusive provider organizations.2 A complication is defined as a patient condition caused by the Type 2 diabetes of the patient. These conditions are a direct result
of having Type 2 diabetes. Complications of Type 2 diabetes include, but are not limited to, cardiovascular disease, hypoglycemia, nephropathy, neuropathy and retinopathy.
PERCENTAGE OF TYPE 2 DIABETES PATIENTS, BY NUMBER OF COMPLICATIONS2
0 1 2 >2
MARKET 2012 2013 2012 2013 2012 2013 2012 2013
Brevard County
53.0% 54.5% 15.6% 15.8% 9.5% 9.1% 21.9% 20.7%
Lakeland 48.0 47.5 15.0 14.3 9.3 9.2 27.8 29.1
Orlando 48.8 47.6 15.0 14.4 9.6 9.7 26.7 28.3
Florida 48.7 48.0 15.9 15.2 9.7 9.6 25.7 27.2
NATION 56.0% 55.0% 15.9% 15.6% 8.7% 8.8% 19.4% 20.6%
PERCENTAGE OF TYPE 2 DIABETES PATIENTS, BY PAYER
Commercial Insurance1 Medicaid Medicare
MARKET 2012 2013 2012 2013 2012 2013
Brevard County
45.1% 44.6% 10.6% 10.6% 42.4% 43.0%
Lakeland 47.6 49.1 13.4 11.2 38.1 39.1
Orlando 48.7 47.2 11.2 10.2 38.7 41.4
Florida 48.0 47.9 9.4 8.7 41.7 42.5
NATION 50.2% 48.6% 9.9% 10.4% 39.2% 40.3%
PERCENTAGE OF TYPE 2 DIABETES PATIENTS, BY PAYER, 2013
PATIENT DEMOGRAPHICS
Brevard County Lakeland Orlando Florida Nation0%
14%
28%
42%
56%
Perc
en
tag
e o
f Pa
tien
ts
44.6%
10.6%
43.0%
49.1%
11.2%
39.1%
47.2%
10.2%
41.4%
47.9%
8.7%
42.5%
48.6%
10.4%
40.3%
Commercial Insurance1 Medicaid Medicare
PERCENTAGE OF TYPE 2 DIABETES, BY TYPE OF COMPLICATION, 20132
MARKETCardiovascular
DiseaseNeuropathy Nephropathy Retinopathy Hypoglycemia
Brevard County
62.6% 31.0% 34.3% 13.5% 5.3%
Lakeland 59.1 40.1 31.3 20.0 7.8
Orlando 64.9 32.9 39.2 13.7 7.4
Florida 62.6 35.9 36.5 15.1 7.1
NATION 57.4% 32.7% 31.0% 18.5% 7.9%
WWW.FLHCC.ORG MANAGED CARE DIGEST SERIES® CENTRAL FLORIDA TYPE 2 DIABETES REPORT, 2014 5
USE OF SERVICES
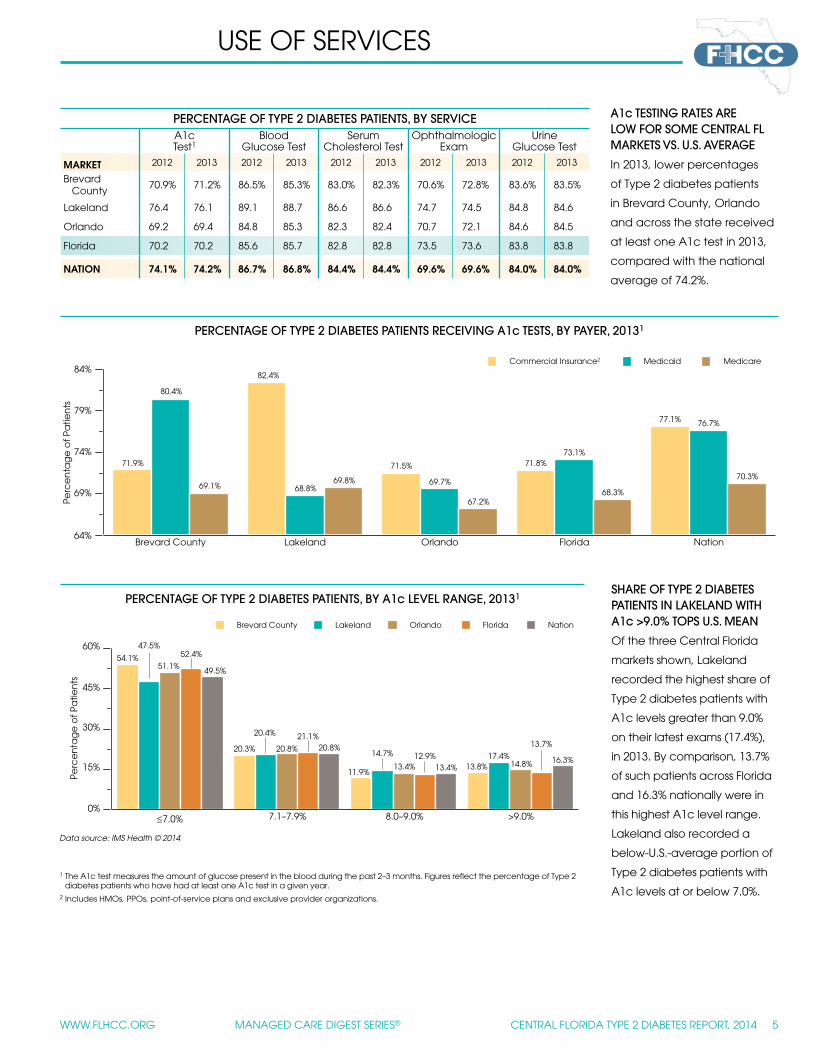
A1c TESTING RATES ARE LOW FOR SOME CENTRAL FL MARKETS VS. U.S. AVERAGE
In 2013, lower percentages
of Type 2 diabetes patients
in Brevard County, Orlando
and across the state received
at least one A1c test in 2013,
compared with the national
average of 74.2%.
1 The A1c test measures the amount of glucose present in the blood during the past 2–3 months. Figures reflect the percentage of Type 2 diabetes patients who have had at least one A1c test in a given year.
2 Includes HMOs, PPOs, point-of-service plans and exclusive provider organizations.
Data source: IMS Health © 2014
PERCENTAGE OF TYPE 2 DIABETES PATIENTS RECEIVING A1c TESTS, BY PAYER, 20131
PERCENTAGE OF TYPE 2 DIABETES PATIENTS, BY SERVICEA1c Test1
Blood Glucose Test
Serum Cholesterol Test
Ophthalmologic Exam
Urine Glucose Test
MARKET 2012 2013 2012 2013 2012 2013 2012 2013 2012 2013
Brevard County
70.9% 71.2% 86.5% 85.3% 83.0% 82.3% 70.6% 72.8% 83.6% 83.5%
Lakeland 76.4 76.1 89.1 88.7 86.6 86.6 74.7 74.5 84.8 84.6
Orlando 69.2 69.4 84.8 85.3 82.3 82.4 70.7 72.1 84.6 84.5
Florida 70.2 70.2 85.6 85.7 82.8 82.8 73.5 73.6 83.8 83.8
NATION 74.1% 74.2% 86.7% 86.8% 84.4% 84.4% 69.6% 69.6% 84.0% 84.0%
PERCENTAGE OF TYPE 2 DIABETES PATIENTS, BY A1c LEVEL RANGE, 20131
Brevard County Lakeland Orlando Florida Nation64%
69%
74%
79%
84%
Perc
en
tag
e o
f Pa
tien
ts
71.9%
80.4%
69.1%
82.4%
68.8%69.8%
71.5%
69.7%
67.2%
71.8%73.1%
68.3%
77.1% 76.7%
70.3%
Commercial Insurance2 Medicaid Medicare
≤7.0% 7.1–7.9% 8.0–9.0% >9.0%0%
15%
30%
45%
60%
Perc
en
tag
e o
f Pa
tien
ts
54.1%
47.5%
51.1%
52.4%
49.5%
20.3%
20.4%
20.8%
21.1%20.8%
11.9%
14.7%
13.4%12.9%
13.4% 13.8%17.4%
14.8%
13.7%
16.3%
Brevard County Lakeland Orlando Florida Nation
SHARE OF TYPE 2 DIABETES PATIENTS IN LAKELAND WITH A1c >9.0% TOPS U.S. MEAN
Of the three Central Florida
markets shown, Lakeland
recorded the highest share of
Type 2 diabetes patients with
A1c levels greater than 9.0%
on their latest exams (17.4%),
in 2013. By comparison, 13.7%
of such patients across Florida
and 16.3% nationally were in
this highest A1c level range.
Lakeland also recorded a
below-U.S.-average portion of
Type 2 diabetes patients with
A1c levels at or below 7.0%.
6 CENTRAL FLORIDA TYPE 2 DIABETES REPORT, 2014 MANAGED CARE DIGEST SERIES® www.flhcc.org
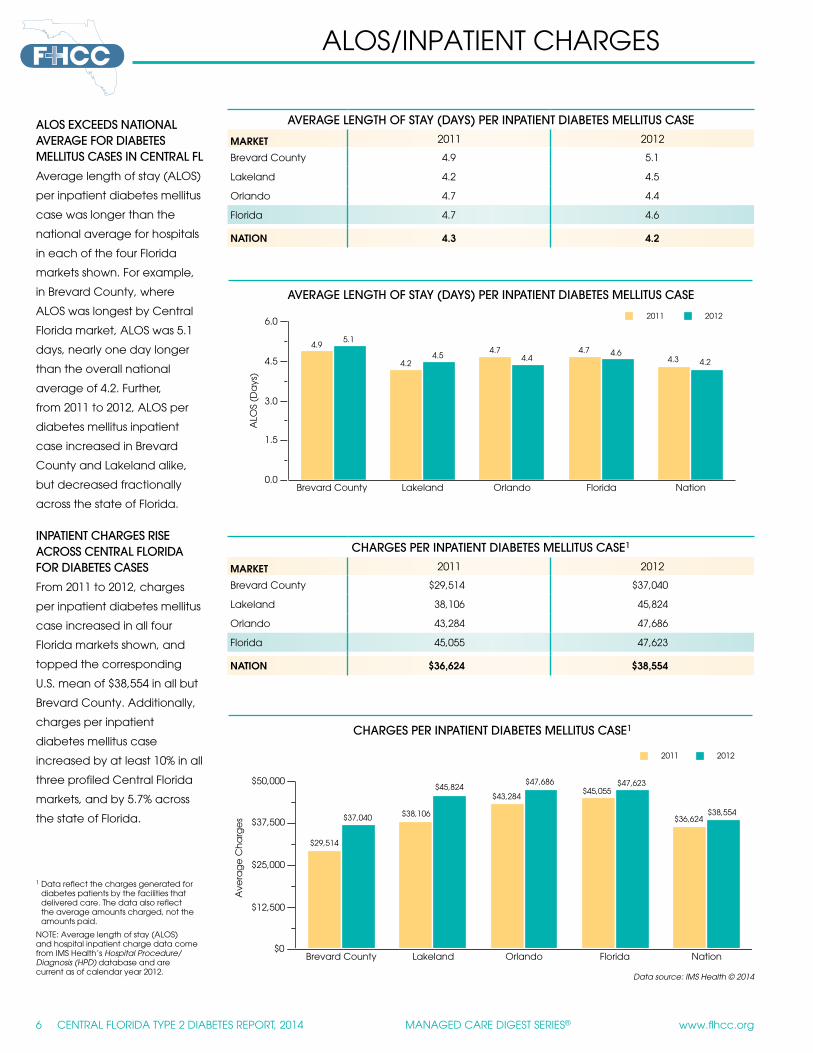
ALOS EXCEEDS NATIONAL AVERAGE FOR DIABETES MELLITUS CASES IN CENTRAL FL
Average length of stay (ALOS)
per inpatient diabetes mellitus
case was longer than the
national average for hospitals
in each of the four Florida
markets shown. For example,
in Brevard County, where
ALOS was longest by Central
Florida market, ALOS was 5.1
days, nearly one day longer
than the overall national
average of 4.2. Further,
from 2011 to 2012, ALOS per
diabetes mellitus inpatient
case increased in Brevard
County and Lakeland alike,
but decreased fractionally
across the state of Florida.
INPATIENT CHARGES RISE ACROSS CENTRAL FLORIDA FOR DIABETES CASES
From 2011 to 2012, charges
per inpatient diabetes mellitus
case increased in all four
Florida markets shown, and
topped the corresponding
U.S. mean of $38,554 in all but
Brevard County. Additionally,
charges per inpatient
diabetes mellitus case
increased by at least 10% in all
three profiled Central Florida
markets, and by 5.7% across
the state of Florida.
ALOS/INPATIENT CHARGES
Data source: IMS Health © 2014
CHARGES PER INPATIENT DIABETES MELLITUS CASE1
1 Data reflect the charges generated for diabetes patients by the facilities that delivered care. The data also reflect the average amounts charged, not the amounts paid.
NOTE: Average length of stay (ALOS) and hospital inpatient charge data come from IMS Health’s Hospital Procedure/Diagnosis (HPD) database and are current as of calendar year 2012.
AVERAGE LENGTH OF STAY (DAYS) PER INPATIENT DIABETES MELLITUS CASE
MARKET 2011 2012
Brevard County 4.9 5.1
Lakeland 4.2 4.5
Orlando 4.7 4.4
Florida 4.7 4.6
NATION 4.3 4.2
AVERAGE LENGTH OF STAY (DAYS) PER INPATIENT DIABETES MELLITUS CASE
Brevard County Lakeland Orlando Florida Nation0.0
1.5
3.0
4.5
6.0
ALO
S (D
ays
)
4.95.1
4.24.5
4.74.4
4.7 4.64.3 4.2
2011 2012
Brevard County Lakeland Orlando Florida Nation$0
$12,500
$25,000
$37,500
$50,000
Ave
rag
e C
ha
rge
s
$29,514
$37,040 $38,106
$45,824$43,284
$47,686$45,055
$47,623
$36,624$38,554
2011 2012
CHARGES PER INPATIENT DIABETES MELLITUS CASE1
MARKET 2011 2012
Brevard County $29,514 $37,040
Lakeland 38,106 45,824
Orlando 43,284 47,686
Florida 45,055 47,623
NATION $36,624 $38,554
WWW.FLHCC.ORG MANAGED CARE DIGEST SERIES® CENTRAL FLORIDA TYPE 2 DIABETES REPORT, 2014 7
PROFESSIONAL CHARGES
Data source: IMS Health © 2014
PROFESSIONAL EMERGENCY ROOM CHARGES PER YEAR FOR TYPE 2 DIABETES PATIENTS1
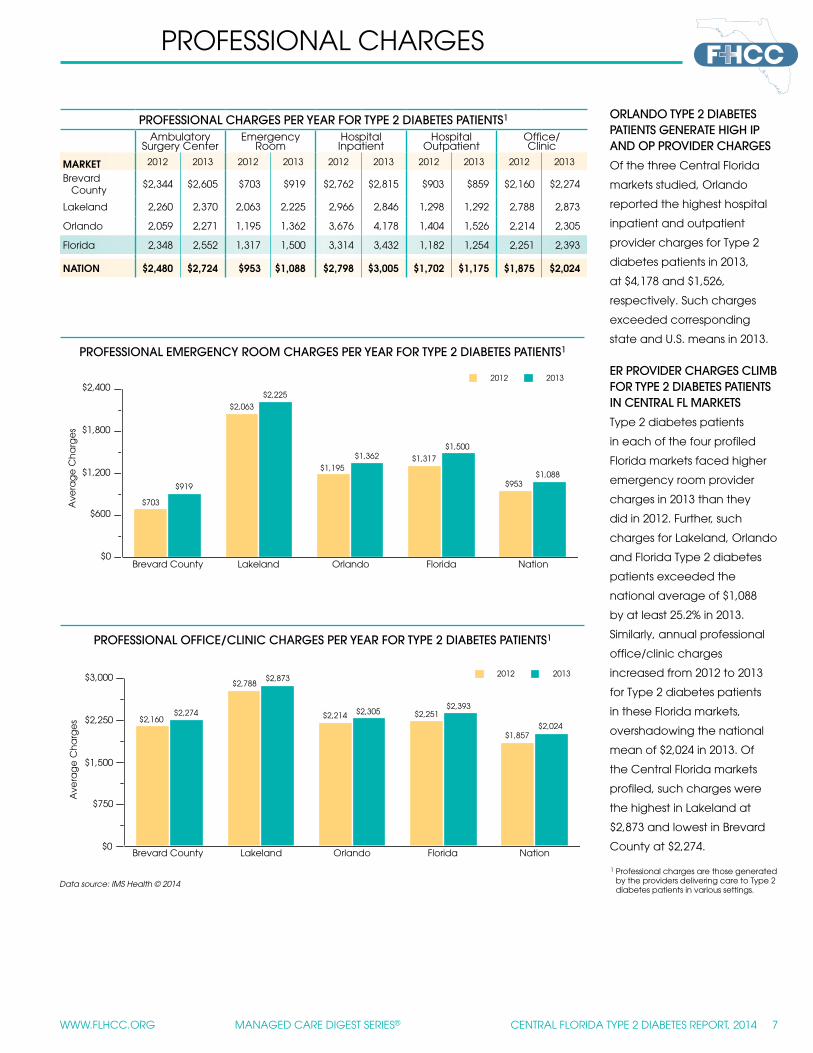
PROFESSIONAL CHARGES PER YEAR FOR TYPE 2 DIABETES PATIENTS1
Ambulatory Surgery Center
Emergency Room
Hospital Inpatient
Hospital Outpatient
Office/ Clinic
MARKET 2012 2013 2012 2013 2012 2013 2012 2013 2012 2013
Brevard County
$2,344 $2,605 $703 $919 $2,762 $2,815 $903 $859 $2,160 $2,274
Lakeland 2,260 2,370 2,063 2,225 2,966 2,846 1,298 1,292 2,788 2,873
Orlando 2,059 2,271 1,195 1,362 3,676 4,178 1,404 1,526 2,214 2,305
Florida 2,348 2,552 1,317 1,500 3,314 3,432 1,182 1,254 2,251 2,393
NATION $2,480 $2,724 $953 $1,088 $2,798 $3,005 $1,702 $1,175 $1,875 $2,024
1 Professional charges are those generated by the providers delivering care to Type 2 diabetes patients in various settings.
ORLANDO TYPE 2 DIABETES PATIENTS GENERATE HIGH IP AND OP PROVIDER CHARGES
Of the three Central Florida
markets studied, Orlando
reported the highest hospital
inpatient and outpatient
provider charges for Type 2
diabetes patients in 2013,
at $4,178 and $1,526,
respectively. Such charges
exceeded corresponding
state and U.S. means in 2013.
ER PROVIDER CHARGES CLIMB FOR TYPE 2 DIABETES PATIENTS IN CENTRAL FL MARKETS
Type 2 diabetes patients
in each of the four profiled
Florida markets faced higher
emergency room provider
charges in 2013 than they
did in 2012. Further, such
charges for Lakeland, Orlando
and Florida Type 2 diabetes
patients exceeded the
national average of $1,088
by at least 25.2% in 2013.
Similarly, annual professional
office/clinic charges
increased from 2012 to 2013
for Type 2 diabetes patients
in these Florida markets,
overshadowing the national
mean of $2,024 in 2013. Of
the Central Florida markets
profiled, such charges were
the highest in Lakeland at
$2,873 and lowest in Brevard
County at $2,274.
PROFESSIONAL OFFICE/CLINIC CHARGES PER YEAR FOR TYPE 2 DIABETES PATIENTS1
Brevard County Lakeland Orlando Florida Nation$0
$600
$1,200
$1,800
$2,400
Ave
rag
e C
ha
rge
s
$703
$919
$2,063
$2,225
$1,195
$1,362 $1,317
$1,500
$953$1,088
2012 2013
Brevard County Lakeland Orlando Florida Nation$0
$750
$1,500
$2,250
$3,000
Ave
rag
e C
ha
rge
s $2,160$2,274
$2,788$2,873
$2,214 $2,305 $2,251$2,393
$1,857$2,024
2012 2013
8 CENTRAL FLORIDA TYPE 2 DIABETES REPORT, 2014 MANAGED CARE DIGEST SERIES® www.flhcc.org
1 Professional charges are those generated by the providers delivering care to Type 2 diabetes patients in various settings.
2 Includes HMOs, PPOs, point-of- service plans and exclusive provider organizations.
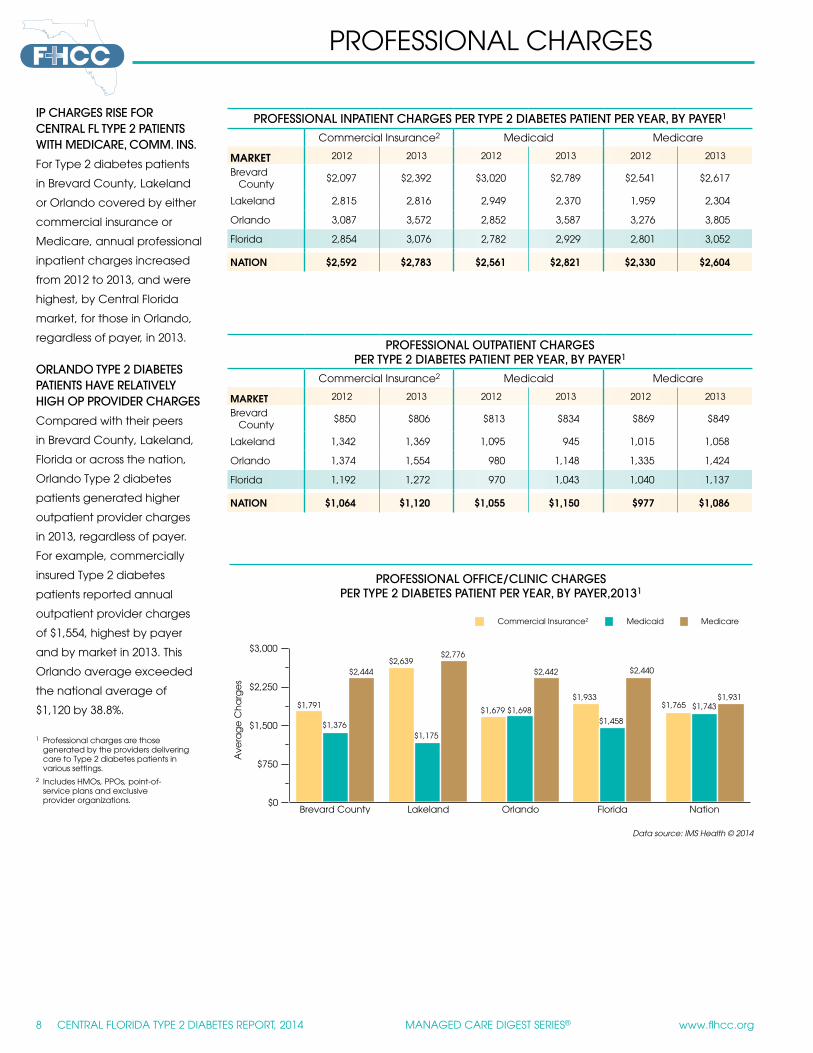
PROFESSIONAL OFFICE/CLINIC CHARGES PER TYPE 2 DIABETES PATIENT PER YEAR, BY PAYER,20131
IP CHARGES RISE FOR CENTRAL FL TYPE 2 PATIENTS WITH MEDICARE, COMM. INS.
For Type 2 diabetes patients
in Brevard County, Lakeland
or Orlando covered by either
commercial insurance or
Medicare, annual professional
inpatient charges increased
from 2012 to 2013, and were
highest, by Central Florida
market, for those in Orlando,
regardless of payer, in 2013.
ORLANDO TYPE 2 DIABETES PATIENTS HAVE RELATIVELY HIGH OP PROVIDER CHARGES
Compared with their peers
in Brevard County, Lakeland,
Florida or across the nation,
Orlando Type 2 diabetes
patients generated higher
outpatient provider charges
in 2013, regardless of payer.
For example, commercially
insured Type 2 diabetes
patients reported annual
outpatient provider charges
of $1,554, highest by payer
and by market in 2013. This
Orlando average exceeded
the national average of
$1,120 by 38.8%.
PROFESSIONAL CHARGES
Data source: IMS Health © 2014
PROFESSIONAL OUTPATIENT CHARGES PER TYPE 2 DIABETES PATIENT PER YEAR, BY PAYER1
Commercial Insurance2 Medicaid Medicare
MARKET 2012 2013 2012 2013 2012 2013
Brevard County
$850 $806 $813 $834 $869 $849
Lakeland 1,342 1,369 1,095 945 1,015 1,058
Orlando 1,374 1,554 980 1,148 1,335 1,424
Florida 1,192 1,272 970 1,043 1,040 1,137
NATION $1,064 $1,120 $1,055 $1,150 $977 $1,086
PROFESSIONAL INPATIENT CHARGES PER TYPE 2 DIABETES PATIENT PER YEAR, BY PAYER1
Commercial Insurance2 Medicaid Medicare
MARKET 2012 2013 2012 2013 2012 2013
Brevard County
$2,097 $2,392 $3,020 $2,789 $2,541 $2,617
Lakeland 2,815 2,816 2,949 2,370 1,959 2,304
Orlando 3,087 3,572 2,852 3,587 3,276 3,805
Florida 2,854 3,076 2,782 2,929 2,801 3,052
NATION $2,592 $2,783 $2,561 $2,821 $2,330 $2,604
Brevard County Lakeland Orlando Florida Nation$0
$750
$1,500
$2,250
$3,000
Ave
rag
e C
ha
rge
s
$1,791
$1,376
$2,444$2,639
$1,175
$2,776
$1,679 $1,698
$2,442
$1,933
$1,458
$2,440
$1,765 $1,743$1,931
Commercial Insurance2 Medicaid Medicare
WWW.FLHCC.ORG MANAGED CARE DIGEST SERIES® CENTRAL FLORIDA TYPE 2 DIABETES REPORT, 2014 9
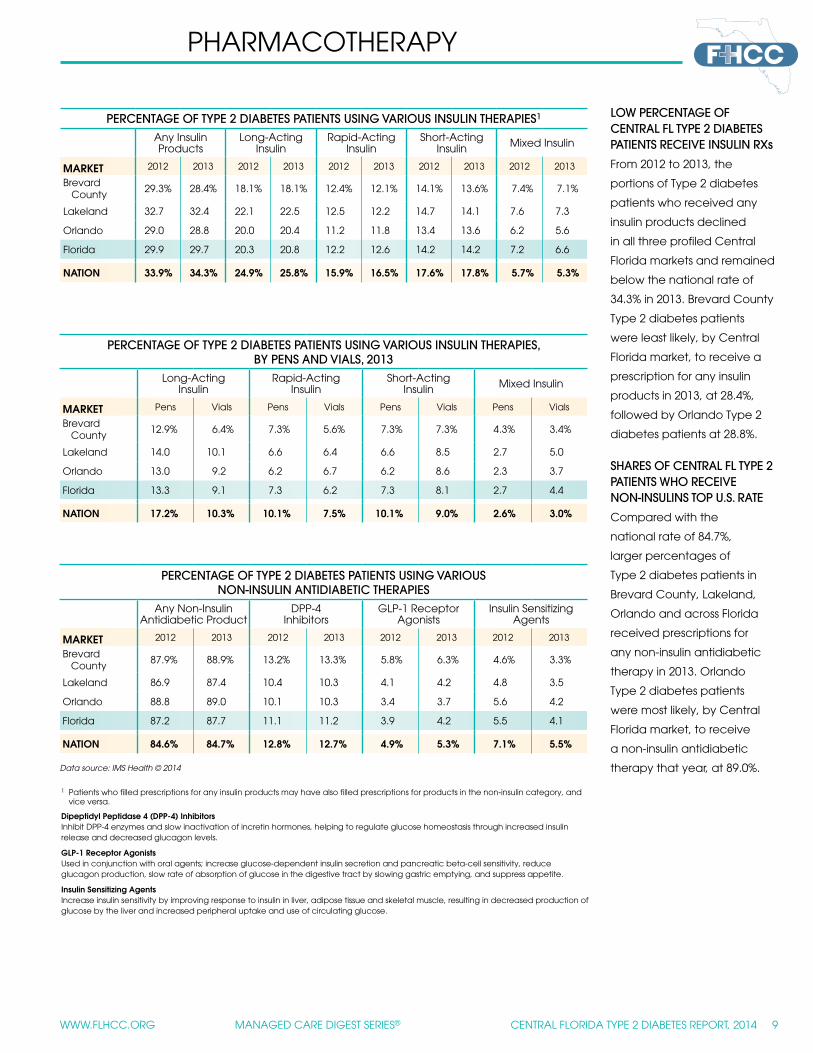
LOW PERCENTAGE OF CENTRAL FL TYPE 2 DIABETES PATIENTS RECEIVE INSULIN RXs
From 2012 to 2013, the
portions of Type 2 diabetes
patients who received any
insulin products declined
in all three profiled Central
Florida markets and remained
below the national rate of
34.3% in 2013. Brevard County
Type 2 diabetes patients
were least likely, by Central
Florida market, to receive a
prescription for any insulin
products in 2013, at 28.4%,
followed by Orlando Type 2
diabetes patients at 28.8%.
SHARES OF CENTRAL FL TYPE 2 PATIENTS WHO RECEIVE NON-INSULINS TOP U.S. RATE
Compared with the
national rate of 84.7%,
larger percentages of
Type 2 diabetes patients in
Brevard County, Lakeland,
Orlando and across Florida
received prescriptions for
any non-insulin antidiabetic
therapy in 2013. Orlando
Type 2 diabetes patients
were most likely, by Central
Florida market, to receive
a non-insulin antidiabetic
therapy that year, at 89.0%.Data source: IMS Health © 2014
PERCENTAGE OF TYPE 2 DIABETES PATIENTS USING VARIOUS INSULIN THERAPIES1
Any Insulin Products
Long-Acting Insulin
Rapid-Acting Insulin
Short-Acting Insulin Mixed Insulin
MARKET 2012 2013 2012 2013 2012 2013 2012 2013 2012 2013
Brevard County
29.3% 28.4% 18.1% 18.1% 12.4% 12.1% 14.1% 13.6% 7.4% 7.1%
Lakeland 32.7 32.4 22.1 22.5 12.5 12.2 14.7 14.1 7.6 7.3
Orlando 29.0 28.8 20.0 20.4 11.2 11.8 13.4 13.6 6.2 5.6
Florida 29.9 29.7 20.3 20.8 12.2 12.6 14.2 14.2 7.2 6.6
NATION 33.9% 34.3% 24.9% 25.8% 15.9% 16.5% 17.6% 17.8% 5.7% 5.3%
PERCENTAGE OF TYPE 2 DIABETES PATIENTS USING VARIOUS NON-INSULIN ANTIDIABETIC THERAPIES
Any Non-Insulin Antidiabetic Product
DPP-4 Inhibitors
GLP-1 Receptor Agonists
Insulin Sensitizing Agents
MARKET 2012 2013 2012 2013 2012 2013 2012 2013
Brevard County
87.9% 88.9% 13.2% 13.3% 5.8% 6.3% 4.6% 3.3%
Lakeland 86.9 87.4 10.4 10.3 4.1 4.2 4.8 3.5
Orlando 88.8 89.0 10.1 10.3 3.4 3.7 5.6 4.2
Florida 87.2 87.7 11.1 11.2 3.9 4.2 5.5 4.1
NATION 84.6% 84.7% 12.8% 12.7% 4.9% 5.3% 7.1% 5.5%
PERCENTAGE OF TYPE 2 DIABETES PATIENTS USING VARIOUS INSULIN THERAPIES, BY PENS AND VIALS, 2013
Long-Acting Insulin
Rapid-Acting Insulin
Short-Acting Insulin Mixed Insulin
MARKET Pens Vials Pens Vials Pens Vials Pens Vials
Brevard County
12.9% 6.4% 7.3% 5.6% 7.3% 7.3% 4.3% 3.4%
Lakeland 14.0 10.1 6.6 6.4 6.6 8.5 2.7 5.0
Orlando 13.0 9.2 6.2 6.7 6.2 8.6 2.3 3.7
Florida 13.3 9.1 7.3 6.2 7.3 8.1 2.7 4.4
NATION 17.2% 10.3% 10.1% 7.5% 10.1% 9.0% 2.6% 3.0%
PHARMACOTHERAPY
1 Patients who filled prescriptions for any insulin products may have also filled prescriptions for products in the non-insulin category, and vice versa.
Dipeptidyl Peptidase 4 (DPP-4) Inhibitors Inhibit DPP-4 enzymes and slow inactivation of incretin hormones, helping to regulate glucose homeostasis through increased insulin release and decreased glucagon levels.
GLP-1 Receptor Agonists Used in conjunction with oral agents; increase glucose-dependent insulin secretion and pancreatic beta-cell sensitivity, reduce glucagon production, slow rate of absorption of glucose in the digestive tract by slowing gastric emptying, and suppress appetite.
Insulin Sensitizing Agents Increase insulin sensitivity by improving response to insulin in liver, adipose tissue and skeletal muscle, resulting in decreased production of glucose by the liver and increased peripheral uptake and use of circulating glucose.
10 CENTRAL FLORIDA TYPE 2 DIABETES REPORT, 2014 MANAGED CARE DIGEST SERIES® www.flhcc.org
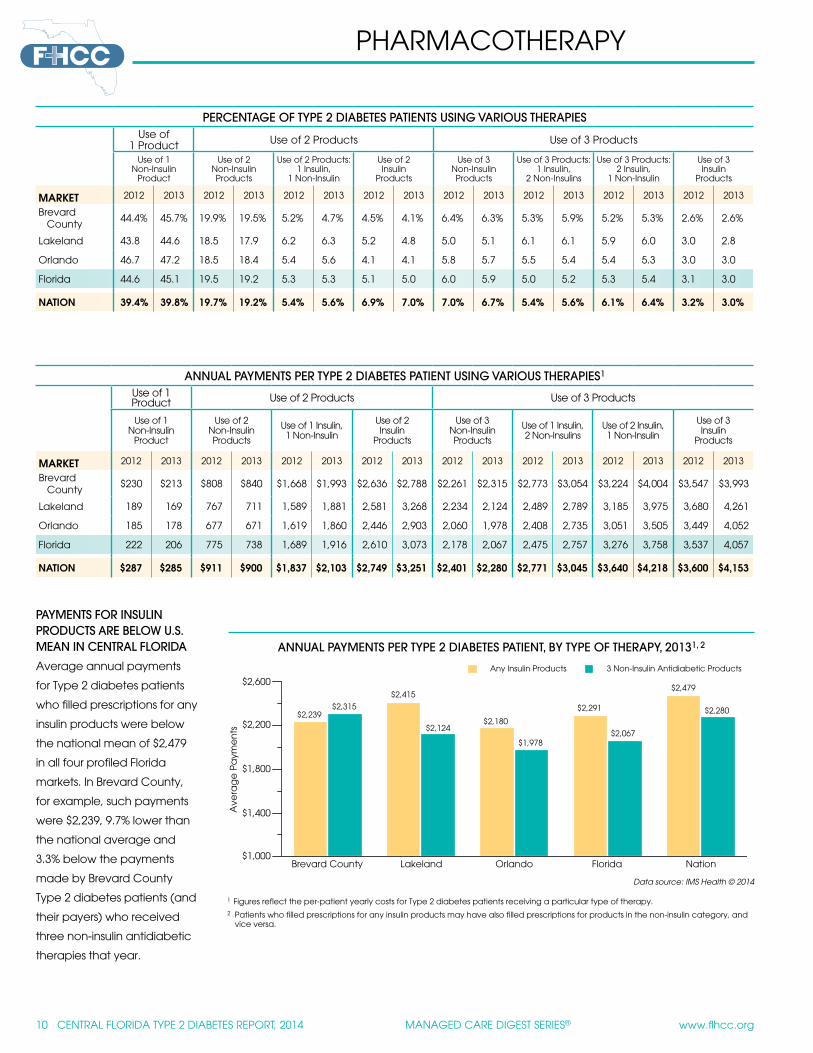
PAYMENTS FOR INSULIN PRODUCTS ARE BELOW U.S. MEAN IN CENTRAL FLORIDA
Average annual payments
for Type 2 diabetes patients
who filled prescriptions for any
insulin products were below
the national mean of $2,479
in all four profiled Florida
markets. In Brevard County,
for example, such payments
were $2,239, 9.7% lower than
the national average and
3.3% below the payments
made by Brevard County
Type 2 diabetes patients (and
their payers) who received
three non-insulin antidiabetic
therapies that year.
1 Figures reflect the per-patient yearly costs for Type 2 diabetes patients receiving a particular type of therapy.2 Patients who filled prescriptions for any insulin products may have also filled prescriptions for products in the non-insulin category, and
vice versa.
PERCENTAGE OF TYPE 2 DIABETES PATIENTS USING VARIOUS THERAPIESUse of
1 Product Use of 2 Products Use of 3 Products
Use of 1 Non-Insulin
Product
Use of 2 Non-Insulin Products
Use of 2 Products: 1 Insulin,
1 Non-Insulin
Use of 2 Insulin
Products
Use of 3 Non-Insulin Products
Use of 3 Products: 1 Insulin,
2 Non-Insulins
Use of 3 Products: 2 Insulin,
1 Non-Insulin
Use of 3 Insulin
Products
MARKET 2012 2013 2012 2013 2012 2013 2012 2013 2012 2013 2012 2013 2012 2013 2012 2013
Brevard County
44.4% 45.7% 19.9% 19.5% 5.2% 4.7% 4.5% 4.1% 6.4% 6.3% 5.3% 5.9% 5.2% 5.3% 2.6% 2.6%
Lakeland 43.8 44.6 18.5 17.9 6.2 6.3 5.2 4.8 5.0 5.1 6.1 6.1 5.9 6.0 3.0 2.8
Orlando 46.7 47.2 18.5 18.4 5.4 5.6 4.1 4.1 5.8 5.7 5.5 5.4 5.4 5.3 3.0 3.0
Florida 44.6 45.1 19.5 19.2 5.3 5.3 5.1 5.0 6.0 5.9 5.0 5.2 5.3 5.4 3.1 3.0
NATION 39.4% 39.8% 19.7% 19.2% 5.4% 5.6% 6.9% 7.0% 7.0% 6.7% 5.4% 5.6% 6.1% 6.4% 3.2% 3.0%
ANNUAL PAYMENTS PER TYPE 2 DIABETES PATIENT USING VARIOUS THERAPIES1
Use of 1 Product Use of 2 Products Use of 3 Products
Use of 1 Non-Insulin
Product
Use of 2 Non-Insulin Products
Use of 1 Insulin, 1 Non-Insulin
Use of 2 Insulin
Products
Use of 3 Non-Insulin Products
Use of 1 Insulin, 2 Non-Insulins
Use of 2 Insulin, 1 Non-Insulin
Use of 3 Insulin
Products
MARKET 2012 2013 2012 2013 2012 2013 2012 2013 2012 2013 2012 2013 2012 2013 2012 2013
Brevard County
$230 $213 $808 $840 $1,668 $1,993 $2,636 $2,788 $2,261 $2,315 $2,773 $3,054 $3,224 $4,004 $3,547 $3,993
Lakeland 189 169 767 711 1,589 1,881 2,581 3,268 2,234 2,124 2,489 2,789 3,185 3,975 3,680 4,261
Orlando 185 178 677 671 1,619 1,860 2,446 2,903 2,060 1,978 2,408 2,735 3,051 3,505 3,449 4,052
Florida 222 206 775 738 1,689 1,916 2,610 3,073 2,178 2,067 2,475 2,757 3,276 3,758 3,537 4,057
NATION $287 $285 $911 $900 $1,837 $2,103 $2,749 $3,251 $2,401 $2,280 $2,771 $3,045 $3,640 $4,218 $3,600 $4,153
Data source: IMS Health © 2014
ANNUAL PAYMENTS PER TYPE 2 DIABETES PATIENT, BY TYPE OF THERAPY, 20131, 2
PHARMACOTHERAPY
$1,000
$1,400
$1,800
$2,200
$2,600
Ave
rag
e P
aym
en
ts
Brevard County Lakeland Orlando Florida Nation
$2,239$2,315
$2,415
$2,124$2,180
$1,978
$2,291
$2,067
$2,479
$2,280
Any Insulin Products 3 Non-Insulin Antidiabetic Products
WWW.FLHCC.ORG MANAGED CARE DIGEST SERIES® CENTRAL FLORIDA TYPE 2 DIABETES REPORT, 2014 11
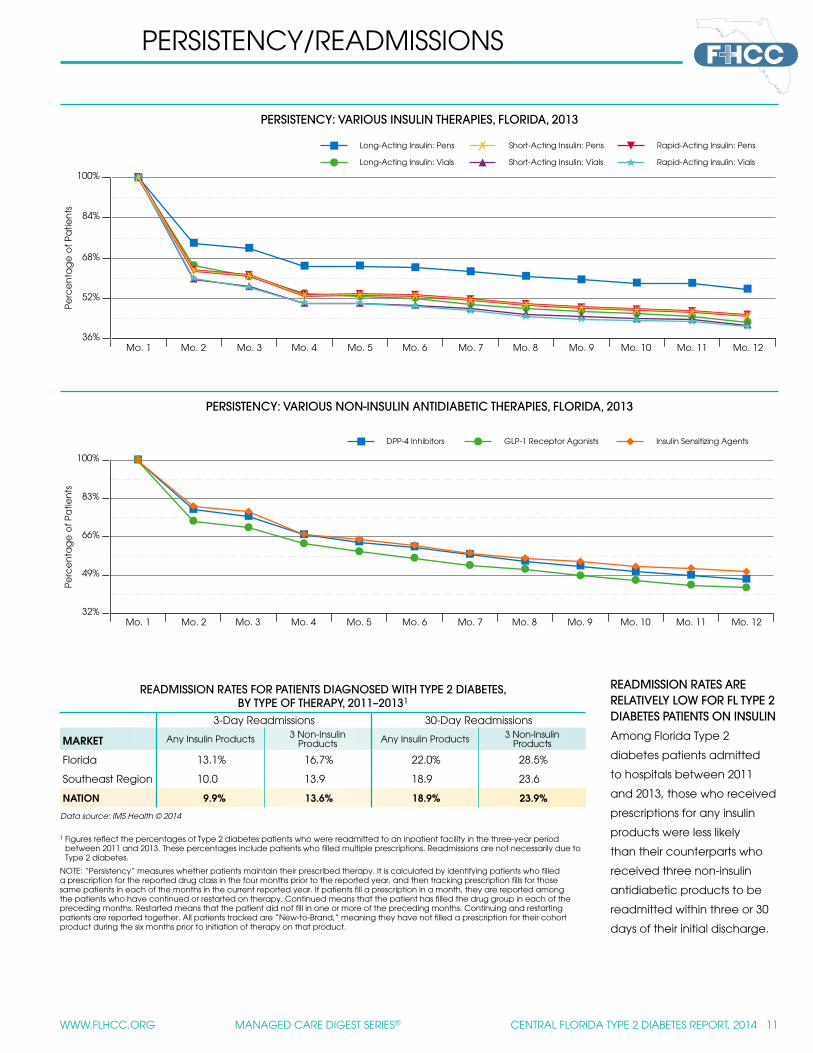
READMISSION RATES FOR PATIENTS DIAGNOSED WITH TYPE 2 DIABETES, BY TYPE OF THERAPY, 2011–20131
3-Day Readmissions 30-Day Readmissions
MARKET Any Insulin Products 3 Non-Insulin Products Any Insulin Products 3 Non-Insulin
Products
Florida 13.1% 16.7% 22.0% 28.5%
Southeast Region 10.0 13.9 18.9 23.6
NATION 9.9% 13.6% 18.9% 23.9%
PERSISTENCY/READMISSIONS
READMISSION RATES ARE RELATIVELY LOW FOR FL TYPE 2 DIABETES PATIENTS ON INSULIN
Among Florida Type 2
diabetes patients admitted
to hospitals between 2011
and 2013, those who received
prescriptions for any insulin
products were less likely
than their counterparts who
received three non-insulin
antidiabetic products to be
readmitted within three or 30
days of their initial discharge.
Data source: IMS Health © 2014
1 Figures reflect the percentages of Type 2 diabetes patients who were readmitted to an inpatient facility in the three-year period between 2011 and 2013. These percentages include patients who filled multiple prescriptions. Readmissions are not necessarily due to Type 2 diabetes.
NOTE: “Persistency” measures whether patients maintain their prescribed therapy. It is calculated by identifying patients who filled a prescription for the reported drug class in the four months prior to the reported year, and then tracking prescription fills for those same patients in each of the months in the current reported year. If patients fill a prescription in a month, they are reported among the patients who have continued or restarted on therapy. Continued means that the patient has filled the drug group in each of the preceding months. Restarted means that the patient did not fill in one or more of the preceding months. Continuing and restarting patients are reported together. All patients tracked are “New-to-Brand,” meaning they have not filled a prescription for their cohort product during the six months prior to initiation of therapy on that product.
PERSISTENCY: VARIOUS INSULIN THERAPIES, FLORIDA, 2013
PERSISTENCY: VARIOUS NON-INSULIN ANTIDIABETIC THERAPIES, FLORIDA, 2013
Mo. 1 Mo. 2 Mo. 3 Mo. 4 Mo. 5 Mo. 6 Mo. 7 Mo. 8 Mo. 9 Mo. 10 Mo. 11 Mo. 1232%
49%
66%
83%
100%
Perc
en
tag
e o
f Pa
tien
ts
DPP-4 Inhibitors GLP-1 Receptor Agonists Insulin Sensitizing Agents
Mo. 1 Mo. 2 Mo. 3 Mo. 4 Mo. 5 Mo. 6 Mo. 7 Mo. 8 Mo. 9 Mo. 10 Mo. 11 Mo. 1236%
52%
68%
84%
100%
Perc
en
tag
e o
f Pa
tien
ts
Long-Acting Insulin: Pens
Long-Acting Insulin: Vials
Short-Acting Insulin: Pens
Short-Acting Insulin: Vials
Rapid-Acting Insulin: Pens
Rapid-Acting Insulin: Vials
12 CENTRAL FLORIDA TYPE 2 DIABETES REPORT, 2014 MANAGED CARE DIGEST SERIES® www.flhcc.org
Sanofi U.S. LLC, as sponsor of this report, maintains an arm’s-length relationship with the organizations that prepare the report and carry out the research for its contents. The desire of Sanofi U.S. is that the information in this report be completely independent and objective.
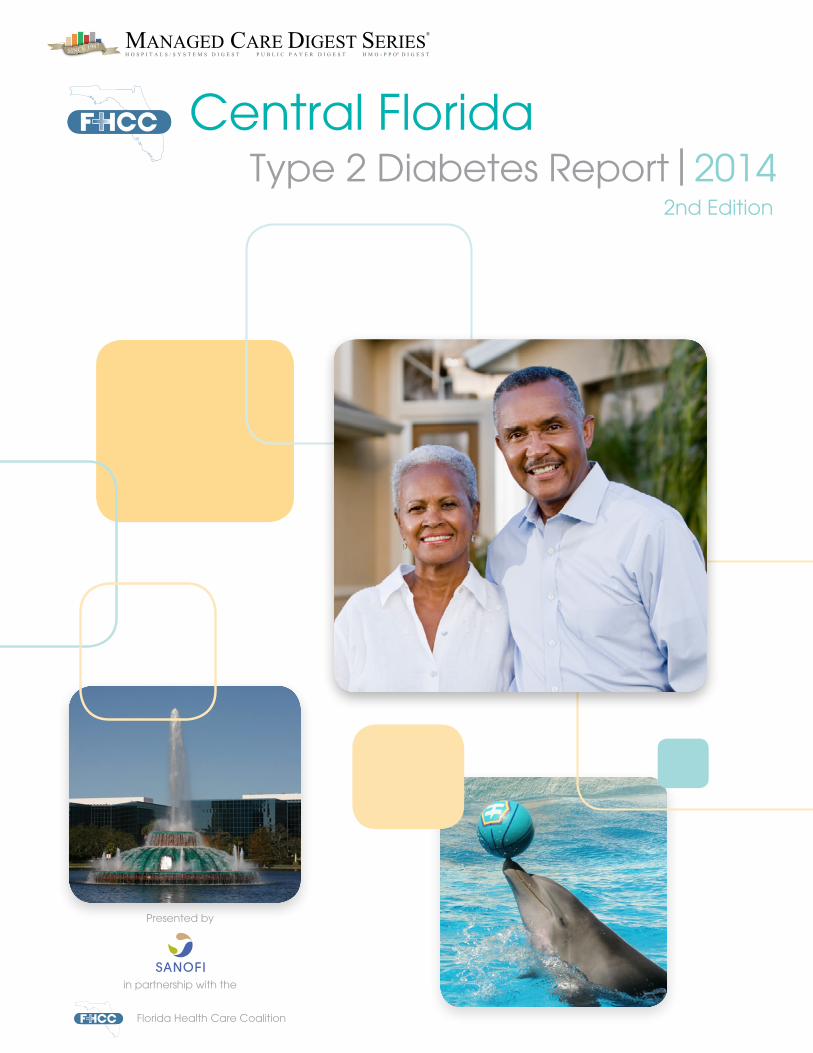
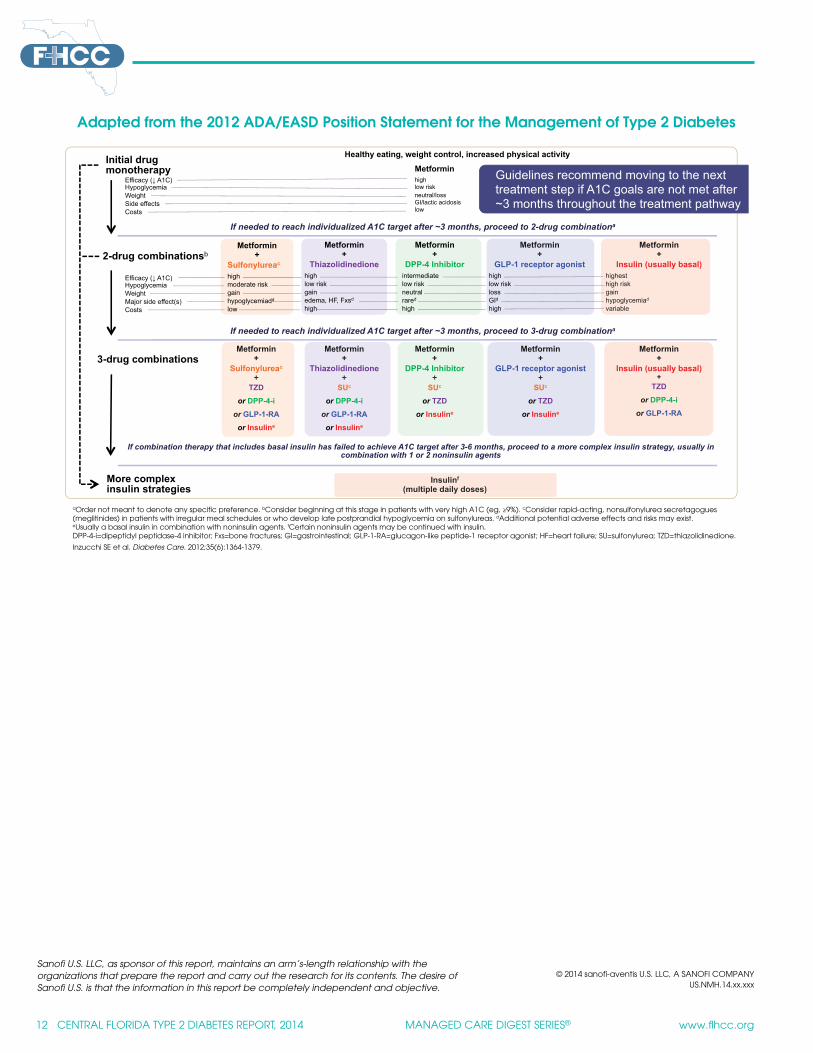
Adapted from the 2012 ADA/EASD Position Statement for the Management of Type 2 Diabetes
Metformin +
Thiazolidinedione
high low risk gain edema, HF, Fxsd
high
Metformin +
DPP-4 Inhibitor intermediate low risk neutral rared
high
Metformin +
Insulin (usually basal)
highest high risk gain hypoglycemiad
variable
Metformin +
GLP-1 receptor agonist
high low risk loss GId
high
2-drug combinationsb
If needed to reach individualized A1C target after ~3 months, proceed to 3-drug combinationa
Efficacy ( A1C) Hypoglycemia Weight Major side effect(s) Costs
Metformin +
Sulfonylureac high moderate risk gain hypoglycemiadd
low
Healthy eating, weight control, increased physical activity
Metformin high low risk neutral/loss GI/lactic acidosis low
If needed to reach individualized A1C target after ~3 months, proceed to 2-drug combinationa
Initial drug monotherapy
Efficacy ( A1C) Hypoglycemia Weight Side effects Costs
3-drug combinations Metformin
+ GLP-1 receptor agonist
+ SUc
or TZD
or Insuline
Metformin +
Insulin (usually basal)
+ TZD
or DPP-4-i
or GLP-1-RA
Metformin +
DPP-4 Inhibitor +
SUc
or TZD
or Insuline
Metformin +
Thiazolidinedione +
SUc
or DPP-4-i
or GLP-1-RA
or Insuline
Metformin +
Sulfonylureac +
TZD
or DPP-4-i
or GLP-1-RA
or Insuline
More complex insulin strategies
Insulinf
(multiple daily doses)
If combination therapy that includes basal insulin has failed to achieve A1C target after 3-6 months, proceed to a more complex insulin strategy, usually in combination with 1 or 2 noninsulin agents
Guidelines recommend moving to the next treatment step if A1C goals are not met after ~3 months throughout the treatment pathway
aOrder not meant to denote any specific preference. bConsider beginning at this stage in patients with very high A1C (eg, ≥9%). cConsider rapid-acting, nonsulfonylurea secretagogues(meglitinides) in patients with irregular meal schedules or who develop late postprandial hypoglycemia on sulfonylureas. dAdditional potential adverse effects and risks may exist.eUsually a basal insulin in combination with noninsulin agents. fCertain noninsulin agents may be continued with insulin.DPP-4-i=dipeptidyl peptidase-4 inhibitor; Fxs=bone fractures; GI=gastrointestinal; GLP-1-RA=glucagon-like peptide-1 receptor agonist; HF=heart failure; SU=sulfonylurea; TZD=thiazolidinedione.
Inzucchi SE et al. Diabetes Care. 2012;35(6):1364-1379.
© 2014 sanofi-aventis U.S. LLC, A SANOFI COMPANYUS.NMH.14.xx.xxx
Related Documents