1 MAES Workshop "Assessing and Mapping Ecosystem Condition" 27 – 28 June 2017 Background Paper to support breakout group discussions (version of 11 July 2017) Prepared by: The European Commission, European Environment Agency, Joint Research Centre, European Topic Centre for Biodiversity and European Topic Centre Urban Land Use Systems

Welcome message from author
This document is posted to help you gain knowledge. Please leave a comment to let me know what you think about it! Share it to your friends and learn new things together.
Transcript
1
MAES Workshop
"Assessing and Mapping Ecosystem Condition"
27 – 28 June 2017
Background Paper to support breakout group discussions (version of 11 July 2017)
Prepared by: The European Commission, European Environment Agency, Joint Research Centre, European Topic Centre for Biodiversity and European Topic Centre Urban Land Use Systems
2
Contents Background .......................................................................................................................................5
Ecosystem Condition ................................................................................................................................. 5 Definition, reference and concept for each ecosystem type.................................................................... 6 Ecosystem types ........................................................................................................................................ 7 This workshop ........................................................................................................................................... 8 Next steps ................................................................................................................................................. 8
Nature ...............................................................................................................................................9
Introduction .............................................................................................................................................. 9 1 DEFINITION, REFERENCE AND CONCEPT FOR EACH ECOSYSTEM TYPE ................................................. 9
1.1 Pressures ....................................................................................................................................... 10 1.2 Condition ....................................................................................................................................... 11 1.3 Impact on biodiversity and ecosystem service capacity ............................................................... 12
2 INDICATOR FRAMEWORK FOR MEASURING THE CONDITIONS OF ECOSYSTEMS ............................... 12 HEATHLAND & SHRUB ......................................................................................................................... 13 SPARSELY VEGETATED LAND ............................................................................................................... 15 WETLANDS (Mires, Bogs & Fens) ........................................................................................................ 16 Grasslands ........................................................................................................................................... 18 Forests ................................................................................................................................................. 19 Freshwater .......................................................................................................................................... 20 Urban .................................................................................................................................................. 21
3 LINK CONDITION TO ECOSYSTEM SERVICES ........................................................................................ 22 4 LINK TO THE DATA COLLECTION .......................................................................................................... 24 References .............................................................................................................................................. 26 ANNEX - INFORMATION PER ECOSYSTEM INCLUDING DESCRIPTION OF HABITATS, ASSESSMENT AND MAIN PRESSURES .................................................................................................................................... 27 HEATHLAND & SHRUB............................................................................................................................. 28 SPARSELY VEGETATED LAND ................................................................................................................... 32 WETLANDS (Mires, Bogs and Fens) ......................................................................................................... 35 GRASSLAND ............................................................................................................................................. 40 FOREST .................................................................................................................................................... 44
Freshwater ecosystems .................................................................................................................... 48
1. Introduction ........................................................................................................................................ 48 1.1 Objectives ...................................................................................................................................... 48 1.2 EU Biodiversity Strategy and EU water policy ............................................................................... 48 1.3 Water ecosystems under consideration ....................................................................................... 49
2. Definition ecosystem conditions (freshwater ecosystems) ................................................................ 50 3. Assessment framework/Analytical framework ................................................................................... 51 4. Indicators (pressure, state, biodiversity) ............................................................................................ 52
4.1 Pressure indicators ........................................................................................................................ 53 4.2 State indicators ............................................................................................................................. 53 4.3 Biodiversity indicators ................................................................................................................... 53
5. Link between ecosystem condition and ecosystem services .............................................................. 55 6. List the European datasets available to quantify the indicators at EU level ...................................... 56 References .............................................................................................................................................. 56
3
Annex 1 – Quality elements for the classification of ecological status of SURFACE WATER in the Water Framework Directive (Annex V) .............................................................................................................. 58 Annex 2 – Indicators of pressures, state and biodiversity proposed in the Nature ecosystem type for freshwater ecosystems ........................................................................................................................... 60 Annex 3 – Proposal of indicators for assessing pressures, conditions and biodiversity in transitional and coastal water .................................................................................................................................... 61 Annex 4 – List of invasive alien species for freshwater ecosystems (Commission Implementing Regulation EU 2016/1141) ...................................................................................................................... 62
Marine waters ................................................................................................................................. 63
1. Introduction ........................................................................................................................................ 63 1.1 Objectives ...................................................................................................................................... 63 1.2 EU Biodiversity Strategy and EU Marine Strategy Framework Directive ...................................... 63 1.3 Marine ecosystems under consideration ...................................................................................... 64
2. Definition ecosystem conditions (marine ecosystems) ...................................................................... 65 3. Indicators (pressure, state, biodiversity) ............................................................................................ 66
3.1 Pressure indicators ........................................................................................................................ 67 3.2 State indicators ............................................................................................................................. 67 3.3 Biodiversity indicators ................................................................................................................... 67
4. Link between ecosystem condition and ecosystem services .............................................................. 72 5. Provisional list of European datasets available to quantify the indicators at EU level ....................... 74 References .............................................................................................................................................. 74 ANNEX ..................................................................................................................................................... 75
Forests............................................................................................................................................. 78 Introduction ............................................................................................................................................ 78 Defining forest ecosystem condition ...................................................................................................... 79 Assessment framework ........................................................................................................................... 81
Conceptual framework ....................................................................................................................... 81 Analytical framework .......................................................................................................................... 82
Forest condition indicators ..................................................................................................................... 84 Expected impact of pressures on forest ecosystems and services ......................................................... 92
Glossary ....................................................................................................................................................... 96 List of acronyms and abbreviations ............................................................................................................ 97 Annex .......................................................................................................................................................... 98 References ................................................................................................................................................ 100 Agroecosystems ............................................................................................................................. 103
MAES Agroecosystem Pilot on Condition ............................................................................................. 103 Condition of agroecosystems................................................................................................................ 103 Assessment framework ......................................................................................................................... 106 Indicator framework ............................................................................................................................. 109 Links between condition and ecosystem services ................................................................................ 111 Link between indicators and spatial data collection............................................................................. 111
Urban ............................................................................................................................................ 113
1. Introduction ...................................................................................................................................... 113 2. Terminology and definitions ............................................................................................................. 113

4
2.1. Definitions and glossary ............................................................................................................. 113 2.2. Urban ecosystem condition: definition and reference .............................................................. 114
3. Indicators for measuring ecosystem condition ................................................................................. 116 4. Link with ecosystem services [to be completed] .............................................................................. 119 5. Link to the data collections [to be completed] ................................................................................. 119
Proposal for mapping and assessment of soil condition .................................................................. 121
1. Introduction ...................................................................................................................................... 121 2. What do soils tell us about ecosystem condition? ........................................................................... 121
5
Background In March 2010, following on from the 2006 Biodiversity Action Plan, the Heads of State and Government of the EU adopted the new headline target to ‘halt biodiversity and ecosystem service loss by 2020, to restore ecosystems in so far as is feasible, and to step up the EU contribution to averting global biodiversity loss’. This target now explicitly recognises the importance of the services provided by biodiversity in addition to the need to protect biodiversity for its intrinsic value. To support the achievement of the EU headline target (and CBD targets agreed in Nagoya in October 2010), the Commission developed, in cooperation with Member States, an EU Biodiversity Strategy to 20201, including 6 targets and 20 feasible and cost-effective measures and actions needed to achieve them. Specifically, Target 2 states: By 2020, ecosystems and their services are maintained and enhanced by establishing green infrastructure and restoring at least 15% of degraded ecosystems. A number of actions have been articulated to support the achievement of Target 2. In particular Action 5 focuses on improving the knowledge base of ecosystems and their services in the EU. Specifically: Member States, with the assistance of the Commission, will map and assess the state of ecosystems and their services in their national territory by 2014, assess the economic value of such services, and promote the integration of these values into accounting and reporting systems at EU and national level by 2020.
In response to the call from the Commission to assist member states in the implementation of Action 5, the Mapping and Assessment of Ecosystem Services (MAES) initiative was launched and a dedicated working group established in 2013. This implies the adoption of an analytical framework for mapping and assessing ecosystems and their services in Europe2, which proposes a pragmatic approach to categorise broad ecosystem types based on the European nature information system (EUNIS)3 for species and habitats classification (cf. nature directives)and Corine Land Cover classes for mapping these habitats (cf. MAES typology4). This is a simplification while it is evident that a clear limit between ecosystem types cannot be defined on the ground and different criteria (vegetation, abiotic characteristics, physiognomy and structure, etc.) can lead to different classifications. This pragmatic approach can help produce statistics and indicators to be comparable for policy needs. Since MAES needs to make the best use of existing datasets and assessments, it is clear that priority data sets are the ones reported by Member States under their legal obligations (e.g. Nature Directives, Water Framework Directive, Marine Strategy Framework Directive) and that the development of cross-walks is essential (e.g. nature and marine crosswalk). At this stage where the focus is on the EU level it makes sense to use the MAES typology, keeping in mind that some more detailed/different classifications at lower levels will need to be considered in a short term based on the expertise provided by Member States.
Ecosystem Condition Establishing a common definition of ecosystem condition and suitable indicators per type of ecosystem is necessary, for instance to measure the restoration of degraded ecosystems from the adoption of the Biodiversity Strategy (in 2011) to 2020 (i.e. measure the progress towards the achievement of Target 2). At the same time, it is essential to understand the relationship between the ecosystem condition and the delivery of services, in order to assess whether ecosystems services are maintained and enhanced.
1 Communication on our life insurance, our natural capital: an EU biodiversity strategy to 2020, COM(2011) 244
final. Hereafter referred to as the “Biodiversity Strategy”. 2 http://ec.europa.eu/environment/nature/knowledge/ecosystem_assessment/pdf/MAESWorkingPaper2013.pdf
3 http://eunis.eea.europa.eu/
4 http://ec.europa.eu/environment/nature/knowledge/ecosystem_assessment/pdf/MAESWorkingPaper2013.pdf
6
For the purpose of MAES work, ecosystem condition is usually used as a synonym for ‘ecosystem state’ (MAES, 20145). It embraces legal concepts (e.g. conservation status under the Birds and Habitats Directives, ecological status under the Water Framework Directive and environmental status under the Marine Strategy Framework Directive) as well as other proxy descriptors related to state, pressures and biodiversity. It is an important concept which would be used to assess trends and set targets related to the improvement of environment health.
This concept is closely related to the capacity of ecosystems to deliver ecosystem services. There is increasing scientific literature (cf. scientific literature peer-reviewed by the Intergovernmental science-policy Platform on Biodiversity and Ecosystem Services – IPBES) demonstrating the close relationship between biodiversity, good ecosystem state and long-term delivery of multiple ecosystem services (especially regulating and cultural) since provisioning services, if overused, can act as a pressure on ecosystems.
It is therefore a very important ‘operational’ concept to be used to assess ecosystem resilience and sustainability in the context of the 2030 Sustainable Development Agenda.
Definition, reference and concept for each ecosystem type A list of potential indicators for pressures, state/condition, biodiversity and impacts on biodiversity and ecosystem service capacity has to be identified through different means such as literature reviews and stakeholder consultation (see figure below for analytical framework). The proposed selection of indicators aims to ensure a coherent mapping of ecosystem condition across the EU. Variations between countries may arise due to presence of specific ecosystems, pressures, different priorities for species protection or spatially explicit patterns of species distribution.
5 http://ec.europa.eu/environment/nature/knowledge/ecosystem_assessment/pdf/2ndMAESWorkingPaper.pdf
7
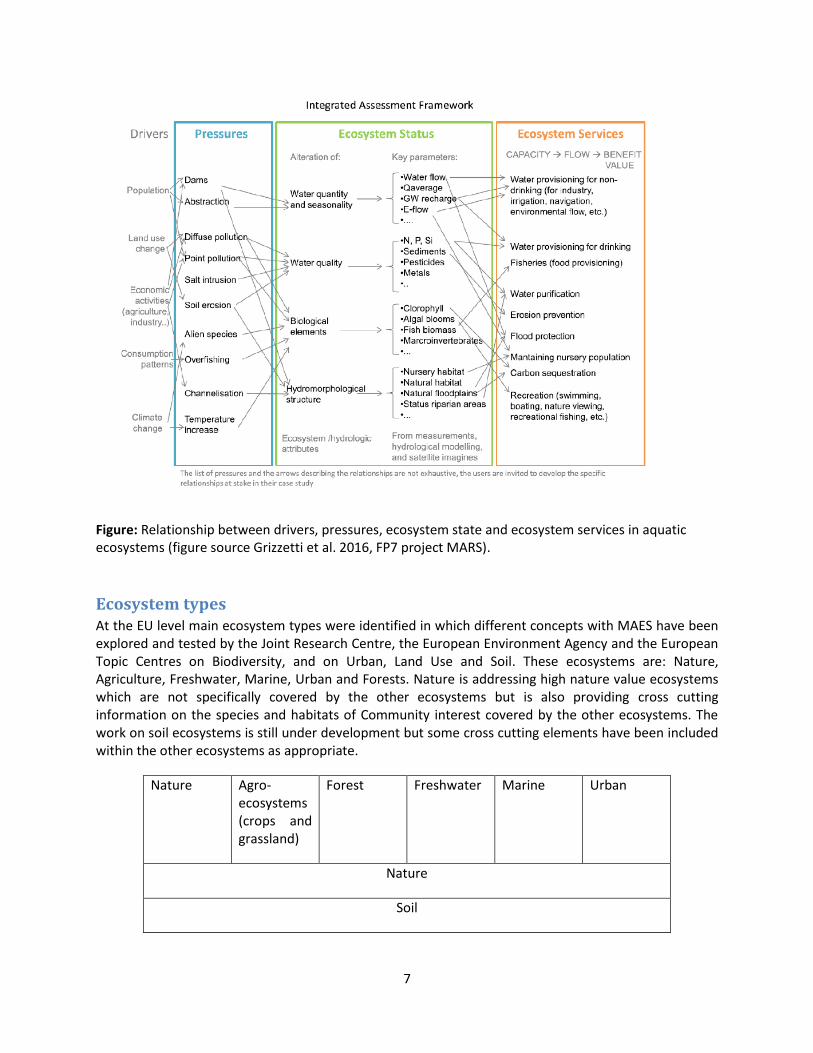
Figure: Relationship between drivers, pressures, ecosystem state and ecosystem services in aquatic ecosystems (figure source Grizzetti et al. 2016, FP7 project MARS).
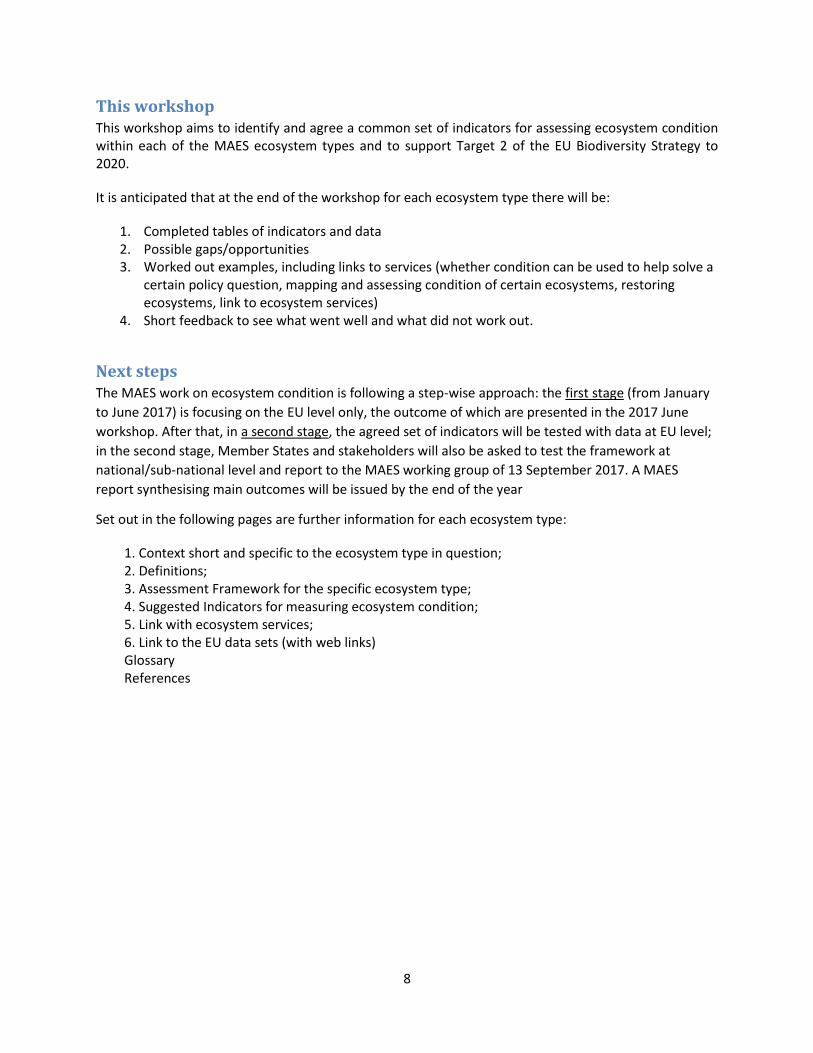
Ecosystem types At the EU level main ecosystem types were identified in which different concepts with MAES have been explored and tested by the Joint Research Centre, the European Environment Agency and the European Topic Centres on Biodiversity, and on Urban, Land Use and Soil. These ecosystems are: Nature, Agriculture, Freshwater, Marine, Urban and Forests. Nature is addressing high nature value ecosystems which are not specifically covered by the other ecosystems but is also providing cross cutting information on the species and habitats of Community interest covered by the other ecosystems. The work on soil ecosystems is still under development but some cross cutting elements have been included within the other ecosystems as appropriate.
Nature Agro-ecosystems (crops and grassland)
Forest Freshwater Marine Urban
Nature
Soil
8
This workshop This workshop aims to identify and agree a common set of indicators for assessing ecosystem condition within each of the MAES ecosystem types and to support Target 2 of the EU Biodiversity Strategy to 2020.
It is anticipated that at the end of the workshop for each ecosystem type there will be:
1. Completed tables of indicators and data 2. Possible gaps/opportunities 3. Worked out examples, including links to services (whether condition can be used to help solve a
certain policy question, mapping and assessing condition of certain ecosystems, restoring ecosystems, link to ecosystem services)
4. Short feedback to see what went well and what did not work out.
Next steps The MAES work on ecosystem condition is following a step-wise approach: the first stage (from January
to June 2017) is focusing on the EU level only, the outcome of which are presented in the 2017 June
workshop. After that, in a second stage, the agreed set of indicators will be tested with data at EU level;
in the second stage, Member States and stakeholders will also be asked to test the framework at
national/sub-national level and report to the MAES working group of 13 September 2017. A MAES
report synthesising main outcomes will be issued by the end of the year
Set out in the following pages are further information for each ecosystem type:
1. Context short and specific to the ecosystem type in question; 2. Definitions; 3. Assessment Framework for the specific ecosystem type; 4. Suggested Indicators for measuring ecosystem condition; 5. Link with ecosystem services; 6. Link to the EU data sets (with web links) Glossary References
9
Nature6
Introduction Nature ecosystem type focusses on ecosystems largely covered by the Habitats Directive (HD) and the
Birds Directive (BD), the so called Nature Directives because of their high values for biodiversity.
Following the MAES typology, these ecosystems are ‘Sparsely vegetated land’, ‘Heathland and shrubs’
and ‘Wetlands’. Due to their sectorial specificities, the other ecosystem types mainly ‘Grasslands’,
‘Croplands’, ‘Forests’, ‘Freshwater’ and ‘Marine’ are covered by the respective thematic ecosystem
types with Nature contributing data and indicators from the respective Directives. Therefore there are
mutual cross-links between the Nature ecosystem type and the other thematic ecosystem types mainly
agriculture, forest, freshwater and marine.
Based on the note ‘An analytical framework for mapping and assessment of ecosystem condition:
proposal to organise the work until June 2017’, this document presents a possible approach to support
assessment of ecosystem conditions based on available information from the Nature Directives related
to ecosystems, habitats and species.
Box 1 Considerations on definitions of ecosystems and use of typologies/classifications
The EU MAES initiative aims to provide the knowledge base to support the EU Biodiversity Strategy to
2020. This implies the adoption of a pragmatic approach to categorise broad ecosystem types based on
the European nature information system (EUNIS) for habitats and Corine Land Cover classes (cf. MAES
typology). This is a simplification while it is evident that a clear limit between ecosystem types cannot be
defined on the ground and different criteria (vegetation, abiotic characteristics, physiognomy and
structure, etc) can lead to different classifications. This pragmatic approach can help produce statistics
and indicators to be comparable for policy needs. Since MAES needs to make the best use of existing
datasets and assessments, it is clear that the development of cross-walks is essential (cf. MAES typology,
CLC nomenclature, EUNIS Habitats classification, HD Annex I, Satellite-based Wetland Observation
Service (SWOS) classification approach). At this stage where the focus is on the EU level it makes sense
to use the MAES typology, keeping in mind that some more detailed/different classifications at lower
levels will need to be considered in a short term.
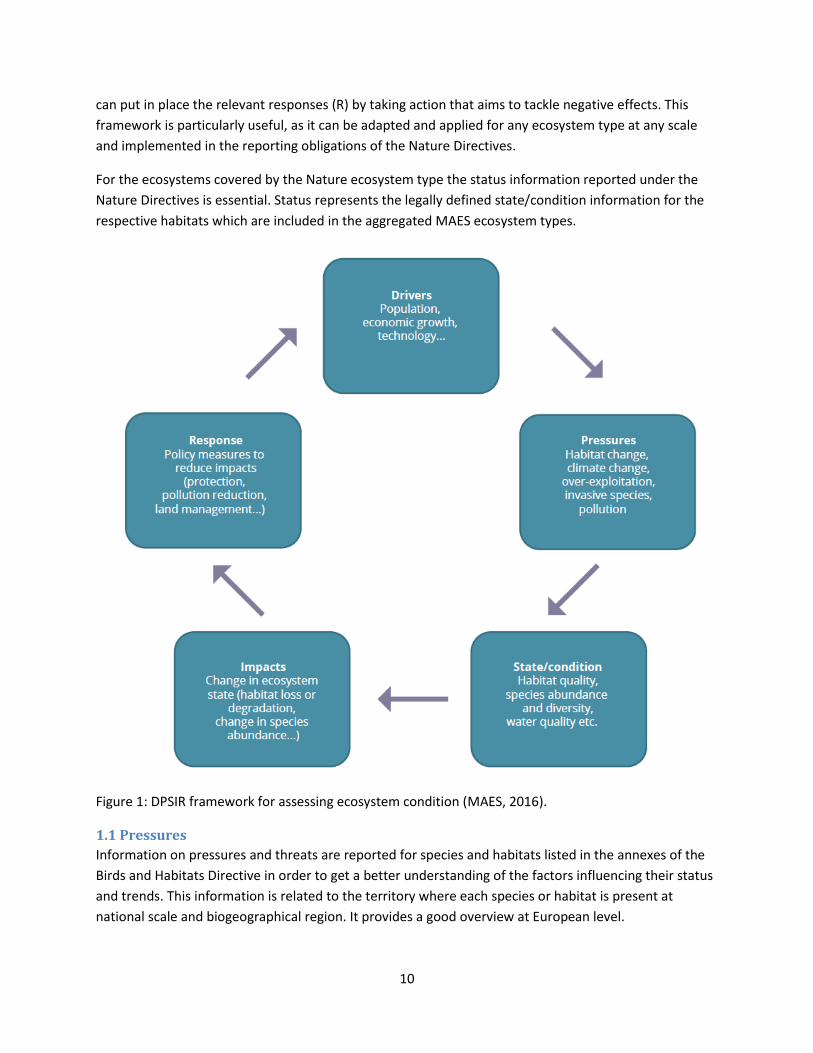
1 DEFINITION, REFERENCE AND CONCEPT FOR EACH ECOSYSTEM TYPE A list of indicators for pressures, state/condition and impacts on biodiversity and ecosystem service
capacity has to be identified. The mapping and assessment process can be coherently structured using
the well-established DPSIR (Drivers, Pressures, State, Impact and Response) framework. This is used to
classify the information needed to analyse environmental problems and to identify measures to resolve
them. Drivers of change (D), such as population, economy and technology development, exert pressures
(P) on the state (condition) of ecosystems (S), with impacts (I) on habitats and biodiversity across Europe
that affect the level of ecosystem services they can supply. If these impacts are undesired, policymakers
6 prepared by Sophie Condé ETC-BD, and contributions from Dania Abdul Malak ETC-ULS, Balint Czúcz ETC-BD,
Joachim Maes JRC, Sara Vallecillo, JRC, Markus Erhard EEA
10
can put in place the relevant responses (R) by taking action that aims to tackle negative effects. This
framework is particularly useful, as it can be adapted and applied for any ecosystem type at any scale
and implemented in the reporting obligations of the Nature Directives.
For the ecosystems covered by the Nature ecosystem type the status information reported under the
Nature Directives is essential. Status represents the legally defined state/condition information for the
respective habitats which are included in the aggregated MAES ecosystem types.
Figure 1: DPSIR framework for assessing ecosystem condition (MAES, 2016).
1.1 Pressures
Information on pressures and threats are reported for species and habitats listed in the annexes of the
Birds and Habitats Directive in order to get a better understanding of the factors influencing their status
and trends. This information is related to the territory where each species or habitat is present at
national scale and biogeographical region. It provides a good overview at European level.
11
Following the same typology, pressures and threats are reported for each site of the Natura 2000
network. This information is not ecosystem specific but of importance at local and landscape levels.
The EU Red list of habitats for all habitats (not only the ones of Community interest) describes the most
important pressures for each habitat at European level.
1.2 Condition
Conditions based on Article 12 and 17 status assessments
Information reported on species and habitats covered by the Birds and Habitats Directives can help to
assess conditions of ecosystems as proposed below.
Proposed definition: Good condition if the combination of habitats and species associated to a specific
ecosystem has been assessed with a ‘Favourable conservation status’ knowing this assessment is done
for each occurrence of this habitat and species present in one MS and in one biogeographic region. This
assessment is based on the four reported parameters: ‘Range’, ‘Area’ and ‘Structure and Functions’ (for
habitat), ‘Population’ and ‘Suitable habitat’ (for species), and ’Future prospects’ (for species and
habitats).
A condition assessment can also be based on one parameter only, e.g. on ‘Structure and Functions’ for
habitat and on ‘Suitable habitat’ for species in order to focus the assessment on the resilience of
habitats and species in relation with the functionalities of the ecosystems and the associated services.
Information based on “Population status” and “Population trends” reported for species of the Birds
Directive can also provide additional ecosystem specific information.
Pitfalls: these assessments are made for a selection of ‘Habitats of Community interest (Annex 1)’ and
therefore don’t cover all natural and semi-natural habitats. Further they do not include highly
anthropogenic habitats related to urban areas and agricultural lands. These ‘non Annex 1 habitats’ are
assessed by the EU Red List of Habitats as explained below.
Sources:
2007-2012 Article 17 and Article 12 databases
Links Species Habitats database
EEA, 2015, State of nature in the EU – Results from the nature reporting 2007-2012. EEA Technical
report n°2/2015.
Conditions based on EU Red List of Habitats
The EU Red List provides an assessment for all (terrestrial and freshwater) habitats , being of Community
interest or not. Assessments of these habitats can be aggregated by main ecosystem types following the
same typology (EUNIS). This assessment is done for two main geographical/administrative units: EU28
and EU28+ including Norway, Switzerland, Iceland, and the Balkan countries. To each habitat one
assessment is available.
12
Proposed definition: ‘Good condition’ if habitat not classified as threatened (Collapsed (CO), Critically
Endangered (CR), Endangered (EN), Vulnerable (VU)) in the EU Red List of habitats published in 2016. It
follows that ‘Good condition’ is proposed if classified as not threatened (Least Concern (LC)) in the EU
Red List of habitats published in 2016.
This approach is defined with a biodiversity and nature conservation perspective based on quantitative
(trends of range, area, geographic distribution) and qualitative (abiotic and biotic) criteria. ‘Of the
criteria used to derive the assessment, three were most frequently decisive: Trend in extent over the past
50 years (criterion A1), Trend in quality over the past 50 years (criterion C/D1) and long-term historical
decline in extent (criterion A3). Restricted geographical occurrence (criterion B) was decisive in only
relatively few cases and quantitative analysis to assess probability of collapse (criterion E) was used only
once ‘. (Janssen et al., 2016).
Pitfalls: Some habitats have been omitted and the classification has been slightly modified (see Annex).
Sources:
• EU Red list of habitats database
• Janssen, J. et al., 2016, European Red list of Habitats. Part 2. Terrestrial and freshwater
habitats. Luxembourg Publications Office of the European Union7.
1.3 Impact on biodiversity and ecosystem service capacity
Species richness and abundance is an inherent aspect of habitat quality and ecosystem condition,
representing their biotic component, it is important to look on both aspects separately as implemented
in the reporting obligations of the Nature Directives, to understand how pressures affect habitat quality
and ecosystem condition and how it changes biodiversity and capacity to provide ecosystem services.
These causalities are the baseline for (policy) action, the prerequisite to reach the targets of the
Directives towards favourable conservation status.
The ecosystem types specifically investigated by the Nature ecosystem type are the ones which are
particularly important for EU nature conservation (ie. species and habitats of Community interest) and
are covered by EU nature legislation. These ecosystems have many other functions and contribute or
even have a key function for numerous other services such as recreation, pollination, water purification
and ground water recharge, flood protection etc.
2 INDICATOR FRAMEWORK FOR MEASURING THE CONDITIONS OF
ECOSYSTEMS The indicator framework for measuring the conditions of ecosystems includes three main types of
indicators: Pressures, State and Biodiversity.
7 http://ec.europa.eu/environment/nature/knowledge/pdf/terrestrial_EU_red_list_report.pdf
13
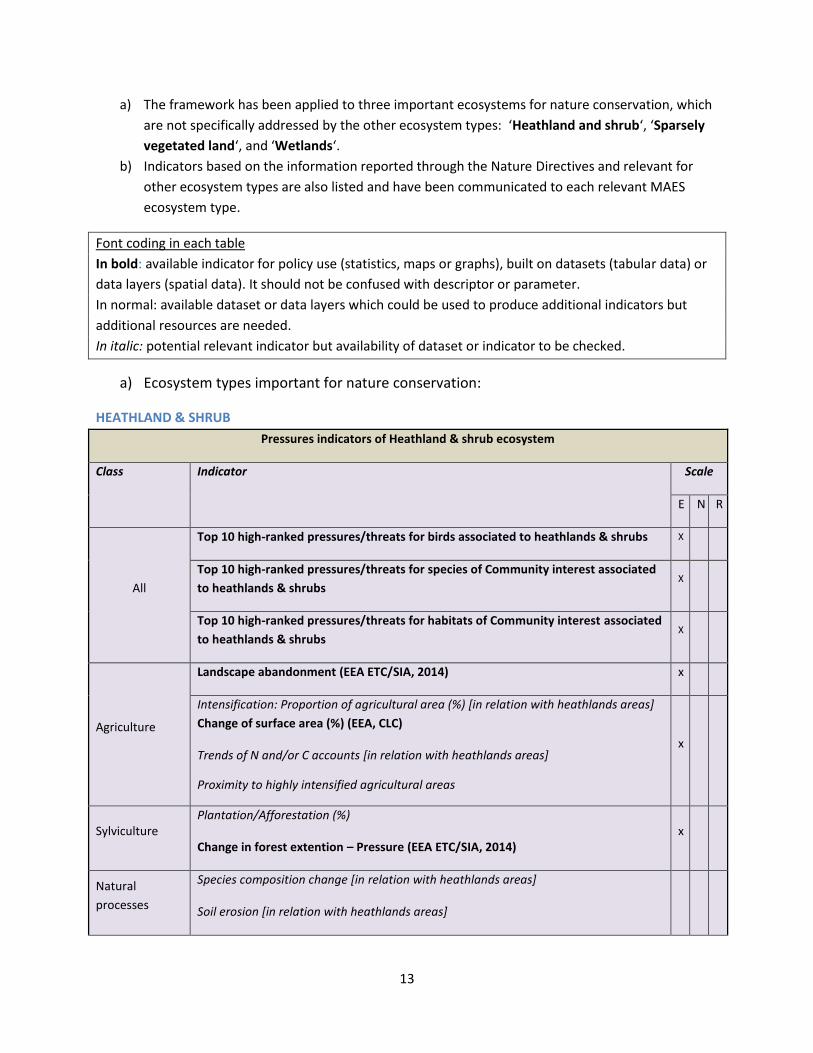
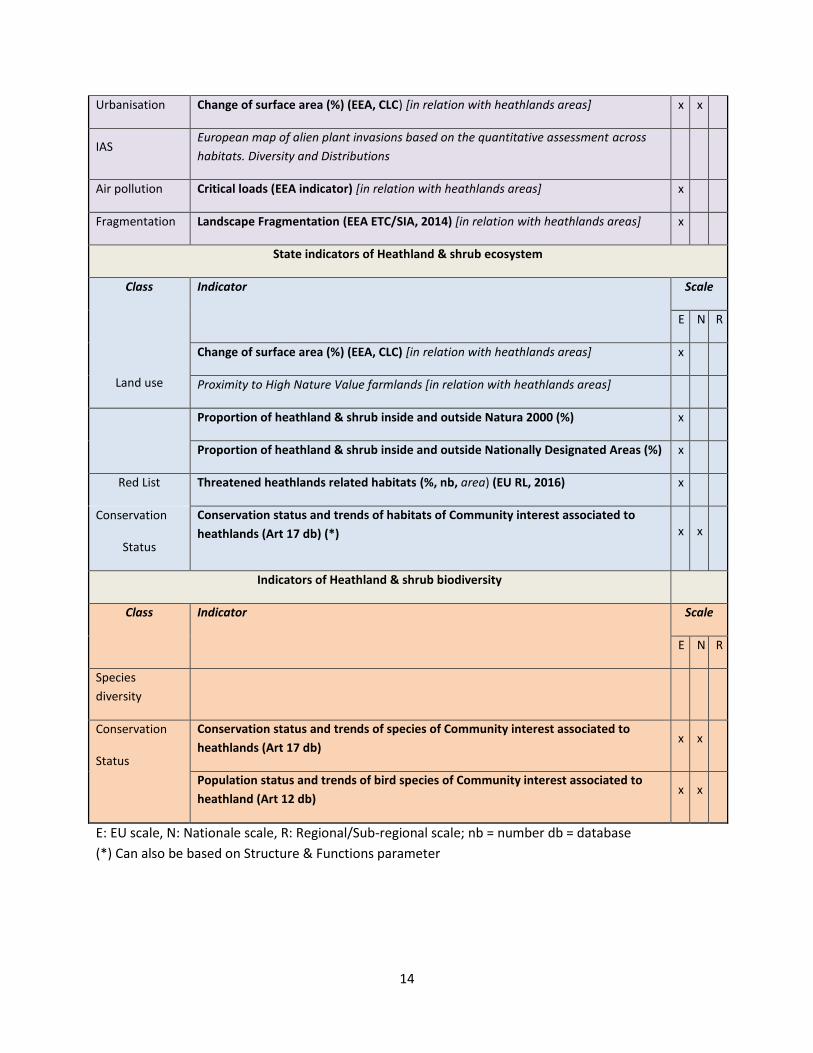
a) The framework has been applied to three important ecosystems for nature conservation, which
are not specifically addressed by the other ecosystem types: ‘Heathland and shrub‘, ‘Sparsely
vegetated land‘, and ‘Wetlands‘.
b) Indicators based on the information reported through the Nature Directives and relevant for
other ecosystem types are also listed and have been communicated to each relevant MAES
ecosystem type.
Font coding in each table
In bold: available indicator for policy use (statistics, maps or graphs), built on datasets (tabular data) or
data layers (spatial data). It should not be confused with descriptor or parameter.
In normal: available dataset or data layers which could be used to produce additional indicators but
additional resources are needed.
In italic: potential relevant indicator but availability of dataset or indicator to be checked.
a) Ecosystem types important for nature conservation:
HEATHLAND & SHRUB
Pressures indicators of Heathland & shrub ecosystem
Class Indicator Scale
E N R
All
Top 10 high-ranked pressures/threats for birds associated to heathlands & shrubs X
Top 10 high-ranked pressures/threats for species of Community interest associated
to heathlands & shrubs X
Top 10 high-ranked pressures/threats for habitats of Community interest associated
to heathlands & shrubs X
Agriculture
Landscape abandonment (EEA ETC/SIA, 2014) x
Intensification: Proportion of agricultural area (%) [in relation with heathlands areas]
Change of surface area (%) (EEA, CLC)
Trends of N and/or C accounts [in relation with heathlands areas]
Proximity to highly intensified agricultural areas
x
Sylviculture Plantation/Afforestation (%)
Change in forest extention – Pressure (EEA ETC/SIA, 2014) x
Natural
processes
Species composition change [in relation with heathlands areas]
Soil erosion [in relation with heathlands areas]
14
Urbanisation Change of surface area (%) (EEA, CLC) [in relation with heathlands areas] x x
IAS European map of alien plant invasions based on the quantitative assessment across
habitats. Diversity and Distributions
Air pollution Critical loads (EEA indicator) [in relation with heathlands areas] x
Fragmentation Landscape Fragmentation (EEA ETC/SIA, 2014) [in relation with heathlands areas] x
State indicators of Heathland & shrub ecosystem
Class
Land use
Indicator Scale
E N R
Change of surface area (%) (EEA, CLC) [in relation with heathlands areas] x
Proximity to High Nature Value farmlands [in relation with heathlands areas]
Proportion of heathland & shrub inside and outside Natura 2000 (%) x
Proportion of heathland & shrub inside and outside Nationally Designated Areas (%) x
Red List Threatened heathlands related habitats (%, nb, area) (EU RL, 2016) x
Conservation
Status
Conservation status and trends of habitats of Community interest associated to
heathlands (Art 17 db) (*) x x
Indicators of Heathland & shrub biodiversity
Class Indicator Scale
E N R
Species
diversity
Conservation
Status
Conservation status and trends of species of Community interest associated to
heathlands (Art 17 db) x x
Population status and trends of bird species of Community interest associated to
heathland (Art 12 db) x x
E: EU scale, N: Nationale scale, R: Regional/Sub-regional scale; nb = number db = database
(*) Can also be based on Structure & Functions parameter
15
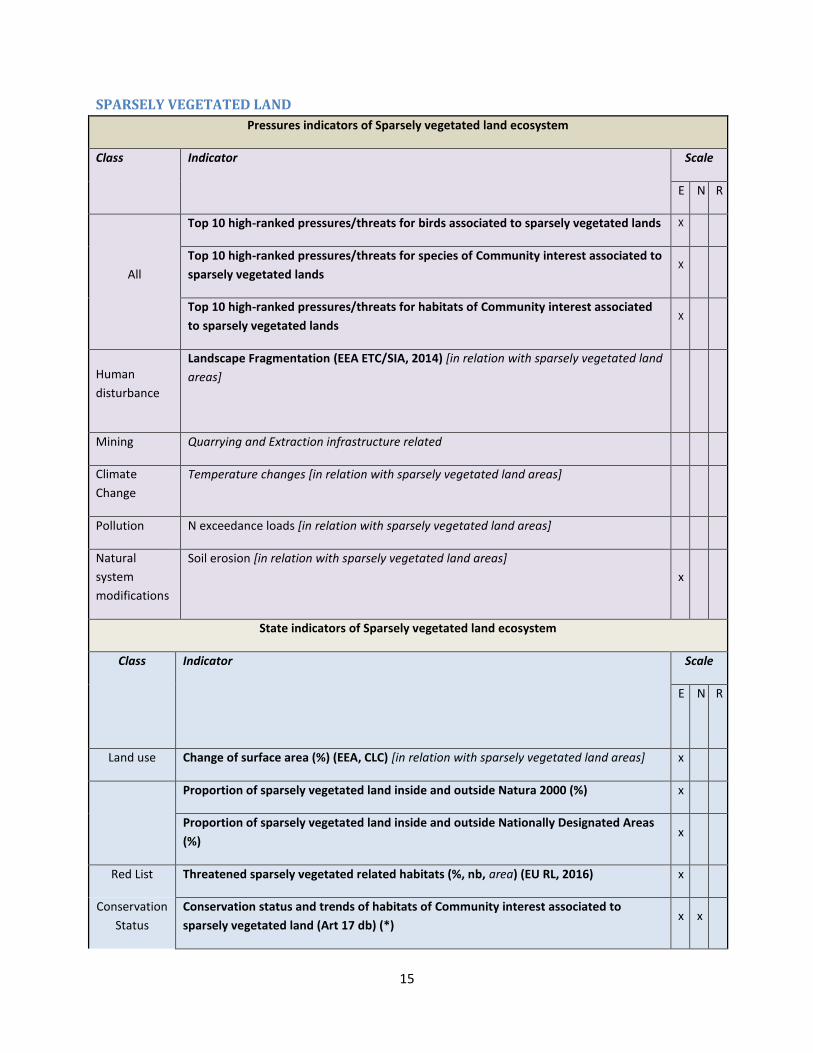
SPARSELY VEGETATED LAND
Pressures indicators of Sparsely vegetated land ecosystem
Class Indicator Scale
E N R
All
Top 10 high-ranked pressures/threats for birds associated to sparsely vegetated lands X
Top 10 high-ranked pressures/threats for species of Community interest associated to
sparsely vegetated lands X
Top 10 high-ranked pressures/threats for habitats of Community interest associated
to sparsely vegetated lands X
Human
disturbance
Landscape Fragmentation (EEA ETC/SIA, 2014) [in relation with sparsely vegetated land
areas]
Mining Quarrying and Extraction infrastructure related
Climate
Change
Temperature changes [in relation with sparsely vegetated land areas]
Pollution N exceedance loads [in relation with sparsely vegetated land areas]
Natural
system
modifications
Soil erosion [in relation with sparsely vegetated land areas]
x
State indicators of Sparsely vegetated land ecosystem
Class
Indicator Scale
E N R
Land use Change of surface area (%) (EEA, CLC) [in relation with sparsely vegetated land areas] x
Proportion of sparsely vegetated land inside and outside Natura 2000 (%) x
Proportion of sparsely vegetated land inside and outside Nationally Designated Areas
(%) x
Red List Threatened sparsely vegetated related habitats (%, nb, area) (EU RL, 2016) x
Conservation
Status
Conservation status and trends of habitats of Community interest associated to
sparsely vegetated land (Art 17 db) (*) x x
16
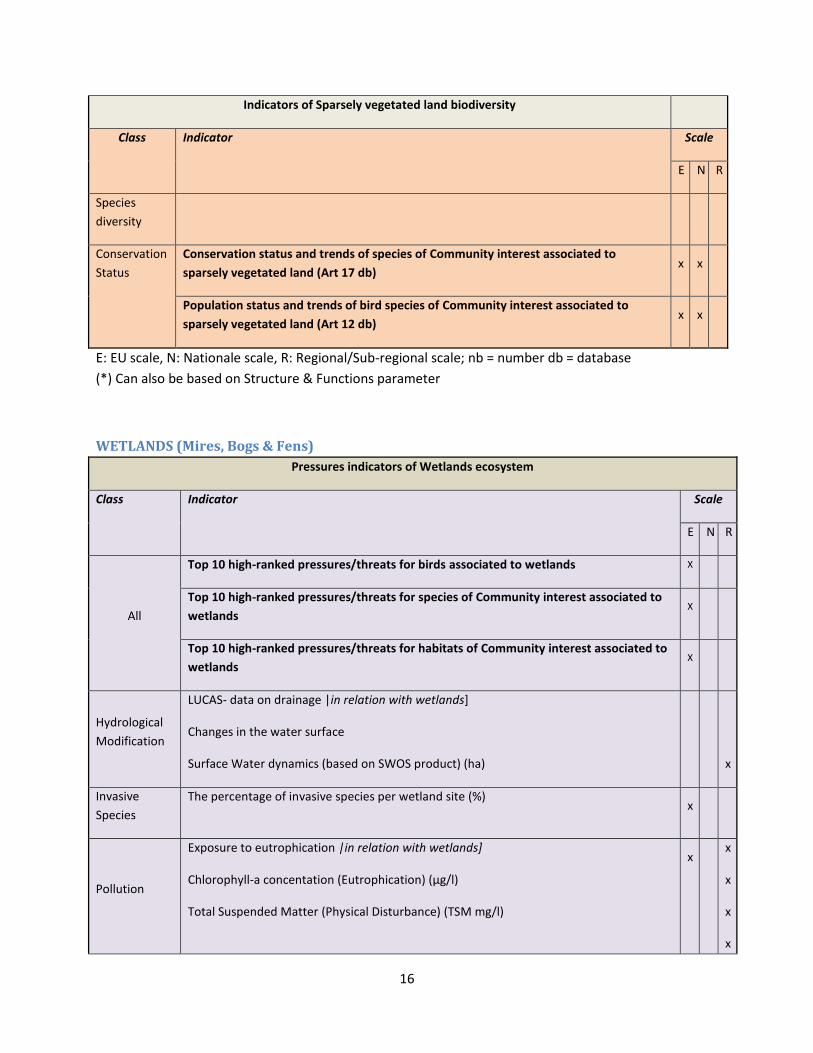
Indicators of Sparsely vegetated land biodiversity
Class Indicator Scale
E N R
Species
diversity
Conservation
Status
Conservation status and trends of species of Community interest associated to
sparsely vegetated land (Art 17 db) x x
Population status and trends of bird species of Community interest associated to
sparsely vegetated land (Art 12 db) x x
E: EU scale, N: Nationale scale, R: Regional/Sub-regional scale; nb = number db = database
(*) Can also be based on Structure & Functions parameter
WETLANDS (Mires, Bogs & Fens)
Pressures indicators of Wetlands ecosystem
Class Indicator Scale
E N R
All
Top 10 high-ranked pressures/threats for birds associated to wetlands X
Top 10 high-ranked pressures/threats for species of Community interest associated to
wetlands X
Top 10 high-ranked pressures/threats for habitats of Community interest associated to
wetlands X
Hydrological
Modification
LUCAS- data on drainage |in relation with wetlands]
Changes in the water surface
Surface Water dynamics (based on SWOS product) (ha)
x
Invasive
Species
The percentage of invasive species per wetland site (%) x
Pollution
Exposure to eutrophication |in relation with wetlands]
Chlorophyll-a concentation (Eutrophication) (µg/l)
Total Suspended Matter (Physical Disturbance) (TSM mg/l)
x
x
x
x
x
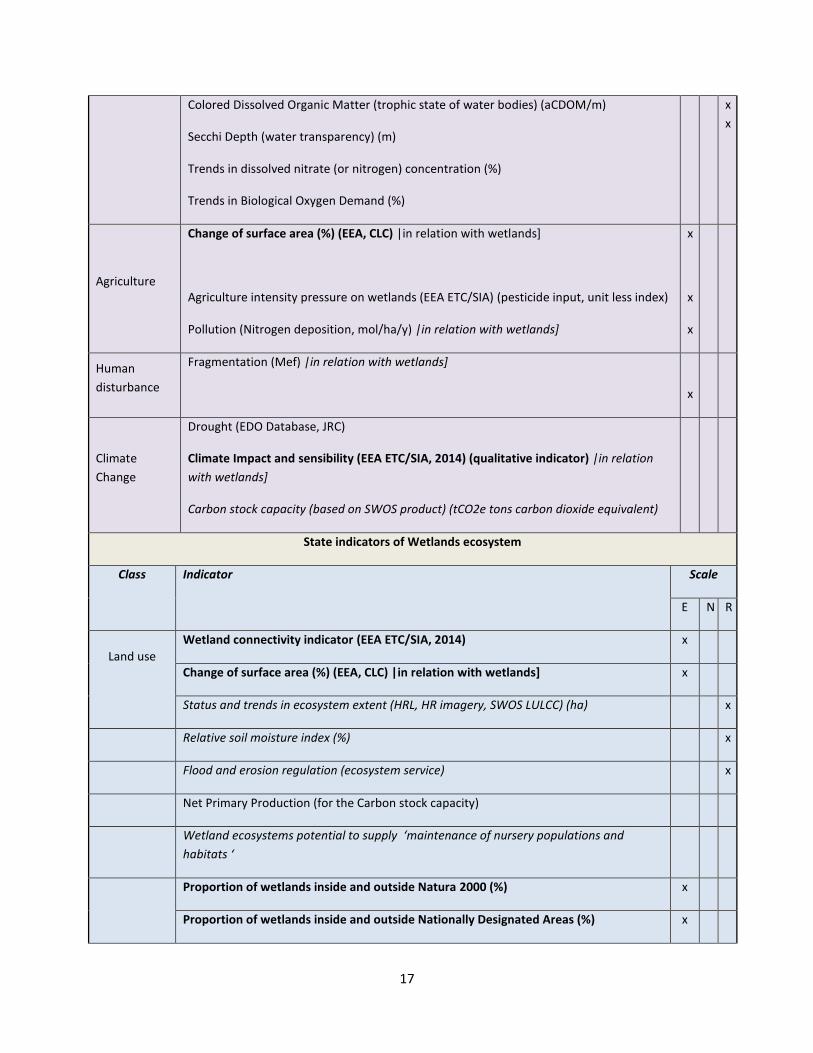
17
Colored Dissolved Organic Matter (trophic state of water bodies) (aCDOM/m)
Secchi Depth (water transparency) (m)
Trends in dissolved nitrate (or nitrogen) concentration (%)
Trends in Biological Oxygen Demand (%)
x
x
Agriculture
Change of surface area (%) (EEA, CLC) |in relation with wetlands]
Agriculture intensity pressure on wetlands (EEA ETC/SIA) (pesticide input, unit less index)
Pollution (Nitrogen deposition, mol/ha/y) |in relation with wetlands]
x
x
x
Human
disturbance
Fragmentation (Mef) |in relation with wetlands]
x
Climate
Change
Drought (EDO Database, JRC)
Climate Impact and sensibility (EEA ETC/SIA, 2014) (qualitative indicator) |in relation
with wetlands]
Carbon stock capacity (based on SWOS product) (tCO2e tons carbon dioxide equivalent)
State indicators of Wetlands ecosystem
Class Indicator Scale
E N R
Land use
Wetland connectivity indicator (EEA ETC/SIA, 2014) x
Change of surface area (%) (EEA, CLC) |in relation with wetlands] x
Status and trends in ecosystem extent (HRL, HR imagery, SWOS LULCC) (ha) x
Relative soil moisture index (%) x
Flood and erosion regulation (ecosystem service) x
Net Primary Production (for the Carbon stock capacity)
Wetland ecosystems potential to supply ‘maintenance of nursery populations and
habitats ‘
Proportion of wetlands inside and outside Natura 2000 (%) x
Proportion of wetlands inside and outside Nationally Designated Areas (%) x
18
Red list Threatened wetlands related habitats (%, nb, area) (EU RL, 2016) x
Trends in status of globally-threatened wetland-dependent birds/amphibians (IUCN RL) x
Conservation
Status
Conservation status and trends of habitats of Community interest associated to
wetlands (Art 17 db) (*) x x
Indicators of Wetlands biodiversity
Class Indicator Scale
E N R
Species
diversity
Number and abundance (number ha-1
) of wetland bird species x x
Living Planet Index for Mediterranean wetlands x
Community Specialisation Index x
Conservation
Status
Conservation status and trends of species of Community interest associated to
wetlands (Art 17 db) x x
Population status and trends of bird species of Community interest associated to
wetlands (Art 12 db) x x
E: EU scale, N: Nationale scale, R: Regional/Sub-regional scale; nb = number db = database
(*) Can also be based on Structure & Functions parameter
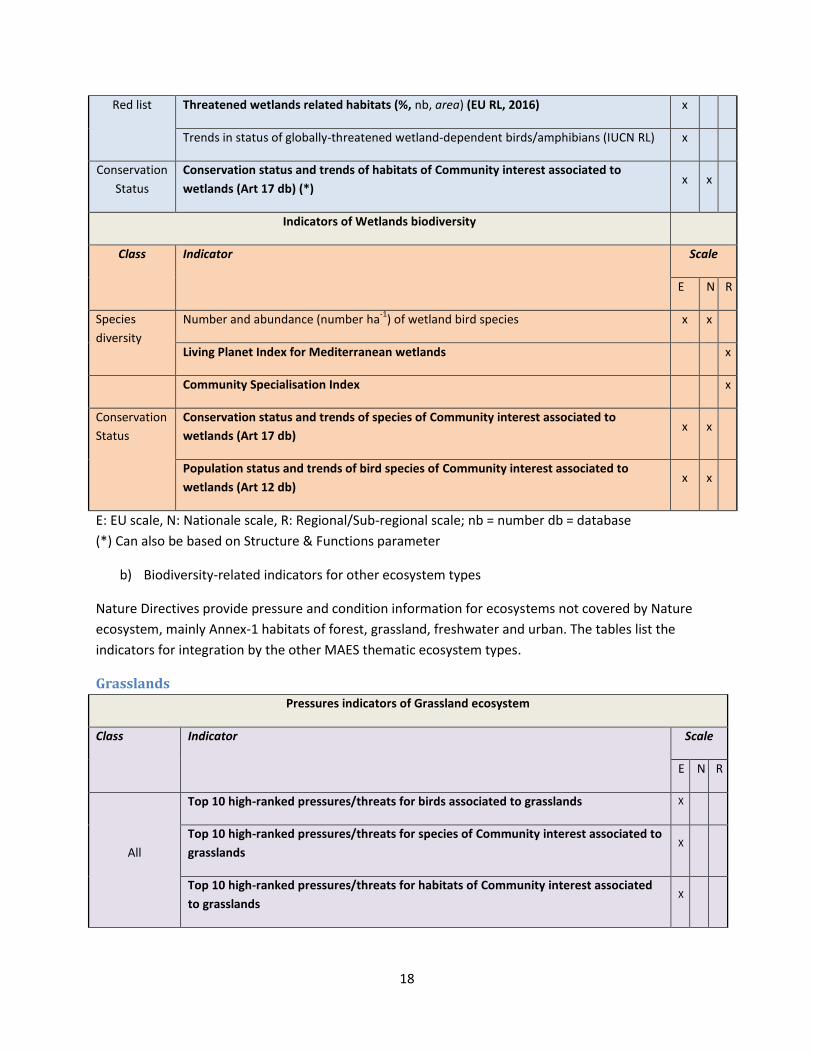
b) Biodiversity-related indicators for other ecosystem types
Nature Directives provide pressure and condition information for ecosystems not covered by Nature
ecosystem, mainly Annex-1 habitats of forest, grassland, freshwater and urban. The tables list the
indicators for integration by the other MAES thematic ecosystem types.
Grasslands
Pressures indicators of Grassland ecosystem
Class Indicator Scale
E N R
All
Top 10 high-ranked pressures/threats for birds associated to grasslands X
Top 10 high-ranked pressures/threats for species of Community interest associated to
grasslands X
Top 10 high-ranked pressures/threats for habitats of Community interest associated
to grasslands X
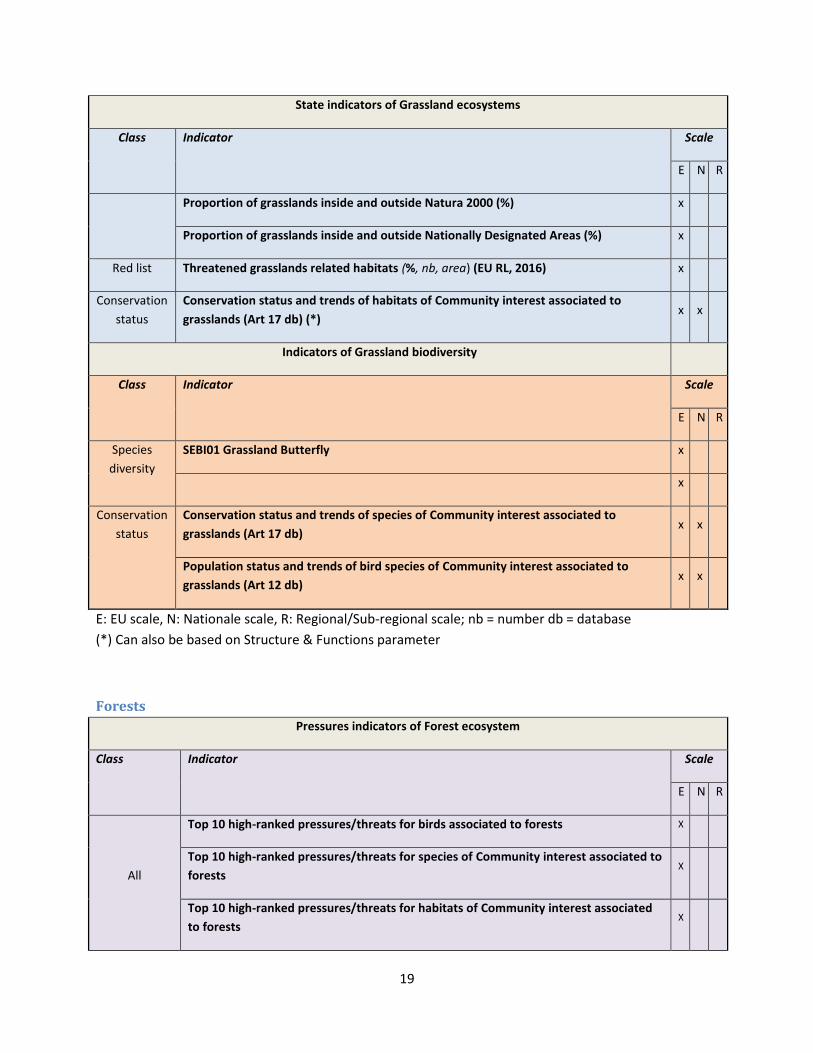
19
State indicators of Grassland ecosystems
Class
Indicator Scale
E N R
Proportion of grasslands inside and outside Natura 2000 (%) x
Proportion of grasslands inside and outside Nationally Designated Areas (%) x
Red list Threatened grasslands related habitats (%, nb, area) (EU RL, 2016) x
Conservation
status
Conservation status and trends of habitats of Community interest associated to
grasslands (Art 17 db) (*) x x
Indicators of Grassland biodiversity
Class Indicator Scale
E N R
Species
diversity
SEBI01 Grassland Butterfly x
x
Conservation
status
Conservation status and trends of species of Community interest associated to
grasslands (Art 17 db) x x
Population status and trends of bird species of Community interest associated to
grasslands (Art 12 db) x x
E: EU scale, N: Nationale scale, R: Regional/Sub-regional scale; nb = number db = database
(*) Can also be based on Structure & Functions parameter
Forests
Pressures indicators of Forest ecosystem
Class Indicator Scale
E N R
All
Top 10 high-ranked pressures/threats for birds associated to forests X
Top 10 high-ranked pressures/threats for species of Community interest associated to
forests X
Top 10 high-ranked pressures/threats for habitats of Community interest associated
to forests X
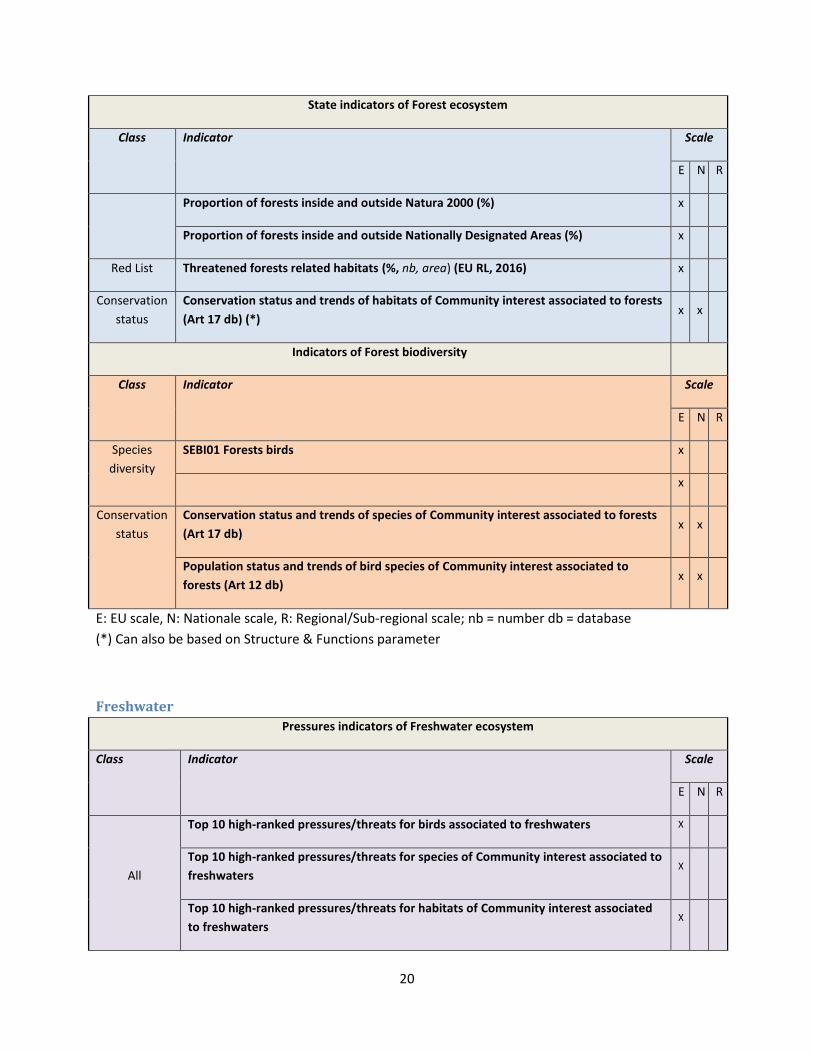
20
State indicators of Forest ecosystem
Class Indicator Scale
E N R
Proportion of forests inside and outside Natura 2000 (%) x
Proportion of forests inside and outside Nationally Designated Areas (%) x
Red List Threatened forests related habitats (%, nb, area) (EU RL, 2016) x
Conservation
status
Conservation status and trends of habitats of Community interest associated to forests
(Art 17 db) (*) x x
Indicators of Forest biodiversity
Class Indicator Scale
E N R
Species
diversity
SEBI01 Forests birds x
x
Conservation
status
Conservation status and trends of species of Community interest associated to forests
(Art 17 db) x x
Population status and trends of bird species of Community interest associated to
forests (Art 12 db) x x
E: EU scale, N: Nationale scale, R: Regional/Sub-regional scale; nb = number db = database
(*) Can also be based on Structure & Functions parameter
Freshwater
Pressures indicators of Freshwater ecosystem
Class Indicator Scale
E N R
All
Top 10 high-ranked pressures/threats for birds associated to freshwaters X
Top 10 high-ranked pressures/threats for species of Community interest associated to
freshwaters X
Top 10 high-ranked pressures/threats for habitats of Community interest associated
to freshwaters X
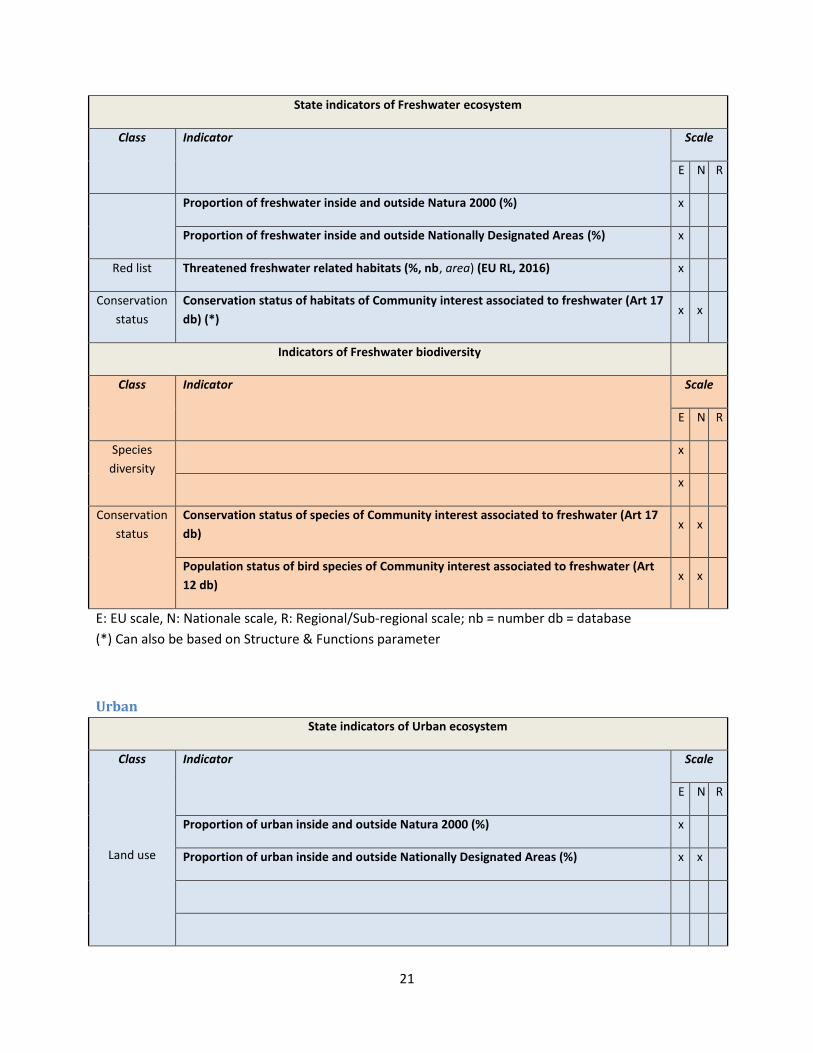
21
State indicators of Freshwater ecosystem
Class
Indicator Scale
E N R
Proportion of freshwater inside and outside Natura 2000 (%) x
Proportion of freshwater inside and outside Nationally Designated Areas (%) x
Red list Threatened freshwater related habitats (%, nb, area) (EU RL, 2016) x
Conservation
status
Conservation status of habitats of Community interest associated to freshwater (Art 17
db) (*) x x
Indicators of Freshwater biodiversity
Class Indicator Scale
E N R
Species
diversity
x
x
Conservation
status
Conservation status of species of Community interest associated to freshwater (Art 17
db) x x
Population status of bird species of Community interest associated to freshwater (Art
12 db) x x
E: EU scale, N: Nationale scale, R: Regional/Sub-regional scale; nb = number db = database
(*) Can also be based on Structure & Functions parameter
Urban
State indicators of Urban ecosystem
Class
Land use
Indicator Scale
E N R
Proportion of urban inside and outside Natura 2000 (%) x
Proportion of urban inside and outside Nationally Designated Areas (%) x x
22
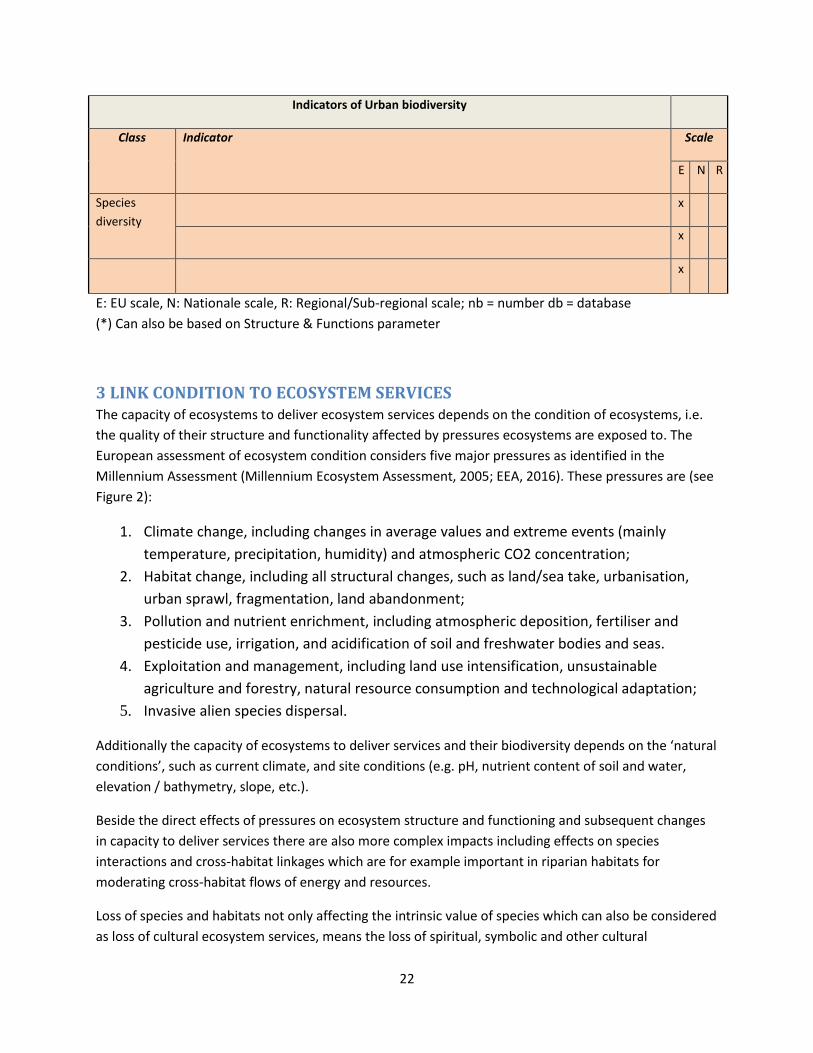
Indicators of Urban biodiversity
Class Indicator Scale
E N R
Species
diversity
x
x
x
E: EU scale, N: Nationale scale, R: Regional/Sub-regional scale; nb = number db = database
(*) Can also be based on Structure & Functions parameter
3 LINK CONDITION TO ECOSYSTEM SERVICES The capacity of ecosystems to deliver ecosystem services depends on the condition of ecosystems, i.e.
the quality of their structure and functionality affected by pressures ecosystems are exposed to. The
European assessment of ecosystem condition considers five major pressures as identified in the
Millennium Assessment (Millennium Ecosystem Assessment, 2005; EEA, 2016). These pressures are (see
Figure 2):
1. Climate change, including changes in average values and extreme events (mainly
temperature, precipitation, humidity) and atmospheric CO2 concentration;
2. Habitat change, including all structural changes, such as land/sea take, urbanisation,
urban sprawl, fragmentation, land abandonment;
3. Pollution and nutrient enrichment, including atmospheric deposition, fertiliser and
pesticide use, irrigation, and acidification of soil and freshwater bodies and seas.
4. Exploitation and management, including land use intensification, unsustainable
agriculture and forestry, natural resource consumption and technological adaptation;
5. Invasive alien species dispersal.
Additionally the capacity of ecosystems to deliver services and their biodiversity depends on the ‘natural
conditions’, such as current climate, and site conditions (e.g. pH, nutrient content of soil and water,
elevation / bathymetry, slope, etc.).
Beside the direct effects of pressures on ecosystem structure and functioning and subsequent changes
in capacity to deliver services there are also more complex impacts including effects on species
interactions and cross-habitat linkages which are for example important in riparian habitats for
moderating cross-habitat flows of energy and resources.
Loss of species and habitats not only affecting the intrinsic value of species which can also be considered
as loss of cultural ecosystem services, means the loss of spiritual, symbolic and other cultural
23
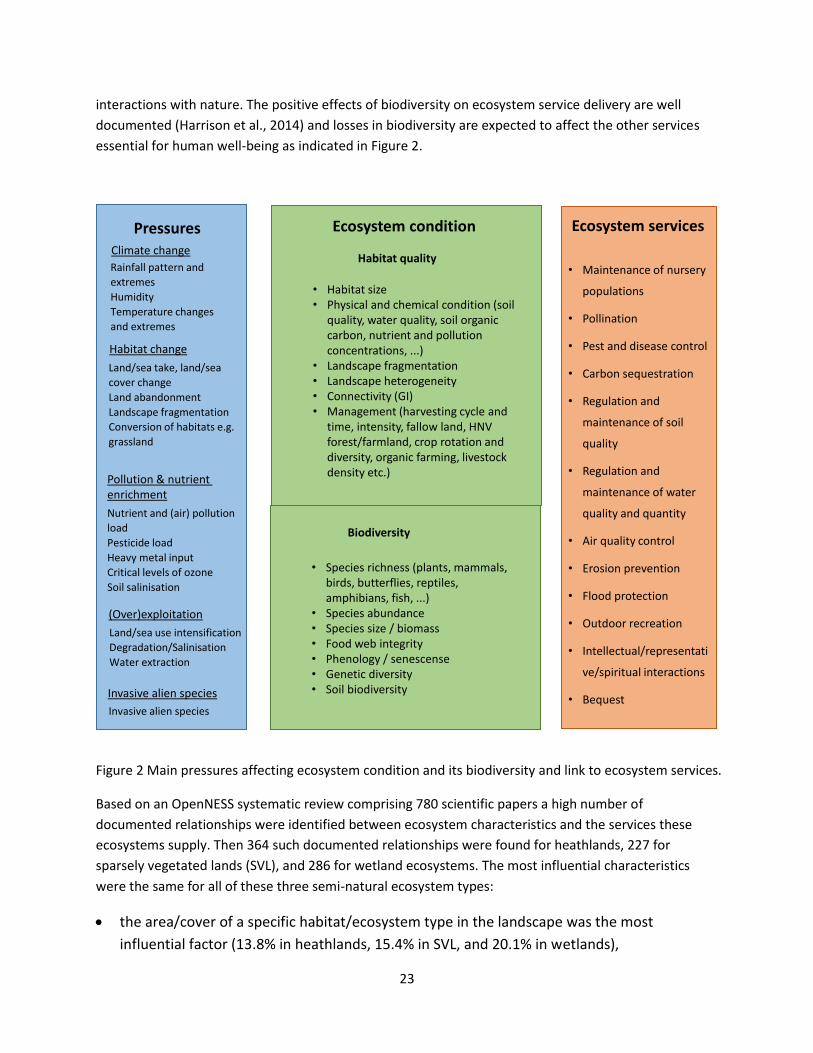
interactions with nature. The positive effects of biodiversity on ecosystem service delivery are well
documented (Harrison et al., 2014) and losses in biodiversity are expected to affect the other services
essential for human well-being as indicated in Figure 2.
Figure 2 Main pressures affecting ecosystem condition and its biodiversity and link to ecosystem services.
Based on an OpenNESS systematic review comprising 780 scientific papers a high number of
documented relationships were identified between ecosystem characteristics and the services these
ecosystems supply. Then 364 such documented relationships were found for heathlands, 227 for
sparsely vegetated lands (SVL), and 286 for wetland ecosystems. The most influential characteristics
were the same for all of these three semi-natural ecosystem types:
the area/cover of a specific habitat/ecosystem type in the landscape was the most
influential factor (13.8% in heathlands, 15.4% in SVL, and 20.1% in wetlands),
Biodiversity
Pressures
Habitat change
Land/sea take, land/sea
cover change
Land abandonment
Landscape fragmentation
Conversion of habitats e.g.
grassland
Pollution & nutrient enrichment
Nutrient and (air) pollution
load
Pesticide load
Heavy metal input
Critical levels of ozone
Soil salinisation
(Over)exploitation
Land/sea use intensification
Degradation/Salinisation
Water extraction
Climate change
Rainfall pattern and
extremes
Humidity
Temperature changes
and extremes
Invasive alien species
Invasive alien species
Ecosystem services
• Maintenance of nursery
populations
• Pollination
• Pest and disease control
• Carbon sequestration
• Regulation and
maintenance of soil
quality
• Regulation and
maintenance of water
quality and quantity
• Air quality control
• Erosion prevention
• Flood protection
• Outdoor recreation
• Intellectual/representati
ve/spiritual interactions
• Bequest
Ecosystem condition
• Species richness (plants, mammals, birds, butterflies, reptiles, amphibians, fish, ...)
• Species abundance• Species size / biomass• Food web integrity• Phenology / senescense• Genetic diversity• Soil biodiversity
• Habitat size• Physical and chemical condition (soil
quality, water quality, soil organic carbon, nutrient and pollution concentrations, ...)
• Landscape fragmentation• Landscape heterogeneity• Connectivity (GI)• Management (harvesting cycle and
time, intensity, fallow land, HNV forest/farmland, crop rotation and diversity, organic farming, livestock density etc.)
Habitat quality
24
similarly, merely the presence/absence of a specific habitat/ecosystem type exerted a
significant impact in many cases (11.3% in heathlands, 12.1% in SVL, and 17.5% in wetlands)
the (species) (bio)diversity of the ecosystem in question is also highly influential (8.7% in
heathlands, and 8.1% in SVL),
landscape structure influenced ES in ~8% (heathlands, SVL, and wetlands) of the cases, and
the presence/absence of specific species was also found to be a critical factor in 11.7% of
the wetland cases.
Analysis done for other ecosystems has been transmitted to the relevant MAES ecosystem types.
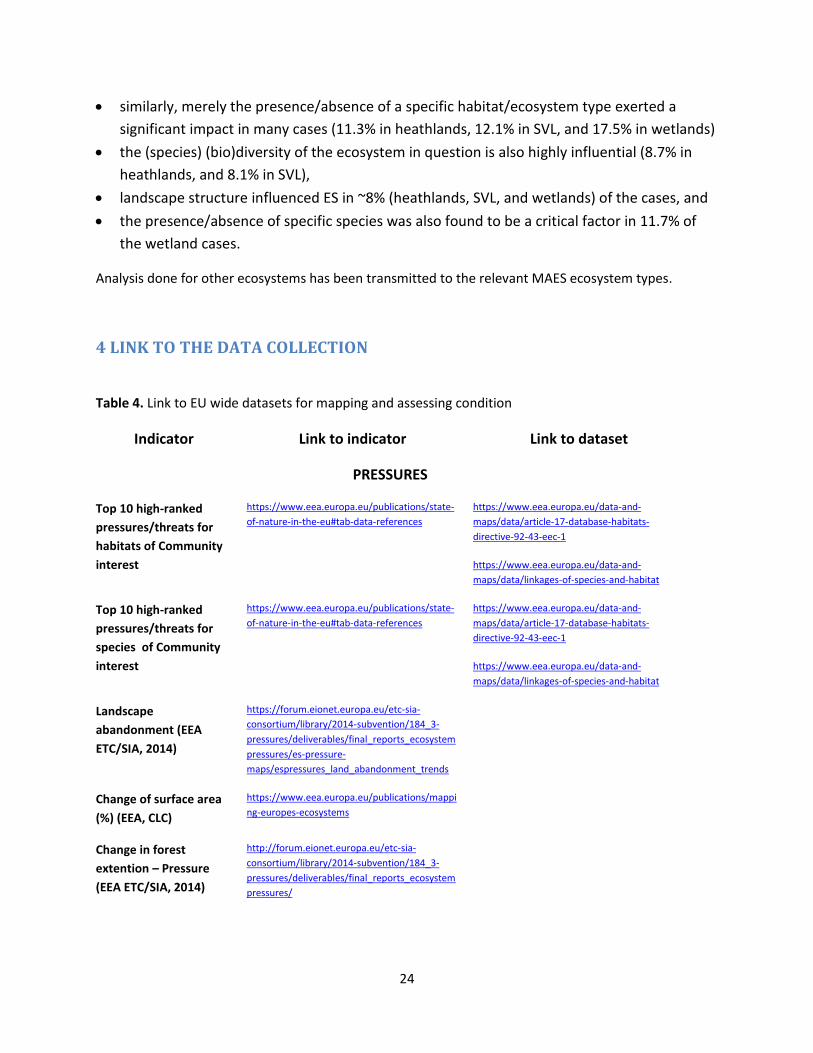
4 LINK TO THE DATA COLLECTION
Table 4. Link to EU wide datasets for mapping and assessing condition
Indicator Link to indicator Link to dataset
PRESSURES
Top 10 high-ranked
pressures/threats for
habitats of Community
interest
https://www.eea.europa.eu/publications/state-
of-nature-in-the-eu#tab-data-references
https://www.eea.europa.eu/data-and-
maps/data/article-17-database-habitats-
directive-92-43-eec-1
https://www.eea.europa.eu/data-and-
maps/data/linkages-of-species-and-habitat
Top 10 high-ranked
pressures/threats for
species of Community
interest
https://www.eea.europa.eu/publications/state-
of-nature-in-the-eu#tab-data-references
https://www.eea.europa.eu/data-and-
maps/data/article-17-database-habitats-
directive-92-43-eec-1
https://www.eea.europa.eu/data-and-
maps/data/linkages-of-species-and-habitat
Landscape
abandonment (EEA
ETC/SIA, 2014)
https://forum.eionet.europa.eu/etc-sia-
consortium/library/2014-subvention/184_3-
pressures/deliverables/final_reports_ecosystem
pressures/es-pressure-
maps/espressures_land_abandonment_trends
Change of surface area
(%) (EEA, CLC)
https://www.eea.europa.eu/publications/mappi
ng-europes-ecosystems
Change in forest
extention – Pressure
(EEA ETC/SIA, 2014)
http://forum.eionet.europa.eu/etc-sia-
consortium/library/2014-subvention/184_3-
pressures/deliverables/final_reports_ecosystem
pressures/
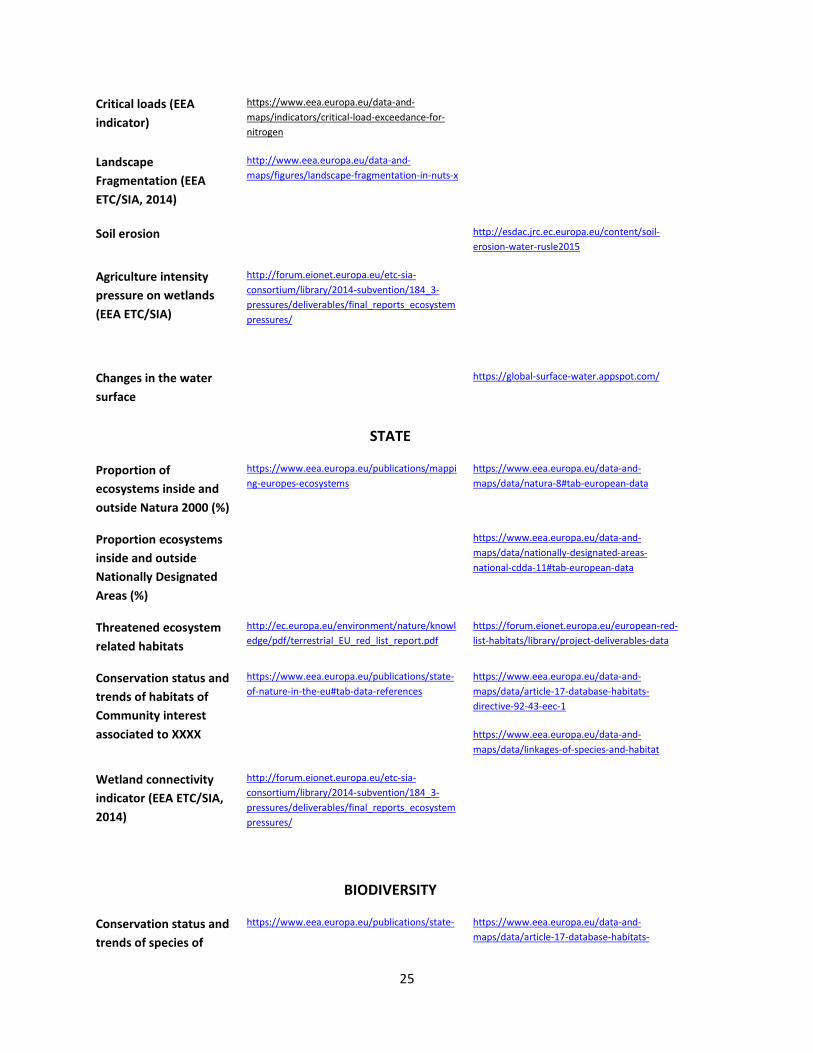
25
Critical loads (EEA
indicator)
https://www.eea.europa.eu/data-and-
maps/indicators/critical-load-exceedance-for-
nitrogen
Landscape
Fragmentation (EEA
ETC/SIA, 2014)
http://www.eea.europa.eu/data-and-
maps/figures/landscape-fragmentation-in-nuts-x
Soil erosion http://esdac.jrc.ec.europa.eu/content/soil-
erosion-water-rusle2015
Agriculture intensity
pressure on wetlands
(EEA ETC/SIA)
http://forum.eionet.europa.eu/etc-sia-
consortium/library/2014-subvention/184_3-
pressures/deliverables/final_reports_ecosystem
pressures/
Changes in the water
surface
https://global-surface-water.appspot.com/
STATE
Proportion of
ecosystems inside and
outside Natura 2000 (%)
https://www.eea.europa.eu/publications/mappi
ng-europes-ecosystems
https://www.eea.europa.eu/data-and-
maps/data/natura-8#tab-european-data
Proportion ecosystems
inside and outside
Nationally Designated
Areas (%)
https://www.eea.europa.eu/data-and-
maps/data/nationally-designated-areas-
national-cdda-11#tab-european-data
Threatened ecosystem
related habitats
http://ec.europa.eu/environment/nature/knowl
edge/pdf/terrestrial_EU_red_list_report.pdf
https://forum.eionet.europa.eu/european-red-
list-habitats/library/project-deliverables-data
Conservation status and
trends of habitats of
Community interest
associated to XXXX
https://www.eea.europa.eu/publications/state-
of-nature-in-the-eu#tab-data-references
https://www.eea.europa.eu/data-and-
maps/data/article-17-database-habitats-
directive-92-43-eec-1
https://www.eea.europa.eu/data-and-
maps/data/linkages-of-species-and-habitat
Wetland connectivity
indicator (EEA ETC/SIA,
2014)
http://forum.eionet.europa.eu/etc-sia-
consortium/library/2014-subvention/184_3-
pressures/deliverables/final_reports_ecosystem
pressures/
BIODIVERSITY
Conservation status and
trends of species of
https://www.eea.europa.eu/publications/state- https://www.eea.europa.eu/data-and-
maps/data/article-17-database-habitats-
26
Community interest
associated to
ecosystems (Art 17 db)
of-nature-in-the-eu#tab-data-references directive-92-43-eec-1
https://www.eea.europa.eu/data-and-
maps/data/linkages-of-species-and-habitat
Population status and
trends of bird species of
Community interest
associated to
ecosystems (Art 12 db)
https://www.eea.europa.eu/publications/state-
of-nature-in-the-eu#tab-data-references
https://www.eea.europa.eu/data-and-
maps/data/article-12-database-birds-directive-
2009-147-ec
https://www.eea.europa.eu/data-and-
maps/data/linkages-of-species-and-habitat
SEBI01 Grassland
Butterfly
https://www.eea.europa.eu/data-and-
maps/indicators/abundance-and-distribution-of-
selected-species/abundance-and-distribution-of-
selected-4
SEBI01 Forest Birds https://www.eea.europa.eu/data-and-
maps/indicators/abundance-and-distribution-of-
selected-species/abundance-and-distribution-of-
selected-4
References
EEA, 2015, State of nature in the EU – Results from the nature reporting 2007-2012. EEA Technical
report n°2/2015 https://www.eea.europa.eu/publications/state-of-nature-in-the-eu#tab-data-
references
Harrison, P. A., Berry, P. M., Simpson, G., Haslett, J. R., Blicharska, M., Bucur, M., Dunford, R., Egoh, B.,
Garcia-Llorente, M., Geamănă, N., Geertsema, W., Lommelen, E., Meiresonne, L. and Turkelboom, F.,
2014, 'Linkages between biodiversity attributes and ecosystem services: A systematic review',
Ecosystem Services 9, 191–203 (DOI: 10.1016/j.ecoser.2014.05.006).
Janssen, J. et al., 2016, European Red list of Habitats. Part 2. Terrestrial and freshwater habitats.
Luxembourg Publications Office of the European Union
http://ec.europa.eu/environment/nature/knowledge/pdf/terrestrial_EU_red_list_report.pdf
MAES, 2016, Mapping and assessing the condition of Europe’s ecosystems: Progress and challenges. 3rd
report.
http://ec.europa.eu/environment/nature/knowledge/ecosystem_assessment/pdf/3rdMAESReport_Con
dition.pdf.
MA (Millennium Ecosystem Assessment), 2005, ‘Ecosystems and human well-being: Synthesis’.
Washington, D.C.: Island Press (http://www.millenniumassessment.org/en/index.html.
27
ANNEX - INFORMATION PER ECOSYSTEM INCLUDING DESCRIPTION OF
HABITATS, ASSESSMENT AND MAIN PRESSURES
This annex details information available for the habitats covered by the MAES Nature ecosystem type
but also for the ones covered by the other ecosystem types: Agriculture, Forests and Freshwater. This
information has been distributed to the respective thematic ecosystem types.
1. The sources of information are the Article 17 and Natura 2000 databases, and the EU Red
List of Habitats database and associated reports.
2. the coherence between the typology of main ecosystems used by the EU Red List of
habitats, the Annex I habitats and the MAES typology has been checked. Main differences
are for Wetlands, Freshwater and Coastal.
3. Each note includes a list of habitats including rearrangement to be consistent with MAES
typology. Additional information from Article 17 assessment, Natura 2000 coverage are also
included. Main pressures and threats reported for the Article 17 habitats have been also
included.
28
HEATHLAND & SHRUB Source : European Red List of Habitats, 2016; 3rd MAES report, 2016; State of Nature report, 2015
version 18.04.2017
WARNING In the European Red list of Habitats, a type of Coastal ecosystem including terrestrial part is
considered with a different approach than the MAES Coastal ecosystem which excludes the terrestrial part. .
Therefore, some recalculations have been done to include five habitats (originally attributed to coastal) under
Heathlands summing a total of 41 habitats.
Description:
‘The heath, shrub and tundra types of Europe comprise (36 +5) habitats which are dominated by diverse
assemblages of woody shrubs often in combination with herbs, and sometimes with a large contingent of mosses,
liverworts and lichens, particularly in the case of the Arctic and Boreal examples. They are distributed across all the
biogeographic regions of Europe from the lowlands to the upper levels of the subalpine and oromediterranean belts.
With the exception of situations where environmental conditions are extreme, with, for example, strong wind, deep
cold, shallow rocky soils, extreme drought or regular flooding, most of these habitats are secondary in character,
dependent on interventions, particularly grazing and fire. In such cases, they occupy an intermediate position
between more closely managed grassland types and mature woodlands.
The abundance and diversity of heath and scrub habitats is uneven across the different regions of Europe, with a
higher representation in the Mediterranean, the Macaronesian and in the Atlantic regions, where a substantial
number of genera of legumes, ericaceous and other sub-shrubs are highly diversified. In these regions, the scrub of
the heath, matorral or phrygana occupies a substantial part of the landscape in the hills and mountains, making an
important contribution to its plant diversity with a good representation of narrow distribution endemics. As a result
of its relationship with traditional pastoral systems, the shrubs are often browsed by sheep and goats, constituting
an important resource for herding. The abandonment of such practices has triggered secondary succession towards
forests in many areas and the reduction of scrub, in an analogous way to the situation with some types of
grasslands. Other scrubs play an important role as forest edges and mantles which are used as living hedges in the
traditional rural landscape of the temperate and submediterranean areas of Europe.
Variability among these habitats is related mainly to biogeography, climatic diversity, hydrologic conditions and soil
reaction as well as to the disturbance regime. This results in habitats linked to different types and degrees of
intervention (seral garrigues, heaths and scrub, woodland mantle hedges), to high mountain situations, to coastal
cliffs, to tundra with its low temperatures, to wet soils (as with riparian and fen scrub) and, only for the
Mediterranean region, to the high content in nitrogen compounds and gypsum in the soils.’ (Janssen et al., 2016)
Assessment:
At EU28 level, 22% of all 41 heathland habitats are threatened (CR, EN, VU) and 76% are not threatened
(NT, LC)
At EU 27 level, 63% of habitat assessments of heathlands of Community interest are in unfavourable status
(bad & Inadequate), 25% are in favourable status and 12% unknown [calculated with the Structure and Fct
parameter]
Around 30% of all heathlands are included in the Natura 2000 network
Main pressures and threats:
‘Since many of these types are successional stages dependent on a certain degree of disturbance – by grazing, fire
and wood harvesting – the main threat is that such intervention stops (Figure 3.23), mostly due to rural
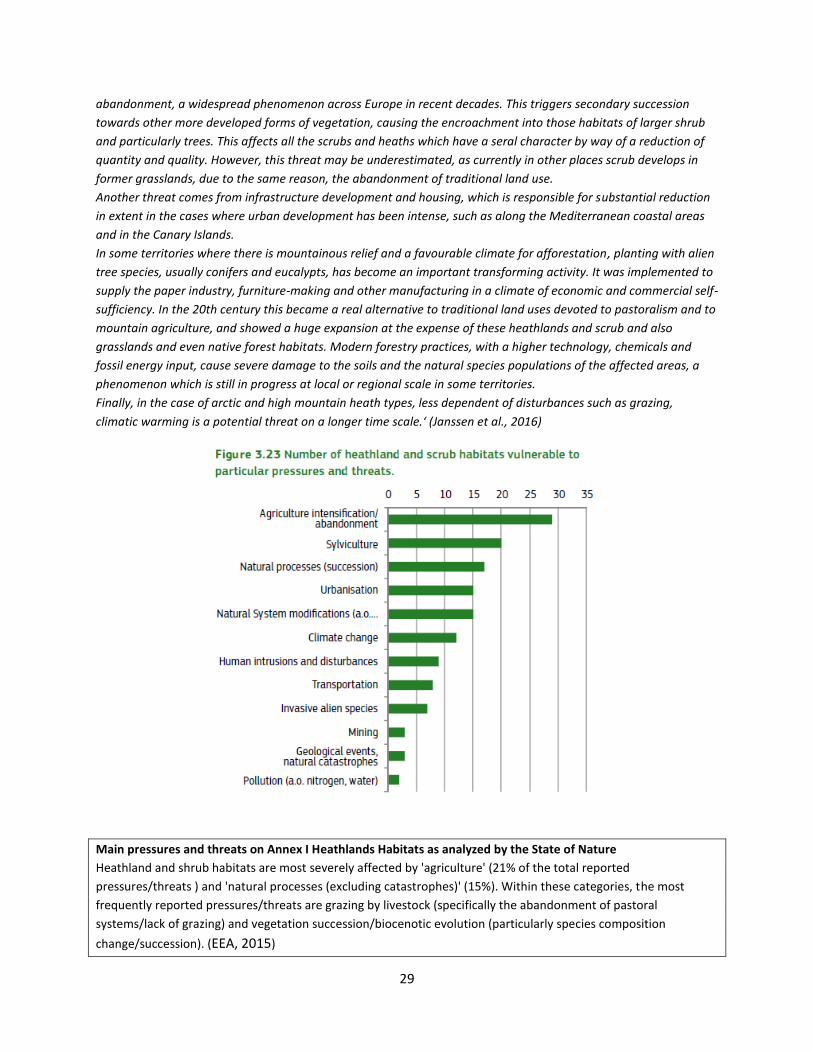
29
abandonment, a widespread phenomenon across Europe in recent decades. This triggers secondary succession
towards other more developed forms of vegetation, causing the encroachment into those habitats of larger shrub
and particularly trees. This affects all the scrubs and heaths which have a seral character by way of a reduction of
quantity and quality. However, this threat may be underestimated, as currently in other places scrub develops in
former grasslands, due to the same reason, the abandonment of traditional land use.
Another threat comes from infrastructure development and housing, which is responsible for substantial reduction
in extent in the cases where urban development has been intense, such as along the Mediterranean coastal areas
and in the Canary Islands.
In some territories where there is mountainous relief and a favourable climate for afforestation, planting with alien
tree species, usually conifers and eucalypts, has become an important transforming activity. It was implemented to
supply the paper industry, furniture-making and other manufacturing in a climate of economic and commercial self-
sufficiency. In the 20th century this became a real alternative to traditional land uses devoted to pastoralism and to
mountain agriculture, and showed a huge expansion at the expense of these heathlands and scrub and also
grasslands and even native forest habitats. Modern forestry practices, with a higher technology, chemicals and
fossil energy input, cause severe damage to the soils and the natural species populations of the affected areas, a
phenomenon which is still in progress at local or regional scale in some territories.
Finally, in the case of arctic and high mountain heath types, less dependent of disturbances such as grazing,
climatic warming is a potential threat on a longer time scale.‘ (Janssen et al., 2016)
Main pressures and threats on Annex I Heathlands Habitats as analyzed by the State of Nature
Heathland and shrub habitats are most severely affected by 'agriculture' (21% of the total reported
pressures/threats ) and 'natural processes (excluding catastrophes)' (15%). Within these categories, the most
frequently reported pressures/threats are grazing by livestock (specifically the abandonment of pastoral
systems/lack of grazing) and vegetation succession/biocenotic evolution (particularly species composition
change/succession). (EEA, 2015)
30
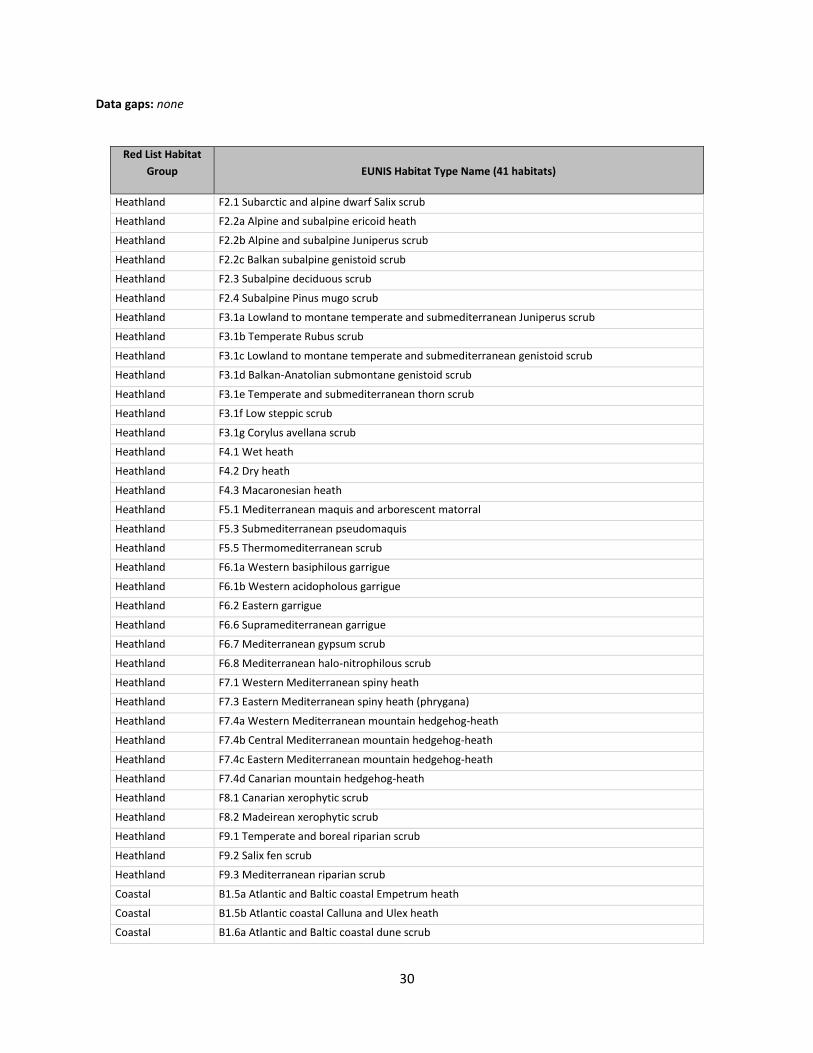
Data gaps: none
Red List Habitat
Group EUNIS Habitat Type Name (41 habitats)
Heathland F2.1 Subarctic and alpine dwarf Salix scrub
Heathland F2.2a Alpine and subalpine ericoid heath
Heathland F2.2b Alpine and subalpine Juniperus scrub
Heathland F2.2c Balkan subalpine genistoid scrub
Heathland F2.3 Subalpine deciduous scrub
Heathland F2.4 Subalpine Pinus mugo scrub
Heathland F3.1a Lowland to montane temperate and submediterranean Juniperus scrub
Heathland F3.1b Temperate Rubus scrub
Heathland F3.1c Lowland to montane temperate and submediterranean genistoid scrub
Heathland F3.1d Balkan-Anatolian submontane genistoid scrub
Heathland F3.1e Temperate and submediterranean thorn scrub
Heathland F3.1f Low steppic scrub
Heathland F3.1g Corylus avellana scrub
Heathland F4.1 Wet heath
Heathland F4.2 Dry heath
Heathland F4.3 Macaronesian heath
Heathland F5.1 Mediterranean maquis and arborescent matorral
Heathland F5.3 Submediterranean pseudomaquis
Heathland F5.5 Thermomediterranean scrub
Heathland F6.1a Western basiphilous garrigue
Heathland F6.1b Western acidopholous garrigue
Heathland F6.2 Eastern garrigue
Heathland F6.6 Supramediterranean garrigue
Heathland F6.7 Mediterranean gypsum scrub
Heathland F6.8 Mediterranean halo-nitrophilous scrub
Heathland F7.1 Western Mediterranean spiny heath
Heathland F7.3 Eastern Mediterranean spiny heath (phrygana)
Heathland F7.4a Western Mediterranean mountain hedgehog-heath
Heathland F7.4b Central Mediterranean mountain hedgehog-heath
Heathland F7.4c Eastern Mediterranean mountain hedgehog-heath
Heathland F7.4d Canarian mountain hedgehog-heath
Heathland F8.1 Canarian xerophytic scrub
Heathland F8.2 Madeirean xerophytic scrub
Heathland F9.1 Temperate and boreal riparian scrub
Heathland F9.2 Salix fen scrub
Heathland F9.3 Mediterranean riparian scrub
Coastal B1.5a Atlantic and Baltic coastal Empetrum heath
Coastal B1.5b Atlantic coastal Calluna and Ulex heath
Coastal B1.6a Atlantic and Baltic coastal dune scrub

31
Red List Habitat
Group EUNIS Habitat Type Name (41 habitats)
Coastal B1.6b Mediterranean and Black Sea coastal dune scrub
Coastal B1.6c Macaronesian coastal dune scrub
32
SPARSELY VEGETATED LAND Source : European Red List of Habitats, 2016; 3rd MAES report, 2016; State of Nature report, 2015
version 04.04.2017
WARNING In the European Red list of Habitats, a type of Coastal ecosystem including terrestrial part is
considered with a different approach than the MAES Coastal ecosystem which excludes the terrestrial part. .
Therefore, some recalculations have been done to include eleven habitats (originally attributed to coastal)
under Sparsely vegetated lands summing a total of 38 habitats.
Description:
‘A total of (29 +9) habitats are considered, forming a very heterogeneous group, including bare or sparsely
vegetated rock, lava, ice and snow of cliffs, screes, caves, volcanoes, glaciers and snow-fields. Also included here is
the only habitat assessed from the more anthropogenic habitats: Arable land with unmixed crops grown by low-
intensity agricultural methods (I1.3).
These habitats are distributed through all the biogeographic regions of Europe, In general, the sparsely vegetated
habitats are dependent on strong geological or meteorological features and are very often considered as azonal in
most bioclimatic maps. However, there are strong geographic differences that have determined the
characterisation of the habitat units with two variables generally used: rock type (whether ultramafic, base-rich or
siliceous) and the biogeographic zone. This distinction enables independent assessments for such types as
Mediterranean inland ultramafic cliffs (H3.2g) or Temperate high mountain siliceous cliff (H2.3). Coastal cliff types
are evaluated among the Coastal habitats (B3.1 and B3.4).
Most of the habitats of this group are very susceptible to change and show little resilience, but have been little
affected by direct human impact by virtue of their remoteness or inaccessibility. Many of the cliff habitats have
functioned as refugia for plant species during the Ice Ages and other periods of changing conditions, and as a result
nowadays harbour high numbers of endemic relic species.‘ (Janssen et al., 2016)
Assessment:
At EU28 level, 11 % of all 38 sparsely vegetated land habitats are threatened (CR, EN, VU) and 71% are
not threatened (NT, LC)
At EU 27 level, 49% of habitat assessments of sparsely vegetated land of Community interest are in
unfavourable status (bad & Inadequate) and 34% are in favourable status and 17% unknown [calculated with
the Structure and Fct parameter]
More than 50% of all sparsely vegetated land are included in the Natura 2000 network
Main pressures and threats:
‘This is a very heterogeneous group of habitats and the threats affecting them are likewise diverse (Figure 3.30).
The most important threat for the snow-related habitats is climate change, which affects the reduction in extent in
recent past and which is very likely to continue in the near future. Indeed, if accurate future projections are
developed, the level of threat may increase.
Agricultural intensification is responsible for the Endangered status of Arable land with unmixed crops grown by
low-intensity agricultural methods (I1.3), where the use of fertilisers, herbicide, insecticide and other agrochemicals,
the large-scale removal of field boundaries, mechanisation and adoption of highly-yielding crop varieties have all
taken a toll. A different form of agriculture is also responsible for Fjell field (H5.1a) being assessed as Near
Threatened in EU28, mainly due to eutrophication through intensive grazing. For the screes, rock outcrops and cliffs,
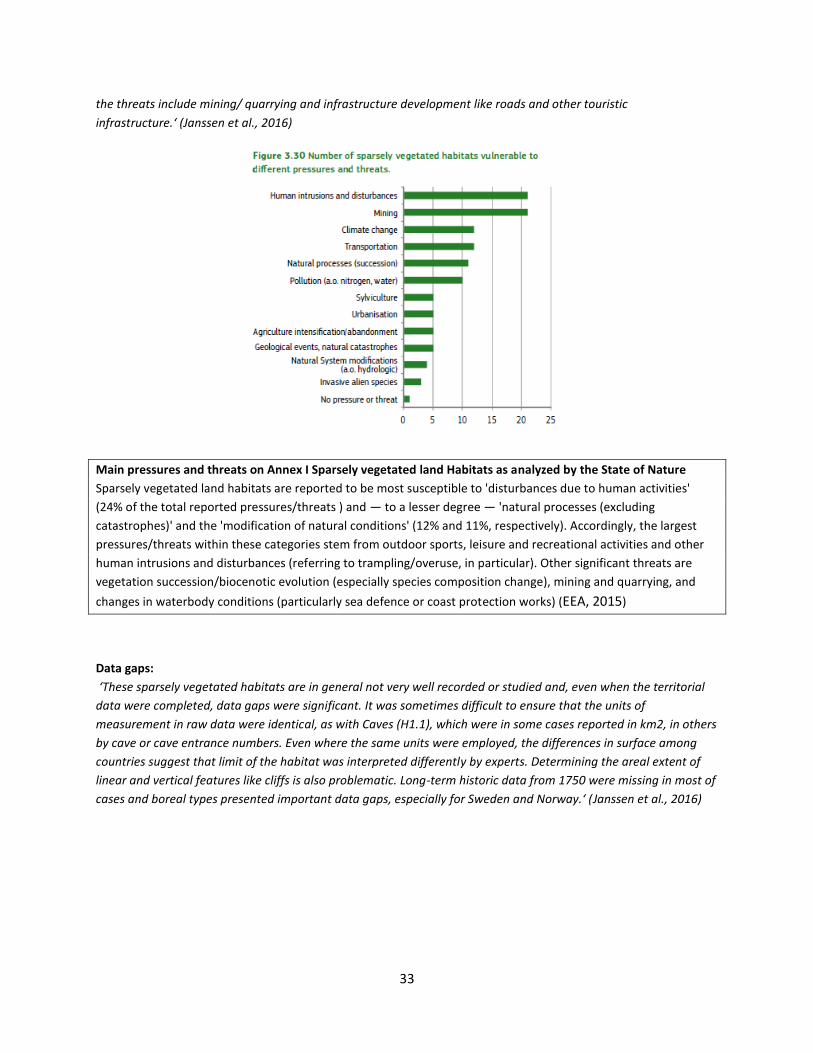
33
the threats include mining/ quarrying and infrastructure development like roads and other touristic
infrastructure.‘ (Janssen et al., 2016)
Main pressures and threats on Annex I Sparsely vegetated land Habitats as analyzed by the State of Nature
Sparsely vegetated land habitats are reported to be most susceptible to 'disturbances due to human activities'
(24% of the total reported pressures/threats ) and — to a lesser degree — 'natural processes (excluding
catastrophes)' and the 'modification of natural conditions' (12% and 11%, respectively). Accordingly, the largest
pressures/threats within these categories stem from outdoor sports, leisure and recreational activities and other
human intrusions and disturbances (referring to trampling/overuse, in particular). Other significant threats are
vegetation succession/biocenotic evolution (especially species composition change), mining and quarrying, and
changes in waterbody conditions (particularly sea defence or coast protection works) (EEA, 2015)
Data gaps:
‘These sparsely vegetated habitats are in general not very well recorded or studied and, even when the territorial
data were completed, data gaps were significant. It was sometimes difficult to ensure that the units of
measurement in raw data were identical, as with Caves (H1.1), which were in some cases reported in km2, in others
by cave or cave entrance numbers. Even where the same units were employed, the differences in surface among
countries suggest that limit of the habitat was interpreted differently by experts. Determining the areal extent of
linear and vertical features like cliffs is also problematic. Long-term historic data from 1750 were missing in most of
cases and boreal types presented important data gaps, especially for Sweden and Norway.‘ (Janssen et al., 2016)
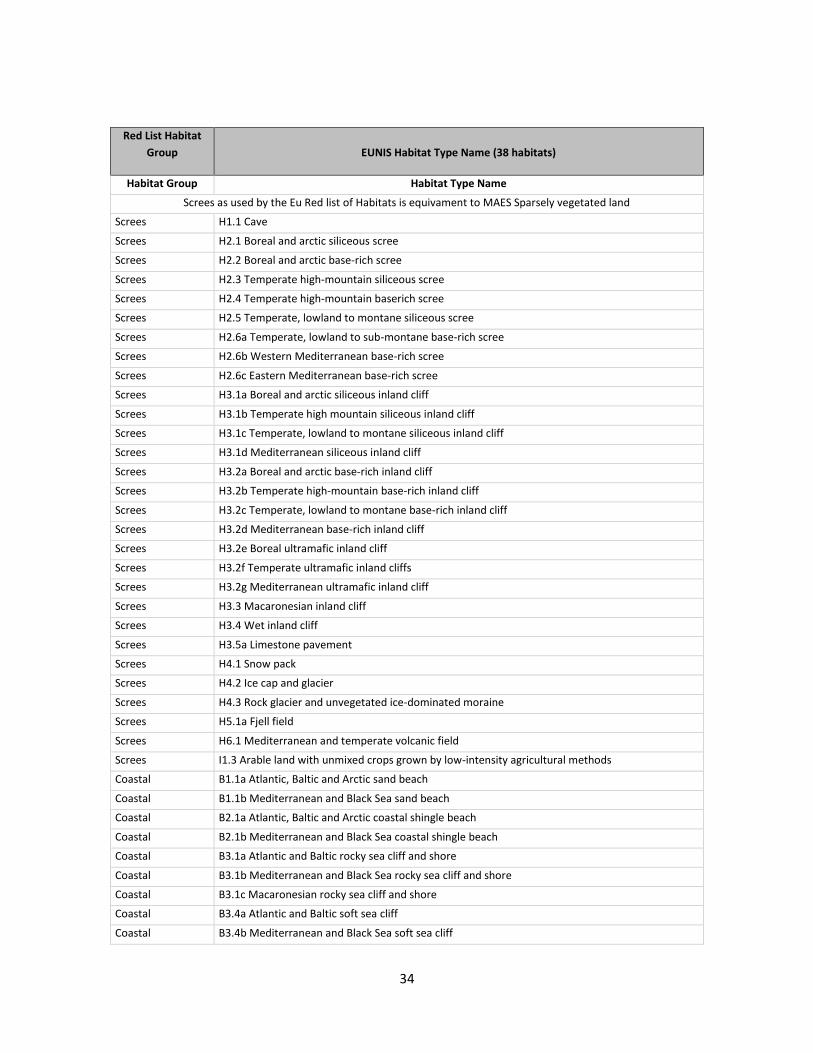
34
Red List Habitat
Group EUNIS Habitat Type Name (38 habitats)
Habitat Group Habitat Type Name
Screes as used by the Eu Red list of Habitats is equivament to MAES Sparsely vegetated land
Screes H1.1 Cave
Screes H2.1 Boreal and arctic siliceous scree
Screes H2.2 Boreal and arctic base-rich scree
Screes H2.3 Temperate high-mountain siliceous scree
Screes H2.4 Temperate high-mountain baserich scree
Screes H2.5 Temperate, lowland to montane siliceous scree
Screes H2.6a Temperate, lowland to sub-montane base-rich scree
Screes H2.6b Western Mediterranean base-rich scree
Screes H2.6c Eastern Mediterranean base-rich scree
Screes H3.1a Boreal and arctic siliceous inland cliff
Screes H3.1b Temperate high mountain siliceous inland cliff
Screes H3.1c Temperate, lowland to montane siliceous inland cliff
Screes H3.1d Mediterranean siliceous inland cliff
Screes H3.2a Boreal and arctic base-rich inland cliff
Screes H3.2b Temperate high-mountain base-rich inland cliff
Screes H3.2c Temperate, lowland to montane base-rich inland cliff
Screes H3.2d Mediterranean base-rich inland cliff
Screes H3.2e Boreal ultramafic inland cliff
Screes H3.2f Temperate ultramafic inland cliffs
Screes H3.2g Mediterranean ultramafic inland cliff
Screes H3.3 Macaronesian inland cliff
Screes H3.4 Wet inland cliff
Screes H3.5a Limestone pavement
Screes H4.1 Snow pack
Screes H4.2 Ice cap and glacier
Screes H4.3 Rock glacier and unvegetated ice-dominated moraine
Screes H5.1a Fjell field
Screes H6.1 Mediterranean and temperate volcanic field
Screes I1.3 Arable land with unmixed crops grown by low-intensity agricultural methods
Coastal B1.1a Atlantic, Baltic and Arctic sand beach
Coastal B1.1b Mediterranean and Black Sea sand beach
Coastal B2.1a Atlantic, Baltic and Arctic coastal shingle beach
Coastal B2.1b Mediterranean and Black Sea coastal shingle beach
Coastal B3.1a Atlantic and Baltic rocky sea cliff and shore
Coastal B3.1b Mediterranean and Black Sea rocky sea cliff and shore
Coastal B3.1c Macaronesian rocky sea cliff and shore
Coastal B3.4a Atlantic and Baltic soft sea cliff
Coastal B3.4b Mediterranean and Black Sea soft sea cliff
35
WETLANDS (Mires, Bogs and Fens) Source : European Red List of Habitats, 2016; 3rd MAES report, 2016; State of Nature report, 2015
version 09.05.2017
WARNING In the European Red list of Habitats, three types of ecosystems are considered: 26 Freshwater
habitats, 13 Mires and bogs habitats and 29 Coastal habitats (including terrestrial and marine parts). The MAES
typology makes distinction between Rivers and Lakes and, Wetlands. MAES Coastal ecosystem is related only to
marine part.
Here, some statistics prepared by the European Red list have been recalculated for a better correspondence
with the MAES/EUNIS typology (2 habitats from Coastal by the European Red list seem more appropriate under
MAES Wetlands summing a total of 15 habitats).
Description:
‘Besides their significance for biodiversity, mire habitats have important ecosystem functions. Peat accumulation
sequesters carbon from the atmosphere and mires also act as water reservoirs and buffer discharge from
catchments into lakes and rivers. In a natural catchment they function as sponges which prevent lower parts of the
catchment from flooding in periods of heavy rain, and still support water for a long time in periods of drought.
Mires also often have a distinct wilderness character, representing remnant natural habitats in landscapes
otherwise altered by humans. Nevertheless, in some temperate regions, groundwater-fed fens have been created
or maintained by pre-industrial agriculture whereas natural fens have virtually disappeared in recent times.
Because mires, bogs and fens are wetland habitats with a high water content governing many ecological processes
that structure their characteristic communities, their hydrological balance is easily disturbed by increased drainage
caused by human activities. Furthermore, mire habitats have been widely destroyed or greatly altered in many
areas by the extraction of peat.
Mire habitats are defined as open, treeless wetlands with vegetation on accumulating peat and they were assessed
in the Red List under 13 types. Wooded mire types are included among Forest habitats, while calcareous fens in
dune slacks are included under Coastal types. Hydrological variation, regulated both by climate and local
catchment features, is the main factor driving differences between mire habitats, the distinction between rainfed
bogs and ground-water fed fens being a high-level separation. At a more detailed level, the habitat units reflect
variation in water chemistry (notably pH and calcium content) and degree of wetness and climatic and landscape
factors related to biogeographic zones. In addition to the existing hydrological and ecological conditions, mires are
also affected by their historical legacy of peat accumulation and vegetation succession and the impacts of
traditional land uses, like peat cutting, hay-making and grazing.
While their range extends over the whole of Europe, the main centre of distribution of mires at the present time is
in the boreal region of the Nordic countries where Finland and Sweden together contain 60% of the total area (over
89,000 km2) of reported mire habitats in EU28. Another significant concentration of mires lies in the Atlantic
regions of Ireland and the UK, where Blanket bog (D1.2) alone comprises ca. 27 % of the total mire area in the EU28.
Mires have unique species assemblages and they significantly enrich landscape-scale diversity in many areas. Most
species-rich mire complexes include a variety of rich and quaking fens that are at least moderately calcareous
habitats with high pH levels. Also, many mire habitats are characterised by patterns such as hummocks and pools
which add significantly to their diversity by providing microhabitats for specialised biota. In the more eastern and
southern European countries, mires and bogs contain many relict plant and animal species, surviving in small,
suitable areas since the Ice Ages.‘ (Janssen et al., 2016)
Assessment:
36
At EU28 level, 80% of all 15 wetlands habitats are threatened (CR, EN, VU) and 20 % are not threatened (NT,
LC)
At EU 27 level, 75% of habitat assessments of wetlands of Community interest are in unfavourable status
(bad & Inadequate) , 20% are in favourable status and 5 % unknown [calculated with the Structure and Fct
parameter]
More than 35% of all wetlands are included in the Natura 2000 network
Main pressures and threats:
Pressures on wetlands arising from land use and land use change in and around the wetland are due to a
combination of land management, fragmentation, , water resource management (i.e. drainage and regulation),
chemical and sediment pollution. Land-use changes have heavily declined the surface area of wetlands, and
particularly coastal wetlands over the last 40 years. Urbanization and expansion of agricultural land have occupied
wetland habitats and are affecting their ecosystem functioning through pollution and fragmentation. Finally,
climate change and invasive species are heavily affecting wetland habitats, due to changes in the hydrological and
ecological functioning.
‘Extraction of peat and conversion of natural mire habitats to productive agricultural and forestry land have been
the main reasons for the decline of mire habitats during recent and more long-term historic times and this decline is
still continuing. Peat extraction especially threatens mires on thick peats like Raised bog (D1.1), Blanket bog (D1.2)
and Aapa mire (D3.2) (see Figure 3.15).
Different types of human-induced changes in hydrological conditions threaten all mire habitat types: canalisation,
water re-direction and abstraction and construction of reservoirs. In Finland and to some extent other countries
too, drainage of mires aiming at conversion to productive forest areas is a land use with impacts over a wide
extent.
Eutrophication mainly due to nitrogen deposition is a common threat to many mire habitats in polluted areas and
increased droughts due to climate change are also widespread. These combine with the natural processes of mire
development to threaten existing communities via impacts on biocoenotic succession and changes in species
composition, though often these effects are hard to distinguish from one another. The situation can be made more
complex by local impacts like changes of grazing and mowing. Sometimes also increased pressure from
tourismrelated activities is reported.
Among northern mire habitats, Palsa mire (D3.1) is threatened by climate change and specifically by melting of the
necessary sporadic permafrost. This results in the loss of permafrost mounds or palsas, one of the main defining
features of the habitat (Figure 3.16). Climate change may threaten also the northern Aapa mire (D3.2) and Arctic
and alpine rich fen (D4.2).‘ (Janssen et al., 2016)
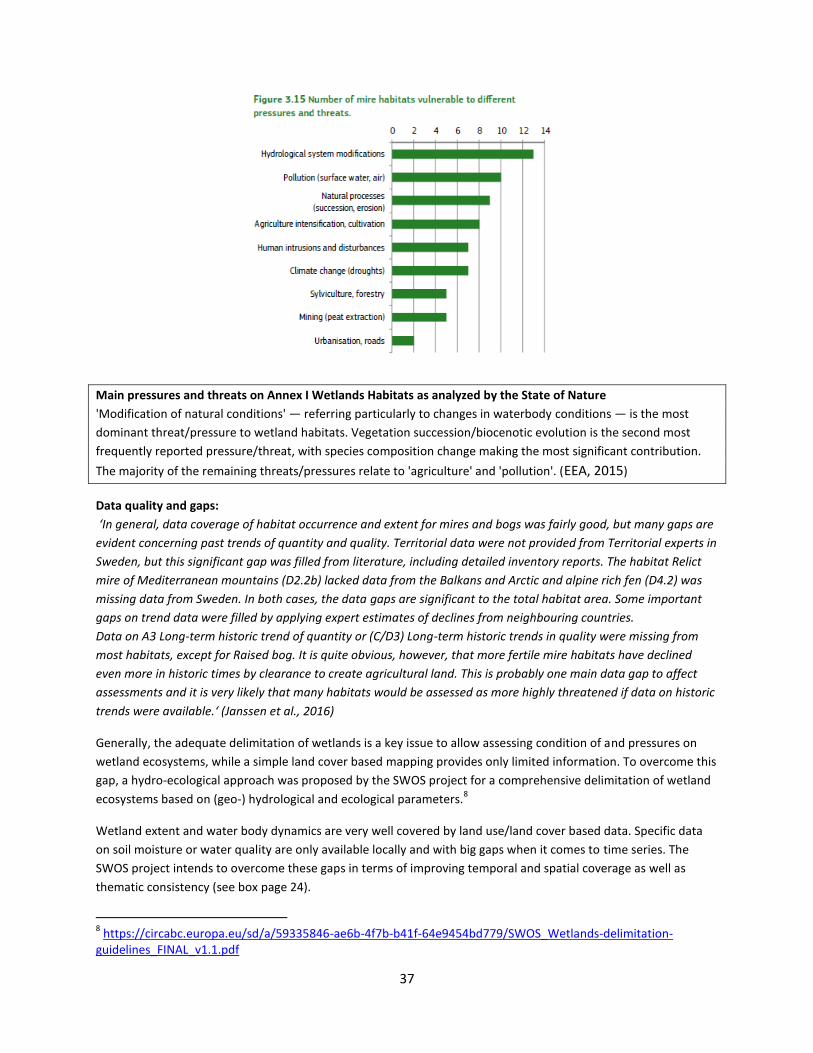
37
Main pressures and threats on Annex I Wetlands Habitats as analyzed by the State of Nature
'Modification of natural conditions' — referring particularly to changes in waterbody conditions — is the most
dominant threat/pressure to wetland habitats. Vegetation succession/biocenotic evolution is the second most
frequently reported pressure/threat, with species composition change making the most significant contribution.
The majority of the remaining threats/pressures relate to 'agriculture' and 'pollution'. (EEA, 2015)
Data quality and gaps:
‘In general, data coverage of habitat occurrence and extent for mires and bogs was fairly good, but many gaps are
evident concerning past trends of quantity and quality. Territorial data were not provided from Territorial experts in
Sweden, but this significant gap was filled from literature, including detailed inventory reports. The habitat Relict
mire of Mediterranean mountains (D2.2b) lacked data from the Balkans and Arctic and alpine rich fen (D4.2) was
missing data from Sweden. In both cases, the data gaps are significant to the total habitat area. Some important
gaps on trend data were filled by applying expert estimates of declines from neighbouring countries.
Data on A3 Long-term historic trend of quantity or (C/D3) Long-term historic trends in quality were missing from
most habitats, except for Raised bog. It is quite obvious, however, that more fertile mire habitats have declined
even more in historic times by clearance to create agricultural land. This is probably one main data gap to affect
assessments and it is very likely that many habitats would be assessed as more highly threatened if data on historic
trends were available.‘ (Janssen et al., 2016)
Generally, the adequate delimitation of wetlands is a key issue to allow assessing condition of and pressures on
wetland ecosystems, while a simple land cover based mapping provides only limited information. To overcome this
gap, a hydro-ecological approach was proposed by the SWOS project for a comprehensive delimitation of wetland
ecosystems based on (geo-) hydrological and ecological parameters.8
Wetland extent and water body dynamics are very well covered by land use/land cover based data. Specific data
on soil moisture or water quality are only available locally and with big gaps when it comes to time series. The
SWOS project intends to overcome these gaps in terms of improving temporal and spatial coverage as well as
thematic consistency (see box page 24).
8 https://circabc.europa.eu/sd/a/59335846-ae6b-4f7b-b41f-64e9454bd779/SWOS_Wetlands-delimitation-
guidelines_FINAL_v1.1.pdf
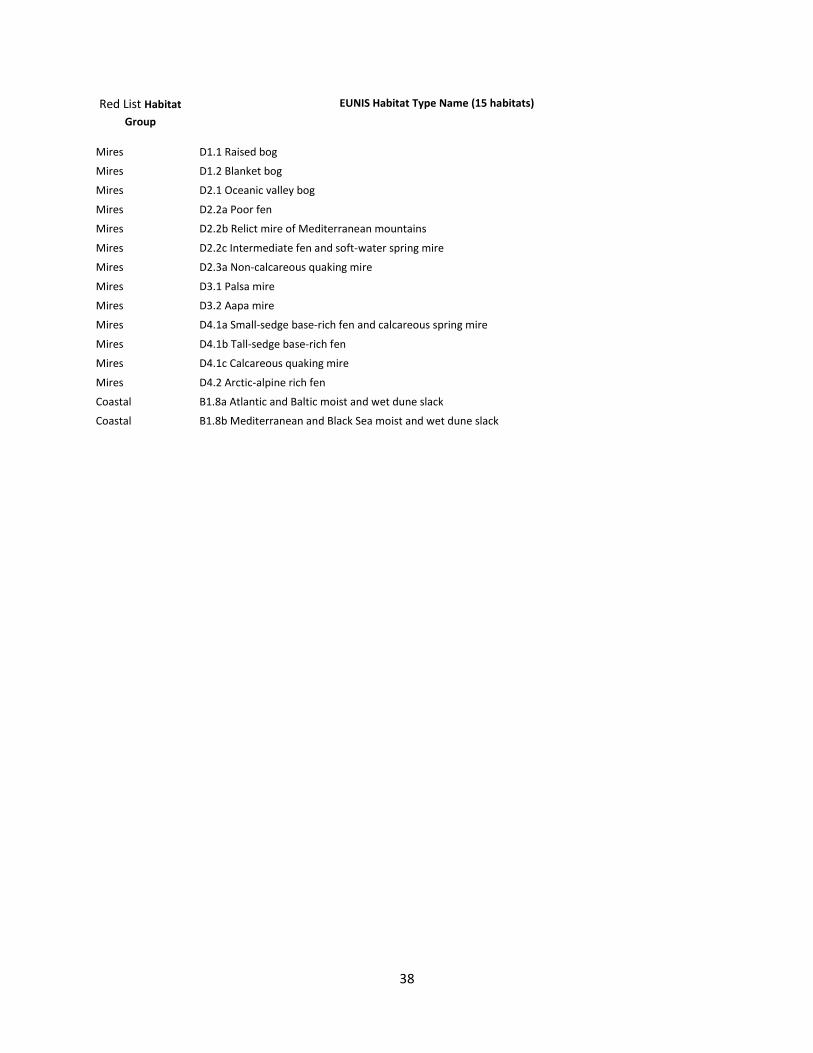
38
Red List Habitat
Group
EUNIS Habitat Type Name (15 habitats)
Mires D1.1 Raised bog
Mires D1.2 Blanket bog
Mires D2.1 Oceanic valley bog
Mires D2.2a Poor fen
Mires D2.2b Relict mire of Mediterranean mountains
Mires D2.2c Intermediate fen and soft-water spring mire
Mires D2.3a Non-calcareous quaking mire
Mires D3.1 Palsa mire
Mires D3.2 Aapa mire
Mires D4.1a Small-sedge base-rich fen and calcareous spring mire
Mires D4.1b Tall-sedge base-rich fen
Mires D4.1c Calcareous quaking mire
Mires D4.2 Arctic-alpine rich fen
Coastal B1.8a Atlantic and Baltic moist and wet dune slack
Coastal B1.8b Mediterranean and Black Sea moist and wet dune slack
39
The guidelines on Wetland ecosystem condition mapping developed by SWOS 9.provide a range of mapping
products that can be used as indicators of wetland ecosystem delimitation, delineation and wetland ecosystems’
health at different scales.
The mapping products are based on hydro-ecological parameters10
.They include an improved wetland ecosystem
nomenclature11
compatible with relevant classification systems such as the MAES, CLC, Ramsar, and FAO and
indicators including surface water dynamics, land use/land cover change and water quality derived from high
spatial and temporal resolution earth observation systems. The products can be used to assess distribution, health
and the major threats and pressures affecting wetland ecosystems. Additionally, the document provides an
overview of the wetland related ecosystem service indicators that have been developed so far in the framework of
SWOS. The indicator list under WETLANDS (Mires, Bogs & Fens) , includes all relevant data and indicator useful
and available for wetland ecosystem condition mapping.
The proposed modifications in nomenclature ( listed below) affect several ecosystem types by introducing
additional level 2 to level 4 MAES classes or changes in terminology used for the class names: - Croplands, a
separate subclass for ‘Rice fields ‘was created (former: irrigated land and rice fields);
- Forests, the Riparian Zone Copernicus project subdivision is adapted by integrating two subclasses at the fourth
level for alluvial and riparian forests and for swamp forests. In addition attributes for dune systems were
integrated corresponding to EUNIS B1.7;
- Grasslands, totally new approach is proposed following the EUNIS relevant classes which are based on wetness
conditions (Dry, Mesic and Wet);
- Heathland and scrub, new wetland classes were included to represent the wet part of this ecosystem;
- Sparsely vegetated land, a class for Littoral zone of lakes has been included as well as few changes in class
naming;
- Inland Wetlands: some class terminology was changed and attributes are proposed to be used to specify (i)
permanently flooded areas and (ii) seasonally /intermittently flooded areas;
- Lagoons, coastal wetlands and estuaries: class name modifications;
- Rivers and Lakes, subclasses follow the divisions made by the Riparian Zone Copernicus project but also new
classes are introduced; and
- Marine, two subclasses have been created to distinguish the deep from the shallow marine waters.
Even though these modifications will not be applicable for the current ecosystem condition mapping, since they
would impact the other MAES classes (as wetland ecosystems are transversal), it is envisaged to use this proposal
to progress towards a more advanced wetland ecosystem classification.
9 http://swos-service.eu/wp-content/uploads/2016/06/MAES_WetlandEcosystemCondition_v1.01.pdf
10 http://swos-service.eu/wp-content/uploads/2016/06/SWOS_Wetlands-delimitation-guidelines_FINAL_v1.1.pdf
11 http://swos-service.eu/wp-content/uploads/2017/05/SWOS_MAES-wetland-component-v1.2.pdf
40
GRASSLAND Source : European Red List of Habitats, 2016; 3rd MAES report, 2016; State of Nature report, 2015
version 04.04.2017
WARNING In the European Red list of Habitats, a type of Coastal ecosystem including terrestrial part is
considered with a different approach than the MAES Coastal ecosystem which excludes the terrestrial part.
Therefore, some recalculations have been done to include four habitats (originally attributed to coastal) under
Grasslands summing a total of 57 habitats.
Description:
‘The grasslands of Europe comprise (53+4) habitats dominated by diverse assemblages of grasses and other herbs,
sometimes with prominent contingents of bryophytes and lichens. They are widely distributed and extensive
through all the biogeographic regions of Europe and, across the lowlands and foothills, have generally been derived
originally by forest clearance. Maintained through grazing by stock and wild herbivores, mowing or burning, or
various combinations of these agricultural interventions, such grasslands have long been of enormous importance
to pastoral farming through the provision of forage and hay crops. Regional traditions of management were often
highly distinctive but these have now been widely abandoned. Where grasslands have shifted into very intensive
systems of grazing and silage production, the resulting species-poor habitats have been excluded from Red List
assessment.
Variation among lowland grasslands is mostly related to differences in regional climate, soil water content and soil
reaction (pH) and there are distinct groups of 25 Dry grasslands (E1), including swards on soils with heavy metals,
four Mesic grasslands (E2) and seven seasonally or permanently wet grasslands (E3). At higher altitudes, grasslands
extend above the tree-line, though can still be grazed and remain an integral part of pastoral systems. Variations
among the five types of Alpine and sub-alpine grasslands (E4) reflect differences in regional climate and soil
reaction and also include vegetated snow patches. The grassland group also includes six habitats dominated by tall
herbs and ferns occurring along woodland fringes (E5) in ungrazed habitats in the lowlands and on mountain slopes
and ledges, three types of herbaceous vegetation of inland salty habitats (E6), and three types of wooded pastures
and meadows (E7) which occur at landscape-scale.
Many of these grasslands are species-rich and even the more widely distributed types can include contingents of
rare or scarce plant species particular to the local or regional habitat conditions. More traditionally managed
grasslands included here are also often associated with distinctive local architecture, field patterns and customs, so
have high cultural interest.‘ (Janssen et al., 2016)
Assessment:
At EU28 level, 54% of all 57 grassland habitats are threatened (CR, EN, VU) and 46% are not threatened (NT,
LC)
At EU 27 level, 75 % of habitat assessments of grasslands of Community interest are in unfavourable status
(bad & Inadequate), 15% are in favourable status and 10% unknown [calculated with the Structure and Fct
parameter]
Less than 20 % of all grasslands are included in the Natura 2000 network
Main pressures and threats as analyzed by the EU Red list of Habitats
‘Two threats are especially important and widespread for these grassland habitats (Figure 3.20). First, particularly
for Mesic Grasslands (E2) and some Wet grasslands (E3), there is a complex of processes concerned with
agricultural improvement for more highly productive forms of intensive stock management, either outdoor grazing
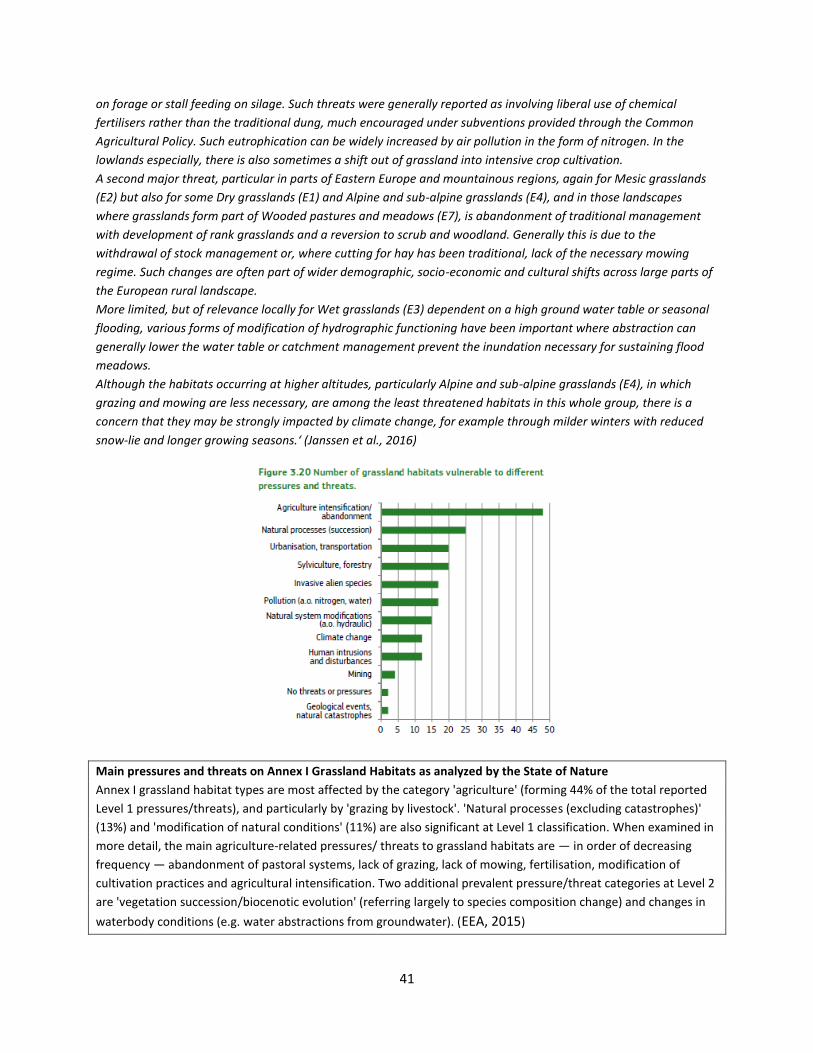
41
on forage or stall feeding on silage. Such threats were generally reported as involving liberal use of chemical
fertilisers rather than the traditional dung, much encouraged under subventions provided through the Common
Agricultural Policy. Such eutrophication can be widely increased by air pollution in the form of nitrogen. In the
lowlands especially, there is also sometimes a shift out of grassland into intensive crop cultivation.
A second major threat, particular in parts of Eastern Europe and mountainous regions, again for Mesic grasslands
(E2) but also for some Dry grasslands (E1) and Alpine and sub-alpine grasslands (E4), and in those landscapes
where grasslands form part of Wooded pastures and meadows (E7), is abandonment of traditional management
with development of rank grasslands and a reversion to scrub and woodland. Generally this is due to the
withdrawal of stock management or, where cutting for hay has been traditional, lack of the necessary mowing
regime. Such changes are often part of wider demographic, socio-economic and cultural shifts across large parts of
the European rural landscape.
More limited, but of relevance locally for Wet grasslands (E3) dependent on a high ground water table or seasonal
flooding, various forms of modification of hydrographic functioning have been important where abstraction can
generally lower the water table or catchment management prevent the inundation necessary for sustaining flood
meadows.
Although the habitats occurring at higher altitudes, particularly Alpine and sub-alpine grasslands (E4), in which
grazing and mowing are less necessary, are among the least threatened habitats in this whole group, there is a
concern that they may be strongly impacted by climate change, for example through milder winters with reduced
snow-lie and longer growing seasons.‘ (Janssen et al., 2016)
Main pressures and threats on Annex I Grassland Habitats as analyzed by the State of Nature
Annex I grassland habitat types are most affected by the category 'agriculture' (forming 44% of the total reported
Level 1 pressures/threats), and particularly by 'grazing by livestock'. 'Natural processes (excluding catastrophes)'
(13%) and 'modification of natural conditions' (11%) are also significant at Level 1 classification. When examined in
more detail, the main agriculture-related pressures/ threats to grassland habitats are — in order of decreasing
frequency — abandonment of pastoral systems, lack of grazing, lack of mowing, fertilisation, modification of
cultivation practices and agricultural intensification. Two additional prevalent pressure/threat categories at Level 2
are 'vegetation succession/biocenotic evolution' (referring largely to species composition change) and changes in
waterbody conditions (e.g. water abstractions from groundwater). (EEA, 2015)
42
Data quality and gaps: ‘Data for grassland types were in general very good, with the most territorial data reported
of all habitat groups. The major lack of data was from Sweden where some Grassland habitats are known to occur
and to be of a distinctive character. However, data from here seemed unlikely to elevate any further Grassland
types into the Endangered or Critically Endangered categories. Data on historic trends of quantity or quality,
particularly for the longer time frame, were often patchy and rarely based on any kind of detailed documentary
survey or map evidence for overall territories. Instead they were more usually based on more limited investigations
or expert judgement.‘ (Janssen et al., 2016)
EU Red List
Habitat Group EUNIS Habitat Type Name (57 habitats)
Grasslands E1.1a Pannonian and Pontic sandy steppe
Grasslands E1.1b Cryptogam- and annual-dominated vegetation on siliceous rock outcrops
Grasslands E1.1d Cryptogam- and annual-dominated vegetation on calcareous and ultramafic rock outcrops
Grasslands E1.1e Perennial rocky grassland of the Italian Peninsula
Grasslands E1.1g Perennial grassland on rocky outcrops at low altitudes in Central and Southeastern Europe
Grasslands E1.1h Heavy-metal dry grassland of the Balkans
Grasslands E1.1i Perennial rocky calcareous grassland of subatlantic-submediterranean Europe
Grasslands E1.1j Dry steppic, submediterranean pasture of South-Eastern Europe
Grasslands E1.2a Semi-dry perennial calcareous grassland
Grasslands E1.2b Continental dry steppe
Grasslands E1.3a Mediterranean closely grazed dry grassland
Grasslands E1.3b Mediterranean tall perennial dry grassland
Grasslands E1.3c Mediterranean annual-rich dry grassland
Grasslands E1.5a Iberian oromediterranean siliceous dry grassland
Grasslands E1.5b Iberian oromediterranean basiphilous dry grassland
Grasslands E1.5c Cyrno-Sardean oromediterranean siliceous dry grassland
Grasslands E1.5d Greek and Anatolian oromediterranean siliceous dry grassland
Grasslands E1.5e Madeiran oromediterranean siliceous dry grassland
Grasslands E1.7 Lowland to submontane, dry to mesic Nardus grassland
Grasslands E1.8 Open Iberian supramediterranean dry acid and neutral grassland
Grasslands E1.9a Oceanic to subcontinental inland sand grassland on dry acid and neutral soils
Grasslands E1.9b Inland sanddrift and dune with siliceous grassland
Grasslands E1.A Mediterranean to Atlantic open, dry, acid and neutral grassland
Grasslands E1.B Heavy-metal grassland of western and central Europe
Grasslands E1.F Azorean open dry, acid to neutral grassland
Grasslands E2.1a Mesic permanent pasture of lowlands and mountains
Grasslands E2.2 Low and medium altitude hay meadow
Grasslands E2.3 Mountain hay meadow
Grasslands E2.4 Iberian summer pasture (vallicar)
Grasslands E3.1a Mediterranean tall humid inland grassland
Grasslands E3.2a Mediterranean short moist grassland of lowlands
Grasslands E3.2b Mediterranean short moist grassland of mountains
Grasslands E3.3 Submediterranean moist meadow
Grasslands E3.4a Moist or wet mesotrophic to eutrophic hay meadow
43
EU Red List
Habitat Group EUNIS Habitat Type Name (57 habitats)
Grasslands E3.4b Moist or wet mesotrophic to eutrophic pasture
Grasslands E3.5 Temperate and boreal moist or wet oligotrophic grassland
Grasslands E4.1 Vegetated snow patch
Grasslands E4.3a Boreal and arctic acidophilous alpine grassland
Grasslands E4.3b Temperate acidophilous alpine grassland
Grasslands E4.4a Arctic-alpine calcareous grassland
Grasslands E4.4b Alpine and subalpine calcareous grassland of the Balkan and Apennines
Grasslands E5.2a Thermophile woodland fringe of base-rich soils
Grasslands E5.2b Thermophile woodland fringe of acidic soils
Grasslands E5.2c Macaronesian thermophilous woodland fringe
Grasslands E5.3 Pteridium aquilinum stand
Grasslands E5.4 Lowland moist or wet tall-herb and fern fringe
Grasslands E5.5 Subalpine moist or wet tall-herb and fern fringe
Grasslands E6.1Mediterranean inland salt steppe
Grasslands E6.2 Continental inland salt steppe
Grasslands E6.3 Temperate inland salt marsh
Grasslands E7.1 Temperate wooded pasture and meadow
Grasslands E7.2 Hemiboreal and boreal wooded pasture and meadow
Grasslands E7.3 Mediterranean wooded pasture and meadow
Coastal B1.4a Atlantic and Baltic coastal dune grassland (grey dune)
Coastal B1.4b Mediterranean and Macaronesian coastal dune grassland (grey dune)
Coastal B1.4c Black Sea coastal dune grassland (grey dune)
Coastal B1.9 Machair
44
FOREST Source : European Red List of Habitats, 2016; 3rd MAES report, 2016; State of Nature report, 2015
version 04.04.2017
WARNING In the European Red list of Habitats, a type of Coastal ecosystem including terrestrial part is
considered with a different approach than the MAES Coastal ecosystem which excludes the terrestrial part. .
Therefore, some recalculations have been done to include four habitats (originally attributed to coastal) under
Forests summing a total of 46 habitats.
Description:
‘The Forests of Europe comprise (42+4) habitats, most of them widely distributed over several biogeographical
regions. Many types form the potential natural vegetation of their distribution range, such as Fagus sylvatica
woodlands in central Europe, different Quercus woodlands in the Mediterranean Region or coniferous woodlands
and taiga in northern Europe. By contrast, among the broadleaved deciduous woodlands, riparian woodlands occur
only azonally, in more or less linear form along smaller or bigger river systems with different types in temperate,
boreal and Mediterranean regions. Azonal bog and swamp woodland types are also closely linked to a special
hydrology and occur patchily, often in small stands but over a large range, depending on climate and local
conditions. A few types have a very restricted distribution, like the South Aegean and Canarian Phoenix groves
(G2.5a, G2.5b), Macaronesian laurophyllous woodland (G2.3) and the subendemic Alnus cordata woodlands (G1.Ba)
found only in Corsica and Southern Italy. In several parts of Europe in historic times or even still today, sylvipastoral
systems are a particular kind of landscape management with specific structure and a very high biodiversity, but
such wooded pastures and meadows are included in the Red List among the Grassland habitats.
The widespread woodland types with a relatively closed canopy are usually dominated by one or only few tree
species. The herb layer is highly dependent on soil, hydrology and climatic conditions, being generally more species-
rich in calcareous conditions and in woodland types in dry situations or with a more open canopy. Nevertheless,
there is also a wide geographic variation among many woodland types, often with a number of sub-types of more
restricted distribution, which may have different levels of threat. Woodlands are home to a very large proportion of
European biodiversity, including tens of thousands of invertebrate-species, many fungi and a large number of birds
that are dependent on a tree cover.
Although woodlands are often considered as more natural vegetation, virgin and pristine examples actually exist
only in small remnants and a long history of different use has left its traces on many of these habitats, making them
also a rich cultural heritage. These cultural modifications to some extent replace the natural dynamics of wind
throw, fire, and breakdown of senescent trees in the canopy or other natural disturbance regimes and allow a
substantial proportion of invertebrate species which need this patchy mosaic for their life cycle to survive in small
relict populations. Commercial forestry, by contrast, removes 2/3 or more of the natural life of trees, senescent
trees or dead wood being a minor feature in many stands.
At higher altitudes, specific mountain woodland types constitute the upper limit of tree growth, often with a
coniferous canopy (as in habitats G3.1a, G3.1b, G3.1c, G3.2). In several mountain ranges, however, deciduous
woodland types can also form the upper limit and all higher mountain woodlands can have a diverse herb layer
characterised by species growing only at these higher altitudes, often including a considerable number of striking
tall herbs. Woodland habitats occur not only as dense tree stands, but also include all developmental phases and,
due to natural or anthropogenic modifications, woodland margins and the herb vegetation of canopy gaps. Herb
fringes and margins with distinct shrub vegetation can be considered as an integral structural part of these habitats,
though they are included in the Red List among the Grasslands (as E5.2). Natural woodland borders, where tree
growth is less vigorous, or where patchy mosaics with fringes or grassland vegetation exist, such as thermophilous
forest, steppic forests and ravine forests, are especially species-rich.‘ (Janssen et al., 2016)
45
Assessment:
At EU28 level, 30% of all 46 forests habitats are threatened (CR, EN, VU) and 67% are not threatened (NT, LC)
At EU 27 level, 71% of habitat assessments of forests of Community interest are in unfavourable status (bad
& Inadequate), 22% are in favourable status and 7 % unknown [calculated with the Structure and Fct
parameter]
More than 20% of all forests are included in the Natura 2000 network
Main pressures and threats:
‘The major threats to most woodland habitats are linked with forestry (Figure 3.27): removal of dead and dying
trees, missing deadwood and missing continuity of deadwood and senescent trees, the creation of even-aged stand
structure, lack of natural stand dynamics, and removal of undergrowth. In some woodland habitats, at least
regionally, clearance as such is also still a threat. Overgrazing by sheep and goats can also be a major threat,
especially in several Mediterranean woodland types, for example Olea europaea-Ceratonia siliqua woodland (G2.4),
and in Macaronesian types. But also in northern Europe, for example in Fennoscandia or Latvia, overgrazing by
reindeer is an important threat to taiga woodlands.
For all woodland types dependent on a special hydrology, such as bog and swamp woodland types, riverine
woodlands, and Phoenix palm groves, anthropogenic changes in hydrology are a major threat. For bog woodlands,
peat-cutting is also still a danger and, for the riverine woodland types, major threats are canalisation and water
deviation, lack of flooding, hydropower and weirs and pollution of surface water – many of these connected with
intensive agriculture, for example in former alluvial plains.
For many woodland habitats, fragmentation and anthropogenic loss of habitat connectivity is an additional threat
in greater or smaller parts of their range or regionally. Airborne nitrogen input and pollution such as acid rain are
major threats mainly to naturally nutrient-poor woodlands, and climate change becomes a more and more
important threat to many mountain types and Nordic boreal woodlands, but will also induce changes in dry and
thermophilous forest habitats.
For several woodland habitats, the absence of natural fire dynamics is a threat, for example in northern taiga, while
anthropogenic burning with destruction or modification in species composition endangers a number of
Mediterranean and Macaronesian woodland types.‘ (Janssen et al., 2016)
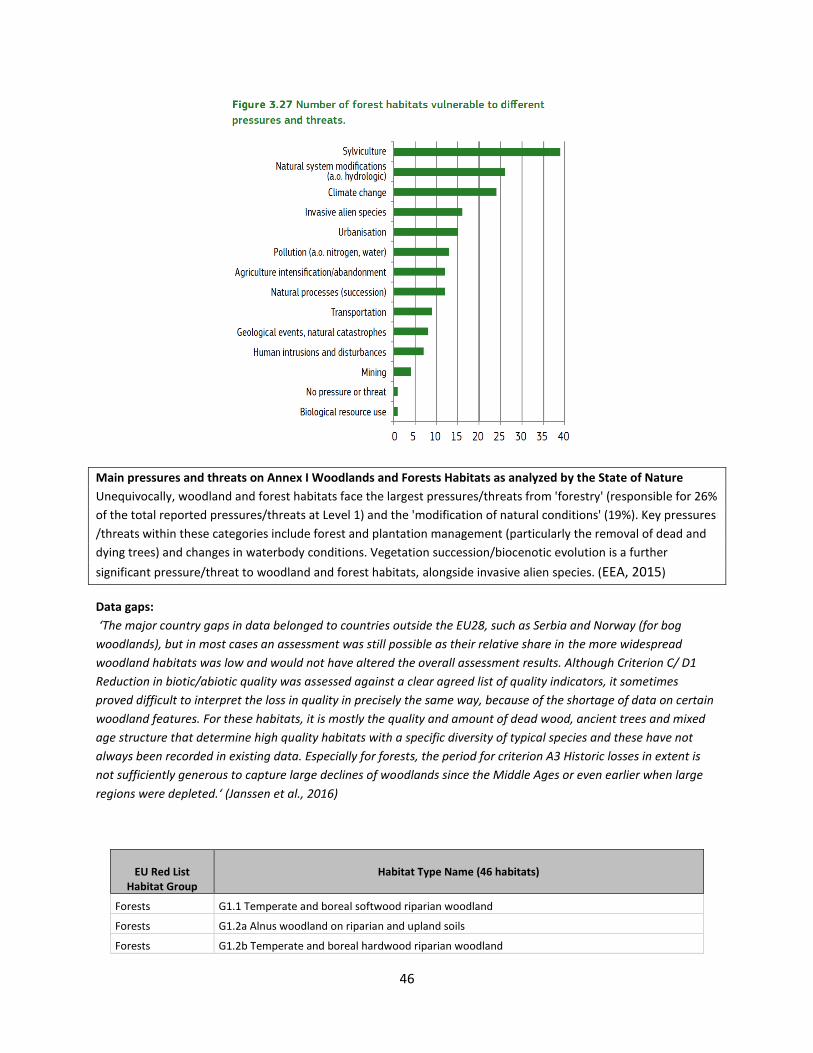
46
Main pressures and threats on Annex I Woodlands and Forests Habitats as analyzed by the State of Nature
Unequivocally, woodland and forest habitats face the largest pressures/threats from 'forestry' (responsible for 26%
of the total reported pressures/threats at Level 1) and the 'modification of natural conditions' (19%). Key pressures
/threats within these categories include forest and plantation management (particularly the removal of dead and
dying trees) and changes in waterbody conditions. Vegetation succession/biocenotic evolution is a further
significant pressure/threat to woodland and forest habitats, alongside invasive alien species. (EEA, 2015)
Data gaps:
‘The major country gaps in data belonged to countries outside the EU28, such as Serbia and Norway (for bog
woodlands), but in most cases an assessment was still possible as their relative share in the more widespread
woodland habitats was low and would not have altered the overall assessment results. Although Criterion C/ D1
Reduction in biotic/abiotic quality was assessed against a clear agreed list of quality indicators, it sometimes
proved difficult to interpret the loss in quality in precisely the same way, because of the shortage of data on certain
woodland features. For these habitats, it is mostly the quality and amount of dead wood, ancient trees and mixed
age structure that determine high quality habitats with a specific diversity of typical species and these have not
always been recorded in existing data. Especially for forests, the period for criterion A3 Historic losses in extent is
not sufficiently generous to capture large declines of woodlands since the Middle Ages or even earlier when large
regions were depleted.‘ (Janssen et al., 2016)
EU Red List
Habitat Group Habitat Type Name (46 habitats)
Forests G1.1 Temperate and boreal softwood riparian woodland
Forests G1.2a Alnus woodland on riparian and upland soils
Forests G1.2b Temperate and boreal hardwood riparian woodland
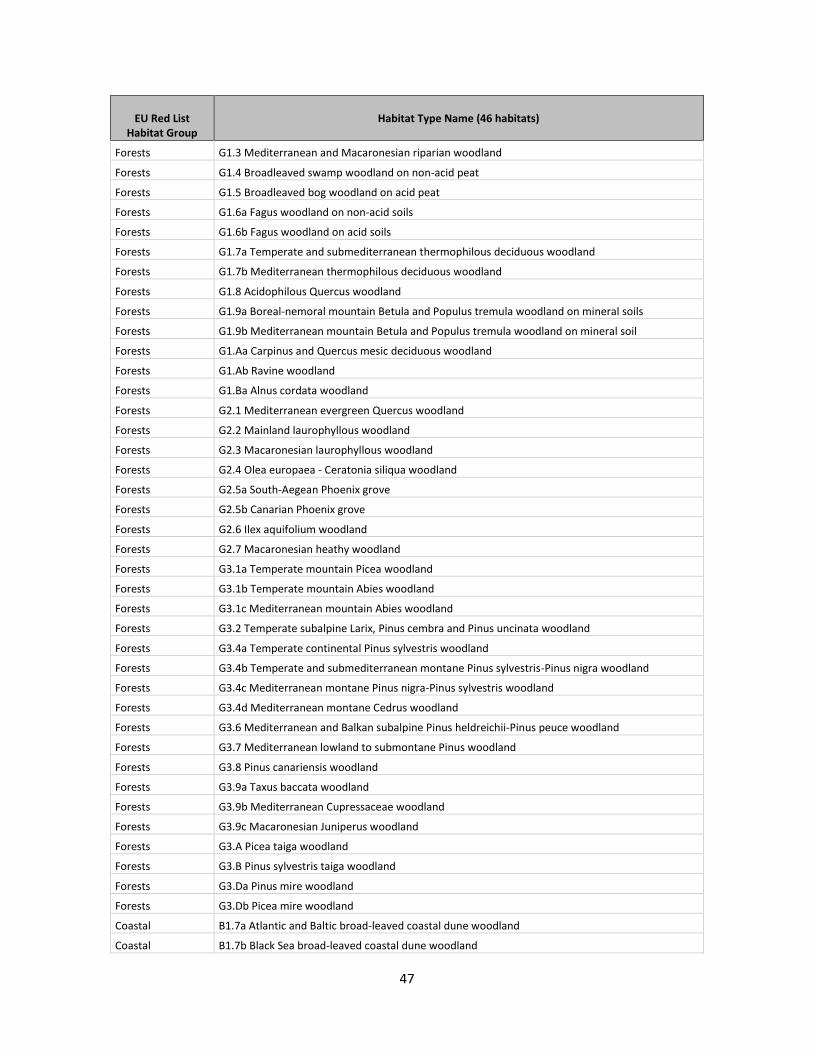
47
EU Red List
Habitat Group Habitat Type Name (46 habitats)
Forests G1.3 Mediterranean and Macaronesian riparian woodland
Forests G1.4 Broadleaved swamp woodland on non-acid peat
Forests G1.5 Broadleaved bog woodland on acid peat
Forests G1.6a Fagus woodland on non-acid soils
Forests G1.6b Fagus woodland on acid soils
Forests G1.7a Temperate and submediterranean thermophilous deciduous woodland
Forests G1.7b Mediterranean thermophilous deciduous woodland
Forests G1.8 Acidophilous Quercus woodland
Forests G1.9a Boreal-nemoral mountain Betula and Populus tremula woodland on mineral soils
Forests G1.9b Mediterranean mountain Betula and Populus tremula woodland on mineral soil
Forests G1.Aa Carpinus and Quercus mesic deciduous woodland
Forests G1.Ab Ravine woodland
Forests G1.Ba Alnus cordata woodland
Forests G2.1 Mediterranean evergreen Quercus woodland
Forests G2.2 Mainland laurophyllous woodland
Forests G2.3 Macaronesian laurophyllous woodland
Forests G2.4 Olea europaea - Ceratonia siliqua woodland
Forests G2.5a South-Aegean Phoenix grove
Forests G2.5b Canarian Phoenix grove
Forests G2.6 Ilex aquifolium woodland
Forests G2.7 Macaronesian heathy woodland
Forests G3.1a Temperate mountain Picea woodland
Forests G3.1b Temperate mountain Abies woodland
Forests G3.1c Mediterranean mountain Abies woodland
Forests G3.2 Temperate subalpine Larix, Pinus cembra and Pinus uncinata woodland
Forests G3.4a Temperate continental Pinus sylvestris woodland
Forests G3.4b Temperate and submediterranean montane Pinus sylvestris-Pinus nigra woodland
Forests G3.4c Mediterranean montane Pinus nigra-Pinus sylvestris woodland
Forests G3.4d Mediterranean montane Cedrus woodland
Forests G3.6 Mediterranean and Balkan subalpine Pinus heldreichii-Pinus peuce woodland
Forests G3.7 Mediterranean lowland to submontane Pinus woodland
Forests G3.8 Pinus canariensis woodland
Forests G3.9a Taxus baccata woodland
Forests G3.9b Mediterranean Cupressaceae woodland
Forests G3.9c Macaronesian Juniperus woodland
Forests G3.A Picea taiga woodland
Forests G3.B Pinus sylvestris taiga woodland
Forests G3.Da Pinus mire woodland
Forests G3.Db Picea mire woodland
Coastal B1.7a Atlantic and Baltic broad-leaved coastal dune woodland
Coastal B1.7b Black Sea broad-leaved coastal dune woodland
48
Freshwater ecosystems12
1. Introduction
1.1 Objectives
Target 2 of the EU Biodiversity Strategy to 2020 (COM(2011) 244) requires that “by 2020 ecosystems and their services are maintained and enhanced by establishing green infrastructure and restoring at least 15 % of degraded ecosystems”.
The objective of the MAES workshop organized on 27-28 June 2017 in Brussels was to develop a common understanding of the analytical framework to be used for assessing ecosystem condition, including relevant indicators, to support Target 2.
Establishing a common definition of ecosystem condition and suitable indicators per type of ecosystem is necessary to measure the restoration of degraded ecosystems from the adoption of the Biodiversity Strategy (in 2011) to 2020 (i.e. measure the progress towards the achievement of Target 2). At the same time, it is essential to understand the relationship between the ecosystem condition and the delivery of services, in order to assess whether ecosystems services are maintained and enhanced.
The purpose of the current MAES freshwater ecosystem type, in coordination with the other MAES ecosystem types, is to develop a common approach for assessing conditions of freshwater ecosystems at EU and Member State level. In this document we provide a proposal and background information to support the discussion.
1.2 EU Biodiversity Strategy and EU water policy
To streamline the assessment of Target 2 for freshwater ecosystems, synergies between the EU Biodiversity Strategy and the EU water policy can be used, especially regarding objectives, definition of condition of freshwater ecosystems, identification of indicators, and data collection and reporting. Figure 1 shows the timeline of implementation of the EU Biodiversity Strategy and the Water Framework Directive (WFD 2000/60/EC).
After its adoption in 2011, the EU Biodiversity Strategy has recently been reviewed (COM(2015) 0478 final) to check the progress towards targets achievement. The accomplishment of the policy goals will be assessed again in 2019, as 2020 is the final deadline for meeting the objectives. Year 2020 is also the deadline to meet the SDG 6.6 “Protect and restore water-related ecosystems” and SDG 15.1 “Ensure the conservation, restoration and sustainable use of terrestrial and inland freshwater and their services”.
The WFD, which entered into force in 2000, aims at achieving a good ecological status for all EU rivers, lakes, groundwater, transitional and coastal waters by 2015. Furthermore it requires the establishment of a register(s) of all protected areas within each river basin district, demanding protection of their surface water and groundwater or conservation of habitats and species directly depending on water. Extensions of this deadline to 2021 or 2027 are foreseen in case of limitations imposed by technical feasibility of improvements, natural conditions, or disproportionate costs. The WFD envisages three management cycles of 6 years each. For each river basin district in their territory, Member States
12 Prepared by Bruna Grizzetti (JRC), Camino Liquete (ENV), Ana Cristina Cardoso (JRC), Francesca Somma (JRC),
Markus Erhard (EEA)
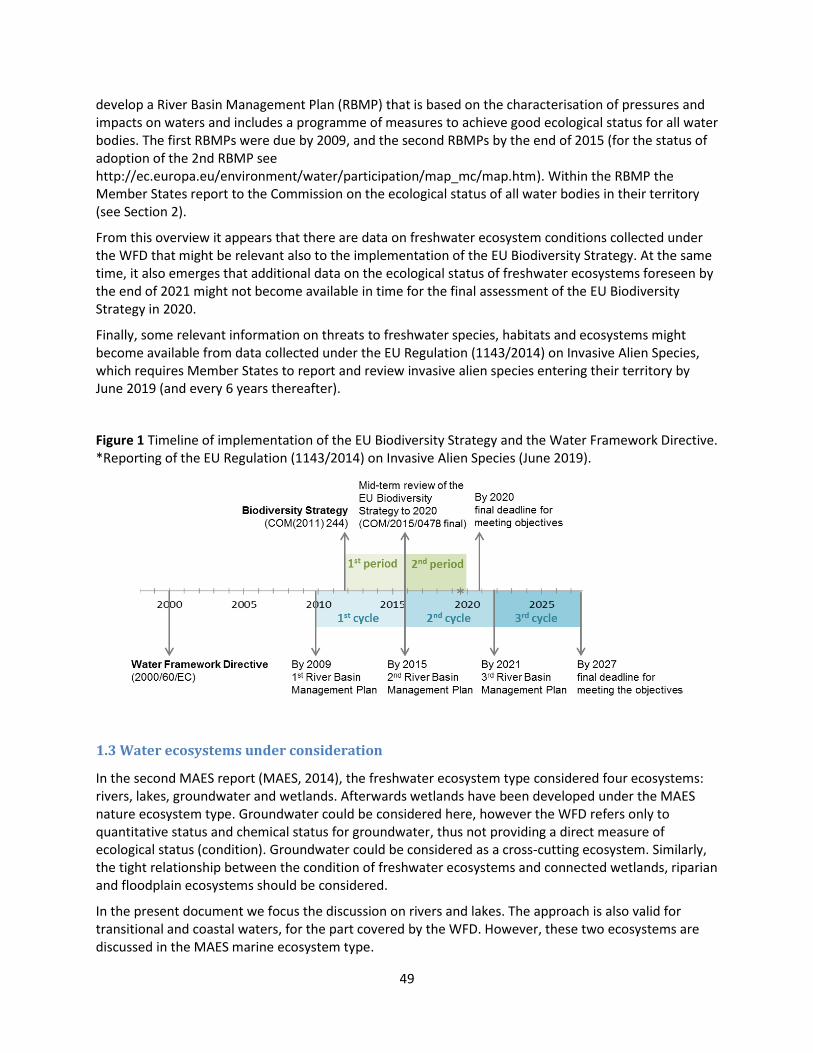
49
develop a River Basin Management Plan (RBMP) that is based on the characterisation of pressures and impacts on waters and includes a programme of measures to achieve good ecological status for all water bodies. The first RBMPs were due by 2009, and the second RBMPs by the end of 2015 (for the status of adoption of the 2nd RBMP see http://ec.europa.eu/environment/water/participation/map_mc/map.htm). Within the RBMP the Member States report to the Commission on the ecological status of all water bodies in their territory (see Section 2).
From this overview it appears that there are data on freshwater ecosystem conditions collected under the WFD that might be relevant also to the implementation of the EU Biodiversity Strategy. At the same time, it also emerges that additional data on the ecological status of freshwater ecosystems foreseen by the end of 2021 might not become available in time for the final assessment of the EU Biodiversity Strategy in 2020.
Finally, some relevant information on threats to freshwater species, habitats and ecosystems might become available from data collected under the EU Regulation (1143/2014) on Invasive Alien Species, which requires Member States to report and review invasive alien species entering their territory by June 2019 (and every 6 years thereafter).
Figure 1 Timeline of implementation of the EU Biodiversity Strategy and the Water Framework Directive. *Reporting of the EU Regulation (1143/2014) on Invasive Alien Species (June 2019).
1.3 Water ecosystems under consideration
In the second MAES report (MAES, 2014), the freshwater ecosystem type considered four ecosystems: rivers, lakes, groundwater and wetlands. Afterwards wetlands have been developed under the MAES nature ecosystem type. Groundwater could be considered here, however the WFD refers only to quantitative status and chemical status for groundwater, thus not providing a direct measure of ecological status (condition). Groundwater could be considered as a cross-cutting ecosystem. Similarly, the tight relationship between the condition of freshwater ecosystems and connected wetlands, riparian and floodplain ecosystems should be considered.
In the present document we focus the discussion on rivers and lakes. The approach is also valid for transitional and coastal waters, for the part covered by the WFD. However, these two ecosystems are discussed in the MAES marine ecosystem type.
50
2. Definition ecosystem conditions (freshwater ecosystems)
According to the Millennium Ecosystem Assessment (MA, 2005) ecosystem condition is the capacity of an ecosystem to yield services, relative to its potential capacity. For the purpose of MAES, ecosystem condition is usually used as a synonym for ‘ecosystem state’ (MAES, 2014). Ecosystem state is defined as the physical, chemical and biological condition of an ecosystem at a particular point in time (MAES, 2013). The term ecosystem status is used in the EU environmental legislation to indicate a classification of ecosystem state among several well-defined categories. It is usually measured against time and compared to an agreed target in EU environmental directives (e.g. HD, WFD, MSFD) (MAES, 2013).
For the purpose of the EU Biodiversity Strategy the definition and classification of ecological status provided by the WFD could be adopted to describe the condition of freshwater ecosystems (see Box 1 for the definitions provided in the WFD Article 2). According to the WFD the ecological status “is an expression of the quality of the structure and functioning of aquatic ecosystems associated with surface waters”
The ecological status is expressed in five classes: high, good, moderate, poor and bad. It is quantified per single water body using biological assessment methods, considering biological quality elements (BQEs, that are phytoplankton, flora, invertebrate fauna and fish fauna), and information on physico-chemical and hydromorphological conditions (the list of quality elements is provided in Annex 1). Rivers, lakes, transitional waters, and coastal waters are in good condition if they are classified as having at least good ecological status.
The ecological status is quantified by each Member State through national assessment methods. The methods were intercalibrated, to assure the coherence of the classification across EU countries (Birk et al. 2012, Poikane et al. 2015, Poikane et al. 2016). Despite the variability in approaches across the EU, that reduces the methodological consistency, the ecological status reported under the WFD provides a homogeneous and consistent assessment of the conditions of freshwater ecosystems at the European, national and river basin scale. In addition, both structural and functional aspects are embedded in its definition.
Shortcomings in the use of the data reported under the WFD to the purposes of the Biodiversity Strategy may derive from: 1) missing information in the data reported under the first and second RBMPs (for example no consistent water body delineation at the European scale is available for the data reported in the first cycle, but this might not be the case within national river basins); 2) data from both first and second cycles might not be available for each water body, also because of changes in the methodology for water bodies delineation, hampering the analysis of trends; 3) data from the third RBMPs will not become available in time for their inclusion the assessment of trends in ecosystem restoration for the Biodiversity Strategy.
Box 1 Definitions provided by the Water Framework Directive (2000/60/EC Article 2). *The quality elements for the classification of ecological status of surface water established in the Annex V of the WFD are reported in Annex 1 of this document.
Ecological status is an expression of the quality of the structure and functioning of aquatic ecosystems associated
with surface waters, classified in accordance with Annex V*.
Surface water status is the general expression of the status of a body of surface water, determined by the poorer of
its ecological status and its chemical status.
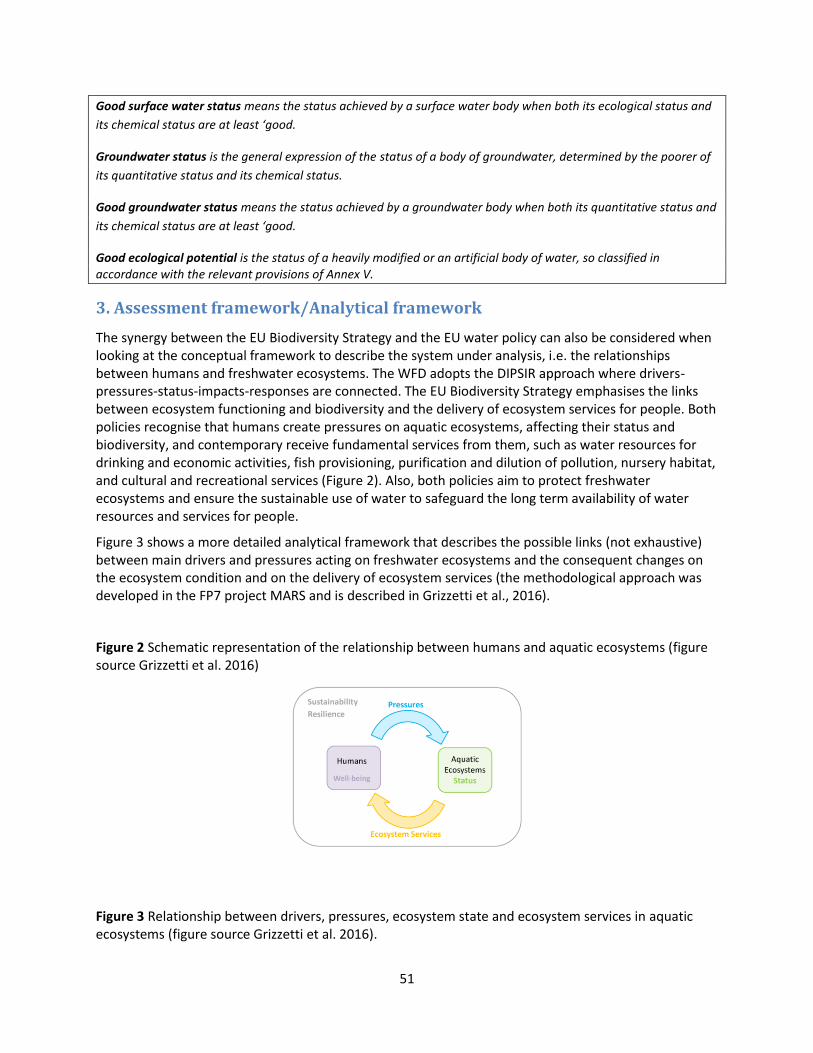
51
Good surface water status means the status achieved by a surface water body when both its ecological status and
its chemical status are at least ‘good.
Groundwater status is the general expression of the status of a body of groundwater, determined by the poorer of
its quantitative status and its chemical status.
Good groundwater status means the status achieved by a groundwater body when both its quantitative status and
its chemical status are at least ‘good.
Good ecological potential is the status of a heavily modified or an artificial body of water, so classified in accordance with the relevant provisions of Annex V.
3. Assessment framework/Analytical framework
The synergy between the EU Biodiversity Strategy and the EU water policy can also be considered when looking at the conceptual framework to describe the system under analysis, i.e. the relationships between humans and freshwater ecosystems. The WFD adopts the DIPSIR approach where drivers-pressures-status-impacts-responses are connected. The EU Biodiversity Strategy emphasises the links between ecosystem functioning and biodiversity and the delivery of ecosystem services for people. Both policies recognise that humans create pressures on aquatic ecosystems, affecting their status and biodiversity, and contemporary receive fundamental services from them, such as water resources for drinking and economic activities, fish provisioning, purification and dilution of pollution, nursery habitat, and cultural and recreational services (Figure 2). Also, both policies aim to protect freshwater ecosystems and ensure the sustainable use of water to safeguard the long term availability of water resources and services for people.
Figure 3 shows a more detailed analytical framework that describes the possible links (not exhaustive) between main drivers and pressures acting on freshwater ecosystems and the consequent changes on the ecosystem condition and on the delivery of ecosystem services (the methodological approach was developed in the FP7 project MARS and is described in Grizzetti et al., 2016).
Figure 2 Schematic representation of the relationship between humans and aquatic ecosystems (figure source Grizzetti et al. 2016)
Figure 3 Relationship between drivers, pressures, ecosystem state and ecosystem services in aquatic ecosystems (figure source Grizzetti et al. 2016).
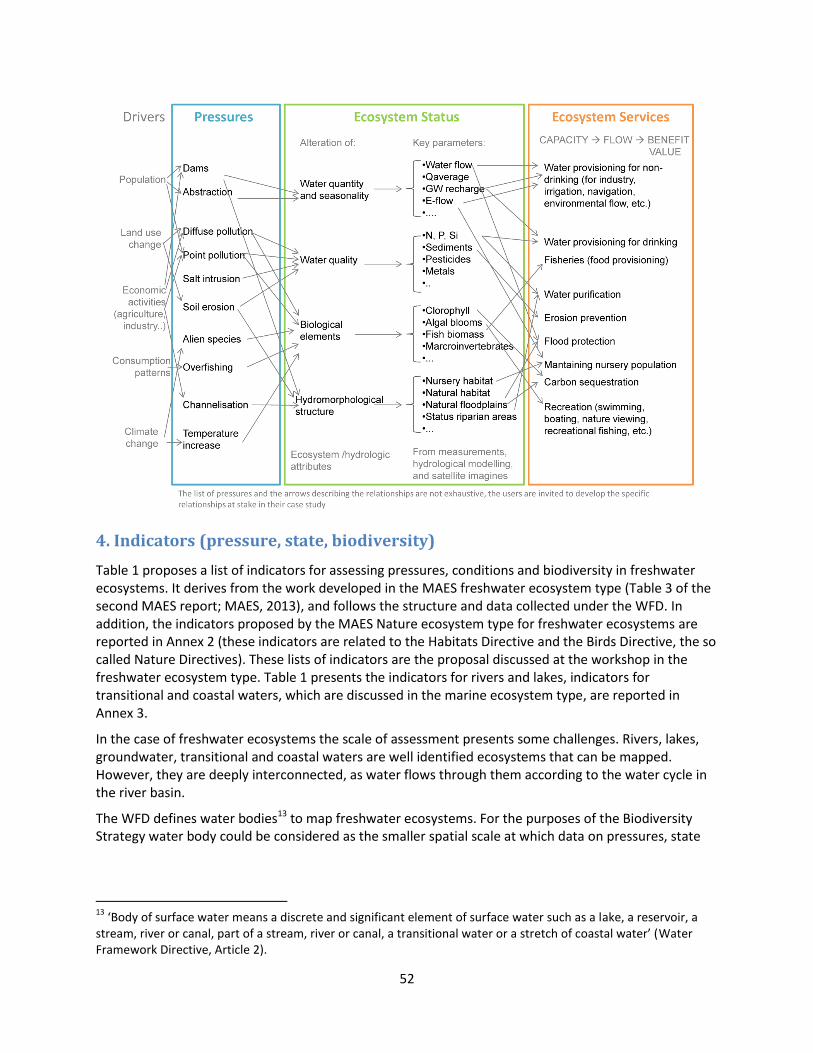
52
4. Indicators (pressure, state, biodiversity)
Table 1 proposes a list of indicators for assessing pressures, conditions and biodiversity in freshwater ecosystems. It derives from the work developed in the MAES freshwater ecosystem type (Table 3 of the second MAES report; MAES, 2013), and follows the structure and data collected under the WFD. In addition, the indicators proposed by the MAES Nature ecosystem type for freshwater ecosystems are reported in Annex 2 (these indicators are related to the Habitats Directive and the Birds Directive, the so called Nature Directives). These lists of indicators are the proposal discussed at the workshop in the freshwater ecosystem type. Table 1 presents the indicators for rivers and lakes, indicators for transitional and coastal waters, which are discussed in the marine ecosystem type, are reported in Annex 3.
In the case of freshwater ecosystems the scale of assessment presents some challenges. Rivers, lakes, groundwater, transitional and coastal waters are well identified ecosystems that can be mapped. However, they are deeply interconnected, as water flows through them according to the water cycle in the river basin.
The WFD defines water bodies13 to map freshwater ecosystems. For the purposes of the Biodiversity Strategy water body could be considered as the smaller spatial scale at which data on pressures, state
13
‘Body of surface water means a discrete and significant element of surface water such as a lake, a reservoir, a stream, river or canal, part of a stream, river or canal, a transitional water or a stretch of coastal water’ (Water Framework Directive, Article 2).
53
and biodiversity can be collected. The other relevant spatial scale for freshwater ecosystems is the river basin14 (or sub-basins), which identifies the area where the freshwater ecosystems are interconnected.
For assessment at the European or national scale, it is important to notice that spatial data on pressures are generally available by administrative units (NUTS0, NUTS1, NUTS2, which correspond to national and regional administrative units), and their allocation per river basin or water body might be challenging.
4.1 Pressure indicators
Under the WFD Member States collect and maintain information on the type and magnitude of the significant anthropogenic pressures on surface water bodies in each river basin district. The pressures include: point and diffuse sources of pollution; water abstractions; water flow regulations; morphological alterations to water bodies; and land use patterns. In the WFD Reporting Guidance 201615 detailed lists of pressure types (Annex 1a of the Guidance) and drivers (Annex 1c of the Guidance) are provided. A simplified list of drivers and pressures is also reported in Figure 3.
For the discussion in the MAES freshwater ecosystem type we proposed a number of indicators of pressures that can be computed at the European scale, at the spatial resolution of small catchments (see Pistocchi et al. 2015; 2017; Grizzetti et al. 2017a). The indicators of pressures cover alterations of water quantity, water quality, habitat and biota (Table 1).
4.2 State indicators
As indicator of condition of freshwater ecosystems, specifically rivers and lakes, we propose to use the ecological status reported under the WFD (Table 1). An analysis of the relationship between indicators of multiple pressures estimated at the European scale and the ecological status reported by the Member States is described by Grizzetti et al. (2017a).
4.3 Biodiversity indicators
For the assessment of the water bodies ecological status Member States collect data on the biological quality elements: 1) composition, abundance and biomass of phytoplankton, 2) composition and abundance of other aquatic flora, 3) composition and abundance of benthic invertebrate fauna, 4) composition, abundance and age structure of fish fauna. These indicators can be used to describe the biodiversity of the freshwater ecosystems (Table 1). However, it is important to note that these data are collected at the country level, but their reporting is not mandatory for the implementation of the WFD.
An additional indicator relevant for biodiversity could be the presence and trends of invasive alien species of concern. This information will be collected and reported by Member States by June 2019 under the EU Regulation (1143/2014) on Invasive Alien Species. Annex 4 provides the list of invasive alien species of Union concern for freshwater ecosystems that is currently adopted by the EU.
14
‘River basin means the area of land from which all surface run-off flows through a sequence of streams, rivers and, possibly, lakes into the sea at a single river mouth, estuary or delta’ (Water Framework Directive, Article 2). 15
http://cdr.eionet.europa.eu/help/WFD/WFD_521_2016/Guidance/WFD_ReportingGuidance.pdf
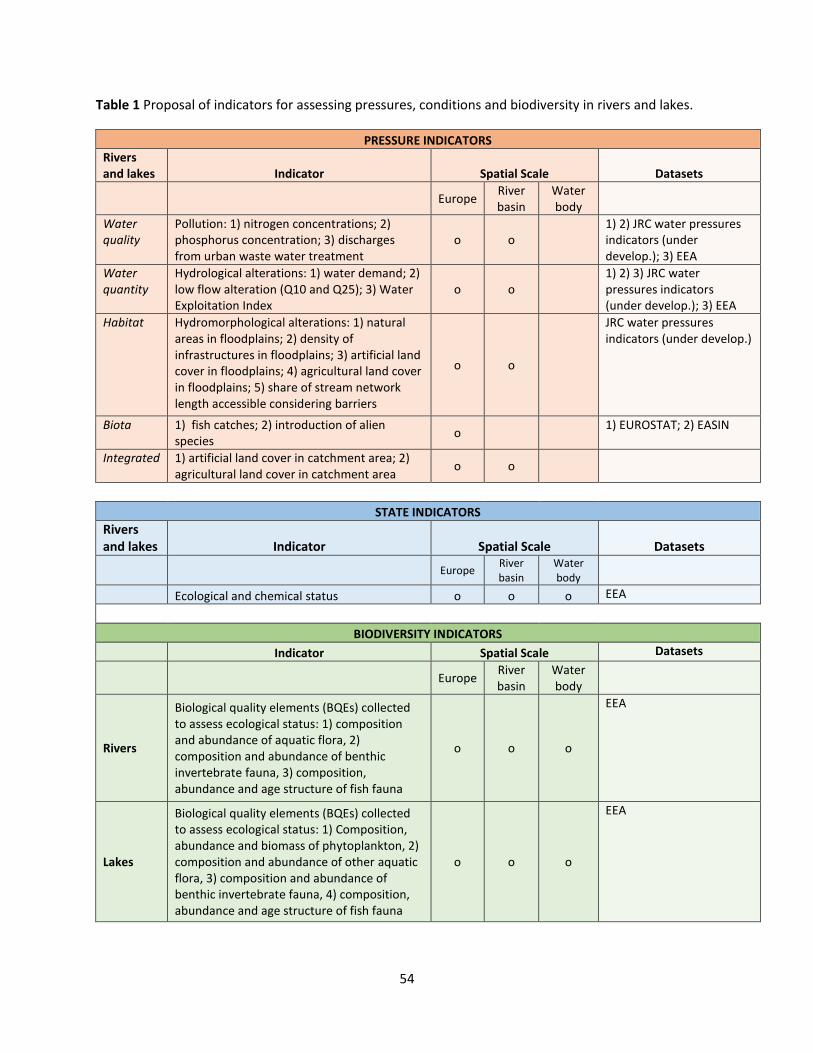
54
Table 1 Proposal of indicators for assessing pressures, conditions and biodiversity in rivers and lakes.
PRESSURE INDICATORS
Rivers and lakes Indicator Spatial Scale Datasets
Europe
River basin
Water body
Water quality
Pollution: 1) nitrogen concentrations; 2) phosphorus concentration; 3) discharges from urban waste water treatment
o o
1) 2) JRC water pressures indicators (under develop.); 3) EEA
Water quantity
Hydrological alterations: 1) water demand; 2) low flow alteration (Q10 and Q25); 3) Water Exploitation Index
o o 1) 2) 3) JRC water pressures indicators (under develop.); 3) EEA
Habitat Hydromorphological alterations: 1) natural areas in floodplains; 2) density of infrastructures in floodplains; 3) artificial land cover in floodplains; 4) agricultural land cover in floodplains; 5) share of stream network length accessible considering barriers
o o
JRC water pressures indicators (under develop.)
Biota 1) fish catches; 2) introduction of alien species
o 1) EUROSTAT; 2) EASIN
Integrated 1) artificial land cover in catchment area; 2) agricultural land cover in catchment area
o o
STATE INDICATORS
Rivers and lakes Indicator Spatial Scale Datasets
Europe
River basin
Water body
Ecological and chemical status o o o EEA
BIODIVERSITY INDICATORS
Indicator Spatial Scale Datasets
Europe
River basin
Water body
Rivers
Biological quality elements (BQEs) collected to assess ecological status: 1) composition and abundance of aquatic flora, 2) composition and abundance of benthic invertebrate fauna, 3) composition, abundance and age structure of fish fauna
o o o
EEA
Lakes
Biological quality elements (BQEs) collected to assess ecological status: 1) Composition, abundance and biomass of phytoplankton, 2) composition and abundance of other aquatic flora, 3) composition and abundance of benthic invertebrate fauna, 4) composition, abundance and age structure of fish fauna
o o o
EEA
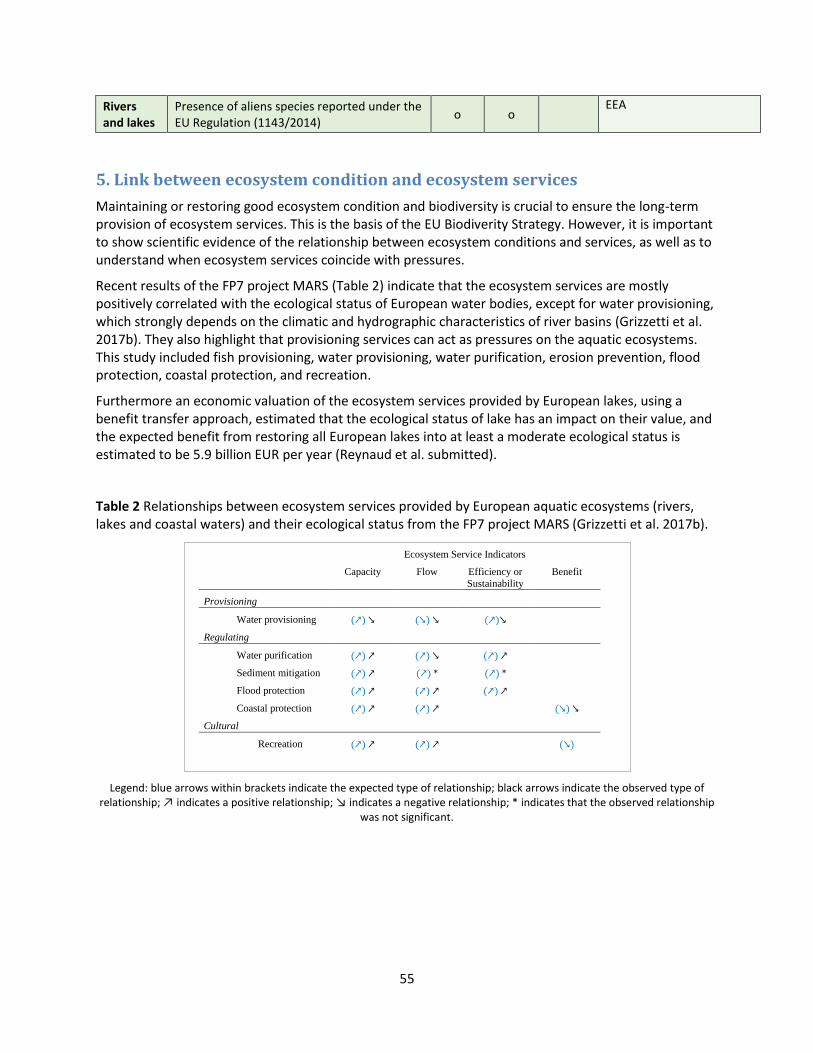
55
Rivers and lakes
Presence of aliens species reported under the EU Regulation (1143/2014)
o o EEA
5. Link between ecosystem condition and ecosystem services
Maintaining or restoring good ecosystem condition and biodiversity is crucial to ensure the long-term provision of ecosystem services. This is the basis of the EU Biodiverity Strategy. However, it is important to show scientific evidence of the relationship between ecosystem conditions and services, as well as to understand when ecosystem services coincide with pressures.
Recent results of the FP7 project MARS (Table 2) indicate that the ecosystem services are mostly positively correlated with the ecological status of European water bodies, except for water provisioning, which strongly depends on the climatic and hydrographic characteristics of river basins (Grizzetti et al. 2017b). They also highlight that provisioning services can act as pressures on the aquatic ecosystems. This study included fish provisioning, water provisioning, water purification, erosion prevention, flood protection, coastal protection, and recreation.
Furthermore an economic valuation of the ecosystem services provided by European lakes, using a benefit transfer approach, estimated that the ecological status of lake has an impact on their value, and the expected benefit from restoring all European lakes into at least a moderate ecological status is estimated to be 5.9 billion EUR per year (Reynaud et al. submitted).
Table 2 Relationships between ecosystem services provided by European aquatic ecosystems (rivers, lakes and coastal waters) and their ecological status from the FP7 project MARS (Grizzetti et al. 2017b).
Legend: blue arrows within brackets indicate the expected type of relationship; black arrows indicate the observed type of relationship; ↗ indicates a positive relationship; ↘ indicates a negative relationship; * indicates that the observed relationship
was not significant.
Ecosystem Service Indicators
Capacity Flow Efficiency or
Sustainability
Benefit
Provisioning
Water provisioning (↗) ↘ (↘) ↘ (↗)↘
Regulating
Water purification (↗) ↗ (↗) ↘ (↗) ↗
Sediment mitigation (↗) ↗ (↗) * (↗) *
Flood protection (↗) ↗ (↗) ↗ (↗) ↗
Coastal protection (↗) ↗ (↗) ↗ (↘) ↘
Cultural
Recreation (↗) ↗ (↗) ↗ (↘)
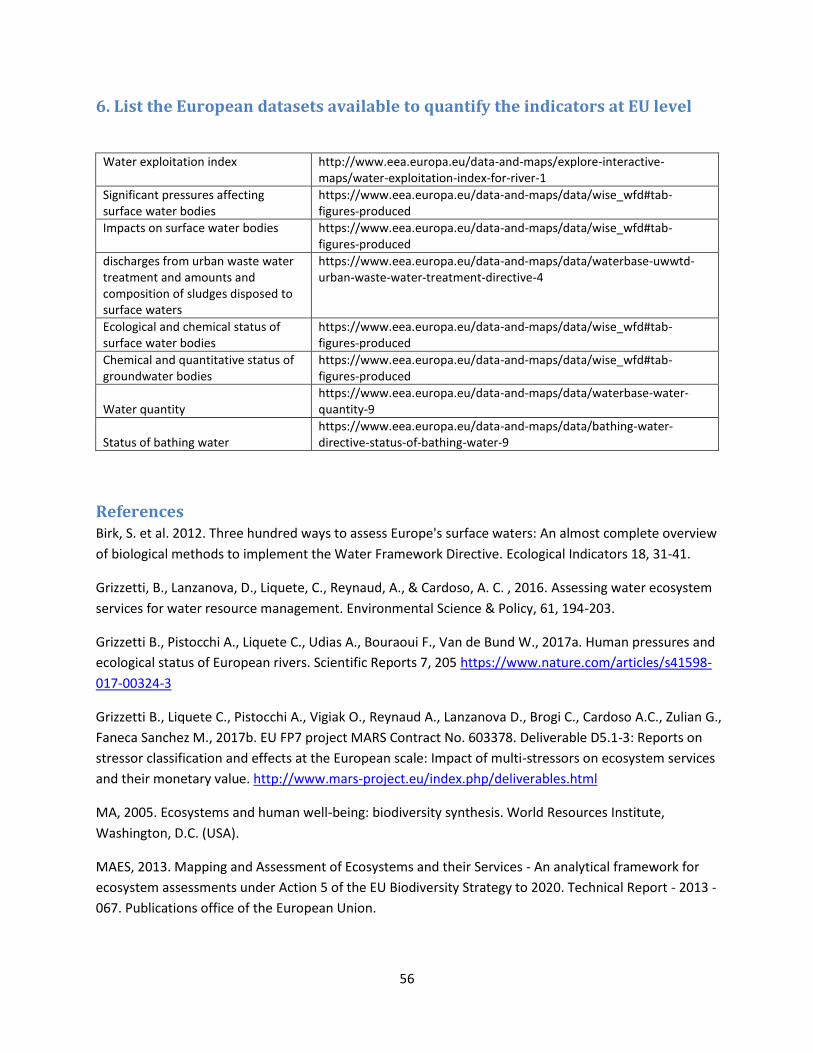
56
6. List the European datasets available to quantify the indicators at EU level
Water exploitation index http://www.eea.europa.eu/data-and-maps/explore-interactive-maps/water-exploitation-index-for-river-1
Significant pressures affecting surface water bodies
https://www.eea.europa.eu/data-and-maps/data/wise_wfd#tab-figures-produced
Impacts on surface water bodies https://www.eea.europa.eu/data-and-maps/data/wise_wfd#tab-figures-produced
discharges from urban waste water treatment and amounts and composition of sludges disposed to surface waters
https://www.eea.europa.eu/data-and-maps/data/waterbase-uwwtd-urban-waste-water-treatment-directive-4
Ecological and chemical status of surface water bodies
https://www.eea.europa.eu/data-and-maps/data/wise_wfd#tab-figures-produced
Chemical and quantitative status of groundwater bodies
https://www.eea.europa.eu/data-and-maps/data/wise_wfd#tab-figures-produced
Water quantity https://www.eea.europa.eu/data-and-maps/data/waterbase-water-quantity-9
Status of bathing water https://www.eea.europa.eu/data-and-maps/data/bathing-water-directive-status-of-bathing-water-9
References Birk, S. et al. 2012. Three hundred ways to assess Europe's surface waters: An almost complete overview
of biological methods to implement the Water Framework Directive. Ecological Indicators 18, 31-41.
Grizzetti, B., Lanzanova, D., Liquete, C., Reynaud, A., & Cardoso, A. C. , 2016. Assessing water ecosystem
services for water resource management. Environmental Science & Policy, 61, 194-203.
Grizzetti B., Pistocchi A., Liquete C., Udias A., Bouraoui F., Van de Bund W., 2017a. Human pressures and
ecological status of European rivers. Scientific Reports 7, 205 https://www.nature.com/articles/s41598-
017-00324-3
Grizzetti B., Liquete C., Pistocchi A., Vigiak O., Reynaud A., Lanzanova D., Brogi C., Cardoso A.C., Zulian G.,
Faneca Sanchez M., 2017b. EU FP7 project MARS Contract No. 603378. Deliverable D5.1-3: Reports on
stressor classification and effects at the European scale: Impact of multi-stressors on ecosystem services
and their monetary value. http://www.mars-project.eu/index.php/deliverables.html
MA, 2005. Ecosystems and human well-being: biodiversity synthesis. World Resources Institute,
Washington, D.C. (USA).
MAES, 2013. Mapping and Assessment of Ecosystems and their Services - An analytical framework for
ecosystem assessments under Action 5 of the EU Biodiversity Strategy to 2020. Technical Report - 2013 -
067. Publications office of the European Union.
57
MAES, 2014. Mapping and Assessment of Ecosystems and their Services - Indicators for ecosystem
assessments under Action 5 of the EU Biodiversity Strategy to 2020. Technical Report - 2014 - 080.
Publications office of the European Union.
Pistocchi A., Aloe A., Bizzi S., Bouraoui F., Burek P., de Roo A., Grizzetti B., van de Bund W., Liquete C.,
Pastori M., Salas F., Stips A., Weissteiner C., Bidoglio G., 2015. Assessment of the effectiveness of
reported Water Framework Directive Programmes of Measures. Part I - Pan-European scale screening of
the pressures addressed by member states. JRC Report EUR 27465. Publications Office of the European
Union. Luxembourg.
Pistocchi A., Aloe A., Bouraoui F., Grizzetti B., Pastori M., Udias A., van de Bund W., Vigiak O., 2017.
Assessment of the effectiveness of reported Water Framework Directive Programmes of Measures. Part
II – development of a system of Europe-wide Pressure Indicators. JRC Technical Reports EUR 28412 EN.
Publications Office of the European Union. Luxembourg.
Poikane, S. et al., 2015. A hitchhiker's guide to European lake ecological assessment and intercalibration.
Ecological Indicators 52, 533-544.
Poikane, S. et al., 2016. Benthic macroinvertebrates in lake ecological assessment: A review of methods,
intercalibration and practical recommendations. Science of the Total Environment 543, 123-134.
Reynaud A., Liquete C., Lanzanova D., Grizzetti B., Brogi C., (submitted). A way to map the value of
ecosystem services delivered by lakes in Europe
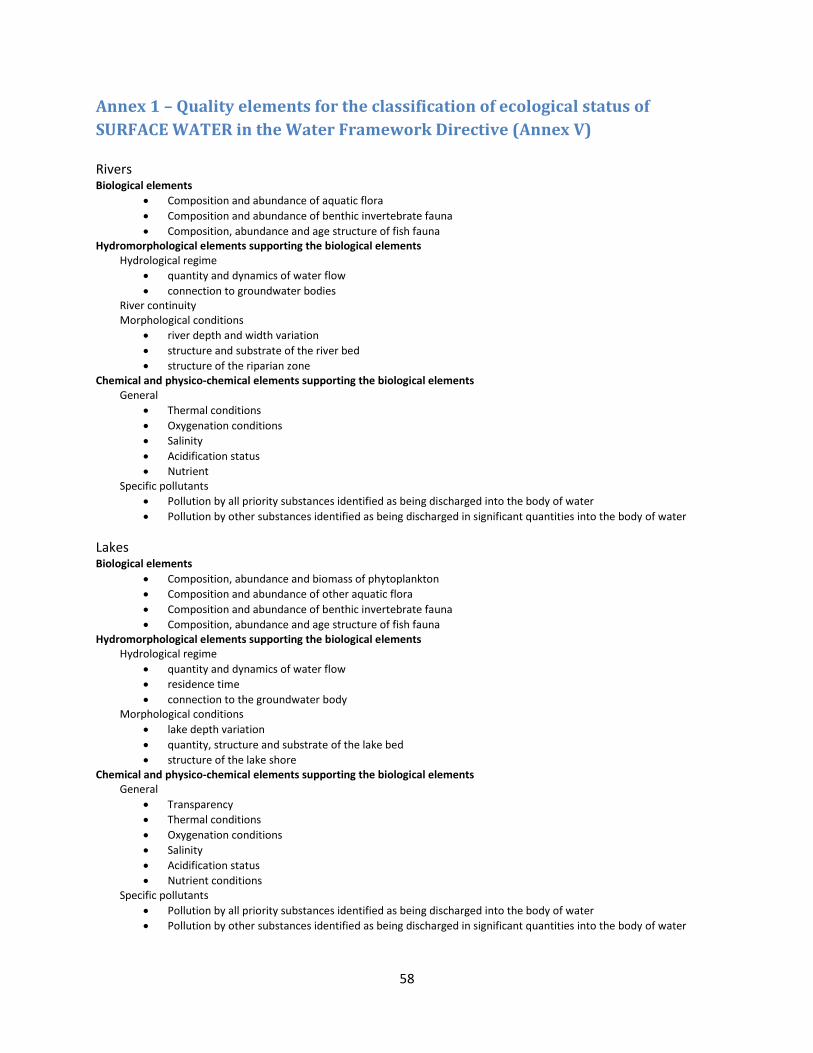
58
Annex 1 – Quality elements for the classification of ecological status of
SURFACE WATER in the Water Framework Directive (Annex V) Rivers Biological elements
Composition and abundance of aquatic flora
Composition and abundance of benthic invertebrate fauna
Composition, abundance and age structure of fish fauna Hydromorphological elements supporting the biological elements
Hydrological regime
quantity and dynamics of water flow
connection to groundwater bodies River continuity Morphological conditions
river depth and width variation
structure and substrate of the river bed
structure of the riparian zone Chemical and physico-chemical elements supporting the biological elements
General
Thermal conditions
Oxygenation conditions
Salinity
Acidification status
Nutrient Specific pollutants
Pollution by all priority substances identified as being discharged into the body of water
Pollution by other substances identified as being discharged in significant quantities into the body of water
Lakes Biological elements
Composition, abundance and biomass of phytoplankton
Composition and abundance of other aquatic flora
Composition and abundance of benthic invertebrate fauna
Composition, abundance and age structure of fish fauna Hydromorphological elements supporting the biological elements
Hydrological regime
quantity and dynamics of water flow
residence time
connection to the groundwater body Morphological conditions
lake depth variation
quantity, structure and substrate of the lake bed
structure of the lake shore Chemical and physico-chemical elements supporting the biological elements
General
Transparency
Thermal conditions
Oxygenation conditions
Salinity
Acidification status
Nutrient conditions Specific pollutants
Pollution by all priority substances identified as being discharged into the body of water
Pollution by other substances identified as being discharged in significant quantities into the body of water
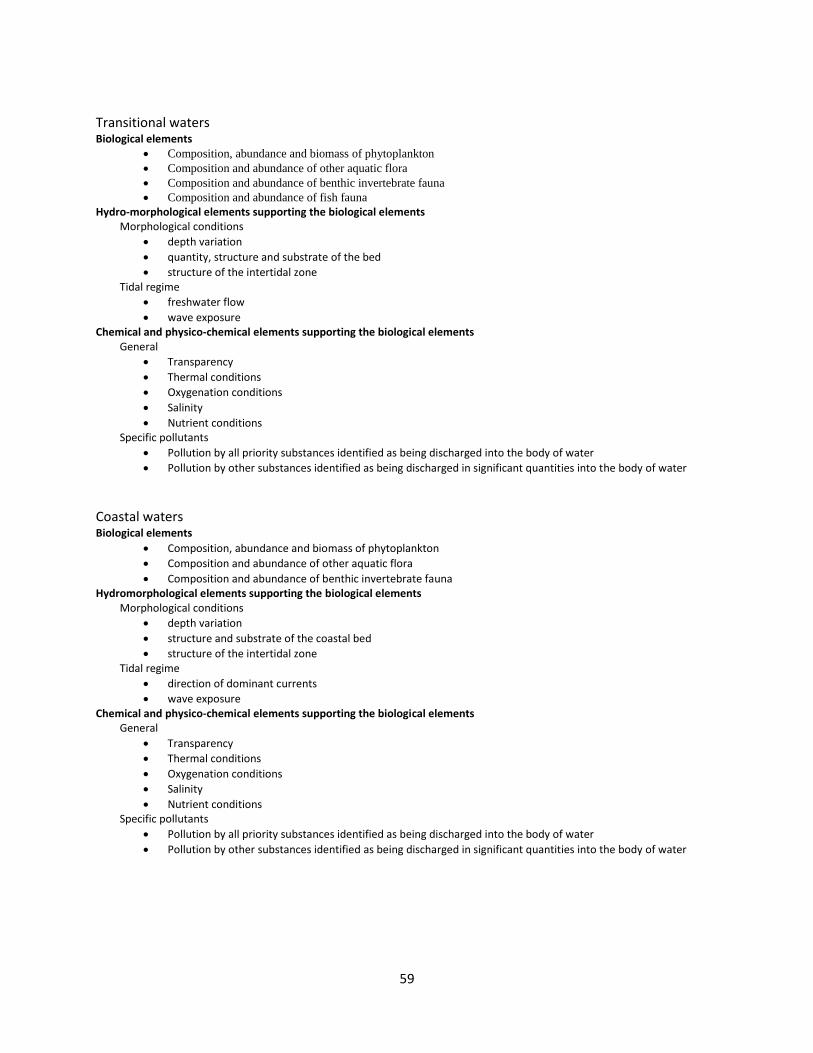
59
Transitional waters Biological elements
Composition, abundance and biomass of phytoplankton
Composition and abundance of other aquatic flora
Composition and abundance of benthic invertebrate fauna
Composition and abundance of fish fauna
Hydro-morphological elements supporting the biological elements Morphological conditions
depth variation
quantity, structure and substrate of the bed
structure of the intertidal zone Tidal regime
freshwater flow
wave exposure Chemical and physico-chemical elements supporting the biological elements
General
Transparency
Thermal conditions
Oxygenation conditions
Salinity
Nutrient conditions Specific pollutants
Pollution by all priority substances identified as being discharged into the body of water
Pollution by other substances identified as being discharged in significant quantities into the body of water
Coastal waters Biological elements
Composition, abundance and biomass of phytoplankton
Composition and abundance of other aquatic flora
Composition and abundance of benthic invertebrate fauna Hydromorphological elements supporting the biological elements
Morphological conditions
depth variation
structure and substrate of the coastal bed
structure of the intertidal zone Tidal regime
direction of dominant currents
wave exposure Chemical and physico-chemical elements supporting the biological elements
General
Transparency
Thermal conditions
Oxygenation conditions
Salinity
Nutrient conditions Specific pollutants
Pollution by all priority substances identified as being discharged into the body of water
Pollution by other substances identified as being discharged in significant quantities into the body of water
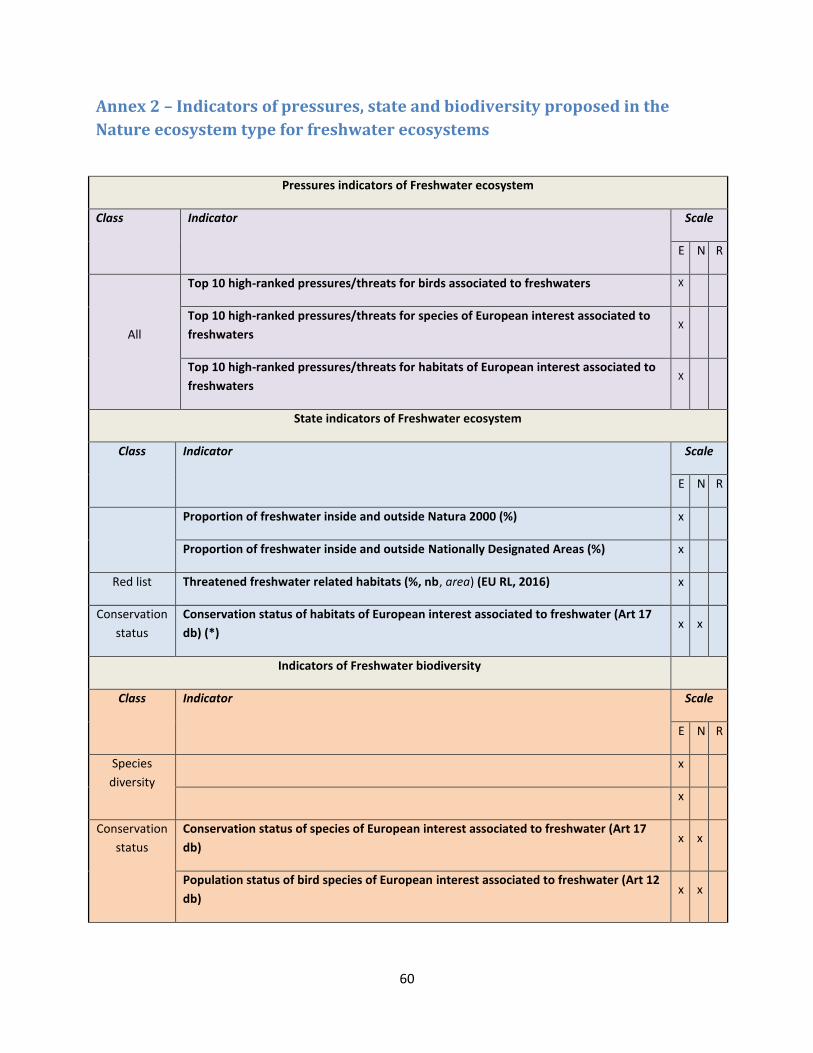
60
Annex 2 – Indicators of pressures, state and biodiversity proposed in the
Nature ecosystem type for freshwater ecosystems
Pressures indicators of Freshwater ecosystem
Class Indicator Scale
E N R
All
Top 10 high-ranked pressures/threats for birds associated to freshwaters X
Top 10 high-ranked pressures/threats for species of European interest associated to
freshwaters X
Top 10 high-ranked pressures/threats for habitats of European interest associated to
freshwaters X
State indicators of Freshwater ecosystem
Class
Indicator Scale
E N R
Proportion of freshwater inside and outside Natura 2000 (%) x
Proportion of freshwater inside and outside Nationally Designated Areas (%) x
Red list Threatened freshwater related habitats (%, nb, area) (EU RL, 2016) x
Conservation
status
Conservation status of habitats of European interest associated to freshwater (Art 17
db) (*) x x
Indicators of Freshwater biodiversity
Class Indicator Scale
E N R
Species
diversity
x
x
Conservation
status
Conservation status of species of European interest associated to freshwater (Art 17
db) x x
Population status of bird species of European interest associated to freshwater (Art 12
db) x x
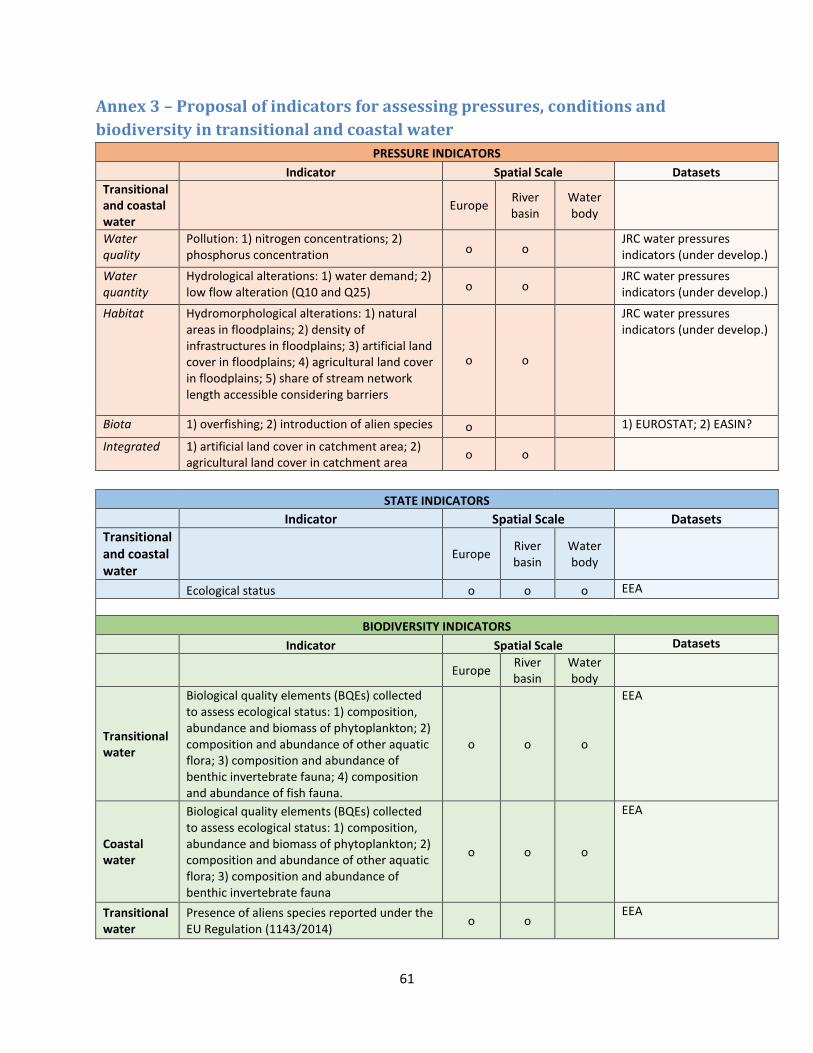
61
Annex 3 – Proposal of indicators for assessing pressures, conditions and
biodiversity in transitional and coastal water
PRESSURE INDICATORS
Indicator Spatial Scale Datasets
Transitional and coastal water
Europe River basin
Water body
Water quality
Pollution: 1) nitrogen concentrations; 2) phosphorus concentration o o
JRC water pressures indicators (under develop.)
Water quantity
Hydrological alterations: 1) water demand; 2) low flow alteration (Q10 and Q25) o o
JRC water pressures indicators (under develop.)
Habitat Hydromorphological alterations: 1) natural areas in floodplains; 2) density of infrastructures in floodplains; 3) artificial land cover in floodplains; 4) agricultural land cover in floodplains; 5) share of stream network length accessible considering barriers
o o
JRC water pressures indicators (under develop.)
Biota 1) overfishing; 2) introduction of alien species o 1) EUROSTAT; 2) EASIN?
Integrated 1) artificial land cover in catchment area; 2) agricultural land cover in catchment area
o o
STATE INDICATORS
Indicator Spatial Scale Datasets
Transitional and coastal water
Europe
River basin
Water body
Ecological status o o o EEA
BIODIVERSITY INDICATORS
Indicator Spatial Scale Datasets
Europe
River basin
Water body
Transitional water
Biological quality elements (BQEs) collected to assess ecological status: 1) composition, abundance and biomass of phytoplankton; 2) composition and abundance of other aquatic flora; 3) composition and abundance of benthic invertebrate fauna; 4) composition and abundance of fish fauna.
o o o
EEA
Coastal water
Biological quality elements (BQEs) collected to assess ecological status: 1) composition, abundance and biomass of phytoplankton; 2) composition and abundance of other aquatic flora; 3) composition and abundance of benthic invertebrate fauna
o o o
EEA
Transitional water
Presence of aliens species reported under the EU Regulation (1143/2014)
o o EEA
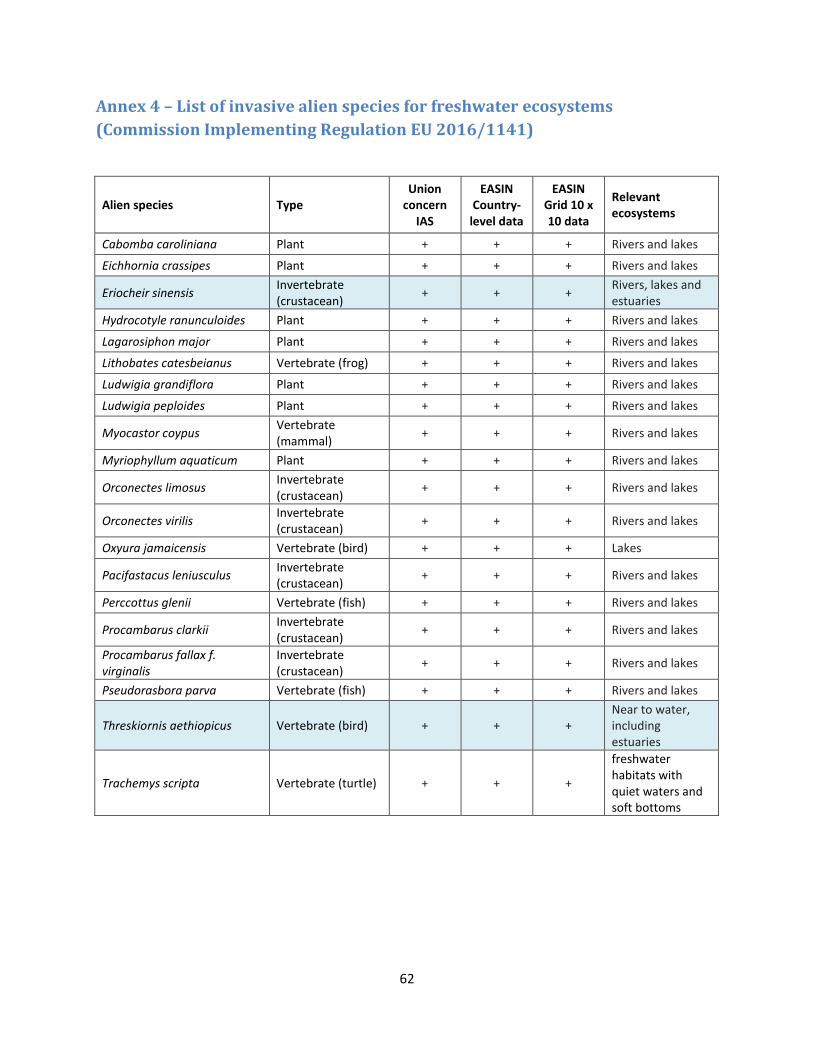
62
Annex 4 – List of invasive alien species for freshwater ecosystems
(Commission Implementing Regulation EU 2016/1141)
Alien species Type Union
concern IAS
EASIN Country-
level data
EASIN Grid 10 x 10 data
Relevant ecosystems
Cabomba caroliniana Plant + + + Rivers and lakes
Eichhornia crassipes Plant + + + Rivers and lakes
Eriocheir sinensis Invertebrate (crustacean)
+ + + Rivers, lakes and estuaries
Hydrocotyle ranunculoides Plant + + + Rivers and lakes
Lagarosiphon major Plant + + + Rivers and lakes
Lithobates catesbeianus Vertebrate (frog) + + + Rivers and lakes
Ludwigia grandiflora Plant + + + Rivers and lakes
Ludwigia peploides Plant + + + Rivers and lakes
Myocastor coypus Vertebrate (mammal)
+ + + Rivers and lakes
Myriophyllum aquaticum Plant + + + Rivers and lakes
Orconectes limosus Invertebrate (crustacean)
+ + + Rivers and lakes
Orconectes virilis Invertebrate (crustacean)
+ + + Rivers and lakes
Oxyura jamaicensis Vertebrate (bird) + + + Lakes
Pacifastacus leniusculus Invertebrate (crustacean)
+ + + Rivers and lakes
Perccottus glenii Vertebrate (fish) + + + Rivers and lakes
Procambarus clarkii Invertebrate (crustacean)
+ + + Rivers and lakes
Procambarus fallax f. virginalis
Invertebrate (crustacean)
+ + + Rivers and lakes
Pseudorasbora parva Vertebrate (fish) + + + Rivers and lakes
Threskiornis aethiopicus Vertebrate (bird) + + + Near to water, including estuaries
Trachemys scripta Vertebrate (turtle) + + +
freshwater habitats with quiet waters and soft bottoms
63
Marine waters16
1. Introduction
1.1 Objectives
Target 2 of the EU Biodiversity Strategy to 2020 (COM(2011) 244) requires that “by 2020 ecosystems and their services are maintained and enhanced by establishing green infrastructure and restoring at least 15 % of degraded ecosystems”. The objective of the MAES workshop organized on 27-28 June 2017 in Brussels is to develop a common understanding of the analytical framework to be used for assessing, among others, marine ecosystems’ condition, including relevant indicators, to support Target 2.
Establishing a common definition of ecosystem condition and suitable indicators per type of ecosystem is necessary to measure the restoration of degraded ecosystems from the adoption of the Biodiversity Strategy (in 2011) to 2020 (i.e. measure progress towards the achievement of Target 2). The purpose of the current MAES marine ecosystem type, in coordination with the other MAES ecosystem types, is to develop a common approach for assessing conditions of marine ecosystems at EU and Member State level. In this document we provide a proposal and background information to support the discussion. The analysis presented in this document reflects currently available knowledge and would benefit from further review and updating on the basis of the outcome of the MAES workshop on ecosystem condition as well as additional scientific review.
1.2 EU Biodiversity Strategy and EU Marine Strategy Framework Directive
To streamline the assessment of Target 2 for marine ecosystems, synergies between the EU Biodiversity Strategy and the EU water and marine policies can be used, especially regarding objectives, definition of condition of marine ecosystems, identification of indicators, and data collection and reporting. Figure 1 shows the timeline of implementation of the EU Biodiversity Strategy and the Marine Strategy Framework Directive (MSFD 2008/56/EC). Reference to the timeline of the Water Framework Directive (WFD, 2000/60/EU) is already provided in the freshwater ecosystem type.
Adopted in 2011, the EU Biodiversity Strategy has recently been reviewed (COM(2015) 0478 final), to check the progress towards targets achievement. The accomplishment of the policy goals will be assessed again in 2019, 2020 being the final deadline for meeting the objectives. 2020 is also the deadline for meeting the SDG 6.6 “Protect and restore water-related ecosystems,” and SDG 14 targets, including SDG14.1 (“Prevent and significantly reduce marine pollution of all kinds, in particular from land-based activities, including marine debris and nutrient pollution”) and SDG 14.2 (“Sustainably manage and protect marine and coastal ecosystem to avoid significant adverse impacts, including by strengthening their resilience, and take action for their restoration in order to achieve healthy and productive oceans”).
On the other side the MSFD, entered into force in 2008, aims at achieving a good environmental status (GES) for all EU seas by 2020. To ensure consistency and to allow for comparison between marine regions or sub-regions as to what extent good environmental status is being achieved, Commission Decision 2010/477/EU was adopted in 2010, setting forth criteria and methodological standards on good environmental status of marine waters. This latter legal instrument has been repealed by the recently
16
Prepared by Francesca Somma (JRC), Bruna Grizzetti (JRC), Ana-Cristina Cardoso (JRC), Camino Liquete (ENV), Jan-Erik Petersen (EEA), Markus Erhard (EEA), Lauren Weatherdon (UNEP-WCMC).
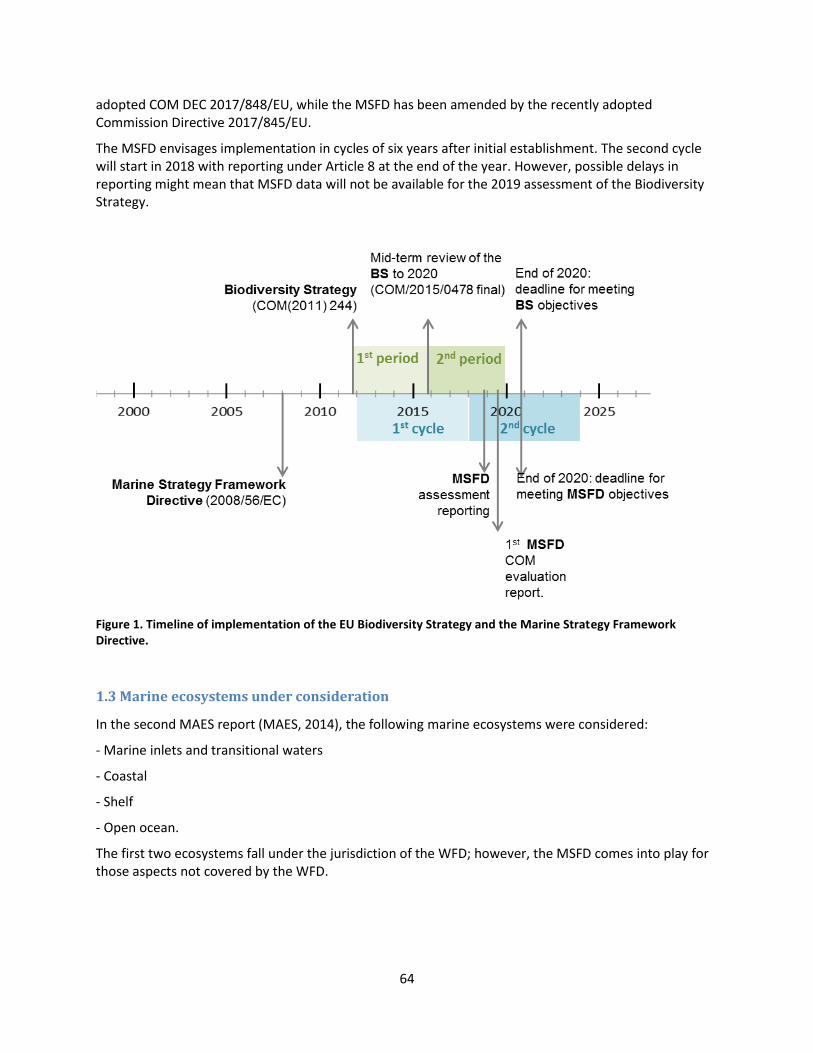
64
adopted COM DEC 2017/848/EU, while the MSFD has been amended by the recently adopted Commission Directive 2017/845/EU.
The MSFD envisages implementation in cycles of six years after initial establishment. The second cycle will start in 2018 with reporting under Article 8 at the end of the year. However, possible delays in reporting might mean that MSFD data will not be available for the 2019 assessment of the Biodiversity Strategy.
Figure 1. Timeline of implementation of the EU Biodiversity Strategy and the Marine Strategy Framework Directive.
1.3 Marine ecosystems under consideration
In the second MAES report (MAES, 2014), the following marine ecosystems were considered:
- Marine inlets and transitional waters
- Coastal
- Shelf
- Open ocean.
The first two ecosystems fall under the jurisdiction of the WFD; however, the MSFD comes into play for those aspects not covered by the WFD.

65
2. Definition ecosystem conditions (marine ecosystems)
According to the Millennium Ecosystem Assessment (MA, 2005), ecosystem condition is the capacity of an ecosystem to yield services, relative to its potential capacity. For the purpose of MAES, ecosystem condition is usually used as a synonym for ‘ecosystem state’ (MAES, 2014). Ecosystem state is defined as the physical, chemical and biological condition of an ecosystem at a particular point in time (MAES, 2013). The term ecosystem status is used in the EU environmental legislation to indicate a classification of ecosystem state among several well-defined categories. It is usually measured against time and compared to an agreed target in EU environmental directives (e.g. HD, WFD, MSFD) (MAES, 2013).
For the purpose of the EU Biodiversity Strategy the definition and classification of environmental status provided by the MSFD could be adopted to describe the condition of marine ecosystems (see Box 1 for the definitions provided in the MSFD Article 3). According to the MSFD the environmental status “means the overall state of the environment in marine waters, taking into account the structure, function and processes of the constituent marine ecosystems together with natural physiographic, geographic, biological, geological and climatic factors, as well as physical, acoustic and chemical conditions, including those resulting from human activities inside or outside the area concerned.”
Box 1. Definitions provided by the Marine Strategy Framework Directive (2008/56/EC Article 3).
Marine waters means:
(a) waters, the seabed and subsoil on the seaward side of the baseline from which the extent of territorial waters is measured extending to the outmost reach of the area where a Member State has and/or exercises jurisdictional rights, in accordance with the UNCLOS, with the exception of waters adjacent to the countries and territories mentioned in Annex II to the Treaty and the French Overseas Departments and Collectivities; and
(b) coastal waters as defined by Directive 2000/60/EC, their seabed and their subsoil, in so far as particular aspects of the environmental status of the marine environment are not already addressed through that Directive or other Community legislation;
Environmental status means the overall state of the environment in marine waters, taking into account the structure, function and processes of the constituent marine ecosystems together with natural physiographic, geographic, biological, geological and climatic factors, as well as physical, acoustic and chemical conditions, including those resulting from human activities inside or outside the area concerned;
Good environmental status means the environmental status of marine waters where these provide ecologically diverse and dynamic oceans and seas which are clean, healthy and productive within their intrinsic conditions, and the use of the marine environment is at a level that is sustainable, thus safeguarding the potential for uses and activities by current and future generations, i.e.:
(a) the structure, functions and processes of the constituent marine ecosystems, together with the associated physiographic, geographic, geological and climatic factors, allow those ecosystems to function fully and to maintain their resilience to human-induced environmental change. Marine species and habitats are protected, human-induced decline of biodiversity is prevented and diverse biological components function in balance;
(b) hydro-morphological, physical and chemical properties of the ecosystems, including those properties which result from human activities in the area concerned, support the ecosystems as described above. Anthropogenic inputs of substances and energy, including noise, into the marine environment do not cause pollution effects.
Through national assessment methods, Member States produce a comprehensive assessment of the status of their marine environment (MSFD Article 8). Member States submitted their initial assessments under the 1st cycle of implementation of the MSFD in 2012. In the same year, and in reference to that
66
assessment, Member States determined a set of characteristics for good environmental status, on the basis of the qualitative descriptors listed in Annex I (MSFD Article 9). The process was assisted by the criteria and methodological standards on good environmental status set forth in COM DEC 2010/477/EU. The latter aimed at ensuring consistency and to allow for comparison between marine regions or sub-regions of the extent to which good environmental status is being achieved.
As we approach the beginning of the 2nd cycle of implementation, Member States are preparing revised assessments under Article 8, due in 2018. In principle, such an assessment should be carried out taking into account the recently adopted COM DEC 2017/848/EU and COM DIR 2017/845/EU. However, Member States that have already started the assessment process might carry it out under the repealed COM DEC 2010/477/EU.
Aside from possible delays in reporting with respect to the December 2018 deadline, shortcomings in the use of the data reported under the MSFD for the purposes of the Biodiversity Strategy may derive from missing information in the data reported under the initial assessment under Article 8, for those Member States that will not have completed their assessment under the 2nd cycle within time. Potential conflicts within the WFD and MSFD in relation to the assessment could arise in relation to:
– fish, which in the WFD are contemplated only in relation to transitional waters, but in the MSFD they play an important economic and ecological role;
– biodiversity, which in the MSFD includes from phyto- and zooplankton (the latter absent from the WFD) to marine mammals, reptiles and sea-birds (also absent in the WFD)
– seafloor integrity, which in the MSFD includes not only invertebrates and macroalgae, but also habitats. (Borja et al., 2010).
3. Indicators (pressure, state, biodiversity)
Table 1 proposes a list of indicators for assessing pressures, conditions and biodiversity in shelf
ecosystems. It derives from the work developed in the MAES marine ecosystem type (Table 3 of the
second MAES report; MAES, 2013). The list is derived entirely from COM DEC 2017/848/EU. However,
other sources of condition information should also be exploited where reliable data are available, so as
to take into account other pressures (e.g. climate change).
The indicators presented in Table 1 apply in large part to Open Ocean ecosystems as well. Indicators for
transitional and coastal waters coming from the WFD are reported in Annex 2 of the freshwater
ecosystem type, and might be integrated where appropriate by indicators in Table 1. In fact, i relation to
marine waters, the MSFD specifically mentions coastal waters (as defined by the WFD) only in relation to
those aspects not already covered by this Directive. In relation to scales, the MSFD regional and sub-
regional scale designations were maintained. However, the pertinence of the indicators presented for
the specific ecosystem and or scale will need to be further refined following common discussion.
Common consensus needs also to be reached about whether selected indicators fall under the pressure
or state group, as the approaches and the definitions followed by current policies are not always
harmonized.
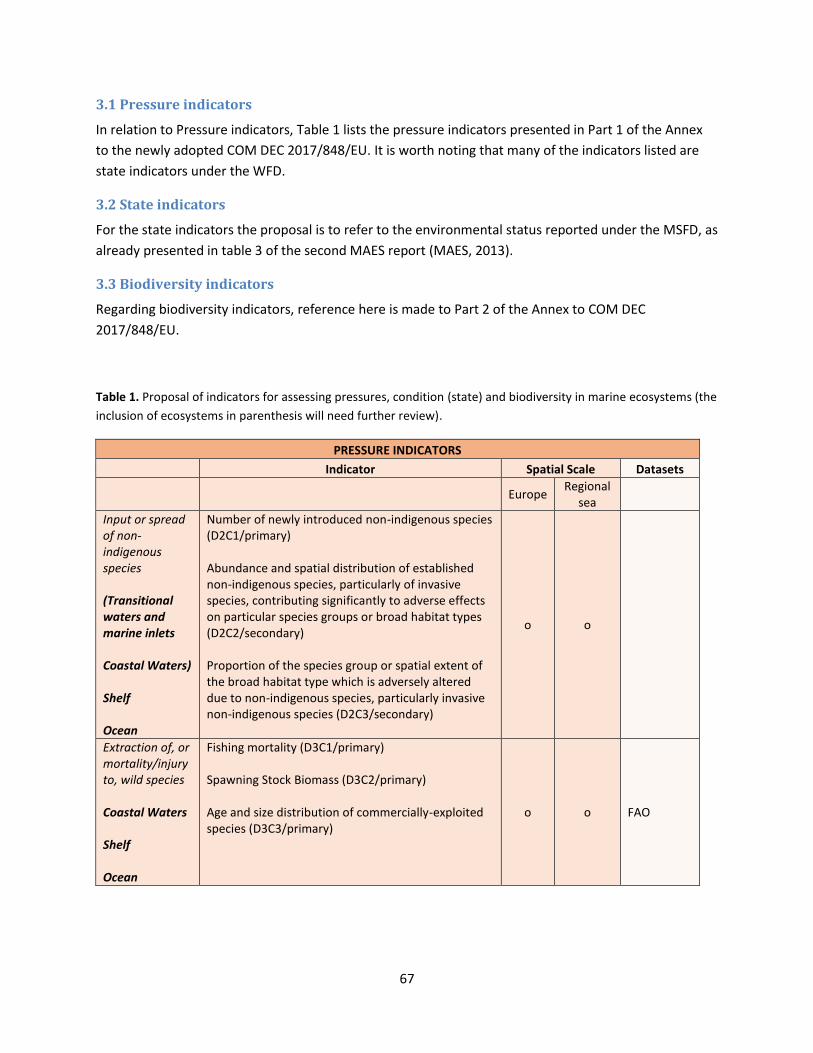
67
3.1 Pressure indicators
In relation to Pressure indicators, Table 1 lists the pressure indicators presented in Part 1 of the Annex
to the newly adopted COM DEC 2017/848/EU. It is worth noting that many of the indicators listed are
state indicators under the WFD.
3.2 State indicators
For the state indicators the proposal is to refer to the environmental status reported under the MSFD, as
already presented in table 3 of the second MAES report (MAES, 2013).
3.3 Biodiversity indicators
Regarding biodiversity indicators, reference here is made to Part 2 of the Annex to COM DEC
2017/848/EU.
Table 1. Proposal of indicators for assessing pressures, condition (state) and biodiversity in marine ecosystems (the
inclusion of ecosystems in parenthesis will need further review).
PRESSURE INDICATORS
Indicator Spatial Scale Datasets
Europe
Regional sea
Input or spread of non-indigenous species (Transitional waters and marine inlets Coastal Waters) Shelf Ocean
Number of newly introduced non-indigenous species (D2C1/primary) Abundance and spatial distribution of established non-indigenous species, particularly of invasive species, contributing significantly to adverse effects on particular species groups or broad habitat types (D2C2/secondary) Proportion of the species group or spatial extent of the broad habitat type which is adversely altered due to non-indigenous species, particularly invasive non-indigenous species (D2C3/secondary)
o o
Extraction of, or mortality/injury to, wild species Coastal Waters Shelf Ocean
Fishing mortality (D3C1/primary) Spawning Stock Biomass (D3C2/primary) Age and size distribution of commercially-exploited species (D3C3/primary)
o o
FAO
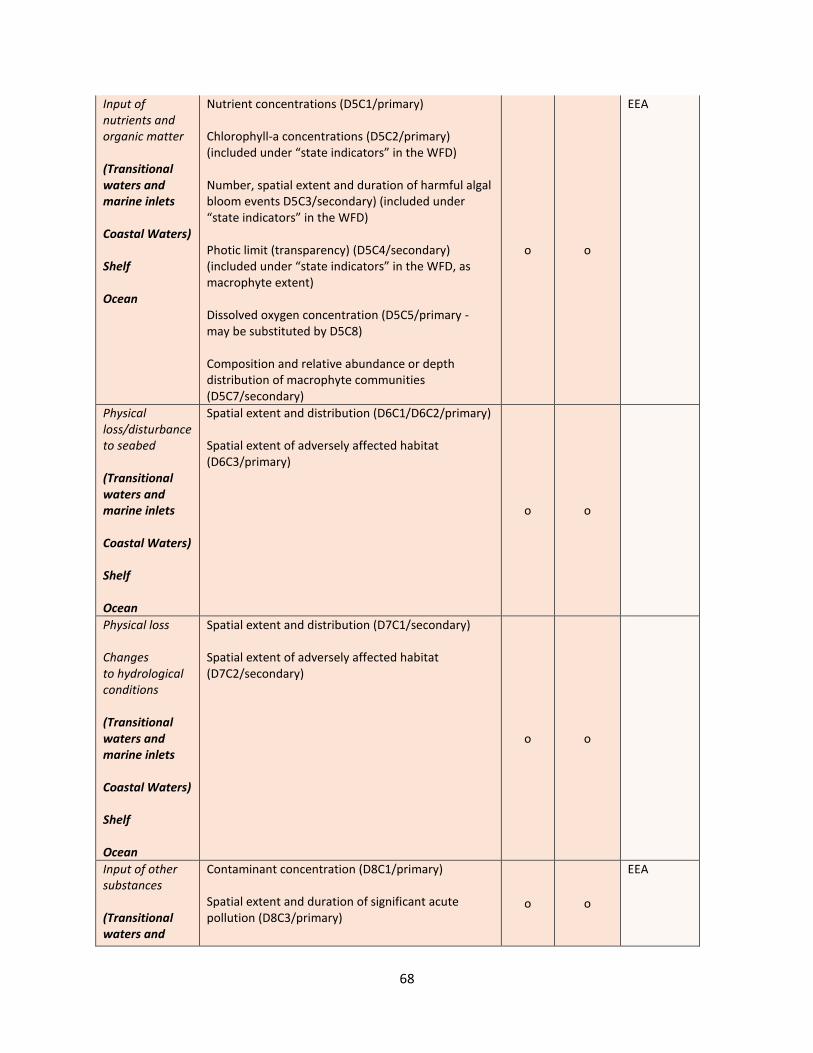
68
Input of nutrients and organic matter (Transitional waters and marine inlets Coastal Waters) Shelf Ocean
Nutrient concentrations (D5C1/primary) Chlorophyll-a concentrations (D5C2/primary) (included under “state indicators” in the WFD) Number, spatial extent and duration of harmful algal bloom events D5C3/secondary) (included under “state indicators” in the WFD) Photic limit (transparency) (D5C4/secondary) (included under “state indicators” in the WFD, as macrophyte extent) Dissolved oxygen concentration (D5C5/primary - may be substituted by D5C8) Composition and relative abundance or depth distribution of macrophyte communities (D5C7/secondary)
o o
EEA
Physical loss/disturbance to seabed (Transitional waters and marine inlets Coastal Waters) Shelf Ocean
Spatial extent and distribution (D6C1/D6C2/primary) Spatial extent of adversely affected habitat (D6C3/primary)
o o
Physical loss Changes to hydrological conditions (Transitional waters and marine inlets Coastal Waters) Shelf Ocean
Spatial extent and distribution (D7C1/secondary) Spatial extent of adversely affected habitat (D7C2/secondary)
o o
Input of other substances (Transitional waters and
Contaminant concentration (D8C1/primary) Spatial extent and duration of significant acute pollution (D8C3/primary)
o o
EEA
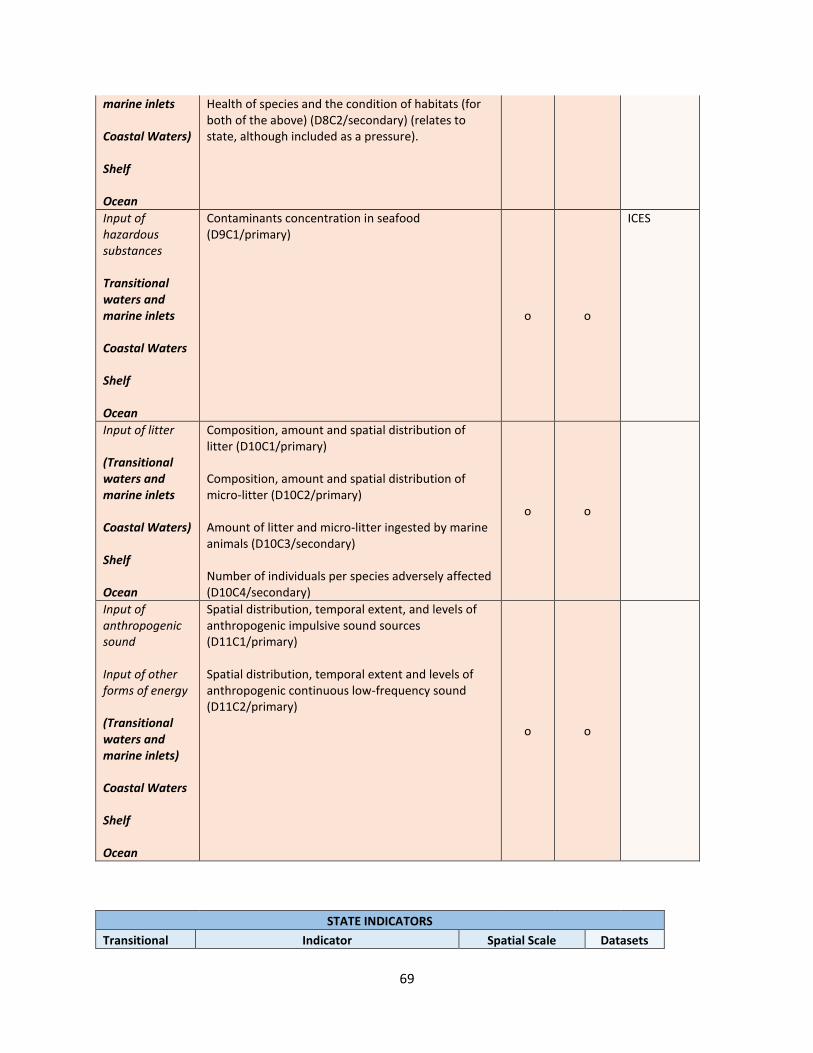
69
marine inlets Coastal Waters) Shelf Ocean
Health of species and the condition of habitats (for both of the above) (D8C2/secondary) (relates to state, although included as a pressure).
Input of hazardous substances Transitional waters and marine inlets Coastal Waters Shelf Ocean
Contaminants concentration in seafood (D9C1/primary)
o o
ICES
Input of litter (Transitional waters and marine inlets Coastal Waters) Shelf Ocean
Composition, amount and spatial distribution of litter (D10C1/primary) Composition, amount and spatial distribution of micro-litter (D10C2/primary) Amount of litter and micro-litter ingested by marine animals (D10C3/secondary) Number of individuals per species adversely affected (D10C4/secondary)
o o
Input of anthropogenic sound Input of other forms of energy (Transitional waters and marine inlets) Coastal Waters Shelf Ocean
Spatial distribution, temporal extent, and levels of anthropogenic impulsive sound sources (D11C1/primary) Spatial distribution, temporal extent and levels of anthropogenic continuous low-frequency sound (D11C2/primary)
o o
STATE INDICATORS
Transitional Indicator Spatial Scale Datasets
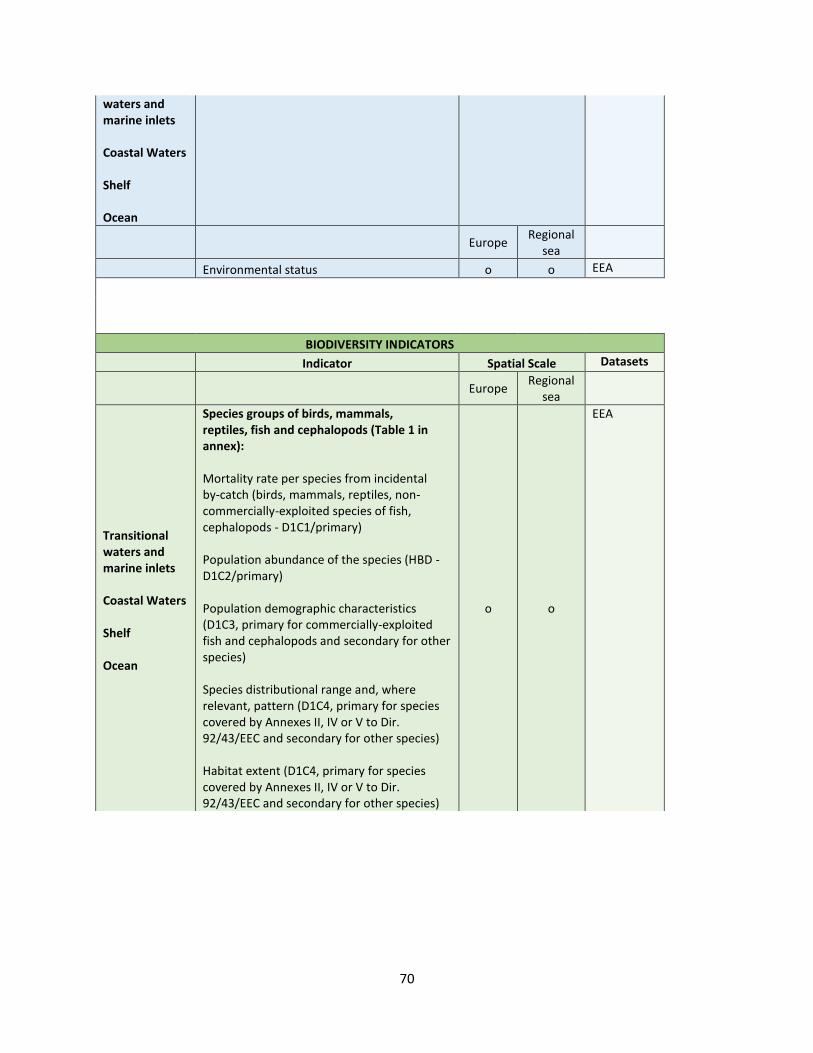
70
waters and marine inlets Coastal Waters Shelf Ocean
Europe
Regional sea
Environmental status o o EEA
BIODIVERSITY INDICATORS
Indicator Spatial Scale Datasets
Europe
Regional sea
Transitional waters and marine inlets Coastal Waters Shelf Ocean
Species groups of birds, mammals, reptiles, fish and cephalopods (Table 1 in annex): Mortality rate per species from incidental by-catch (birds, mammals, reptiles, non-commercially-exploited species of fish, cephalopods - D1C1/primary) Population abundance of the species (HBD - D1C2/primary) Population demographic characteristics (D1C3, primary for commercially-exploited fish and cephalopods and secondary for other species) Species distributional range and, where relevant, pattern (D1C4, primary for species covered by Annexes II, IV or V to Dir. 92/43/EEC and secondary for other species) Habitat extent (D1C4, primary for species covered by Annexes II, IV or V to Dir. 92/43/EEC and secondary for other species)
o o
EEA
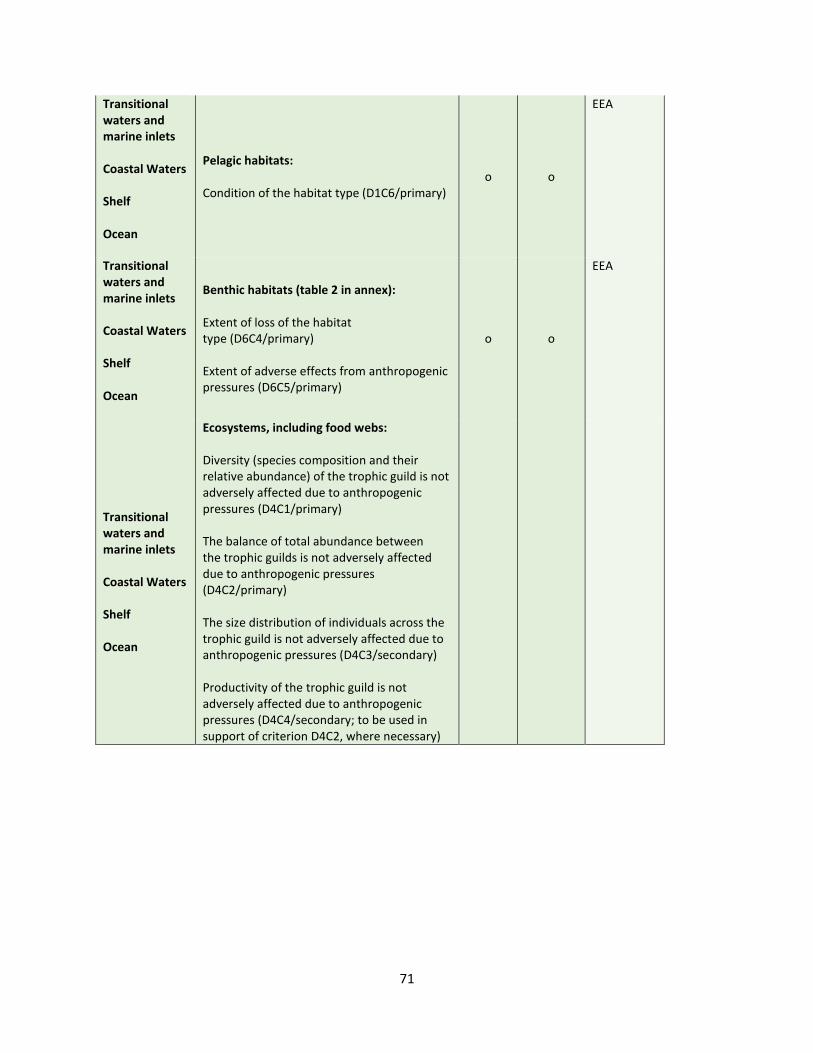
71
Transitional waters and marine inlets Coastal Waters Shelf Ocean
Pelagic habitats: Condition of the habitat type (D1C6/primary)
o o
EEA
Transitional waters and marine inlets Coastal Waters Shelf Ocean
Benthic habitats (table 2 in annex): Extent of loss of the habitat type (D6C4/primary) Extent of adverse effects from anthropogenic pressures (D6C5/primary)
o o
EEA
Transitional waters and marine inlets Coastal Waters Shelf Ocean
Ecosystems, including food webs: Diversity (species composition and their relative abundance) of the trophic guild is not adversely affected due to anthropogenic pressures (D4C1/primary) The balance of total abundance between the trophic guilds is not adversely affected due to anthropogenic pressures (D4C2/primary) The size distribution of individuals across the trophic guild is not adversely affected due to anthropogenic pressures (D4C3/secondary) Productivity of the trophic guild is not adversely affected due to anthropogenic pressures (D4C4/secondary; to be used in support of criterion D4C2, where necessary)
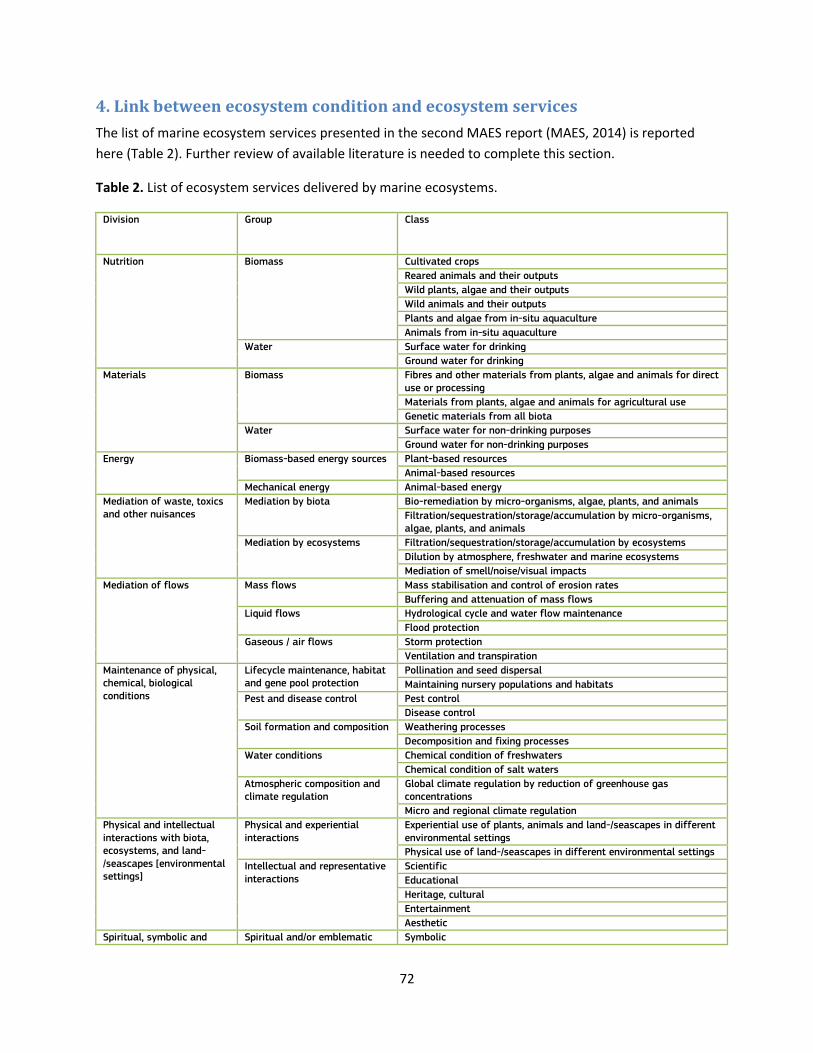
72
4. Link between ecosystem condition and ecosystem services
The list of marine ecosystem services presented in the second MAES report (MAES, 2014) is reported
here (Table 2). Further review of available literature is needed to complete this section.
Table 2. List of ecosystem services delivered by marine ecosystems.
Division Group Class
Nutrition Biomass Cultivated crops
Reared animals and their outputs
Wild plants, algae and their outputs
Wild animals and their outputs
Plants and algae from in-situ aquaculture
Animals from in-situ aquaculture
Water Surface water for drinking
Ground water for drinking
Materials Biomass Fibres and other materials from plants, algae and animals for direct use or processing
Materials from plants, algae and animals for agricultural use
Genetic materials from all biota
Water Surface water for non-drinking purposes
Ground water for non-drinking purposes
Energy Biomass-based energy sources Plant-based resources
Animal-based resources
Mechanical energy Animal-based energy
Mediation of waste, toxics and other nuisances
Mediation by biota Bio-remediation by micro-organisms, algae, plants, and animals
Filtration/sequestration/storage/accumulation by micro-organisms, algae, plants, and animals
Mediation by ecosystems Filtration/sequestration/storage/accumulation by ecosystems
Dilution by atmosphere, freshwater and marine ecosystems
Mediation of smell/noise/visual impacts
Mediation of flows Mass flows Mass stabilisation and control of erosion rates
Buffering and attenuation of mass flows
Liquid flows Hydrological cycle and water flow maintenance
Flood protection
Gaseous / air flows Storm protection
Ventilation and transpiration
Maintenance of physical, chemical, biological conditions
Lifecycle maintenance, habitat and gene pool protection
Pollination and seed dispersal
Maintaining nursery populations and habitats
Pest and disease control Pest control
Disease control
Soil formation and composition Weathering processes
Decomposition and fixing processes
Water conditions Chemical condition of freshwaters
Chemical condition of salt waters
Atmospheric composition and climate regulation
Global climate regulation by reduction of greenhouse gas concentrations
Micro and regional climate regulation
Physical and intellectual interactions with biota, ecosystems, and land-/seascapes [environmental settings]
Physical and experiential interactions
Experiential use of plants, animals and land-/seascapes in different environmental settings
Physical use of land-/seascapes in different environmental settings
Intellectual and representative interactions
Scientific
Educational
Heritage, cultural
Entertainment
Aesthetic
Spiritual, symbolic and Spiritual and/or emblematic Symbolic
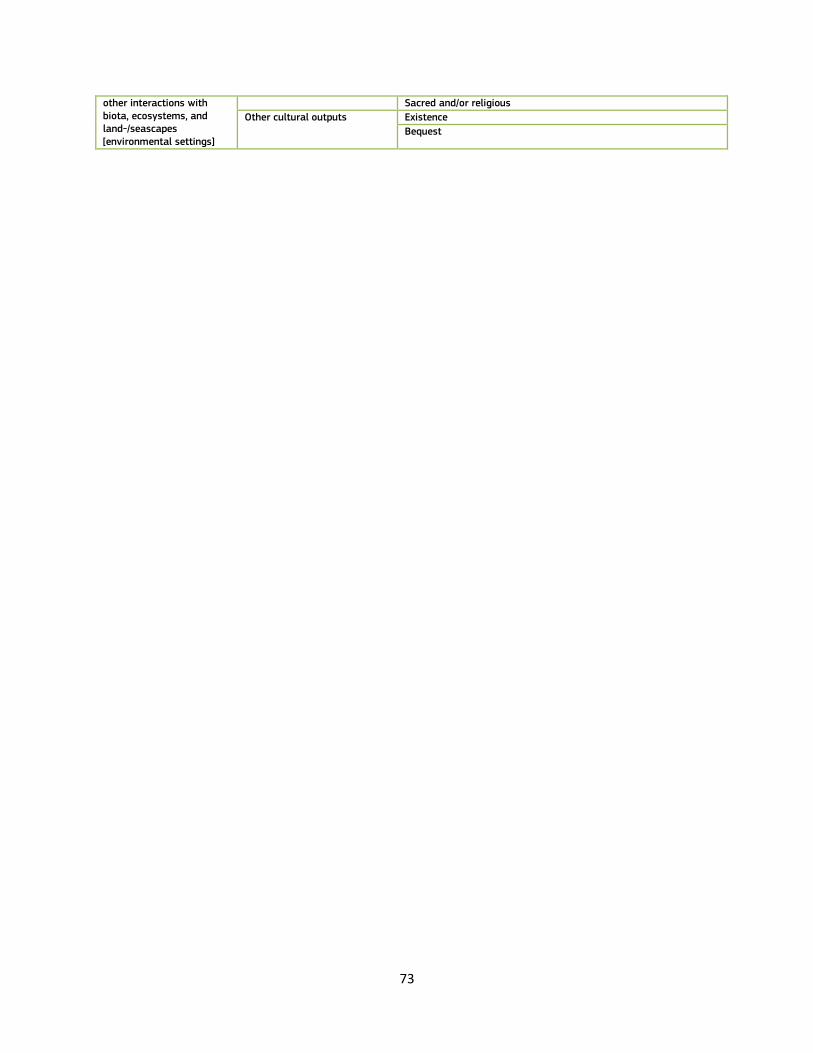
73
other interactions with biota, ecosystems, and land-/seascapes [environmental settings]
Sacred and/or religious
Other cultural outputs Existence
Bequest
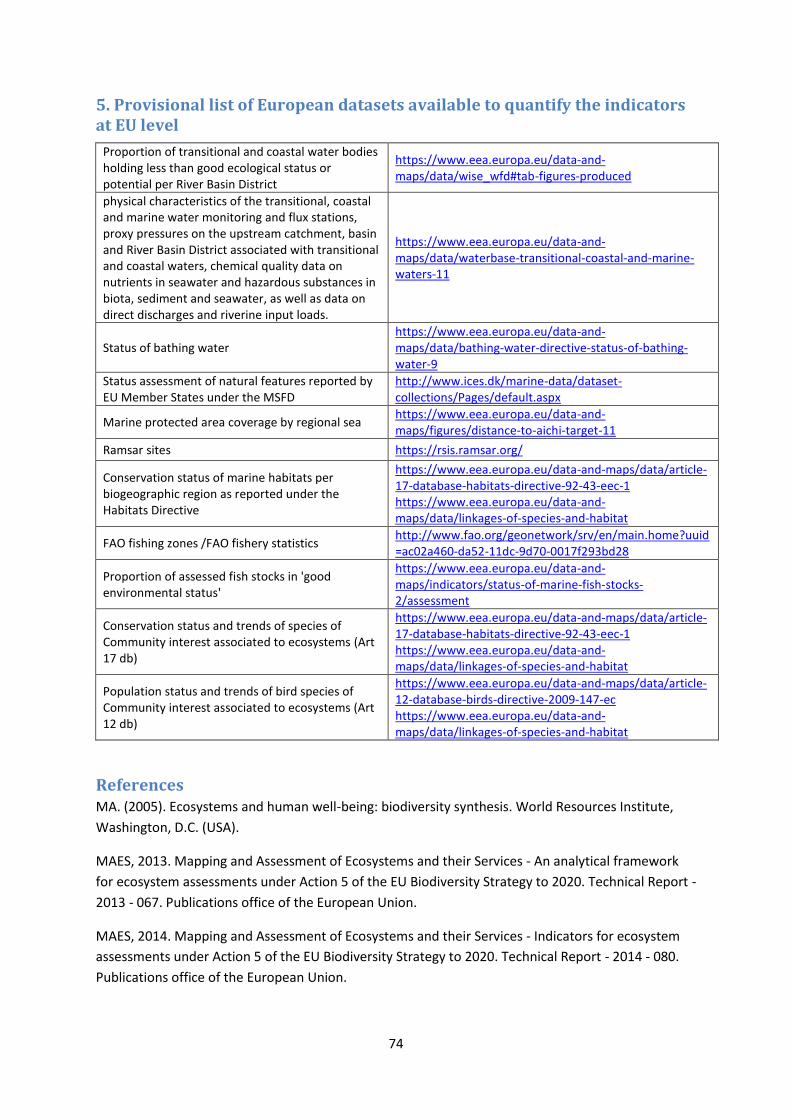
74
5. Provisional list of European datasets available to quantify the indicators at EU level
Proportion of transitional and coastal water bodies holding less than good ecological status or potential per River Basin District
https://www.eea.europa.eu/data-and-maps/data/wise_wfd#tab-figures-produced
physical characteristics of the transitional, coastal and marine water monitoring and flux stations, proxy pressures on the upstream catchment, basin and River Basin District associated with transitional and coastal waters, chemical quality data on nutrients in seawater and hazardous substances in biota, sediment and seawater, as well as data on direct discharges and riverine input loads.
https://www.eea.europa.eu/data-and-maps/data/waterbase-transitional-coastal-and-marine-waters-11
Status of bathing water https://www.eea.europa.eu/data-and-maps/data/bathing-water-directive-status-of-bathing-water-9
Status assessment of natural features reported by EU Member States under the MSFD
http://www.ices.dk/marine-data/dataset-collections/Pages/default.aspx
Marine protected area coverage by regional sea https://www.eea.europa.eu/data-and-maps/figures/distance-to-aichi-target-11
Ramsar sites https://rsis.ramsar.org/
Conservation status of marine habitats per biogeographic region as reported under the Habitats Directive
https://www.eea.europa.eu/data-and-maps/data/article-17-database-habitats-directive-92-43-eec-1 https://www.eea.europa.eu/data-and-maps/data/linkages-of-species-and-habitat
FAO fishing zones /FAO fishery statistics http://www.fao.org/geonetwork/srv/en/main.home?uuid=ac02a460-da52-11dc-9d70-0017f293bd28
Proportion of assessed fish stocks in 'good environmental status'
https://www.eea.europa.eu/data-and-maps/indicators/status-of-marine-fish-stocks-2/assessment
Conservation status and trends of species of Community interest associated to ecosystems (Art 17 db)
https://www.eea.europa.eu/data-and-maps/data/article-17-database-habitats-directive-92-43-eec-1 https://www.eea.europa.eu/data-and-maps/data/linkages-of-species-and-habitat
Population status and trends of bird species of Community interest associated to ecosystems (Art 12 db)
https://www.eea.europa.eu/data-and-maps/data/article-12-database-birds-directive-2009-147-ec https://www.eea.europa.eu/data-and-maps/data/linkages-of-species-and-habitat
References MA. (2005). Ecosystems and human well-being: biodiversity synthesis. World Resources Institute,
Washington, D.C. (USA).
MAES, 2013. Mapping and Assessment of Ecosystems and their Services - An analytical framework
for ecosystem assessments under Action 5 of the EU Biodiversity Strategy to 2020. Technical Report -
2013 - 067. Publications office of the European Union.
MAES, 2014. Mapping and Assessment of Ecosystems and their Services - Indicators for ecosystem
assessments under Action 5 of the EU Biodiversity Strategy to 2020. Technical Report - 2014 - 080.
Publications office of the European Union.
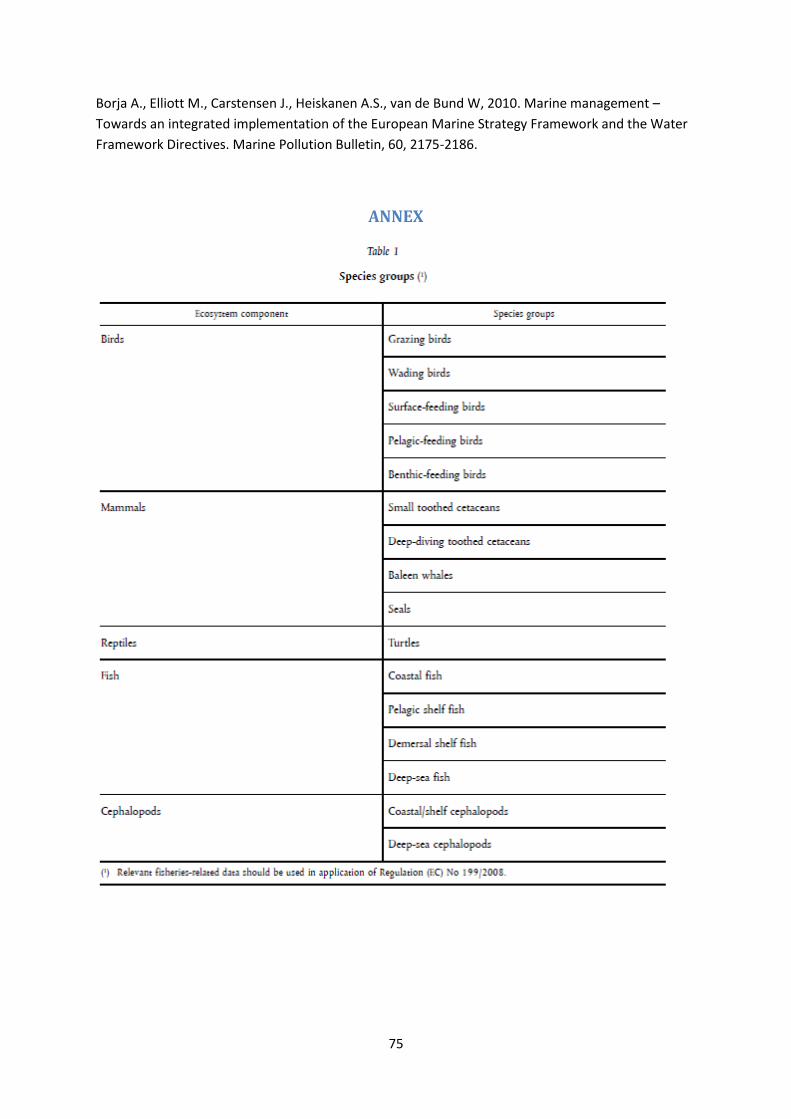
75
Borja A., Elliott M., Carstensen J., Heiskanen A.S., van de Bund W, 2010. Marine management –
Towards an integrated implementation of the European Marine Strategy Framework and the Water
Framework Directives. Marine Pollution Bulletin, 60, 2175-2186.
ANNEX
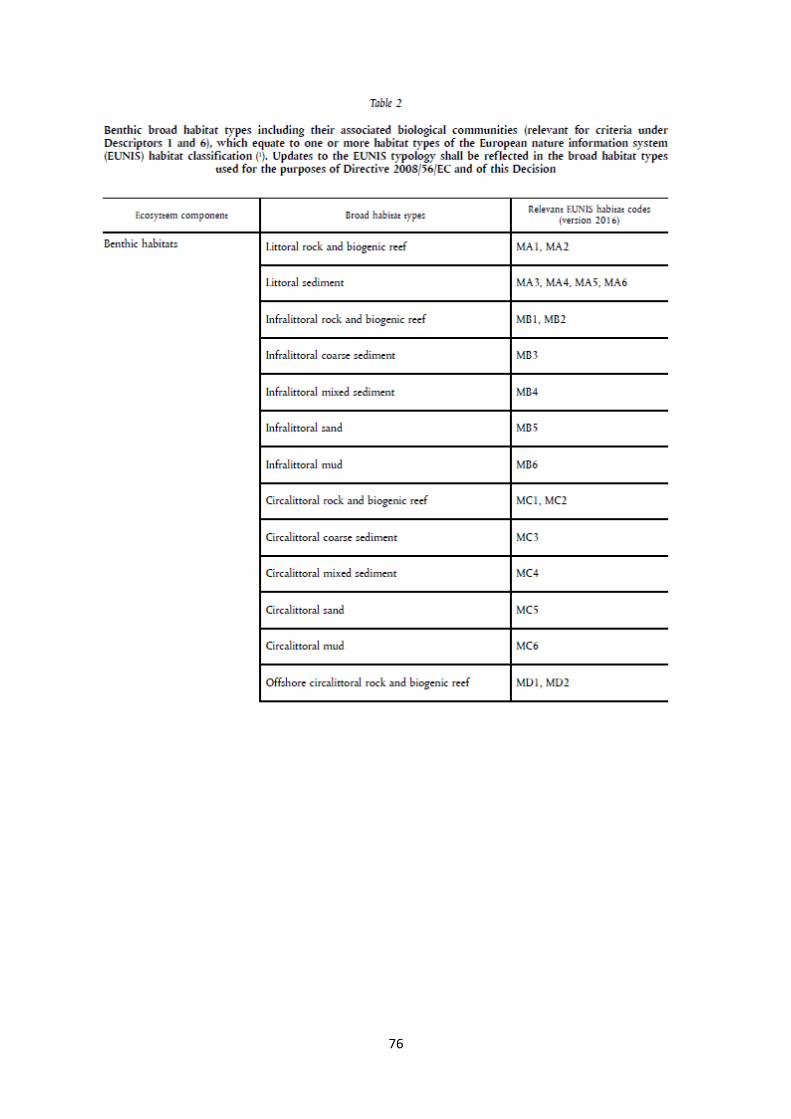
76
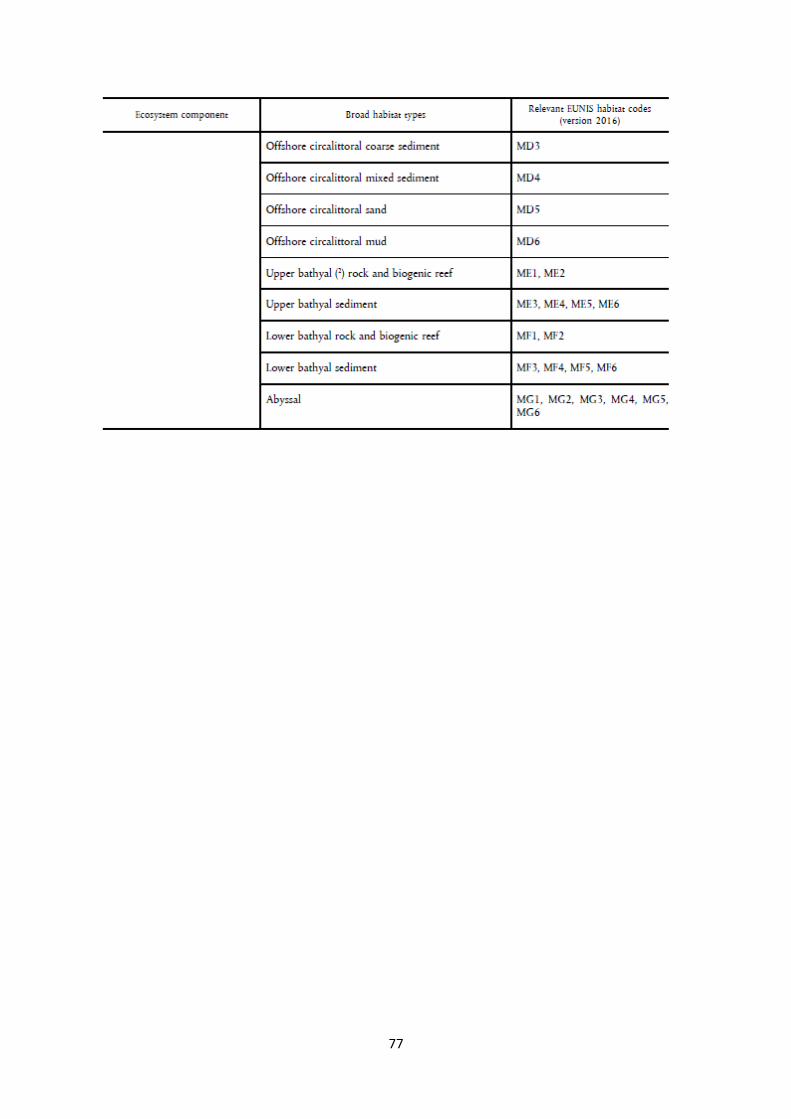
77
78
Forests17
Introduction Forest ecosystems deliver multiple ecosystem services supporting and satisfying human needs.
Consequently, society take advantage of forest services while at the same time modify forest
ecosystems through a number of direct and indirect drivers. In Europe, forests have been intensively
used by increasing human activities over the last millenniums (Davis, et al., 2015; Giesecke, et al.,
2017), leading to a current composition and structure that is quite far from its natural potential
(Strona, et al., 2016). Other drivers such as climate change, air pollution and invasive alien species
also contribute to the current condition of European forest.
Despite the amount of available information of forest ecosystems from ground surveys and remote
sensing, assessing forest condition remains challenging. There is lack of consensus regarding a
definition of forest condition or health that can be operationalised with available indicators. In
addition, although indicators of forest condition are available, these are in some cases either limited
in time, spatial scale or are relative to few dimensions of forest ecosystems. Notwithstanding these
limitations, one source of valuable information is the reporting on the conservation status of
habitats and species of Community interest under the Nature Directives18,19, that include a legal
definition of status of forest habitats and species.
In order to alleviate the difficulties for assessing forest ecosystem condition in line with
environmental legislation a specific study was set up through the MAES Forest ecosystem type. The
aim of the study is to develop an assessment framework (conceptual and analytical) on forest
ecosystem condition in Europe. The framework contributes to the overarching goal of the MAES
Forest ecosystem type, which is to identify an array of forest condition indicators and corresponding
datasets.
The MAES Forest ecosystem type on condition is implemented following four methodological steps.
The steps are logically interrelated and will provide an analytical framework for forest ecosystem
condition and an assessment of available indicators:
1) Definitions and reference frameworks: Firstly, definitions of forest condition are assessed from
literature review, with the aim of discussing challenges and opportunities for an operational
definition of forest condition. Secondly, a conceptual framework is implemented including an
assessment of drivers and pressures that influence forest ecosystem condition and biodiversity.
This approach will ease identifying relationships between pressures, condition and forest
ecosystem services in an analytical framework. In addition, key parameters of forest condition
are identified resulting from the effects of pressures on key forest attributes and the services
forest provide.
17 Achille Mauri (JRC) and José I. Barredo (JRC), with contribution from Anne Teller (DG-ENV), Peter Loffler (DG-
ENV), Annemarie Bastrup-Birk (EEA), Sophie Condé (EEA ETC-BD), Bálint Czúcz (EEA ETC-BD), and Dania Abdul Malak (EEA ETC-ULS) 18
http://ec.europa.eu/environment/nature/legislation/habitatsdirective/index_en.htm 19
http://ec.europa.eu/environment/nature/legislation/birdsdirective/index_en.htm
79
2) Identifying and structuring indicators on condition: From the output of step 1 and consultation
with the MAES Forest ecosystem type partners and stakeholders, a structured indicators table is
provided for pressures, state and biodiversity.
3) Link between condition and ecosystem services: This step is implemented following the
approach of Grizzetti, et al. (2016) adapted to forest ecosystems.
4) Identifying datasets for each indicator: Available data is classified and included in the indicators
table.
The draft output of the MAES Forest ecosystem type is presented for discussion to Member States
and stakeholders in a MAES Workshop on “Assessing and Mapping Ecosystem Condition” in Brussels,
27-28 June 2017. After the workshop, and after having included the view from MS and stakeholders,
a consolidated final version will be included in a report, which will ensure consistence with the
output from the other MAES ecosystem types, and the Nature ecosystem type in particular
regarding forest related species and habitats.
Defining forest ecosystem condition The aim of this section is to provide an overview on the definitions of forest condition and health. A
generic definition of ecosystem condition was adopted by the Millennium Ecosystem Assessment as
“the capacity of an ecosystem to yield services, relative to its potential capacity” (MA, 2005). For the
purpose of MAES, ecosystem condition is often used as synonymous for “ecosystem state”. And
“ecosystem state” is defined as “the physical, chemical and biological condition of an ecosystem at a
particular point in time” (MAES, 2013). Ecosystem state should not be confused with “status” (see
glossary), which is defined as an ecosystem state defined among several well-defined categories
including its legal status. It is usually measured against time and compared to an agreed target in EU
environmental directives (e.g. Habitats Directive, Water Framework Directive, Marine Strategy
Framework Directive), e.g. “conservation status”.
Forest condition is subject to natural processes and as such is dynamic (Stanturf, et al., 2012). In
addition, the concept of forest ecosystem condition is closely connected to the concept of forest
degradation and restoration. Common for all three concepts is the lack of consensus on a definition
due to their complexity and dependence on multiple interconnected factors. It is therefore
challenging and virtually impossible to propose an operational definition of a healthy, vital forest or
a forest in good condition (Costanza, et al., 1992; Trumbore, et al., 2015).
In the forest domain, although a long history of forest condition monitoring is available in Europe
(ICP, 2016), a widely accepted definition of “forest condition” is missing (Lorenz, 2004; UN, 2000).
“Forest condition” is often used synonymously with the terms “forest health” and “forest vitality” or
a combination of the two (FAO, 2010; FOREST EUROPE, 2015). In this study the focus is on the
definition of “forest health”, which is the term most recently adopted in the scientific literature to
assess the state of forests (Finley & Chhin, 2016; Lausch, et al., 2016; Millar & Stephenson, 2015;
Pautasso, et al., 2015; Ramsfield, et al., 2016; Trumbore, et al., 2015).
The focus of this study is on EU scale, nevertheless one of the challenges in defining forest health is
the issue of spatial and temporal scale. A local infection is considered as a threat at local level but
not important at landscape level. However, such an infection can develop into an epidemic and
affect forests at the landscape scale. In another example, a single tree is considered healthy when
there is absence of disease, but on a larger scale a forest stand can be healthy even though few
individuals are unhealthy (Innes & Tikina, 2017; Kolb, et al., 1994) (Box 1 in annex). Regarding the
80
temporal scale, forest recovery after disturbance might take different periods depending on a
number of factors such as species composition, forest age and management practices among others.
Additionally, forest processes and functions recover at different periods. For instance,
photosynthesis and respiration recover within a few years, biomass within a few decades, while
mineral nutrient can take several decades to recover (Trumbore, et al., 2015).
The available definitions of forest health (see Box 2 in annex) can follow three main perspectives:
utilitarian, environmental and ecosystem-centered (Kolb, et al., 1994). In the utilitarian perspective,
a forest is considered healthy if management objectives are satisfied, and vice versa (Kimmins, 2004;
Kolb, et al., 1994; USDA, 1993). In the environmental perspective, a healthy forest is one that is in a
succession stage at which trees’ canopy is multilayered and uneven-aged, the forest is a combination
of large living trees as well as decayed trees that provide a fundamental habitat for animals and
micro-organisms (Kimmins, 2004). These two perspectives, utilitarian and environmental, can be
contradictory, because the same forest could be considered differently depending of the perspective
adopted, i.e. timber production in the utilitarian, and environmental attributes in the environmental
perspective. In the ecosystem-centered perspective, a forest is considered healthy if it has the
following characteristics. First, the physical environment, biotic resources and trophic networks to
support productive forests during at least some seral stages. Second, resistance to catastrophic
change and/or the ability to recover from catastrophic change at the landscape level. And finally, a
diversity of seral stages and stand structures that provide habitat for many native species and
support essential ecosystem processes and services (Kolb, et al., 1994).
The ecosystem perspective add a new element to the functionality of forest ecosystems that is
disturbance, which is considered to be inherent to forest dynamics and contributes to healthy forest
functioning and resilience (Millar & Stephenson, 2015). Forest disturbances are environmental
fluctuations and destructive events that disturb forest health and/or structure and/or change the
resources or the physical environment at any spatial or temporal scale (FAO, 2010; van Lierop, et al.,
2015). Disturbance may harm individual organisms, but can be an essential component of overall
ecosystem health (Raffa, et al., 2009). In normal circumstances, disturbances such as insect pests
and diseases, are an integral part of forest ecosystems (Dajoz, 2000; van Lierop, et al., 2015).
However, when the frequency and intensity of disturbances occur above “normal” thresholds, they
produce detrimental effects in forest ecosystems affecting functions, health and vitality, often
producing tree mortality and forest decline. An open question is determining the disturbance/stress
threshold over which the natural range of variability is overpassed and when the trajectory of
vegetation recovery at the landscape to regional scale is affected.
The FAO combined the utilitarian and the ecological perspectives by defining “forest health and
vitality” based on the combined presence of abiotic and biotic stresses and the way they affect tree
growth and survival, the yield and quality of wood and non-wood products, wildlife habitat,
recreation and scenic and cultural values (FAO, 2017). In this definition, the role of non-wood
products and other forest services is central for understanding the health state of forests. In fact,
health and vitality of forests affects their ability to provide ecosystem services. Therefore, the
discussions on forest health and vitality is tightly connected to concepts of sustainability, resilience
and ecosystem functions, and with humans and their activities being an integral part of the system
(Innes & Tikina, 2017). Human expectations can be met if the forest is resilient, is managed in a
sustainable way and functions within the ecosystem boundaries.
81
Forest health and vitality can be approached as a function of the extent to which the ecosystem
processes are functioning within natural historical boundaries and using appropriate modifiers to
specify the scales and human expectations (Innes & Tikina, 2017). The concept is thus also
connected to planetary boundaries as these are used to determine the levels of disturbances that
are within the safe range for the planet (Steffen, et al., 2015). Maintenance of functional biodiversity
and redundancy can help to improve resilience and prevent forest ecosystems (as other ecosystems)
to tip into undesired states.
Assessment framework In the previous section, we provided an overview of the definitions of forest health. These include a
series of aspects (e.g. physical environment, biotic resources, trophic networks, disturbances, forest
composition/structure) that are integrated first, in a conceptual framework, and second in an
analytical framework, emphasizing the linkages between elements. These linkages are fundamental
for setting a framework that facilitates structuring a comprehensive list of indicators on condition.
The conceptual framework links drivers and pressures affecting forest condition and biodiversity.
Drivers and pressures are one of the building blocks of the analytical framework, where they are
integrated with ecosystem condition, ecosystem services, and their relationships in a functional
model.
Conceptual framework
The conceptual framework for assessing forest ecosystem condition departs from the fourth MAES
(2016b) report, the study of Trumbore, et al. (2015) on assessing forest health on a global scale and
from the review on forest health by Lausch, et al. (2016). In the conceptual framework we provide a
classification of drivers and pressures affecting forest ecosystem condition and biodiversity (Figure
1). Drivers were classified in four high level categories, human, climate, biotic, and
atmospheric/biochemical, which have an effect on pressures (disturbances) in a one-to-many
relationship. For instance, climate drivers such as changes in temperature might lead to higher fire
activity but also pest outbreaks.
The conceptual framework illustrates the complexity of pressures acting at multiple levels and
comprising multiple drivers with interactions between environmental factors. Natural disturbances
form an integral part of natural forest ecosystems, playing essential roles regarding biodiversity,
nutrient cycling, regeneration and creation of habitats. In contrast, human-driven factors such as air
pollution, invasive species, unsustainable management practices and climate change could drive tree
mortality and forest decline, pushing the systems outside the range of natural variability.
Inside human drivers, the intensity of forest management affects forest structure, soils, biochemical
cycles, biodiversity and ecosystem services (EEA, 2015). At present, more than 80% of the forest area
in the EEA region is under management as production forest with potential for wood supply, and 27%
of Europe’s forest are uneven-aged (EEA, 2016; FOREST EUROPE, 2015). Still, according to FAO
(2015), 10% of the total forest area of Europe is intensively managed and an increasing proportion
(currently 30%) is managed as multiple-use forest. Intensified forestry practices could lead to trade-
offs between wood production and other ecosystem services, deriving in the medium to long term in
a reduction of nor-marketed ecosystem services (Duncker, et al., 2012; Verkerk, et al., 2014), thus
worsening forest health and vitality and impairing biodiversity protection.
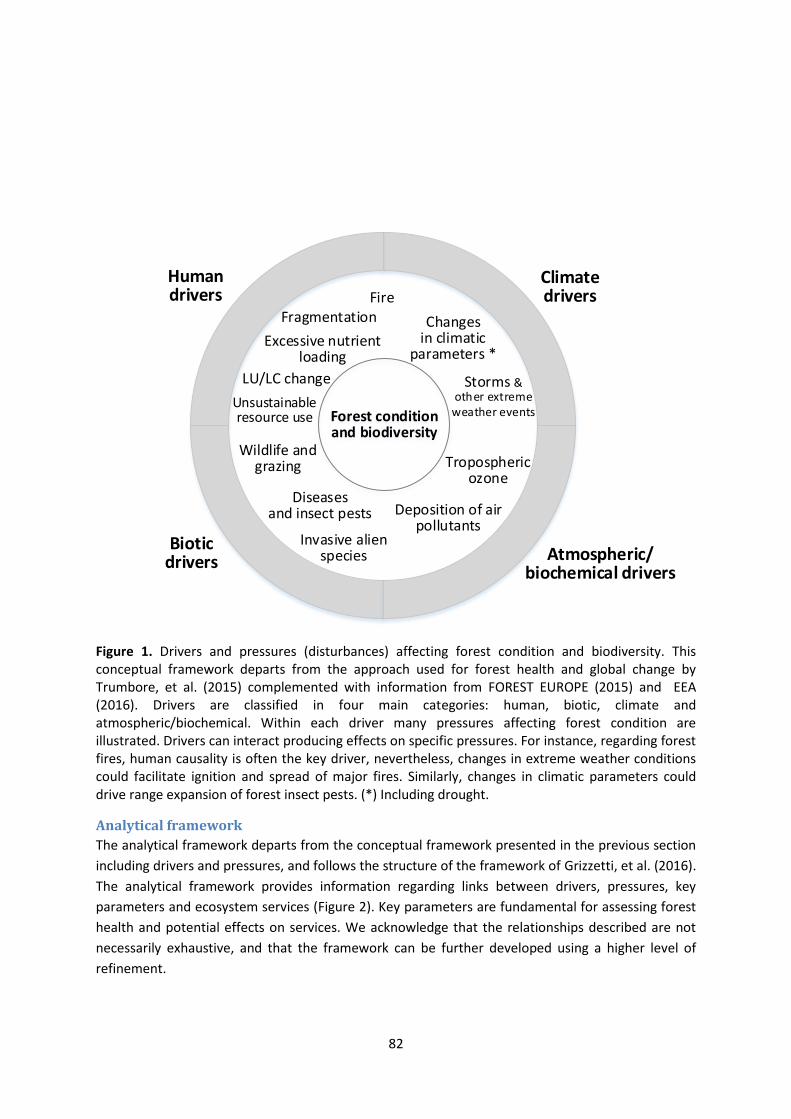
82
Forest condition and biodiversity
Climatedrivers
Atmospheric/biochemical drivers
Bioticdrivers
Humandrivers
Unsustainable resource use
Fire
Changes in climatic
parameters *
Invasive alienspecies
Fragmentation
Deposition of air pollutants
Tropospheric ozone
Storms & other extreme
weather events
Diseases and insect pests
Wildlife and grazing
LU/LC change
Excessive nutrient loading
Figure 1. Drivers and pressures (disturbances) affecting forest condition and biodiversity. This conceptual framework departs from the approach used for forest health and global change by Trumbore, et al. (2015) complemented with information from FOREST EUROPE (2015) and EEA (2016). Drivers are classified in four main categories: human, biotic, climate and atmospheric/biochemical. Within each driver many pressures affecting forest condition are illustrated. Drivers can interact producing effects on specific pressures. For instance, regarding forest fires, human causality is often the key driver, nevertheless, changes in extreme weather conditions could facilitate ignition and spread of major fires. Similarly, changes in climatic parameters could drive range expansion of forest insect pests. (*) Including drought.
Analytical framework
The analytical framework departs from the conceptual framework presented in the previous section
including drivers and pressures, and follows the structure of the framework of Grizzetti, et al. (2016).
The analytical framework provides information regarding links between drivers, pressures, key
parameters and ecosystem services (Figure 2). Key parameters are fundamental for assessing forest
health and potential effects on services. We acknowledge that the relationships described are not
necessarily exhaustive, and that the framework can be further developed using a higher level of
refinement.
83
In the framework, we identified the main pressures that can affect forest ecosystems (shown in
Figure 1) and the seven key parameters that can be affected classified in three forest attributes i.e.
composition, structure and function. The condition of a forest ecosystem can be described from
these three forest attributes (EEA, 2016; Franklin & Spies, 1991; Lausch, et al., 2016; McElhinny,
2002). First, compositional attributes refers primarily to the array of plant and animal species
present in a forest ecosystems, also considering their abundance. Second, structure refers to the
spatial arrangement of various components of the ecosystem, such as height of various canopy
levels and spacing of trees. Finally, function refers to how various ecological processes, such as the
production of organic matter, are accomplished and to the rates at which they occur. Because the
compositional, structural, and functional aspects of forest ecosystems are highly interdependent, it
is difficult to attribute observed changes on forest health and vitality to specific causes, especially
when one pressure may affect the three attributes simultaneously, or may affect one attribute that
can produce an indirect effect in the other two. This is recognised as the attribution problem
emphasised in Trumbore, et al. (2015), “no existing observing system can track ongoing changes in a
way that enables confident attribution of causes”. For instance, fire affects the structure of forests
but also its composition and diversity. In turn, this has an influence on forest ecosystem functions
and services. Similarly, land use change can lead to fragmentation, which also affects the three
ecological attributes.
Possible effects of pressures on key parameters and, in turn, on forest ecosystem services were
identified from literature review. Key parameters were selected according to Lausch, et al. (2016),
who provides an exhaustive classification of plant traits specifically designed for assessing forest
ecosystem health from remote sensing and ground information. The key parameters used in this
classification are also valid for in-situ forest monitoring approaches. For instance, the indicator
defoliation, used in the State of Europe’s Forest (FOREST EUROPE, 2015), is included in the key
parameter “Stress”. Similarly, soil fertility is in the “Biogeochemical and Biogeophysical” key
parameter.
The information regarding indicators and datasets on forest health in section “Expected impact of
pressures on forest ecosystems and services” was structured according the analytical framework,
specifically according to the key parameters and forest attributes described in Figure 2.
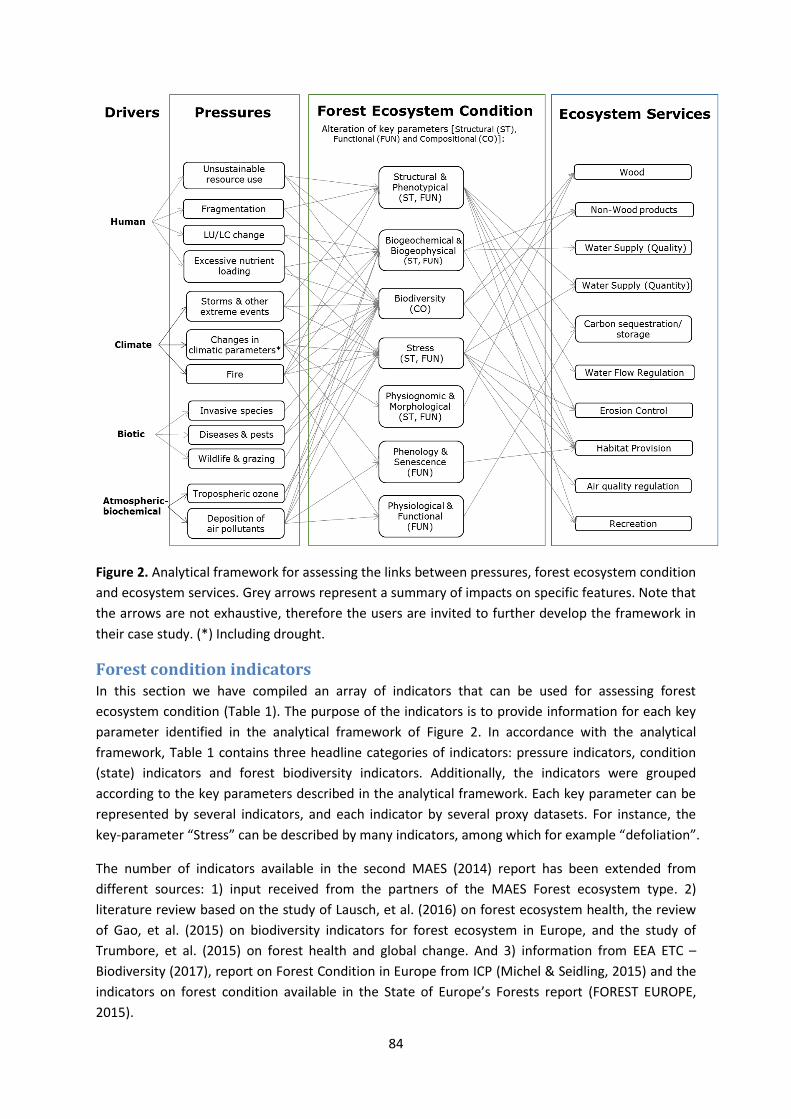
84
Figure 2. Analytical framework for assessing the links between pressures, forest ecosystem condition
and ecosystem services. Grey arrows represent a summary of impacts on specific features. Note that
the arrows are not exhaustive, therefore the users are invited to further develop the framework in
their case study. (*) Including drought.
Forest condition indicators In this section we have compiled an array of indicators that can be used for assessing forest
ecosystem condition (Table 1). The purpose of the indicators is to provide information for each key
parameter identified in the analytical framework of Figure 2. In accordance with the analytical
framework, Table 1 contains three headline categories of indicators: pressure indicators, condition
(state) indicators and forest biodiversity indicators. Additionally, the indicators were grouped
according to the key parameters described in the analytical framework. Each key parameter can be
represented by several indicators, and each indicator by several proxy datasets. For instance, the
key-parameter “Stress” can be described by many indicators, among which for example “defoliation”.
The number of indicators available in the second MAES (2014) report has been extended from
different sources: 1) input received from the partners of the MAES Forest ecosystem type. 2)
literature review based on the study of Lausch, et al. (2016) on forest ecosystem health, the review
of Gao, et al. (2015) on biodiversity indicators for forest ecosystem in Europe, and the study of
Trumbore, et al. (2015) on forest health and global change. And 3) information from EEA ETC –
Biodiversity (2017), report on Forest Condition in Europe from ICP (Michel & Seidling, 2015) and the
indicators on forest condition available in the State of Europe’s Forests report (FOREST EUROPE,
2015).

85
Following the MAES Urban study (MAES, 2016b) and despite that the focus of this study is EU scale,
we included in the indicators table information regarding the relevant spatial scale for each indicator.
As discussed previously, and shown in Box 1 (in annex), there is not a generally accepted scale
structure for classifying forest health and biodiversity indicators. In this study we adopted three
scale categories according to Winter, et al. (2011) and Williams (2004): forest stand/patch (1–100
ha), landscape (100 – 1000 ha) and ecological zone (1000 ha – to millions km2). Finally, the field
“Datasets” (to be completed) is included for describing the datasets and associated references that
can be used as proxy for each indicator.
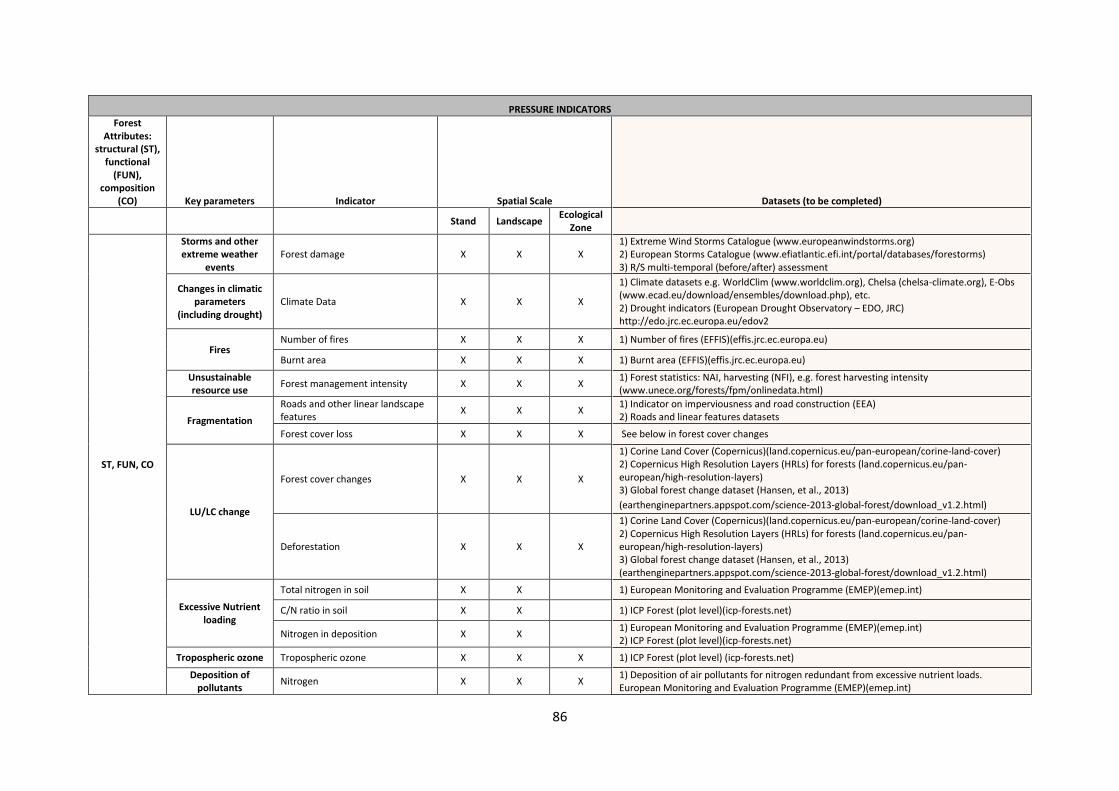
86
PRESSURE INDICATORS
Forest Attributes:
structural (ST), functional
(FUN), composition
(CO) Key parameters Indicator Spatial Scale Datasets (to be completed)
Stand Landscape
Ecological Zone
ST, FUN, CO
Storms and other extreme weather
events Forest damage X X X
1) Extreme Wind Storms Catalogue (www.europeanwindstorms.org) 2) European Storms Catalogue (www.efiatlantic.efi.int/portal/databases/forestorms) 3) R/S multi-temporal (before/after) assessment
Changes in climatic parameters
(including drought) Climate Data X X X
1) Climate datasets e.g. WorldClim (www.worldclim.org), Chelsa (chelsa-climate.org), E-Obs (www.ecad.eu/download/ensembles/download.php), etc. 2) Drought indicators (European Drought Observatory – EDO, JRC) http://edo.jrc.ec.europa.eu/edov2
Fires Number of fires X X X 1) Number of fires (EFFIS)(effis.jrc.ec.europa.eu)
Burnt area X X X 1) Burnt area (EFFIS)(effis.jrc.ec.europa.eu)
Unsustainable resource use
Forest management intensity X X X 1) Forest statistics: NAI, harvesting (NFI), e.g. forest harvesting intensity (www.unece.org/forests/fpm/onlinedata.html)
Fragmentation
Roads and other linear landscape features
X X X 1) Indicator on imperviousness and road construction (EEA) 2) Roads and linear features datasets
Forest cover loss X X X See below in forest cover changes
LU/LC change
Forest cover changes X X X
1) Corine Land Cover (Copernicus)(land.copernicus.eu/pan-european/corine-land-cover) 2) Copernicus High Resolution Layers (HRLs) for forests (land.copernicus.eu/pan-european/high-resolution-layers) 3) Global forest change dataset (Hansen, et al., 2013)
(earthenginepartners.appspot.com/science-2013-global-forest/download_v1.2.html)
Deforestation X X X
1) Corine Land Cover (Copernicus)(land.copernicus.eu/pan-european/corine-land-cover) 2) Copernicus High Resolution Layers (HRLs) for forests (land.copernicus.eu/pan-european/high-resolution-layers) 3) Global forest change dataset (Hansen, et al., 2013) (earthenginepartners.appspot.com/science-2013-global-forest/download_v1.2.html)
Excessive Nutrient loading
Total nitrogen in soil X X 1) European Monitoring and Evaluation Programme (EMEP)(emep.int)
C/N ratio in soil X X 1) ICP Forest (plot level)(icp-forests.net)
Nitrogen in deposition X X 1) European Monitoring and Evaluation Programme (EMEP)(emep.int) 2) ICP Forest (plot level)(icp-forests.net)
Tropospheric ozone Tropospheric ozone X X X 1) ICP Forest (plot level) (icp-forests.net)
Deposition of pollutants
Nitrogen X X X 1) Deposition of air pollutants for nitrogen redundant from excessive nutrient loads. European Monitoring and Evaluation Programme (EMEP)(emep.int)
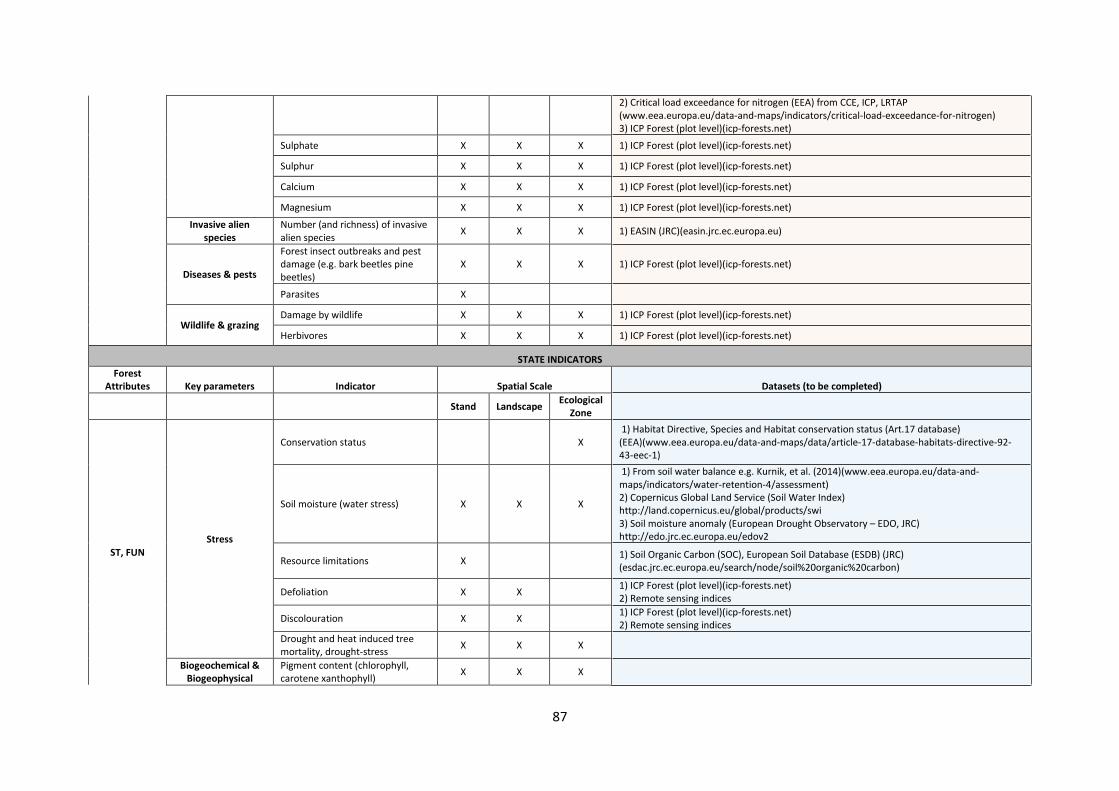
87
2) Critical load exceedance for nitrogen (EEA) from CCE, ICP, LRTAP (www.eea.europa.eu/data-and-maps/indicators/critical-load-exceedance-for-nitrogen) 3) ICP Forest (plot level)(icp-forests.net)
Sulphate X X X 1) ICP Forest (plot level)(icp-forests.net)
Sulphur X X X 1) ICP Forest (plot level)(icp-forests.net)
Calcium X X X 1) ICP Forest (plot level)(icp-forests.net)
Magnesium X X X 1) ICP Forest (plot level)(icp-forests.net)
Invasive alien species
Number (and richness) of invasive alien species
X X X 1) EASIN (JRC)(easin.jrc.ec.europa.eu)
Diseases & pests
Forest insect outbreaks and pest damage (e.g. bark beetles pine beetles)
X X X 1) ICP Forest (plot level)(icp-forests.net)
Parasites X
Wildlife & grazing Damage by wildlife X X X 1) ICP Forest (plot level)(icp-forests.net)
Herbivores X X X 1) ICP Forest (plot level)(icp-forests.net)
STATE INDICATORS
Forest Attributes Key parameters Indicator Spatial Scale Datasets (to be completed)
Stand Landscape
Ecological Zone
ST, FUN Stress
Conservation status X 1) Habitat Directive, Species and Habitat conservation status (Art.17 database) (EEA)(www.eea.europa.eu/data-and-maps/data/article-17-database-habitats-directive-92-43-eec-1)
Soil moisture (water stress) X X X
1) From soil water balance e.g. Kurnik, et al. (2014)(www.eea.europa.eu/data-and-maps/indicators/water-retention-4/assessment) 2) Copernicus Global Land Service (Soil Water Index) http://land.copernicus.eu/global/products/swi 3) Soil moisture anomaly (European Drought Observatory – EDO, JRC) http://edo.jrc.ec.europa.eu/edov2
Resource limitations X
1) Soil Organic Carbon (SOC), European Soil Database (ESDB) (JRC) (esdac.jrc.ec.europa.eu/search/node/soil%20organic%20carbon)
Defoliation X X 1) ICP Forest (plot level)(icp-forests.net) 2) Remote sensing indices
Discolouration X X 1) ICP Forest (plot level)(icp-forests.net) 2) Remote sensing indices
Drought and heat induced tree mortality, drought-stress
X X X
Biogeochemical & Biogeophysical
Pigment content (chlorophyll, carotene xanthophyll)
X X X
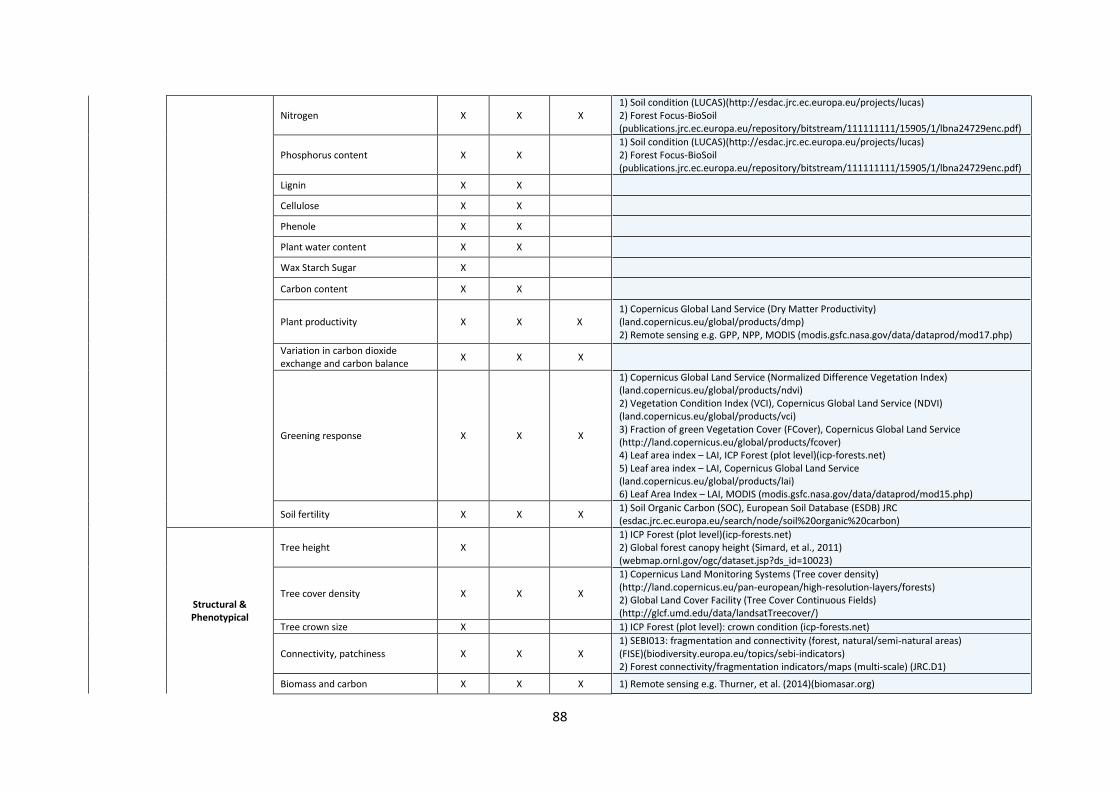
88
Nitrogen X X X 1) Soil condition (LUCAS)(http://esdac.jrc.ec.europa.eu/projects/lucas) 2) Forest Focus-BioSoil (publications.jrc.ec.europa.eu/repository/bitstream/111111111/15905/1/lbna24729enc.pdf)
Phosphorus content X X 1) Soil condition (LUCAS)(http://esdac.jrc.ec.europa.eu/projects/lucas) 2) Forest Focus-BioSoil (publications.jrc.ec.europa.eu/repository/bitstream/111111111/15905/1/lbna24729enc.pdf)
Lignin X X
Cellulose X X
Phenole X X
Plant water content X X
Wax Starch Sugar X
Carbon content X X
Plant productivity X X X 1) Copernicus Global Land Service (Dry Matter Productivity) (land.copernicus.eu/global/products/dmp) 2) Remote sensing e.g. GPP, NPP, MODIS (modis.gsfc.nasa.gov/data/dataprod/mod17.php)
Variation in carbon dioxide exchange and carbon balance
X X X
Greening response X X X
1) Copernicus Global Land Service (Normalized Difference Vegetation Index) (land.copernicus.eu/global/products/ndvi) 2) Vegetation Condition Index (VCI), Copernicus Global Land Service (NDVI) (land.copernicus.eu/global/products/vci) 3) Fraction of green Vegetation Cover (FCover), Copernicus Global Land Service (http://land.copernicus.eu/global/products/fcover) 4) Leaf area index – LAI, ICP Forest (plot level)(icp-forests.net) 5) Leaf area index – LAI, Copernicus Global Land Service (land.copernicus.eu/global/products/lai) 6) Leaf Area Index – LAI, MODIS (modis.gsfc.nasa.gov/data/dataprod/mod15.php)
Soil fertility X X X 1) Soil Organic Carbon (SOC), European Soil Database (ESDB) JRC (esdac.jrc.ec.europa.eu/search/node/soil%20organic%20carbon)
Structural & Phenotypical
Tree height X 1) ICP Forest (plot level)(icp-forests.net) 2) Global forest canopy height (Simard, et al., 2011) (webmap.ornl.gov/ogc/dataset.jsp?ds_id=10023)
Tree cover density X X X
1) Copernicus Land Monitoring Systems (Tree cover density) (http://land.copernicus.eu/pan-european/high-resolution-layers/forests) 2) Global Land Cover Facility (Tree Cover Continuous Fields) (http://glcf.umd.edu/data/landsatTreecover/)
Tree crown size X
1) ICP Forest (plot level): crown condition (icp-forests.net)
Connectivity, patchiness X X X 1) SEBI013: fragmentation and connectivity (forest, natural/semi-natural areas) (FISE)(biodiversity.europa.eu/topics/sebi-indicators) 2) Forest connectivity/fragmentation indicators/maps (multi-scale) (JRC.D1)
Biomass and carbon X X X 1) Remote sensing e.g. Thurner, et al. (2014)(biomasar.org)
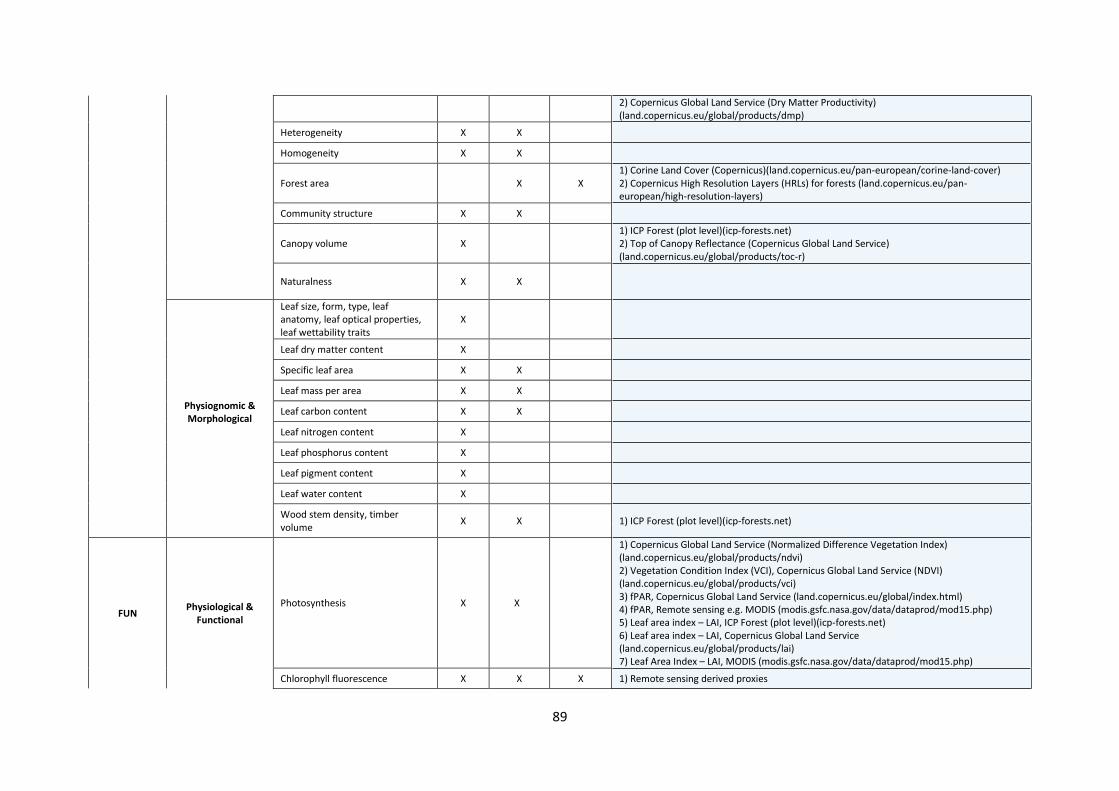
89
2) Copernicus Global Land Service (Dry Matter Productivity) (land.copernicus.eu/global/products/dmp)
Heterogeneity X X
Homogeneity X X
Forest area X X 1) Corine Land Cover (Copernicus)(land.copernicus.eu/pan-european/corine-land-cover) 2) Copernicus High Resolution Layers (HRLs) for forests (land.copernicus.eu/pan-european/high-resolution-layers)
Community structure X X
Canopy volume X 1) ICP Forest (plot level)(icp-forests.net) 2) Top of Canopy Reflectance (Copernicus Global Land Service) (land.copernicus.eu/global/products/toc-r)
Naturalness X X
Physiognomic & Morphological
Leaf size, form, type, leaf anatomy, leaf optical properties, leaf wettability traits
X
Leaf dry matter content X
Specific leaf area X X
Leaf mass per area X X
Leaf carbon content X X
Leaf nitrogen content X
Leaf phosphorus content X
Leaf pigment content X
Leaf water content X
Wood stem density, timber volume
X X 1) ICP Forest (plot level)(icp-forests.net)
FUN Physiological &
Functional
Photosynthesis X X
1) Copernicus Global Land Service (Normalized Difference Vegetation Index) (land.copernicus.eu/global/products/ndvi) 2) Vegetation Condition Index (VCI), Copernicus Global Land Service (NDVI) (land.copernicus.eu/global/products/vci) 3) fPAR, Copernicus Global Land Service (land.copernicus.eu/global/index.html) 4) fPAR, Remote sensing e.g. MODIS (modis.gsfc.nasa.gov/data/dataprod/mod15.php) 5) Leaf area index – LAI, ICP Forest (plot level)(icp-forests.net) 6) Leaf area index – LAI, Copernicus Global Land Service (land.copernicus.eu/global/products/lai) 7) Leaf Area Index – LAI, MODIS (modis.gsfc.nasa.gov/data/dataprod/mod15.php)
Chlorophyll fluorescence X X X 1) Remote sensing derived proxies
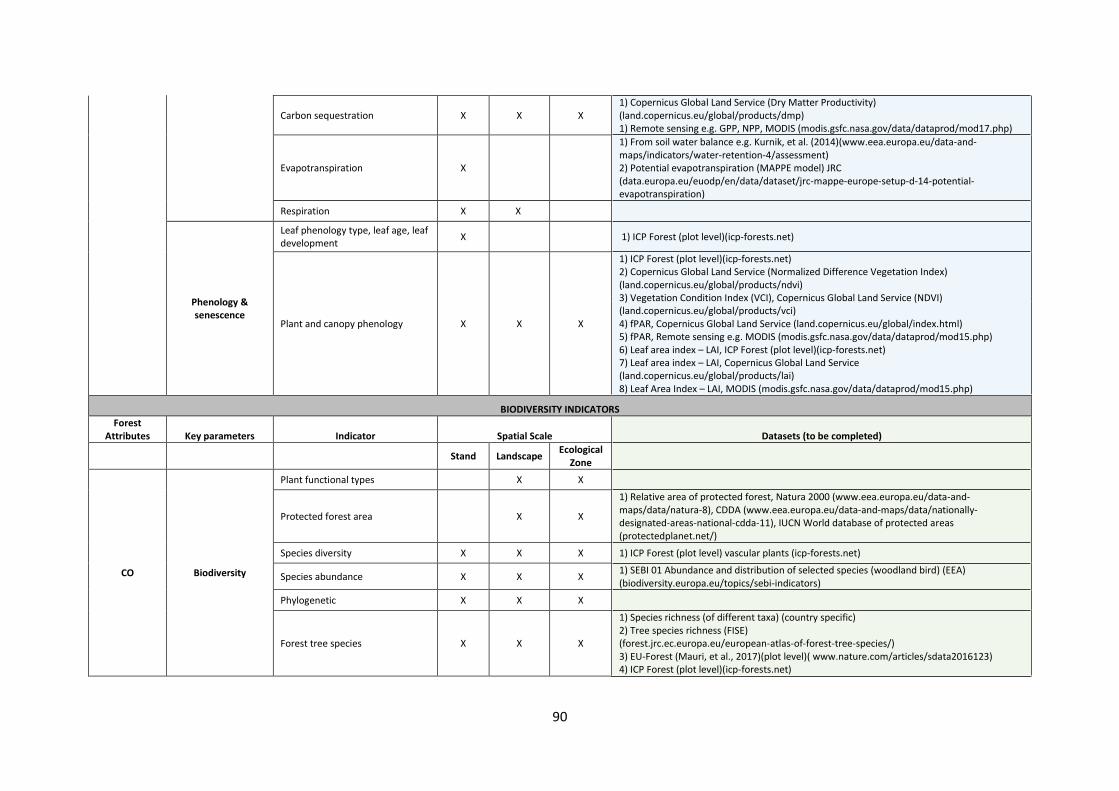
90
Carbon sequestration X X X 1) Copernicus Global Land Service (Dry Matter Productivity) (land.copernicus.eu/global/products/dmp) 1) Remote sensing e.g. GPP, NPP, MODIS (modis.gsfc.nasa.gov/data/dataprod/mod17.php)
Evapotranspiration X
1) From soil water balance e.g. Kurnik, et al. (2014)(www.eea.europa.eu/data-and-maps/indicators/water-retention-4/assessment) 2) Potential evapotranspiration (MAPPE model) JRC (data.europa.eu/euodp/en/data/dataset/jrc-mappe-europe-setup-d-14-potential-evapotranspiration)
Respiration X X
Phenology & senescence
Leaf phenology type, leaf age, leaf development
X 1) ICP Forest (plot level)(icp-forests.net)
Plant and canopy phenology X X X
1) ICP Forest (plot level)(icp-forests.net) 2) Copernicus Global Land Service (Normalized Difference Vegetation Index) (land.copernicus.eu/global/products/ndvi) 3) Vegetation Condition Index (VCI), Copernicus Global Land Service (NDVI) (land.copernicus.eu/global/products/vci) 4) fPAR, Copernicus Global Land Service (land.copernicus.eu/global/index.html) 5) fPAR, Remote sensing e.g. MODIS (modis.gsfc.nasa.gov/data/dataprod/mod15.php) 6) Leaf area index – LAI, ICP Forest (plot level)(icp-forests.net) 7) Leaf area index – LAI, Copernicus Global Land Service (land.copernicus.eu/global/products/lai) 8) Leaf Area Index – LAI, MODIS (modis.gsfc.nasa.gov/data/dataprod/mod15.php)
BIODIVERSITY INDICATORS
Forest Attributes Key parameters Indicator Spatial Scale Datasets (to be completed)
Stand Landscape Ecological
Zone
CO Biodiversity
Plant functional types X X
Protected forest area X X
1) Relative area of protected forest, Natura 2000 (www.eea.europa.eu/data-and-maps/data/natura-8), CDDA (www.eea.europa.eu/data-and-maps/data/nationally-designated-areas-national-cdda-11), IUCN World database of protected areas (protectedplanet.net/)
Species diversity X X X 1) ICP Forest (plot level) vascular plants (icp-forests.net)
Species abundance X X X 1) SEBI 01 Abundance and distribution of selected species (woodland bird) (EEA) (biodiversity.europa.eu/topics/sebi-indicators)
Phylogenetic X X X
Forest tree species X X X
1) Species richness (of different taxa) (country specific) 2) Tree species richness (FISE) (forest.jrc.ec.europa.eu/european-atlas-of-forest-tree-species/) 3) EU-Forest (Mauri, et al., 2017)(plot level)( www.nature.com/articles/sdata2016123) 4) ICP Forest (plot level)(icp-forests.net)
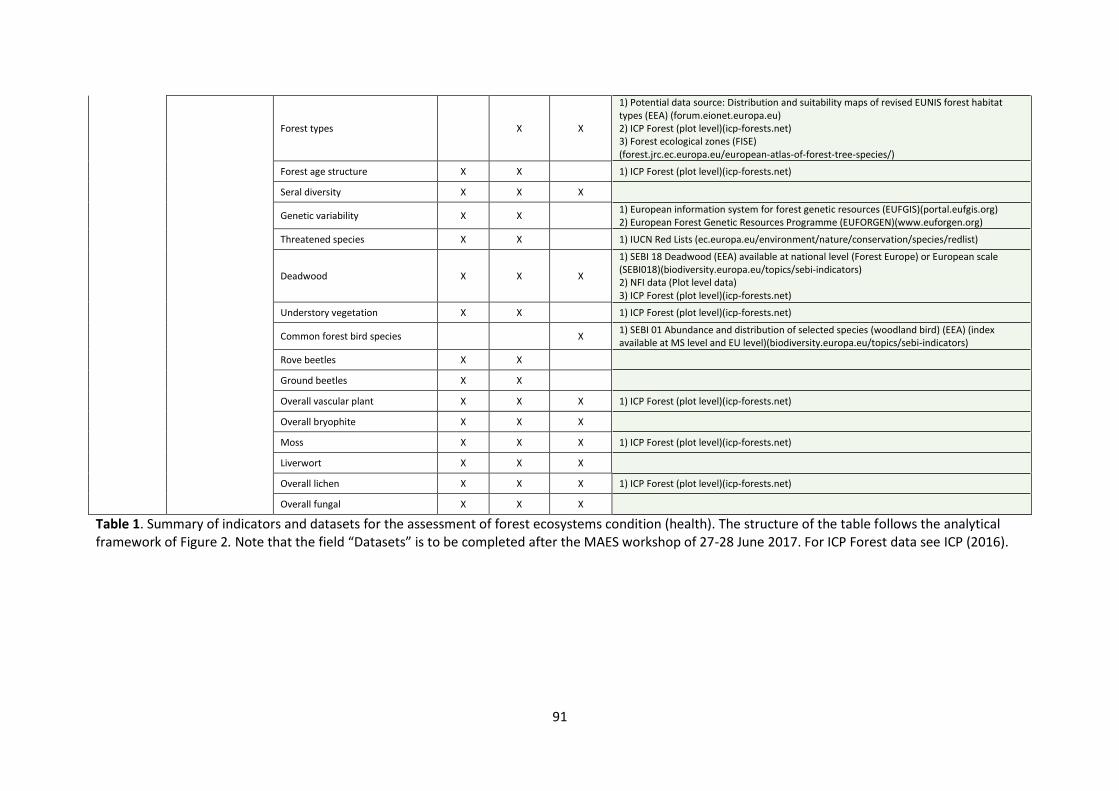
91
Forest types X X
1) Potential data source: Distribution and suitability maps of revised EUNIS forest habitat types (EEA) (forum.eionet.europa.eu) 2) ICP Forest (plot level)(icp-forests.net) 3) Forest ecological zones (FISE) (forest.jrc.ec.europa.eu/european-atlas-of-forest-tree-species/)
Forest age structure X X 1) ICP Forest (plot level)(icp-forests.net)
Seral diversity X X X
Genetic variability X X 1) European information system for forest genetic resources (EUFGIS)(portal.eufgis.org) 2) European Forest Genetic Resources Programme (EUFORGEN)(www.euforgen.org)
Threatened species X X 1) IUCN Red Lists (ec.europa.eu/environment/nature/conservation/species/redlist)
Deadwood X X X
1) SEBI 18 Deadwood (EEA) available at national level (Forest Europe) or European scale (SEBI018)(biodiversity.europa.eu/topics/sebi-indicators) 2) NFI data (Plot level data) 3) ICP Forest (plot level)(icp-forests.net)
Understory vegetation X X 1) ICP Forest (plot level)(icp-forests.net)
Common forest bird species X 1) SEBI 01 Abundance and distribution of selected species (woodland bird) (EEA) (index available at MS level and EU level)(biodiversity.europa.eu/topics/sebi-indicators)
Rove beetles X X
Ground beetles X X
Overall vascular plant X X X 1) ICP Forest (plot level)(icp-forests.net)
Overall bryophite X X X
Moss X X X 1) ICP Forest (plot level)(icp-forests.net)
Liverwort X X X
Overall lichen X X X 1) ICP Forest (plot level)(icp-forests.net)
Overall fungal X X X
Table 1. Summary of indicators and datasets for the assessment of forest ecosystems condition (health). The structure of the table follows the analytical framework of Figure 2. Note that the field “Datasets” is to be completed after the MAES workshop of 27-28 June 2017. For ICP Forest data see ICP (2016).
92
Expected impact of pressures on forest ecosystems and services
Forest ecosystems are exposed to pressures as part of their natural evolution, natural pressures
inside the range of normal background levels are important for several ecosystem processes. They
contribute to a healthy mix of patches and to maintain water balance, biomass and diversity at
landscape scale (Trumbore, et al., 2015). Healthy and vigorous forest ecosystems can return to its
initial state following the occurrence of pressures, within the “normal” boundary of occurrence, and
any resulting change to its systemic nature. In consequence, after the recovery period, the capacity
of providing ecosystem services is recovered as well. Nevertheless, novel human-driven pressures
such as unsustainable resource use, climate change, air pollutants or invasive pests, might push the
forest system to new states beyond the capacity of evolutionary adaptation, leading to forest decline
and unhealthy forests.
Attributing causal-effects relationships between forest pressures, ecosystem condition and
ecosystem services is challenging due to several reasons (Carpenter, et al., 2009; MA, 2005). First,
pressures can be the result of many interrelated factors such as drought and insect pests, or
fragmentation and water cycling. In most cases there is not a simple causal chain between pressures
and forest services, on the contrary, pressures are often interrelated by complex feedbacks with
ecosystem services. Second, pressures act at different temporal and spatial scales from sub-daily
effects to seasonal or multi-annual, and from single tree effects to stand/patch or landscape scale.
Finally, pressures can adopt different configurations depending on range, scope, duration, intensity,
continuity, dominance, and overlap. These different characteristics and its attributes can modify
notably the capacity of forest to provide services (Lausch, et al., 2016).
An example of cumulative effects of pressures is shown in Figure 3. In this example a healthy forest
patch of natural mixed forest provides a suite of ecosystem services. Then, the occurrence of a
drought event lasting from months to years and occurring at the landscape level, where the patch is
located, reduces tree vigour. As a consequence, the patch exhibits an increased vulnerability to
insect infestations. In the third stage, the stand is partially affected by insect infestations, some trees
are affected, and this produces an increased amount of fuel that facilitates fire ignition and
propagation. In the final stage, after fire occurrence, a pressure that may last from a few hours to
days, the effects are a proportion of dead trees and a weakened tree defense system. Which in turn
can facilitate future infestations. When these pressures occur with a frequency and magnitude
beyond background conditions, the forest system enters in a decline state (unhealthy) and the
capacity to provide ecosystem services is reduced. In this example, the pressures were represented
to occur sequentially. However, often they act overlapping each other temporally and spatially,
exhibiting many interactions. Therefore, their effects in forests are not independent, on the contrary,
they interact producing non-linear feedbacks with the forest system and its capacity to provide
ecosystem services (Carpenter, et al., 2009; Lausch, et al., 2016; Trumbore, et al., 2015).
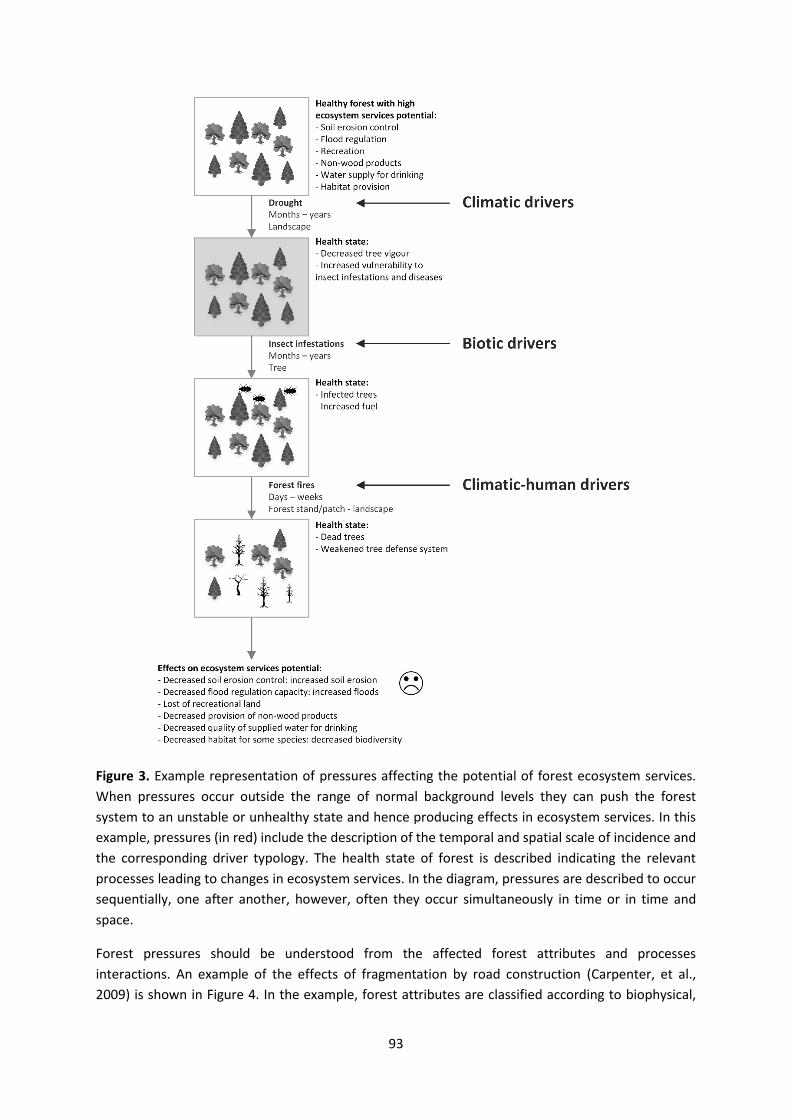
93
Figure 3. Example representation of pressures affecting the potential of forest ecosystem services.
When pressures occur outside the range of normal background levels they can push the forest
system to an unstable or unhealthy state and hence producing effects in ecosystem services. In this
example, pressures (in red) include the description of the temporal and spatial scale of incidence and
the corresponding driver typology. The health state of forest is described indicating the relevant
processes leading to changes in ecosystem services. In the diagram, pressures are described to occur
sequentially, one after another, however, often they occur simultaneously in time or in time and
space.
Forest pressures should be understood from the affected forest attributes and processes
interactions. An example of the effects of fragmentation by road construction (Carpenter, et al.,
2009) is shown in Figure 4. In the example, forest attributes are classified according to biophysical,
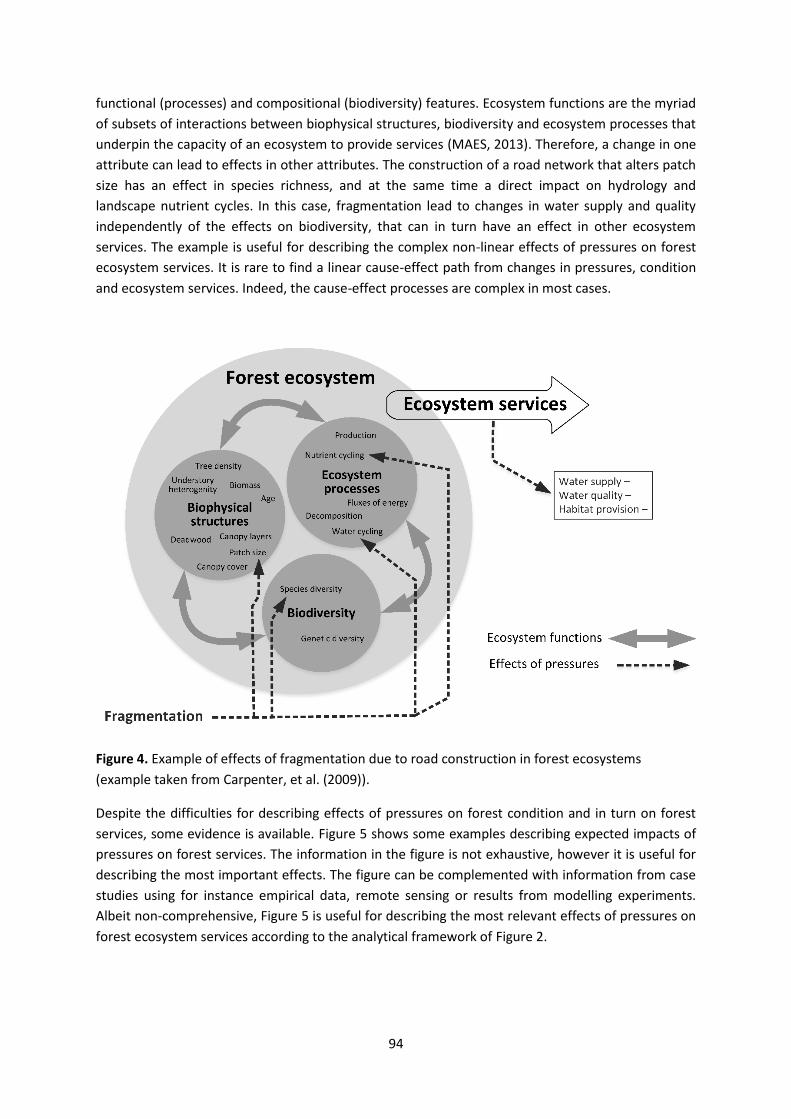
94
functional (processes) and compositional (biodiversity) features. Ecosystem functions are the myriad
of subsets of interactions between biophysical structures, biodiversity and ecosystem processes that
underpin the capacity of an ecosystem to provide services (MAES, 2013). Therefore, a change in one
attribute can lead to effects in other attributes. The construction of a road network that alters patch
size has an effect in species richness, and at the same time a direct impact on hydrology and
landscape nutrient cycles. In this case, fragmentation lead to changes in water supply and quality
independently of the effects on biodiversity, that can in turn have an effect in other ecosystem
services. The example is useful for describing the complex non-linear effects of pressures on forest
ecosystem services. It is rare to find a linear cause-effect path from changes in pressures, condition
and ecosystem services. Indeed, the cause-effect processes are complex in most cases.
Figure 4. Example of effects of fragmentation due to road construction in forest ecosystems
(example taken from Carpenter, et al. (2009)).
Despite the difficulties for describing effects of pressures on forest condition and in turn on forest
services, some evidence is available. Figure 5 shows some examples describing expected impacts of
pressures on forest services. The information in the figure is not exhaustive, however it is useful for
describing the most important effects. The figure can be complemented with information from case
studies using for instance empirical data, remote sensing or results from modelling experiments.
Albeit non-comprehensive, Figure 5 is useful for describing the most relevant effects of pressures on
forest ecosystem services according to the analytical framework of Figure 2.
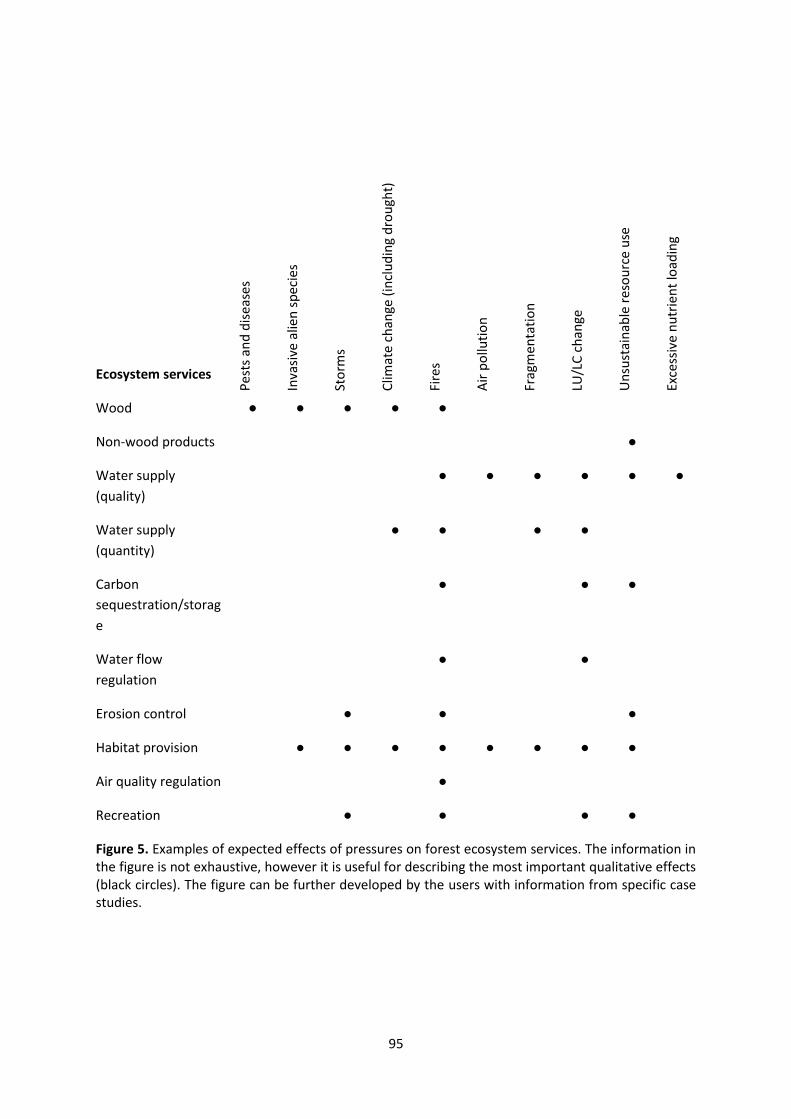
95
Ecosystem services
Pes
ts a
nd
dis
ease
s
Inva
sive
alie
n s
pec
ies
Sto
rms
Clim
ate
chan
ge (
incl
ud
ing
dro
ugh
t)
Fire
s
Air
po
lluti
on
Frag
men
tati
on
LU/L
C c
han
ge
Un
sust
ain
able
re
sou
rce
use
Exce
ssiv
e n
utr
ien
t lo
adin
g
Wood ● ● ● ● ●
Non-wood products ●
Water supply
(quality)
● ● ● ● ● ●
Water supply
(quantity)
● ● ● ●
Carbon
sequestration/storag
e
● ● ●
Water flow
regulation
● ●
Erosion control ● ● ●
Habitat provision ● ● ● ● ● ● ● ●
Air quality regulation ●
Recreation ● ● ● ●
Figure 5. Examples of expected effects of pressures on forest ecosystem services. The information in the figure is not exhaustive, however it is useful for describing the most important qualitative effects (black circles). The figure can be further developed by the users with information from specific case studies.
96
Glossary Conservation status (of a natural habitat): The sum of the influences acting on a natural habitat and
its typical species that may affect its long-term natural distribution, structure and functions as well
as the long-term survival of its typical species (Council of the European Communities, 1992; MAES,
2013).
Conservation status (of a species): The sum of the influences acting on the species concerned that
may affect the long-term distribution and abundance of its populations (Council of the European
Communities, 1992; MAES, 2013).
Ecosystem-Based Management (EBM): EBM, in the context of forest ecosystems, is defined as the
sustainable management of forest ecosystems, as well as the sustainable use of forest ecosystems
and their services, i.e. allowing for the maintenance of essential forest ecosystem functions. It is an
integrated approach to management that considers the interdependence of human activities,
ecosystems and human well-being, with a long-term outlook across different spatial scales. In
contrast, other approaches may focus on a single species, sector or issue, and have a short-term
outlook and limited spatial scale. Furthermore, EBM focuses on ecosystem services and evaluating
these services before management decisions are made (EEA, 2016).
Ecosystem condition: The capacity of an ecosystem to yield services, relative to its potential capacity
(MA, 2005). For the purpose of MAES, ecosystem condition is usually used as a synonym for
‘ecosystem state’(MAES, 2014).
Ecosystem Health (forest): There is not a unique definition of ecosystem health. On the contrary,
the concept can be defined only within the context of the desired values that a particular seral stage
of a forest ecosystem or a particular forest landscape is supposed to provide (Kimmins, 2004).
Ecosystem integrity (forest): The maintenance of an ecosystem within the range of conditions or
seral stage in which the process of autogenic succession operate normally to return the ecosystem
to or toward its pre-disturbance condition. Ecosystem integrity is very different from the integrity of
a particular seral stage or condition, such as the integrity of the old-growth condition. An ecosystem
that has been regressed from an old-growth condition to an earlier seral stage may not have
experienced any loss of ecosystem integrity, but there will have been a loss in the integrity of the
old-growth condition of that ecosystem (Kimmins, 2004).
Ecosystem state: The physical, chemical and biological condition of an ecosystem at a particular
point in time (MAES, 2013).
Ecosystem status: A classification of ecosystem state among several well-defined categories. It is
usually measured against time and compared to an agreed target in EU environmental directives (e.g.
HD, WFD, MSFD) (MAES, 2013).
Forest ecosystem: Can be defined on a range of scales. It is a dynamic complex of plant, animal and
microorganism communities, and their abiotic environment, that interact as a functional unit that
reflects the dominance of ecosystem conditions and processes by trees. Humans, with their cultural,
economic and environmental needs, are an integral part of many forest ecosystems (Convention on
Biological Diversity).
97
Forest ecosystem functions: The key functions of forest ecosystems are energy capture from the sun
through photosynthesis and its conversion to organic substances, which leads to processes such as
the production of biomass, the cycling of water and nutrients, and decomposition (Kimmins, 2004).
Forest ecosystem services: Defined as 'the direct and indirect contributions of forest ecosystems to
human well‑ being'. These include provisioning services such as food and water, regulating services
such as flood and disease control, and cultural services such as spiritual, recreational and cultural
benefits (MAES, 2014).
Sustainable Forest Management (SFM): Sustainable forest management means using forests and
forest land in a way, and at a rate, that maintains their biodiversity, productivity, regeneration
capacity, vitality and their potential to fulfil, now and in the future, relevant ecological, economic
and social functions, at local, national, and global levels, and that does not cause damage to other
ecosystems (European Commission, 2013).
List of acronyms and abbreviations
EEA: European Environmental Agency ETC-BD: European Topic Centre on Biological Diversity ETC-ULS: European Topic Centre on Urban, Land and Soil Ecosystems FAO: Food and Agriculture Organization of the United Nations FISE: Forest Information System for Europe ICP Forest: The International Cooperative Programme on Assessment and Monitoring of Air Pollution Effects on Forests JRC: Joint Research Centre LUCAS: Land Use/Cover Area frame statistical Survey MAES: Mapping and Assessment of Ecosystems and their Services MS: Member States SEBI: Streamlining European Biodiversity Indicators
98
Annex
Box 1. Assessing forest ecosystem health: scale issues. One critical aspect for assessing forest health is the observational scale of the indicators. At the level of each single tree, health can be defined as the absence of disease. However, when the assessment is implemented at larger spatial units, such as forest stands or biomes, indicators of forest health are more difficult to assess (Trumbore, et al., 2015). These difficulties have propelled scientific discussions for decades regarding an operational definition of forest ecosystem health (Costanza, et al., 1992; Trumbore, et al., 2015). Several authors have proposed scale levels for forest ecosystem assessment. Trumbore, et al. (2015) suggested four levels: tree, forest (stand), landscape and Globe. Noss (1990) proposed four levels of organisation: regional landscape, community-ecosystem, population-species and genetic. Finally, Lausch, et al. (2016) defined nine forest organisational levels: molecular, genetic, individual, species, population, community, ecosystem, landscape and biome.
99
Box 2. Definitions of forest health.
Kolb, et al. (1994) (ecosystem-centered perspective):
A healthy forest ecosystem has the following characteristics: the physical environment, biotic resources, and
trophic networks to support productive forests during at least some seral stages; resistance to catastrophic
change and/or the ability to recover from catastrophic change at the landscape level; a functional equilibrium
between supply and demand of essential resources (water, nutrients, light, growing space) for major portions of
the vegetation; and a diversity of seral stages and stand structures that provide habitat for many native species
and all essential ecosystem processes.
FAO (2017):
The FAO combined the utilitarian and the ecological perspectives by defining “forest health and vitality” based
on the combined presence of abiotic and biotic stresses and the way they affect tree growth and survival, the
yield and quality of wood and non-wood products, wildlife habitat, recreation and scenic and cultural values.
Edmonds, et al. (2000):
Edmonds, et al. (2000) combines the utilitarian and ecosystem perspectives to enumerate eight conditions of a
healthy forest: 1) an ecosystem in which abiotic and biotic factors do not threaten current and future
management objectives; 2) a fully functional community of plants and animals and their physical environment;
and 3) an ecosystem in balance that 4) sustains its complexity while providing for human needs, 5) is resilient to
change and 6) is able to recover from natural and human stressors while 7) maintaining and sustaining functions
and processes, and 8) is free of “distress” symptoms such as reduced primary productivity, loss of nutrient
capital, loss of biodiversity, or widespread incidence of disease or potentially tree-killing insects.
Kimmins (2004):
A stand-level forest is healthy when: the stand-level structure, species composition, ecosystem processes, and
pattern of change therein all are within the historical range exhibited by that ecosystem over temporal sequences
of seral stages that are characteristic for that ecosystem; the landscape pattern of forest ages and seral stages and
the temporal changes in that pattern are within the range that is characteristic for that landscape and to which the
biota are adapted.
Trumbore, et al. (2015):
A healthy forest is one that encompasses a mosaic of successional patches representing all stages of the natural
range of disturbance and recovery. Such forests promote a diversity of nutrient dynamics, cover types, and stand
structures, and they create a range of habitat niches for endemic fauna. The challenge is determining when the
frequency, spatial extent, and strength of stresses and disturbances exceed the natural range of variability and
affect the trajectory of vegetation recovery at the landscape to regional scale.
Millar and Stephenson (2015):
Forest health can be considered in the context of disturbances effects. Over a certain threshold forest change
from being healthy (resilient to disturbances) to become unhealthy as a consequence of mega disturbances.
Teale and Castello (2011):
The Society of American Foresters defines forest health as “the perceived condition of a forest derived from
concerns about such factors as its age, structure, composition, function, vigor, presence of unusual levels of
insects or disease, and resilience to disturbance.
EEA (2016):
From a forest manager's perspective, a healthy forest is one that has optimal levels of growth and that provides
the range of expected products, mainly wood products of a given quality, for placement on relevant markets,
whereas, from an ecological perspective, a healthy ecosystem is one that is able to maintain biodiversity and
ensure the long-term capacity of forest ecosystems to resist and respond to human-induced changes, and restore
ecosystem resilience now and for the future.
OMNR (2006):
A healthy forest is one that has the capacity to maintain its ecological functions while meeting the needs of
society. These ecological functions include moderating climate, filtering air and water, enriching the soil and
preventing soil erosion, providing a home for wildlife and regulating water flow. The needs are the values,
products and services that society seeks from its forests.
100
References
Carpenter, S. R., Mooney, H. A., Agard, J., Capistrano, D., DeFries, R. S., Díaz, S., Dietz, T., Duraiappah, A. K., Oteng-Yeboah, A., Pereira, H. M., Perrings, C., Reid, W. V., Sarukhan, J., Scholes, R. J., & Whyte, A. (2009). Science for managing ecosystem services: Beyond the Millennium Ecosystem Assessment. Proceedings of the National Academy of Sciences, 106 (5), 1305-1312.
Costanza, R., Norton, B., & Haskell, B. (1992). Ecosystem Health: New Goals for Environmental Management. Island Press, Washington, D.C.
Council of the European Communities. (1992). Council Directive 92/43/EEC of 21 May 1992 on the conservation of natural habitats and of wild fauna and flora. Official Journal of the European Communities. 206, 1-66.
Dajoz, R. (2000). Insects and forests: the role and diversity of insects in the forest environment. In. Intercept Limited, Andover.
Davis, B., Collins, P., & Kaplan, J. (2015). The age and post-glacial development of the modern European vegetation: a plant functional approach based on pollen data. 24 (2), 303-317.
Duncker, P. S., Raulund-Rasmussen, K., Gundersen, P., Katzensteiner, K., De Jong, J., Ravn, H. P., Smith, M., Eckmüllner, O., & Spiecker, H. (2012). How Forest Management affects Ecosystem Services, including Timber Production and Economic Return: Synergies and Trade-Offs. Ecology and Society, 17 (4).
Edmonds, R. L., Agee, J. K., & Gara, R. I. (2000). Forest Health and Protection. McGraw Hill, New York. EEA (2015). State of nature in the EU. European Environment Agency (EEA). No 2/2015. Publications
Office of the European Union. EEA (2016). European forest ecosystems - State and trends. European Environment Agency (EEA). No
5/2016. Publications Office of the European Union. EEA ETC – Biodiversity. (2017). Personal communication. European Commission. (2013). COM(2013) 659 final: A new EU Forest Strategy: for forests and the
forest-based sector. European Commission. 17. FAO (2010). Global Forest Resources Assessment 2010 - Main report. Food and Agriculture
Organisation of the United Nations (FAO). FAO (2015). Global Forest Resources Assessment 2015 - Desk reference. Food and Agriculture
Organisation of the United Nations (FAO). FAO. (2017). Forest health. Accesed: 04/05/2017. Available at:
http://www.fao.org/forestry/pests/en/ Finley, K., & Chhin, S. (2016). Forest Health Management and Detection of Invasive Forest Insects.
Resources, 5 (2), 18+. FOREST EUROPE (2015). State of Europe's Forests 2015. Ministerial Conference on the Protection of
Forests in Europe. Franklin, J. F., & Spies, T. A. (1991). Composition, function, and structure of old-growth Douglas-fir
forests. In L. F. Ruggiero, K. B. Aubry, A. B. Carey & M. H. Huff (Eds.), Wildlife and Vegetation of Unmanaged Douglas-Fir Forests. USDA, Portland.
Gao, T., Nielsen, A. B., & Hedblom, M. (2015). Reviewing the strength of evidence of biodiversity indicators for forest ecosystems in Europe. Ecological Indicators, 57, 420-434.
Giesecke, T., Brewer, S., Finsinger, W., Leydet, M., & Bradshaw, R. H. W. (2017). Patterns and dynamics of European vegetation change over the last 15,000 years. J. Biogeogr., n/a.
Grizzetti, B., Lanzanova, D., Liquete, C., Reynaud, A., & Cardoso, A. C. (2016). Assessing water ecosystem services for water resource management. Environmental Science & Policy, 61, 194-203.
Hansen, M. C., Potapov, P. V., Moore, R., Hancher, M., Turubanova, S. A., Tyukavina, A., Thau, D., Stehman, S. V., Goetz, S. J., Loveland, T. R., Kommareddy, A., Egorov, A., Chini, L., Justice, C.
101
O., & Townshend, J. R. G. (2013). High-Resolution Global Maps of 21st-Century Forest Cover Change. Science, 342 (6160), 850-853.
ICP (2016). Forest Condition in Europe: 2016 Technical Report of ICP Forests. Report under the UNECE Convention on Long-Range Transboundary Air Pollution (CLRTAP). Austrian Research and Training Centre for Forests, Natural Hazards and Landscape (BFW). 978-3-902762-65-8. A. Michel & W. Seidling.
Innes, J. L., & Tikina, A. V. (2017). Sustainable Forest Management - From Concept to Practice. Routledge, UK.
Kimmins, J. P. (2004). Forest ecology - a foundation for sustainable forest management and environmental ethics in forestry. Prentice-Hall,, Upper Saddle River, N.J.
Kolb, T. E., Wagner, M. R., & Covington, W. W. (1994). Concepts of Forest Health - Utilitarian and Ecosystem Perspectives. Journal of Forestry, 92 (7), 10-15.
Kurnik, B., Louwagie, G., Erhard, M., Ceglar, A., & Bogataj Kajfež, L. (2014). Analysing Seasonal Differences between a Soil Water Balance Model and in Situ Soil Moisture Measurementsat Nine Locations Across Europe. Environmental Modeling & Assessment, 19 (1), 19-34.
Lausch, A., Erasmi, S., King, D., Magdon, P., & Heurich, M. (2016). Understanding Forest Health with Remote Sensing -Part I—A Review of Spectral Traits, Processes and Remote-Sensing Characteristics. Remote Sensing, 8 (12), 1029+.
Lorenz, M. (2004). Monitoring of forest condition in Europe. Towards the Sustainable Use of Europe's Forests - Forest Ecosystem and Landscape Research: Scientific Challenges and Opportunities (49), 73-83.
MA. (2005). Ecosystems and human well-being: biodiversity synthesis. World Resources Institute, Washington, D.C. (USA).
MAES (2013). Mapping and Assessment of Ecosystems and their Services - An analytical framework for ecosystem assessments under Action 5 of the EU Biodiversity Strategy to 2020. Technical Report - 2013 - 067. Publications office of the European Union.
MAES (2014). Mapping and Assessment of Ecosystems and their Services - Indicators for ecosystem assessments under Action 5 of the EU Biodiversity Strategy to 2020. Technical Report - 2014 - 080. Publications office of the European Union.
MAES (2016a). Mapping and Assessment of Ecosystems and their Services - Mapping and assessing the condition of Europe’s ecosystems: Progress and challenges. Technical Report - 2016 - 095. Publications office of the European Union.
MAES (2016b). Mapping and Assessment of Ecosystems and their Services - Urban ecosystems 4th Report. Technical Report - 2016 - 102. Publications office of the European Union.
Mauri, A., Strona, G., & San-Miguel-Ayanz, J. (2017). EU-Forest, a high-resolution tree occurrence dataset for Europe. Scientific Data, 4, 160123.
McElhinny, C. (2002). Forest and woodland structure as an index of biodiversity: a review. In A. N. University (Ed.).
Michel, A., & Seidling, W. (2015). Forest Condition in Europe. 2015 Technical Report of ICP Forests. Report under the UNECE Convention on Long-Range Transboundary Air Pollution (CLRTAP). ICP Forest. BFW-Dokumentation 21/2015.
Millar, C. I., & Stephenson, N. L. (2015). Temperate forest health in an era of emerging megadisturbance. Science, 349 (6250), 823-826.
Noss, R. F. (1990). Indicators for Monitoring Biodiversity - a Hierarchical Approach. Conservation Biology, 4 (4), 355-364.
OMNR (2006). The State of Canada's Forests 2005-2006. Ontario Ministry of Natural Resources (OMNR), Forest Branch.
Pautasso, M., Schlegel, M., & Holdenrieder, O. (2015). Forest Health in a Changing World. 69 (4), 826-842.
Raffa, K. F., Aukema, B., Bentz, B. J., Carroll, A., Erbilgin, N., Herms, D. A., Hicke, J. A., Hofstetter, R. W., Katovich, S., Lindgren, B. S., Logan, J., Mattson, W., Munson, A. S., Robison, D. J., Six, D.
102
L., Tobin, P. C., Townsend, P. A., & Wallin, K. F. (2009). A Literal Use of "Forest Health" Safeguards against Misuse and Misapplication. Journal of Forestry, 107 (5), 276-277.
Ramsfield, T. D., Bentz, B. J., Faccoli, M., Jactel, H., & Brockerhoff, E. G. (2016). Forest health in a changing world: effects of globalization and climate change on forest insect and pathogen impacts. Forestry, 89 (3), 245-252.
Simard, M., Pinto, N., Fisher, J. B., & Baccini, A. (2011). Mapping forest canopy height globally with spaceborne lidar. Journal of Geophysical Research: Biogeosciences, 116 (G4), n/a-n/a.
Stanturf, J., Lamb, D., & Madsen, P. (2012). Forest Landscape Restoration: integrating natural and social sciences. Springer, Dordrecht, The Netherlands.
Steffen, W., Richardson, K., Rockström, J., Cornell, S. E., Fetzer, I., Bennett, E. M., Biggs, R., Carpenter, S. R., de Vries, W., de Wit, C. A., Folke, C., Gerten, D., Heinke, J., Mace, G. M., Persson, L. M., Ramanathan, V., Reyers, B., & Sörlin, S. (2015). Planetary boundaries: Guiding human development on a changing planet. Science, 347 (6223), 1259855.
Strona, G., Mauri, A., Veech, J. A., Seufert, G., San-Miguel Ayanz, J., & Fattorini, S. (2016). Far from Naturalness: How Much Does Spatial Ecological Structure of European Tree Assemblages Depart from Potential Natural Vegetation? PLoS ONE, 11 (12), e0165178+.
Teale, S., & Castello, J. (2011). The past as a key to the future: A new perspective on forest health. In J. Castello & S. Teale (Eds.), (pp. 3-16). Cambridge: Cambridge University Press.
Thurner, M., Beer, C., Santoro, M., Carvalhais, N., Wutzler, T., Schepaschenko, D., Shvidenko, A., Kompter, E., Ahrens, B., Levick, S. R., & Schmullius, C. (2014). Carbon stock and density of northern boreal and temperate forests. Global Ecology and Biogeography, 23 (3), 297-310.
Trumbore, S., Brando, P., & Hartmann, H. (2015). Forest health and global change. Science, 349 (6250), 814-818.
UN (2000). Forest Resources of Europe, CIS, North America, Australia, Japan and New Zealand. United Nations.
USDA (1993). Healthy forests for America's future: a strategic plan. USDA Forest Service. van Lierop, P., Lindquist, E., Sathyapala, S., & Franceschini, G. (2015). Global forest area disturbance
from fire, insect pests, diseases and severe weather events. Forest Ecology and Management, 352, 78-88.
Verkerk, P. J., Mavsar, R., Giergiczny, M., Lindner, M., Edwards, D., & Schelhaas, M. J. (2014). Assessing impacts of intensified biomass production and biodiversity protection on ecosystem services provided by European forests. Ecosystem Services, 9, 155-165.
Williams, J. (2004). Metrics for assessing the biodiversity values of farming systems and agricultural landscapes. Pacific Conservation Biology, 10, 145–163.
Winter, S., McRoberts, R. E., Chirici, G., Bastrup-Birk, A., Rondeux, J., Brändli, U.-B., Ørnelund Nilsen, J.-E., & Marchetti, M. (2011). The Need for Harmonized Estimates of Forest Biodiversity Indicators. In G. Chirici, S. Winter & R. E. McRoberts (Eds.), National Forest Inventories: Contributions to Forest Biodiversity Assessments (Vol. 20, pp. 1-23). Springer Netherlands.
103
Agroecosystems20
MAES Agroecosystem Pilot on Condition This document contains the proposal on how to define, map and assess condition of agroecosystems
in the frame of the MAES process. The document is grounded on existing MAES reports, EC/EEA
reports, and scientific literature.
This version represents work in progress and needs to be further revised and complemented on the
basis of the workshop discussions and additional research.
The document is organised according to the following structure:
1. Definition(s) of condition for different ecosystem types; 2. Indicator framework; 3. Link between condition and services; 4. Link between indicators and spatial data collection
Condition of agroecosystems Agriculture was introduced in Europe about 9000 ago, and in a period of four millennia it has spread
all over the continent. In the following 5000 years until today it has shaped and changed the face of
European landscapes. Nowadays agricultural land use is the primary land use in the European Union,
accounting for 45% of its total area. Agroecosystems are communities of plants and animals
interacting with their physical and chemical environments that have been modified by people to
produce food, fibre, fuel and other products for human consumption and processing (M.Altieri). The
MAES process has so far classified agroecosystems into cropland and grassland ecosystems (first
MAES report). Cropland is the main food production area including both intensively managed
ecosystems and multifunctional areas supporting many semi- and natural species along with food
production (lower intensity management). It includes regularly or recently cultivated agricultural,
horticultural and domestic habitats (incl. associated landscape elements) and agro-ecosystems with
significant coverage of natural vegetation (agricultural mosaics). Grassland covers areas dominated
by grassy vegetation (but including tall forbs, mosses and lichens) of two kinds – intensively
managed pastures and fodder production, and (semi-)natural (extensively managed) grasslands.
Box 1 Considerations on definitions of ecosystems and use of typologies/classifications
The EU MAES initiative aims to provide the knowledge base to support the EU Biodiversity Strategy
to 2020. This implies the adoption of a pragmatic approach to categorise broad ecosystem types
based on the European nature information system (EUNIS) for habitats and Corine Land Cover
classes (cf. MAES typology). This is a simplification while it is evident that a clear limit between
ecosystem types cannot be defined on the ground and different criteria (vegetation, abiotic
20 Lead partner: JRC D.5 Contributing partners: ENV, EEA, ETC BD, ETC ULS
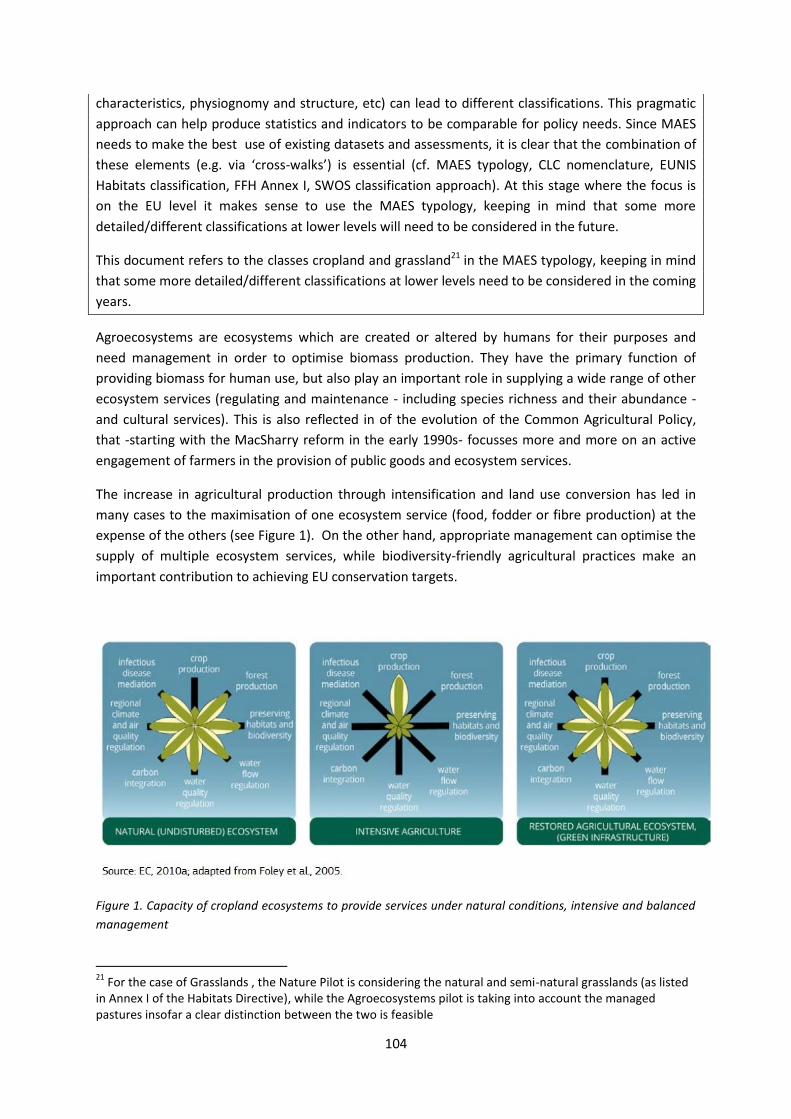
104
characteristics, physiognomy and structure, etc) can lead to different classifications. This pragmatic
approach can help produce statistics and indicators to be comparable for policy needs. Since MAES
needs to make the best use of existing datasets and assessments, it is clear that the combination of
these elements (e.g. via ‘cross-walks’) is essential (cf. MAES typology, CLC nomenclature, EUNIS
Habitats classification, FFH Annex I, SWOS classification approach). At this stage where the focus is
on the EU level it makes sense to use the MAES typology, keeping in mind that some more
detailed/different classifications at lower levels will need to be considered in the future.
This document refers to the classes cropland and grassland21 in the MAES typology, keeping in mind
that some more detailed/different classifications at lower levels need to be considered in the coming
years.
Agroecosystems are ecosystems which are created or altered by humans for their purposes and
need management in order to optimise biomass production. They have the primary function of
providing biomass for human use, but also play an important role in supplying a wide range of other
ecosystem services (regulating and maintenance - including species richness and their abundance -
and cultural services). This is also reflected in of the evolution of the Common Agricultural Policy,
that -starting with the MacSharry reform in the early 1990s- focusses more and more on an active
engagement of farmers in the provision of public goods and ecosystem services.
The increase in agricultural production through intensification and land use conversion has led in
many cases to the maximisation of one ecosystem service (food, fodder or fibre production) at the
expense of the others (see Figure 1). On the other hand, appropriate management can optimise the
supply of multiple ecosystem services, while biodiversity-friendly agricultural practices make an
important contribution to achieving EU conservation targets.
Figure 1. Capacity of cropland ecosystems to provide services under natural conditions, intensive and balanced
management
21
For the case of Grasslands , the Nature Pilot is considering the natural and semi-natural grasslands (as listed in Annex I of the Habitats Directive), while the Agroecosystems pilot is taking into account the managed pastures insofar a clear distinction between the two is feasible
105
The process of defining agroecosystem condition should take into account the following
considerations:
in Europe, the conversion of natural ecosystems into agroecosystems is a process
that spans through nine millennia; agricultural production is subject to socio-
economic drivers and subsequent direct and indirect pressures, and societal
priorities that fluctuate over time, and this makes very difficult identifying what a
good condition is;
for agroecosystems, agreement by multiple actors about the definition of “good
condition” is available for natural or semi-natural grasslands when covered by the
nature legislation (Annex I habitats of Habitats Directive), but very little exists for
cropland which could serve as a starting point for the discussion in this document (in
contrast to freshwater ecosystems for which the definition of good environmental
status in the Water Framework Directive can be applied).
Nevertheless, recent policy actions aiming at enhancing sustainability in the use and management of
our natural capital are applicable to agroecosystems as an essential element both in terms of
importance and spatial extension, and scientific research has identified potential boundary
conditions for this exercise:
the UN, in the identification of Sustainable Development Goals, set a strong focus on
the need to guarantee a healthy environment, harmony with nature, sustainable
management of natural resources, to support the needs of present and future
generations;
the EC, in the EU Biodiversity Strategy to 2020 sets as headline target for 2020
“Halting the loss of biodiversity and the degradation of ecosystem services in the EU
by 2020, and restoring them in so far as feasible, while stepping up the EU
contribution to averting global biodiversity loss”. In particular, Target 3A of the
Strategy addresses specifically agriculture: “By 2020, maximise areas under
agriculture across grasslands, arable land and permanent crops that are covered by
biodiversity-related measures under the CAP so as to ensure the conservation of
biodiversity and to bring about a measurable improvement(*) in the conservation
status of species and habitats that depend on or are affected by agriculture and in
the provision of ecosystem services as compared to the EU2010 Baseline, thus
contributing to enhance sustainable management”.
the Fitness Check of the Nature Directives has recently revealed that the Natura
2000 network alone cannot deliver the Directives' objectives. Habitat and landscape
management and restoration measures through Green Infrastructure (GI) are
needed, both within and outside Natura 2000 sites, with a view to achieving
favourable conservation status of protected habitats and species and ensuring the
coherence of the Natura 2000 network, whilst delivering multiple environmental,
106
economic and social benefits through enhanced ecosystem services, such as climate
change mitigation and adaptation (Fritz et al., 2017).
Certain articles of the Habitats Directive (Art. 6, 12, 16 and 17) require Member
States to report on the conservation status of habitats and species. In particular, the
concept of favourable reference values (FRVs) is derived from definitions in the
Directive, particularly the definition of favourable conservation status that relates for
habitats to the ‘long term natural distribution, structure and functions as well as the
long‐term survival of its typical species’ in their natural range (Article 1e). For habitat
types, the Directive requires that the specific structure and functions necessary for
its long‐term maintenance exist and will continue to exist and that its typical species
are in favourable status, i.e. are maintaining themselves on a long‐term basis (Draft
section on Favourable Reference Values – Article 17 reporting guidelines).
Steffen et al., (2015) in their Science paper on Planetary Boundaries identify the
erosion of genetic diversity and perturbations of phosphorus and nitrogen cycling as
control variables for planetary boundaries, which are at high risk that human
perturbations will destabilize the Earth System at the planetary scale. Agriculture
plays a major role in the management of all three of these variables.
The key points that can be extracted from this list are:
the need to take account of sustainability in managing the natural resources that
agriculture depends upon;
the importance of the temporal dimension to take the needs of future generations
into account;
the request to enhance ecosystem services provided by agriculture;
the urgent need to halt the loss of biodiversity, and to reduce nitrogen and
phosphorus enrichment;
the references to assess the conservation status of habitats and species.
Based on the policy and scientific targets set out above, the condition of agroecosystems can be
defined as follows:
Agroecosystems are modified ecosystems, they are in good condition when they support biodiversity,
abiotic resources (soil-water-air) are not depleted, and they provide a balanced supply of ecosystem
services (provisioning, regulating, cultural). Sustainable management is key to reaching or
maintaining a good condition, with the aim to increase resilience and maintain the capacity of
delivering services to current and future generations.
Assessment framework Ecosystem condition is a key element of the MAES framework (MAES 2013), which is connected to
two other core elements: pressures and ecosystem services. To develop such a framework for
agroecosystems we followed the fourth MAES (2016a) report and the exercise by Grizzetti et al.
(2016b).

107
The definition of agroecosystem condition can be used to build the framework for the assessment,
by describing each compartment with key variables/parameters (Figure 2).
Why and how a certain crop is cultivated in a certain area depends on a high number of factors
(climate, relief, soil type, marketability, profitability, availability of nutrients, available technology,
farmers education level etc.) therefore it is extremely difficult to identify what “good condition” is
for agroecosystems in absolute terms. A reference for assessing grasslands condition is the
framework adopted under the Habitats Directive art.17 reporting. This does not mean that grassland
habitats that are not protected, and cropland habitats in general cannot be in good condition. The
assessment of condition is based on several parameters, and cases may exist of agroecosystems (i.e.
High Nature Value farmland) not including protected habitats that can be considered in good
condition.
The assessment framework is organised as follows:
Pressures are those actions/changes that impact on the capacity (present and future) of
agroecosystems to maintain biodiversity and deliver ecosystem services (including providing food,
feed and fibre). They have been classified in the 3rd MAES Report in: habitat changes (here called:
land use change), climate change, overexploitation, invasive alien species, pollution and nutrient
enrichment. Examples are conversion to other land uses (land take), landscape fragmentation, soil
erosion, excess of nutrient input, use of pesticides etc. In most cases, pressures originate from
human activities, in other cases they can originate from climate and biotic drivers.
Agroecosystem condition can be described by two groups of parameters:
1. Biological factors: biodiversity and genetic diversity are a key element of agroecosystems that
impacts on the sustainability of the agricultural production system itself but also impact
maintenance of habitats and species depending on agriculture as well as other species. As
agroecosystems are shaped by human land management this group also includes some parameters
that represent aspects of the agricultural system that have an impact on farmland species richness.
It has to be noted that landscape fragmentation occurs both under pressures and condition. In the
first case, it is intended in the wider sense as fragmentation by infrastructures and land take, in the
second more specifically as fragmentation of specific habitats and loss of connectivity;
2. the abiotic factors affecting and affected by agricultural management (like soil and water), and
describing productivity trends; where environmental legislation applies, the definition of status
should be used (cf. water and nature legislation)22. As the impact of farming on the condition of the
abiotic environment is strongly influenced by the use of external inputs and agricultural productivity,
this group again contains parameters that relate to the farming system itself.
The delivery of ecosystem services is affected by the alteration of ecosystem condition, and links can
be found between different ecosystem services and the key parameters of agroecosystem condition
(see Figure 2).
22
See Nature and Freshwater Pilots
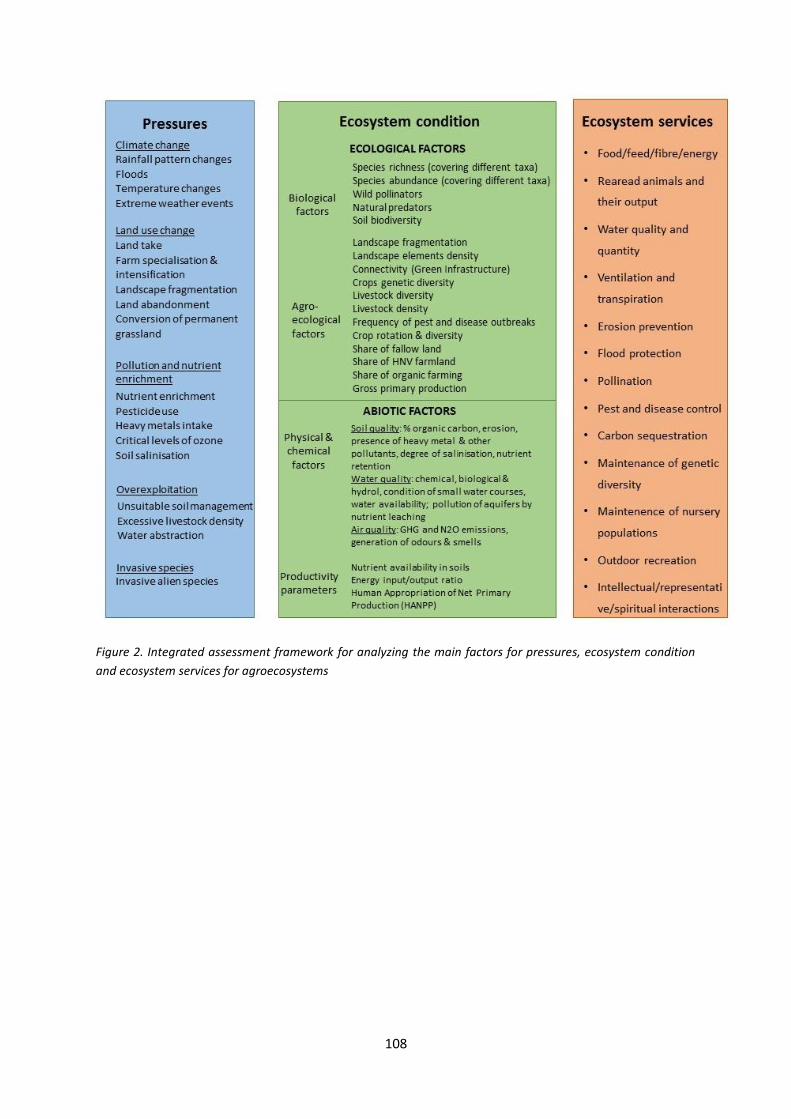
108
Figure 2. Integrated assessment framework for analyzing the main factors for pressures, ecosystem condition
and ecosystem services for agroecosystems
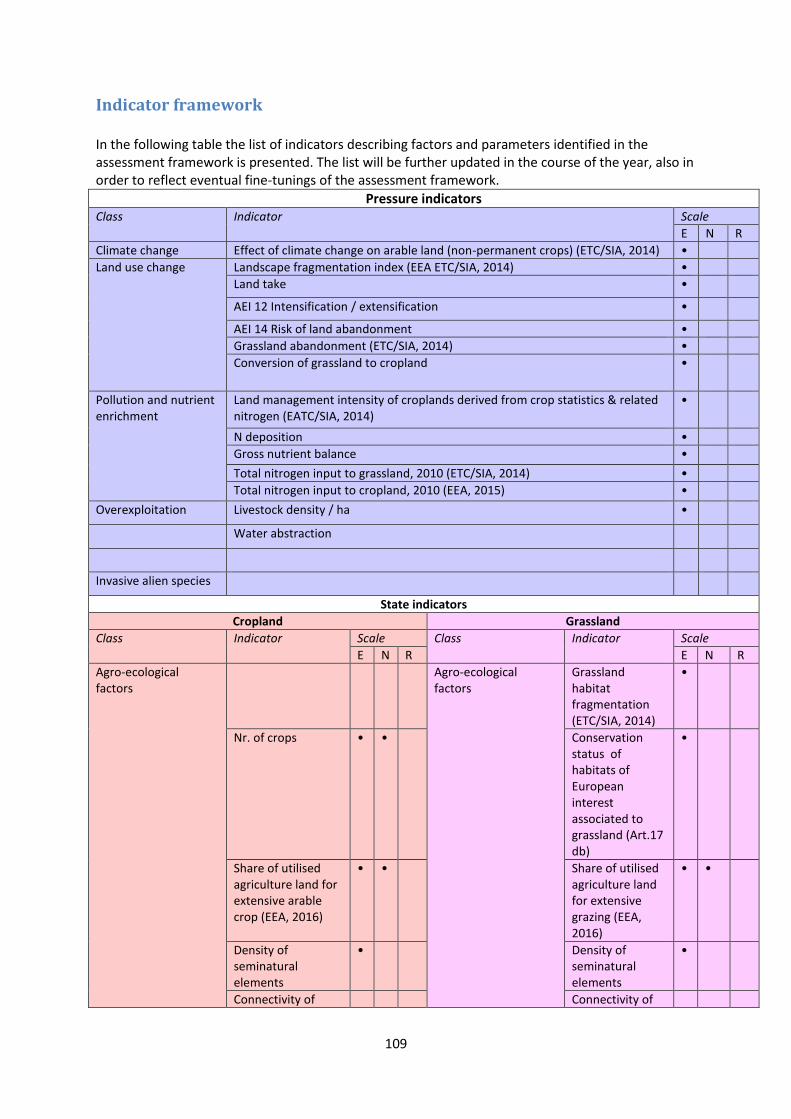
109
Indicator framework In the following table the list of indicators describing factors and parameters identified in the assessment framework is presented. The list will be further updated in the course of the year, also in order to reflect eventual fine-tunings of the assessment framework.
Pressure indicators Class Indicator Scale
E N R
Climate change Effect of climate change on arable land (non-permanent crops) (ETC/SIA, 2014) •
Land use change Landscape fragmentation index (EEA ETC/SIA, 2014) •
Land take •
AEI 12 Intensification / extensification •
AEI 14 Risk of land abandonment •
Grassland abandonment (ETC/SIA, 2014) •
Conversion of grassland to cropland •
Pollution and nutrient enrichment
Land management intensity of croplands derived from crop statistics & related nitrogen (EATC/SIA, 2014)
•
N deposition •
Gross nutrient balance •
Total nitrogen input to grassland, 2010 (ETC/SIA, 2014) •
Total nitrogen input to cropland, 2010 (EEA, 2015) •
Overexploitation Livestock density / ha •
Water abstraction
Invasive alien species
State indicators
Cropland Grassland
Class Indicator Scale Class Indicator Scale
E N R E N R
Agro-ecological factors
Agro-ecological factors
Grassland habitat fragmentation (ETC/SIA, 2014)
•
Nr. of crops • • Conservation status of habitats of European interest associated to grassland (Art.17 db)
•
Share of utilised agriculture land for extensive arable crop (EEA, 2016)
• • Share of utilised agriculture land for extensive grazing (EEA, 2016)
• •
Density of seminatural elements
• Density of seminatural elements
•
Connectivity of Connectivity of
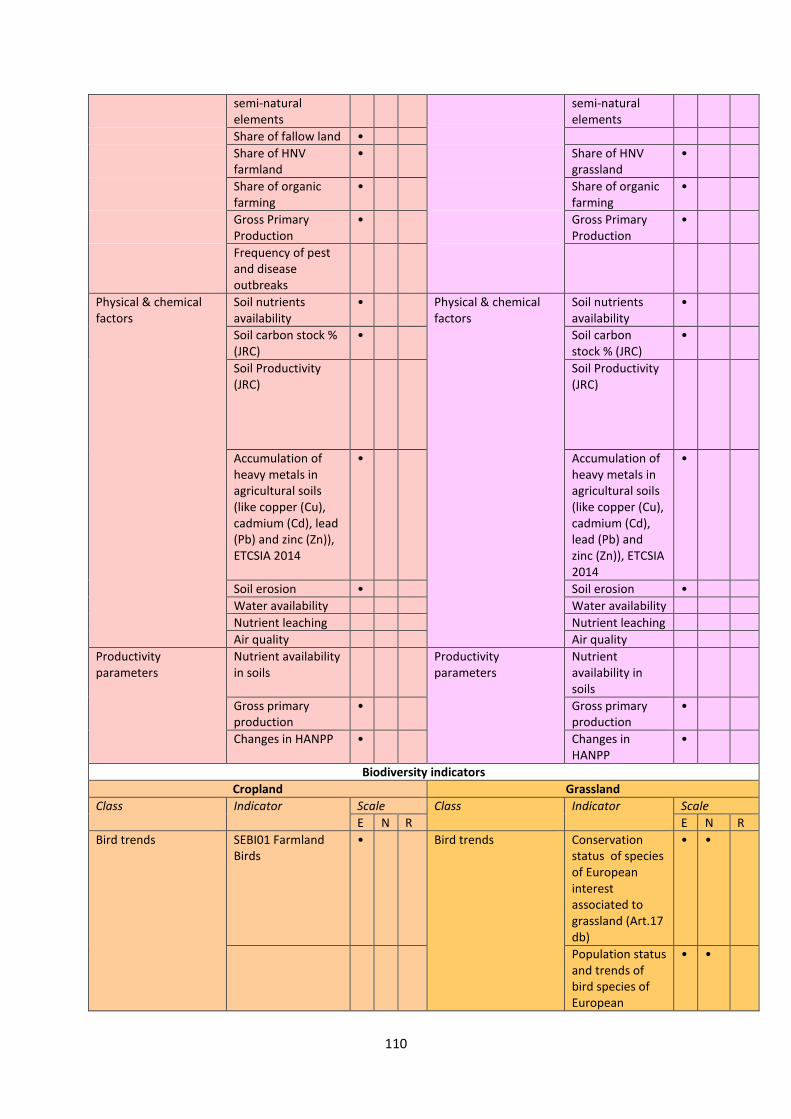
110
semi-natural elements
semi-natural elements
Share of fallow land •
Share of HNV farmland
• Share of HNV grassland
•
Share of organic farming
• Share of organic farming
•
Gross Primary Production
• Gross Primary Production
•
Frequency of pest and disease outbreaks
Physical & chemical factors
Soil nutrients availability
• Physical & chemical factors
Soil nutrients availability
•
Soil carbon stock % (JRC)
• Soil carbon stock % (JRC)
•
Soil Productivity (JRC)
Soil Productivity (JRC)
Accumulation of heavy metals in agricultural soils (like copper (Cu), cadmium (Cd), lead (Pb) and zinc (Zn)), ETCSIA 2014
• Accumulation of heavy metals in agricultural soils (like copper (Cu), cadmium (Cd), lead (Pb) and zinc (Zn)), ETCSIA 2014
•
Soil erosion • Soil erosion •
Water availability Water availability
Nutrient leaching Nutrient leaching
Air quality Air quality
Productivity parameters
Nutrient availability in soils
Productivity parameters
Nutrient availability in soils
Gross primary production
• Gross primary production
•
Changes in HANPP • Changes in HANPP
•
Biodiversity indicators
Cropland Grassland
Class Indicator Scale Class Indicator Scale
E N R E N R
Bird trends SEBI01 Farmland Birds
• Bird trends Conservation status of species of European interest associated to grassland (Art.17 db)
• •
Population status and trends of bird species of European
• •
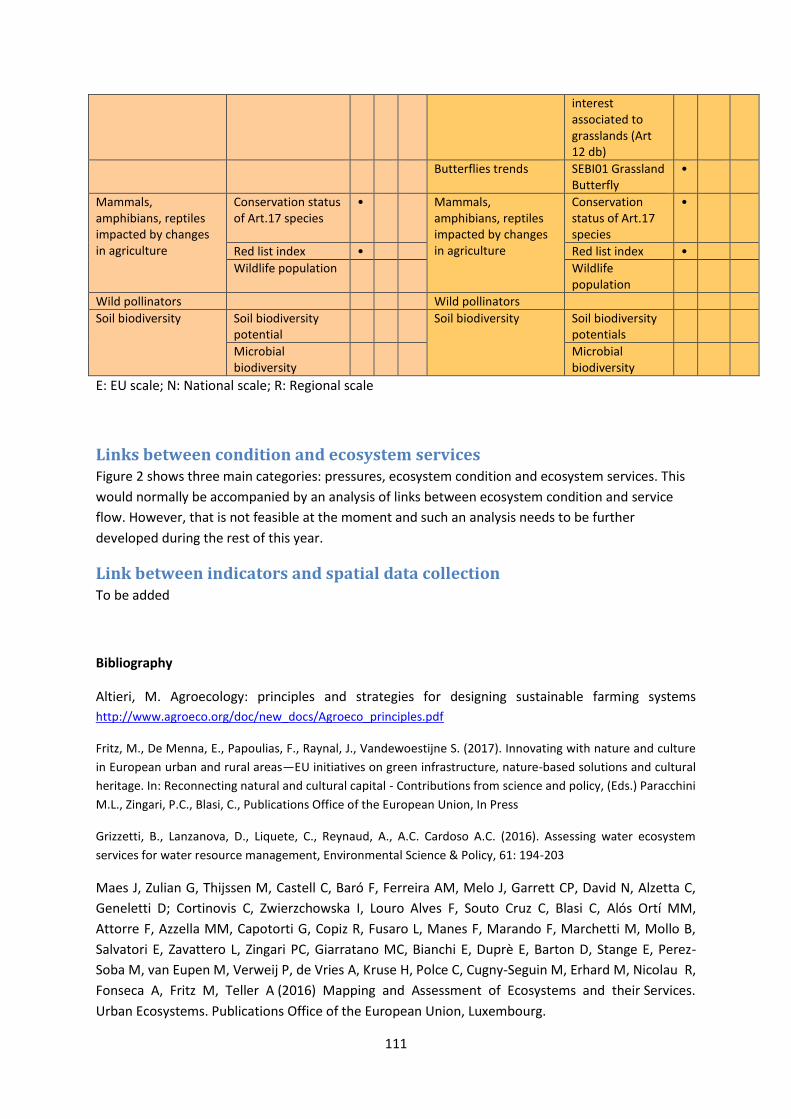
111
interest associated to grasslands (Art 12 db)
Butterflies trends SEBI01 Grassland Butterfly
•
Mammals, amphibians, reptiles impacted by changes in agriculture
Conservation status of Art.17 species
• Mammals, amphibians, reptiles impacted by changes in agriculture
Conservation status of Art.17 species
•
Red list index • Red list index •
Wildlife population Wildlife population
Wild pollinators Wild pollinators
Soil biodiversity Soil biodiversity potential
Soil biodiversity Soil biodiversity potentials
Microbial biodiversity
Microbial biodiversity
E: EU scale; N: National scale; R: Regional scale
Links between condition and ecosystem services Figure 2 shows three main categories: pressures, ecosystem condition and ecosystem services. This
would normally be accompanied by an analysis of links between ecosystem condition and service
flow. However, that is not feasible at the moment and such an analysis needs to be further
developed during the rest of this year.
Link between indicators and spatial data collection To be added
Bibliography
Altieri, M. Agroecology: principles and strategies for designing sustainable farming systems
http://www.agroeco.org/doc/new_docs/Agroeco_principles.pdf
Fritz, M., De Menna, E., Papoulias, F., Raynal, J., Vandewoestijne S. (2017). Innovating with nature and culture
in European urban and rural areas—EU initiatives on green infrastructure, nature-based solutions and cultural
heritage. In: Reconnecting natural and cultural capital - Contributions from science and policy, (Eds.) Paracchini
M.L., Zingari, P.C., Blasi, C., Publications Office of the European Union, In Press
Grizzetti, B., Lanzanova, D., Liquete, C., Reynaud, A., A.C. Cardoso A.C. (2016). Assessing water ecosystem
services for water resource management, Environmental Science & Policy, 61: 194-203
Maes J, Zulian G, Thijssen M, Castell C, Baró F, Ferreira AM, Melo J, Garrett CP, David N, Alzetta C,
Geneletti D; Cortinovis C, Zwierzchowska I, Louro Alves F, Souto Cruz C, Blasi C, Alós Ortí MM,
Attorre F, Azzella MM, Capotorti G, Copiz R, Fusaro L, Manes F, Marando F, Marchetti M, Mollo B,
Salvatori E, Zavattero L, Zingari PC, Giarratano MC, Bianchi E, Duprè E, Barton D, Stange E, Perez-
Soba M, van Eupen M, Verweij P, de Vries A, Kruse H, Polce C, Cugny-Seguin M, Erhard M, Nicolau R,
Fonseca A, Fritz M, Teller A (2016) Mapping and Assessment of Ecosystems and their Services.
Urban Ecosystems. Publications Office of the European Union, Luxembourg.
112
Steffen, W., Richardson, K., Rockström, J., Cornell, S.E., Fetzer, I., Bennett, E.M. , Biggs, R., Carpenter,
S.R., Vries, W. de, Wit, C.A. de, Folke, C., Gerten, D. , Heinke, J., Mace, G.M., Persson, L.M.,
Ramanathan, V., Reyers, B. and Sörlin, S. 2015. Planetary boundaries: Guiding human development
on a changing planet. Science 347:6219.
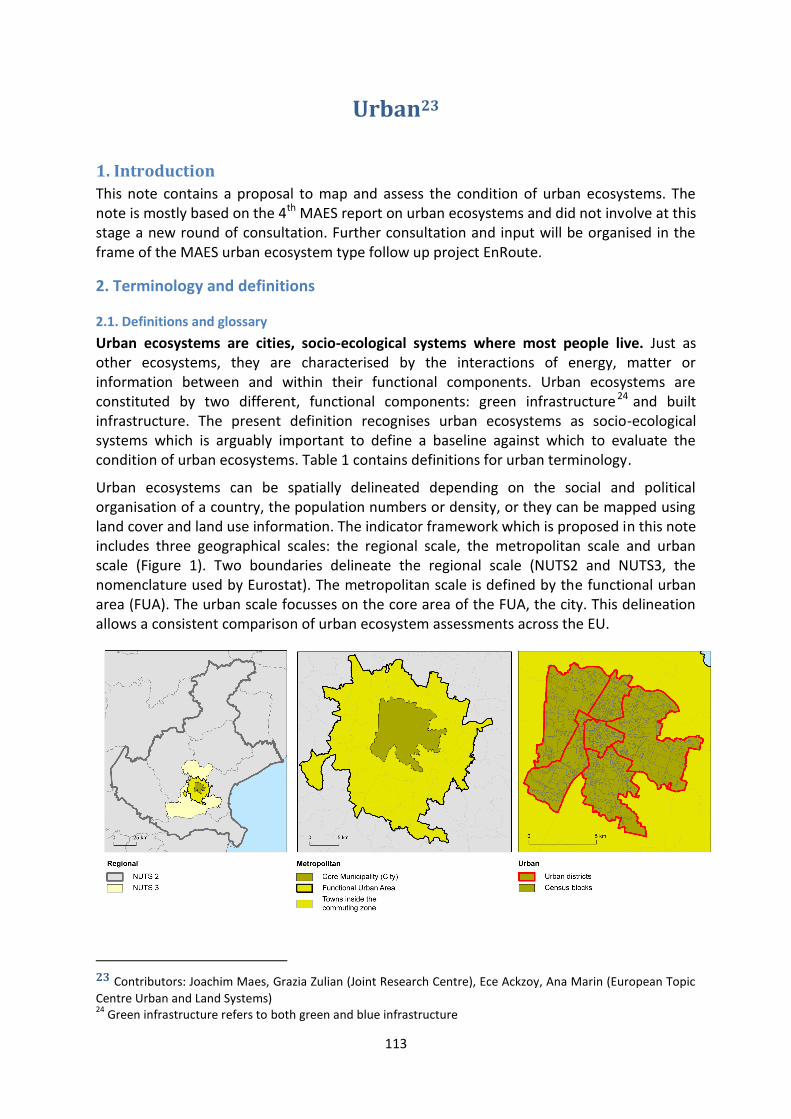
113
Urban23
1. Introduction
This note contains a proposal to map and assess the condition of urban ecosystems. The note is mostly based on the 4th MAES report on urban ecosystems and did not involve at this stage a new round of consultation. Further consultation and input will be organised in the frame of the MAES urban ecosystem type follow up project EnRoute.
2. Terminology and definitions
2.1. Definitions and glossary
Urban ecosystems are cities, socio-ecological systems where most people live. Just as other ecosystems, they are characterised by the interactions of energy, matter or information between and within their functional components. Urban ecosystems are constituted by two different, functional components: green infrastructure 24 and built infrastructure. The present definition recognises urban ecosystems as socio-ecological systems which is arguably important to define a baseline against which to evaluate the condition of urban ecosystems. Table 1 contains definitions for urban terminology.
Urban ecosystems can be spatially delineated depending on the social and political organisation of a country, the population numbers or density, or they can be mapped using land cover and land use information. The indicator framework which is proposed in this note includes three geographical scales: the regional scale, the metropolitan scale and urban scale (Figure 1). Two boundaries delineate the regional scale (NUTS2 and NUTS3, the nomenclature used by Eurostat). The metropolitan scale is defined by the functional urban area (FUA). The urban scale focusses on the core area of the FUA, the city. This delineation allows a consistent comparison of urban ecosystem assessments across the EU.
23 Contributors: Joachim Maes, Grazia Zulian (Joint Research Centre), Ece Ackzoy, Ana Marin (European Topic
Centre Urban and Land Systems) 24
Green infrastructure refers to both green and blue infrastructure
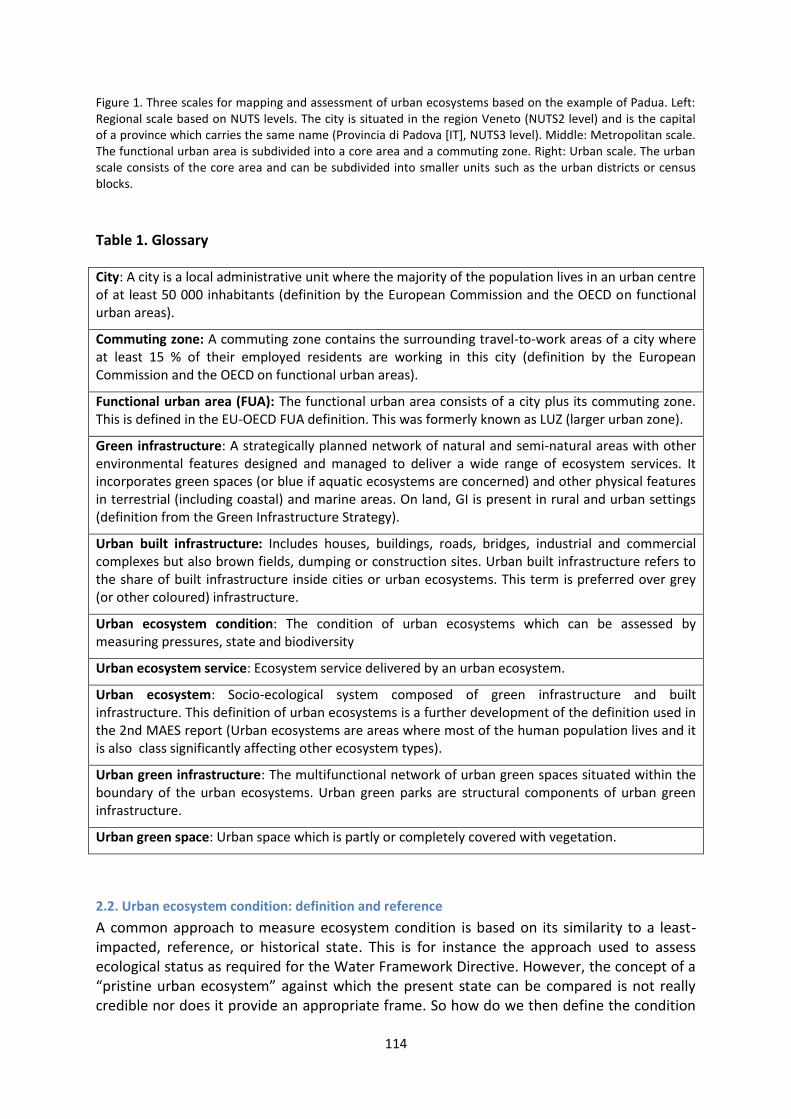
114
Figure 1. Three scales for mapping and assessment of urban ecosystems based on the example of Padua. Left: Regional scale based on NUTS levels. The city is situated in the region Veneto (NUTS2 level) and is the capital of a province which carries the same name (Provincia di Padova [IT], NUTS3 level). Middle: Metropolitan scale. The functional urban area is subdivided into a core area and a commuting zone. Right: Urban scale. The urban scale consists of the core area and can be subdivided into smaller units such as the urban districts or census blocks.
Table 1. Glossary
City: A city is a local administrative unit where the majority of the population lives in an urban centre of at least 50 000 inhabitants (definition by the European Commission and the OECD on functional urban areas).
Commuting zone: A commuting zone contains the surrounding travel-to-work areas of a city where at least 15 % of their employed residents are working in this city (definition by the European Commission and the OECD on functional urban areas).
Functional urban area (FUA): The functional urban area consists of a city plus its commuting zone. This is defined in the EU-OECD FUA definition. This was formerly known as LUZ (larger urban zone).
Green infrastructure: A strategically planned network of natural and semi-natural areas with other environmental features designed and managed to deliver a wide range of ecosystem services. It incorporates green spaces (or blue if aquatic ecosystems are concerned) and other physical features in terrestrial (including coastal) and marine areas. On land, GI is present in rural and urban settings (definition from the Green Infrastructure Strategy).
Urban built infrastructure: Includes houses, buildings, roads, bridges, industrial and commercial complexes but also brown fields, dumping or construction sites. Urban built infrastructure refers to the share of built infrastructure inside cities or urban ecosystems. This term is preferred over grey (or other coloured) infrastructure.
Urban ecosystem condition: The condition of urban ecosystems which can be assessed by measuring pressures, state and biodiversity
Urban ecosystem service: Ecosystem service delivered by an urban ecosystem.
Urban ecosystem: Socio-ecological system composed of green infrastructure and built infrastructure. This definition of urban ecosystems is a further development of the definition used in the 2nd MAES report (Urban ecosystems are areas where most of the human population lives and it is also class significantly affecting other ecosystem types).
Urban green infrastructure: The multifunctional network of urban green spaces situated within the boundary of the urban ecosystems. Urban green parks are structural components of urban green infrastructure.
Urban green space: Urban space which is partly or completely covered with vegetation.
2.2. Urban ecosystem condition: definition and reference
A common approach to measure ecosystem condition is based on its similarity to a least-impacted, reference, or historical state. This is for instance the approach used to assess ecological status as required for the Water Framework Directive. However, the concept of a “pristine urban ecosystem” against which the present state can be compared is not really credible nor does it provide an appropriate frame. So how do we then define the condition
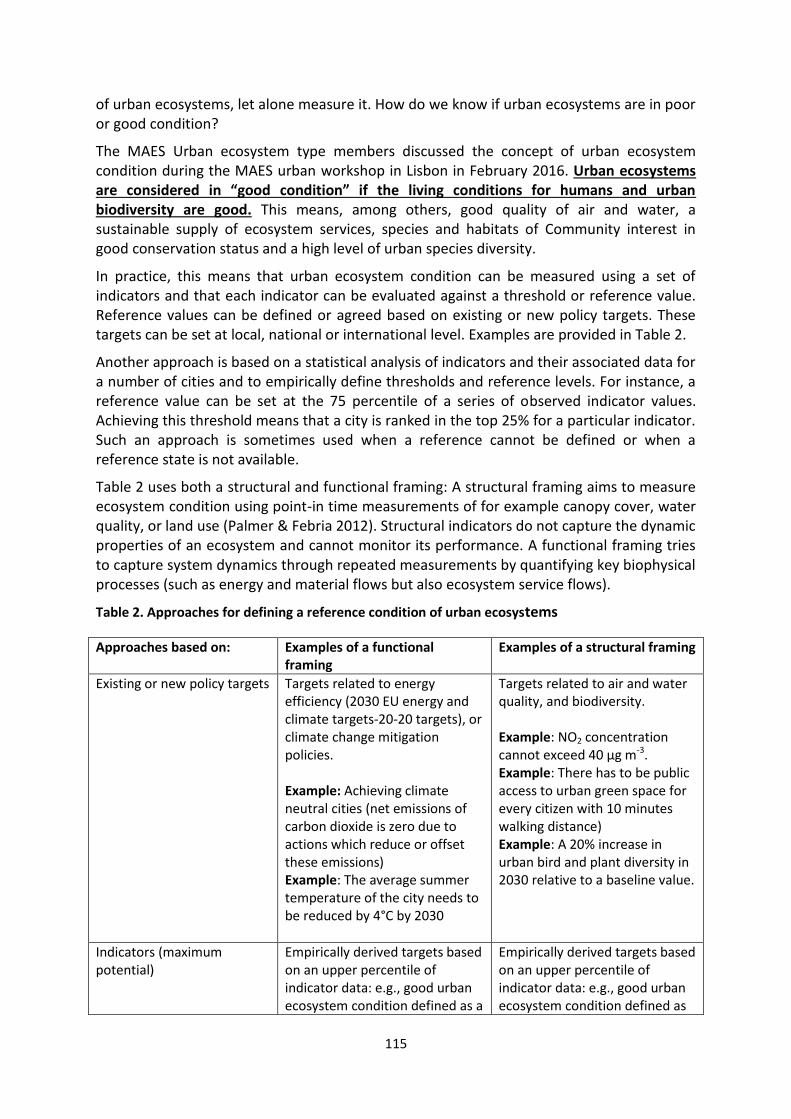
115
of urban ecosystems, let alone measure it. How do we know if urban ecosystems are in poor or good condition?
The MAES Urban ecosystem type members discussed the concept of urban ecosystem condition during the MAES urban workshop in Lisbon in February 2016. Urban ecosystems are considered in “good condition” if the living conditions for humans and urban biodiversity are good. This means, among others, good quality of air and water, a sustainable supply of ecosystem services, species and habitats of Community interest in good conservation status and a high level of urban species diversity.
In practice, this means that urban ecosystem condition can be measured using a set of indicators and that each indicator can be evaluated against a threshold or reference value. Reference values can be defined or agreed based on existing or new policy targets. These targets can be set at local, national or international level. Examples are provided in Table 2.
Another approach is based on a statistical analysis of indicators and their associated data for a number of cities and to empirically define thresholds and reference levels. For instance, a reference value can be set at the 75 percentile of a series of observed indicator values. Achieving this threshold means that a city is ranked in the top 25% for a particular indicator. Such an approach is sometimes used when a reference cannot be defined or when a reference state is not available.
Table 2 uses both a structural and functional framing: A structural framing aims to measure ecosystem condition using point-in time measurements of for example canopy cover, water quality, or land use (Palmer & Febria 2012). Structural indicators do not capture the dynamic properties of an ecosystem and cannot monitor its performance. A functional framing tries to capture system dynamics through repeated measurements by quantifying key biophysical processes (such as energy and material flows but also ecosystem service flows).
Table 2. Approaches for defining a reference condition of urban ecosystems
Approaches based on: Examples of a functional framing
Examples of a structural framing
Existing or new policy targets Targets related to energy efficiency (2030 EU energy and climate targets-20-20 targets), or climate change mitigation policies. Example: Achieving climate neutral cities (net emissions of carbon dioxide is zero due to actions which reduce or offset these emissions) Example: The average summer temperature of the city needs to be reduced by 4°C by 2030
Targets related to air and water quality, and biodiversity. Example: NO2 concentration cannot exceed 40 μg m-3. Example: There has to be public access to urban green space for every citizen with 10 minutes walking distance) Example: A 20% increase in urban bird and plant diversity in 2030 relative to a baseline value.
Indicators (maximum potential)
Empirically derived targets based on an upper percentile of indicator data: e.g., good urban ecosystem condition defined as a
Empirically derived targets based on an upper percentile of indicator data: e.g., good urban ecosystem condition defined as
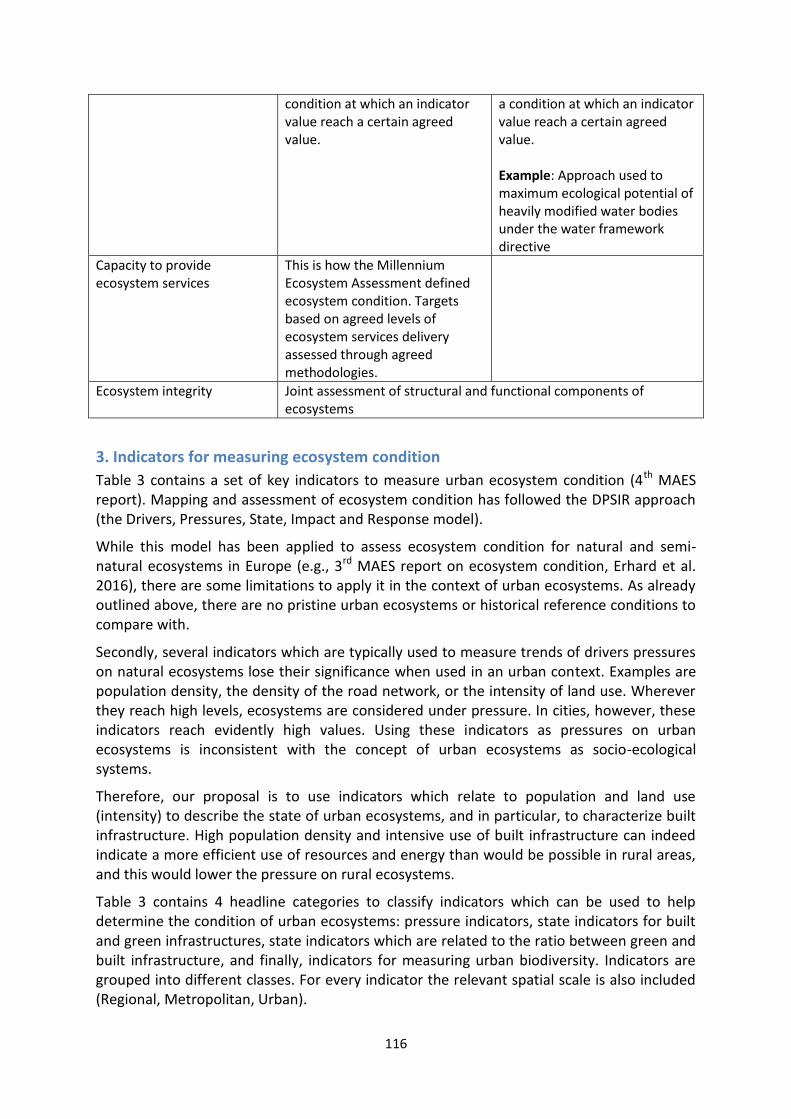
116
condition at which an indicator value reach a certain agreed value.
a condition at which an indicator value reach a certain agreed value. Example: Approach used to maximum ecological potential of heavily modified water bodies under the water framework directive
Capacity to provide ecosystem services
This is how the Millennium Ecosystem Assessment defined ecosystem condition. Targets based on agreed levels of ecosystem services delivery assessed through agreed methodologies.
Ecosystem integrity Joint assessment of structural and functional components of ecosystems
3. Indicators for measuring ecosystem condition
Table 3 contains a set of key indicators to measure urban ecosystem condition (4th MAES report). Mapping and assessment of ecosystem condition has followed the DPSIR approach (the Drivers, Pressures, State, Impact and Response model).
While this model has been applied to assess ecosystem condition for natural and semi-natural ecosystems in Europe (e.g., 3rd MAES report on ecosystem condition, Erhard et al. 2016), there are some limitations to apply it in the context of urban ecosystems. As already outlined above, there are no pristine urban ecosystems or historical reference conditions to compare with.
Secondly, several indicators which are typically used to measure trends of drivers pressures on natural ecosystems lose their significance when used in an urban context. Examples are population density, the density of the road network, or the intensity of land use. Wherever they reach high levels, ecosystems are considered under pressure. In cities, however, these indicators reach evidently high values. Using these indicators as pressures on urban ecosystems is inconsistent with the concept of urban ecosystems as socio-ecological systems.
Therefore, our proposal is to use indicators which relate to population and land use (intensity) to describe the state of urban ecosystems, and in particular, to characterize built infrastructure. High population density and intensive use of built infrastructure can indeed indicate a more efficient use of resources and energy than would be possible in rural areas, and this would lower the pressure on rural ecosystems.
Table 3 contains 4 headline categories to classify indicators which can be used to help determine the condition of urban ecosystems: pressure indicators, state indicators for built and green infrastructures, state indicators which are related to the ratio between green and built infrastructure, and finally, indicators for measuring urban biodiversity. Indicators are grouped into different classes. For every indicator the relevant spatial scale is also included (Regional, Metropolitan, Urban).

117
The list of indicators in Table 2 is not exhaustive. A complete list of indicators which was provided through the different collection channels is available in the JRC technical report and on CIRCABC25. Besides this source of information, much scientific literature is available reporting on local case studies and experiences. However, Table 2 aims to ensure a coherent mapping and assessment of condition of urban ecosystems across the EU and several of these are used by the European Environment Agency for reporting on the state of urban ecosystems in the EU.
Pressures on urban ecosystems can be assessed by considering urban sprawl, temperature, water pollution, noise pollution and air pollution. The indicators for pollution are linked to different EU environmental directives (the air quality directive, the urban water water treatment directive, the water framework directive, the bathing water directive and the noise directive). This legal framework requires the member states to monitor pollutants and the EEA has datasets available to quantify these indicators.
Table 2 makes a difference between indicators which measure the condition of urban green infrastructure (without considering built infrastructure) and indicators which can be used to monitor the urban ecosystems as a whole (so including built infrastructure). Urban GI indicators are typically grounded in forest connectivity research and are used in or adapted to urban ecosystems. Indicators for measuring condition of the whole urban ecosystem use the proportion of green versus built infrastructure. Depending on the purpose and the context, different proportions can be assessed.
Finally, urban biodiversity can be monitored by targeting specific taxa. Birds are commonly monitored in cities. Also lichens are proposed given their relation to air quality. Following increased global attention (e.g. IPBES), also pollinator insects are used as indicators for urban biodiversity. In this context, the potential role of citizen science is worth mentioning as tool for monitoring urban biodiversity. In cities, several species are introduced, often for cultural reasons (in Botanic gardens or zoos) so they are not necessarily viewed as a pressure but as part of the cultural heritage.
25
https://circabc.europa.eu/w/browse/0d5507e1-cfd2-453a-9492-f9b2db4589ec
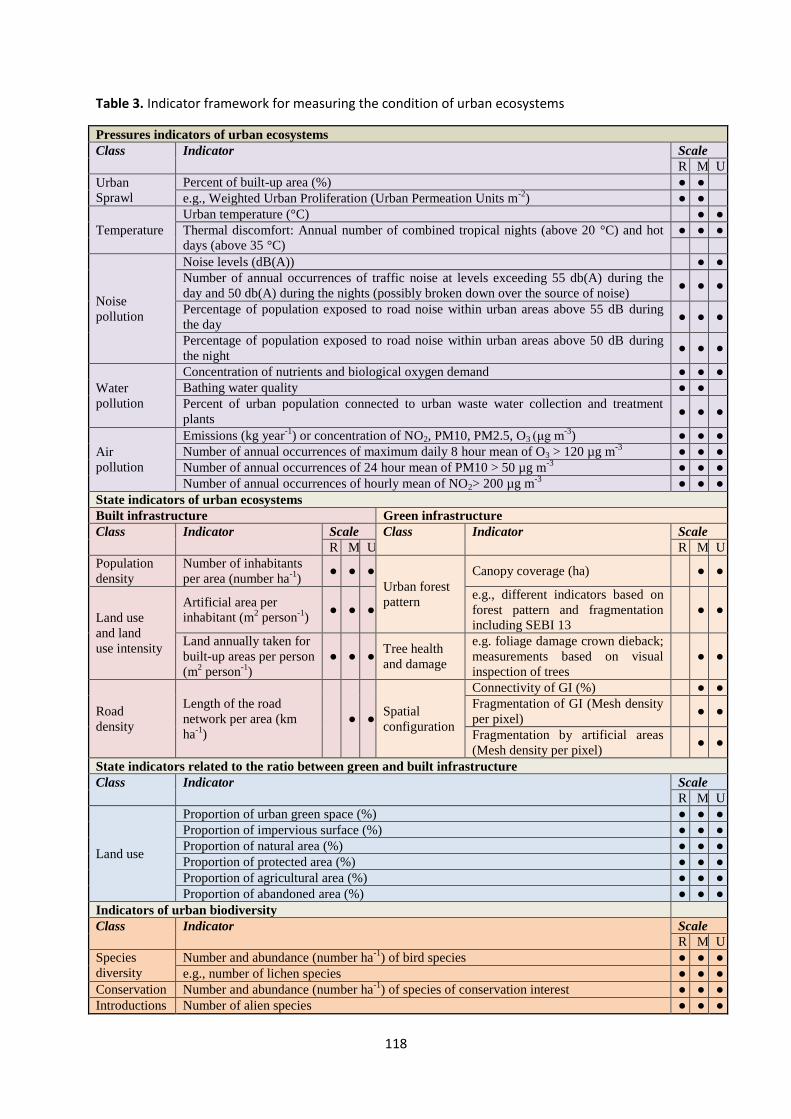
118
Table 3. Indicator framework for measuring the condition of urban ecosystems
Pressures indicators of urban ecosystems
Class Indicator Scale
R M U
Urban
Sprawl
Percent of built-up area (%) ● ●
e.g., Weighted Urban Proliferation (Urban Permeation Units m-2
) ● ●
Temperature
Urban temperature (°C) ● ●
Thermal discomfort: Annual number of combined tropical nights (above 20 °C) and hot
days (above 35 °C)
● ● ●
Noise
pollution
Noise levels (dB(A)) ● ●
Number of annual occurrences of traffic noise at levels exceeding 55 db(A) during the
day and 50 db(A) during the nights (possibly broken down over the source of noise) ● ● ●
Percentage of population exposed to road noise within urban areas above 55 dB during
the day ● ● ●
Percentage of population exposed to road noise within urban areas above 50 dB during
the night ● ● ●
Water
pollution
Concentration of nutrients and biological oxygen demand ● ● ●
Bathing water quality ● ●
Percent of urban population connected to urban waste water collection and treatment
plants ● ● ●
Air
pollution
Emissions (kg year-1
) or concentration of NO2, PM10, PM2.5, O3 (μg m-3
) ● ● ●
Number of annual occurrences of maximum daily 8 hour mean of O3 > 120 µg m-3
● ● ●
Number of annual occurrences of 24 hour mean of PM10 > 50 µg m-3
● ● ●
Number of annual occurrences of hourly mean of NO2> 200 µg m-3
● ● ●
State indicators of urban ecosystems
Built infrastructure Green infrastructure
Class Indicator Scale Class Indicator Scale
R M U R M U
Population
density
Number of inhabitants
per area (number ha-1
) ● ● ●
Urban forest
pattern
Canopy coverage (ha) ● ●
Land use
and land
use intensity
Artificial area per
inhabitant (m2 person
-1)
● ● ●
e.g., different indicators based on
forest pattern and fragmentation
including SEBI 13
● ●
Land annually taken for
built-up areas per person
(m2 person
-1)
● ● ● Tree health
and damage
e.g. foliage damage crown dieback;
measurements based on visual
inspection of trees
● ●
Road
density
Length of the road
network per area (km
ha-1
)
● ● Spatial
configuration
Connectivity of GI (%) ● ●
Fragmentation of GI (Mesh density
per pixel) ● ●
Fragmentation by artificial areas
(Mesh density per pixel) ● ●
State indicators related to the ratio between green and built infrastructure
Class Indicator Scale
R M U
Land use
Proportion of urban green space (%) ● ● ●
Proportion of impervious surface (%) ● ● ●
Proportion of natural area (%) ● ● ●
Proportion of protected area (%) ● ● ●
Proportion of agricultural area (%) ● ● ●
Proportion of abandoned area (%) ● ● ●
Indicators of urban biodiversity
Class Indicator Scale
R M U
Species
diversity
Number and abundance (number ha-1
) of bird species ● ● ●
e.g., number of lichen species ● ● ●
Conservation Number and abundance (number ha-1
) of species of conservation interest ● ● ●
Introductions Number of alien species ● ● ●
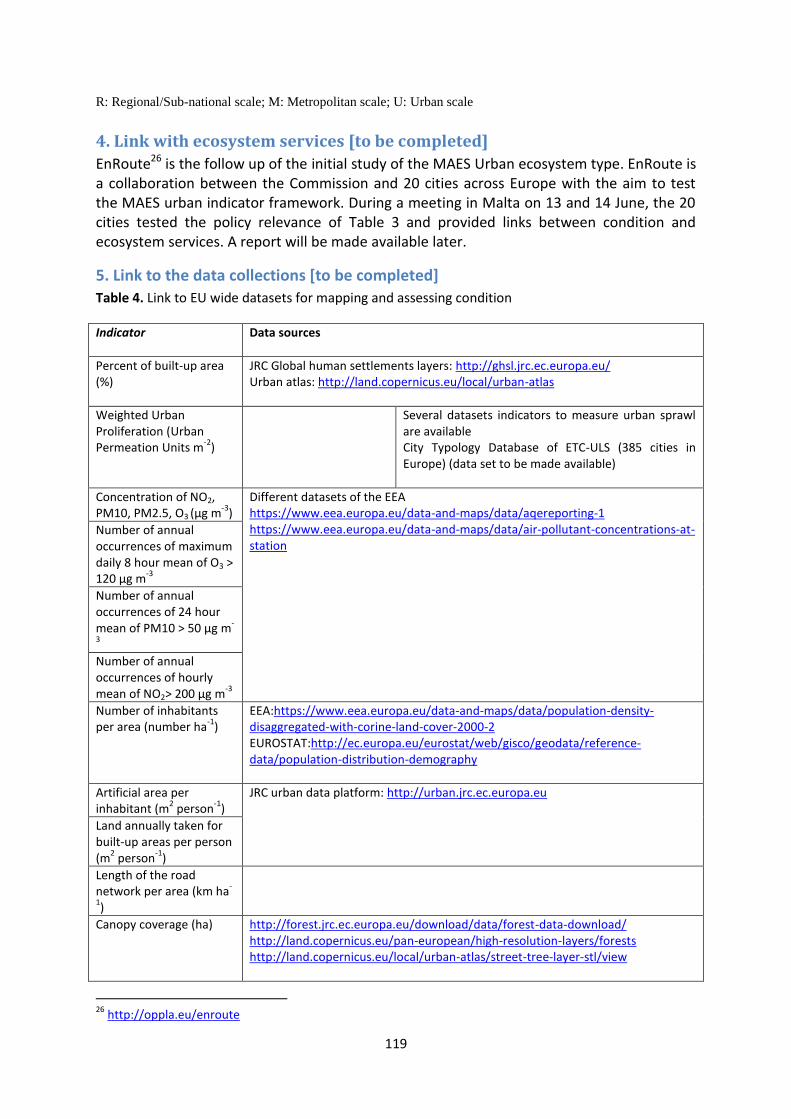
119
R: Regional/Sub-national scale; M: Metropolitan scale; U: Urban scale
4. Link with ecosystem services [to be completed]
EnRoute26 is the follow up of the initial study of the MAES Urban ecosystem type. EnRoute is a collaboration between the Commission and 20 cities across Europe with the aim to test the MAES urban indicator framework. During a meeting in Malta on 13 and 14 June, the 20 cities tested the policy relevance of Table 3 and provided links between condition and ecosystem services. A report will be made available later.
5. Link to the data collections [to be completed]
Table 4. Link to EU wide datasets for mapping and assessing condition
Indicator Data sources
Percent of built-up area (%)
JRC Global human settlements layers: http://ghsl.jrc.ec.europa.eu/ Urban atlas: http://land.copernicus.eu/local/urban-atlas
Weighted Urban Proliferation (Urban Permeation Units m
-2)
Several datasets indicators to measure urban sprawl are available City Typology Database of ETC-ULS (385 cities in Europe) (data set to be made available)
Concentration of NO2, PM10, PM2.5, O3 (μg m
-3)
Different datasets of the EEA https://www.eea.europa.eu/data-and-maps/data/aqereporting-1 https://www.eea.europa.eu/data-and-maps/data/air-pollutant-concentrations-at-station
Number of annual occurrences of maximum daily 8 hour mean of O3 > 120 µg m
-3
Number of annual occurrences of 24 hour mean of PM10 > 50 µg m
-
3
Number of annual occurrences of hourly mean of NO2> 200 µg m
-3
Number of inhabitants per area (number ha
-1)
EEA:https://www.eea.europa.eu/data-and-maps/data/population-density-disaggregated-with-corine-land-cover-2000-2 EUROSTAT:http://ec.europa.eu/eurostat/web/gisco/geodata/reference-data/population-distribution-demography
Artificial area per inhabitant (m
2 person
-1)
JRC urban data platform: http://urban.jrc.ec.europa.eu
Land annually taken for built-up areas per person (m
2 person
-1)
Length of the road network per area (km ha
-
1)
Canopy coverage (ha) http://forest.jrc.ec.europa.eu/download/data/forest-data-download/ http://land.copernicus.eu/pan-european/high-resolution-layers/forests http://land.copernicus.eu/local/urban-atlas/street-tree-layer-stl/view
26
http://oppla.eu/enroute
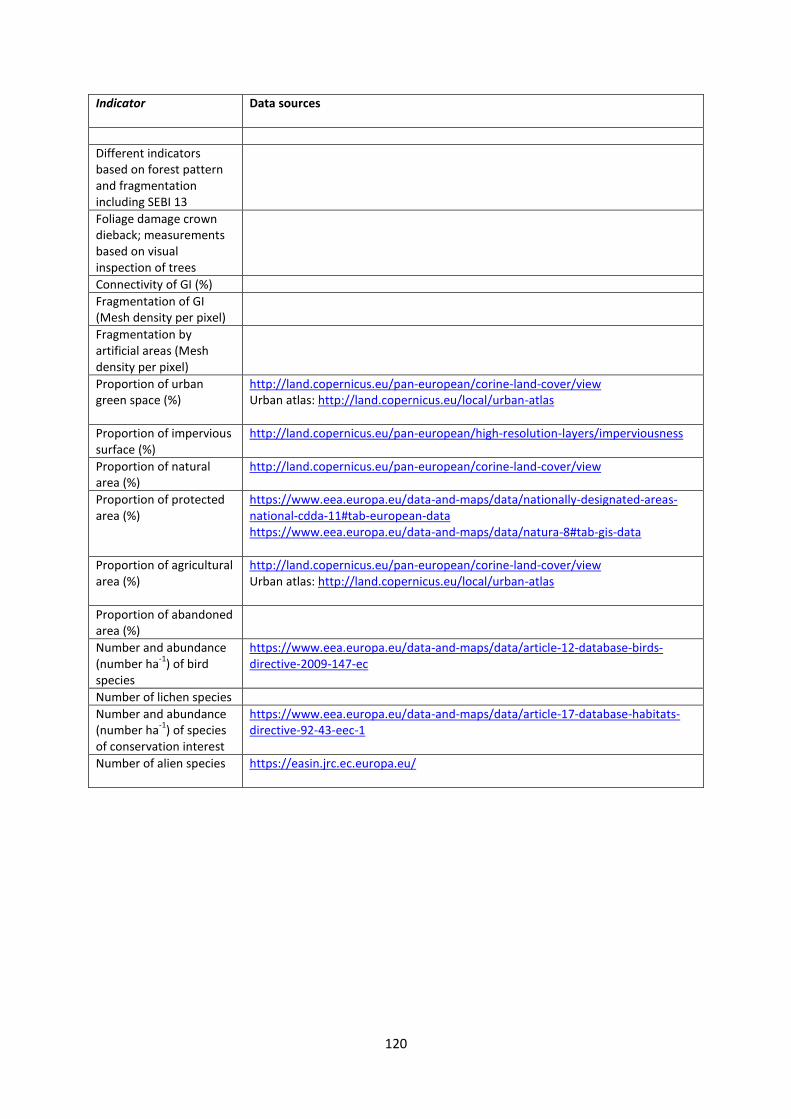
120
Indicator Data sources
Different indicators based on forest pattern and fragmentation including SEBI 13
Foliage damage crown dieback; measurements based on visual inspection of trees
Connectivity of GI (%)
Fragmentation of GI (Mesh density per pixel)
Fragmentation by artificial areas (Mesh density per pixel)
Proportion of urban green space (%)
http://land.copernicus.eu/pan-european/corine-land-cover/view Urban atlas: http://land.copernicus.eu/local/urban-atlas
Proportion of impervious surface (%)
http://land.copernicus.eu/pan-european/high-resolution-layers/imperviousness
Proportion of natural area (%)
http://land.copernicus.eu/pan-european/corine-land-cover/view
Proportion of protected area (%)
https://www.eea.europa.eu/data-and-maps/data/nationally-designated-areas-national-cdda-11#tab-european-data https://www.eea.europa.eu/data-and-maps/data/natura-8#tab-gis-data
Proportion of agricultural area (%)
http://land.copernicus.eu/pan-european/corine-land-cover/view Urban atlas: http://land.copernicus.eu/local/urban-atlas
Proportion of abandoned area (%)
Number and abundance (number ha
-1) of bird
species
https://www.eea.europa.eu/data-and-maps/data/article-12-database-birds-directive-2009-147-ec
Number of lichen species
Number and abundance (number ha
-1) of species
of conservation interest
https://www.eea.europa.eu/data-and-maps/data/article-17-database-habitats-directive-92-43-eec-1
Number of alien species https://easin.jrc.ec.europa.eu/
121
Proposal for mapping and assessment of soil
condition27
1. Introduction The work on ecosystem condition is organised per MAES ecosystem type (forest: forest and
woodland; agricultural: cropland and grassland; nature: wetlands, heathland and shrub, sparsely
vegetated habitats; the freshwater: rivers and lakes; urban: urban ecosystems; marine and soil).
Since the work on soil ecosystem is not as developed as with the other elements of MAES, soil
indicators have been considered as cross-cutting and will be integrated in a pragmatic way forward
into all ecosystem types to assess their condition. The approach to include soil information such as
data and indicators in the MAES framework is therefore based on the ecosystem type which the soil
is supporting. Currently work is also under away with the objective to integrate soil as a separate
ecosystem type28 in the MAES framework. A report on soil ecosystem will be delivered by the end of
2017.
This note presents the main outcome of an EU expert meeting29: a proposal for soil indicators to be
included in the MAES ecosystem condition indicator framework. It follows the steps proposed by the
common analytical framework paper for mapping and assessment of ecosystem condition.
2. What do soils tell us about ecosystem condition? Ecosystems are in good condition only if their soil – in particular soil biodiversity - is in good
condition.
Soils are in good condition when they have low pressures on it. The experts recognised that soil
condition can be measured in a functional and structural way. A functional approach to the
assessment of soil condition is based on indicators which measure the performance of soil functions
(condition for what? condition for which purpose?). Examples are water holding capacity or soil
productivity. These indicators can be coupled to specific soil ecosystem services. A structural
approach to soil condition is based on indicators which measure the state or biodiversity of soils. An
example is the soil biodiversity potential indicator.
Table 1 contains a proposal for soil indicators which should be included if the condition of
ecosystems is assessed. The table contains indicators for each of the seven terrestrial MAES
ecosystem types. For wetlands indicators refer to peatland and water logged soils. Each indicator is
assigned to pressure, state, biodiversity or management. Some indicators are ecosystem type
specific whereas most indicators are shared by different ecosystem types. This is made clear from
27
Contributors: Joachim Maes, Alberto Orgiazzi, Arwyn Jones, Sara Vallecillo (Joint Research Centre), Josiane Masson, Bavo Peeters (DG Environment), Ece Ackzoy (European Topic Centre Urban and Land Systems), Jan Staes (University of Antwerp) 28
https://www.researchgate.net/publication/276090499_The_soil_as_an_ecosystem 29
JRC organised on 15 May an expert meeting to review and select a set of soil indicators, which should be
used in MAES ecosystem assessments when the condition of different ecosystem types is mapped and
assessed.
122
the design of the table. For instance, the Number of contaminated sites per city is an indicator which
is only proposed for urban ecosystems. The indicator Compaction can be used for urban, cropland
and grassland. Soil carbon stock can be used for all ecosystem types but urban. Soil biodiversity
potential should be used for all ecosystem types. Note that two indicators (Available water capacity
and Soil nutrient availability) appear twice in the table (for the purpose of the table design).
The following indicators cover most ecosystem types and could represent an essential set to include
in MAES ecosystem condition assessments:
Soil erosion (kg/ha/year)
Soil sealing (% area)
Soil contamination or pollution (from point or diffuse sources)
Available water capacity
Soil nutrient availability
Soil carbon stock (%)
Soil biodiversity potential
The indicators of Table 1 are commented in Table 2 and coupled to data sources for their
quantification. These data sources are not all available at the EU or national scale, with a number of
data sets available at only a regional of local scale.
The soil pilot proposes to include a separate class to measure ecosystem condition: management.
Some management types can have a positive or a negative impact on soil condition so spatially-
explicit data of land management can be used as proxy to map and assess soil condition30.
Clearly, several indicators will prove to be correlated to each other: soil carbon content is a function
of land management practices while it may be related to soil biodiversity or available soil water. So a
further separation could be made between indicators which measure the intrinsic condition of soils
and indicators which measure pressures or management. For instance Natura 2000 sites have, on
average, 10% more carbon in their topsoil than non-protected areas. So carbon content can be
considered as an essential indicator which captures well the state of soils but the inclusion of
additional indicators which quantify pressures or management may be interesting to understand
spatial and temporal patterns in soil carbon.
Measuring pressures on soil in a spatially explicit manner is easier than measuring the state of soil or
soil biodiversity. It is likely that more data for soil pressures are available than for management,
state or biodiversity.
30
There was some disagreement among the pilot experts about including management indicators. Because management would be a driver of change in the condition framework (like the pressure indicators).
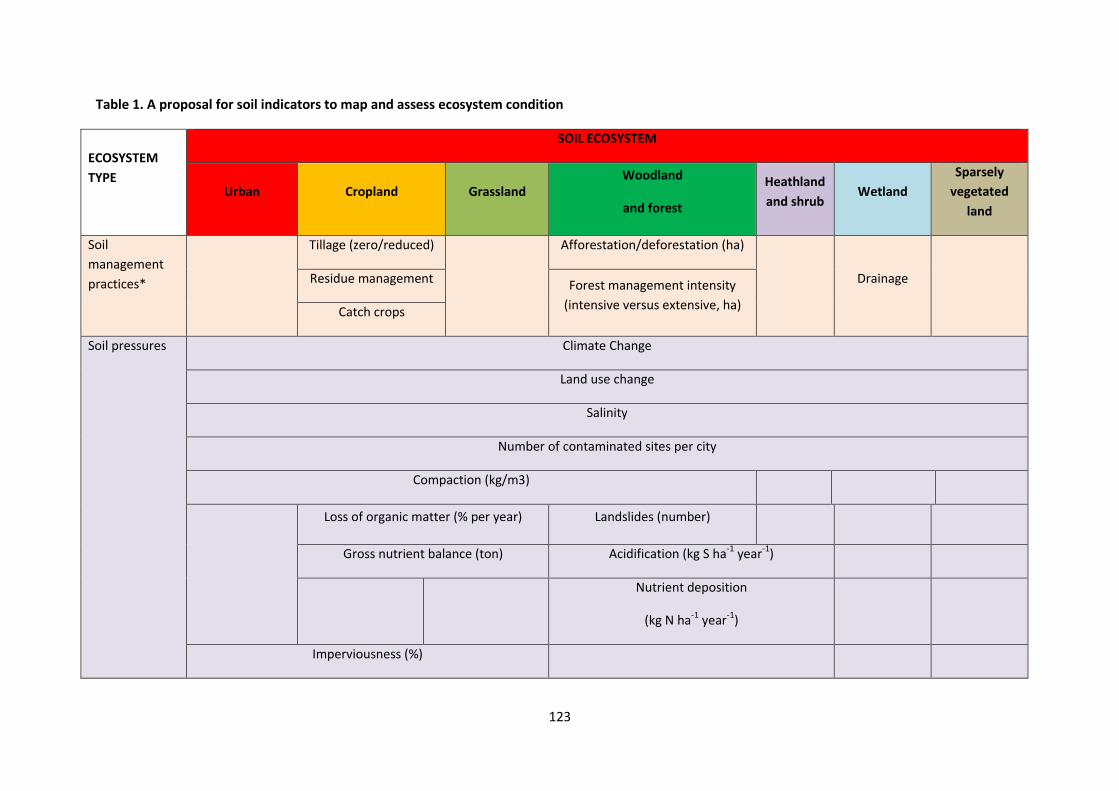
123
Table 1. A proposal for soil indicators to map and assess ecosystem condition
ECOSYSTEM
TYPE
SOIL ECOSYSTEM
Urban Cropland Grassland Woodland
and forest
Heathland
and shrub Wetland
Sparsely
vegetated
land
Soil
management
practices*
Tillage (zero/reduced)
Afforestation/deforestation (ha)
Drainage Residue management Forest management intensity
(intensive versus extensive, ha) Catch crops
Soil pressures Climate Change
Land use change
Salinity
Number of contaminated sites per city
Compaction (kg/m3)
Loss of organic matter (% per year) Landslides (number)
Gross nutrient balance (ton) Acidification (kg S ha-1 year-1)
Nutrient deposition
(kg N ha-1 year-1)
Imperviousness (%)
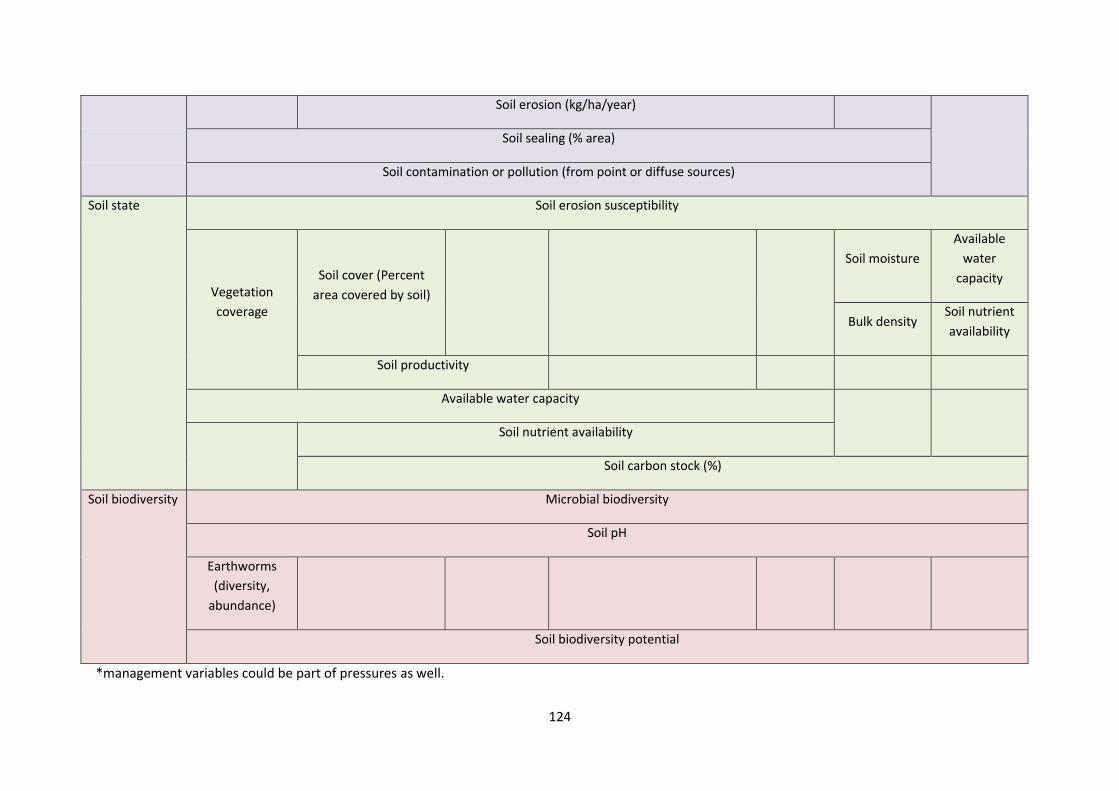
124
Soil erosion (kg/ha/year)
Soil sealing (% area)
Soil contamination or pollution (from point or diffuse sources)
Soil state Soil erosion susceptibility
Vegetation
coverage
Soil cover (Percent
area covered by soil)
Soil moisture
Available
water
capacity
Bulk density Soil nutrient
availability
Soil productivity
Available water capacity
Soil nutrient availability
Soil carbon stock (%)
Soil biodiversity Microbial biodiversity
Soil pH
Earthworms
(diversity,
abundance)
Soil biodiversity potential
*management variables could be part of pressures as well.
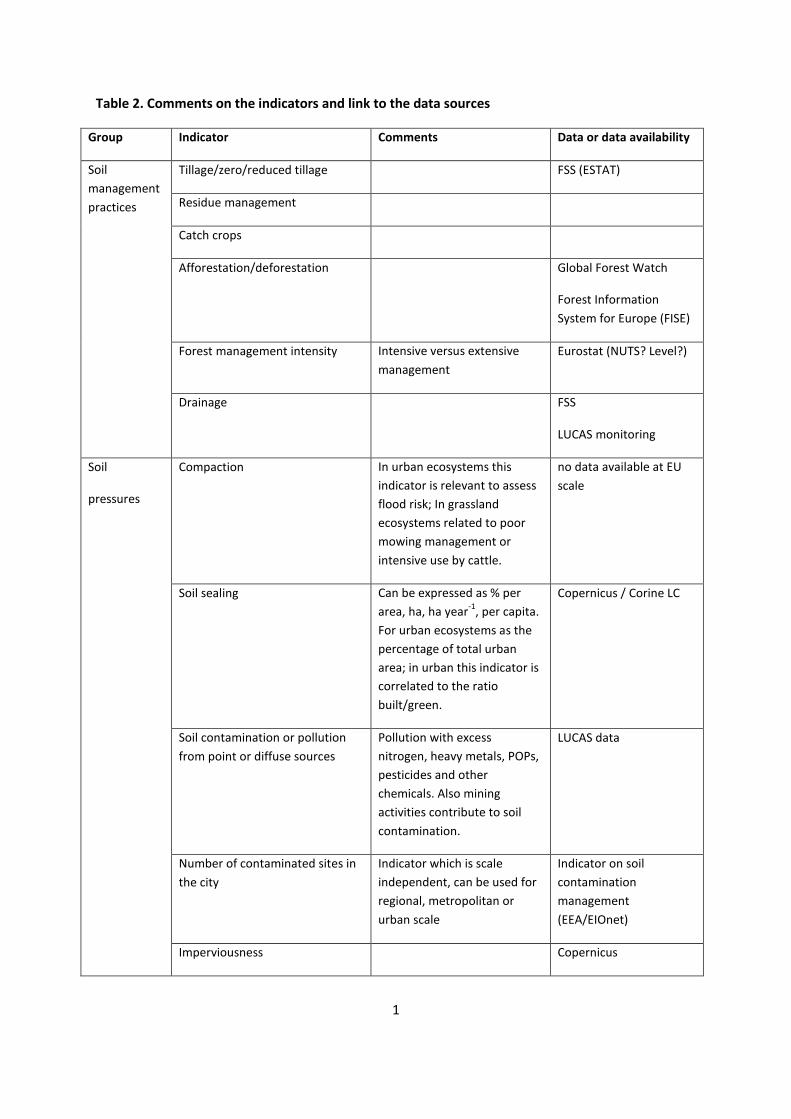
1
Table 2. Comments on the indicators and link to the data sources
Group Indicator Comments Data or data availability
Soil
management
practices
Tillage/zero/reduced tillage FSS (ESTAT)
Residue management
Catch crops
Afforestation/deforestation Global Forest Watch
Forest Information
System for Europe (FISE)
Forest management intensity Intensive versus extensive
management
Eurostat (NUTS? Level?)
Drainage FSS
LUCAS monitoring
Soil
pressures
Compaction In urban ecosystems this
indicator is relevant to assess
flood risk; In grassland
ecosystems related to poor
mowing management or
intensive use by cattle.
no data available at EU
scale
Soil sealing Can be expressed as % per
area, ha, ha year-1
, per capita.
For urban ecosystems as the
percentage of total urban
area; in urban this indicator is
correlated to the ratio
built/green.
Copernicus / Corine LC
Soil contamination or pollution
from point or diffuse sources
Pollution with excess
nitrogen, heavy metals, POPs,
pesticides and other
chemicals. Also mining
activities contribute to soil
contamination.
LUCAS data
Number of contaminated sites in
the city
Indicator which is scale
independent, can be used for
regional, metropolitan or
urban scale
Indicator on soil
contamination
management
(EEA/EIOnet)
Imperviousness Copernicus
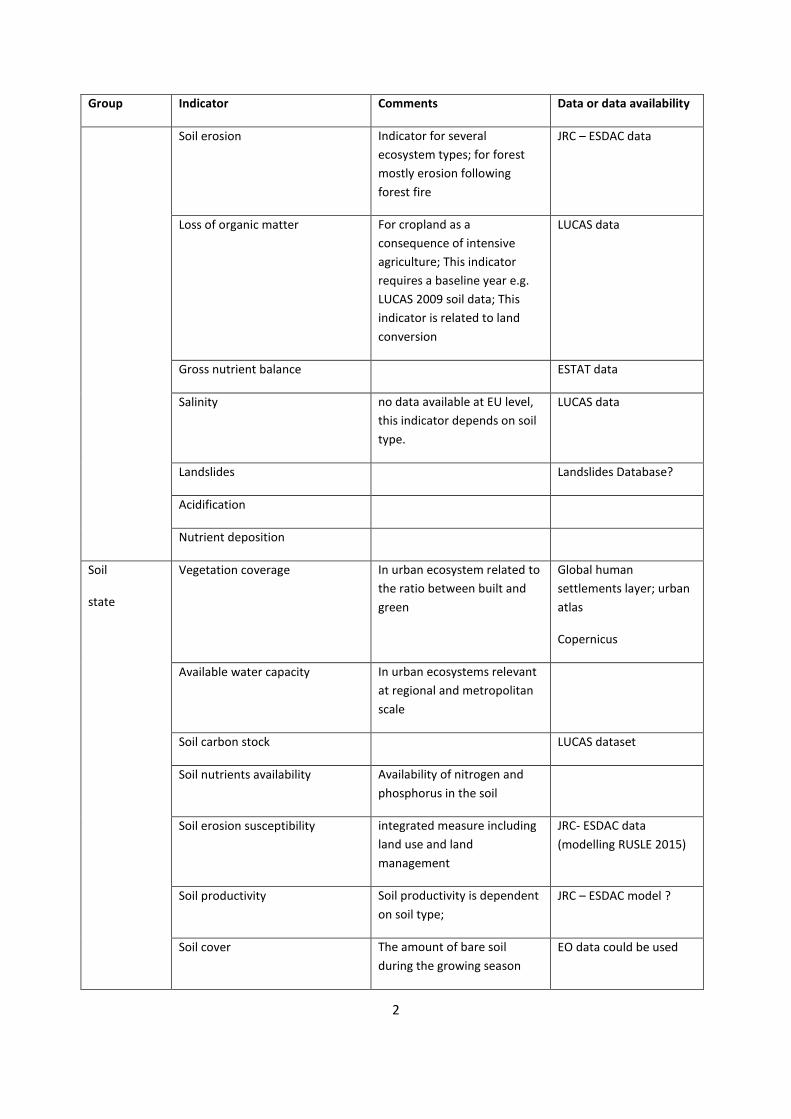
2
Group Indicator Comments Data or data availability
Soil erosion
Indicator for several
ecosystem types; for forest
mostly erosion following
forest fire
JRC – ESDAC data
Loss of organic matter For cropland as a
consequence of intensive
agriculture; This indicator
requires a baseline year e.g.
LUCAS 2009 soil data; This
indicator is related to land
conversion
LUCAS data
Gross nutrient balance ESTAT data
Salinity no data available at EU level,
this indicator depends on soil
type.
LUCAS data
Landslides Landslides Database?
Acidification
Nutrient deposition
Soil
state
Vegetation coverage In urban ecosystem related to
the ratio between built and
green
Global human
settlements layer; urban
atlas
Copernicus
Available water capacity In urban ecosystems relevant
at regional and metropolitan
scale
Soil carbon stock LUCAS dataset
Soil nutrients availability Availability of nitrogen and
phosphorus in the soil
Soil erosion susceptibility integrated measure including
land use and land
management
JRC- ESDAC data
(modelling RUSLE 2015)
Soil productivity Soil productivity is dependent
on soil type;
JRC – ESDAC model ?
Soil cover The amount of bare soil
during the growing season
EO data could be used
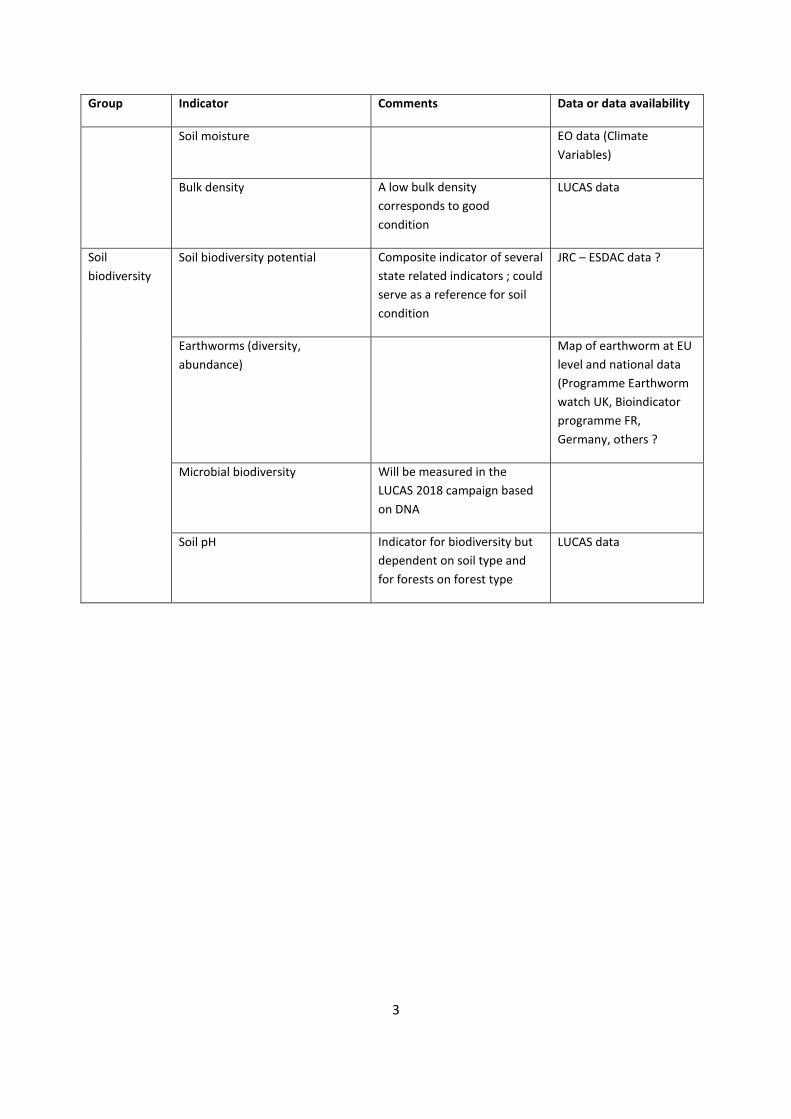
3
Group Indicator Comments Data or data availability
Soil moisture EO data (Climate
Variables)
Bulk density A low bulk density
corresponds to good
condition
LUCAS data
Soil
biodiversity
Soil biodiversity potential Composite indicator of several
state related indicators ; could
serve as a reference for soil
condition
JRC – ESDAC data ?
Earthworms (diversity,
abundance)
Map of earthworm at EU
level and national data
(Programme Earthworm
watch UK, Bioindicator
programme FR,
Germany, others ?
Microbial biodiversity Will be measured in the
LUCAS 2018 campaign based
on DNA
Soil pH
Indicator for biodiversity but
dependent on soil type and
for forests on forest type
LUCAS data
Related Documents