Macroeconomic outlook and Food & Beverage Outlook 2016 15 October 2015

Welcome message from author
This document is posted to help you gain knowledge. Please leave a comment to let me know what you think about it! Share it to your friends and learn new things together.
Transcript

Macroeconomic outlook
and Food & Beverage Outlook 2016
15 October 2015

Agenda
• Macroeconomic outlook
• Food and Beverage outlook
2

Key determinants for business environment in 2016
3
1. Global economic recovery
2. China’s economic slowdown
3. Fed’s first rate hike
4. Low commodity prices
1. Export concerns
2. Consumption drag
3. Infra megaproject investment
4. Strong tourism growth
Global outlook Domestic outlook

Higher growth in 2016, except for China
4
Japan
China
Eurozone
Thailand U.S.
2.4 2.2 2.8
2014 2015F 2016F
0.9 1.5
2.0
2014 2015F 2016F
7.4 6.9 6.8
2014 2015F 2016F
0.9 2.2
3.0
2014 2015F 2016F
-0.1
0.9 1.6
2014 2015F 2016F
Source: EIC, IMF, Bloomberg and forecasts of major research houses (Goldman Sachs, J.P. Morgan, Deutsche Bank, Bank of America)

With slowdown in China’s investment, commodity prices will remain low
5
0
5
10
15
20
25
30
Jan
-13
Ap
r-1
3
Jul-
13
Oct
-13
Jan
-14
Ap
r-1
4
Jul-
14
Oct
-14
Jan
-15
Ap
r-1
5
Jul-
15
Total
Real estate
Unit: %YOY of China’s fixed asset investment
Source: EIC analysis based on data from CEIC and EIA
20
40
60
80
100
Jun
-14
Jul-
14
Au
g-1
4
Sep
-14
Oct
-14
No
v-1
4
Dec
-14
Jan
-15
Feb
-15
Mar
-15
Ap
r-1
5
May
-15
Jun
-15
Jul-
15
Au
g-1
5
Crude oil
Sugar
Rubber
Rice
Unit: Index (June 2014=100)

The low commodity prices will continue to hold back Thailand’s households’ consumption spending
6
Source: EIC analysis based on data from Bank of Thailand, Office of Industrial Economics
50
60
70
80
90
100
110
120
Jan-1
3
Mar-
13
May-1
3
Jul-13
Sep-1
3
Nov-1
3
Jan-1
4
Mar-
14
May-1
4
Jul-14
Sep-1
4
Nov-1
4
Jan-1
5
Mar-
15
May-1
5
Jul-15
PCI PCI - nondurable PCI - durable
70
80
90
100
110
120
130
140
Jan-1
3
Mar-
13
May-1
3
Jul-13
Sep-1
3
Nov-1
3
Jan-1
4
Mar-
14
May-1
4
Jul-14
Sep-1
4
Nov-1
4
Jan-1
5
Mar-
15
May-1
5
Real non-farm wage Real farm income
Private Consumption Index (BOT) SA Index: Jan13 = 100 Unit: Index Jan 2013 = 100, 3MMA SA
Non-Farm Wage and Farm Income

Overall business environment for 2016 will be slightly better than this year
7
Private investment
Household consumption
• Public investment
• Sentiment
• Capacity utilization rate
• Farm income
• Household debt
Export
• External demand
• Commodity prices
• Exchange rate: THB/USD
Fails to pick up
Suppressed
Shrinking
Small recovery
No change
Stabilizing
• Shrinking
• Falling
• Weaker THB helps export
• Infra megaprojects to start
• Recovers
• Rising
• Falling commodities income amid severe drought
• High
• Stabilizing
• Stabilizing
• Weaker THB helps export
• Low commodities income with potential drought
• Remains high
• Delays in disbursement
• Deteriorates
• Remains low
Key economic factors 2015 2016
1
2
3
Source: EIC analysis

8
EIC’s baseline economic forecasts
1 %YOY except for policy rate (% per annum) and exchange rate (THB/USD). Source: EIC analysis as of September 2015 based on data from the MoC, the BoT, the NESDB, AIMC, Thai BMA and TFIIC
Comments and Outlook Estimates (%)1
Key drivers
GDP growth (%YOY)
Policy rate (end period)
Export growth (in USD)
THB/USD (end period)
2015F
2.0-2.5
1.50
-4.7 7MYOY
2014A
Weak domestic consumption and investment continue to hold down growth. Sentiment should improve as gov’t project s get going in 2016.
The main culprits are the depressed commodity prices and out-of-date technology products. Weaknesses from China also hurt exports.
BOT is likely to be very cautious against the prospect of volatile capital flows, making further aggressive move on rate unlikely.
With China and other regional players depreciating their currencies, THB will be allowed to weaken further.
2015A
1.50
36
0.9
-0.4
2.00
33.0
2016F
2.5-3.0
0-2
1.50
37
2.9 6MYOY
(-4.5)-(-5)
36

Agenda
• Macroeconomic outlook
• Food and Beverage outlook
9

10
4.7% 5.9%
3.2%
2016f
1.31
2015e
1.24
2014
1.18
2013
1.16
2012
1.13
+19%
+20%
2016f
399
72%
17%
11%
2015e
337
72%
17%
11%
2014
287
73%
17%
11%
2013
204
78%
10%
12%
2012
203
77%
11%
12%
2011
172
77%
11% 13%
2010
138
77%
11% 12%
Food +18%
Dairy +28%
Beverage +17% +6%
+5%
2016f
634
47%
33%
20%
2015e
597
46%
35%
19%
2014
562
45%
37%
18%
2013
533
45%
39%
16%
2012
568
42%
44%
15%
2011
534
41%
46%
13%
2010
464
39%
47%
13%
Other F&B +9% Meat +13%
Seafood -1%
Domestic F&B value
Unit: THB trillion
F&B import value
Unit: THB billion
F&B export value
Unit: THB billion
Domestic consumption, import and export will perform better than this year
Source: EIC analysis based on data from BMI and NFI
11
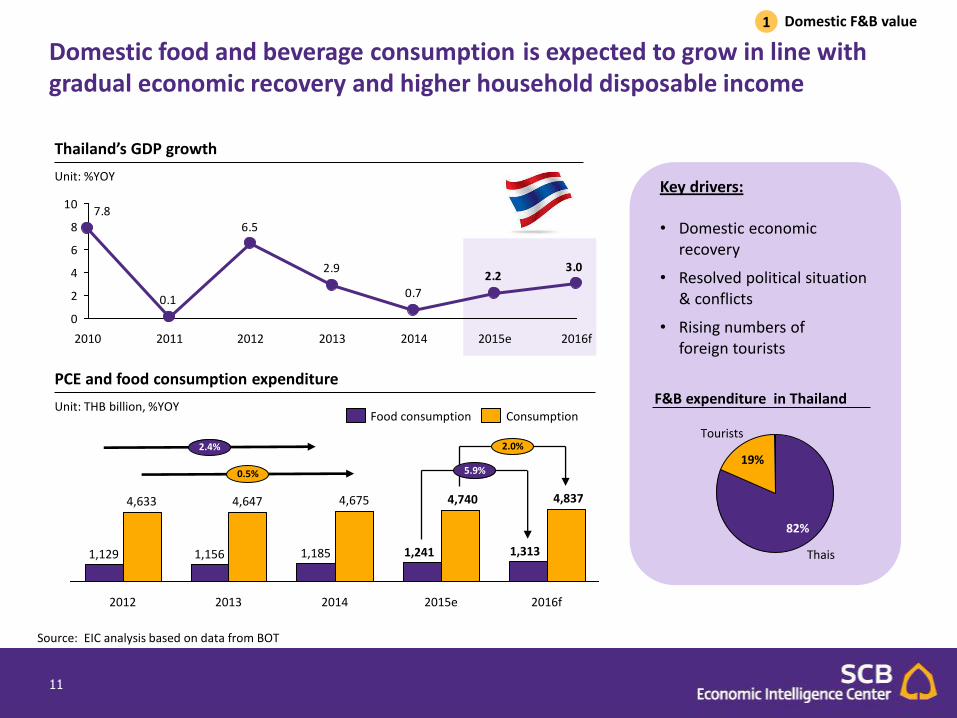
Thailand’s GDP growth
Unit: %YOY
Domestic food and beverage consumption is expected to grow in line with gradual economic recovery and higher household disposable income
0.7
2.9
6.5
0.1
7.8
3.02.2
0
2
4
6
8
10
2016f 2015e 2014 2013 2012 2011 2010
PCE and food consumption expenditure
Unit: THB billion, %YOY
2012
4,633
1,129
2014
4,675
1,185
2013
4,647
1,156
2.0%
5.9%
2.4%
0.5%
2016f
4,837
1,313
2015e
4,740
1,241
Consumption Food consumption
Domestic F&B value 1
Key drivers: • Domestic economic
recovery
• Resolved political situation & conflicts
• Rising numbers of foreign tourists
82%
19%
Tourists
Thais
F&B expenditure in Thailand
Source: EIC analysis based on data from BOT

12
Disposable income of Thai households is likely to move up the bracket in tandem with better economic growth
25%
75%
F&B spending
Others
Household spending by category
Number of households by disposable income bracket 2005, 2010, 2016
Unit: ‘000 households
Source: EIC analysis based on data from Euromonitor
Domestic F&B value 1

13
4.5
3.6
3.0
2.9
4.0
3.3
2.1
5.3
3.4
4.7
3.7
2.4
6.6
3.9
4.5
3.5
3.6
5.6
3.5
5.0
+24%
+12%
+14%
+19%
+21%
+13%
+16%
Snacks
+11%
Seasoning
Ready Meals
Pasta
Oils and Fats
Ice Cream
Dairy
Chilled Processed Food
Canned/Preserved Food
Bakery
2014-19 CAGR
2014-15
5.4
5.2
5.9
4.2
4.7
6.0
7.6
4.5+7%
Organic +15%
+29%
+15% Health & wellness
Functional
Naturally Healthy
2014-15
2014-19 CAGR
Rising urbanization and middle-income class will drive continued demand for processed food, RTE, RTD and health & wellness food in Thailand
Growth of packaged food sales in Thailand
Unit: %
Growth of health & wellness food sales in Thailand
Unit: %
Source: EIC analysis based on data from Euromonitor
Domestic F&B value 1

14
4%
Herb
2%
Meat
63% 15%
1%
Seasoning
0%
Seafood
1%
Fruit
Legumes
1%
Candy
Vegetable
Starchy products
8%
5%
Roots
Non-alcoholic beverage
2%
Hot drink 63%
Alcoholic beverage 35%
Source: EIC analysis based on data from NFI
Thailand’s food import value
Unit: billion THB
399
12%
72%
11%
337
17%
11%
2015e
17%
2016f
72%
17% 287
11%
2013
204
78%
10% 12%
2012
203
77%
11% 12%
2011
+19%
77%
11% 13%
2010
172
77%
11%
2014
73%
138
Dairy +28%
Food +18%
Beverage +17%
63% 15%
Vegetable
4%
1%
Herb
8%
Fruit
Legumes
5%
Seafood
1%
2%
Candy
Starchy products Meat
Seasoning
1%
0%
Roots
Non-alcoholic beverage
Alcoholic beverage
63%
35%
2%
Hot drink
Source: EIC analysis based on data from NFI
Import of F&B 2
Thailand’s key importing food items are seafood (tuna), diary products and beverages

15
Export of F&B 3
Thailand’s food export by main category
Unit: %
Other F&B export value
Unit: billion THB
12%
4%
Others
11%
Oceania
3%
US
Middle East
China
EU 12%
11% 12%
Africa
13%
22%
Japan
ASEAN
Other F&B
Seafood
45% 37%
18%
Meat
Thai food importer
Unit: %
21%
45%
19%
+8%
2013
10% 241
4%
41%
26%
19%
4%
11%
2012
237
44%
24%
251
2014
19%
25%
11% 3%
2010
46%
16%
44%
3%
15%
12%
26%
10%
182 3%
2011
219
Others
Dairy +17%
Fruit & Veg +9%
Starch +3%
Beverage +15%
ASEAN is our key destination for F&B products
Source: EIC analysis based on data from NFI

16
809
+6.9%
2020f
1,375
2012
2020f
7.7
25%
75%
2010
6.9
23%
77%
2000
6.1
21%
79%
Muslim +1.9% Non-muslim +1.0%
7.2 7.3
2017f 2010 2014 2011
6.9
2012 2015f
7.0 7.0
2016f
7.4 7.1
2013
7.4
+1%
2018f
7.5
Source: EIC analysis based on data from NFI, IMF, Trademap, UN and World Halal Summit Report
World population
Unit: Billion persons
Aging population
Unit: Million persons
Muslim population
Unit: Million persons
Export of F&B 3
Going forward, food and beverage serving Aging and Muslim population will have brighter prospects and bigger room to grow

17
-1
0
1
2
3
4
5
6
7
8
9
10
11
2014 2010 2018f
EU
EM
ASEAN-5
World MENA Japan
US China
46
77
52 49
78
54 52
79
56
DM EM World
+5%
+1%
+4%
2020f 2010 2015e
1317
31
2002 2011 2015e
-6%
* Poverty line = below USD 1.25 /day
EM and ASEAN-5 will become key potential markets for F&B consumption while urbanization trend will drive more demand for packaged and RTE food
GDP growth forecast
Unit: %YOY
Urban population
Unit: % of total
Population living below poverty line*
Unit: % of total
Source: EIC analysis based on data from IMF and UN
Export of F&B 3

18
51
118
2339
5
48
72
9
17
10
32
17
3
35
Milk Seafood Oil Sugar Starchy roots
Cereal exc. Beer
Meat Alcoholic beverages
Fruits Vegetables
2002 2014
844741
+3%
2018f 2013
442
336
+6%
2014 2019f
Growing protein intake will enhance global demand for meat, seafood and dairy products
Share of global dietary energy supply
Unit: % of total
Global meat and seafood market
Unit: USD billion
Global dairy market
Unit: USD billion
Source: EIC analysis based on data from Merrill Lynch
Meat consumption by type
Unit: Kilogram per capita
1.8
9.810.2
14.6
9.9
2.1
10.113.8
15.319.2
2.4
10.6
17.215.1
20.9
Fish* Pork Poultry Beef Lamb
1997/99
2030
2015
Export of F&B 3

19
84
43
2013 2018f
+15%
N. America Europe 43% 34%
4%
Others
66
34
2013
+14%
2018f
1,100
2019f
+3%
932
2014
Rising health awareness amongst consumers will contribute stronger sales for health and wellness F&B products, esp. in the developed economies
Global H&W food market
Unit: USD billion
Global organic F&B market
Unit: USD billion 2013: 80.4 USD billion
Export of F&B 3
Source: EIC analysis based on data from Merrill Lynch, Euromonitor, BCC Research and Agrarmarkt Austria Marketing

20
13%
2014
14%
1,516
10%
64%
11% 11%
2,580
2010
3%
+14%
67%
6%
2%
Others +1%
India +28% Viet Nam +13%
Thailand +15% Canada +16%
17% 4% 6%
Indonesia
Hong Kong
Others
30%
US
Viet Nam
21%
22% China
Source: EIC analysis based on data from Trademap
Chinese demand for Thai fresh and frozen fruits will continue to rise steadily over the forecasted period
Export of F&B 3
Major destination of Thai fruits export, 2014
Unit: % of total
China fruit imports, by supplying country
Unit: USD million
Thailand is the main supplier of fresh fruits in China

21
3%
5%
2%
20%
1,362
15%
72% 4%
65%
3% 3%
+22%
4%
5%
2014 2010
611
CLMV +25%
Philippines +11%
Indonesia +16%
Singapore +13%
Malaysia +24%
Others +14%
2010
36%
23%
64%
19
77%
2014
37 +18%
Non-alochoholic drinks +23%
Alcoholic drinks +4%
3
4
5
6
7
8
9
10
Vietnam
Laos
Myanmar
ASEAN-5
Cambodia
2018f
World
2010 2017f 2016f 2015f 2014 2013 2012 2011
Demand for Thai beverage, especially non-alcoholic beverages (tea and functional drinks), in CLMV is rising strongly in line with economic expansion
Export of F&B 3
Source: EIC analysis based on data from Trademap
Thai beverage export to CLMV market, by category
Unit: THB million
Major destination of Thai beverage export
Unit: THB million
GDP growth forecast
Unit: %YOY

22
Likewise, demand for Thai dairy products is also expected to grow steadily, particularly among the CLMV countries
Export of F&B 3
20%
1% 10%
4%
13%
13%
4%
189
8%
2010
5%
16%
13%
19%
12% 9%
8%
16%
9%
20%
+9%
2014
262
Germany +66%
Others +3%
US +16% Cambodia +7%
Hong Kong +17%
Singapore +4%
Laos +6%
Philippines +15%
Myanmar +5% Buttermilk & yogurt
31%
Sweetened milk
20%
Milk
12% Whey
6%
Others
31%
Import
Domestic
Production
2,602
57%
43%
Domestic
Export
2,602 7%
Consumption
93%
Source: EIC analysis based on data from Trademap
Major destination of Thai dairy export
Unit: USD million
Thai dairy export products, 2014
Unit: %
Thai dairy industry, 2014
Unit: ‘000 ton

23
In sum, EIC expects overall F&B industry to expand continuously in 2016 and over the forecasted period
Segment Key drivers 2016
Outlook MT
Outlook
Domestic & Import
• Population growth
• Economic recovery
• Higher disposable income
• Rising of middle-income class
• Rising urbanization
Export • Macro trend
Economic change
Demographic change
Demand change
• Demand for Thai fruits in China
• Demand for Thai beverage in CLMV
• Demand for Thai dairy products from Asian countries
Positive
G
Positive
G
Positive
G
Positive
G
Source: EIC analysis

End of document
24


Disclaimer Disclaimer Disclaimer Disclaimer
The information contained in this report
has been obtained from sources believed
to be reliable. However, neither we nor any
of our respective affiliates, employees or
representatives make any representation
or warranty, express or implied, as to the
accuracy or completeness of any of the
information contained in this report, and
we and our respective affiliates, employees
or representatives expressly disclaim any
and all liability relating to or resulting from
the use of this report or such information
by the recipient or other persons in
whatever manner.
Any opinions presented herein represent
our subjective views and our current
estimates and judgments based on various
assumptions that may be subject to
change without notice, and may not prove
to be correct.
This report is for the recipient’s
information only. It does not represent or
constitute any advice, offer,
recommendation, or solicitation by us and
should not be relied upon as such. We, or
any of our associates, may also have an
interest in the companies mentioned
herein.
26
Related Documents


