Macro Economics & Coal Industry S.B.Mahapatra Sr. Faculty Member IICM, Ranchi

Welcome message from author
This document is posted to help you gain knowledge. Please leave a comment to let me know what you think about it! Share it to your friends and learn new things together.
Transcript

Macro Economics & Coal Industry
S.B.Mahapatra
Sr. Faculty Member
IICM, Ranchi

Global Financial Crisis● USA – Layman Brothers● UK - Has lined up $850b rescue plan,
May nationalize Royal Bank of Scotland, Will recapitalize Bank upto $88b each, Barclays, HSBC, Lyods, Standard Chartered, HBOS, Govt. will guarantee $439b, Total liability of Barclays $1950b, Leverage over 60, More than Britain GDM.
2

Global Financial Crisis (cont…)● Belgium – Govt. took partial control of the
struggling Fortis Bank, Fortis Bank liability is several times higher than GDP of Belgium.
● Germany – Has guaranteed all Bank deposits, Total liability of Deutsche Bank leveraging over 50 which is 80% more than the GDP of Germany.
● The situation is more or less similar to other countries of EU – Iceland has nationalized 3 of its biggest Bank.
● IMF’s latest estimate regarding losses of US Banking system amounts to $1.4 Trillion.
3


Micro & Macro Economics● Micro Economics is a branch of
economics which study how the individual, household, farm, make decision to allocate limited resources and how this decision affect the supply and demand of goods and services which determines price and how price in turn determine the supply and demand of goods and services.
4

Micro & Macro Economics (cont..)
● Macro Economics on the other hand involve the sum total of economic activity dealing with issues like– Economic growth – savings, population,
COR, poverty etc.– Inflation, Unemployment– International economics– Export, Import, balance of trade, current
account deficit– Govt. policy and its effect on macro
economic parameters. 5

Poverty● Definition – World Bank – In Aug’08 World
Bank has revised the threshold of poverty line for the purpose of estimating global poverty from per capita expenditure capacity of $1 per day to $1.25 per day in terms of PPP for the year 2005.
● As per the new definitions, 41.6% of the Indian population are poor and as per the earlier definition 24.3% of Indian population are living in poverty.
6

Poverty (cont….)● In India, the definition of poverty is based on
nutritional norm i.e. the expenditure capacity of household group, 2400 Calories for an individual in rural area 2100 Calories in urban areas.
● In financial term the amount are –RuralUrban
1973 Rs.49.00 Rs.57.002000 Rs.327.00 Rs.454.002006 Rs.432.00 Rs.603.002008 Rs.498.00 Rs.696.00
7
Poverty (cont….)● The above definitions of poverty line is more
akin to starvation line.● The definition, beyond a mere calorific norm,
access to health, education, shelter as well as hygiene and sanitation is not considered.
● Suresh Tendulkar Committee has been constituted by the govt. to frame a comprehensive definition of poverty. But Indian Govt. do not allow any other definition which will increase statistically the no. of poor.
8

Macro Scene – Financial Tsunami & Ripple Effect
● The Good– Oil price has fallen over 50%– Regulated banking system– Forex reserve over $270b– Global wheat prices have fallen– Interest rates are declining – Cut in
repo rate
9

Macro Scene – Financial Tsunami & Ripple Effect (cont….)
● The Bad– Sensex has crashed 60% - FCCB,
stoppage of right issue– Banks are reluctant to lend– The rupee has breached 50 v/s $– Monsoon worse than last year– Fiscal deficit to be far higher– Projects likely to be stalled– Overseas funds have dried up– Job prospects are green
10

Macro Scene – Financial Tsunami & Ripple Effect (cont….)
● Could Turn Ugly– Slow down could result in more job
losses– Corporates could face credit freeze– Further flight of capital likely– Food prices could rise– Bank NPAs set to rise– Loans may become inaccessible too
11

Economic Growth● During the last couple of year, India has made
remarkable GDP growth as below:Year GDP Growth Total GDP Per capita GDP2002-03 3.8 % 24.5 L.Cr. 232662003-04 8.5% 27.5 L.Cr. 256962004-05 7.5% 31.4 L.Cr. 289802005-06 9.4% 35.8 L.Cr. 323722006-07 9.6% 41.4 L.Cr. 369502007-08 9.0% 47.1 L.Cr. 414162008-09 7.5% 53.0 L.Cr. 43000
In fact GDP in the purchasing power parity is nearly 4 times the above GDP 12
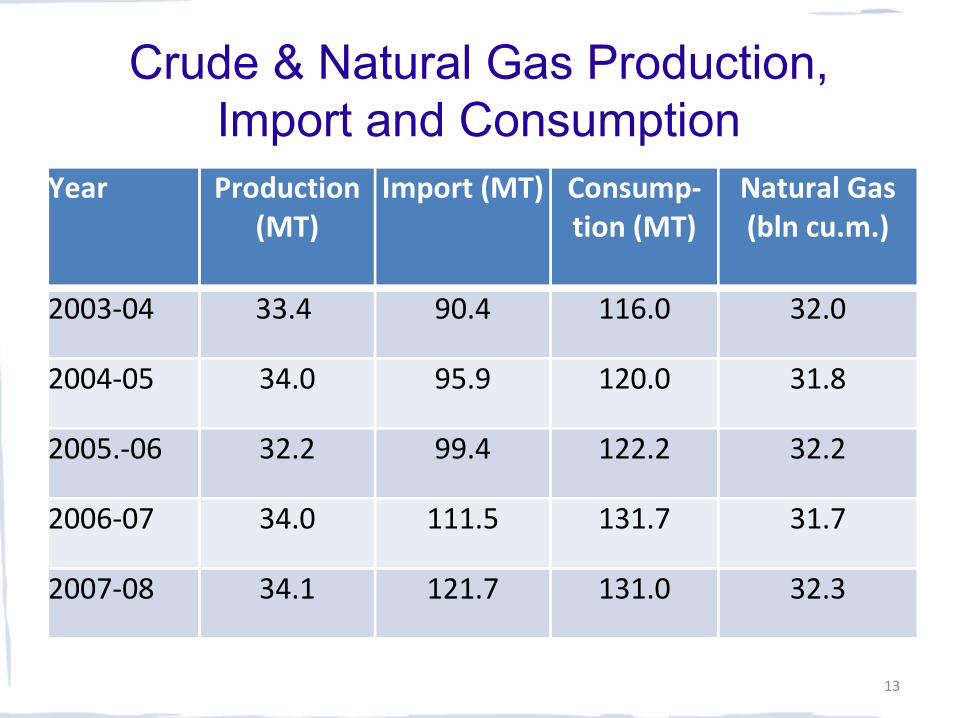
Crude & Natural Gas Production, Import and Consumption
Year Production (MT)
Import (MT) Consump-tion (MT)
Natural Gas(bln cu.m.)
2003-04 33.4 90.4 116.0 32.0
2004-05 34.0 95.9 120.0 31.8
2005.-06 32.2 99.4 122.2 32.2
2006-07 34.0 111.5 131.7 31.7
2007-08 34.1 121.7 131.0 32.3
13

Balance of Payment2003-04 2004-05 2005-06 2006-07 2007-08 2008-09
Export 63.9 83.5 103 126 159 191
Import 78.2 111.4 149 185 239 302
POL 20.6 29.8 44 57 79.6 102
Non-POL 57.6 81.6 105 128 158.4 200
Trade Balance
(-) 14.3 (-) 27.9 (-) 46 (-) 59 (-) 80 (-) 111
Trade4 Balance (RBI)
14.0 33.7 51.9 63 90 -
Gross invisible
53.5 69.5 89.6 115 145 -
14

Balance of Payment (cont…)2003-04 2004-
052005-06 2006-07 2007-08 2008-09
Net invisible 27.8 31.2 42.0 53 73 -
Current A/c Balance
(-) 14.0 (-) 2.5 (-) 9.9 (-) 9.8 (-) 17.4 -
Foreign Capital Inflow
16.7 28.0 25 46 108 -
External Comm. borrowing
(-) 2.9 5 2.5 16 22 -
FDI 4.3 5.9 8.9 22.0 32 -
Portfolio 11.0 9.3 12.5 7.0 29 -
15

Rupee Dollar Exchange Rate
16

Foreign Exchange Reserve
17

Govt. Receipt & Payment2003-04 2004-05 2005-06 2006-07 2007-08 2008-09
Receipt D. Tax 1050 1320 1573 2195 3044 3647
Indirect Tax 1494 1729 2088 2540 2810 3230
Total Tax 2544 3049 3661 4735 5854 6877
Expenditure 4712 4983 5057 5834 7094 7509
Plan Expenditure 1223 1323 1406 1699 2075 2434
N.P. Expenditure 3489 3660 3651 4135 5018 5075
Gross Fiscal Deficit 1233 1258 1464 1426 1437 1333
Subsidiaries 443 460 475 571 697 716
18

Govt. Receipt & Payment (cont….)
2003-04 2004-05 2005-06 2006-07 2007-08 2008-09
Defence (billion) 601 759 805 855 925 1056
Interest (billion) 1241 1269 1326 1503 1720 1908
Outstanding Int. Debt (billion)
11417 12759 13897 15450 18441 19725
External Debt ($b) 112 133 138 169 221 -
Wholesale Price Index
5.4 6.4 4.4 5.4 4.7 10
Primary Article 4.2 - - - - 9.2
Fuel Power 6.3 - - - - 14.3
Manufacture 5.6 - - - - 8.7
19
Unemployment● Employment scenario has worst hit,
particularly export oriented sector such as Textile, IT, Leather, Aviation.
● Job anxiety is prevailing across the sectors.
● Since the sub-prime crisis more than 5 million job has been lost in India.
● IT sector has layoff more than 10,000 employees.
● Lower GDP growth have adverse impact in the creation of job opportunity. 20

Unemployment (cont….)
● In export oriented unit and labor intensive industries such as leather, textile, gems and handicrafts, 3 million jobs has been lost.
● Currently in India 484 million strong workforce is growing by 2.5% annually i.e. more than 10 million people join the workforce every year.
● Intension to hire has dampened at all level.
● Wages cut, leave without wages, reduction in variable pay etc. is rampant.
21
Unemployment (cont….)● Demographic advantage of India (570 million
people below the age of 25) is turning into disadvantage.
● 60% of the workforce is in the rural areas which provides only 18% of GDP.
● 40% of our workforce is illiterate, 40% is below 12 class pass.
● Job in the organized sector is insignificant. Only 7% of the India’s workforce which normally makes the headline – In case of Jet Airways galvanized politician and media. 22

Unemployment (cont….)● Unorganized sector like personal service,
transportation, construction, power loom deploy 150 million people.
● In Coimbatore, a manufacturing hub employing more than 1 million people, 10% of the workforce has been retrenched.
● The private engineering collages are worst hit.● GDP growth has co relation with the
employment generation, slow down in GDP will reflect in falling job creation rate and unemployment will rise.
23
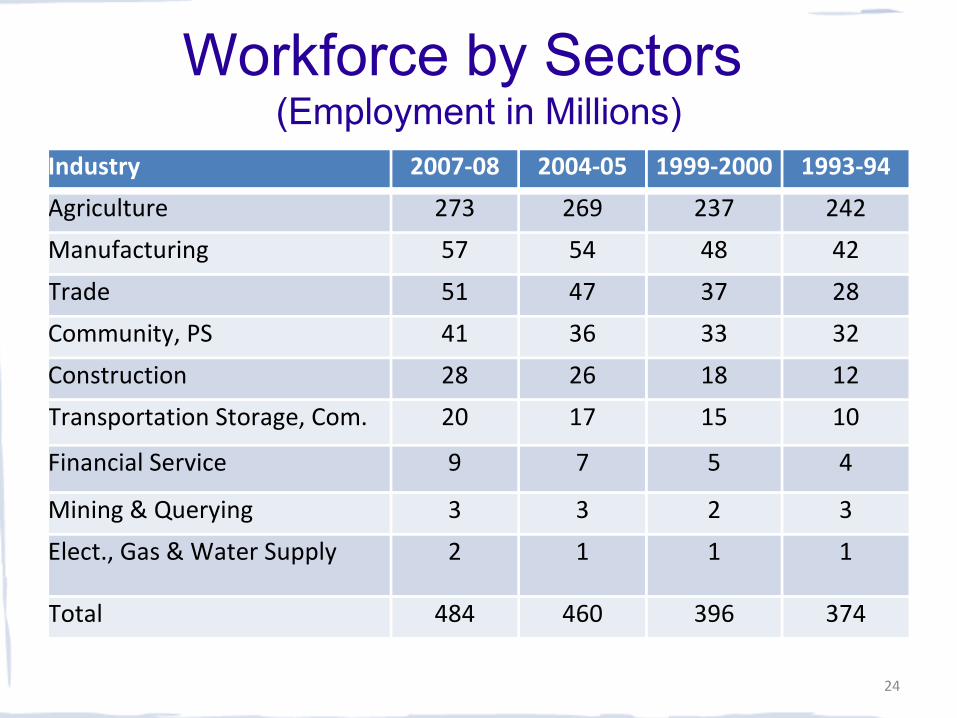
Workforce by Sectors (Employment in Millions)
Industry 2007-08 2004-05 1999-2000 1993-94
Agriculture 273 269 237 242
Manufacturing 57 54 48 42
Trade 51 47 37 28
Community, PS 41 36 33 32
Construction 28 26 18 12
Transportation Storage, Com. 20 17 15 10
Financial Service 9 7 5 4
Mining & Querying 3 3 2 3
Elect., Gas & Water Supply 2 1 1 1
Total 484 460 396 374
24
Related Documents