M. Shanahan, A. Havard, K. Mills. A. Williamson, J. Ross, M. Teesson, S. Darke, R. Ali, A. Ritter, R. Cooke & M. Lynskey Health services use and treatment costs over 12 months among heroin users: Findings from the Australian Treatment Outcome Study (ATOS) NDARC Technical Report No. 203

Welcome message from author
This document is posted to help you gain knowledge. Please leave a comment to let me know what you think about it! Share it to your friends and learn new things together.
Transcript
M. Shanahan, A. Havard, K. Mills. A. Williamson,
J. Ross, M. Teesson, S. Darke, R. Ali, A. Ritter, R. Cooke & M. Lynskey
Health services use and treatment costs over 12 months among heroin users:
Findings from the Australian Treatment
Outcome Study (ATOS)
NDARC Technical Report No. 203

HEALTH SERVICES USE AND TREATMENT
COSTS OVER 12 MONTHS AMONG HEROIN
USERS:
FINDINGS FROM THE AUSTRALIAN
TREATMENT OUTCOME STUDY (ATOS)
Marian Shanahan, Alys Havard, Katherine Mills, Anna Williamson,
Joanne Ross, Maree Teesson, Shane Darke,
Robert Ali, Alison Ritter, Richard Cooke & Michael Lynskey
Technical Report Number 203
ISBN: 1877027 94 4
©National Drug and Alcohol Research Centre, University of New South Wales,
Sydney, 2003
This work is copyright. You may download, display, print and reproduce this material in unaltered form only (retaining this notice) for your personal, non-commercial use or use within your organisation. All other rights are reserved. Requests and enquiries concerning reproduction and rights should be addressed to the information manager, National Drug and Alcohol Research Centre, University of New South Wales, Sydney, NSW 2052, Australia.
2

TABLE OF CONTENTS
ACKNOWLEDGEMENTS ..............................................................................................5 EXECUTIVE SUMMARY ...............................................................................................6 1. INTRODUCTION ...............................................................................................9 2. METHODS ............................................................................................................ 12
2.1 Procedure ............................................................................................... 12 2.2 Structured interview............................................................................... 12 2.3 Costing perspective................................................................................ 13 2.4 Consistent methodology for determining costs .................................... 14 2.5 Index treatment costs ............................................................................ 15 2.6 Non-index treatment costs .................................................................... 19 2.7 Other health services utilisation (HSU) in the month preceding interview ...................................................................................................... 19 2.8 Detoxification prior to index residential rehabilitation.........................23 2.9 Statistical analysis ..................................................................................23
3. RESULTS............................................................................................................24 3.1 Sample characteristics............................................................................24 3.2 Outcomes...............................................................................................28 3.3 Treatment services and costs ................................................................28 3.4 HSU resources and costs.......................................................................32
4. DISCUSSION..........................................................................................................37 5. REFERENCES........................................................................................................ 41
3

LIST OF TABLES
Table 1: Who pays for drug treatment services? .....................................................................14 Table 2: Costs for Index and Non-index Opiate Dependence Treatment (Australian 2002
dollars) ..................................................................................................................................18 Table 3: Costs for HSU...............................................................................................................22 Table 4: Detoxification prior to attending index residential rehabilitation..........................23 Table 5: Selected baseline characteristics..................................................................................27 Table 6: Key outcome measures ................................................................................................28 Table 7: Index treatment at 12 months – costs and days in treatment ................................29 Table 8: Percent of each index group with at least one non-index episode of the
following:..............................................................................................................................30 Table 9: Time in non- index treatment over 12 months ........................................................30 Table 10: Total days, episodes and costs for non-index treatment.......................................31 Table 11: Distribution of costs ..................................................................................................31 Table 12: Total treatment – costs, days and episodes in treatment at 12 months (index
and non-index treatment) ..................................................................................................32 Table 13: Percent of individuals that use various health services (HSU) in the month
prior to the baseline and at 12 months interviews .........................................................33 Table 14: Quantity of health services utilisation (HSU) in the month prior to the baseline
and 12 month interviews....................................................................................................34 Table 15: One month HSU costs at baseline and 12 months ...............................................34 Table 16: Distribution of HSU costs per person in one month ...........................................35 Table 17: HSU costs and percent expenditure by group........................................................35 Table 18: Percent of HSU expenditures that were paid by the individual...........................36
4
ACKNOWLEDGEMENTS
This project was funded by the National Health and Medical Research Council
(National Illicit Drugs Strategy), the Australian Government Department of
Health and Aging, and the Victorian Department of Human Services.
The authors would like to thank the treatment agency staff who assisted in the
recruitment of participants for ATOS. Special thanks also go to the participants
themselves who gave up their time to participate in the study. We would also like
to thank those who reviewed the document, any errors or omissions remain ours.
5

EXECUTIVE SUMMARY
Introduction Heroin use results in a significant social burden. In addition to the wider social impact,
heroin use represents a serious public health concern creating many challenges for policy
makers and treatment providers alike. This health burden comes at some cost; heroin
dependence accounts for a significant proportion of the total burden of disease and
injury related to illicit drugs in Australia. Despite this, there is little information on either
the use of health care services generally, or more specifically the use of drug treatment
services over extended periods of time, by heroin users in Australia.
This report documents economic costs of treatment for heroin and other health services
using data from the Australian Treatment Outcome Study. The aims of this report are to:
1. Determine patterns of treatment for heroin dependence and other health services
use among heroin users
2. Determine the costs of treatment and other health services use.
This current report presents 12 month cost data from New South Wales, South Australia
and Victoria.
Method
Seven hundred and forty five individuals entering treatment and 80 heroin users not
seeking treatment were recruited into the study and interviewed by trained research staff
using a structured questionnaire. A total of 649 individuals, who were followed up at 12
months and for whom there was complete resource use information are included in the
report. Data was collected on all treatment experiences (type, and number of days of
treatment) over the 12-month follow-up, use of other health care services, as well as their
heroin and other drug use, mental health and criminal activity. Treatment and other
health services use were costed using a set of standard prices.
TR.203 6
Results
Index treatment
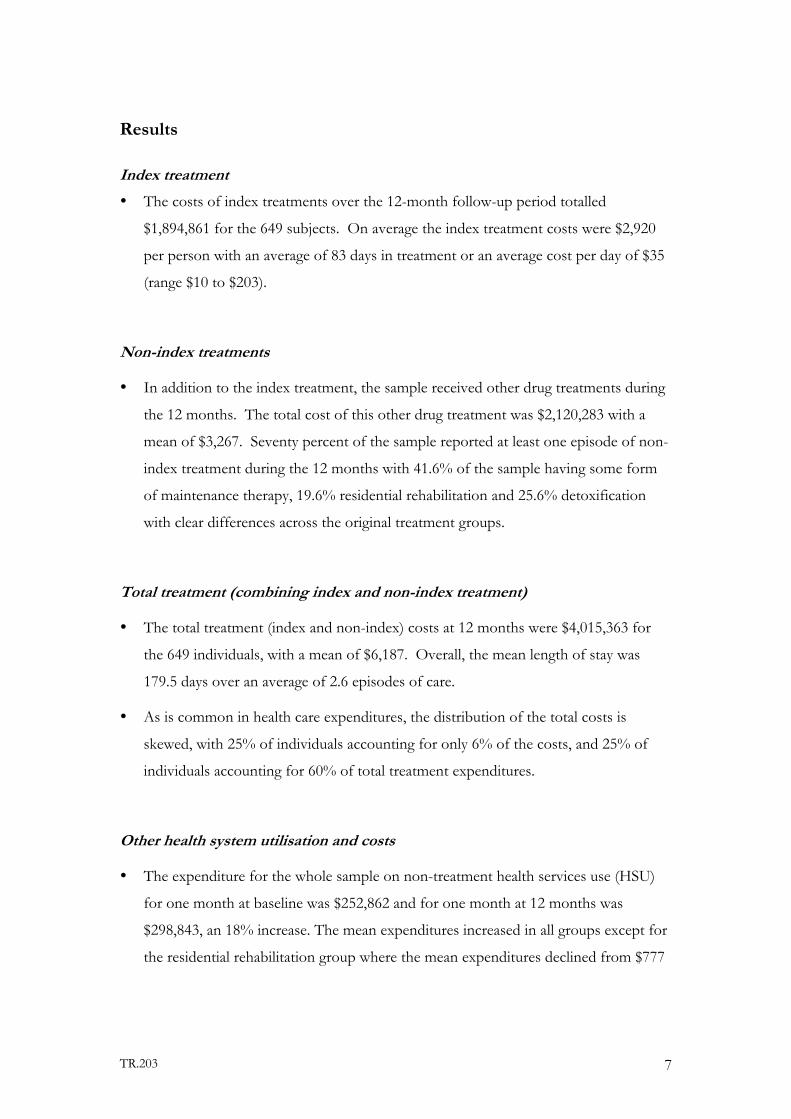
The costs of index treatments over the 12-month follow-up period totalled
$1,894,861 for the 649 subjects. On average the index treatment costs were $2,920
per person with an average of 83 days in treatment or an average cost per day of $35
(range $10 to $203).
Non-index treatments
In addition to the index treatment, the sample received other drug treatments during
the 12 months. The total cost of this other drug treatment was $2,120,283 with a
mean of $3,267. Seventy percent of the sample reported at least one episode of non-
index treatment during the 12 months with 41.6% of the sample having some form
of maintenance therapy, 19.6% residential rehabilitation and 25.6% detoxification
with clear differences across the original treatment groups.
Total treatment (combining index and non-index treatment)
The total treatment (index and non-index) costs at 12 months were $4,015,363 for
the 649 individuals, with a mean of $6,187. Overall, the mean length of stay was
179.5 days over an average of 2.6 episodes of care.
As is common in health care expenditures, the distribution of the total costs is
skewed, with 25% of individuals accounting for only 6% of the costs, and 25% of
individuals accounting for 60% of total treatment expenditures.
Other health system utilisation and costs
The expenditure for the whole sample on non-treatment health services use (HSU)
for one month at baseline was $252,862 and for one month at 12 months was
$298,843, an 18% increase. The mean expenditures increased in all groups except for
the residential rehabilitation group where the mean expenditures declined from $777
TR.203 7
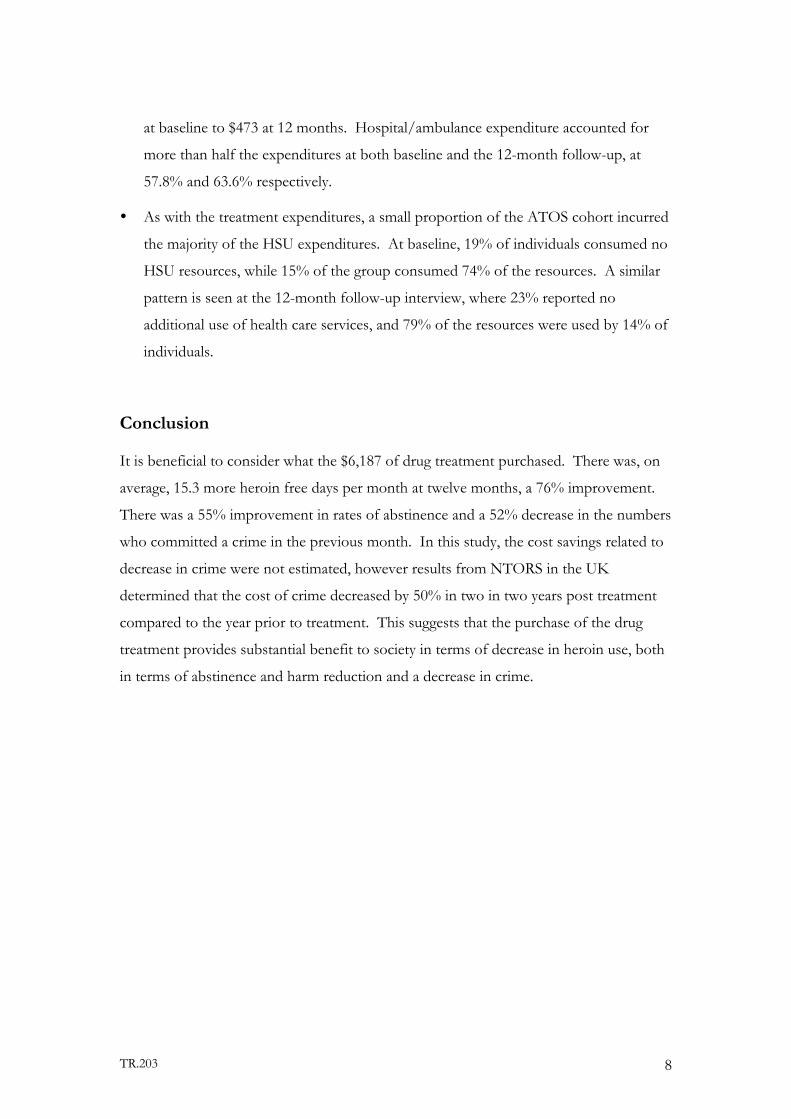
at baseline to $473 at 12 months. Hospital/ambulance expenditure accounted for
more than half the expenditures at both baseline and the 12-month follow-up, at
57.8% and 63.6% respectively.
As with the treatment expenditures, a small proportion of the ATOS cohort incurred
the majority of the HSU expenditures. At baseline, 19% of individuals consumed no
HSU resources, while 15% of the group consumed 74% of the resources. A similar
pattern is seen at the 12-month follow-up interview, where 23% reported no
additional use of health care services, and 79% of the resources were used by 14% of
individuals.
Conclusion
It is beneficial to consider what the $6,187 of drug treatment purchased. There was, on
average, 15.3 more heroin free days per month at twelve months, a 76% improvement.
There was a 55% improvement in rates of abstinence and a 52% decrease in the numbers
who committed a crime in the previous month. In this study, the cost savings related to
decrease in crime were not estimated, however results from NTORS in the UK
determined that the cost of crime decreased by 50% in two in two years post treatment
compared to the year prior to treatment. This suggests that the purchase of the drug
treatment provides substantial benefit to society in terms of decrease in heroin use, both
in terms of abstinence and harm reduction and a decrease in crime.
TR.203 8

1 . INTRODUCTION
Heroin use results in a significant social burden. Several international studies such as the
Drug Abuse Report Program (DARP), Treatment Outcome Prospective Study (TOPS),
Drug Abuse Treatment Outcome Study (DATOS) and National Treatment Outcome
Research Study (NTORS) (Simpson et al., 1997, Hubbard et al., 1989, Gossop et al.,
1997, Gossop et al., 1998, Gossop et al., 2000, Gossop et al., 2003, Godfrey et al., 2004,
Simpson and Sells, 1982) have examined treatment use and outcomes in the United
States and the United Kingdom. When the costs of treatment in these and other studies
were compared to the social benefits gained from treatment, including decreased crime
costs, the findings were unvarying, that is, treatment is cost beneficial from the societal
perspective (Harwood et al., 1988, Gerstein et al., 1994, Godfrey et al., 2004, Gossop et
al., 1998, Flynn et al., 1999, Cartwright, 2000).
Heroin use is a serious public health concern that creates many challenges for policy
makers and treatment providers alike. The general health of heroin users has long been
recognised to be poor (Ryan and White, 1996, Cherubin and Sapira, 1967, Webster et al.,
1977). In addition to overall poor health, heroin users also have specific health problems
related to overdose, blood-borne viruses, injection-induced vascular damage
(Degenhardt, 2001, Warner-Smith et al., 2001, Morrison et al., 1997, Crofts and Aitkin,
1997) and high rates of depression and other psychopathology (Brienza et al., 2000,
Brooner et al., 1997, Croughan et al., 1982, Darke and Ross, 1997, Khantazin and Treece,
1985, Kosten and Rounsaville, 1988, Rounsaville et al., 1982). Heroin users also engage
in frequent poly drug use (Darke and Ross, 1997, Kidorf et al., 1998) including
prescription pharmaceutical products (Ross et al., 1996, Darke et al., 2003) which often
leads to frequent visits to multiple doctors (ie. doctor shopping) (Adair et al., 1996).
This health burden comes at some cost; heroin dependence accounts for a significant
proportion of the total burden of disease and injury related to illicit drugs in Australia
(Mathers et al., 1999) with estimates that 23% of the burden of heroin is due to health
TR.203 9
care costs (Mark et al., 2001). In the US, French et al. (2000) reports that injecting and
chronic drug users consumed approximately US $1000/year more in health care costs
than the general population when inpatient, outpatient and emergency costs are
considered (French et al., 2000). Despite this, there is little information on either the
costs associated with the use of health care services generally, or more specifically the use
of drug treatment services over extended periods of time, by heroin users in Australia. A
few Australian randomised controlled trials have compared the costs and outcomes of
providing specific forms of treatment interventions for heroin dependence (Doran et al.,
2003, Gibson et al., 2003, Mattick et al., 2001). However these studies, which involved
detailed costing of treatment permitting the comparison of the cost-effectiveness of
various treatment interventions for a short period (1 week to 6 months), often did not
report data on subsequent drug treatment provision or other health care use during the
period of follow-up.
This report documents the economic costs of treatment for heroin dependence and
other treatment services based on data collected by the Australian Treatment Outcome
Study (ATOS). ATOS is the first large-scale longitudinal study of treatment outcome for
heroin dependence to be conducted in Australia. ATOS is being conducted by the
National Drug and Alcohol Research Centre (NDARC) in collaboration with the Drug
and Alcohol Services Council (DASC) of SA and Turning Point Alcohol and Drug
Centre, Melbourne.
The main purpose of ATOS is to examine the effectiveness of treatment for heroin
dependence as it is delivered in everyday practice. Heroin users were recruited on entry
to one of the three major treatment modalities in Australia (methadone/buprenorphine
maintenance treatment, detoxification or residential rehabilitation), and were re-
interviewed at 3 and 12 months post treatment entry. A comparison group of heroin
users who were not in treatment were also recruited in order to allow more confidence in
attributing outcomes to treatment. The study commenced in February 2001, and an
examination of the baseline characteristics of the sample indicated a high level of poly
TR.203 10
drug use, criminality and psychopathology among Australian entrants to treatment for
heroin dependence (Ross et al., 2002a, Weekley et al., 2002, Holt et al., 2002).
Examination of use of health services at baseline demonstrated high levels of health
services utilisation among this cohort (Darke et al., 2003). At 12 months there were
substantial reductions in drug use, risk-taking, crime and injection-related health
problems across all treatment groups and less marked reductions among the non-
treatment (NT) group. Psychopathology was also dramatically reduced among the
treatment modalities, while remaining fairly stable among the non-treatment group (Ross
et al., 2004).
This report documents the economic costs of treatment for heroin dependence as well as
the economic costs of other health services. This study uses the real world context of
ATOS to collect information on the resources used in the original (index) treatment, but
also those used in subsequent drug treatment programs. In addition information is
collected on the use of general health care services at baseline and in the month prior to
the 12-month follow-up interview.
The aims of this study are to:
1. Describe patterns of treatment for heroin dependence and other health services
use among heroin users
2. Determine the costs of treatment and other health services use
TR.203 11
2. METHODS
2.1 Procedure ATOS is a longitudinal study of treatment outcome for heroin dependence, with follow-
up interviews conducted at 3 and 12 months post treatment entry. Baseline data were
collected between February 2001 and August 2002. Treatment entrants were recruited
from 38 agencies treating heroin dependence in Sydney, Adelaide and Melbourne. They
comprised 21 methadone/buprenorphine maintenance (MT) agencies, 17 detoxification
facilities (DTX), and 8 residential rehabilitation units (RR). Eight agencies provided both
maintenance and detoxification services. Additionally, in Sydney, a comparison group of
heroin users not currently in or seeking treatment (NT) was recruited from needle and
syringe programs within the same regional health areas from which treatment entrants
were recruited.
Eligibility criteria were: i) no treatment for heroin dependence in the preceding month, ii)
no imprisonment in the preceding month, iii) aged 18 years or over, iv) agreed to give
contact details for follow-up interviews, and v) had a good understanding of English.
Participants were paid up to AUS$30 for completing each interview, which took up to 90
minutes to complete at baseline and approximately 20 minutes at the 3 and 12 month
interviews.
2.2 Structured interview At baseline, 3 months and 12 months, participants were administered a structured
interview. Sections addressed demographic characteristics, treatment history, drug use
history and heroin overdose history. Drug use, needle risk-taking, injection-related
health problems and criminal behaviours over the month preceding interview were
measured using the Opiate Treatment Index (OTI; Darke et al, 1992). General physical
and mental health was measured using the Short-Form 12 (SF-12; Ware et al, 1996). Past
month diagnoses of DSM-IV Major Depression were obtained using the version of the
Composite International Diagnostic Interview used in the National Survey of Mental
Health and Well-Being (Andrews et al, 1999). Lifetime measures of Post Traumatic
TR.203 12
Stress Disorder, Anti-Social Personality Disorder and Borderline Personality Disorder
were taken at baseline (see Ross et al, 2002 for details).
A specific section, which was adapted from the NEPOD study, (Mattick et al., 2001) was
used to obtain health service utilisation over the month preceding interview.
Information was collected on frequency of use of ambulance services, inpatient and
outpatient hospital services, general practitioner (GP) consultations, specialist
consultations, diagnostics (including blood and urine tests, x-rays and scans), dental
services, other health professional consultations, psychiatric consultations and
prescription medications.
2.3 Costing perspective The preferred perspective in any economic assessment of resource use, that of the
societal perspective, which would have included the costs of crime, court costs, costs of
jail and lost productivity was beyond the scope of this project. As some participants
were required to pay for treatment, (for example, in private clinics, dosing in pharmacies,
or counselling), the standard health department/s perspective was also not appropriate.
The perspective selected for costing of resources in this study was the treatment cost and
included costs to the health department (Commonwealth and States) plus the costs to the
individual for treatment and other health services.
Costs were estimated for all drug treatment services used by ATOS participants over the
12-month follow-up period but only for one month prior to each interview for other
health services. Personal costs do not include costs of travel or any other costs not
directly related to health services use. Table 1 provides a summary of which treatment
settings required private expenditures. Interviews conducted at the private clinics found
that participant visits to GPs were bulk-billed resulting in no cost to the individual, and
this assumption was extended to include all visits to a general practitioner. These costing
decisions adhere to the costing principles outlined by Drummond et al (1997).
TR.203 13

Table 1: Who pays for drug treatment services?
Government: State or Commonwealth
Individual
Detoxification - public setting Detoxification - private setting*
Public clinic for methadone/buprenorphine maintenance
a dispensing fee paid if obtaining at pharmacy
Private clinic for methadone/buprenorphine maintenance
Residential rehab Public hospital General practitioner Medications (not methadone/buprenorphine)
Ambulance Social Worker Psychologist Counsellor Dentist
Data was not available for the costs for detoxification in the private setting; therefore costs from the public sector were used.
for the purposes of this study assumed all visits were bulk billed to Medicare ; if the medication is on the PBS.
2.4 Consistent methodology for determining costs
Table 2 provides a list of the costs used in this study and their source. There were not
the funds available in this study to document actual resource use by all participants.
Therefore, it was decided to collect information on days and type of services and then
cost these days of care using standard prices from published sources including the
Medical Benefits Schedule (MBS)(CDHA, 2004a), Department of Veterans Affairs
(DVA, 2004), Pharmaceutical Benefits Schedule (PBS)(CDHA, 2004b), TAFE (DET,
2004), National Hospital Cost Data Collection (AN-DRG) (CDHA, 2001) and other
studies, primarily the National Evaluation of Pharmacotherapies for Opioid Dependence
(NEPOD)(Digiusto and Kimber, 1999, Mattick et al., 2001). Detailed micro-costing
techniques were used in NEPOD to document costs of detoxification (standard inpatient
and outpatient, rapid detoxification under anaesthesia or sedation, and buprenorphine)
TR.203 14

and the costs per day maintenance therapy (methadone, buprenorphine and naltrexone).
As no other valid costs for these treatments were found, costs from this study were used
throughout this project where appropriate; alternate sources of costs are discussed below.
Where a standard price per treatment episode was not available, cost information from
key informant interviews was used. These interviews were conducted with selected index
treatment providers in NSW. Key informant interviews addressed the types of services
provided, the frequency with which they were provided, who paid for the service and
how much it cost.
Once type, location and duration of treatment were identified the appropriate cost was
attached to each occasion of treatment. Then all costs were summed for each individual
obtaining a total for index treatment, non-index treatment and for other health services
used. As the study period was over several years, a standardised cost in 2002 Australian
dollars was calculated using the health Consumer Price Index (CPI) (ABS, 2004).
2.5 Index treatment costs Index treatment refers to the treatment that participants were commencing at the time of
baseline interview. Information on days in index treatment was collected from patient
treatment files. Costs, as presented in Table 2, were applied to each day or episode of
treatment according to type and location of treatment.
2.5.1 Methadone and buprenorphine maintenance
As actual daily dose information was not available, an average dose of 75mg dose of
methadone was used across all participants. This assumption, given the low price of
methadone, means that any error on dose would have a minimal impact on cost.
Buprenorphine is a more costly medication therefore its cost was based on the median
dose of participants of 12 mg at 3 months, and 10mg at 12 months. The price for these
doses was obtained from the PBS (CDHA, 2004b).
2.5.1.1 Public clinics
The key informant interviews conducted at the clinics involved in the study were
reviewed to assess whether the clinics operated in a manner consistent with that of the
TR.203 15

agencies in NEPOD. Once this assurance was obtained, costs per day from NEPOD,
adjusted to 2002 dollars, were applied to days in treatment. A standard cost for
methadone and a standard cost for buprenorphine were used across all public facilities.
2.5.1.2 Private clinics
Information from key informant interviews was used to determine the costs to
government and costs to the individual. Information was obtained on the frequency and
type of diagnostic tests undertaken, frequency of visits to a general practitioner and the
standard fees charged to clients. Diagnostics and medical visits were costed at 85% of
the MBS fee (CDHA, 2004a) with the assumption that no extra billing occurred (this was
confirmed in key informant interviews). The fee for medical visits was weighted based
on the assumption that initial assessment and consultation would be longer than the
subsequent monitoring visits.
2.5.1.3 General practitioner or clinic based with dispensing at a pharmacy
This treatment involved initial contact at a specialized drug and alcohol clinic with
subsequent case management at a public clinic or with a GP, with methadone or
buprenorphine dispensed at a pharmacy. The initial treatment at the clinic was costed as
above for public and private clinics. A similar model of subsequent case management
and pharmacy dispensing was reported in NEPOD (Mattick et al., 2001), therefore
NEPOD costs were used as a base. These costs were then updated using NSW
pharmacy costs derived from a survey of pharmacies in the area where this model of care
was used. In this model, the GP or clinic costs are public expenditure with the individual
paying a dispensing cost at the pharmacy.
2.5.2 Detoxification
2.5.2.1 Public detoxification services
Specific detoxification costs per episode (inpatient, outpatient, rapid detoxification and
buprenorphine) as developed in NEPOD (Mattick et al., 2001) were used. These costs
were based on the average length of stay for each type of detoxification. No cost
adjustment was made in ATOS for length of stay. The reason for this is that the first few
days of treatment are the more resource intensive, thus total average cost divided by
TR.203 16
average length of stay is not a valid estimate of cost per day. As we did not have a
method for assessing the marginal daily costs of our study group, we used average cost
for each type of detoxification. This will overestimate the costs for some participants
and underestimate the cost for others.
2.5.2.2 Private detoxification services
With the exception of one facility, all private detoxification services providing index
treatment in this study involved the use of outpatient buprenorphine. As costs were not
available for this clinic, public costs were applied. Only six percent of the detoxification
group were treated in this service. For private outpatient buprenorphine detoxification,
costs to the government and the individual were based on key informant interviews.
Information was obtained on the frequency and type of diagnostic tests that were
undertaken, frequency of visits to general practitioners and standard fees charged to
clients. Diagnostics and medical visits were costed as 85% of the MBS fee (CDHA,
2004a) and assumed no extra billing occurred. Again, the fee for medical visits was
weighted to account for the longer initial visits.
2.5.3 Residential Rehabilitation
A cost per day for residential rehabilitation was constructed on the basis of financial data
from the facilities which had the most participants involved in the study. Where
appropriate, these costs were supplemented by TAFE data (DET, 2004) for educational
courses and MBS data (CDHA, 2004a) for diagnostics and medical services provided to
participants while in residential rehabilitation. In the two facilities where data were
obtained, the total cost of providing care also included personal costs. These costs are
presented separately where appropriate, as not all facilities had a client payment system.
Costs for women were higher as often child care was also necessary.
TR.203 17
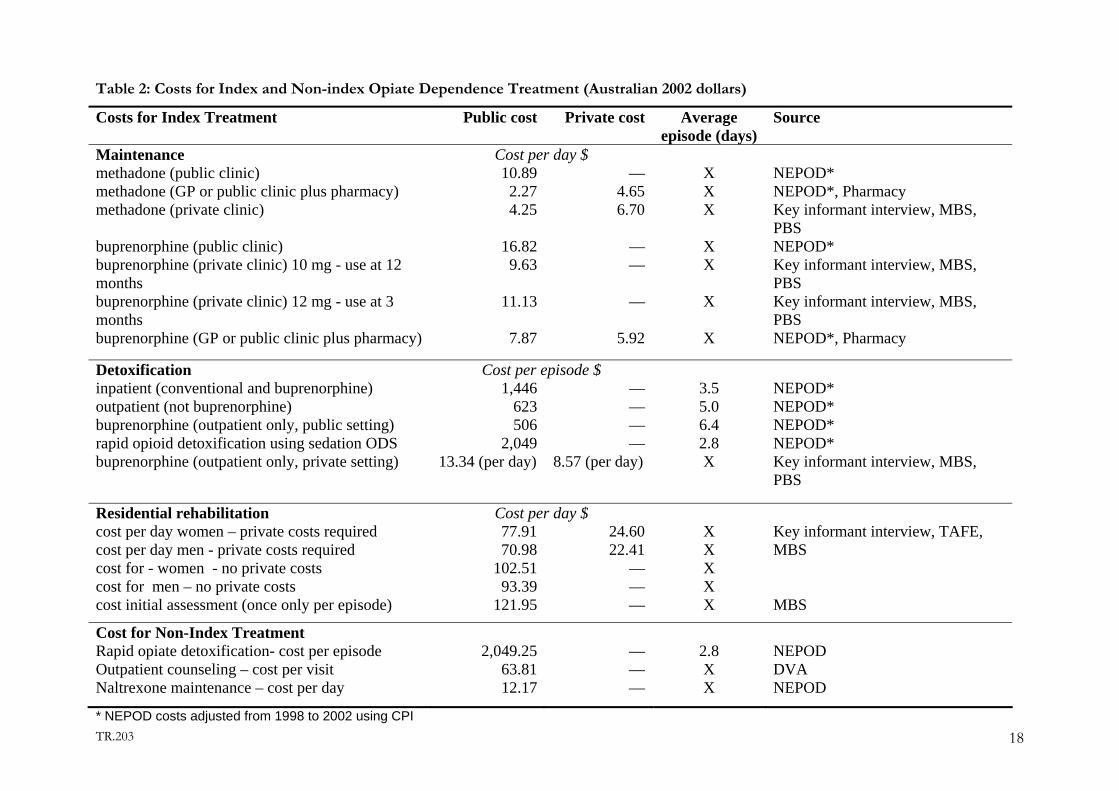
Table 2: Costs for Index and Non-index Opiate Dependence Treatment (Australian 2002 dollars)
Costs for Index Treatment Public cost Private cost Average episode (days)
Source
Maintenance Cost per day $ methadone (public clinic) 10.89 — X NEPOD* methadone (GP or public clinic plus pharmacy)
2.27 4.65 X NEPOD*, Pharmacymethadone (private clinic) 4.25 6.70 X Key informant interview, MBS,
PBS buprenorphine (public clinic) 16.82 — X NEPOD*buprenorphine (private clinic) 10 mg - use at 12 months
9.63 — X Key informant interview, MBS, PBS
buprenorphine (private clinic) 12 mg - use at 3 months
11.13 — X Key informant interview, MBS, PBS
buprenorphine (GP or public clinic plus pharmacy) 7.87 5.92 X NEPOD*, Pharmacy
Detoxification Cost per episode $ inpatient (conventional and buprenorphine) 1,446 — 3.5
NEPOD*outpatient (not buprenorphine) 623 — 5.0 NEPOD*buprenorphine (outpatient only, public setting) 506 — 6.4 NEPOD*rapid opioid detoxification using sedation ODS 2,049 — 2.8 NEPOD*buprenorphine (outpatient only, private setting) 13.34 (per day) 8.57 (per day) X Key informant interview, MBS,
PBS
Residential rehabilitation Cost per day $ cost per day women – private costs required 77.91 24.60 X cost per day men - private costs required 70.98 22.41 X cost for - women - no private costs 102.51 — X cost for men – no private costs 93.39 — X
Key informant interview, TAFE, MBS
cost initial assessment (once only per episode) 121.95 — X
MBS
Cost for Non-Index Treatment Rapid opiate detoxification- cost per episode 2,049.25 — 2.8
NEPODOutpatient counseling – cost per visit 63.81 — X DVANaltrexone maintenance – cost per day 12.17 — X NEPOD
* NEPOD costs adjusted from 1998 to 2002 using CPI TR.203 18
2.6 Non-index treatment costs Non-index treatment refers to any treatment for opiate dependence that participants
underwent subsequent to their index treatment. Detailed questions concerning the type,
frequency and duration of such treatments were asked in the 3 and 12-month follow-up
interviews. This information was used to estimate total costs for non-index treatment using
the costs outlined in Table 2 for index treatment. In most instances it was not known
whether non-index treatment was provided by the public or private sector, therefore it was
assumed that they were provided by the public sector and the costs for public treatment
were applied. As rapid opiate detoxification and naltrexone maintenance were utilised by
participants, these were costed using information from NEPOD (Mattick et al., 2001) and
outpatient counselling costs were obtained from the DVA (DVA, 2004)(see Table 2).
2.7 Other health services utilisation (HSU) in the month preceding interview Other health service utilisation refers to any health services that participants may have
received in addition to their treatment for heroin dependence. The frequency and cost of
these services was determined for the month preceding each follow-up interview. HSU data
were collected at baseline to permit a comparison to data collected at 12 months. The
baseline data collection is important to establish at baseline whether any participants were
receiving treatment for chronic health conditions; to assess the costs and frequency of high
resource use treatments; and to assess the frequency of less costly treatments such as visits to
general practitioners, counsellors, and dentists.
2.7.1 Hospital visits
Self reported data stating the reason and length of stay for inpatient hospital admissions was
used to select an appropriate Diagnostic Related Group (CDHA, 2001). Costs for
outpatient and emergency visits were obtained from Appendix 3 of the Manual of Resource
Items (CDHA, 2002). A specific cost category was used where there was sufficient
information, and where there was insufficient information the price for ‘General Medical
TR.203 19
doctor present’ was used. For participants who stated that they were admitted to hospital
but did not stay overnight, the relevant cost from the Appendix 3 of the Manual of Resource
Items for Emergency Department and Outpatient presentations was used. Costs were
converted to 2002 dollars using the health CPI (ABS, 2004) where necessary.
2.7.2 Home nursing
One participant received home nursing. An estimated weighted average national cost of
Home and Community Care services provided in the Manual Resource Items (CDHA, 2002)
was used to cost this care.
2.7.3 Ambulance
A general cost of $238.63 (from the Private Health Insurance Administration Council),
(PHIAC, 2003) was applied for each time participants reported use of ambulance services. A
different price structure for whether or not the individual required transfer to hospital was
not available.
2.7.4 Medications
Costs to the government for prescribed medications were obtained from the PBS (CDHA,
2004b), using the dispensed price for maximum quantity and the least costly brand. When
there were multiple prices per dose, the most common dose was used to then convert the
price into a price per mg. Where there was no price on the PBS database, prices were
obtained from MIMS (MIMS, 2003). Over the counter medications were not included.
For medications covered by the PBS (CDHA, 2004b), the consumer is charged a co-
payment of $3.70 for every medication obtained if they are a concessional patient or $23.10
for general patients. The status of the study group with respect to whether or not they
were concessional patients was unknown, however only 17% reported their main source of
income being from a wage or salary, therefore a conservative decision was made to use the
concessional co-payment for all medications obtained through the PBS.
TR.203 20
2.7.5 Other health services utilisation
Costs for other health services are presented in Table 3. Services such as general practitioner
visits, specialist doctor visits and diagnostics were priced according to information from the
MBS (CDHA, 2004a) and Appendix 3 of the Manual of Resource Items (CDHA, 2002).
Costs for dentist, other health professional and psychiatric related visits were obtained from
the MBS and the Department of Veteran Affairs (DVA) (DVA, 2004).
TR.203 21

Table 3: Costs for HSU
Service Cost Source Year Costper
visit/test
Description
2002 $ GP visit MBS 2002 17.85 Standard 5-20 minute consultation Specialist doctor MBS 2002 29.60 Subsequent consultation Urine test Manual of Resource Items 2001 18.54 Microbiology Blood tests General Manual of Resource Items 2001 25.75 Hematology Liver function MBS 2002 16.30 Blood borne virus MBS 2002 59.40 X-ray or Scan Manual of Resource Items
2001 59.74 Miscellaneous imagingDentist First visit DVA 2003 32.77 Comprehensive oral exam Subsequent visits DVA 2003 61.19 30 minute consultation Other health Professionals
Chiropractor DVA 2003 31.19 Subsequent consultationDietician DVA 2003 31.78 Subsequent consultationSpeech pathologist
DVA 2003 63.37 Consultation
Osteopath DVA 2003 31.19 Subsequent consultationOptometrist DVA 2003 28.47 Subsequent consultationPhysiotherapist DVA 2003 33.61 Standard consultation Occupational therapist DVA 2003 64.55 Subsequent consultation Psychiatrist MBS 2002 59.65 15-30 minute consultation Psychologist DVA 2003 63.81 Subsequent consultation Social/welfare worker DVA 2003 20.63 Subsequent consultation Other therapist/counsellors DVA 2003 63.81 Clinical counsellor, subsequent consultation
TR.203 22
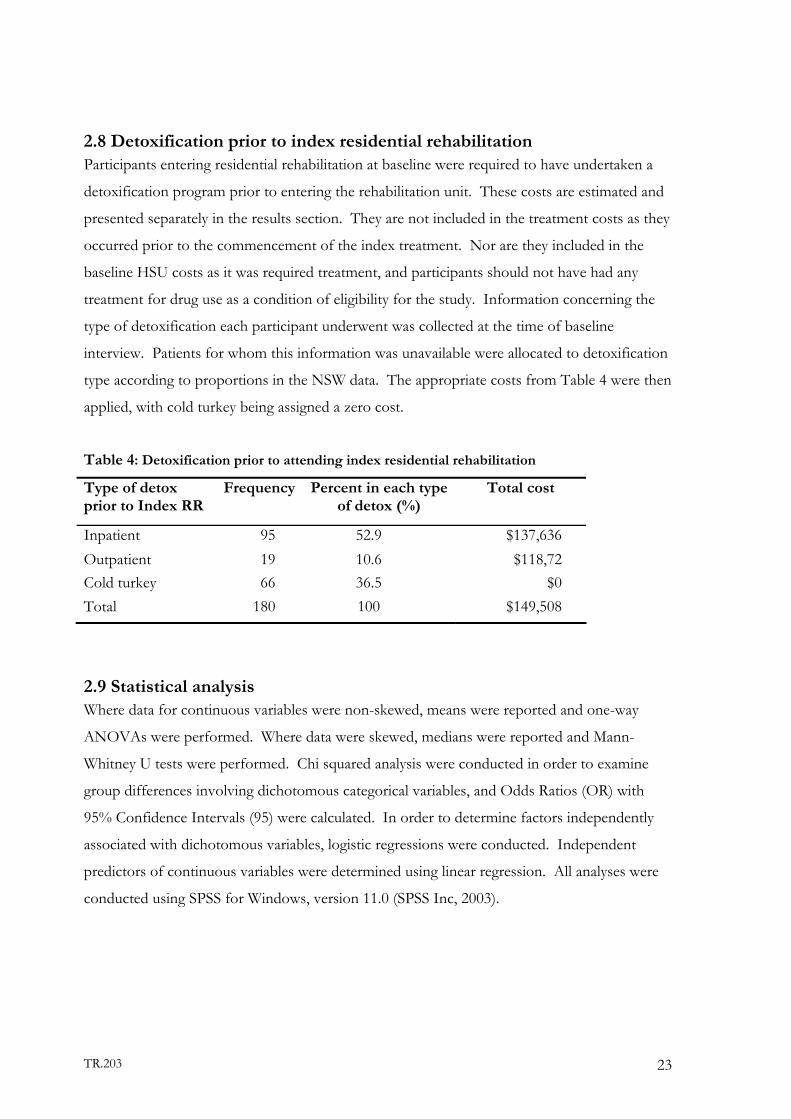
2.8 Detoxification prior to index residential rehabilitation Participants entering residential rehabilitation at baseline were required to have undertaken a
detoxification program prior to entering the rehabilitation unit. These costs are estimated and
presented separately in the results section. They are not included in the treatment costs as they
occurred prior to the commencement of the index treatment. Nor are they included in the
baseline HSU costs as it was required treatment, and participants should not have had any
treatment for drug use as a condition of eligibility for the study. Information concerning the
type of detoxification each participant underwent was collected at the time of baseline
interview. Patients for whom this information was unavailable were allocated to detoxification
type according to proportions in the NSW data. The appropriate costs from Table 4 were then
applied, with cold turkey being assigned a zero cost.
Table 4: Detoxification prior to attending index residential rehabilitation
Type of detox prior to Index RR
Frequency Percent in each type of detox (%)
Total cost
Inpatient 95 52.9 $137,636 Outpatient 19 10.6 $118,72 Cold turkey 66 36.5 $0 Total 180 100 $149,508
2.9 Statistical analysis Where data for continuous variables were non-skewed, means were reported and one-way
ANOVAs were performed. Where data were skewed, medians were reported and Mann-
Whitney U tests were performed. Chi squared analysis were conducted in order to examine
group differences involving dichotomous categorical variables, and Odds Ratios (OR) with
95% Confidence Intervals (95) were calculated. In order to determine factors independently
associated with dichotomous variables, logistic regressions were conducted. Independent
predictors of continuous variables were determined using linear regression. All analyses were
conducted using SPSS for Windows, version 11.0 (SPSS Inc, 2003).
TR.203 23

3. RESULTS
3.1 Sample characteristics A total of 657 individuals were re-interviewed at the 12-month follow-up, representing 80% of
the sample of 825 recruited into the study at baseline. Follow-up rates for the four index
groups were: 82% of MT, 82% of DTX, 78% of RR, and 66% of NT.
In order to determine factors associated with cohort retention at 12 months, a logistic
regression was conducted. Variables entered into the model included having entered treatment
at baseline (yes/no), age, gender, previous treatment history (yes/no), criminally active
(yes/no), history of attempted suicide, number of heroin use days in the month preceding
baseline interview, major depression at baseline, and presence/absence of a personality
disorder at baseline. The overall model was significant (χ27df =64.5, p=.01). Participants in the
treatment groups were more likely to be retained than those in the NT group (81% v 66%, OR
2.24, 95% CI: 1.35-3.74), and those with a suicide history were less likely to be retained (75% v
83%, OR 0.59, 95% CI: 0.41-0.85). Overall, the sample re-interviewed at 12-month follow-up
was broadly representative of the initial sample of 825 recruited into ATOS.
Some baseline characteristics are presented below which are illustrative of the differences
across groups but additional information can be found in the baseline reports (Ross et al.,
2002b, Holt et al., 2002, Weekley et al., 2002).
3.1.1 Demographics As the participants in this study self-selected into treatment there is no reason to expect that
the characteristics of the index treatment groups would be similar, and as illustrated below
there are significant differences between groups.
For the remainder of this report the data collected on 649 participants are used, as cost data
was incomplete for 8 individuals and therefore they were excluded. At baseline, the mean age
of the 649 participants was 29.5 yrs (SD 7.9, range 18-56), and 64% were male. The age by
treatment modality varied across groups (F3, 645=4.2, p=0.006) with DTX group being older
TR.203 24

than the RR group (30.5 v 27.7, p=0.01). The percentage of male participants recruited
according to treatment modality was also different (χ23df = 14.48, p =0.002) with more males
recruited in DTX than MT (72% v 55%, OR 2.09, 95% CI 1.42-3.07) (Table 5).
3.1.2 Heroin use
Measures of heroin use at baseline showed some variation across the original groups. The age
of first intoxication varied by group with a mean of 13.5 years (F3, 645 = 4.66 p=0.003). The
DTX, MT, and NT groups all started at an older age than the RR group. Reported days of
heroin use in the previous month at baseline varied by treatment modality (F3, 644 =18.27
p<0.001). The DTX group had more heroin use days than MT (19.2, p<0.001) and RR (17.1,
p<0.001), and NT had more than RR (21.8 versus 17.1. p=0.003). Overall, the sample had
used a mean of 4.9 (SD 1.7, range 1-10) drug classes in the month preceding interview. There
was some variation across groups (F3, 645 = 4.3 p=0.005), with NT using a significantly greater
number of drug classes than MT (5.5 vs 4.7, p=0.024).
Overall, 26% of the sample had an overdose in the 12 months prior to the baseline interview.
Again there was some variation across groups (χ23df = 1.25, p =0.01). Of the RR group, 37%
reported at least one overdose in the previous year which was significantly more than the 22%
of the MT group (p=0.01) and 24% of the DTX group (p=0.03).
3.1.3 Treatment
At baseline the median number of previous treatment episodes was five, again with some
differences across the index groups (χ23df = 29.6, p<0.001). RR, with a median of 8 previous
treatment episodes, had significantly more than MT (4, p<0.001); DTX (5, p=0.016), and NT
(5, p=0.03). The DTX group also had more episodes than MT (5 versus 4, p=0.013).
TR.203 25
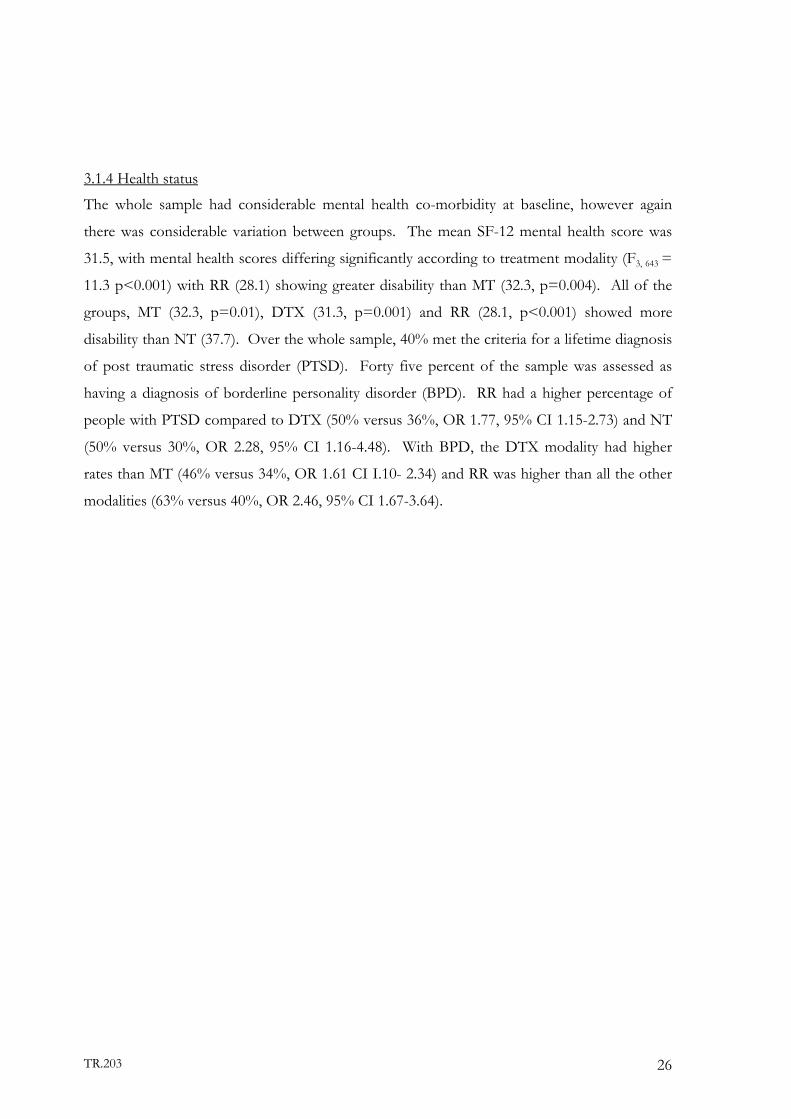
3.1.4 Health status
The whole sample had considerable mental health co-morbidity at baseline, however again
there was considerable variation between groups. The mean SF-12 mental health score was
31.5, with mental health scores differing significantly according to treatment modality (F3, 643 =
11.3 p<0.001) with RR (28.1) showing greater disability than MT (32.3, p=0.004). All of the
groups, MT (32.3, p=0.01), DTX (31.3, p=0.001) and RR (28.1, p<0.001) showed more
disability than NT (37.7). Over the whole sample, 40% met the criteria for a lifetime diagnosis
of post traumatic stress disorder (PTSD). Forty five percent of the sample was assessed as
having a diagnosis of borderline personality disorder (BPD). RR had a higher percentage of
people with PTSD compared to DTX (50% versus 36%, OR 1.77, 95% CI 1.15-2.73) and NT
(50% versus 30%, OR 2.28, 95% CI 1.16-4.48). With BPD, the DTX modality had higher
rates than MT (46% versus 34%, OR 1.61 CI I.10- 2.34) and RR was higher than all the other
modalities (63% versus 40%, OR 2.46, 95% CI 1.67-3.64).
TR.203 26
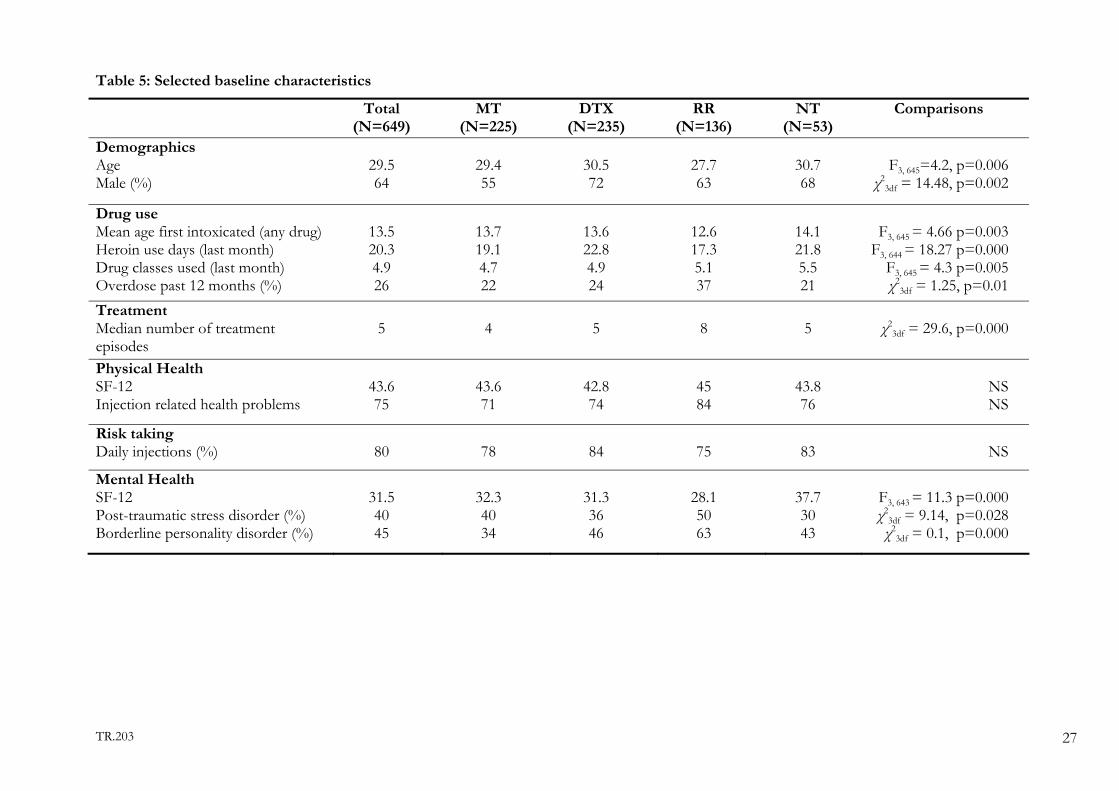
Table 5: Selected baseline characteristics
Total (N=649)
MT (N=225)
DTX (N=235)
RR (N=136)
NT (N=53)
Comparisons
Demographics Age Male (%)
29.5 64
29.4 55
30.5 72
27.7 63
30.7 68
F3, 645=4.2, p=0.006
χ23df = 14.48, p=0.002
Drug use Mean age first intoxicated (any drug) Heroin use days (last month) Drug classes used (last month) Overdose past 12 months (%)
13.5 20.3 4.9 26
13.7 19.1 4.7 22
13.6 22.8 4.9 24
12.6 17.3 5.1 37
14.1 21.8 5.5 21
F3, 645 = 4.66 p=0.003
F3, 644 = 18.27 p=0.000 F3, 645 = 4.3 p=0.005 χ2
3df = 1.25, p=0.01 Treatment Median number of treatment episodes
5 4 5 8 5 χ23df = 29.6, p=0.000
Physical Health SF-12 Injection related health problems
43.6 75
43.6 71
42.8 74
45 84
43.8 76
NS NS
Risk taking Daily injections (%)
80
78
84
75
83
NS
Mental Health SF-12 Post-traumatic stress disorder (%) Borderline personality disorder (%)
31.5 40 45
32.3 40 34
31.3 36 46
28.1 50 63
37.7 30 43
F3, 643 = 11.3 p=0.000 χ2
3df = 9.14, p=0.028 χ2
3df = 0.1, p=0.000
TR.203 27

3.2 Outcomes Over the 12-month follow-up period there were considerable improvements in the general
functioning of all groups. The levels of heroin use and criminal involvement at baseline and 12
months are presented here to demonstrate that the provision of treatment has beneficial
outcomes. An in depth analysis of these and other outcomes is discussed elsewhere (Ross et al.,
2004). The percentage of participants abstinent from heroin increased from 2% at baseline to
56% at the 12 month interview. The percentage of the MT group abstinent at the 12 month
interview was 65.3%, 51.5% of the DTX and 62.2% of the RR. A greater percentage of those
recruited into an index treatment compared to those not in treatment were abstinent at the 12
month interview. However, both those in an index treatment group and the non-treatment
group showed an increased percentage of participants abstinent from heroin. At 12 months
(baseline) heroin had been used on a mean of 2.9 (19.2) days by the MT group, 6.0 (22.8) days by
the DTX group and 4.2 (17.1) days by RR and 10.3 (21.8) days by the NT group. Overall at 12
months, the proportion reporting any crime in preceding month was 26% compared to 55% at
baseline, an improvement of 52%.
Table 6: Key outcome measures
Total
(N=649) MT
(N=225 ) DTX
(N= 235) RR
(N=136) NT
(N= 53) Outcome *BL 12 mth BL 12 mth BL 12 mth BL 12 mth BL 12 mthHeroin use days last month (mean)
20.2 4.9 19.2 2.9 22.8 6.0 17.1 4.2 21.8 10.3
Heroin abstinent last month (%)
1.7 56.2 3.6 65.3 0.0 51.5 2.2 62.2 0.0 24.5
Any crime committed last month (%)
55 26 45 19 59 28 61 26 60 39
*BL=Baseline
3.3 Treatment services and costs
3.3.1 Index Treatment
The costs of index treatments were calculated for each participant for the 12-month follow-up
period and the total was $1,894,861 for the 649 participants. On average the index treatment
costs were $2,920 per person with a 95% confidence interval of $2,585-$3,254 (Table 7).
TR.203 28
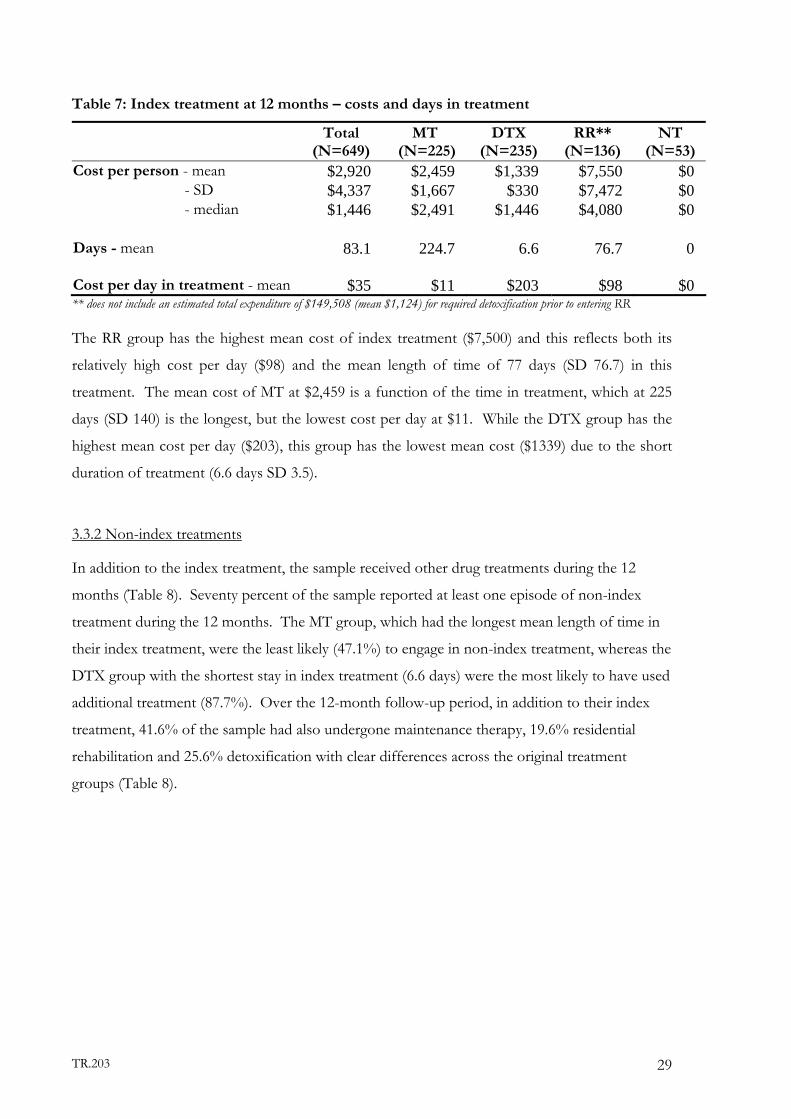
Table 7: Index treatment at 12 months – costs and days in treatment
Total (N=649)
MT (N=225)
DTX (N=235)
RR** (N=136)
NT (N=53)
Cost per person - mean $2,920 $2,459 $1,339 $7,550 $0 - SD $4,337 $1,667 $330 $7,472 $0 - median $1,446 $2,491 $1,446 $4,080 $0 Days - mean
83.1 224.7 6.6 76.7 0
Cost per day in treatment - mean $35 $11 $203 $98 $0 ** does not include an estimated total expenditure of $149,508 (mean $1,124) for required detoxification prior to entering RR The RR group has the highest mean cost of index treatment ($7,500) and this reflects both its
relatively high cost per day ($98) and the mean length of time of 77 days (SD 76.7) in this
treatment. The mean cost of MT at $2,459 is a function of the time in treatment, which at 225
days (SD 140) is the longest, but the lowest cost per day at $11. While the DTX group has the
highest mean cost per day ($203), this group has the lowest mean cost ($1339) due to the short
duration of treatment (6.6 days SD 3.5).
3.3.2 Non-index treatments
In addition to the index treatment, the sample received other drug treatments during the 12
months (Table 8). Seventy percent of the sample reported at least one episode of non-index
treatment during the 12 months. The MT group, which had the longest mean length of time in
their index treatment, were the least likely (47.1%) to engage in non-index treatment, whereas the
DTX group with the shortest stay in index treatment (6.6 days) were the most likely to have used
additional treatment (87.7%). Over the 12-month follow-up period, in addition to their index
treatment, 41.6% of the sample had also undergone maintenance therapy, 19.6% residential
rehabilitation and 25.6% detoxification with clear differences across the original treatment
groups (Table 8).
TR.203 29

Table 8: Percent of each index group with at least one non-index episode of the following:
Type of non- index treatment
Total (N=649)
%
MT (N=225)
%
DTX (N=235)
%
RR (N=136)
%
NT (N=53)
% Maintenance therapy 41.6 41.3 53.2 17.6 52.8 Detoxification 25.9 7.1 43.0 29.4 20.8 Rehabilitation 19.6 3.1 24.7 40.4 13.2 Naltrexone maintenance 3.7 3.1 6.8 0.7 0.0 Outpatient counselling 16.2 8.0 20.9 26.5 15.1
No non-index treatment 30.2 52.9 12.3 25.7 26.4
As discussed above, all groups used considerable additional treatment beyond their original index
treatment. As a way of further understanding resource use across the groups, the mean length of
time spent in non-index treatments is presented (Table 9) while Table 10 provides a summary of
the total days and episodes in non-index treatment and associated costs. The mean number of
days in non-index methadone was 37.0, and 20.8 for buprenorphine and 16.7 for rehabilitation.
Examining the data across the groups, the tendency for the MT group to return to a form of
maintenance therapy and the RR group to return to RR is evident. These data also show that the
DTX group had a considerable number of days in both maintenance and rehabilitation. The NT
group has a mean of 60 days in non-index MT and 18.8 days in buprenorphine. In terms of
understanding resource use examining the number of detoxification episodes is also useful. On
average, all groups had less than one episode of non-index detoxification, however, e.
Table 9: Time in non- index treatment over 12 months
Total (N=649) MT (N=225) DTX (N=235) RR (N=136) NT (N=53) Mean SD Mean SD Mean SD Mean SD Mean SD
Treatment days Methadone maintenance 37.0 78.4 47.5 91.0 39.6 75.4 7.7 34.0 56.0 95.7 Buprenorphine maintenance 20.8 58.6 15.6 52.0 32.6 73.5 9.5 36.7 18.8 47.9 Naltrexone maintenance 2.2 17.7 2.4 17.3 3.7 23.8 0.3 3.9 0.0 0.0 Outpatient counselling 2.2 7.2 1.0 5.1 2.5 7.4 3.9 9.8 1.7 5.1 Residential rehabilitation 16.7 50.3 2.8 21.7 17.0 45.0 43.4 80.5 5.5 26.4 Detoxification episodes Outpatient 0.2 037 0.1 0.7 0.3 0.7 0.2 0.8 0.2 0.6 Buprenorphine 0.0 0.1 0.0 0.0 0.0 0.1 0.0 0.1 0.0 0.0 Inpatient 0.4 1.2 0.1 0.4 0.6 1.1 0.6 1.9 0.3 0.9
TR.203 30

Over the 12 month period the total cost of non-index treatment was $2,120,283 with a mean of
$3,267 (95% CI $2,855-3,679). The mean number of days in the non-index treatment across all
groups was 96.4 days, with a range of 71 to 102 across the groups. Again there is considerable
variation across the groups; with the MT and RR groups having longest stays in their index
treatment and having the shortest mean number of days in non-index treatments. The NT
group had a mean of 84.8 days in non-index treatment. DTX had the most episodes of non-
index treatment.
Table 10: Total days, episodes and costs for non-index treatment
Total (N=649)
MT (N=225)
DTX (N=235)
RR (N=136)
NT (N=53)
Costs per person - mean - SD - median
$3,267 $5,344 $1,559
$1,331 $2,669
$0
$3,899 $4,699 $2,735
$5,814 $8,267 $2,595
$2,153 $3,485 $1,470
Days - mean 96.4 71.1 101.6 70.7 84.8 Episodes - mean 1.6 0.9 2.3 1.8 1.4
3.3.3 Total treatment (combining index and non-index treatment)
The total treatment (index and non-index) costs at 12 months were $4,015,363 for the 649
individuals, with a mean of $6,187 per person (95% CI $5677 -$6697). As is common in health
care expenditures, the distribution of the total costs is skewed. Table 11 demonstrates the
extent of this, with at the low end, 25% of individuals accounting for only 6% of the costs, and
at the top, 25% of individuals accounting for 60% of total treatment expenditures.
Table 11: Distribution of costs
Costs Percentage of costs
Percentage of individuals
$1-$2,490 6.3% 25% $2,491-$3,920 13.2% 25% $3,921-$6,774 20.4% 25% $6,775-$39,345 60.1% 25%
Table 12 presents the days and episodes in index and non-index treatment, as well as the costs
for each group. It is important to note that these are raw costs, with no adjustment for the
duration of use of heroin, pre-existing physical and mental health co-morbidities, age, or any
other factor that may impact upon resource use during treatment. Overall, there was a mean
of 2.6 episodes of treatment when index and non-index treatments are combined. The MT
TR.203 31

group had on average 1.9 episodes of treatment with 295.8 days spent in treatment (76% of the
days occurred in the index treatment). The DTX group had on average 3.3 treatment episodes
and 108 days in treatment, however as only 6% of the treatment days were in the index
treatment this suggests that this group had considerable additional treatment. The NT group
had 1.4 episodes of treatment with an average of 84.4 days in treatment. The RR group had
52% of days in the index treatment with an average of 147.4 days over 2.8 episodes of
treatment.
Table 12: Total treatment – costs, days and episodes in treatment at 12 months (index and non-index treatment)
Total (N=649)
MT (N=225)
DTX (N=235)
RR** (N=136)
NT (N=53)
Cost per person - mean - SD - median
$6,187 $6,618 $3,920
$3,790 $2,389 $3,920
$5,238 $4,736 $4,168
$13,364 $9,371
$10,998
$2,153 $3,485 $1,470
Days - mean 179.5 295.8 108.2 147.4 84.8 Episodes - mean 2.6 1.9 3.3 2.8 1.4 ** does not include an estimated total expenditure of $149,508 for required detoxification prior to entering RR (mean of $1,124).
3.4 HSU resources and costs
3.4.1 Resource use In addition to treatment for heroin use, all groups used a variety of other health services at
baseline and follow-up. There appears to be a general decrease in health services use in the
treatment groups at 12 months, especially in the RR group, which had higher use of health care
services at baseline in most categories (Table 13). At baseline, over 60% of all individuals in the
MT, DTX and RR groups report visiting a GP at least once in the preceding month compared to
50% of the NT group. At the 12-month follow-up there was decrease in the number of
individuals in the MT, DTX and RR groups who reported visiting a GP. Between 45% and 56%
of each group report at least one prescription medication (excluding methadone and
buprenorphine) in the month preceding their baseline and 12 month interviews, again with some
decrease noted in the treatment groups at 12 months, but no change in the NT group.
Of those who were attended by an ambulance, 65% resulted in a visit to an emergency
department. The number, of individuals who had at least one attendance from an ambulance
TR.203 32
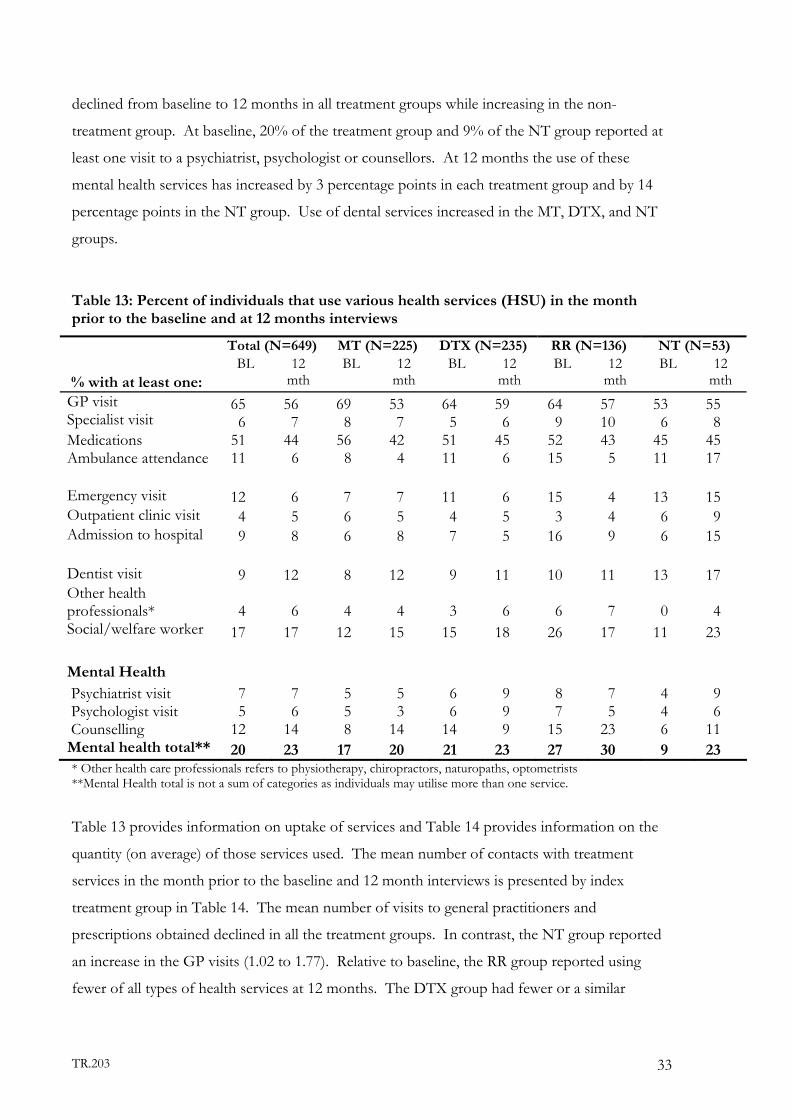
declined from baseline to 12 months in all treatment groups while increasing in the non-
treatment group. At baseline, 20% of the treatment group and 9% of the NT group reported at
least one visit to a psychiatrist, psychologist or counsellors. At 12 months the use of these
mental health services has increased by 3 percentage points in each treatment group and by 14
percentage points in the NT group. Use of dental services increased in the MT, DTX, and NT
groups.
Table 13: Percent of individuals that use various health services (HSU) in the month prior to the baseline and at 12 months interviews
Total (N=649) MT (N=225) DTX (N=235) RR (N=136) NT (N=53) % with at least one:
BL 12 mth
BL 12 mth
BL 12 mth
BL 12 mth
BL 12 mth
GP visit Specialist visit
65 6
56 7
69 8
53 7
64 5
59 6
64 9
57 10
53 6
55 8
Medications 51 44 56 42 51 45 52 43 45 45 Ambulance attendance 11 6 8 4 11 6 15 5 11 17 Emergency visit 12 6 7 7 11 6 15 4 13 15 Outpatient clinic visit 4 5 6 5 4 5 3 4 6 9 Admission to hospital 9 8 6 8 7 5 16 9 6 15 Dentist visit 9 12 8 12 9 11 10 11 13 17 Other health professionals* 4 6 4 4 3 6 6 7 0 4 Social/welfare worker 17 17 12 15 15 18 26 17 11 23 Mental Health Psychiatrist visit 7 7 5 5 6 9 8 7 4 9 Psychologist visit 5 6 5 3 6 9 7 5 4 6 Counselling 12 14 8 14 14 9 15 23 6 11 Mental health total** 20 23 17 20 21 23 27 30 9 23 * Other health care professionals refers to physiotherapy, chiropractors, naturopaths, optometrists **Mental Health total is not a sum of categories as individuals may utilise more than one service.
Table 13 provides information on uptake of services and Table 14 provides information on the
quantity (on average) of those services used. The mean number of contacts with treatment
services in the month prior to the baseline and 12 month interviews is presented by index
treatment group in Table 14. The mean number of visits to general practitioners and
prescriptions obtained declined in all the treatment groups. In contrast, the NT group reported
an increase in the GP visits (1.02 to 1.77). Relative to baseline, the RR group reported using
fewer of all types of health services at 12 months. The DTX group had fewer or a similar
TR.203 33
number of contacts at 12 months, with the exception of ‘other HSU contacts’ which included
social workers, physiotherapists and counsellors. The mean number of encounters decreased in
three categories (GP visits, ambulance contacts, and prescriptions) and increased in hospital
visits and other HSU contacts for the MT group. The costs associated with this resource use are
found in Table 15.
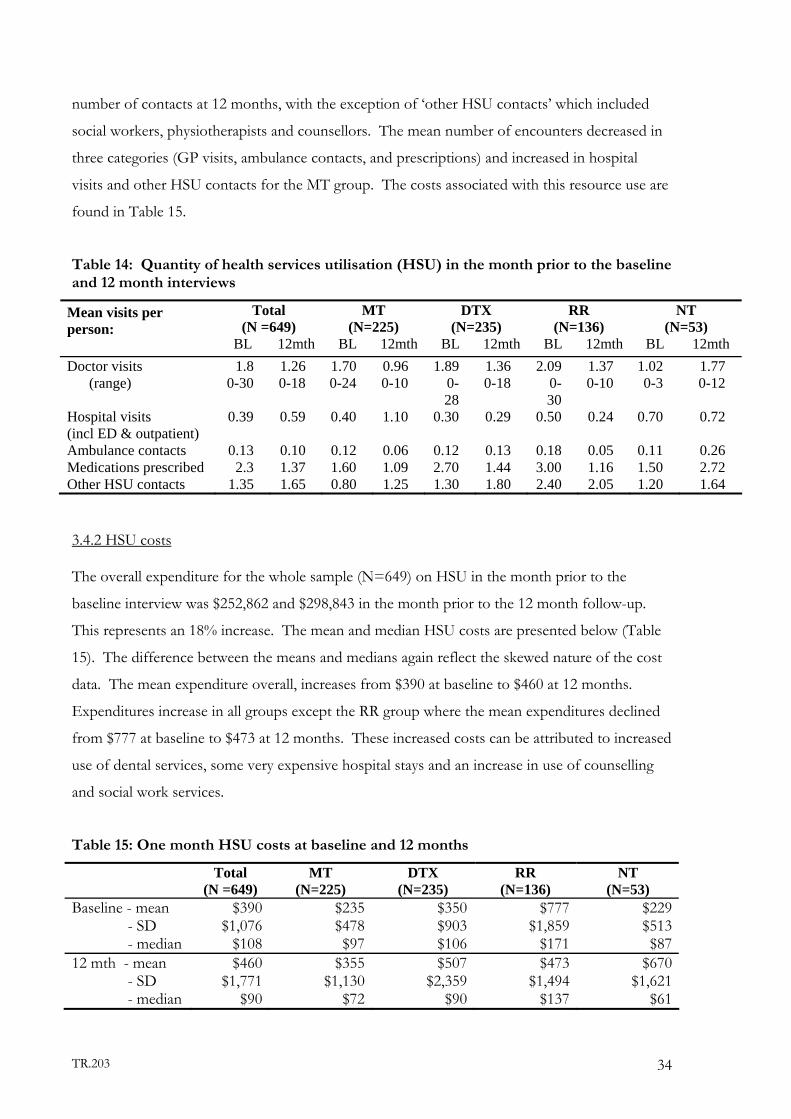
Table 14: Quantity of health services utilisation (HSU) in the month prior to the baseline and 12 month interviews
Total (N =649)
MT (N=225)
DTX (N=235)
RR (N=136)
NT (N=53)
Mean visits per person: BL 12mth BL 12mth BL 12mth BL 12mth BL 12mth Doctor visits 1.8 1.26 1.70 0.96 1.89 1.36 2.09 1.37 1.02 1.77 (range) 0-30 0-18 0-24 0-10 0-
28 0-18 0-
30 0-10 0-3 0-12
Hospital visits (incl ED & outpatient)
0.39 0.59 0.40 1.10 0.30 0.29 0.50 0.24 0.70 0.72
Ambulance contacts 0.13 0.10 0.12 0.06 0.12 0.13 0.18 0.05 0.11 0.26 Medications prescribed 2.3 1.37 1.60 1.09 2.70 1.44 3.00 1.16 1.50 2.72 Other HSU contacts 1.35 1.65 0.80 1.25 1.30 1.80 2.40 2.05 1.20 1.64
3.4.2 HSU costs
The overall expenditure for the whole sample (N=649) on HSU in the month prior to the
baseline interview was $252,862 and $298,843 in the month prior to the 12 month follow-up.
This represents an 18% increase. The mean and median HSU costs are presented below (Table
15). The difference between the means and medians again reflect the skewed nature of the cost
data. The mean expenditure overall, increases from $390 at baseline to $460 at 12 months.
Expenditures increase in all groups except the RR group where the mean expenditures declined
from $777 at baseline to $473 at 12 months. These increased costs can be attributed to increased
use of dental services, some very expensive hospital stays and an increase in use of counselling
and social work services.
Table 15: One month HSU costs at baseline and 12 months
Total (N =649)
MT (N=225)
DTX (N=235)
RR (N=136)
NT (N=53)
Baseline - mean - SD
- median
$390 $1,076
$108
$235 $478 $97
$350 $903 $106
$777 $1,859
$171
$229 $513 $87
12 mth - mean - SD
- median
$460 $1,771
$90
$355 $1,130
$72
$507 $2,359
$90
$473 $1,494
$137
$670 $1,621
$61
TR.203 34

As shown in Table 16, a small proportion of the ATOS cohort use the majority of the HSU
expenditures. At baseline, 19% of individuals consumed no HSU resources, while 15% of the
group consumed 74% of the resources. A similar pattern is seen at the 12-month follow-up
interview, where 23% report no additional use of health care services, and 79% of the resources
were used by 14% of individuals. The data were examined for each index group (not shown),
and the pattern is consistent with the data in Table 16, with the exception of the methadone
group at baseline, where expenditures were somewhat evenly spread across categories.
Table 16: Distribution of HSU costs per person in one month
Baseline 12 month % of
Total costs % of
Individuals %of
Total costs % of
Individuals $0 0 19 0 23 $1-100 4 29 2 24 $101-200 7 19 6 20 $201-500 15 18 13 20 >$500 74 15 79 14 Overall, at both baseline and 12-month follow-up hospital/ambulance expenditure accounts for
the majority of HSU costs at 57.8% and 63.6% respectively (Table 17). The proportion of the
total expenditure attributed to hospital and ambulance expenditure increased in all groups with
the exception of RR. On the other hand, the proportion of expenditures on GPs and specialists
declined in all groups except RR. Expenditure on medications (not including methadone,
buprenorphine or naltrexone) declined in all groups while expenditures on ‘other’ services
(dentists, psychologist, counselling, diagnostics and social work) increased or remained stable
among the treatment groups and declined in the NT group.
Table 17: HSU costs and percent expenditure by group
* Other includes: dentists, psychologist, counselling, diagnostics and social work.
Total (N=649) MT (N=225) DTX (N=235) RR (N=136) NT (N=53) BL 12 mth BL 12 mth BL 12 mth BL 12 mth BL 12 mth
Mean expenditure $390 $460 $235 $355 $350 $507 $777 $473 $229 $670
percent expenditure: Hosp/ambulance 57.8 63.6 44.9 63.0 54.3 65.0 67.1 56.4 56.9 73.4 GP/specialist 10.7 7.6 16.0 7.3 11.9 7.9 7.2 8.4 9.9 6.2 Medications 14.8 8.2 17.2 7.0 18.1 8.0 11.1 9.8 13.6 8.4 Other* 16.7 20.5 21.9 22.7 15.7 19.1 14.6 25.3 19.6 12.0
TR.203 35
Regression analysis examined factors associated with HSU costs at 12 months. Variables entered
into the model include age, sex, OTI score for heroin use, SF-12 physical health score, SF-12
mental health score at baseline with HSU costs as the dependent variable. The model was
significant (F5,645 = 7.76, p=000). Only the SF-12 physical summary score was a significant
predictor of HSU costs (β = -34.8, t= -5.05, p<0.001) suggesting that a worse physical status led
to an increase in HSU costs.
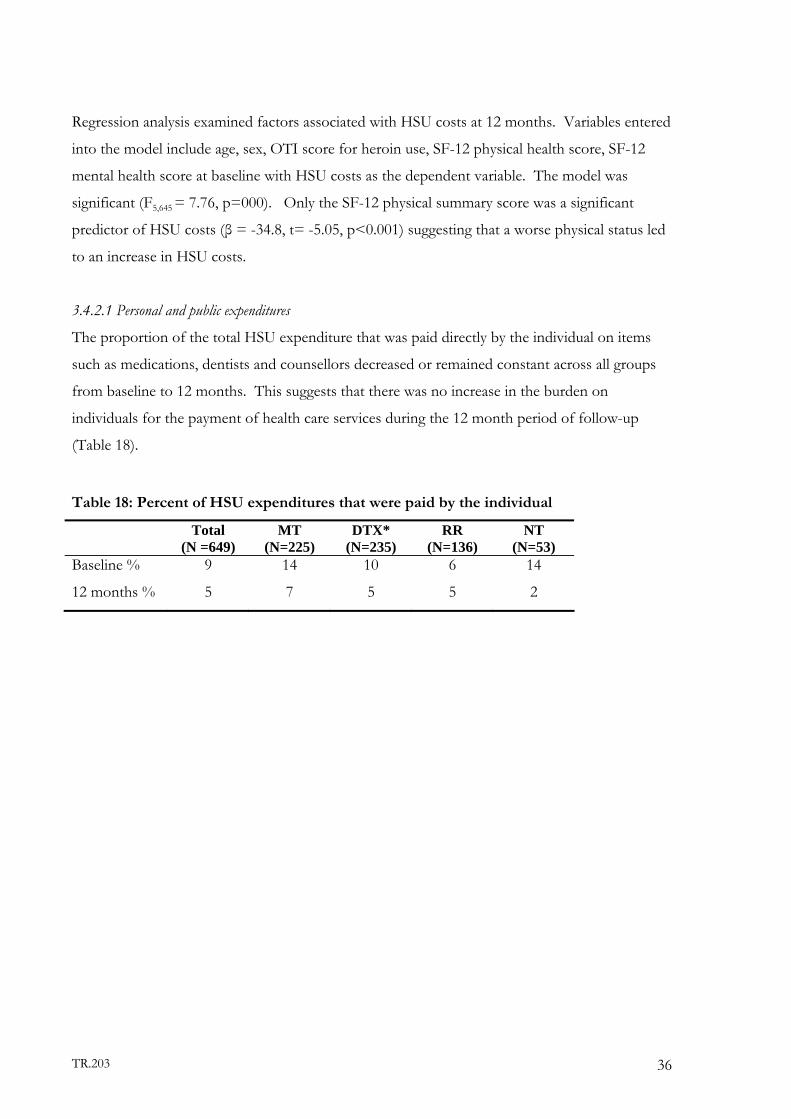
3.4.2.1 Personal and public expenditures
The proportion of the total HSU expenditure that was paid directly by the individual on items
such as medications, dentists and counsellors decreased or remained constant across all groups
from baseline to 12 months. This suggests that there was no increase in the burden on
individuals for the payment of health care services during the 12 month period of follow-up
(Table 18).
Table 18: Percent of HSU expenditures that were paid by the individual
Total (N =649)
MT (N=225)
DTX* (N=235)
RR (N=136)
NT (N=53)
Baseline %
12 months %
9
5
14
7
10
5
6
5
14
2
TR.203 36
4 DISCUSSION
The total heroin treatment costs for the 649 participants over a period of 12 months were
estimated to be $4,015,364 or a mean of $6,187 per person with a mean number of days in
treatment of 179.5. The data in this report support the conclusion that it is feasible to conduct
longitudinal research on heroin users in Australia including the estimation of costs of treatment.
As this was a cohort study, not an RCT, it reflects the real-world conditions of self-selection into
treatment, as well as the movement in and out of treatment. As individuals often leave initial
treatment, but later return to similar or different types of treatment for heroin use, economic
costs were estimated for both index and non-index treatment. The mean index treatment costs
were $2,920 for an average of 83 days of treatment, while non-index treatment costs were $3,267
for an average of 96.4 days.
The types of non-index treatment received varied across the groups; in the MT and RR groups
there was a tendency to obtain a similar type of non-index treatment as their index treatment
(41.6% of MT group returned to maintenance therapy and 40.4% of the RR group attended
additional residential rehabilitation as non-index treatment). The DTX group took up a variety
of non-index treatments, with 53.2% receiving maintenance, 43% additional detoxification and
25% rehabilitation and 21% outpatient counselling. The NT group also enrolled in a variety of
treatment types with 52.8% taking up methadone treatment, 20.8% attending an episode of
detoxification, and 13.2% attending residential rehabilitation.
In terms of days of treatment, the uptake of the non-index treatment is influenced by the average
number of days in the index treatment. For example, the MT group which had a mean of 225
days in index treatment had only 47% engaging in non-index treatment whereas the DTX group
with a mean of 6.6 days in index treatment had 88% with non-index treatment over the 12
months. In the RR group, which had a mean of 77 days in the index treatment, 74% had a non-
index treatment.
There was considerable variation in costs across the ATOS sample which is common with health
care expenditures. At the lower end, 25% of the individuals in the sample accounted for only
6% of the total expenditures, while at the top, 25% of individuals accounted for 60% of the
expenditures.
TR.203 37

In addition to the treatment costs, information on other health services utilisation was
determined for one month prior to the baseline and 12 month interviews. The total cost of HSU
at baseline was $252,862 and at 12 months was $298,843 with a mean of $390 at baseline and
$460 at 12 months. As with treatment costs, there was a large variation in costs across
individuals with 19% of the sample reporting no additional use of health services, while 15%
accounted for 74% of expenditures at baseline and 79% at 12 months.
Fifty-eight percent of the total HSU costs at baseline and 64% at 12 months were attributable to
hospital and ambulance encounters even though the mean number of encounters was less than
one. These costs reflect some long and expensive care received for overdoses, mental health
admissions and acute care following accidents. Costs attributable to GP or specialists accounted
for 10.7% of the total HSU expenditure at baseline declining to 7.6% at 12 months; medications
made up 15% of the total at baseline and 8% at follow-up.
If the assumption is made that a combination of baseline and 12 month HSU costs reflects, on
average, the monthly costs throughout the year (this assumption is made with caution) we can
estimate an annual HSU cost per person of $5,100. Combining the treatment costs, and the
estimate of HSU costs, results in an annual cost of $11,287 per person.
To put the average $11,287 expenditure per participant into perspective, the annual expenditure
on health in Australia in 2001/02 was $3,292 per person for every man, woman and child
including those who may have never used any health services in that year as well as those treated
for a chronic illness (AIHW, 2004). In comparison, a study that examined the costs of health
care for the first year following a stroke found the costs varied from AUS $4,932 to $28,266
depending on the type of stroke (Dewey et al., 2003). Similarly, the cost per year of intensive
case management for a person with schizophrenia was estimated to be $35,700, and cost for
routine case management was AUS $26,100 (costs converted to 2002 prices for comparison
using CPI ) (Johnston et al., 1998). This would suggest that an average of $11,287 per person for
treatment of heroin use and their other health services use is not an excessive amount.
The costs used in this study were estimates of resource use for the various treatments provided
and are our best estimate of the health costs. Both personal and provider costs of treatment are
TR.203 38
included while participant time and travel costs were not. The data on treatment and health
services use collected for this study were a combination of self-report (non-index treatment and
HSU) and data collected from audits of patient treatment files (index treatments). While debate
continues in the literature as to the accuracy and comprehensiveness of self-reported health
service utilisation compared to the use of administrative records, recent work by Killeen at al.
(2004) demonstrates that the level of agreement for self-report health service utilisation for
medical, psychiatric and substance abuse treatment is good. Given that the range of providers
from which individuals in this study may be obtaining treatment includes hospitals, private and
public clinics, residential rehabilitation facilities, pharmacies, medical practitioners, and
counsellors, the use of self-reported data was the only method feasible for collection of this data
in this study.
There are obvious differences in use of resources across the four groups in this study. Given
that individuals self-selected into different treatment options, possibly suggesting different
objectives (i.e. abstinence versus harm reduction), the treatment groups would not be expected
to have similar demographic, drug use or health characteristics; and in fact there are documented
differences in demographics, drug use history, health status, and treatment histories of these
cohorts. Therefore, there is no a priori reason that the resource use, thus costs (if it affected by
these characteristics), should be similar across the treatment groups, however additional work is
required to explore this.
Some economists might argue that hotel type (food and accommodation) costs of residential
rehabilitation should be excluded from the total costs, particularly when some residential
facilities required individuals to cover a portion of these costs. However, in this study not all
facilities required this payment, nor did we have the resources to ascertain what proportion of
cost were hotel-type costs. The argument for excluding these costs is that everyone faces food
and lodging costs and to therefore include them in the totals overestimates the costs of RR.
However, some participants of this study had no fixed address or were homeless and if they had
not received treatment, many would have had very low expenditures on housing , and in addition
some individuals would have had household to maintain even if they were in treatment. We
therefore included all costs that were attributable to treatment, however based on personal
contributions, approximately 20% of the RR daily costs might be considered hotel type costs.
TR.203 39
Finally, what did the $6,187 of drug treatment purchase? There were a number of key outcomes
measures used in ATOS, with only three key indicators reported in this report. The outcome
measures, change in heroin free days, abstinence in preceding month and committed any crime
in the previous month, each showed a significant improvement from baseline to the 12 month
interview. There was, on average, 15.3 more heroin free days per month at 12 months, a 76%
improvement. There was a 55% improvement in rates of abstinence and a 52% decrease in the
numbers who committed crime in the previous month. In this study, the cost savings related to
decrease in crime were not estimated, however results from NTORS in the UK determined that
the cost of crime decreased by 50% in two years post treatment compared to the year prior to
treatment (Godfrey et al., 2004).
In summary, this report documents the patterns of use and economic costs of health care for a
group of heroin users in Australia. It details the quantity, type and economic cost of all the drug
treatments and general health services that this group accessed over a 12 month period. In
contrast to previous costing studies in Australia, ATOS is a cohort design, thus the information
presented here reflects health service utilisation and costs under real-world conditions.
TR.203 40

5. REFERENCES
ABS (2004) Consumer Price Index, Australian Bureau of Statistics: Canberra. www.abs.gov.au. 2003.
Adair, E. B. G., Craddock, S. G., Miller, H. G. and Turner, C. F. (1996) Quality of treatment data: Reliability over time of self-reports given by clients in treatment for substance abuse. Journal of Substance Abuse Treatment, 13, 145-150.
AIHW (2004) Australia's Health 2004, No. 9., Australian Institute of Health and Welfare: Canberra.
Brienza, R. S., Stein, M. D., Chen, M. H., Gogineni, A., Sobota, M., Maksad, J., Hu, P. and Clarke, J. (2000) Depression among needle exchange program and methadone maintenance clients. Journal of Substance Abuse Treatment, 18, 331-337.
Brooner, R. K., King, V. L., Kidorf, M., Schmidt, C. W. and Bigelow, G. E. (1997) Psychiatric and substance use comorbidity among treatment-seeking opioid abusers. Archives of General Psychiatry, 54, 71-80.
Cartwright, W. (2000) Cost-benefit analysis of drug treatment services: review of the literature. The Journal of Mental Health Policy and Economics, 3, 11-26.
CDHA (2001) National Hospital Cost Data Collection: National Public Sector Cost Weights Version 4.0, Commonwealth Department of Health and Ageing: Canberra. http://www.health.gov.au/casemix/report/hospmor8.htm. 2003.
CDHA (2002) Manual of resource items and their associated costs for use in major submissions to the Pharmaceutical Benefits Advisory Committee involving economic analyses, Commonwealth Department of Health and Ageing: Canberra. http://www.health.gov.au/pbs/pharm/pubs/manual/index.htm. 2003.
CDHA (2004a) Medical Benefits Schedule (MBS), Commonwealth Department of Health and Ageing: Canberra. http://www.health.gov.au/pubs/mbs/. 2003.
CDHA (2004b) Schedule of Pharmaceutical Benefits (PBS), Commonwealth Department of Health and Ageing: Canberra. http://www1.health.gov.au/pbs/scripts/search.cfm. 2003.
Cherubin, C. and Sapira, J. (1967) The medical complications of drug addiction and the medical assessment of the intravenous drug user: 25 years later. Annals of Internal Medicine, 119, 1017-1028.
Crofts, N. and Aitkin, C. (1997) Incidence of blood borne virus infection and risk behaviours in a cohort of injecting drug users in Victoria, 1990-95. Medical Journal of Australia, 167, 17-20.
Croughan, J. L., Miller, J. P., Wagelin, D. and Whitmen, B. W. (1982) Psychiatric illness in male and female narcotic addicts. Journal of Clinical Psychiatry, 43, 225-228.
Darke, S. and Ross, J. (1997) Polydrug dependence and psychiatric comorbidity among heroin injectors. Drug & Alcohol Dependence, 48, 135-41.
Darke, S., Ross, J., Teesson, M. and Lynskey, M. (2003) Health services utilisation and benzodiazepine use among heroin users: findings from the Australian Treatment Outcome Study (ATOS). Addiction, 98, 1129-1135.
Degenhardt, L. (2001) Opioid overdose deaths in Australia, National Drug and Alcohol Research Centre: Sydney.
DET (2004) TAFE NSW - Technical and Further Education, Australia, New South Wales Department of Education and Training: Sydney. http://www.tafensw.edu.au/. 2003.
TR.203 41
Dewey, H. M., Thrift, A. G., Mihalopoulos, C., Carter, R., Macdonell, R. A. L., McNeil, J. J. and Donnan, G. A. (2003) Lifetime Cost of Stroke Subtypes in Australia:Findings From the North East Melbourne Stroke Incidence
Study (NEMESIS). Stroke, 34, 2502-2507.
Digiusto, E. and Kimber, J. (1999) In Medical Observer, pp. 50.
Doran, C., Shanahan, M., Mattick, R., Ali, R., White, J. and Bell, J. (2003) Buprenorphine versus methadone maintenance: a cost-effectiveness analysis. Drug & Alcohol Dependence, 71, 295-302.
DVA (2004) Information for health care providers, Department of Veterans' Affairs Australia: Canberra. http://www.dva.gov.au/health/provider/provider.htm. 2003.
Flynn, P., PL., K., Portob, J. and Hubbard, R. (1999) Costs and benefits of treatment for cocaine addiction in DATOS. Drug & Alcohol Dependence, 57, 167-174.
French, M., McGeary, K., Chitwood, D. and McCoy, C. (2000) Chronic illicit drug use, health services utilization and the cost of medical care. Social Science and Medicine, 50.
Gerstein, D. R., Johnson, R. A., Harwood, H. J., Fountain, D., Suter, N. and Malloy, K. (1994) Evaluation Recovery Services: The California drug and alcohol treatment assessment (CALDATA), Department of alcohol and drug programs:Sacramento, CA.
Gibson, A., Doran, C., Bell, J., Ryan, A. and Lintzeris, N. (2003) A comparison of buprenorphine treatment in clinic and primary care settings. Medical Journal of Australia, 179, 38-42.
Godfrey, C., Stewart, D. and Gossop, M. (2004) Economic analysis of costs and consequences of of the treatment of drug misuse: 2-year outcome data from the National Treatment Outcome Research Study (NTORS). Addiction, 99, 697-707.
Gossop, M., Marsden, J., Steward, D. and Kidd, T. (2003) The National Treatment Outcomes Research Study (NTORS): 4-5 year follow-up results. Addiction, 98, 291-303.
Gossop, M., Marsden, J. and Stewart, D. (1998) NTORS at one year, Department of Health:London.
Gossop, M., Marsden, J., Stewart, D., Edwards, C., Lehmann, P., Wilson, A. and Segar, G. (1997) The National Treatment Outcome Research Study in the United Kingdom: Six-month follow-up outcomes. Psychology of Addictive Behaviors, 11, 324-337.
Gossop, M., Marsden, J., Stewart, D. and Rolfe, A. (2000) Patterns of improvement after methadone treatment: 1 year follow-up results from the National Treatment Outcome Research Study (NTORS). Drug and Alcohol Dependence, 60, 275-286.
Harwood, H., Hubbard, R., Collins, J. and Rachal, J. (1988) In Compulsory Treatment of Drug Abuse: Research and Clinical Practice(Eds, Leukefeld, C. and Tims, F.) US Department of Public Health Service, Alcohol, Drug Abuse, and Mental Health Administration, Washington, DC.
Holt, T., Ritter, A., Swan, A. and Pahoki, S. (2002) Australian Treatment Outcome Study (ATOS): Heroin. Baseline data report: Victoria., Turning Point Drug and Alcohol Centre: Melbourne.
Hubbard, R., Marsden, M., Rachal, J., Harwood, H., Cavanaugh, E. and Ginzburg, H. (1989) Drug abuse treatment: A national study of effectiveness, University of North Carolina Press, Chapel Hill.
Johnston, S., Salkeld, G., Sanderson, K., Issakidis, C., Teesson, M. and Buhrich, N. (1998) Intensive case management: a cost effectiveness analysis. Australian and New Zealand Journal of Psychiatry, 32, 551-559.
TR.203 42
Khantazin, E. J. and Treece, C. (1985) DSM-III psychiatric disorders of narcotic addicts. Archives of general psychiatry, 42, 1067-1071.
Kidorf, M., Hollander, J. R., King, V. L. and Brooner, R. K. (1998) Increasing employment of opioid dependent outpatients: An intensive behavioral intervention. Drug and Alcohol Dependence, 50, 73-80.
Kosten, T. R. and Rounsaville, B. J. (1988) Suicidality among opioid addicts: 2.5 year follow-up. American Journal of Drug and Alcohol Abuse, 14, 357-369.
Mark, T., Woody, G., T., J. and HD., K. (2001) The economic costs of heroin addiction in the United States. Drug & Alcohol Dependence, 61, 195-206.
Mathers, C., Vos, T. and Stevenson, C. (1999) The Burden of Disease and Injury in Australia, Australian Institute of Health and Welfare:Canberra.
Mattick, R., Digiusto, E., Doran, C., O'Brien, S., Shanahan, M., Kimber, J., Henderson, N., Breen, C., Shearer, J., Gates, J., Shakeshaft, A. and NEPOD Trial Investigators (2001) National Evaluation of Pharmacotherapies for Opioid Dependence (NEPOD): Report of Results and Recommendations, National Drug and Alcohol Research Centre, UNSW: Sydney.
MIMS (2003) Mims Online - Simple Search, MIMS Australia: http://mims.hcn.net.au/ifmx-nsapi/mims-data/?MIval=2MIMS_ssearch. 2003.
Morrison, A., Elliot, L. and Gruer, L. (1997) Injecting-related harm and treatment seeking behaviour among injecting drug users. Addiction, 92.
PHIAC (2003) Industry Statistics - PHIAC A reports, Australian Government Private Health Insurance Administration Council: http://www.phiac.gov.au/statistics/phiacareports/index.htm. 2003.
Ross, J., Darke, S. and Hall, W. (1996) Benzodiazepine use among heroin users in Sydney: patterns of use, availability and procurement. Drug & Alcohol Review, 15, 237-243.
Ross, J., Teesson, M., Darke, S., Lynskey, M., Ali, R., Ritter, A. and Cooke, R. (2004) Twelve month outcomes of treatment for heroin dependence: Findings from the Australian Treatment Outcome Study (ATOS), UNSW:Sydney.
Ross, J., Teesson, M., Darke, S., Lynskey, M., Hetherington, K., Mills, K., Williamson, A. and Fairbairn, S. (2002a) Characteristics of heroin users entering three treatment modalities in New South Wales: Baseline findings from the Australian Treatment Outcome Study (ATOS), UNSW:Sydney.
Ross, J., Teesson, M., Darke, S., Lynskey, M., Hetherington, K., Mills, K., Williamson, A. and Fairburn, S. (2002b) Characteristics of heroin users entering three treatment modalities in New South Wales: baseline findings from the Australian Treatment Outcome Study, National Drug and Alcohol Research Centre:Sydney.
Rounsaville, B. J., Weissman, M. M., Crits-Cristoph, K., Wilber, C. and Kleber, H. (1982) Diagnosis and symptoms of depression in opiate addicts: Course and relationship to treatment outcome. Archives of General Psychiatry, 39, 151-156.
Ryan, C. F. and White, J. M. (1996) Health status at entry to methadone maintenance treatment using the SF-36 health survey questionnaire. Addiction, 91, 39-45.
Simpson, D. and Sells, S. (1982) Effectiveness of treatment for drug abuse: An overview of the DARP research program. Advances in Alcohol and Substance Abuse, 2, 7-29.
Simpson, D. D., Joe, G. W., Broome, K. M., Hiller, M. L., Knight, K. and Rowan Szal, G. A. (1997) Program diversity and treatment retention rates in the Drug Abuse Treatment Outcome Study (DATOS). Psychology of Addictive Behaviors, 11, 279-293.
TR.203 43
Warner-Smith, M., Darke, S., Lynskey, M. and Hall, W. (2001) Heroin overdose: causes and consequences. Addiction, 96, 113-1125.
Webster, I., Waddy, N., LV., J. and Lai, L. (1977) Health status of a group of narcotic addicts in a methadone treatment programme. Medical Journal of Australia, 2, 485-491.
Weekley, J., Cooke, R. and Ali, R. (2002) Characteristics of heroin dependent individuals in South Australian Drug Treatment. The first report of the South Australian component of the Australian Treatment Outcome Study - Heroin., Drug and Alcohol Services Council:Adelaide.
TR.203 44
Related Documents