SMM 210 Assessing Quality and Customer Satisfaction with service delivery of mobile telecommunication networks in the UK. Dissertation Student Number: 0847416 Student Name: Vimal Gopal MBA International Business

Welcome message from author
This document is posted to help you gain knowledge. Please leave a comment to let me know what you think about it! Share it to your friends and learn new things together.
Transcript

SMM 210
Assessing Quality and Customer Satisfaction with service delivery of mobile telecommunication networks in the UK.
Dissertation
Student Number: 0847416Student Name: Vimal Gopal
MBA International Business

Market Research on Service Quality and Customer Satisfaction 2010
ABSTRACT
Purpose - There are a lot of service quality dimensions derived from the Service
Quality models and frameworks. The aim of this dissertation is to find out the
significance of these dimensions as perceived by the customers and compare it with
the level of service offered by the UK’s Mobile Service Providers.
Review/Methodology – A review was conducted on the relevant models and the gaps
were found using the Qualitative (Focus Group Interview) and Quantitative research
(Questionnaire) methods.
Findings – Five attributes of service quality are found to be deemed with high
importance by the customers and lacks attention from the Mobile Service Providers.
Limitations/Implications – As this research has been conducted using limited time
and resources, the Mobile Networks could conduct research specific to their market
potential and offered service level.
Keywords – Service Quality, customer satisfaction, mobile telecommunication
networks, customer expectations and SERVQUAL
2 | P a g e
Deadline: Monday 16th August 2010

Market Research on Service Quality and Customer Satisfaction 2010
Table of contents
1. INTRODUCTION.............................................................................................5
1.1. Background of the study……………………………………………....5
1.2. Overview of Telecommunications Market……………………...…....6
1.3. The current state of telecommunication industry in the UK……….6
1.4. Problem Identification & Purpose of the Study……………………..8
1.5. Research Questions……………………………………………………9
1.6. Research Objectives…………………………………………………...9
1.7. Significance and Limitations of this dissertation……………………10
2. LITERATURE REVIEW.................................................................................11
2.1. Purpose of Literature
review………………………………………….11
2.2. Customer
Psychology………………………………………………….11
2.3. Role of Customer
Satisfaction………………………………………...12
2.4. Measuring Customer
Satisfaction…………………………………….13
2.5. Customer Satisfaction Indices (CSI)
……………………………………..13
2.6. Disconfirmation
Models………………………………………………..15
2.7. Service
Quality………………………………………………………….16
2.8. Relationship between Service Quality and Customer Satisfaction…
18
3 | P a g e
Market Research on Service Quality and Customer Satisfaction 2010
2.9. Service Quality Dimensions……………………………………………
19
2.10. Service Quality Models…………………………………………………
19
2.11. SERVQUAL…………………………………………………………….2
0
2.12. Gronroos’ Model of
SERVQUAL……………………………………..23
2.13. Addressing the Research
Questions…………………………………...24
3. RESEARCH METHODOLOGY.................................................................26
3.1. Research Purpose
……………………………………………………...26
3.2. Research
Philosophy…………………………………………………...26
3.3. Research Approach……………………………………………………
27
3.4. Research Method ………………………………………………………
27
3.5. Operationalisation of Concepts………………………………………….30
3.5.1. Minnesota Customer Satisfaction Index (MnCSI)…………..30
3.5.2. Defining Hypothesis…………………………………………....32
3.5.3. Disconfirmation Models……………………………………….33
3.5.4. Over-all Satisfaction…………………………………………...33
3.5.5. Procedures to test Hypotheses………………………………..34
4 | P a g e
Market Research on Service Quality and Customer Satisfaction 2010
3.6. Sample Selection and Data
Collection………………………………..37
3.7. Reliability………………………………………………………………
38
3.8. Validity…………………………………………………………………
39
4. DATA ANALYSIS AND DISCUSSION………………………………….41
4.1. Introduction……………………………………………………………41
4.2. Demographic profile…………………………………………………..41
4.3. Assessing Customer Satisfaction with the Service Quality…………41
4.3.1. Results of Minnesota Customer Satisfaction Index…………42
4.3.2. Results of Disconfirmation Models and Over-all
Customer Satisfaction Measure……………………………...43
4.3.2.1. Irrespective of cellular network……………………...43
4.3.2.2. With respect to cellular networks…………………....47
4.4. Customer satisfaction with each service quality dimension………..57
5. SUMMARY AND CONCLUSION.............................................................65
6. BIBLIOGRAPHY........................................................................................69
1. INTRODUCTION
1.1 Background to the study:
During the last few years, the Telecom industry has experienced an enormous
growth across the world and there has been a rapid growth in the wireless technology
(Bharat Book Bureau, 2008). According to an industry market study, by 2013 the
5 | P a g e

Market Research on Service Quality and Customer Satisfaction 2010
telecommunications industry is anticipated to attain revenue of $2.7 trillion with an
average growth rate of 10.3 percent an year (Bharat Book Bureau, 2008). In the
present dynamic and interactive market place, the organisations are proposing various
strategic methods to achieve effective Customer Satisfaction (CS) strategy decisions
and eventually increase the CS success rates to sustain long term relationship with the
profitable customers (Chien and Su, 2003; Gronroos, 1994). “Loyal customers are
reported to have higher customer retention rates, commit a higher share of their
category spending to the firm, and are more likely to recommend others to become
customers of the firm.” (Keiningham et al., 2007, p. 362). Hence the organisations are
becoming more customer centric, giving more importance to retaining old customer as
the business would end up spending an approximate of five times more in attracting
new customers than retaining the existing customers in terms of time, money and
resources (Reichheld, 1996; Pizam and Ellis, 1999).
As the growth of the organisation and its survival in the market is driven by
customer loyalty and customer retention, each of these companies is continually
improving on their service quality standards to survive in this highly competitive
market (Keiningham et al., 2007). Hence, in order to maintain these service quality
standards, organisations frequently adopt new measures to check if the customers are
satisfied with the service quality provided. For e.g. by conducting customer surveys
and analysing the acquired data statistically, which would help them make the right
decision to increase customer satisfaction and eventually customer loyalty among
their customers (SPSS White Paper, 1996). Organisations adopt both quantitative and
qualitative methodologies to evaluate CS and the data obtained from these measures
provide constructive feedback to help the organisation know the satisfactory level of
its customers with its products, which would help the organisation to: i) take reliable
steps to improve the quality of service, ii) adding more value to its customers and iii)
achieving high customer satisfaction rates (Amaratunga et al., 2002).
1.2 Overview of the UK Telecommunications Market:
Telecommunications is one of the best growing sectors of the UK economy.
The competition developed strongly in 1984 after the privatisation of British Telecom
6 | P a g e

Market Research on Service Quality and Customer Satisfaction 2010
(BT) and as of 2004, the UK had an approximate of 170 fixed telecommunications
provider and 59 mobile service providers (CWU research, 2004). The market for fixed
telephone network has been declining since the evolution of mobile / cellular phone
networks and in 2003 due to flat call volumes and pricing competition, it fell by
£400m (CWU research, 2004). Eventually, the consumers preferred the cellular phone
networks as the mode of communication which was faster and easier than the fixed
telephones (CWU research, 2004).
According to the UK Mobile Operator Subscriber Data, Statistics and Market
Share 2006 - 2008, there are five primary cellular network operators in the UK:
Vodafone, Telefonica O2, T-Mobile, Orange and 3 UK and it was reported to have
73.1 million cellular service subscribers in the last quarter of 2007, which represents
almost 9% of the total European mobile subscriber market and another statistical
report from IE market research Corp reveals that the wireless market is anticipated to
achieve 126% by 2010 and gradually the total subscribers would also reach 78 million
by 2010 (Telecoms Market Research, 2008).
1.3 The current state of telecommunication industry in the UK:
Today, the telecommunication industry has undergone a rapid transformation
creating a lot of new challenges for infrastructure and service providers. The rapid
advances in technology and increased market turbulences have added a lot of value to
the telecom industry (Lia and Whalley, 2002).
Recently T-Mobile and Orange merged becoming a giant in the telecom
industry having 28.4 million customers and now they are the largest cellular service
provider in the UK with an approximate of 37% of the entire mobile market (BBC
News, 2009; The Register, 2010).
The 3G network is up to 40 times faster in data than the 2g or the GSM
networks. This high connection speed adds on more features such as sending Pictures,
MMS (Multimedia Messaging Service) or video clips and also promotes high quality
sound (Robins, 2003).
7 | P a g e

Market Research on Service Quality and Customer Satisfaction 2010
However this rapid growing mobile market is expected to face capacity-crunch
i.e. due to the increasing existence of several MVNOs (Mobile Virtual Network
Operators), the mobile data traffic has gradually increased 200% in 2009 and
according to the reports of Ofcom, few service providers such as O2 are about to hit
that capacity (Xln Business Community, 2010). Hence, this capacity-crunch may
bring down the quality of service delivery necessitating the network operators to take
precautions in order to maintain their service delivery standards.
The market share of mobile telecom industry in the UK as of September 2009:
Fig 1.3a Market Share of Mobile telecom industry in the UK
(Source: Guardian News, 2009)
The Fig 1.3a indicates that, as of September 2009, T-Mobile / Orange had
37% of market share being the highest, followed by O2 with 28%, Vodafone with
23% and 3-mobile with the least at 5.8%.
The total number of subscribers for the UK’s mobile telecom industry as on
September 2009:
8 | P a g e

Market Research on Service Quality and Customer Satisfaction 2010
Fig 1.3b Number of subscribers for the UK’s mobile telecom industry
(Source: Guardian News, 2009)
The Fig 1.3b indicates that, as of September 2009, T-Mobile / Orange had
28.4 million customers being the highest followed by O2 having 21.5 million
customer, Vodafone with 17.7 million customers and 3-mobile having the least at 4.5
million customers.
1.4 Problem Identification & Purpose of the Study:
Though majority of the customers for UK mobile telecommunication networks
use all of their mobile services like text, data and mobile internet services, they are
dissatisfied with the service-availability and it’s quality; especially the network
coverage is a crucial concern to all of its consumers. (Telecom paper, 2009) Due to
the existence of several MVNOs, customers switch to different service providers
frequently and they are also concerned about the self-regulatory schemes by their
network providers (Telecom paper, 2009).
Customers are known to have reported that there is no network clarity and
coverage. They are not being told if they would have network coverage in their area
before they could sign a contract with the company and they are unhappy with the
after sales service that is being provided to them (Poulter, 2009). “A study on 5,000
people revealed the telecom giants are nearly twice as bad at dealing with issues and
complaints compared with their successors British Gas.” (Xln Business Community,
2009). The customers don’t get reliability and assurance in the services they are being
offered, as they have to go through a sequence of inconsistencies such as waiting in
long queues to speak to representative, incompetent employees who do not understand
9 | P a g e

Market Research on Service Quality and Customer Satisfaction 2010
the correct issue that is being faced and bear with their rude behaviour at times (Xln
Business Community, 2009). These situations create a bad impression in the
customer’s mind and lead them to change the service provider. Also, this word of
mouth communication can spoil the image or reputation of the company.
Hence the main research aim of this study would be: To measure and critically
analyse the level of customer satisfaction with regards to service delivery among
different mobile service providers (Mobile Telecommunication Networks) within the
UK.
1.5 Research Questions:
How the customers’ satisfaction with the service quality is described in the UK’s
MTNs with and without respect to the customer’s service providers?
Which attributes of service quality do the customers perceive to be of more
importance that lacks attention from the service providers in the UK?
1.6 Research Objectives:
To find out the level of customers’ satisfaction with the service quality offered to
them by the UK’s MTNs with and without respect to which network customers
subscribe to.
To find out which dimensions of service quality are the customers
satisfied/dissatisfied with in the UK’s MTNs.
To identify the Service Quality dimensions that the customers perceive to be of high
importance in the UK’s MTNs.
1.7 Significance and Limitations of this dissertation:
10 | P a g e
Market Research on Service Quality and Customer Satisfaction 2010
This study is significant in various ways to business consultants and business
partners. The results and findings of this study would be helpful to the management of
UK’s cellular service providers, as it provides a reliable scientific measure to evaluate
customer satisfaction level with the services delivered by them. It will reveal the
dimensions of service quality which are considered more important from the
customer’s perspective, which would provide them with a priceless empirical support
to make right strategic decisions in the required areas of operations and over-all it
would act as reliable guide to improve their service delivery standards and create
customer-value. This dissertation would provide enormous valuable information to
business partners such as share-holders and investors which would help them provide
useful suggestions to their respective mobile service providers to improve their
service delivery standards. The dissertation enables the customers to analyze the
ratings of the various dimensions with respect to the service providers so that bringing
in awareness among customers.
The limitations of this dissertation are that, the research would not have access to
every locality in the UK and as the research is mostly done in the city of London. But
London, being a cosmopolitan city, gives us a gist of UK and a right place to conduct
the research. It doesn’t allow us to conduct the analysis on large samples, which is a
prerequisite to have more reliability on surveys (Saunders et al., 2007). But, as the
MTNs are a public service and have millions of users, the samples are obtained from a
much diversified respondents to obtain the best possible results.
11 | P a g e
Market Research on Service Quality and Customer Satisfaction 2010
2. LITERATURE REVIEW
2.1 Purpose of Literature review:
The literature review aims at critically exploring the existing knowledge and
theories that are relevant to the research objectives, so that we can develop and refine
the key areas of our research (Saunders et al, 2007). To generate and refine the
research ideas the ‘Relevance Tree’ technique is used in this review of literature i.e. a
broad concept is studied from the view of various authors via which a new sub-
concept is developed and as we proceed deep into the subject new ideas are
formulated (Saunders et al, 2007). The customer satisfaction is measured through the
service quality dimensions defined for that particular product or service. These
dimensions are based on different models created by academics which I critically
analyse in the literature and adopt those that best suit the aim of this dissertation.
2.2 Customer Psychology:
A ‘Customer’ is usually the final user of any product where the purpose of it
being made gets fulfilled (Hayes, 1997). Understanding the psychology of customers
plays a very important role in determining their satisfaction over a product or service.
This includes designing a product according to the needs of the customer. The
satisfaction of a customer starts well before manufacturing the product rather than the
moment after sale. During the service encounters the customers’ values, perceptions,
beliefs and expectations motivate them to choose one service provider rather than
another (Lynch, 1992; Pizam and Ellis, 1999).
At any point of sale, there are four options available for the customer to
choose: Purchase – where the customer is convinced to buy a product or service,
Rejection – where the customer rejects the offer, Postponement – where the customer
is partly convinced and postpones the offer to think at a later date and substitution –
12 | P a g e

Market Research on Service Quality and Customer Satisfaction 2010
where the customer compares the product with other contemporary offers. Hence
influencing the customer’s choice to purchase a product is very crucial (Lynch, 1992;
Pizam and Ellis, 1999). Therefore, it is very essential for us to know the customer
expectations and their requirements, to understand customer’s view and perspective
about the quality of services and products they need (Pizam and Ellis, 1999).
2.3 Role of Customer Satisfaction:
Customer Satisfaction (CS) is said to be the customer’s post-purchase
evaluation of services or a product. When the CS level of an organisation is high,
even the market share and profits of the organisation grow higher leading the
company to a stronger competitive position in the market place (Turkyilmaz and
Ozkan, 2007). The customer satisfaction is built on the varied experiences, positive
and negative that the customer has come across at different points of time (Satari,
2007).
The impact of customer care in service quality system would maximize profits
and help the organisations grow by providing customer satisfaction and building great
customer experiences. Customer care is therefore a key to gain the competitive
advantage among the competitors (Lynch, 1992).
“Satisfaction of customers also happens to be the cheapest means of
promotion and therefore, customer satisfaction is recognized as of great importance to
all commercial firms because of its influence on repeat purchases and word-of mouth
recommendations.” (Pizam and Ellis, 1999, p. 326). Hence, it becomes important for
the organisation to offer customers a good experience that exceeds their expectation
and if the customers have bad experiences, then the reputation of the company
reduces rapidly due to word-of-mouth communication.
Satisfaction of customers over a telecommunication product can be two
dimensional: i) It can be component specific – i.e. service specific, over the MMS
services, 3G services, speed etc. and ii) It can be product specific – satisfaction on the
overall performance and responsiveness of the mobile service provider (Cronin and
13 | P a g e

Market Research on Service Quality and Customer Satisfaction 2010
Taylor, 1992). These dimensions require us to measure the satisfaction level of the
customers in different particular components as well as on the whole.
2.4 Measuring Customer Satisfaction:
In order to take managerial decisions, the CS needs to be measured in an
organisation and this Customer Satisfaction Measurement (CSM) is used to determine
the customer satisfaction level based on the valuable feedback from the customers and
identifying the customer expectations (Crosby, 1991). The service quality can be
achieved only by knowing the customer’s total needs or customer expectations and
with the help of this data, the service standards and processes may be altered to
achieve customer satisfaction (Crosby, 1991).
After in depth research on CSM, nine distinct theories were developed such
as: Expectancy disconfirmation (Parasuraman et al, 1988), Assimilation contrast,
Comparison level (Gronroos, 2001), Value precept (Zeithaml, 1988), Cognitive
dissonance, Equity, Generalised negativity, Contrast and Attribution (Kauppinen et
al., 2007). Most of these theories were based on cognitive psychology, but they were
developed with no empirical research. However, among these, only two of them were
widely accepted i.e. the expectancy disconfirmation theory and customer satisfaction
indices (Pizam and Ellis, 1999) because all the theories mentioned above use these
two models as a common base (Parasuraman et al, 1988; Gronroos, 2001; Zeithaml,
1988; Kauppinen et al., 2007). Therefore, we would review the customer satisfaction
indices and disconfirmation models which would form the crux of this study.
2.5 Customer Satisfaction Indices (CSI):
This model focuses more on customer’s overall satisfaction with a product or
the services offered to them till date and it is based on a cumulative view of
satisfaction (Turkyilmaz and Ozkan, 2007). “The CSI model is a structural model
based on the assumptions that customer satisfaction is caused by some factors such as
perceived quality (PQ), perceived value (PV), expectations of customers, and image
14 | P a g e

Market Research on Service Quality and Customer Satisfaction 2010
of a firm.” (Turkyilmaz and Ozkan, 2007, p. 673). It is equally important to
understand the customer perceived value and their expectations to attain high degree
of customer satisfaction.
The Swedish Customer Satisfaction Barometer (SCSB) is reported to be the
first national customer satisfaction index (NCSI) which was developed in 1989, then
the model was followed by the Germans, they named it as German Customer
Barometer (Fornell, 1992).
The Americans adapted this model in 1993, it was developed by Claes Fornell,
who was the founder of SCSB and they named it as the American Customer
Satisfaction Index (ACSI). The ACSI is a cause and effect model using the responses
from the respondents to form a ‘Multi-Equation Econometric’ model. The responses
were collected according to different variables in a 0-100 scale (Turkyilmaz and
Ozkan, 2007; Fornell, 1992). The European Organisation for Quality (EOQ) and
European Foundation for Quality Management (EFQM) jointly developed the
European Customer Satisfaction Index (ECSI) in 1999. Then gradually many other
countries followed the CSI model (Turkyilmaz and Ozkan, 2007). The ECSI model
included the ‘Corporate Image’ as a component on top of the ASCI model. But, these
indices do not measure the CS levels for specific components and overall CS together
(Turkyilmaz and Ozkan, 2007).
The Workforce Centre developed the Minnesota Customer Satisfaction Index
(MnCSI). The MnCSI model is specifically used to evaluate over-all customer
satisfaction with service delivery of the MTNs on a single scale (Positively
Minnesota, 2007). This model uses the variables of disconfirmation models: both
desire disconfirmation as well as expectation disconfirmation and it combines three
questions which includes the disconfirmation models also (As discussed earlier
disconfirmation models are the second CSM tool which was widely accepted) It also
gets more stable when there are three questions instead of one. In addition, it is
comparatively flexible and best suited for any number of responses (Positively
Minnesota, 2007).
15 | P a g e

Market Research on Service Quality and Customer Satisfaction 2010
2.6 Disconfirmation Models:
According to Parasuraman et al. (1988), customer expectations are one of the
most important factors of CS, as they play a major role of ascertaining customer
satisfaction. Even the SERVQUAL model uses the disconfirmation model as its base
and it is basically used for conceptualizing service quality (Parasuraman et al., 1988).
The disconfirmation model was tested and confirmed in a lot of studies conducted
across the world and there are two different types of disconfirmation models - Desire-
Disconfirmation model and Expectancy disconfirmation model (Pizam and Ellis,
1999; Parasuraman et al., 1988). The expectancy disconfirmation model states that
quality is assessed by comparing perceived and expected performance i.e. to examine
if the customer expectations were met during the service delivery process (Oliver and
DeSarbo, 1988; Kang and James, 2004).
According to Oliver (1980), the expectancy disconfirmation model has got
two internal attributes, which are known as positive disconfirmation and negative
disconfirmation. If the performance of the product or service exceeds the customer
expectations and when the customer is highly satisfied with the product or service
delivered, then it is called as value disconfirmation. However, if the customer’s
expectations are met and he/she is satisfied with the product or services offered, then
it is positive disconfirmation and finally if the product or service perceived is below
his/her expectations, then it is called negative disconfirmation (Oliver, 1980). This
theory focuses more on the antecedents of satisfaction, which occurs at the initial
stages of the service-delivery process (Oliver, 1980; Oliver and DeSarbo, 1988; Kang
and James, 2004).
Recently Khalifa and Liu (2002) built a theory that embedded both desire as
well as expectancy disconfirmation theory. They have proved that both these factors
impact the over-all customer satisfaction, as they both are of cognitive standards and
it is hard to evaluate which one of these factors explains CS better.
16 | P a g e

Market Research on Service Quality and Customer Satisfaction 2010
2.7 Service Quality:
Service Quality means the service that meets all the customers’ expectation
and satisfies their needs and requirements or it is defined as “a consumer’s judgment
about an entity’s overall excellence or superiority.” (Kang and James, 2004, p. 267)
This term is purely customer oriented. Hence excellence in service requires an
understanding of customer needs and expectation (Edvardsson, 1998).
As there was an enormous growth in mobile telecommunications market in the
last few years, the customers are more conscious about the quality of services being
offered to them (Kumar and Lim, 2008). According to Kumar and Lim (2008), the
service quality in MTNs can be perceived through the technical as well as the
functional attributes of mobile services in which the technical attributes include the
pricing/tariff plan, the network quality & data services and the functional attributes
include the customer service quality and the billing system. “Overall perceptions of
service quality are formed by a consumer’s evaluation of multiple quality
dimensions.” (Kumar and Lim, 2008, p. 569). Hence in order to enhance the
customer’s perceived value and their satisfaction level, it is important for the
organisations to create positive perceptions of service quality among its customers
(Kumar and Lim, 2008).
Service quality enhances the organisation’s operational efficiency as well as
improving the retention rate of its firm (Edvardsson, 1998). The customers assess the
product quality in various tangible ways such as its colour, style and feel. But in most
of the cases only few of these tangibles exist and meet the customers’ expectation
(Parasuraman et al., 1985).
According to Parasuraman et al. (1985), as the services being intangible in
nature, most of it cannot be measured and their heterogeneous nature makes them
vary from time to time and customer to customer. Hence because of these natures, it
becomes hard to evaluate the service quality of an organisation.
17 | P a g e

Market Research on Service Quality and Customer Satisfaction 2010
Gronroos (2001) introduced the concept of Consumer Perceived Quality
(CPQ), which evaluates to what extent the service delivered, meets the customer’s
expectation. It compares the consumer’s expectations and the customer’s perception
of service received. According to this theory, over-all satisfaction of the customer
with the organisation is based on every encounter or experience he had with that
organisation. Hence they claim that service quality and customer satisfaction are
distinct conceptually but they are closely related constructs (Kang and James, 2004;
Sureshchandar et al., 2002). A recent study has proved that “the CPQ influences
profitability directly as well as indirectly through market share.” (Crosby, 1991, p. 6).
Hence it is equally important to take CPQ under consideration for this research.
According to Parasuraman et al. (1988), the long term and global evaluation of
a service is related to the service quality perceived by the customers and the customer
satisfaction can be obtained by evaluating specific service transactions and they have
also clearly pointed out that the customer experience with the provided service,
influence the perceptions of service quality. Hence, it could be said that both service
quality and CS are closely related terms.
2.8 Relationship between Service Quality and Customer Satisfaction:
The relationship between service quality and customer satisfaction has gained
a lot of attention in the last few years and they are considered to be the two core
components that frame a crux of the marketing theories (Sureshchandar et al, 2002).
In the current competitive market, the companies can sustain its competitive
advantage by providing service quality of higher standards, which would result in
satisfied customers (Sureshchandar et al, 2002).
Customers are one of the important assets of an organisation as they are the
only ones who keep the business running. As it was already discussed earlier that
retaining existing customers is more essential than generating new ones, it is
important to have service quality in every stroke to build a long term relationship with
the customers, which adds more value to the consumers as well as the company
(Nguyen et al, 2007). Based on the quality of service delivered, is the consumer’s
18 | P a g e

Market Research on Service Quality and Customer Satisfaction 2010
commitment to renew/continue our service consistently in the future (Nguyen et al,
2007).
Figure 2.8: Five critical factors of customer perceived service quality
Source: (Sureshchandar et al., 2002)
The figure 2.8 indicates the five critical factors of customer perceived service
quality, in which the core services refer to the content of the services i.e. the different
features offered in a service. The human element of services refers to the empathy,
assurance, reliability and responsiveness i.e. includes the factors that affect the human
behaviour. Standardisation of services refers to the systematizing and simplifying the
systems, processes and the procedures. The tangibles refer to the physical facilities
available, equipments and the appearance of their workers and finally the social
responsibility refers to encouraging ethical behaviour in every aspect, which would
improve the image of the company and also promote customer loyalty and overall
customer satisfaction (Sureshchandar et al., 2002).
19 | P a g e

Market Research on Service Quality and Customer Satisfaction 2010
2.9 Service Quality Dimensions:
According to Johnston (1995), it is crucial to identify the determinants of
service quality before we proceed with the service research. Hence this becomes a
central concern, as it is necessary to find out the determinants of service quality to
define measures and control customer perceived service quality.
In 1980s, Parasuraman et al. (1985, 1988, 1994) developed the SERVQUAL
model to determine what service quality meant to the consumers, followed by the
measures they developed strategies to meet customer’s expectations. It is considered
to be the most popular instrument, which is widely used by many researchers and
practitioners to measure service quality (Sureshchandar et al., 2002).
2.10 Service Quality Models:
Many models were developed to capture the quality of service at different
points of time to suit different business objectives (Nitin et al, 2005). The earliest ones
were that of Gronroos’, (1984) ‘Technical and Functional Quality Model’ where the
perceived quality was compared with the Expected Service with reference to the
Functional and Technical dimensions. The next popular model was Parasuraman et
al.’s (1985) GAP model. This model analysed the gaps between the customers’
expected and perceived service forming a base for the SERVQUAL model with
several dimensions like Tangibles, Reliability etc. However, the SERVQUAL model
has been subjected to a lot of criticisms and there have been many scholars who had
tried to modify or restructure this model conceptually (Kang and James, 2004). The
next model designed by Haywood (1998) called as ‘Attribute ServQual Model’
incorporated 3 attributes: ‘Physical facilities and process’, ‘People’s Behaviour’ and
‘Professional Judgement’ into the SERVQUAL components. Haywood (1998) also
said that all the three attributes needs to have a balance and if not leads to fall in
quality. The ‘Synthesized ServQual Model’ by Brogwicz et al. (1990) explained the
importance of the customer’s perception of the brand and image before even the
20 | P a g e
Market Research on Service Quality and Customer Satisfaction 2010
product launched. This model added up the ‘Company Image’ component and its
elements to the SERVQUAL model.
Meanwhile, Cronin and Taylor (1992) developed ‘SERVPERF’, the
‘Performance Only Model’ which states that the consumers’ perceptions on the brand
actually predict the service quality and the perception index is a worthy indicator of
the Service Quality. It also criticises that the SERVQUAL model mixes satisfaction
with perception. But the perception cannot always be a proper service quality
indicator because perceptions do change with time, and the organisation that provide
unmatched service excellence always lead even when started with comparatively
lesser brand awareness and marketing system. The Mattson’s (1992) ‘Ideal Value
Model’ calculates the Service Quality in comparison with the Ideal Industry Standard
rather than the Customers’ perceptions. This model may strive to provide the best
service in line with the technological capability but the innovation may not be
focussed on the customer’s requirements. The ‘IT Alignment Model’ (Berkley and
Gupta, 1994) introduced Information Technology for improving the service quality.
Meanwhile, Dabholkar (1996) introduced the ‘Attribute and Overall Affect Model’
which examines the technology used self service options to minimize labour costs.
The PCP Attribute (Philip and Hazzlet, 1997) egg prioritized the dimensions as
Pivotal, Core and Peripheral. Oh (1999) depicted the importance of Customer Value.
Frost and Kumar (2000) proposed the ‘Internal Service Quality’ dimensions based on
the GAP model for the Internal Customers of the organisation. In the ‘Internal Service
Quality DEA model’ (Soteriou and Starvinide, 2000), the Data Envelope Analysis
maps the depreciation in service quality from the client base to branches. Santos’
(2003) ‘e-Service Quality’ is developed on the antecedents of service quality using e-
commerce.
2.11 SERVQUAL:
SERVQUAL is a multiple item scale developed to measure the Service quality
and this instrument illuminates the different dimensions of customer’s perception and
helps assessing the service quality (Parasuraman et al., 1985, 1988).
21 | P a g e

Market Research on Service Quality and Customer Satisfaction 2010
It has illuminated five dimensions via which customers perceive and assess service
quality of the organisation and each dimension has a sub-set called ‘items’ via which
the dimensions are being measured (Parasuraman et al., 1988). The five dimensions
are:
1. Tangibles: This includes the physical facilities available, equipments and the
appearance of their workers.
2. Assurance: This includes the courteous nature and the product knowledge of
the employees and also if they are confident and trust worthy.
3. Responsiveness: Providing quick service and their willingness to help the
customers.
4. Empathy: Caring for the customers with more individualised attention.
5. Reliability: Providing accurate service and performing the promised
commitments (Parasuraman et al., 1988).
The required data is collected via structured questionnaire or surveys from a
sample of customers in which many questions are formulated based on the key service
quality dimensions (Parasuraman et al., 1988, 1994). Before reviewing other models
based on SERVQUAL, it is better to look into the advantages and disadvantages of
SERVQUAL.
Advantages and Disadvantages of SERVQUAL:
SERVQUAL has overlooked at some of the important factors of service
quality such as the social responsibility of the organisation, core service and
standardisation of service delivery and there is also a general agreement towards the
22 items scale, that they are reasonably good predictors of service quality
(Sureshchandar et al., 2002). Most of the research models till date have used
SERVQUAL as its base for development (Sureshchandar et al., 2002).
The SERVQUAL model has also been severely criticized in many cases. The
contents of the service quality dimensions obtained from the SERVQUAL model has
not been accepted by everyone, as service quality is generally viewed as a multi-
dimensional construct and it focuses mainly on the service delivery aspects and there
22 | P a g e

Market Research on Service Quality and Customer Satisfaction 2010
are many additional factors also to be considered for e.g. Considering only the
functional attributes to predict customer’s behaviour may have low predictive
validity, the semantic differences are not being withstanded in each dimension, etc.
(Kang and James, 2004; Sureshchandar et al., 2002). The criticisms also include “the
use of difference scores, dimensionality, applicability and the lack of validity of the
model, especially with respect to the dependence or independence of the five main
variables” (Kang and James, 2004, p. 267). Hence considering all these criticisms that
SERVQUAL is renowned for its widespread use by other researchers and scholars
and it also has got lot of disadvantages it is advisable to look into other models based
on SERVQUAL.
In 1992, Cronin and Taylor developed the Performance only model, which
they called it SERVPERF. It states that service quality can only be assessed by
perceptions and it is not necessary to measure expectations (Cronin and Taylor, 1992).
The author views service quality as a link between purchase intentions and customer
satisfaction and they challenged the SERVQUAL framework by Parasuraman et al.
(1985), that perceptions are the only predictors of service quality where as
SERVQUAL model confuses consumer satisfaction with attitude of the consumers
(Cronin and Taylor, 1992).
Similarly, Brogowicz et al. (1990) argued that there are many chances for the
service quality gap to occur well before the customer experiences the service, as the
customer may learn through various ways such as word-of-mouth communication and
advertisements. It integrates the traditional managerial framework to the service
quality which comprises of three factors: image, traditional marketing activities and
external influences and the model was called synthesized model of service quality
(Brogowicz et al., 1990).
Another study by Haywood-Farmer (1988) suggests that the attributes has to
be separated into three groups: professional judgement, processes & facilities and
consumer’s behaviour and each of the attributes comprises of various factors. It also
states that all the three groups must be given equal importance, in case if any one of
the attribute is given more importance than others, then it may lead to a disaster
(Haywood-Farmer, 1988).
23 | P a g e

Market Research on Service Quality and Customer Satisfaction 2010
Similarly, Parasuraman et al. (1985) had stated that service quality cannot be
assessed only with service outcomes but even the service delivery process needs to be
evaluated, the SERVQUAL is composed of only functional dimension of service
quality and they lack technical dimension and corporate image. Both these dimensions
are inter correlated.
The attributes of functional quality refers to the American perspective of
service quality but however according to the European perspective, the service quality
needs two more attributes in addition, which are technical quality and the corporate
image (Kang and James, 2004). The Gronroos SERVQUAL model includes all the
three attributes i.e. necessary from the European perspective. Moreover, the
Gronroos’ ServQual model was used in an empirical research in the
telecommunications field, which had proved that Gronroos model is more appropriate
to represent service quality in telecommunications industry (Kang and James, 2004).
2.12 Gronroos’ Model of SERVQUAL:
It is a multi dimensional model. According to this model there are two service
quality dimensions, firstly the technical aspect (what kind of service is provided) and
the functional aspect (how is the service being provided).They introduced the
corporate image concept, as one of the other important element in the perceived
service-quality model, as the customers would bring their perceptions and past
experiences with the firm in each encounter with the organisation (Kang and James,
2004). If a positive image about the firm is created in the mind of a customer, then
they wouldn’t bother much about the minor mistakes that happens and in case there is
a negative image about the firm, then the mistakes would be magnified in their mind
(Gronroos, 1994; Kang and James, 2004).
In the mobile telecommunications industry the customers look for both – How
they are being served (functional dimension) as well as the nature of services and
service outcomes which constitute the technical dimension (Kang and James, 2004).
24 | P a g e

Market Research on Service Quality and Customer Satisfaction 2010
Hence these three dimensions (technical dimension, functional dimension and
corporate image) are considered the most important.
2.13 Addressing the Research Questions
As discussed earlier in the ‘current state of telecommunication industry in the
UK’ and ‘Problem Identification’ in the introduction (section 1.3 and 1.4), the
network operators are likely to face capacity crunch which induces network coverage
and clarity issues. This in turn shall reduce the service quality standards to a new low.
Moreover, even the reliability, assurance and responsiveness factors are not addressed
with proper concern increasing the customer’s switching intention.
At this juncture it is important to know the service quality dimensions valued
more by the customers and to give more attention towards those in order to achieve
positive customer service experience. These problems led to the main research
objectives specified. Based on the reviewed literature the research objectives can be
obtained using the following theoretical models which has been justified in this
chapter:
i) The MnCSI model, Disconfirmation models (both desire and expectation) and
over-all satisfaction measure is used to assess and describe the level of customers’
satisfaction with the service quality offered to them by the UK’s MTNs with and
without respect to which network customers subscribe to.
ii) The expectation disconfirmation model is used in order to find which dimensions of service quality the customers are satisfied or dissatisfied with in the UK’s MTNs.
iii) The Gronroos’ Servqual model is used to identify the service quality dimensions that the customers perceive to be of high importance in the UK’s MTNs.
The research question one: ‘How the customers’ satisfaction with the service
quality is described in the UK’s MTNs with and without respect to the customer’s
service providers?’ is answered by critically analysing the results obtained from the
first research objective and the research question two: ‘Which attributes of service
quality do the customers perceive to be of more importance and lacks attention from
25 | P a g e

Market Research on Service Quality and Customer Satisfaction 2010
the service providers in the UK?’ is answered by critically analysing the results
obtained from objectives two and three.
26 | P a g e
Market Research on Service Quality and Customer Satisfaction 2010
3. RESEARCH METHODOLOGY
3.1 Research Purpose:
According to Saunders et al. (2007), research is a systematic or a step by step
procedure to increase the knowledge of a new or an existing subject. The purpose of
27 | P a g e

Market Research on Service Quality and Customer Satisfaction 2010
this research is to key out the main service quality dimensions/attributes as perceived
by the customers and find out how satisfied they are with these attributes and also to
explore the reasons for their the intention to change their service providers (Saunders
et al., 2007).
3.2 Research Philosophy:
Research philosophy brings up different philosophical assumptions and beliefs that
would support this research and help us selecting the appropriate research strategy and
phenomenon. It has two core traditions: ‘Positivism’ and ‘phenomenological approach’
(Saunders et al., 2007). Positivism deals with the fundamental laws perceived by us and
their scientific explanations. ‘Phenomenological’ helps in trying to understand a
particular phenomenon (Saunders et al., 2007). The three main characteristics of
positivism are:
• The explanations and knowledge attained in this method are similar to that of
natural science.
• The ‘hypothetico deductive methodology’ which is followed by positivism is
same as natural science.
• It treats its’ subject matter (i.e. mobile telecom networks in UK, in this study) just
like how a natural scientist would treat the world (of natural forces/things)
(Saunders et al., 2007).
Hence, it implies that positivism deals with observable social reality. So, this research is
built on this approach as it involves customer perceptions and identifying relationships
through different theoretical frameworks.
3.3 Research Approach:
According to Saunders et al., (2007), there are two broad methods of reasoning:
deductive approach and inductive approach. The deductive approach is based on the top-
down approach mode where a theory is developed and subjected to more observation
after hypothesis as shown in the fig 4.3. It works from more general to specific reasoning
(Saunders et al., 2007). Conversely, the inductive approach is based on the bottom-up
approach model i.e. the theory is developed based on the data collected during research.
28 | P a g e
Market Research on Service Quality and Customer Satisfaction 2010
However, the deductive approach is also said to have degrees of uncertainty (Saunders et
al., 2007) and moreover, as this research is based on theoretical considerations, our
research employs the deductive approach.
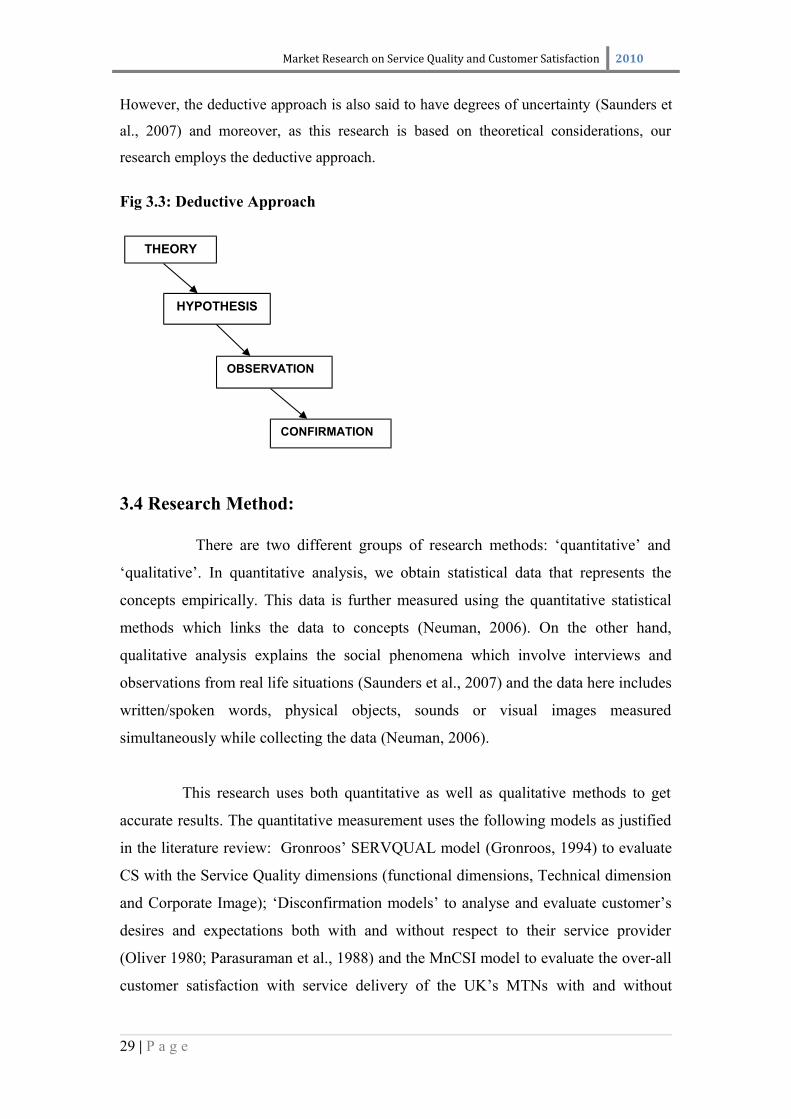
Fig 3.3: Deductive Approach
3.4 Research Method:
There are two different groups of research methods: ‘quantitative’ and
‘qualitative’. In quantitative analysis, we obtain statistical data that represents the
concepts empirically. This data is further measured using the quantitative statistical
methods which links the data to concepts (Neuman, 2006). On the other hand,
qualitative analysis explains the social phenomena which involve interviews and
observations from real life situations (Saunders et al., 2007) and the data here includes
written/spoken words, physical objects, sounds or visual images measured
simultaneously while collecting the data (Neuman, 2006).
This research uses both quantitative as well as qualitative methods to get
accurate results. The quantitative measurement uses the following models as justified
in the literature review: Gronroos’ SERVQUAL model (Gronroos, 1994) to evaluate
CS with the Service Quality dimensions (functional dimensions, Technical dimension
and Corporate Image); ‘Disconfirmation models’ to analyse and evaluate customer’s
desires and expectations both with and without respect to their service provider
(Oliver 1980; Parasuraman et al., 1988) and the MnCSI model to evaluate the over-all
customer satisfaction with service delivery of the UK’s MTNs with and without
29 | P a g e
THEORY
HYPOTHESIS
OBSERVATION
CONFIRMATION
Market Research on Service Quality and Customer Satisfaction 2010
respect to which Mobile Telecom Network customers subscribe to (Positively
Minnesota, 2007).
According to Neuman (2006, pg. 412), “Researchers often combine focus group
with quantitative research, and the procedure has its own specific strengths and
weaknesses”. The strengths are: the lively setting that allows respondents to express
their opinions or ideas freely and interpretation of ideas is facilitated (Neuman, 2006).
This helps in bridging rich ideas and data in a continuing and interactive manner via
which we could have a better understanding of the subject in a bigger view and these
strengths overwrites the weaknesses which are: ‘polarization effect’ and limitation in
the number of topics discussed in a session (Neuman, 2006). Hence focus group
interview is the chosen Qualitative method as the research also includes quantitative
measurement. The focus group interview uses the Delphi technique to refine the
research ideas. This process involves employing a group of people who can contribute
some more value to the research idea (Saunders et al., 2007). The members of the
group were initially briefed about the research idea and were asked to suggest other
important elements to measure the service quality. According to respondents, among
these attributes they consider the balance between quality and cost as the most
important. It was then derived as another dimension to the Gronroos SERVQUAL
model called as ‘Value for Money (VFM)’. This focus group interview lasted for 60
minutes and the details of which is described in Appendix-A.
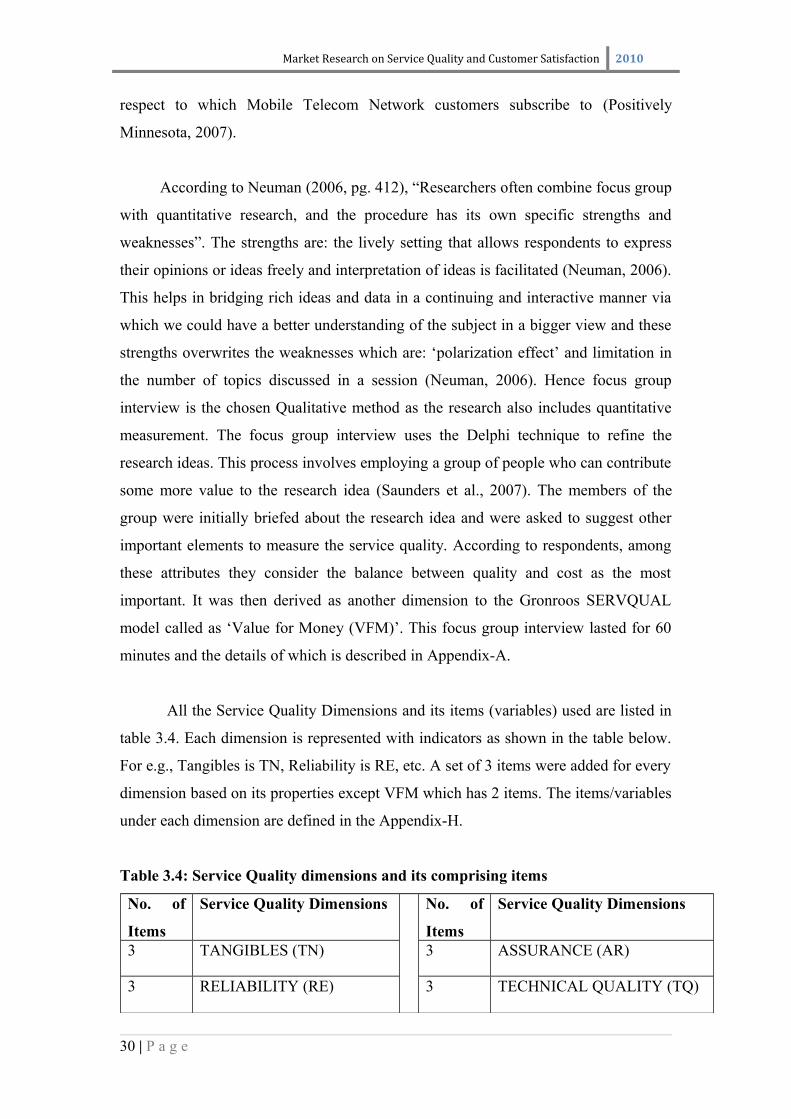
All the Service Quality Dimensions and its items (variables) used are listed in
table 3.4. Each dimension is represented with indicators as shown in the table below.
For e.g., Tangibles is TN, Reliability is RE, etc. A set of 3 items were added for every
dimension based on its properties except VFM which has 2 items. The items/variables
under each dimension are defined in the Appendix-H.
Table 3.4: Service Quality dimensions and its comprising items
No. of
Items
Service Quality Dimensions No. of
Items
Service Quality Dimensions
3 TANGIBLES (TN) 3 ASSURANCE (AR)
3 RELIABILITY (RE) 3 TECHNICAL QUALITY (TQ)
30 | P a g e
Related Documents