7 - 9 M S ET I40 F PICT I W SUM DETERNINATION OF T ES FI i / UNLSIIDTEST CENTER PATUXENT RIVER NO J F CALVERT 03JANE*OISC FW ETRDTRS EHCE()KY. = iuc lA S F E IT C - T N - I ? -l7 lS R F / 9 1 / 2 IN . IEEE."mmmm

Welcome message from author
This document is posted to help you gain knowledge. Please leave a comment to let me know what you think about it! Share it to your friends and learn new things together.
Transcript
7 - 9 M S ET I40 F PICT I W SUM DETERNINATION OF T ES FI i /
UNLSIIDTEST CENTER PATUXENT RIVER NO J F CALVERT 03JANE*OISC FW ETRDTRS EHCE()KY.
= iuc lA S F E IT C - T N - I ? -l7 lS R F / 9 1 / 2 IN .
IEEE."mmmm
1.0 2-8
11 61 111
I .'i lll
g |l-.Ni! .g .' \ % %' ' Illl
0)0
I-
I
1*> 0
~. .9
V. **~
* .' -
~
0
4 *
x I j~
'~r.. -~I-- - ~.,**..-
'.A~ -~.
Ii.
MW
- 'ww "V...,.
... .~. ~ ~%~\WA/ V ;. ~. ~'U. ,.
I I
z- 44
iv v
'X0:
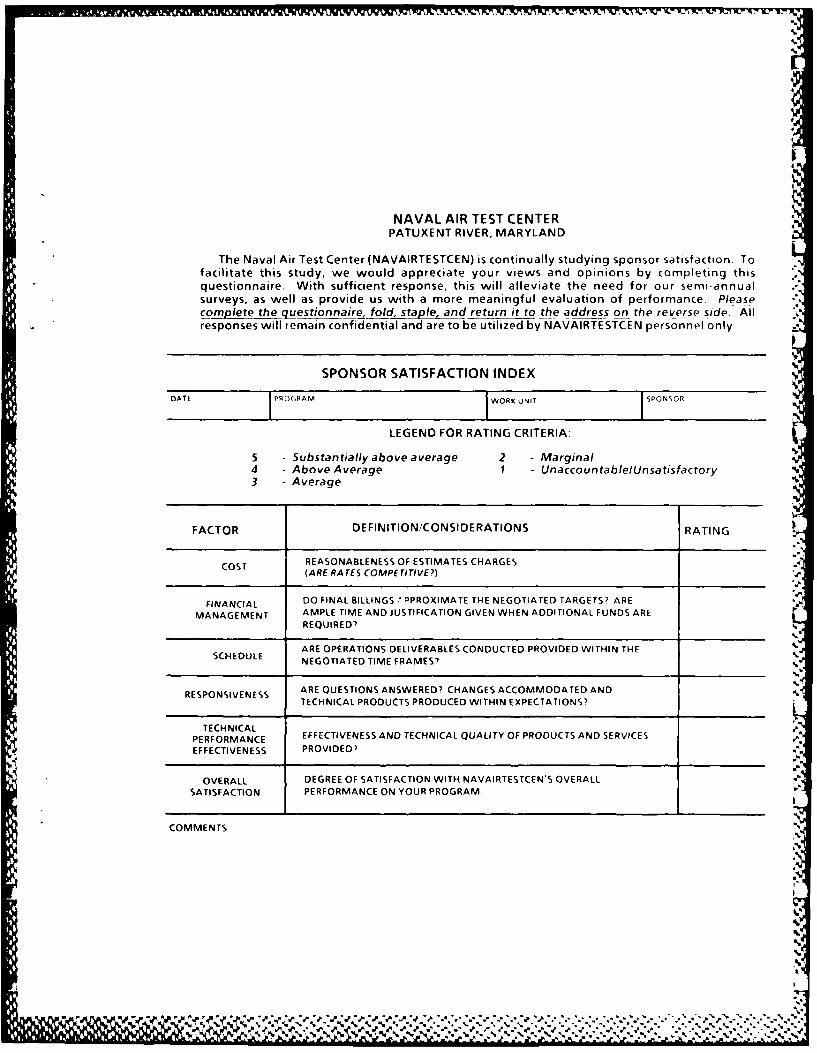
NAVAL AIR TEST CENTERPATUXENT RIVER, MARYLAND
The Naval Air Test Center (NAVAIRTESTCEN) is continually studying sponsor satisfaction. Tofacilitate this study, we would appreciate your views and opinions by completing thisquestionnaire. With sufficient response, this will alleviate the need for our semi-annualsurveys, as well as provide us with a more meaningful evaluation of performance. Pleasecomplete the questionnaire, fold, staple, and return it to the address on the reverse side. Allresponses will remain confidential and are to be utilized by NAVAIRTESTCEN personnel only
SPONSOR SATISFACTION INDEX
DATE '~,A WORK UNIT SPONSOR
LEGEND FOR RATING CRITERIA:
5 - Substantially above average 2 - Marginal4 - Above Average I UnaccountablelUnsatis factory3 - Average
FACTOR DEFINITION/CONSIDERATIONS RATING
COST REASONABLENESS OF ESTIMATES CHARGES(ARE RATES COMPETITIVE?)
FINANCIAL DO FINAL BILLINGS , PPROXIMATE THE NEGOTIATED TARGETS? ARE
MANAGEMENT AMPLE TIME AND JUSTIFICATION GIVEN WHEN ADDITIONAL FUNDS AREREQUIRED
ARE OPERATIONS DELIVERABLES CONDUCTEDPROVIDED WITHIN THESCHEDULE NEGOTIATED TIME FRAMES? %
RESPONSIVENESS ARE QUESTIONS ANSWERED? CHANGES ACCOMMODATED ANDTECHNICAL PRODUCTS PRODUCED WITHIN EXPECTATIONS?
TECHNICALPERFORMANCE EFFECTIVENESS AND TECHNICAL QUALITY OF PRODUCTS AND SERVICESEFFECTIVENESS PROVIDED'
OVERALL DEGREE OF SATISFACTION WITH NAVAIRTESTCEN'S OVERALLSATISFACTION PERFORMANCE ON YOUR PROGRAM.
COMMENTS
,.
e V %A s VS.ne "e e ' 2:
OFFICIAL BUSINESS 111111& EE PAIDPENALTY FOR PRIVATE USE. 6300 DEPARTMENT OF THE NAVY
DOD-316
COMMANDER, NAVAL AIR TEST CENTER(Code CT251 M)
NAVAL AIR TEST CENTERPATUXENT RIVER. MD 20670-5304
- -- -- -- -- -- - - - - - -- -- -- -- --
s a sr NOaa a aa a aapaa - r .Pw
UNCLASSIFIEDSECURITY CLASSIFICATION OF THIS PAGE (Iben Dole Enterod) _________________
REPORT DOCUMENTATION PAGE BFRE COMPRLETIN FOR
REPORT NUMBER 2. GOVT ACCESSION NO, 3. RECIPIENT'S CATALOG NUMBER
4. TITLE (and Subtitle) 5. TYPE OF REPORT & PERIOD COVERED
METHOD FOR PREDICTION AND DETERMINATION TECHNICAL MEMORANDUMOF TAKEOFF PERFORMANCE FOR' VECTOREDTHRUST VEHICLES 6. PERFORMING ORG. REPORT NUMBER
7. AuTmOR(s) S. CONTRACT OR GRANT NUMBER(s) s
MR. J. F. CALVERT
9 PERFORMING ORGANIZATION NAME AND ADDRESS 10. PROGRAM ELEMENT. PROJECT, TASKAREA IS WORK UNIT NUMBERS
NAVAL AIR TEST CENTER A% -1115-255-0-9STRIKE AIRCRAFT TEST DIRECTORATE A511i51 /5-/25-0-9 14--PATUXENT RIVER, MARYLAND 20670-5304
It. CONTROLLING OFFICE NAME AND ADDRESS 12. REPORT DATE
NAVAL AIR TEST CENTER 5 JANUARY 1988DEPARTMENT OF THE NAVY 13 NUMBER Or PAGES
PATUXENT RIVER, MARYLAND 20670-5 304 1614 MONITORING AGENCY NAME II ADDRESS(if different froth Controlling Office) IS. SECURIT'v CL.ASS. (,,[ (h.-i -rrr
UNCLASSIFIED1I8, DECLASSIFICATION DO*04GRAC)IN
SCHEDULE
16, DISTRIBUTION STATEMENT (of this Report)
APPROVED FOR PUBLIC RELEASE; DISTRIBUTION UNLIMITED.
I7, DISTRIBUTION STATEMENT (of the abstract entered in Block 20, if different from Report)
~SUPPLEMENTARY NOTES
19 KEY WORDS (Continue on reverse side if necessary and identify by btock number)
VSTOL TAKEOFF PERFORMANCE
20 ABSTRACT (Continue an re verse side If necesmary and identify by block number)
IYAV-8B3 and AV-8B3 Short Takeoff (STO) test results had indicated that STO techniques for theHarrier 11 could be further optimized, particularly for operations at higher hover weight ratios(1.3 and above). This paper documents a method to predict and determine optimum land-basedSTO performance with minimum flight testing required. The method was applied during thedetermination of the optimum STO performance of the AV-8B3, and is tailored generally toward 4 Sthrust vectored vehicles with rapid thrust vectoring capability. With certain assumptions accounted -
for this approach can also be used in less restricted cases. Emphasis was placed on developing a
DD I oo 1473 EDITION OF INOV 65 IS OBSOLETEUCL SIEDA
SECURITY CL ASSIFICATION OF THIS P AGE '07,ei Dl. Fw-rrr
~~~j~ % %i %* %*%r~~e 41. ?J 1. %" ,v-I%.
UNCLASSIFIED
SE.CURITY CLASSIFICATION OF THIS PAGE(Wh.en Data Encered)
20.
repeatable task terminating with sufficient flight path acceleration at 50 ft AGL. STO testsconducted using the revised STO procedures validated the improvement in STO performance.Changes to the AV-8B flight operations manual were recommended in order to implement therevised STO task.
V %,
Pu
N
6 MCLRIr A SIiA C&I 6N" TkII P&t-We /YGN++r
TM 87-171 SA
SUMMARY
YAV-8B and AV-8B Short Takeoff (STO) test results had indicated that STO techniques for theHarrier II could be further optimized, particularly for operations at higher hover weight ratios(1.3 and above). This paper documents a method to predict and determine optimum land-based STO.performance with minimum flight testing required. The method was applied during the determinationof the optimum STO performance of the AV-8B, and is tailored generally toward thrust vectoredvehicles with rapid thrust vectoring capability. With certain assumptions accounted for this approachcan also be used in less restricted cases. Emphasis was placed on developing a repeatable taskterminating with sufficient flight path acceleration at 50 ft AGL. STO tests conducted using therevised STO procedures validated the improvement in STO performance. Changes to the AV-8Bflight operations manual were recommended in order to implement the revised STO task.
COPYINSPECTED
6
,,
Accesion For /NTIS CRA&
OTIC TAB 0 '.
Unannourced 0Justiftcatiolo - -
BY .... ............ -
Distribution I
Availability Codes
Avail and/orDist Special
'p''p,
.i
F. N u
l , k, ' , ,,",, ,Z,,,,- ,, .,,L .,, . , . . . ., ,. ..., ...-. ,, ... ...... -.. ,'., . .. ..-.. ... .. ...,. ,
Tsr 719Wj~ "1 U~ p. WJ~ i r ~7-Y --- Y 1. Y -W. *'.W -1 -7 I-W 71 77 -*
TM 87-171 SAA
METHOD FOR THE DETERMINATION AND OPTIMILA.TIONOF VECTORED THRUST TAKEOFF PERFORMANCE
J. F. CalvertStrike Aircraft Test Directorate
Naval Air Test CenterPatuxent River, Maryland 20670
T installed gross thrust,time difference between initial and final *
YAV-8B and Av-8B Short Takeoff (STO) test results had conditionsindicated that STO techniques for the Hanier I1 could be further V airspeedoptimized, particularly for operations at higher nover weightratios (1.3 and above). This paper documents a method to V&ef velocity for minimum acceptable a/gV.o takeoff velociryv"'.predict and determine optimum land based STO performance V vertical airspeedwith minimum flight testing required. The method was applied VY velocity for engine thrust vectorng to target e3during the determination of the optimum STO performance of during takeoff runthe AV-8B, and is tailored generally toward thrust vectored V nozzle rotation velocity (same as V,vehicles with rapid thrust vectoring capability. With certain gross weightassumptions accounted for this approach can also be used in less aircraft weight in climbing flight •restricted cases. Emphasis was placed on developing a W D desired weight for weight correctionrepeatable task terminating with sufficient flight path accelerationat 50 ft above ground level. Short takeoff tests conducted using aircraft weight in level flightthe revised STO procedures validated the improvement in STO W I gross weight at initial heightperformance. Changes to the AV-8B flight operations manual W Wh goss weight atina eightwere recommended in order to implement the revised STO task. m uhover weight ratio (aircraft weight divided by
max imumn weight at which the airc-raft can hover'Nfor given ambient conditions)x aircraft c.g. position
Symbl. D c aircraft angle of attack
a net acceleration y flight path angle without wind correction(a/g) D normalized fight path accelerauton for aircraft at flight path angle corrected for wind affects
average aircraft ground roll acceleraonweight W (evaluated at V1/fi2 if assumed constant)
(a/g) L normalize flight path acceleration for aircraft at dynamic coefficient of surace fnctonweight WL O. angle between line of thrust and fuselage
C0 aircraft drag coefficient reference line (thrust vector angle)CL aircraft lift coefficientC aircraft drag coefficient in ground effect P ambient densityDg average acceleratfon from V. to Vt. "C aircraft lift coefficient in ground effect a fmV tV.D aerodynamic drag 1D9 drag evaluated in ground effect IntroductonDM momentum drag (total mass flow rate times This paper develops and presents an arproach to prcd:c:ine
vehicle airspeed) and determining optimum Short Takeoff performance for rapidF the net force acting in the flight path direction thrust vectonng vehicles. STO performance refers to velocin,F average net non-conservative force between Vt and distance required to takeoff, velocity and distance requiredan? occurng at 'QV50 2+V,0 Z]/2) to clear an obstacle, and the velocity at which t-rust Is vectored
height at initial positon during ground roll initiating takeoff Unlike conventionalheight at final position takeoff testing, it is difficult to separate STO testing of vectoredheight or altitude difference between initial and thrust aircraft into distinct flying quahes and performancefinal conditions areas. A repeatable STO task is directly dependent u;'on bothaerodynamic lift aircraft performance and STO technique (,A hich inclu
Laverage aerodynamic lift evaluated in ground climbout as well as takeoff). The approach outined :oreffect predicting STO performance involves opumizat:on of the
L, total lift (aerodynamic and thrust generated lift) parameters relative to lift, drag, thrust, and thiht painM toral mass flowrtacceleration. Optimization also accounts for the require"c.s,M average total mass flow rate through engine for quick and precise attitude capture, atttude control andS wing reference area maximum rate of climb. The deseloped fl:cht test rre fior t,,,Sd integral path distance, ground roll distance determinaton of optmum STO performanceS.(%) estimated percent error in ground roll distance was applied to the AV-8B lamer II aircraft. Method aird pdue to the instantaneous takeoff assumption results are presented herein.S. ground roll distance to velocity for thrust
vectoring Prediction of Short Takeoff Pcforr__ __ _
S£ ground roll distance to takeoffScestimated distance from V. toV1 bctv
S air distance traveled along the flight path to 50 ftAGL Basic performance prediction is achieved hroueh a
S.P ground distance traveled for climbout to 50 ft mathematical analysis of the goveming equations. STOAGL performance should be optimized for full operational capahil:ty %
m aircraft mass within the given performance and handling irrIttions ot theM mass flow rate of air through the engine aircraft concerned. By Identifying the vanables requitrd forT installed net thrust, STO performance prediction, separation of the variahles into
J.
* c -,p
W~
TM 87-171 SA
%task dependent and airframe dependent categories can be Since most runways have little or no slope, Ah is negligible, achieved. The STO task can then be developed accounting for therefore assume APE = 0. Fix the thrust vector angle duringboth performance and controllability. It is important to takeoff at an angle less than 20 deg relative to the velocity vectorremember that controllability greatly affects the airborne distance during the ground roll and assume that momentum drag andrequired to clear a given obstacle, gross thrust are reasonably parallel to the velocity vector (as
assumed in figure 1. however for clearness eJ is shown out ofSr eoP escale). For aircraft with rapid thrust vector capability, thrust
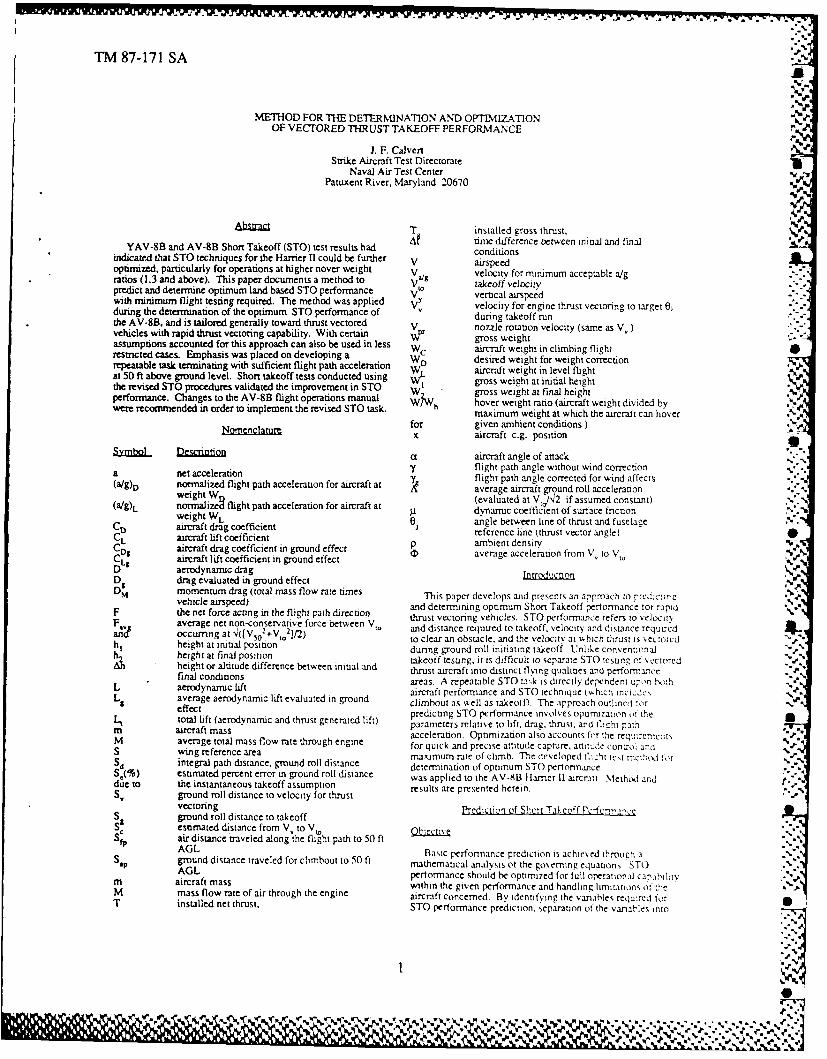
should remain aft for the takeoff ground run in order toThe typical short takeoff profile (figure 1) for rapid thrust maximize acceleration and minimize ground roll distance. At
vectoring vehicles generally consists of the ground roll phase, a thrust vector rotation velocity, thrust would be vectored suchbrief thrust rotation-takeoff-position capture phase, and the that takeoff would occur rapidly with sufficient flight pathclimbout-acceleration-transition phase. Vectored thrust acceleration. For slow vector thrust capability (such as tilt rotorminimizes ground roll distance to takeoff by augmenting wing aircraft), 0 would most lkly remain fixed throughout thelift with thrust lift- This concept has been adopted for use in takeoff. lIY0 does not remain below 20 deg, then thecertain land based, shipboard, and restricted area operations, assumption that momentum drag and gross thrust are parallel to
the velocity vector is no longer valid. In that case, the net thrustterm needs to be separated into the momentum drag and grossthrust components such that the momentum drag is accountedfor in the direction of the aerodynamic drag and the gross thrustis accounted for in the vectored thrust direction. This differs
" ' .. from conventional takeoff and landing aircraft where the thrustW remains fairly parallel with the velocity vector.
Integrating equation (1) using the above assumptions, andrecalling from basic aerodynamics that drag and lift are equal to
Figure 1 Typical Short Takeoff Profile 1/2pV 2SCD and l/2pV 2SCL. respectively, the followingequation for ;round roll distance to takeoff is obtained:
Takeoff Ground Roll Distance Prediction Sd=1W/[pgS'(tC -C )] }Ln{1+ 2 [(pS/2W). o
Ground roll distance can be predicted by applying the (CLS - C+a )]/l(T/W)°(cos(Oj+t) + I.Lsin(OJ+a)) - i] I (2)work-energy relationship. For basic terms this relationshipstates Equation (2) additionally assumes takeoff occurs rapidly after
thrust vectoring. A good estimate for time between V. to VOJ(work) = J(energy) obtained from flight test is approximately 1 sec for 20.000 to .JF.ds = AKE + APE 30,000 lb rapid thrust vectoring jet aircraft. The difference in Z
takeoff distance resulting from the instantaneous takeoff '--where F = non-conservative forces acting on the body assumption can be surveyed in order to determine the validity of
APE = change in potential energy from initial state to final this assumption for a given case.stateAKE = change in kinetic energy from initial state to final Aircraft acceleration will decrease upon thrust vectoringstate mostly due to the reduction in thrust acting in the axial direction.
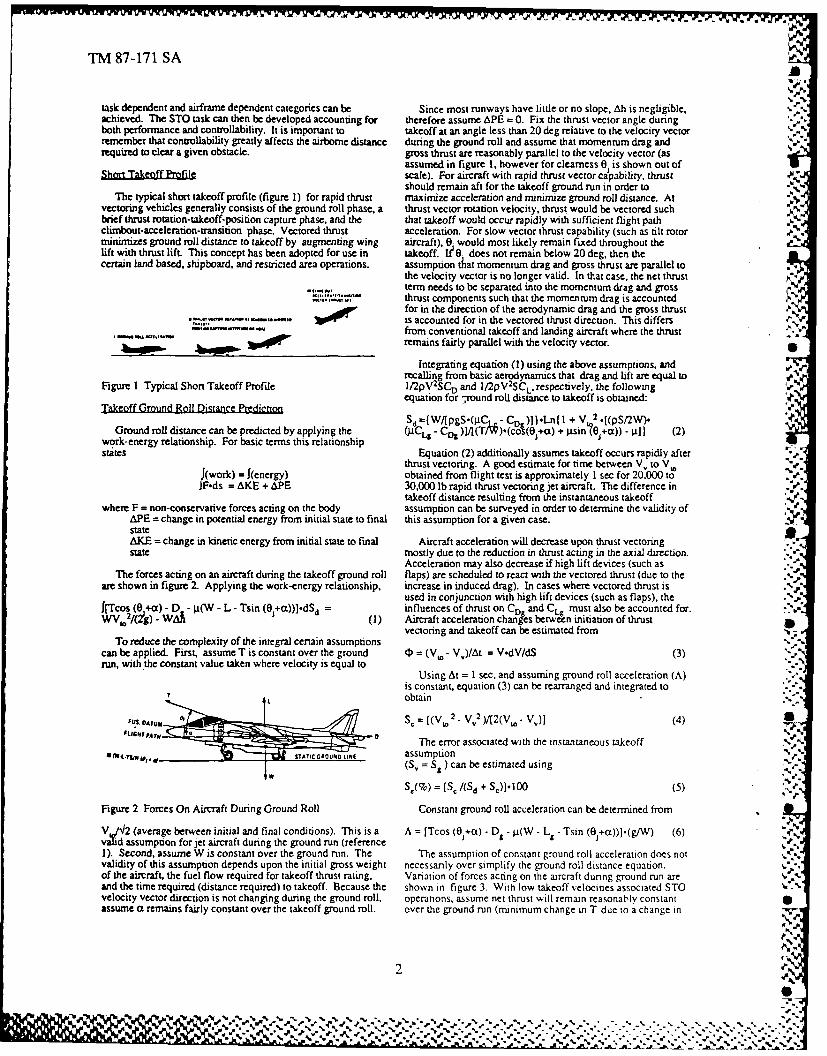
Acceleration may also decrease if high lift devices (such asThe forces acting on an aircraft during the takeoff ground roll flaps) are scheduled to react with the vectored thrust (due to the
are shown in figure 2. Applying the work-energy relationship, increase in induced drag). In cases where vectored thrust is %used in conjunction with high lift devices (such as flaps), the J.
J[Tcos (0 +at) - D - j±,W - L - Tsin (OJ+a))]odSd = influences of thrust on CD8 and CL8 must also be accounted for.WV. 2/(Yg) - WA (I) Aircraft acceleration changes between initiation of thrust
vectoring and takeoff can be estimated from NTo reduce the complexity of the integral certain assumptions "-
can be applied. First, assume T is constant over the ground 0 = (V,. - V.)/At = V.dV/dS (3)run, with the constant value taken where velocity is equal to
Using At = I sec. and assuming ground roll acceleration (A)is constant, equation (3) can be rearranged and integrated toobtain
,Sc = [(V, 2 . V 2 )/[2(V,. V.)] (4) a_ asmpioThe error associated with the instantaneous takeoff
t S LTTSTI GROUND LINE assumption(S' = S8 ) can be estimated using
S = [Sc /(Sd + SC)].100 (5)
Figure 2 Forces On Aircraft During Ground Roll Constant ground roll acceleration can be determined from
V J2 (average between initial and final conditions). This is a A = [Tcos (0 +x) - Dg- p(W- Lg- Tsin (6 +t))].(gfW) (6)vid assumption for jet aircraft dunng the ground run (reference£T.g1). Second, assume W is constant over the ground run. The The assumption of constant ground roll acceleration does notvalidity of this assumption depends upon the initial gross weight necessarily over simplify the ground roll distance equation.of the aircraft, the fuel flow required for takeoff thrust rating. Variation of forces acting on the aircraft dunng ground run areand the time required (distance required) to takeoff. Because the shown in figure 3. With low takeoff velocities associated STOvelocity vector direction is not changing during the ground roll, operations, assume net thrust will remain reasonably constant Sassume (a remains fairly constant over the takeoff ground roll. over the ground run (minimum change in T due to a change in
%%
_A % % %
A. .|S- -. ~ * -b h - . . . . . . . . . .
TM 87-171 SA
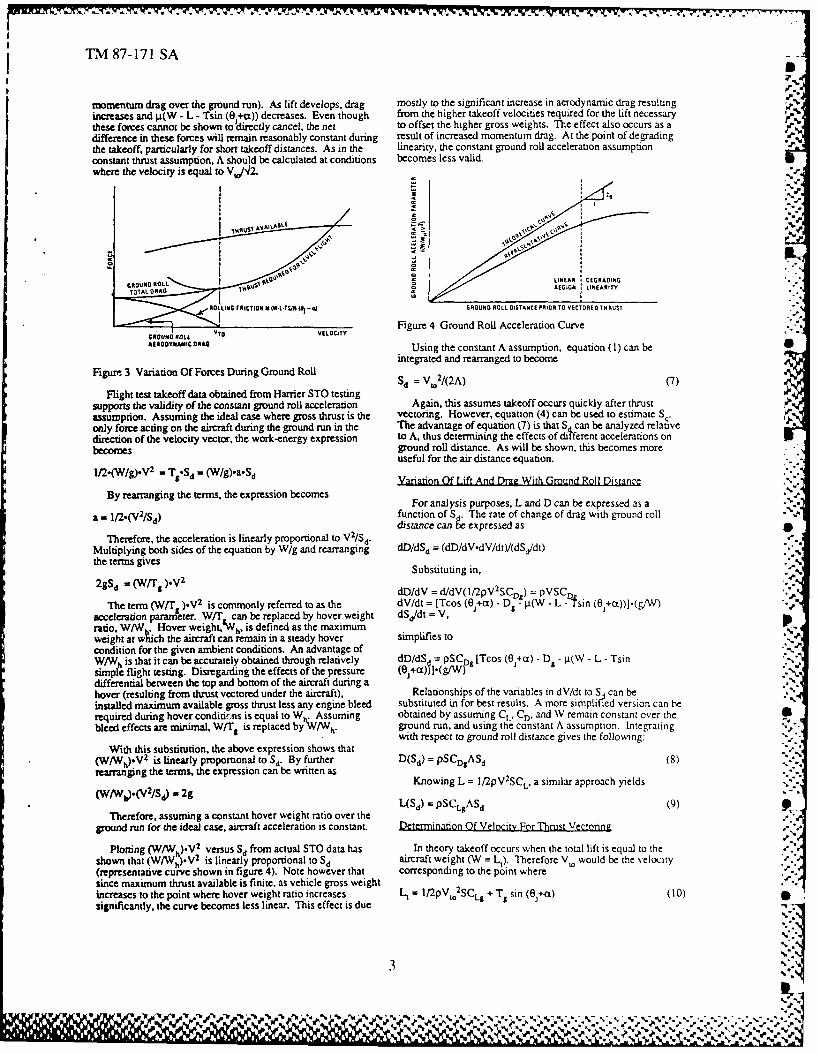
momentum drag over the ground run). As lift develops, drag mostly to the significant increase in aerodynamic drag resulting .1,,
increases and g.(W - L - Tsin (08-s-)) decreases. Even though from the higher takeoff velocities required for the lift necessarythese forces cannot be shown to directly cancel, the net to offset the higher gross weights. The effect also occurs as adifference in these forces will remain reasonably constant during result of increased momentum drag. At the point of degradingthe takeoff, particularly for short takeoff distances. As in the linearity, the constant ground roll acceleration assumptionconstant thrust assumption, A should be calculated at conditions becomes less valid.where the velocity is equal to V,/q2. ,
""S -VA- 1' 0
.5-.
GROUND ROLL SA LINEAR DEGADING
ROLLING FRICTION M WL-TIM Na - 1 GROUND ROLL DISTANCE PRIOR TO VECTOREO IHRUST
Figure 4 Ground Roll Acceleration Curve -G ROUND ROLL VtO VE LOCITY •*"
ARNOOYNAMIC DRAG Using the constant A assumption, equation (1) can beintegrated and rearranged to become
Figure 3 Variation Of Forces During Ground Roll S, = V2/(2A) (7)
Flight test takeoff data obtained from Harrier STO testingsupports the validity of the constant ground roll acceleration Again, this assumes takeoff occurs quickly after thrustassumption. Assuming the ideal case where gross thrust is the vectoring. However, equation (4) can be used to estimate S..only force acting on the aircraft during the ground run in the The advantage of equation (7) is that S can be analyzed relativedirection of the velocity vector, the work-energy expression to A, thus determining the effects of different accelerations onbecomes ground roll distance. As will be shown, this becomes more
useful for the air distance equation.1I2"(W/g)V 2 = TitSd = (W/g).aSd Variation Of Lift And Dra, With Ground Roll Distance . -
By rearranging the terms, the expression becomesFor analysis purposes, L and D can be expressed as a
a = 12"(V 2/Sd) function of S The rate of change of drag with ground roll ",distance can be expressed as
Therefore, the acceleration is linearly proportional to V2/Sd. .Multiplying both sides of the equation by W/g and rearranging dD/dSd = (dD/dV.dVdt)/(dSdt).the terms gives
V2 trsSubstituting in,2 gSd = Wit dD/dV = d/dV(1/2pVSCD) = pVSC
The term (WT ).V 2 is commonly referred to as the dV/dt = [Tcos (8 +r) - D 5W- L -fsin (0acceleration parameter. W/T can be replaced by hover weight dS,/dt =V. 1 g/
ratio, W/W . Hover weight,W h , is defined as the maximumweight at which the aircraft can remain in a steady hover simplifies tocondition for the given ambient conditions. An advantage ofW/W is that it can be accurately obtained through relatively dD/dS d = pSC0 z [Tcos (0+at) - D1 - lg(W - L - Tsinsimple flight testing. Disregaiding the effects of the pressure (0+))l.(g/W) "..%,differential between the top and bottom of the aircraft during ahover (resulting from thrust vectored under the aircraft), Relationships of the variables in dV/dt to S, can beinstalled maximum available gross thrust less any engine bleed substituted in for best results. A more simplified version can berequired during hover conditions is equal to W Assuming obtained by assuming CL, CD, and W remain constant over the •bleed effects are minimal. WIT 1 is replaced byW/W h. ground run, and using the constant A assumption. Integrating
with respect to ground roll distance gives the following:With this substitution, the above expression shows that
(W Wh)5V2 is linearly proportional to Sd. By further D(Sd) = PSCDgASd (8) '-
rearranging the terms, the expression can be written asKnowing L = I/2pV 2SCL, a similar approach yields
(W/Wb).(V 2/Sd) = 2g L(Sd) = pSCLAS d (9)
Therefore. assuming a constant hover weight ratio over theground run for the ideal case, aircraft acceleration is constant. Determination Of Velocity For Thrust Vectonnri
Plottng (W/lW )-V2 versus Sd from actual STO data has In theory takeoff occurs when the total lift is equal to the ..,shown that (WAV'h).V2 is linearly proportional to Sd aircraft weight (W = L1). Therefore Vt, would be the velocity'-.,(representative curve shown in figure 4). Note however that corresponding to the point where"%"since maximum thrust available is finite, as vehicle gross weight :-'increases to the point where hover weight ratio increases I-t= I/2pVto2SCL~ + Ttsin (O,+co) (10) 5significantly, the curve becomes less linear. This effect is due £.x
5,.-
3e
'N .'N5- *.,%'%..
V,.%V').at
C"%t
oin:
TM.87-171 SA k
for so given T resulting from a takeoff power throttle recall that the determination of the takeoff velocity (a directsetting. Becauselhrust vector angles used for takeoff will be relation with V.) is a function of the STO technique as well aslarge, the net thrust term is broken into the gross thrust and the lift and thrust performance of the aircraft. While addressingmomentum drag terms due to the respective differences relative constraints due to the STO technique, equation (11) can be usedto the flight path. For drag bookkeeping purposes, momentum to estimate a takeoff schedule prior to actual STO testing.drag is commonly resolved in the direction of the velocity vector(perpendicular to 1,). If the STO technique is an attitude takeoff task (i.e., thrust is
vectored at V, and takeoff occurs shortly afterwards withoutTakeoff velocity for determining the ratio of wing lift to rotation of the nose (as is usually required with conventional
thrust lift is very important. If minimum wingbome lift is used, takeoff aircraft), then ground run pitch attitude can bea larger e is required, thus allowing less thrust for acceleration substituted into equation (11) for a.during transition from semijetborne flight (flight requiring bothaerodynamic and thrust generated lift) to wingbome flight (flight Prediction Of Ground Distance Reouired To Clear An Objectrequiring aerodynamic lift only) during climbout. Also, if Dunno Takeoff Air Phasetakeoff velocity is such that maximum lift available from thewing is required for W = L1, angle of attack will be large In order to determine the total distance required to clear ancreating additional induced drag and a potential stall hazard. obstacle during a STO, the air phase distance must be accountedTherefore, the balance of wing lift and thrust lift is critical not for separately from the ground roll phase distance due to theonly for takeoff, but for climbout characteristics as well. difference in the forces acting on the aircraft.
The key to STOL operations is not necessarily to takeoff in The free body diagram for an aircraft in flight is shown inthe minimum distance required, but to takeoff and climb out figure 6. Applying the work-energy relationship gives theabove some height in the least possible distance while following expressionmaintaining adequate flight path acceleration for continuing theclimb to desired altitude. If the wing lift to thrust lift ratio is not J[T cos (6+c) - D- DMI-dSd- ,Vzh2 - W h1 ) = f(W/g).VdVoptimum for the STO technique, the pilot may takeoff in the (12)minimum distance required, but he may significantly increasethat distance trying to accelerate and climb above an obstacle. The subscript 1 defines the datum at the takeoff position as 0The STO technique also has a direct impact in optimizing the ft above ground level (AGL), and subscript 2 is at 50 ft AGL"T) task for minimum distance required to clear a given height level. If the weight change between takeoff and 50 ft AGL is
-. -Pa, ritaining a reasonable flight path acceleration. assumed negligible, then gross weight is a constant.
Another variable impacting STO performance is engine Applying this assumption, equation (12) can be simplified tooperating limitations (temperature, RPM, etc.). Takeoff velocity 2eshould allow flight path acceleration to minimize the time J[T Cos(", +a) - D - DMl-dSd = [W/(2g)],[V50 - V' 2 - 100g]required to adequately perform the STO task such that engine (13)life is not reduced and/or thrust reduction does not occur due toreaching or exceeding engine operating limits during climbout Ideally, for the determination of flight path distance (S,)and transition to wingbome flight. required to clear 50 ft AGL. relationships of D. D.,. 0., ano a
to Sa between takeoff and 50 ft AGL would be required forThe velocity at which a pilot vectors thrust in order to initiate solving equation (13). These variables are directly related to
takeoff is V,. Assumptions can be made to simplify equation flight path acceleration, and are therefore critical relative to STO(10) allowing the development of a thrust vector velocity performance optimization.schedule relating takeoff velocity with thrust available, thrustvector angle, and gross weight for some predetermined STO As shown for the ground roll case, certain assumptions cantechnique. Substituting in L1 ? W at takeoff, replacing W/T. be applied to equation (13) in order to develop a more simplifiedwith W/Wh, and rearranging the terms gives form. Because the optimization of STO performance will result
in low, but acceptable flight path acceleration, and as a result of(V, /W) Z ",[2.(1 - [I/(W/Wh)).sin (0+a))/(pSCL )] (11) the position capture cimbout task during the air phase portion of
the STO, assume a, CD, and DM remain fairly constant over theThe term VJIW is termed the velocity parameter. Equation cimbout to 50 ft AGL. Also, assume that Tg will not vary
(11) shows that velocity parameter is a function of only hover during climbout. Furthermore, assume that the thrust vector %weight tio for a given STO technique where thrust is vectored angle is constant throughout the climbout. If acceleration isto the same B,. and t at takeoff is consistent for all gross adequate, the pilot may begin to vector the thrust aft and
weights (i.e.. target 0 and a are a result of the STO technique). transition to wingbome flight prior to 50 ft AGL. Relative toFrom this, a schedule depicting velocity for thrust vectoring can available flight path acceleration for the given climbout angle,be estimated and presented as VJ'4W versus W/W, as shown in the constant 0, assumption during climbout is the worse casefigure 5. If takeoff was assumed to occur at the instant that situation. However, if the pilot transitions to wingbome flightthrust was vectored. V, could be replaced with Vt.. However, too soon, the aircraft could begin to descend due to the deviation
from optimum L, conditions.
.. 4, .] , , -Since all the variables within the integral are assumed to befairly constant throughout the climb, the non-conservarte torcesare now presented as
- ~F, g = [Ts Cos (0 +ao) - D - DMI,
As in the ground roll equation, the parameters assumed to beconstant over the air phase should be evaluated at averageconditions occurmng at "([V 5 0
2 + V '12) Iie gratine and
.OVa *'G,"r R*rO -*W.. rearranging equation (13) gives the ("llo ing exsression
Figure 5 Thrust Vector Rotation Velocity Schedule
14
44
Np
%' % %f 5, % % %.,,\%.% % % %~ I
TM 87-171 SA.'
S= [W/(2gF, )].[V' 2 - - 100g] (14) Therefore.
Therefore, the ground distance covered during climbout is D/L = IT8 cos (0+a) - Wcsin y- D ,[ Wccos 0".#
-S .cosy s (15) T si !Rearranging and solving for tan y gves
For no wind conditions, the angle y, can be calculated from R-sf y
arcsin (V/Vt) = Ys (16) tan y = ([T9 cos (0 +a) + (D/L).T& sin (Oj+2) - Ds21) %. WcCOS Yl - (D/L) [(20) ,
Applying equation (15) to equation (14), the following is ,1D/e )obtained: Note that D/L can be replaced by Cl, CL ,
S = [W/(2gF,,g )]-[V 5 02
- V. 2 _ 100g]-cos yg (17) Summing the forces aong the flight path for a levelacceleration (./= 0) gives _
The simplified version of the air phase distance equation is a ( )
useful for minimizing S relative to the variables contained in IF = T cos (9 +a) - D - D, = ( / g ) . a (21), In other words the variables governing F4 . can be I= T si (8 +c) + L
manipulated within the given constraints of the a2raft in order Y 9 - L - L
to minimize the distance required for climbout. Therefore,
Environmental Effects on STO Performance Prediction D/L = [Ts cos (01+ct) - WL .(a/g) - DJ /IWL cos - sin
Ambient conditions can greatly affect takeoff performance. (i),
Because the equations predicting takeoff distance and distance Rearranging and solving for a./g givesrequired to clear 50 ft AGL are derived from the work energyrelationship, they assume that airspeed is equal to inertial ground a./g = (IT cos (0 +ct) + (DIL).T1 sin (6 +c) - Dvelocity (no wind conditions). The equations also have not - (D/L5) = a/J (23) ,accounted for any runway slope. In addition, the distance L
calculated is for some given density condition which affects Because the lift and drag are different for climb and level %
thrust, lift and drag. Takeoff performance can be adjusted to flight, the relationship between the climb velocity and level flightany ambient conditions using empirical methods. The velocity needs to be established in order to determine thecorrections are not within the scope of this paper; however, velocity associated with the level fight a/g. From equationsreference 2 discusses how to correct takeoff performance to (19) and (22) lift can be expressed asdesired conditions relative to environmental effects.
LC =Wccosy -T sin (0 +a)=( V 2SCL)Relationship Of e Flight Path Acceleration Parameter To STO = WL- sin L)
Performance hiOf Th=Rh WLL T.si t,+) =(l12PVSCI
So for W = Wcos y, and as;uming p, Tg , and S to beThe most important aspect of the STO task is maintaining the same for 5oth the climb and level flight situatin, then
acceptable flight path acceleration during climbout. It will beshown that when performing a STO at a W/Wh below the Lc =L. Therefore.W/Wh for design optimum STO task conditions, a/g will be C C - Therefore,above acceptable conditions. At some WIWh above the W/Wh % ii = L erefore,for design optimum STO task conditions, a/g will fall below V_ = _ Therefore.acceptable conditions. The W/Wh for which a/g becomes Dc = DL. Therefore,unacceptable can be determined by comparing the velocity (D/L)c = (DIL) L. Therefore.required for the climbout task with the velocity required for DMc = DML.minimum acceptable a/g (dictated by the given STO technique).The following paragraphs outLne the flight test technique Thus, the only difference between equations (20) and (23)utilized in predicting the W/Wh for which a/g becomes right of the equal sign is the aircraft gross weight term in theunacceptable for the design optimum STO technique. divisor. The flight paih angle obtained during constant airspeed
climb tests can be related to level flight acceleration if \VL =Flight paih acceleration can be determined from onstant Wccos y. The relation can be wNoiter by
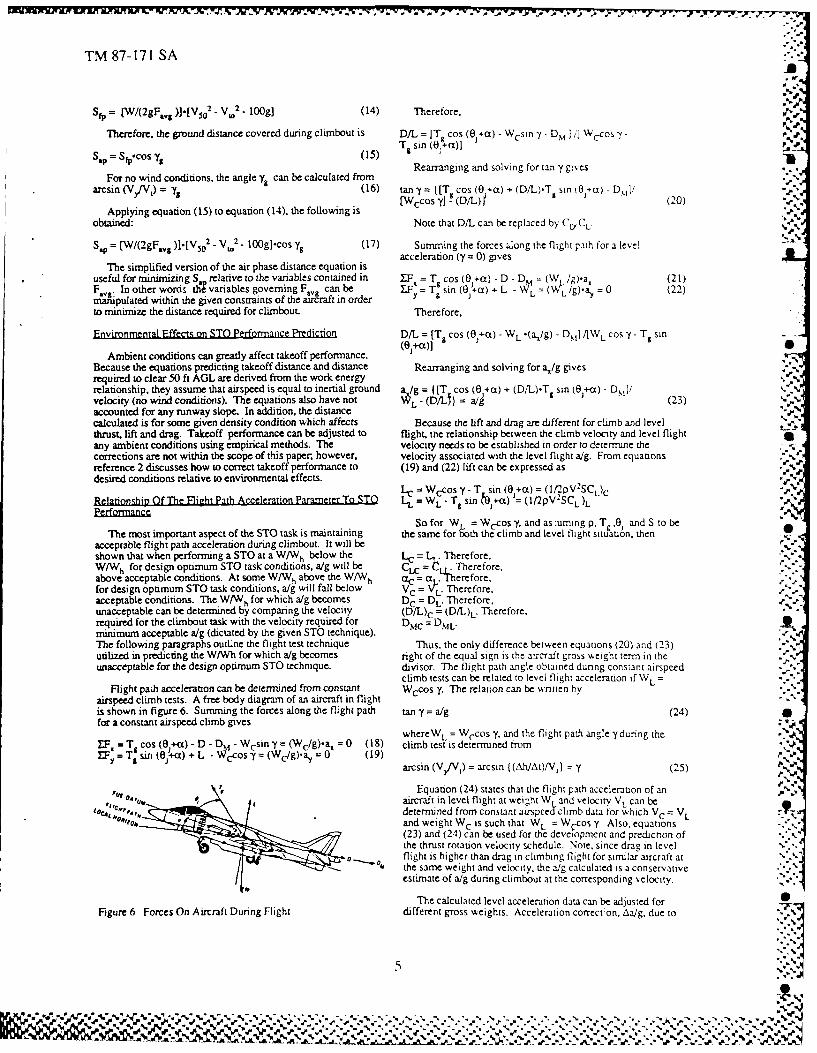
airspeed climb tests. A free body diagram of an aircraft in flightis shown in figure 6. Summing the forces along the flight path tan y = a/g (24) •for a constant airspeed climb gives
whereWL = Wccos y, and the flight path angle yduring theF =T os (Oj+(t) -D-D -Wcsin y = (Wc/g).a = 0 (18) climb test is determuned from
TIFl, = T sir. (0+(X) + L- Vcos = (Wc/g),a)= 0 (19)arcsin (V/V) = arcsin ((AhIAt)/V) = y (25)
Equation (24) states that the flight path acceleration of an
aircraft in level flight at weight W and velocity VL can bedetermined from constant au-speedclimb data for which Vc = Vt_
and weight WC is such that WL = W cos y. Also, equations(23) and (24) can be used for the development and predicnon of .'the thrust rotation velocity schedule. Note, since drag in level
N flight is higher than drag in climbing flight for similar aircraft atthe same weight and velocity, the a/g calculated is a conservativeestimate of a/g during climbout at the corresponding velocity.
The calculated level acceleration data can be adjusted for 0Figure 6 Forces On Aircraft During Flight different gross weights. Acceleration correct:on, Aa/g, due to
5lo. .04, J.w
- -"I It/' ." I,.,W'r , " l- " % % %% " ".". , . %". . " % % " % ".%. % % %% - %% % % 'o '% .%
-~~~ ~~~~~ b. 6 . - . . . . - - - - - - -
TM 87-171 SA
weight correction, AW, can be written as For a given aircraft, it can be shown from aerodynamic
AW = W-WL theory that.(afg)L D/L = f(ct, Mach Number. Reynolds Number) U
Therefore, Since this problem is restricted to low speed flight, anA(ag) = {[T cos (8+) + (DIL).T sin (6+a) -D] - incompressible fluid at some constant ambient density is(D/L)}L- {fT cos (+ct) + (D/L)T sin (0 +a) - DM/W- assumed. Therefore D/L can be expressed as
(D/L))D (26) D/L = f(Rt, V, x)
Constant airspeed climbs at different weights have different andangles of attack and momentum drag at the same thrust setting.If weight corrections are small (:15%), then it is not f(W, V)unreasonable to assume that the angles of attack for the given ""-"and desired weight conditions are equal. Therefore V is Substituting into equation (32) and assuming 01 is constantassumed approximately equal to VL. consequently, (D/e)D is letsapproximately equal to (D/L)L and (DM)D is approximately requal to (DM1 )L. Although the desired weight condition has the a = f(Tl ,V, g, DM ,W. x)same angle of attack, thrust setting, and approximately the same £
velocity as the original condition, an algebraic difference in a/g Since W = mg and DM = MV, level flight path accelerationresults because the relative pitch attitude changes due to the data from constant airspeed climbs can be expressed asdifference in weight (i.e., because pitch attitude is equal to thesum of ax and y, the different pitch attitude produces a change in a = f(Tg V, g, M, m, x) (33)y, which in turn changes a/g). Applying the above assumptions ,to equation (26). Equation (33) can be defined asA/gT - [(W - W )I(W DW t)]. {cos (0+a) + f(a. T . , g, M . m, x) = 0 = f( 7E 1. x, n. n )
(D/L)siA (Bea)} (27)
Recall again that D/L can be written as CC/CL. Note also that where Vt gf(T ,V ga)T .Vb.g.atsome cases may constitute a further simplification of equation X2 f( 5 V g0 x) f T *Vb .gc . .'(27 t 'C =f(T'eg.V, 9, X ) = T1..V 'V N k
(27) to ij4 g, M) = j..Vb.g.M1
- T '[(W - W)/(WDWL)] For nt = TS -Vb. g'. at , the non-dimensional expression I ,.
The difference between VD and VL (resulting from the can be writen Is
weight change and constant angle of attack assumption) can be nj = [MLt2]a.[Lt'l]b.[Lt2]c.[Lt 2]t = M°Lt 0 (34) 0calculated. Solving equation (19) for T , substituting into -equation (18), rearranging the expression and applying the Therefore.assumptions used in developing equation (24) shows .''
M0 O=a -VL2
= (W -[I - tan y .tan (0+a)] - DMWtan (Oj--t)/[(C 0.tan 10 0 = a + b + c + I(6i +a) + (I/2)pS = Vc (28) to 0=-2a-b-2c-2
Doing the same for the desired weight condition yields Solving for a, b. and c, and inserting the values back into
VD2 - (W -[I - tan y.tan (0+c)] - DM.tan (6i+ac)}/[(CD.tan equation (34) gives
(6,-a) + C3.(1/2)pS] (29) x, = a/g
Dividing equation (28) by equation (29) and applying Doing the same for the other three non-dimensional variablesequation (24) produces yields
(VL/V )2 = (W /WD )([Il - (a/g) -tan (0 +a)] - D -tan X aig(6 +ct)-}{[1 - ((a'g)L + A(a/g)).tan( +ct) -'DM.tan (O+a)]} I= aer wL/T£
(30) " gx/V£2 "
Applying the pr'-vious assumptions valid for a small weight X4 £ VL DM/Tcorrection allows So.
I - (I - (a~g)-tan (0.+a) - D -ta ("+a))/(' I ((a/g) L + f(it it 2, (2 it) = 0 = f(a/g, WL/Tr gx/VL2 , DMT) .A(ag)).tan ( r+) - 6 -tan +a))
Therefore, Therefore,
VD= VL"(WD/W L ) = VC"!WD/(Wcos y) (31) a/g = f(WL rT', gx/VL,2 DM/T 5 ) (35)
If the aircraft is further constrained to a constantThe variables used to express a/g can be collected as configuration, then the following expression can be written due .44
independent, non-dimensional parameters in order to better to the fact that cWg postion is directly related to gross weight.evaluate aircraft performance. From equation (23)
a = f(T 01.a, g, D/L. DM, W) (32) x= f(W) =f(m. g)
0.
S.p.?eN%
. . . . I N ", I-.
%0 *-- 1 '-
% %.,
TM 87-171 SA
For this case, W varies only with the fuel state of the vehicle. Optimum STO PerformanceThe non-dimensional parameter, x3, can be rearranged using x
f(W) by substituting in m for x. noting that g is already edictioaccounted for, such that the dimensional velocity parameter(previously defined) is obtained as As discussed earlier, optimum STO performance is governed
by minimum acceptable a/g availableduring the STO tsk.it3' = VLP/W L Equations (39) and (41) formulate the approach to opumizng
STO performance, and determining W/Wh for which a/gTherefore. a/g can be expressed as becomes un,,.ceptable.
a/g = fWL/Tg, VL/-4WL, DM/T (36) To maximize STO performance, an engineer can manipulateand fix the key variables in equations (4). (7), (11), (17), (23)
Assuming changes in DM /T. to be negligible over the range and (40) as necessary in order to aid in the development of theof velocities involved, the expression can be further reduced to initial thrust vector velocity schedule for optrnum STO
performance. Equations (2) and (13) could then be used toa/g = f(VLiTI, VL/qW L) (37) predict the associated distance performance. Again, recall that
STO performance is directly influenced by handling qualities asTherefore, a/g is primarily a function of thrust to weight ratio well. Therefore, the variables in the above mennoned equations
and velocity parameter. For a given minimum acceptable a/g would also be constrained by the requirements of the STO taskand recalling the concept of the hover weight ratio, equation (37) (i.e.. adequate acceleration for climbout. task repeacabiy,,can be written as reduced complexity, and minimum pilot workload). The
average pilot must be able to execute the STO task with(VojqW) = )= f(W/W ) (38) consistent results without the complexity of the task being
overwhelming. When the variable combinations of the derivedSetting the Kollsman window of the test altimeter to 29.92 in takeoff equations are set such that maximum STO performance
Hg prior to constant airspeed climb tests allows obtaining the is achieved relative to the chosen STO technique, predicted STOstandard day graph of VWS p4W versus alg from test day data of performance is considered optimized.V.I t/W versus a/g plotted in terms of test day equivalentairspeed. Variations in a/g due to differences in engine thrust However, the variable combinations for optimumresulting from ambient temperature and pressure effects ae performance will change with W/Wh. In order to reduce theaccounted for due to plotting a/g data relative to W/Wh. As complexity involved in optimizing performance for everyusual, for best results tests should be performed as close to possible condition, the STO task is designed along with thedesired conditions (temperature, pressure, weight, etc.) as constraining variables for operational conditions most likelypossible. encountered during the mission of the vehicle. For off-design
conditions, the task remains constant (reducing operationalRelationship Of Climbout Task With STO Performance complexity) until performance degrades below acceptahle
conditions. At this condition, selected parameters pertainingEarlier, equation (11) showed that takeoff velocity was directly to vehicle performance can be vaned in order to maintain
related to the STO task by the best possible STO performance for the determined STO task.Because the vehicle is performance constrained by the engine
(VplW) ? 1t(2.(l - (l/(W/Wh)l]sin (@l+cr))/(PSCL )] (11) and aerodynamically constrained by geometry, off-designperformance can be optimuzed by changing the target engine
For a given optimum STO technique, equation (11) becomes thrust vector angle. In order to optimize aircraft handlingqualities, longitudinal mm setting for takeoff is vaned to obtain
(VV/NW) = f(W/Wh) (39) the best aircraft response for quick takeoff upon thrustvectoring, and precise attitude targeting and control dunng
Using equation (19), lift during the climbout phase of the climbout.STO is expressed asL - (W/g)ay + Wcos 7 - T. sin (e+at) = (/2)pV2SC L Dtria
Unlike conventional takeoff testing, it is difficult to separate
By rearranging the terms and substituting in W/Wh, the STO testing of vectored thrust aircraft into distinct fl.ingvelocity during the climbout task can be expressed as qualities and performance tests. The repeatable STO task is
directly dependent upon both aircraft performance and STO(Vt 4W) : .412.((ay /g + cos Y) - [l/(W/Wh)]'sin (01+ct))/ technique (which includes climbout as %ell as takeoff). In order(pSCL )] (40) to achieve repeatability of optimum STO performance, the STO
task must optimize aircraft performance relative to lift, drag.The STO task profile defined climbout at a constant attitude thrust and acceleration, and at the same time balance in the
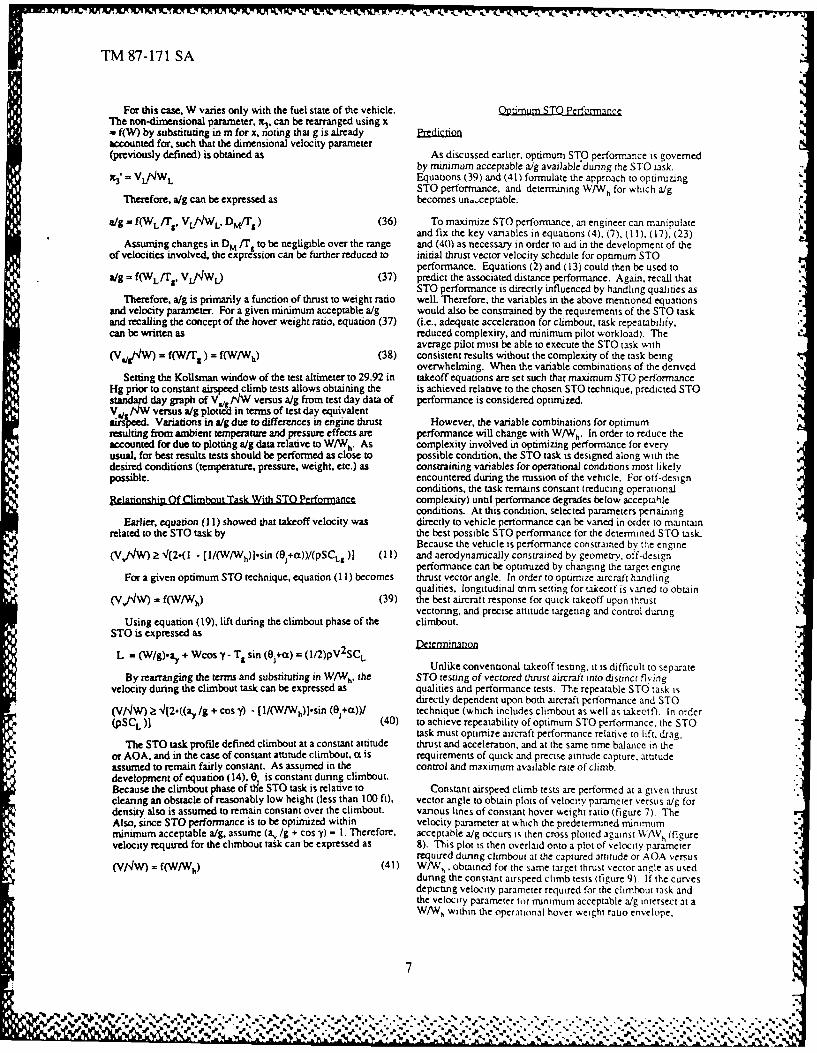
or AOA. and in the case of constant attitude climbout, ax is requirements of quick and precise attitude capture, attitudeassumed to remain fairly constant. As assumed in the control and maximum available rate of climb.development of equation (14). 0 is constant during climbout.Because the climbout phase of t&'e STO task is relative to Constant airspeed climb tests are performed at a given thrustclearing an obstacle of reasonably low height (less than 100 ft), vector angle to obtain plots of velocity parameter versus a/g fordensity also is assumed to remain constant over the climbout. various lines of constant hover weight ratio (figure 7). TheAlso, since STO performance is to be optimized within velocity parameter at which the predetermuned minimumminimum acceptable a/g. assume (a, /g + cos y) - 1. Therefore. acceptable a/g occurs is then cross plotted against W/Wh (figurevelocity required for the climbout task can be expressed as 8). This plot is then overlaid onto a plot of velocity parameter
required dunng climbout at the captured attitude or AOA versus(V/I/W) = f(W/Wh) (41) W/V,., obtained for the same target thrust vector anle as used
during the constant airspeed climb tests (tigure 9). 1I the curvesdepicting velocity parameter required for the climbout task andthe velocity parameter for munimum acceptable a/g intersect at aWAV, within the operational hover weight rauo envelope.
7
%' ' *.P .% % ~ ' ~',' " 1 " % " % " %,",", " • %". .o% % . .,. " % % .. . . . . .. ,% ., , . "
,-. p
TM 87-171 SA
depicting velocity parameter required for the climbout task(relative to the new O ) and the velocity parameter for minimum
WAN," acceptable a/g intersect at a W/W still within the operationalhover weight ratio envelope, acceleration is no longer acceptablefor the given optimum STO technique utilizing this new 0.
o Therefore, another reduction in target nozzle rotation angli isrequired for W/W above the second thrust vector anglecrossover point. +he process would then be repeated in order todetermine if another reduction in e is required to keepacceleration adequate, until the requirements for minimum
.Mh ,IMuUMnA'WT': acceptable a/g were satisfied for all W/W within the operationalhover weight ratio envelope. The target trust vector angles andcorresponding hover weight ratios depicting the thrust vector
FLIGHT PATH ACCELERATION VELOCITY PARANetM - 'W angle crossover points are the components of the target thrustvector angle schedule. This schedule is used in conjunction
Figure 7 Determination Of Velocity For Minimum Acceptable with the thrust vector rotation velocity schedule during STOallg For A Given Target Thrust Vector Angle operations.
acceleration is no longer acceptable for the given optimum STO The initial (theoretically predicted) schedule for thrust vectortechnique utilizing that target thrust vector rotation angle. The rotation velocity can be compared to the velocity required forhover weight ratio at which the velocity parameter for minimum minimum acceptable a/g (obtained from flight test). Predictedacceptable a/g equals the velocity parameter required for the V, should be scheduled to occur at or above the velocity forclimbout task is defined as the thrust vector angle crossover acceptable level flight path acceleration such that the vehicle haspoint. If desired, a safety buffer can be utilized in the adequate energy for transition to wingbome flight duringdetermination of the thrust vector angle crossover point as climbout (thus minimizing ground distance required). If theshown in figure 9. initial schedule satisfies this criteria, it could be used as the
starting point for determination of the final schedule from flighttest. Depending on the confidence in the development of the 01S.initial schedule,it may be desired to add a safety buffer of 5 to10 knots to the initial schedule prior to flight testing. Sincemaximum STO performance is desired, the final schedule forthrust vector rotation velocity should be approximately the sameas curve depicting the velocity required for minimum acceptablea/g.
Application Of TechniqueHOVER WEIGHT RATIO -WVM1
BackgmoundFigure 8 Velocity For Minimum Acceptable a/g Versus W/Wh
For A Given Thrust Vector Angle. YAV-SB and AV-SB STO test results had indicated that theSTO performance could be further optimized. particularly at
CLIM. PON rhigher hover weight ratios (1.3 and above). Fleet commentsIIo IoTEO and earlier STO test results confirmed the need for land based
AV-8B STO performance optimization. STO optimizationrequired the development of a new nozzle rotation schedule andSTO task. %
4 Description Of Test Aircraft
11 1-1 - TRUST VECTOR ANGLE CROSSOVER POINETWITRS....YUPFER uThis above technique was applied for the determination of
Z " 01 ACC [FTAIL|
,it l i3 Ei F0i .iOO[i liOi
oINCREASE0i FOR $TO OPERATION optimum STO performance of the AV-8B Harrier II aircraft.MOVER WEIGHT RATIO WAN The AV-8B is a single place, single engine, tactical attack,
vectored thrust V/STOL aircraft The aircraft has a shoulderFigure 9 Determination Of Thrust Vector Angle Crossover Point mounted supercritical swept wing, a single row of auxiliary
engine air inlets, four rotatable engine exhaust nozzles, and aAt this point, the variables in the takeoff equations could be Lift Improvement Device System. The AV-SB is powered by a Al
reexamined in order to develop a new STO technique for hover Rolls Royce F402-RR-406 twin spool, axial flow turbofanweight ratios in excess of thrust vector angle crossover point, engine with an uninstalled sea level static short lift wet (water .-For a given vehicle, there is a finite maximum available thrust injection) thrust rating of 21,500 lb. The primary flight controland maximum allowable gross weight for takeoff. Therefore, system is hydromechanical with a limited authority digitalthe two major ways of improving a/g are to vary vector thrust stability augmentation and attitude hold system incorporating aangle and angle of attack. Angle of attack during ground run is departure resistance system. The Harrier also incorporates aa function of vehicle attitude as long as the vehicle rests on the reaction control system providing engine bleed air to puffer ductlanding gear. For climbout, the angle of attack will depend on valves located on the nose, tail and wingtips for longitudinal,the STO technique. As stated earlier, the situation may dictate lateral and directional control dunng vectored thrust operations.that the design STO technique will remain consistent for all The engine is equipped with a digital engine control system withhover weight ratios in order to reduce complexity of aircraft a manual fuel system provided for back-up fuel control.operation. Therefore, at the thrust vector angle crossover pointthe target thrust vector rotation angle would be reduced allowing Test Approch-for higher axial acceleration.
In order to achieve optimization, the STO task was changedConstant airspeed climb tests are then performed for the new to a pitch attitude capture task as opposed to the previous AOA
thrust vector angle in order to produce the required plots as uik, and the target thrust vector angle (defined as nozzlepreviously discussed for the initial 0,. If the new curves
N,
N.
8
%- -
A%.
TM 87-171 SA
rotation angle, 0.) when used in reference to the AV-8B) was attitude and the velocity for minimum acceptable a/g. Fromscheduled as a function of the hover weight ratio as opposed to experience gained during shipboard trials, the minimum -being constant at 55 deg for all W/Wh. Constant airspeed climb acceptable a/g was chosen to be 0.04 g. During STO tests 0.04tests were performed in order to determine the relationship g was again confirmed to be the minimum acceptable flight path ,-between hover weight ratio and optimum nozzle angle during the acceleration for STO operations. The nozzle angle crossoverSTO task. This allowed the development of a new schedule for point was determined from the intersection of the curvesthe velocity at which nozzles would be rotated (Vn). depicting velocity parameter required for 14 deg pitch attitude
climb and velocity parameter for minimum acceptable a/g as aIn order to maintain adequate flight path acceleration during function of W/Wh for STO operations targeting 55 deg 0f.
high hover weight ratio STO tasks, the target nozzle angle wasreduced, resulting in a slight increase in Va. The reduced The second phase of the testing was to determine the nozzlenozzle angle increased flight path acceleration, while the rotation schedule for the newly defined STO task. The majorincreased V provided more wing lift to supplement the reduced test criteria was to deteriune V= such that the total distancethrust lift (resulting from the reduction in nozzle angle). required to clear 50 ft AGL was rrnimum and a/g remained
acceptable during climbout providing a repcatable STO task forThe new optimum STO performance task outlined the STO the average ploL As a result of the data obtained from the %
task as rotating nozzles at V, (obtained from the developed Vr7 constant airspeed climb tests, initial test nozzle rotation velocitiesschedule) to optimum target nozzle angle, capturing 14 deg pitch were chosen from the original nozzle rotation schedule plus 10attitude within 1.5 sec of takeoff, and climbing through 50 AGL KTS. Tests were conducted in a build-up approach bywithin minimum ground distance. Emphasis was placed on a performing lower hover weight ratio tests first. If aircraft flightrepeatable STO task ending with sufficient acceleration at 50 ft path acceleration and handling qualities were qualitatively andAGL. Stabilator trim, drag and stability effects of stores, flight quantitatively acceptable throughout the STO task, V,. waspath acceleration, and flying qualities were all considered in the decreased in 2 - 5 KT increments and the test was repeated. V,development of the revised nozzle rotation schedule. A new was reduced until minimum acceptable a/g was achieved or pilotstabilator trim schedule was developed to enhance the pitch comments indicated that any further reduction in V would havecapture task in order to promote repeatability of the STO task. adverse effects on the flying qualities and repeatablity. TrimThe schedule needed to account for drag and stability effects of was initially set using the original trim schedule. During STOstores, c.g. position, and potential reaction control system testing, trim was varied for each loading tested in order toinduced foreign object debris engine damage. develop the optimum tim schedule. A removable mechanical
throttle stop was used so that engine RPM cutback did not occurThe STO task originally dictated application of the due to engine temperature limiters, thus guaranteeing that the
longitudinal stick as necessary to reach and maintain 12 units hover weight ratio would remain reasonably constant throughoutAOA after nozzle rotation and takeoff. However, previous test the STO.results showed that a reduction in flight path angle was requiredto maintain positive longitudinal flight path acceleration. Further Test Resultstesting was recommended in order to determine the optimum 'p.AOA for STO climbout. However, during the AV-8B Navy Test data showed the nozzle angle crossover point to be atTechnical Evaluation, it was determined that STO tasks 1.35 W/Wh (with approximately 10 KCAS performance safetycapturing pitch attitude with proper trim were easier than margin) for 55 deg 0. If a pilot were to pertform a 14 deg pitchcapturing AOA due to the lag in the AOA indication in the HUD, attitude climbout with 55 deg 8 above 135 W VA he wouldand the tendency for the pilot to induce oscillations in AOA sense that the aircraft was not adcelerating, and in fct thewhen targeting an AOA for climbout. Target pitch angle was aircraft would begin to stagnate, inhibiting the pilot fromchosen in order to optimize climbout AOA during higher hover transitioning from semijetbome flight to wingbome flight.weight ratio STO operations, as well as to maintain similarity Constant airspeed climb tests for 50 deg 08 showed acceptable w,,with shipboard STO procedures. a/g for all W/W above the nozzle angle crossover point of 1.35
W/Wh. When the aircraft accelerauon data was plotted againstBoth the optimum and original STO tasks outlined STO the current original V curve, the results showed that the
procedures as initially setting proper control surface trim, original curve would cause a pilot to be below the minimumselecting proper flap setting, selecting proper nozzle angle acceptable a/g for a target V at hover weight ratios above 1.30setting for the ground roll, applying appropriate power with for STO operations using 55 deg nozzle angle. Therefore,brakes applied, releasing brakes at initial skid, accelerating to during the orlginally defined STO task, a pilot would begin totarget Vn,, rotating nozzle lever to the pre-selected nozzle angle experience stagnation (lack of acceleration). Both fleet and test -,
STO stop, and performing an attitude takeoff task. The main pilot comments prior to this evaluation supported this finding.difference in task technique lies in capturing 14 deg pitch attitudewithin 1.5 sec for the optimum task as opposed to capturing 12 The final Vn, schedule was then plotted in the form ofdeg AOA for the original task. The tasks also have different. Vn, velocity parameter versus hover weight ratio, for corresponding0e and stabilator trim schedules. Both tasks call for maintaining regions of target 0,. A comparison between data for the original a-atitude and heading during cimbout. STO task and the developed STO task depicting iotal round
distance required to clear 50 AGL at the same test conditionsTest LMethod showed the distances to be approximately the same (within -±200
ft, positive for W/W below the nozzle angle crossover point,In order to determine the optimum nozzle rotation schedule, and negative for W/W above the nozzle angle crossover point). .
tests were conducted in two phases. The first phase involved Therefore, new nozzle rotation schedule and trim schedule " .
the determination of the nozzle crossover point (the hover produced no major change in required distances, increased flightweight ratio for which the velocity parameter for minimum path acceleration, and provided adequate handling qualities .4acceptable a/g equals the velocity parameter required for the 14 allowing the pilot to perform a sate and repeatable STO for alldeg pitch attitude climbout task). The nozzle crossover point operational hover weight ratios tested. ",was determined by flying constant airspeed sawtoothed climbsat various hover weight ratios for 50 deg and 55 deg nozzle The lower hover weight rano data showed that the distance to,,;angles. Low pressure fan speed RPM was set during the climb clear 50 ft AGL using the maximum STO pert ormance wasin order to generate the required thrust for the targeted hover slightly more then the original STO method. This is a result ofweight ratio. Constant airspeed climb data was then used to using the pitch at-rtude capture technique as opposed to AOAdetermine the velocity required to maintain a 14 deg pitch capture. The lower hover weight ratio tesis %%ere conducted at ,,
9
N-
' w, A " ,
TM 87-171 SA.A
lower gross weights. This provided for lower angle, of attack,thus lower rates of climb. However, the ability of the aircraft toaccelerate in the axial direction was enhanced. Perfonmance canbe further optimized if pitch attitude (as well as 8,) is optimizedrelative to hover weight ratio such that rate of climb ismaximized while keeping adequate flight path acceleration.Performance could also be further optimized by just increasingtarget 0,, resulting in a decrease in a/g. However, as statedearlier tis increases the complexity of the STO task. Since thepitch attitude was chosen for the most likely operationalcondition, and because performance for lower hover weightratio conditions was adequate, the constant pitch attitude capturetask was considered acceptable for all operational hover weightratios tested.
Co ,ch.sion
Using the concepts of thrust vector rotation schedule andminimum acceptable a/g allowed the development of an optimumSTO technique with associated V schedule, nozzle angle "schedule, and stabilator trim schlule optimizing STOperformance and producing a safe, repeatable STO task for all IF %
operational hover weight ratios. Advantages to the developedtest approach included:
1. Increased flight test efficiency. Minimum flight testing %was needed to determine the required thrust vector anglecrossover points, thrust vector angle schedule, thrust vectorrotation velocity schedule, and the trim schedule optimizingattitude capture for various loadings.
2. Development of a STO task accounting for both thehandling qualities and performance constraints of a given test N 0.vehicle, therefore optimizing the performance and repeatabilityof the STO techique.
3. The concept of the velocity parameter and hover weightratio reduced complexity of data presentation anddocumentation.
Additional benefits can be gained by applying the concept ofminimum acceptable a/g along with the developed takeoffperformance and a/g equations in order to analyze and developan optimum STO technique accompanied with associatedperformance schedules prior to flight testing. This can beparticularly useful in the early design phase of an aircraft and orfurther benefits can be gained when applied in conjunction withsimulation.
Acknowledgements..,
The author wishes to acknowledge Mr. C. Lea and Mr. L.Thomas of the Naval Air Test Center for their contributions to .',,this investigation.
1. Kollsman, David L. "Introduction to V/STOL Airplanes",first ed., 1981.
2. "USAF Test Pilot School Flight Test Handbook,Performance; Theory and Flight Test Techniques",FTC-TIH-79- 1, dated 1 Aug 79.
3. "Carrier Suitability Manual", NAVAIR 51-35-50. e%
11
100
%o% %I%
TM 87-171 SA
DISTRIBUTION: N
NAVAIRSYCN'. (50) 2
NAVAIRSYSCOM (5317) (2)NAVAIRSYSCOM (51363) (2) -PACMISTESTCEN (3103) (2)COMOPTEVFOR (52 1) (2)AIRTEVRON FIVE (2)NAVPRO St. Louis, MO (2)NAVAIRTESTCEN (SA) (5)NAVAIRTESTCEN (SY) (1)NAVAIRTESTCEN (FW) (1) -
NAVAIRTESTCEN (RW) (1)NAVAIRTESTCEN (TPS) (1)NAVAIRTESTCEN (C'r0lA) (2)D TIC (2)
-
. N~l
% % % % %

- - - - - .~. ~- %~ * - *
S
fe'.
~..tu'.
j
S
J. .,p.
,.r .~
~:**~ *q
d~ ~.jq
I..,' ~I S
i', *\
- .*-
-.
-
'--'S'S.
0
-, .- .~ *~ *'S',~S*~ ~ N N ~ **~.*,~**.*,.* ~S.v* -
Related Documents