Social capital and change in psychological health over time. Giordano, Giuseppe Nicola; Lindström, Martin Published in: Social Science and Medicine DOI: 10.1016/j.socscimed.2011.02.029 Published: 2011-01-01 Link to publication Citation for published version (APA): Giordano, G. N., & Lindström, M. (2011). Social capital and change in psychological health over time. Social Science and Medicine, 72, 1219-1227. DOI: 10.1016/j.socscimed.2011.02.029 General rights Copyright and moral rights for the publications made accessible in the public portal are retained by the authors and/or other copyright owners and it is a condition of accessing publications that users recognise and abide by the legal requirements associated with these rights. • Users may download and print one copy of any publication from the public portal for the purpose of private study or research. • You may not further distribute the material or use it for any profit-making activity or commercial gain • You may freely distribute the URL identifying the publication in the public portal Take down policy If you believe that this document breaches copyright please contact us providing details, and we will remove access to the work immediately and investigate your claim.

Welcome message from author
This document is posted to help you gain knowledge. Please leave a comment to let me know what you think about it! Share it to your friends and learn new things together.
Transcript
LUND UNIVERSITY
PO Box 117221 00 Lund+46 46-222 00 00
Social capital and change in psychological health over time.
Giordano, Giuseppe Nicola; Lindström, Martin
Published in:Social Science and Medicine
DOI:10.1016/j.socscimed.2011.02.029
Published: 2011-01-01
Link to publication
Citation for published version (APA):Giordano, G. N., & Lindström, M. (2011). Social capital and change in psychological health over time. SocialScience and Medicine, 72, 1219-1227. DOI: 10.1016/j.socscimed.2011.02.029
General rightsCopyright and moral rights for the publications made accessible in the public portal are retained by the authorsand/or other copyright owners and it is a condition of accessing publications that users recognise and abide by thelegal requirements associated with these rights.
• Users may download and print one copy of any publication from the public portal for the purpose of privatestudy or research. • You may not further distribute the material or use it for any profit-making activity or commercial gain • You may freely distribute the URL identifying the publication in the public portalTake down policyIf you believe that this document breaches copyright please contact us providing details, and we will removeaccess to the work immediately and investigate your claim.

Download date: 27. Aug. 2018
LUPLund University Publications
Institutional Repository of Lund University
This is an author produced version of a paperpublished in Social Science & Medicine. This paper has
been peer-reviewed but does not include the finalpublisher proof-corrections or journal pagination.
Citation for the published paper:Giuseppe Nicola Giordano, Martin Lindström
"Social capital and change in psychological healthover time."
Social Science & Medicine2011 Mar 24
http://dx.doi.org/10.1016/j.socscimed.2011.02.029
Access to the published version may require journalsubscription.
Published with permission from: Elsevier
Social capital and change in psychological health over time - a panel study
Authors (Family name, First names)
Giordano, Giuseppe Nicola, BDS MPH a,b
Lindström, Martina,b
a Department of Clinical Sciences, Faculty of Medicine, Lund University, Sweden. Postal address: CRC, building 28, floor 12, entrance 72, Malmö University Hospital, 204 02 Malmö, Sweden
b Centre for Economic Demography (CED) Lund University
Email addresses:
Corresponding author:
Giuseppe N Giordano
Dept. Of Clinical Science, Malmö University Hospital, Clinical Research Centre (CRC), Entrance 72, House 28, Floor 12, Lund University, 204 02 Malmö, SWEDEN.
TEL: +46 (0)707522958
FAX: +46 (0)40 391 300
1
Social capital and change in psychological health over time - a panel study
Abstract
The positive association between social capital and general health outcomes has been
extensively researched over the past decade; however, studies investigating social capital and
psychological health show less consistent results. Despite this, policy-makers worldwide still
employ elements of social capital to promote and improve psychological health. This United
Kingdom study aims to investigate the association between changes in psychological health
over time and three different individual-level proxies of social capital, measures of socio-
economic status, social support and the confounders age and gender. All data are derived
from the British Household Panel Survey data, with the same individuals (N = 7994)
providing responses from 2000-07.
The data were split according to baseline psychological health status (‘Good’ or ‘Poor’
psychological health – the dependent variable). Using Generalised Estimating Equations, two
separate models were built to investigate the association between changes from baseline
psychological health over time and considered variables. An autoregressive working
correlation structure was employed to derive the true influence of explanatory variables on
psychological health outcomes over time.
Generalised trust was the only social capital variable to maintain a positive and highly
significant (OR 1.32, p < 0.001) association with psychological health in multivariable
models. All measures of socioeconomic status and social support were rendered insignificant,
bar one.
We argue that the breakdown of the traditional family unit (and subsequent reduction in
family capital investment), along with psychosocial pathways, demonstrate plausible
mechanisms by which a decrease in generalised trust could lead to an increasing trend of
2
worse psychological health in youth over successive birth cohorts. Policy makers, while
providing welfare solutions in response to breakdown in traditional family structure, must
also consider perverse incentives they provide. If perceived as a viable lifestyle choice,
welfare provision could inadvertently promote further decline of trust, at even greater cost to
society.
Introduction
According to the World Health Organisation (WHO), mental health disorders caused 13.1%
of the global burden of disease in 2004; with unipolar depression predicted to be the greatest
cause of disability burden worldwide by 2030, this already high percentage is set to rise
further (WHO, 2004). However, funding for mental health services is still considered low
priority, with almost one third of all countries not having a specific mental health budget
(Saxena, Thornicroft, Knapp, & Whiteford, 2007). Of the countries that do, around one fifth
spends less than 1% of their total health budget on mental health (Saxena et al., 2007) and
decision makers have been considering community-based resources to address this shortfall
(Cutler, Bevilacqua, & McFarland, 2003; Thornicroft & Tansella, 2004; WHO, 2006).
One such community resource is social capital. Defined by Putnam (2004) as “social
networks and norms of reciprocation”, communities deemed rich in social capital consist of
individuals who demonstrate high levels of generalised trust, high social and civic
participation and high levels of generalised reciprocity (Putnam, 1993; Putnam, 2000). These
individual-level social capital proxies are described as having a ‘structural’ dimension,
relating to social networks, and a ‘cognitive’ dimension, relating to individuals’ perceptions
of trust and reciprocity (Harpham, Grant, & Thomas, 2002). The two dimensions have been
hypothesised to act in different ways to affect health outcomes, with many studies showing
strong association between high levels of social capital and positive general health outcomes
3
(Kawachi, Kennedy, & Glass, 1999; Kawachi, Kennedy, & Lochner, 1997; Lindström,
Hanson, & Östergren, 2001; Giordano & Lindström, 2010). In comparison, studies
researching social capital and psychological wellbeing demonstrate less consistent results,
with individual-level ‘cognitive’ social capital studies showing a more consistent inverse
association with poor psychological health than studies investigating ‘structural’ measures;
and no obvious pattern of association emerging from ecological-level social capital studies
and psychological health (De Silva, McKenzie, Harpham, & Huttly, 2005). Despite this fact,
policy-makers worldwide, including WHO and the World Bank, have employed elements of
social capital as a means to promote and improve the mental health of populations
(Henderson & Whiteford, 2003).
How social capital affects health outcomes is considered contentious (Muntaner, 2004;
Pearce & Davey Smith, 2003). Kawachi et al. (1999) originally postulated that communities
with high levels of social capital were more likely to deter ‘deviant’ behaviours such as
drinking, smoking and crime, maintain access to local resources and even promote healthier
behaviours, such as regular exercise. It has been further postulated that individuals perceiving
high levels of trust and reciprocity in their communities have better health, due to reduced
exposure to chronic stressors (Wilkinson, 1996; Giordano & Lindström, 2010). These
theories equally apply to psychological health, as regular physical exercise and maintaining
access to resources affect psychological health outcomes, and high crime levels and chronic
stressors are known precursors to worse psychological wellbeing (Aneshensel & Sucoff,
1996; Tennison, Rodgers, Beker, Vorobjeva, Creed, & Simonenko, 2010). Further, active
social participation, considered the “cornerstone” of social capital generation (Putnam, 2000),
has a positive affect on psychological wellbeing through increasing social ties and
community integration (Kawachi & Berkman, 2001).
4
A further issue surrounding social capital is that as a contextual phenomenon, it cannot be
directly observed or quantified; this begs the question as to how social capital and its effects
are empirically measured and tested. Regarding measurement, social capital is often
quantified using individual-level proxies, such as generalised trust, voluntary group
participation, voting levels and perceived reciprocity (De Silva, Harpham, Tuan, Bartolini,
Penny, & Huttly, 2006). Once measured, however, there is still the issue of testing. One
school of thought is to aggregate individual-level indicators to a contextual level (such as
neighbourhood or community) in order to capture contextual effects (Kawachi, Kim, Coutts,
& Subramanian, 2004). In practice, however, contextual levels are often chosen solely by
availability of data (e.g. postcode sectors, constituencies or states) and may hold little
relevance to individuals’ day-to-day social interactions. Furthermore, any contextual-level
effects may be the result of confounding if individual-effects are not also taken into account
(Poortinga, 2006).
In the absence of appropriate community-level contextual units (as is the case with our data),
the only option is to measure the effects of social capital at the individual-level. In doing so,
however, one invites criticism that it is the effects of social support being measured, as social
isolation and poor social networks have long been associated with poor health (Durkheim,
1897, 1951; Hawe & Shiell, 2000; Kawachi & Berkman, 2001). This is most apparent when
‘social participation’ is used as a measure of social capital, as it is not difficult for readers to
equate this source of social capital as a potential source of social support. To avoid such
critique, we must therefore include social support variables alongside the individual-level
social capital proxies in our investigation, to reduce any potential confounding of association.
Furthermore, it is also vital that we keep ‘cognitive’ and ‘structural’ dimensions of social
capital as separate entities, as the ‘structural’ dimension is the one most likely to influence
health along social support pathways (Giordano & Lindström, 2010).
5
One social support mechanism known to influence health is the role of marriage. Marriage
has independently been shown to reduce morbidity and mortality (House, Landis, &
Umberson, 1988) and is thought to reduce risk-taking behaviour and stress (Wyke & Ford,
1992), mirroring presumed causal pathways that elements of social capital act upon (Kawachi
et al., 1999). Marriage is also thought to provide a level of health ‘protection’ via emotional
and financial support for the individuals concerned (Umberson, 1992). Though happy
marriages are shown to contribute to better psychological health (Kiecolt-Glaser & Newton,
2001), marital distress/breakdown and remaining unmarried are, however, strongly associated
with worse psychological health (Beach, Fincham, & Katz, 1998).
Socio-economic status (SES) also has a positive association with psychological health
outcomes (Lorant, Deliege, Eaton, Robert, Philippot, & Ansseau, 2003; Wang, Schmitz, &
Dewa, 2009), though its influence seems to depend on which measures of SES are used
(income, social class, education or employment status) and how psychological health is
measured (Wiggins, Schofield, Sacker, Head, & Bartley, 2004).
From the above, the potential for confounding the association between social capital and
psychological health is great, unless multiple measures of social support and SES are also
considered. The aim of this panel study is to research different dimensions of individual-level
social capital (generalised trust, community group participation and informal local networks),
SES (education level, social class, employment status and household income) and social
support (marital status, cohabitation and support networks) against self-rated psychological
health over a seven year period. Along with known confounders (age and gender), considered
variables will be individually and simultaneously tested, revealing any association with
changes in psychological health over time.

6
Materials and methods
Data collection
The British Household Panel Survey (BHPS) is a longitudinal survey of randomly selected
private households, conducted by the UK’s Economic and Social Research Centre. Details of
the selection process, weighting and participation rates can be found on-line in the BHPS
User manual (Taylor, Brice, Buck, & Prentice-Lane, 2007). Since 1991, individuals within
selected households have been interviewed annually with a view to identifying social and
economic change within the British population. The Research Centre fully adopted the
Ethical Guidelines of the Social Research Association; informed consent was obtained from
all participants and strict confidentiality protocols were adhered to throughout data collection
and processing procedures. The raw data used for this panel study come from the BHPS
individual level responses in years 2000, 2003, 2005 and 2007.
Dependent variable
The dependent variable in this study is self-rated psychological health, obtained using the 12-
item General Health Questionnaire (GHQ-12). Depending on the answers obtained from the
twelve items offered by this instrument, respondents were deemed to have either ‘good’ or
‘poor’ psychological health (see appendix for more detail). Although there are more complex
instruments (28- or 60-item) to measure psychological health, there seems little difference in
validity between them and the GHQ-12 item used here (Goldberg, Gater, Sartorius, Ustun,
Piccinelli, Gureje et al., 1997).
All data were stratified by baseline psychological health (‘Good’ or ‘Poor’ PH) to create two
distinct cohorts. This was done in order to track changes in PH over time from baseline.
Individuals from the ‘Good PH’ at baseline cohort whose PH deteriorated over time were the
7
subject of investigation in model one. Likewise, those in the ‘Poor PH’ at baseline cohort
whose PH improved over time were the subject of investigation in a second separate model.
Independent variables
Social capital variables
Our individual-level social capital items were interpersonal trust, active social participation
and frequency of talking with neighbours. According to Putnam (1993, 2000), communities
with high levels of social capital consist of individuals who are more able to trust one
another, who actively participate in local groups, and demonstrate high levels of generalised
reciprocity. Though no specific reciprocity data were available, we also deemed ‘frequency
of talking with neighbours’ a suitable social capital proxy.
Interpersonal trust was assessed by asking people: ‘Generally speaking, would you say that
most people can be trusted, or that you can't be too careful?’ Those respondents who stated
that most people could be trusted were labelled ‘Can trust others’; all other responses
(including ‘It depends’) were labelled ‘Can’t trust others’.
Social participation was measured by asking respondents questions about being active
members of community groups, local voluntary organisations, or any sports, hobby or leisure
group activity within the community. Only those who answered positively to any of these
were judged to participate, with all others being labelled ‘No participation’.
Frequency of talking to neighbours was also considered a measure of social capital. Possible
responses were: ‘Most days, once or twice a week, once or twice a month, less than once a
month, or never’. Those answering ‘most days’ or ‘once or twice a week’ were assigned the
label ‘two or more times per week’; the rest were assigned the label ‘less often’.

8
Socio-economic status variables
Education level was categorised as ‘University or higher’, ‘Year 12’ and ‘Year 10 or less’.
Social class was determined by occupation (derived from the Registrar General’s Social
Classification of occupations). The usual six categories were dichotomised into ‘higher’ (1-3)
and ‘lower’ (4-6) social class.
Household income was weighted according to size by summing the income of all household
members and dividing this sum by the square root of the household size (Burkhauser,
Smeeding, & Merz, 1996). This item was maintained as a continuous variable per £1000
increase and was an expression of total income, net of any taxation.
Employment status was categorized as ‘Employed’, ‘Retired’, ‘Fulltime student’ or
‘Unemployed’.
Social support variables
Respondents were asked if they were ‘married, separated, divorced, widowed or never
married’. Marital status was recoded into married and unmarried (widow, divorced, single)’.
A further variable ‘Lives alone’ (yes/no) was also used to try to capture more information
about those individuals who co-habited.
Frequency of meeting with friends was considered a measure of potential social support.
Possible responses were: ‘Most days, once or twice a week, once or twice a month, less than
once a month, or never’. Those answering ‘most days’ or ‘once or twice a week’ were
assigned the label ‘two or more times per week’; the rest were assigned the label ‘less often’.

9
Confounders
Age and gender were considered confounders in this study, age being stratified into quintiles
(see tables 1-3).
Statistical analyses
Each independent variable was run against the dependent variable (‘Worse PH over time’ or
‘Better PH over time’) in bivariate analyses using Generalized Estimating Equations (GEE),
with an autoregressive working correlation structure (AR1), utilising the ‘sandwich’
covariance estimator (Fitzmaurice, Laird, & Ware, 2004) . Reasoning behind this choice of
model was twofold: firstly, repeated observations within the same subject are not independent
of each other - the correlation structure corrects for this. Secondly, when examining time-
dependent variables (such as PH, marital status, employment status, etc), GEE (AR1)
estimates the “real influence” of independent variables on outcome (Y) over time, by also
correcting for the previous value of the outcome (Y) at (t -1) (Twisk, 2003), as illustrated by
the equation:
Yt = 0 + 1Yt–1 + 2Yt–1 + … + ut.
All analyses were conducted within the statistical software package STATA 11.0 (StataCorp,
2009). The presence of social capital, higher education, household income and social class,
employment, being married, cohabiting and meeting friends more often were all hypothesized
to be associated with better psychological health over time.
10
Results
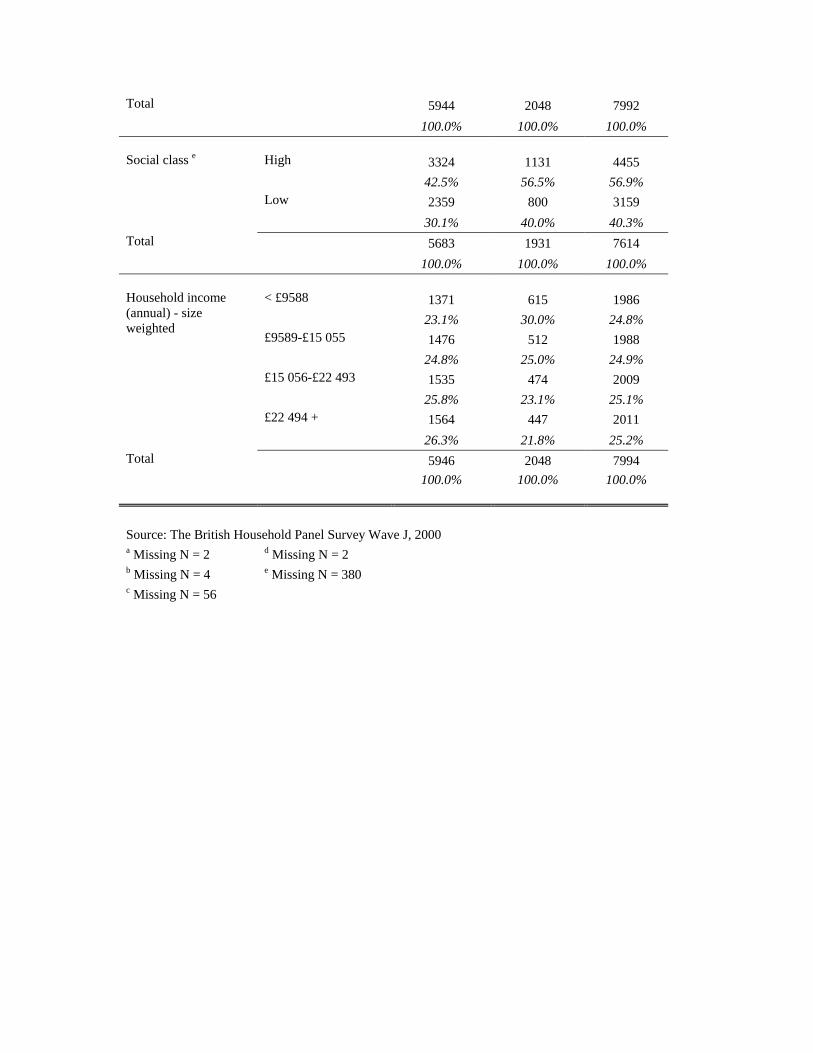
Table 1 shows the frequencies and total percentages of all the variables at baseline, stratified
by psychological health, derived from Wave ten (2000) of the BHPS. This stratification
represents the two separate cohorts under investigation, as previously explained in the
‘dependent variable’ section.
The bivariate analyses results are presented in table 2 as prevalence (%) and odds ratios
(ORs) with 95% confidence intervals (95% CI). The prevalence percentage demonstrates
those individuals with ‘Worse’ or ‘Better’ psychological health compared to the baseline
within each variable investigated. A multivariable GEE (AR1) model was also built for both
PH cohorts, adjusting for all statistically significant (p < 0.05) variables identified from
bivariate analyses. Results from these models are presented in table 3 as ORs with 95% CI.
Bivariate analysis – ‘Worse PH over time’
As shown in table 2, column 1, the social capital variables ‘cannot trust’ and ‘do not
participate’ were more likely to have worse PH compared to baseline (OR 1.30 and 1.09
respectively). Talking less with neighbours was also associated with worse PH over time (OR
1.17). None of the SES variables were statistically significant in bivariate analyses.
Regarding the confounders, those individuals who were younger seem more likely to have
worse PH over time, and females were 56% more likely to experience worse PH at follow-up
than males. Being unmarried was the only measure of social support showing significant
association with worse PH over time.
Bivariate analysis – ‘Better PH over time’
As shown in table 2, column 2, the only social capital variable significantly associated with
better PH over time was generalised trust. Regarding SES variables, increasing household

11
income and higher social class were also associated with better PH over time. Being married
and not living alone were the only social support variables significantly associated with better
PH compared to baseline levels in bivarate analysis.
The confounders age and gender were also strongly associated with better PH over time.
Multivariable analysis – ‘Worse PH over time’
As shown in table 3, column 1, being unable to trust (OR 1.25) and talking less with
neighbours (OR 1.12) maintained their significant association with worse PH over time.
Being unmarried (OR 1.22) was the only social support variable still significant in
multivariable analysis. The confounders age and gender maintained their significant
association with worse PH over time.
Multivariable analysis – ‘Better PH over time’
As per table 3, column 2, only the variables trust, marital status and household income, along
with confounders age and gender maintained significant association with better PH over time.
All other measures of social support, social capital and SES were rendered insignificant in
multivariable analysis.
Discussion
The aim of this panel study was to compare any association between different individual-
level indicators of social capital, SES and social support with changes in individual
psychological health (PH) outcomes over time. In multivariable GEE analysis with an
autoregressive working correlation structure, only the social capital variable generalised trust,
the social support variable marital status and confounders age and gender maintained their
12
association with PH over time (see table 3). No SES variable remained statistically significant
bar one, household income (OR 1.01).
Our results mirror previous research regarding gender differences in psychological wellbeing.
As numerous international studies also show that females are 1.5 to 3.0 times more likely to
experience worse PH than males (Weissman, Bland, Canino, Faravelli, Greenwald, Hwu et
al., 1996; Piccinelli & Wilkinson, 2000), this adds plausibility to our other results.
The results also support previous research demonstrating that marriage protects against worse
PH over time. As the autoregressive working correlation structure corrects for changes in
individuals’ marital status over time, this ‘robust’ result confirms that remaining married, or
becoming married during this seven year period, is strongly associated with better PH (see
table 3). Marriage is thought to have both a ‘selection’ and a ‘protection’ effect regarding PH,
i.e. healthy individuals self-select into marriage and, as touched upon in the introduction,
marriage is thought to ‘protect’ via emotional and financial support mechanisms (Umberson,
1992).
It is interesting to see that increased age seems to offer protection against worse PH. In the
past, the reverse seemed more commonplace (Sheldon, 1948), but our results show, as do
others, that worse PH is becoming more prevalent in younger age groups (Hankin, Abramson,
Moffitt, Silva, McGee, & Angell, 1998; Pelkonen, Marttunen, Kaprio, Huurre, & Aro,
2008).That younger age groups are also strongly associated with better PH over time (see
table 3) at first glance appears to contradict the previous statement. However, what this most
likely demonstrates is younger individuals’ greater ability to recover.
13
After considered confounders, generalised trust has the strongest association with PH over
time in both multivariable models. Though there are fewer studies specifically examining
association between social capital and PH compared with general health, (Almedom, 2005),
our results reflect earlier research implying some level of consistency concerning the
‘conceptual’ dimension trust (De Silva et al., 2005). It may seem obvious that there is
association between trust levels and psychological health, as lack of trust (or ‘paranoia’) is
often associated with clinical psychoses. However, we should point out that the GHQ-12
instrument is not a diagnostic tool used by professionals to determine the mental health of
patients, but a screening instrument designed to ascertain levels of anxiety, depression and
loss of confidence, in non-clinical settings (Hu, Stewart-Brown, Twigg, & Weich, 2007).
Therefore, generalised trust should be considered as an individual’s expression of their
community’s level of social capital in this study (Putnam, 2001), not paranoia.
The ‘cornerstone’ of social capital generation, active participation shows no significant
association with PH in multivariable models. This result adds to the increasing volume of
research demonstrating that the separate dimensions of social capital are not as closely
correlated as first thought (Stolle, 2001; Nummela, Sulander, Rahkonen, Karisto, & Uutela,
2008; Giordano & Lindström, 2010).
Fukuyama’s (1999) concept of ‘miniaturization of community’ further describes how active
group participation may not necessarily generate interpersonal trust. He distinguishes
between quantity and quality group participation, the ‘miniaturization of community’ being
one by-product of high group participation by individuals with low radii of trust (i.e.
distrusting others outside the clique). According to Fukuyama, without quality social
participation there can be no gains in interpersonal trust within the community (and
subsequently no associated health benefits). Interestingly enough, individuals who
14
demonstrate this ‘high participation-low trust’ combination have worse PH than those who
both trust and participate (Lindström, 2004).
‘Miniaturization of community’ is just one consequence of a greater shift in cultural norms
described by Fukuyama (1999), which has occurred across many high income countries (the
UK included) since the 1960s . This ‘shift’ comprised of, among other things, an increase in
levels of crime, higher divorce rates and breakdown of the traditional family unit. Fukuyama
(1999) and Putnam (2000) have also described general declines in levels of trust over a
similar timeframe. This, in our opinion, is no coincidence; moreover, we hypothesize that the
decline in trust could be one reason why there has been an increase in worse psychological
health in youth over the same period.
To expand and clarify; Coleman (1990) stressed the importance of the traditional family unit
as a conduit for social capital. Coleman believed that if parents spent quality time with their
children and clearly articulated codes of conduct regarding acceptable and unacceptable
behaviours, this would ensure the next generation understood accepted norms of reciprocity
and trust. In other words, family capital investment enabled youth to generate social capital.
It is not inconceivable that breakdown of the traditional family unit – e.g. through divorce,
lone parent families or both parents working full time – could lead to a reduction in family
capital investment in youth by parent(s). This in turn could mean that successive birth cohorts
since the 1960s have reduced ability to maintain previous levels of social capital, thus leading
to the reported decrease in trust levels across some societies (Fukuyama, 1999). Coleman
(1990) also writes that high family capital investment reduces delinquent behaviour; ipso
facto, reduced family capital investment could also contribute to higher levels of crime and
the further decline of trust over time (Sampson, Raudenbush, & Earls, 1997).

15
From trust to psychological health
It has been argued that generalised trust is not just a reflection of community-level social
capital (Putnam, 2001) but is indicative of an individual’s level of perceived social stress and
possible health status (Wilkinson, 1996; Giordano & Lindström, 2010). The ‘psychosocial’
pathway from stress to health is via the hypothalamic-pituitary-adrenal (HPA) axis, and is
one plausible mechanism by which individuals’ perceptions can lead to physical changes in
the body over time (Rosmond & Björntorp, 2000).
In recent years, this same pathway has also been linked to psychological health; HPA axis
dysfunction, in response to perceived stressors, plays a significant role in the development of
mood disorders (Watson & Mackin, 2006; Itoi & Sugimoto, 2010; Tennison et al., 2010). If
lower levels of trust are indicative of higher social stressors, then it seems plausible that the
decline in trust could lead to deteriorating physical and psychological health in individuals.
Following this line of discussion, we could further hypothesise that maintaining traditional
family structure is a determinant of social capital for future generations, which in turn may
protect against worse PH. Results from previous studies lend credence to this hypothesis:
social capital (as measured by network size and norms of trust) has been reported at higher
levels within ‘intact’ families than within single-parent families (Ravanera & Rajulton,
2009), and population-based research has shown that youths born of teenage mothers are
more susceptible to worse PH (Ekeus, Olausson, & Hjern, 2006). Thus breakdown of
traditional family structure could be the first step in one pathway affecting PH in future
generations.
With this in mind, policy makers, whilst developing welfare solutions in response to
breakdown in traditional family structure (for example, lone parents receiving priority
16
housing and financial support), must also consider any perverse incentives they provide.
Education empowers individuals; providing welfare without maintaining excellent levels of
free/subsidized education could inadvertently promote further breakdown in traditional
family structure, if disempowered individuals perceive welfare as a viable lifestyle choice.
Strengths and weaknesses
A major strength of this study is the fact that it is longitudinal, covering a seven year time
frame with a high number of individual respondents (N = 7994). The unique design of this
study captures association between our independent variables and any change in
psychological health. Coupled with the auto-lag correlation structure, baseline stratification
further allows us to infer causality by estimating the true influence of explanatory variables
on changes in psychological health over time. The fact that the data were obtained via
interview rather than relying on postal questionnaires contributed to the very high
participation rate of around 90%, year on year (Taylor et al., 2007). Despite us being unable
to compare our results against longer assessment tools, the GHQ-12 item is still considered a
valid and reliable indicator of psychological health (Goldberg et al., 1997). By investigating
three different individual-level indicators of social capital, along with multiple SES and
social support variables, we ensured that well-known health determinants were also included
in the analyses, thus reducing the risk of potential confounding. Though there is no ‘gold
standard’ with which to validate against, generalised trust is considered a proxy of social
capital (Putnam, 2001).
A major limitation of this study is that the BHPS sample was originally selected to reflect the
UK population as a whole and deliberately avoided oversampling of smaller sized
communities. Due to sampling and collection methods, the longitudinal data were unsuitable
to perform any meaningful contextual analysis at the community-level. By year 2000, only

17
62.0% of the original cohort members were able to answer the questions posed (Taylor et al.,
2007). This would have introduced further selection bias into this study. Another limitation is
our social capital variables were only available in four of the seventeen ‘waves’. Marital
status was reduced to the dichotomous ‘married’ and ‘not married’; though this method of
reduction has been previously validated (Afifi, Cox, & Enns, 2006), it may hide more
complex pathways regarding cohabitation, common in society today. The ‘Lives alone’
variable was included in an attempt to recapture this detail. Allowing significance levels to
dictate the content of our final model could have similar disadvantages to using a stepwise
analysis. However, we ran all hypothesized variables in one separate analysis for the sake of
‘correctness’; the results on the independent variables in table 3 essentially did not differ
(results not published).
Conclusion
Our study confirms that a strong positive association remains between the ‘cognitive’ social
capital measure generalised trust and psychological health over time, even after taking many
other social support and SES variables into consideration. We consider the decline in trust
over recent decades to be associated with reduced family capital investment, a possible
consequence of traditional family unit breakdown. Furthermore, we argue that this decline in
trust may be associated with increases in worse PH in successive birth cohorts.
Policy makers, whilst justified in providing welfare solutions in response to breakdown in
traditional family structure, must also consider perverse incentives they provide. If perceived
as a viable lifestyle choice, welfare provision could inadvertently promote further decline of
trust, at even greater cost to society.

18
References
Afifi, T., Cox, B., & Enns, M. (2006). Mental health profiles among married, never-married, and
separated/divorced mothers in a nationally representative sample. Social Psychiatry and Psychiatric
Epidemiology, 41(2), 122-129.
Almedom, A. (2005). Social capital and mental health: An interdisciplinary review of primary evidence. Social
Science & Medicine, 61(5), 943-964.
Aneshensel, C., & Sucoff, C. (1996). The neighborhood context of adolescent mental health. Journal of Health
and Social Behavior, 37(4), 293-310.
Beach, S., Fincham, F., & Katz, J. (1998). Marital therapy in the treatment of depression: Toward a third
generation of therapy and research. Clinical Psychology Review, 18(6), 635-661.
Burkhauser, R., Smeeding, T., & Merz, J. (1996). Relative inequality and poverty in Germany and the United
States using alternative equivalence scales. Review of Income & Wealth, 42(4), 381-401.
Coleman, J. (1990). The foundations of social theory. Cambridge, MA: Harvard University Press.
Cutler, D., Bevilacqua, J., & McFarland, B. (2003). Four decades of community mental health: a symphony in
four movements. Community Mental Health Journal, 39(5), 381-399.
De Silva, M. J., Harpham, T., Tuan, T., Bartolini, R., Penny, M. E., & Huttly, S. R. (2006). Psychometric and
cognitive validation of a social capital measurement tool in Peru and Vietnam. Social Science &
Medicine, 62(4), 941-953.
De Silva, M., McKenzie, K., Harpham, T., & Huttly, S. (2005). Social capital and mental illness: a systematic
review. Journal of epidemiology and community health, 59(8), 619-627.
Durkheim, É. (1897, 1951). Suicide: A study in sociology. Glencoe, IL: Free Press.
Ekeus, C., Olausson, P., & Hjern, A. (2006). Psychiatric morbidity is related to parental age: a national cohort
study. Psychological medicine, 36(2), 269-276.
Fitzmaurice, G., Laird, N., & Ware, J. (2004). Applied longitudinal analysis. Hoboken, NJ: John Wiley & Sons.
Fukuyama, F. (1999). The great disruption: Human nature and the reconstitution of
social order. New York: Simon & Schuster.
Giordano, G., & Lindström, M. (2010). The impact of changes in different aspects of social capital and material
conditions on self-rated health over time: a longitudinal cohort study. Social Science & Medicine,
70(5), 700-710.
19
Goldberg, D., Gater, R., Sartorius, N., Ustun, T., Piccinelli, M., Gureje, O., et al. (1997). The validity of two
versions of the GHQ in the WHO study of mental illness in general health care. Psychological
medicine, 27(1), 191-197.
Hankin, B. L., Abramson, L. Y., Moffitt, T. E., Silva, P. A., McGee, R., & Angell, K. E. (1998). Development
of depression from preadolescence to young adulthood: Emerging gender differences in a 10-year
longitudinal study. Journal of Abnormal Psychology, 107(1), 128-140.
Harpham, T., Grant, E., & Thomas, E. (2002). Measuring social capital within health surveys: key issues.
Health Policy and Planning, 17(1), 106-111.
Hawe, P., & Shiell, A. (2000). Social capital and health promotion: a review. Social Science & Medicine, 51(6),
871-885.
Henderson, S., & Whiteford, H. (2003). Social capital and mental health. Lancet, 362(9383), 505-506.
House, J., Landis, K., & Umberson, D. (1988). Social Relationships and Health. Science, 241(4865), 540-545.
Hu, Y., Stewart-Brown, S., Twigg, L., & Weich, S. (2007). Can the 12-item General Health Questionnaire be
used to measure positive mental health? Psychological medicine, 37(7), 1005-1013.
Itoi, K., & Sugimoto, N. (2010). The Brainstem Noradrenergic Systems in Stress, Anxiety and Depression.
Journal of Neuroendocrinology, 22(5), 355-361.
Kawachi, I., & Berkman, L.F. (2001). Social Ties and Mental Health. Journal of Urban Health, 78(3), 458-467.
Kawachi, I., Kennedy, B., & Glass, R. (1999). Social capital and self-rated health: a contextual analysis.
American Journal of Public Health, 89(8), 1187-1193.
Kawachi, I., Kennedy, B., & Lochner, K. (1997). Social capital, income inequality, and mortality. American
Journal of Public Health, 87(9), 1491-1499.
Kawachi, I., Kim, D., Coutts, A., & Subramanian, S. V. (2004). Health by association? Social capital, social
theory, and the political economy of public health - Commentary: Reconciling the three accounts of
social capital. International Journal of Epidemiology, 33(4), 682-690.
Kiecolt-Glaser, J., & Newton, T. (2001). Marriage and health: His and hers. Psychological bulletin, 127(4), 472-
472.
Lindström, M. (2004). Social capital, the miniaturisation of community and self-reported global and
psychological health. Social Science& Medicine, 59(3), 595-607.
20
Lindström, M., Hanson, B., & Östergren, P. (2001). Socioeconomic differences in leisure-time physical activity:
the role of social participation and social capital in shaping health related behaviour. Social Science &
Medicine, 52(3), 441-451.
Lorant, V., Deliege, D., Eaton, W., Robert, A., Philippot, P., & Ansseau, M. (2003). Socioeconomic inequalities
in depression: A meta-analysis. American Journal of Epidemiology, 157(2), 98-112.
Muntaner, C. (2004). Commentary: Social capital, social class, and the slow progress of psychosocial
epidemiology. International Journal of Epidemiology, 33(4), 674-680.
Nummela, O., Sulander, T., Rahkonen, O., Karisto, A., & Uutela, A. (2008). Social participation, trust and self-
rated health: A study among ageing people in urban, semi-urban and rural settings. Health & Place,
14(2), 243-253.
Pearce, N., & Davey Smith, G. (2003). Is Social Capital the Key to Inequalities in Health? American Journal of
Public Health, 93(1), 122-130.
Pelkonen, M., Marttunen, M., Kaprio, J., Huurre, T., & Aro, H. (2008). Adolescent risk factors for episodic and
persistent depression in adulthood. A 16-year prospective follow-up study of adolescents. Journal of
Affective Disorders, 106(1-2), 123-131.
Piccinelli, M., & Wilkinson, G. (2000). Gender differences in depression - Critical review. British journal of
psychiatry, 177, 486-492.
Poortinga, W. (2006). Social capital: An individual or collective resource for health? Social Science &
Medicine, 62(2), 292-302.
Putnam, R. (1993). Making democracy work: Civic traditions in modern Italy. Princeton, NJ: Princeton
University Press.
Putnam, R. (2000). Bowling alone: The collapse and revival of American community. New York: Simon &
Schuster.
Putnam, R. (2001). Social capital: measurement and consequences. Isuma, 2(1), 41-51.
Putnam, R. (2004). Commentary: ‘Health by association’: some comments. International Journal of
Epidemiology, 33(4), 667-671.
Ravanera, Z., & Rajulton, F. (2009). Measuring Social Capital and Its Differentials by Family Structures. Social
Indicators Research, 95(1), 63-89.
Rosmond, R., & Björntorp, P. (2000). The hypothalamic-pituitary-adrenal axis activity as a predictor of
cardiovascular disease, type 2 diabetes and stroke. Journal of Internal Medicine, 247(2), 188-197.
21
Sampson, R. J., Raudenbush, S. W., & Earls, F. (1997). Neighborhoods and violent crime: A multilevel study of
collective efficacy. Science, 277(5328), 918-924.
Saxena, S., Thornicroft, G., Knapp, M., & Whiteford, H. (2007). Resources for mental health: scarcity, inequity,
and inefficiency. Lancet, 370(9590), 878-889.
Sheldon, J. (1948). The Social Medicine of Old Age. Oxford: Oxford University Press.
StataCorp. (2009). Stata Statistical Software. College Station, TX: StataCorp LP.
Stolle, D. (2001). Clubs and congregations: The benefit of joining organizations New York: Russell Sage
Foundation.
Taylor, M., Brice, J., Buck, N., & Prentice-Lane, E. (2007). British household panel survey user manual volume
A. Colchester, England: University of Essex. Retrieved from
http://www.iser.essex.ac.uk/survey/bhps/documentation/volume-a-user-guide
Tennison, L., Rodgers, L., Beker, D., Vorobjeva, K., Creed, E., & Simonenko, A. (2010). Cortisol and
symptoms of psychopathology in Russian and American college students. International Journal of
Psychology, 45(3), 165-173.
Thornicroft, G., & Tansella, M. (2004). Components of a modern mental health service: a pragmatic balance of
community and hospital care: Overview of systematic evidence. British journal of psychiatry, 185(4),
283-290.
Twisk, J. (2003). Applied longitudinal data analysis for epidemiology: A practical guide. Cambs, England:
Cambridge University Press.
Umberson, D. (1992). Gender, marital status and the social control of health behavior. Social Science &
Medicine, 34(8), 907-917.
Wang, J., Schmitz, N., & Dewa, C. (2009). Socioeconomic status and the risk of major depression: the Canadian
National Population Health Survey. Journal of epidemiology and community health, 64(5), 447-452.
Watson, S., & Mackin, P. (2006). HPA axis function in mood disorders. Psychiatry, 5(5), 166-170.
Weissman, M. M., Bland, R. C., Canino, G. J., Faravelli, C., Greenwald, S., Hwu, H. G., et al. (1996). Cross-
national epidemiology of major depression and bipolar disorder. Jama-Journal of the American
Medical Association, 276(4), 293-299.
WHO. (2004). Global burden of disease report: 2004. Geneva: World Health Organization.
WHO. (2006). Dollars, DALYs and decisions: economic aspects of the mental health system. Geneva: World
Health Organization.
22
Wiggins, R., Schofield, P., Sacker, A., Head, J., & Bartley, M. (2004). Social position and minor psychiatric
morbidity over time in the British Household Panel Survey 1991-1998. Journal of epidemiology and
community health, 58(9), 779-787.
Wilkinson, R. (1996). Unhealthy societies: The afflictions of inequality. London, England: Routledge.
Wyke, S., & Ford, G. (1992). Competing explanations for associations between marital status and health. Social
Science & Medicine, 34(5), 523-532.
Appendix
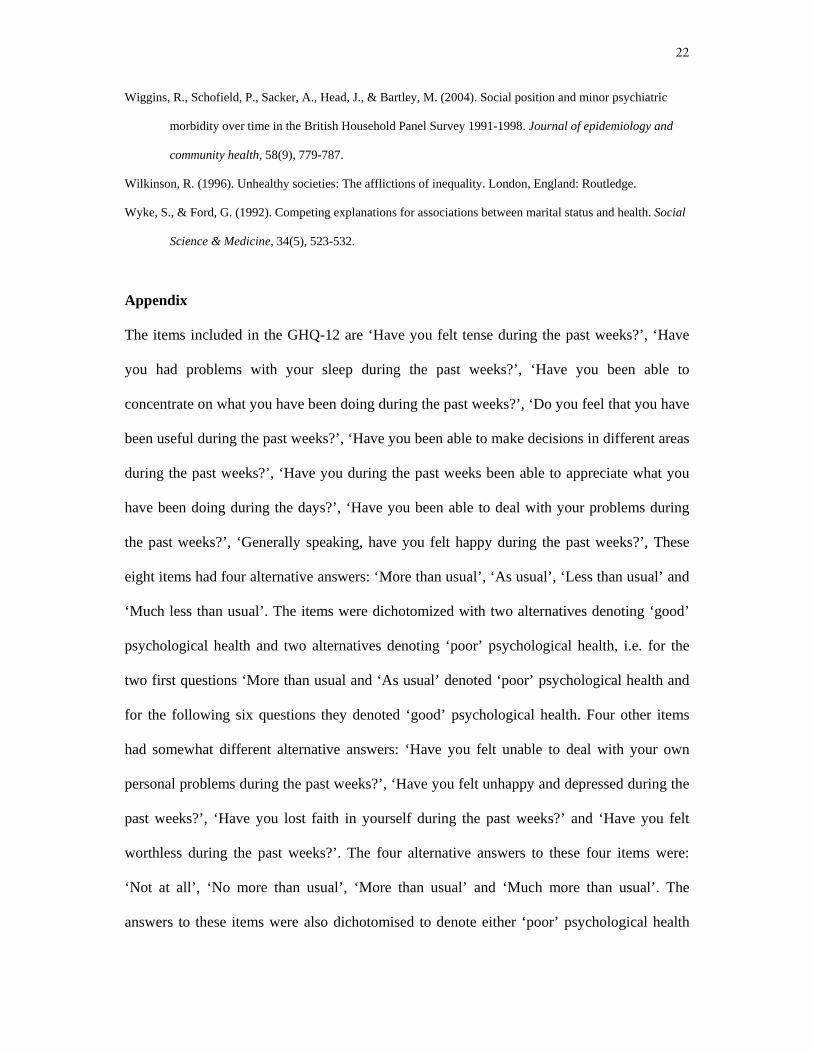
The items included in the GHQ-12 are ‘Have you felt tense during the past weeks?’, ‘Have
you had problems with your sleep during the past weeks?’, ‘Have you been able to
concentrate on what you have been doing during the past weeks?’, ‘Do you feel that you have
been useful during the past weeks?’, ‘Have you been able to make decisions in different areas
during the past weeks?’, ‘Have you during the past weeks been able to appreciate what you
have been doing during the days?’, ‘Have you been able to deal with your problems during
the past weeks?’, ‘Generally speaking, have you felt happy during the past weeks?’, These
eight items had four alternative answers: ‘More than usual’, ‘As usual’, ‘Less than usual’ and
‘Much less than usual’. The items were dichotomized with two alternatives denoting ‘good’
psychological health and two alternatives denoting ‘poor’ psychological health, i.e. for the
two first questions ‘More than usual and ‘As usual’ denoted ‘poor’ psychological health and
for the following six questions they denoted ‘good’ psychological health. Four other items
had somewhat different alternative answers: ‘Have you felt unable to deal with your own
personal problems during the past weeks?’, ‘Have you felt unhappy and depressed during the
past weeks?’, ‘Have you lost faith in yourself during the past weeks?’ and ‘Have you felt
worthless during the past weeks?’. The four alternative answers to these four items were:
‘Not at all’, ‘No more than usual’, ‘More than usual’ and ‘Much more than usual’. The
answers to these items were also dichotomised to denote either ‘poor’ psychological health

23
(‘more than usual’ and ‘much more than usual’) or ‘good’ psychological health (‘not at all’
and ‘no more than usual’). If three or more of all the 12 items denoted ‘poor’ psychological
health, the general psychological health (GHQ-12) was denoted as ‘poor’.
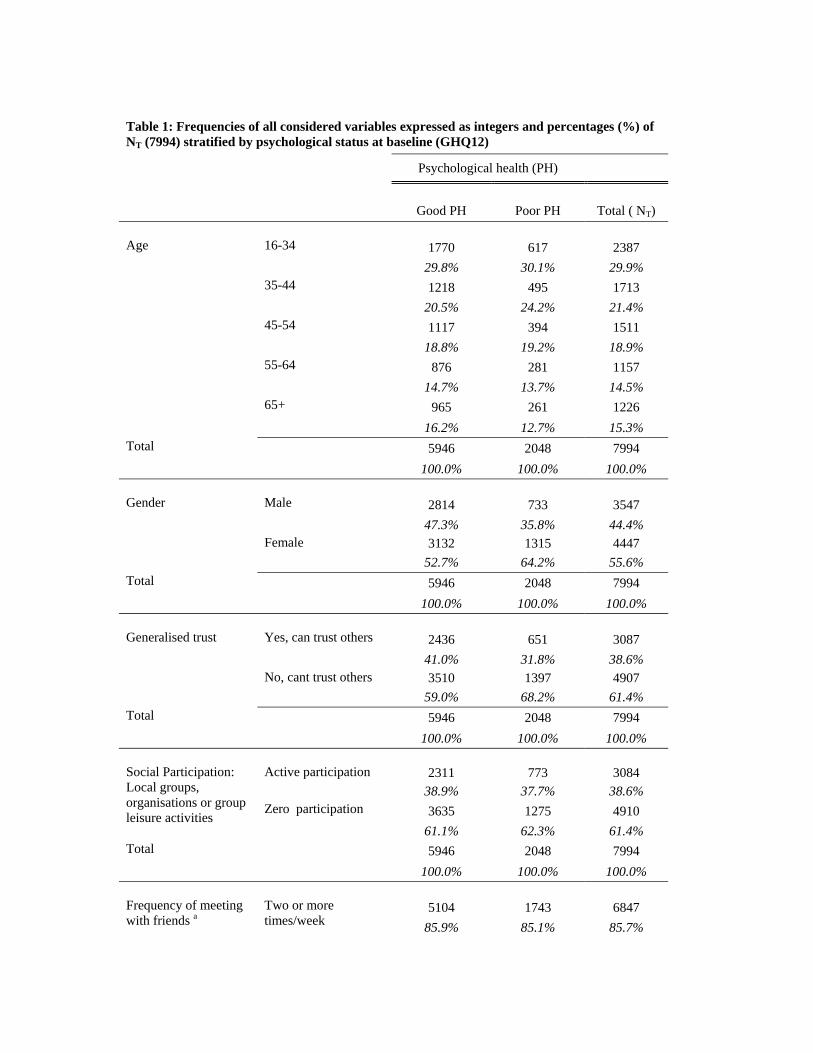
Table 1: Frequencies of all considered variables expressed as integers and percentages (%) of NT (7994) stratified by psychological status at baseline (GHQ12)
Psychological health (PH)
Good PH Poor PH Total ( NT)
Age 16-34 1770 617 2387
29.8% 30.1% 29.9% 35-44 1218 495 1713
20.5% 24.2% 21.4% 45-54 1117 394 1511
18.8% 19.2% 18.9% 55-64 876 281 1157
14.7% 13.7% 14.5% 65+ 965 261 1226
16.2% 12.7% 15.3% Total 5946 2048 7994
100.0% 100.0% 100.0% Gender Male 2814 733 3547
47.3% 35.8% 44.4% Female 3132 1315 4447
52.7% 64.2% 55.6% Total 5946 2048 7994
100.0% 100.0% 100.0% Generalised trust Yes, can trust others 2436 651 3087
41.0% 31.8% 38.6% No, cant trust others 3510 1397 4907
59.0% 68.2% 61.4% Total 5946 2048 7994
100.0% 100.0% 100.0% Social Participation: Local groups, organisations or group leisure activities
Active participation 2311 773 3084 38.9% 37.7% 38.6%
Zero participation 3635 1275 4910
61.1% 62.3% 61.4% Total 5946 2048 7994
100.0% 100.0% 100.0% Frequency of meeting with friends a
Two or more times/week
5104 1743 6847
85.9% 85.1% 85.7%
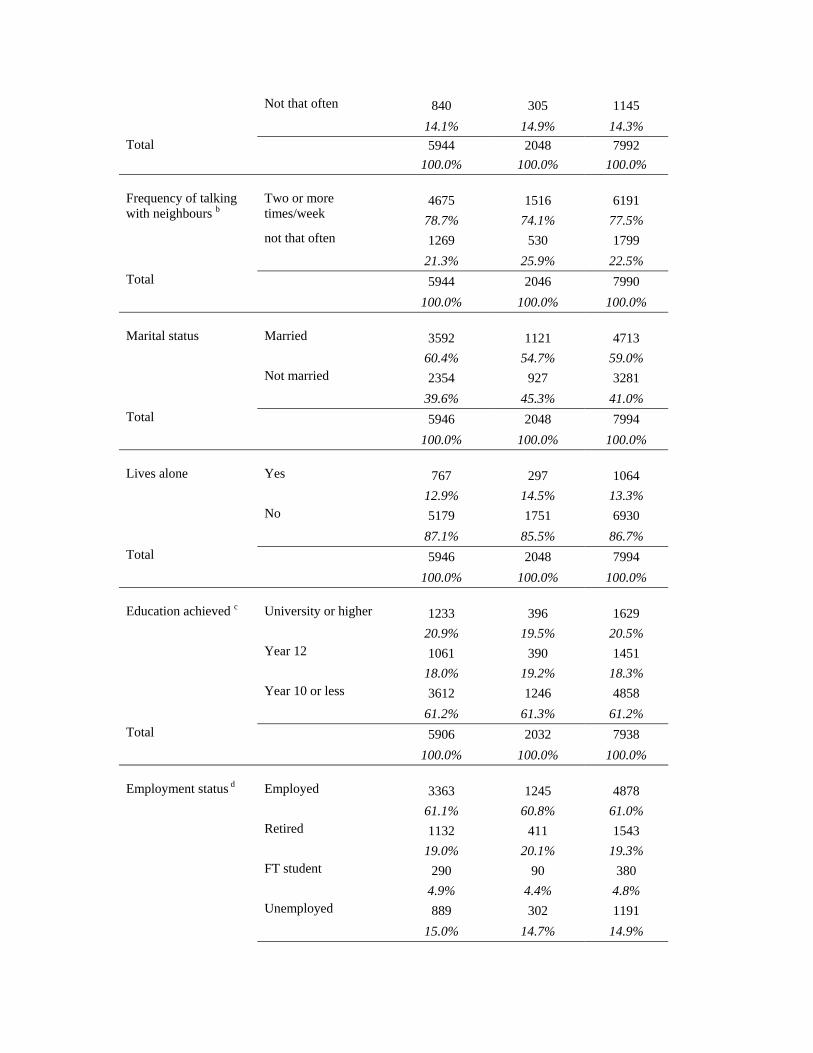
Not that often 840 305 1145
14.1% 14.9% 14.3% Total 5944 2048 7992
100.0% 100.0% 100.0% Frequency of talking with neighbours b
Two or more times/week
4675 1516 6191
78.7% 74.1% 77.5% not that often 1269 530 1799
21.3% 25.9% 22.5% Total 5944 2046 7990
100.0% 100.0% 100.0% Marital status Married 3592 1121 4713
60.4% 54.7% 59.0% Not married 2354 927 3281
39.6% 45.3% 41.0% Total 5946 2048 7994
100.0% 100.0% 100.0% Lives alone Yes 767 297 1064
12.9% 14.5% 13.3% No 5179 1751 6930
87.1% 85.5% 86.7% Total 5946 2048 7994
100.0% 100.0% 100.0% Education achieved c University or higher 1233 396 1629
20.9% 19.5% 20.5% Year 12 1061 390 1451
18.0% 19.2% 18.3% Year 10 or less 3612 1246 4858
61.2% 61.3% 61.2% Total 5906 2032 7938
100.0% 100.0% 100.0% Employment status d Employed 3363 1245 4878
61.1% 60.8% 61.0% Retired 1132 411 1543
19.0% 20.1% 19.3% FT student 290 90 380
4.9% 4.4% 4.8% Unemployed 889 302 1191
15.0% 14.7% 14.9%
Total 5944 2048 7992
100.0% 100.0% 100.0% Social class e High 3324 1131 4455
42.5% 56.5% 56.9% Low 2359 800 3159
30.1% 40.0% 40.3% Total 5683 1931 7614
100.0% 100.0% 100.0% Household income (annual) - size weighted
< £9588 1371 615 1986
23.1% 30.0% 24.8% £9589-£15 055 1476 512 1988
24.8% 25.0% 24.9% £15 056-£22 493 1535 474 2009
25.8% 23.1% 25.1% £22 494 + 1564 447 2011
26.3% 21.8% 25.2% Total 5946 2048 7994
100.0% 100.0% 100.0%
Source: The British Household Panel Survey Wave J, 2000 a Missing N = 2 d Missing N = 2 b Missing N = 4 e Missing N = 380 c Missing N = 56
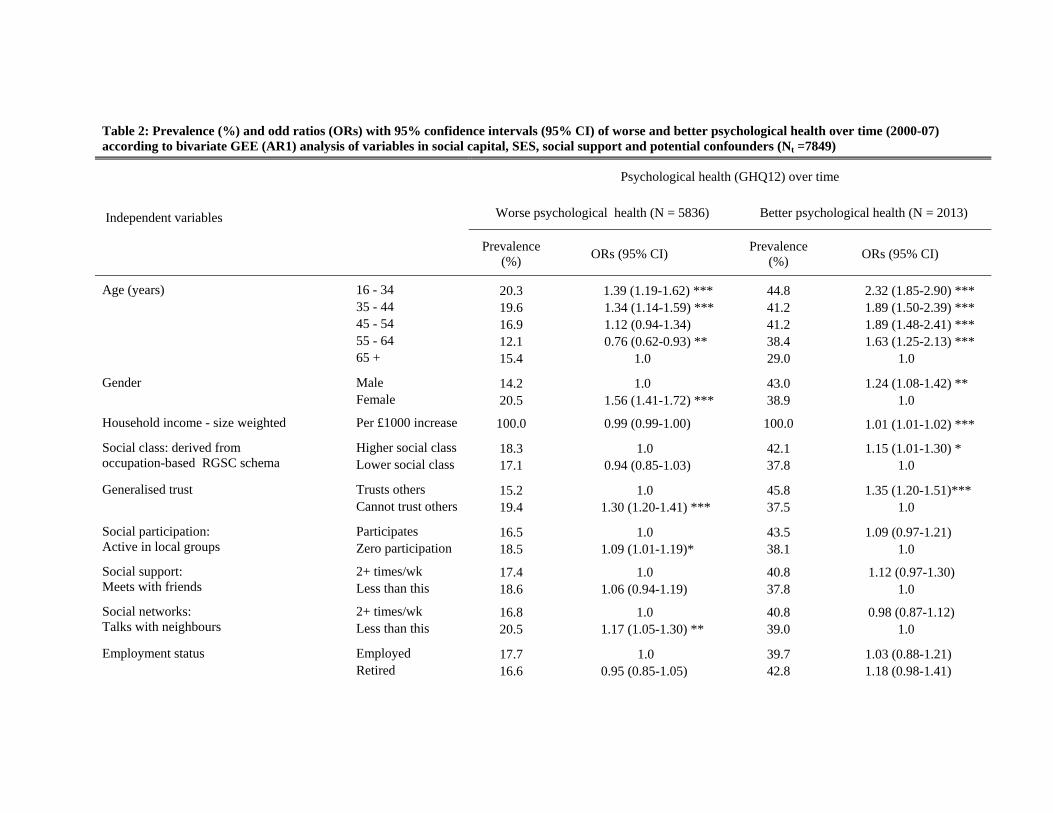
Table 2: Prevalence (%) and odd ratios (ORs) with 95% confidence intervals (95% CI) of worse and better psychological health over time (2000-07) according to bivariate GEE (AR1) analysis of variables in social capital, SES, social support and potential confounders (Nt =7849)
Independent variables
Psychological health (GHQ12) over time
Worse psychological health (N = 5836) Better psychological health (N = 2013)
Prevalence (%)
ORs (95% CI) Prevalence
(%) ORs (95% CI)
Age (years) 16 - 34 20.3 1.39 (1.19-1.62) *** 44.8 2.32 (1.85-2.90) *** 35 - 44 19.6 1.34 (1.14-1.59) *** 41.2 1.89 (1.50-2.39) *** 45 - 54 16.9 1.12 (0.94-1.34) 41.2 1.89 (1.48-2.41) *** 55 - 64 12.1 0.76 (0.62-0.93) ** 38.4 1.63 (1.25-2.13) *** 65 + 15.4 1.0 29.0 1.0
Gender Male 14.2 1.0 43.0 1.24 (1.08-1.42) ** Female 20.5 1.56 (1.41-1.72) *** 38.9 1.0
Household income - size weighted Per £1000 increase 100.0 0.99 (0.99-1.00) 100.0 1.01 (1.01-1.02) ***
Social class: derived from occupation-based RGSC schema
Higher social class 18.3 1.0 42.1 1.15 (1.01-1.30) * Lower social class 17.1 0.94 (0.85-1.03) 37.8 1.0
Generalised trust Trusts others 15.2 1.0 45.8 1.35 (1.20-1.51)*** Cannot trust others 19.4 1.30 (1.20-1.41) *** 37.5 1.0
Social participation: Active in local groups
Participates 16.5 1.0 43.5 1.09 (0.97-1.21) Zero participation 18.5 1.09 (1.01-1.19)* 38.1 1.0
Social support: Meets with friends
2+ times/wk 17.4 1.0 40.8 1.12 (0.97-1.30) Less than this 18.6 1.06 (0.94-1.19) 37.8 1.0
Social networks: Talks with neighbours
2+ times/wk 16.8 1.0 40.8 0.98 (0.87-1.12) Less than this 20.5 1.17 (1.05-1.30) ** 39.0 1.0
Employment status Employed 17.7 1.0 39.7 1.03 (0.88-1.21) Retired 16.6 0.95 (0.85-1.05) 42.8 1.18 (0.98-1.41)
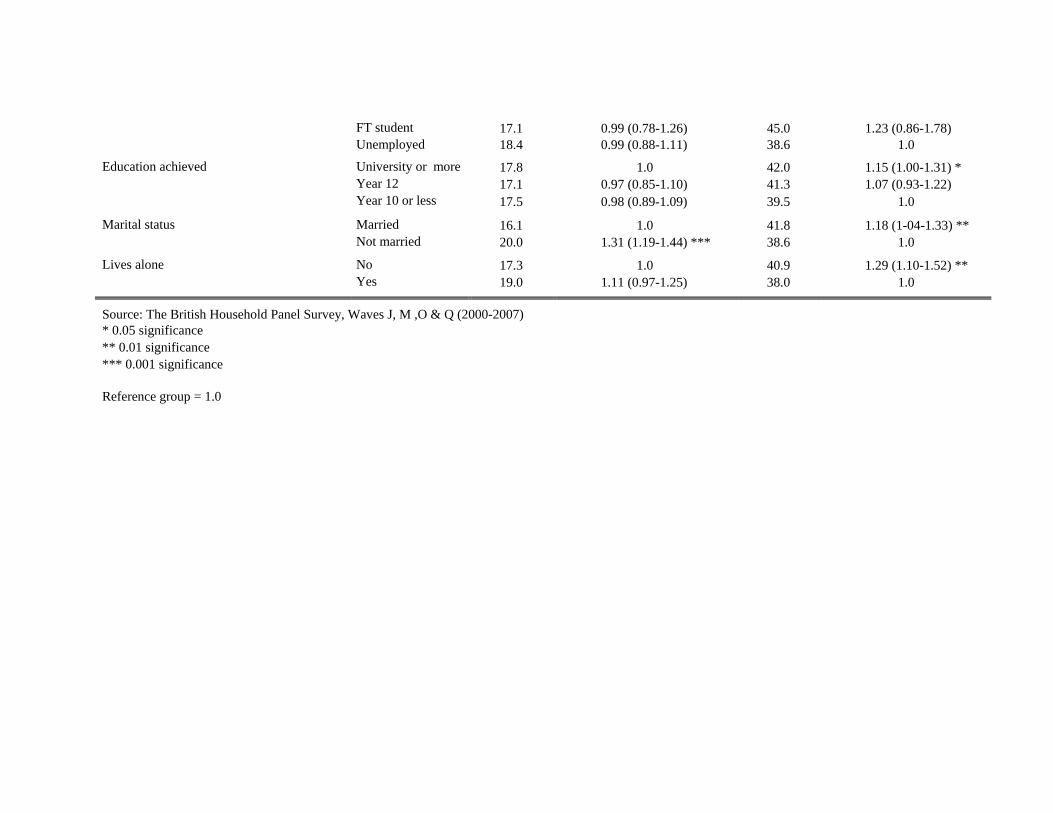
FT student 17.1 0.99 (0.78-1.26) 45.0 1.23 (0.86-1.78) Unemployed 18.4 0.99 (0.88-1.11) 38.6 1.0
Education achieved University or more 17.8 1.0 42.0 1.15 (1.00-1.31) * Year 12 17.1 0.97 (0.85-1.10) 41.3 1.07 (0.93-1.22) Year 10 or less 17.5 0.98 (0.89-1.09) 39.5 1.0
Marital status Married 16.1 1.0 41.8 1.18 (1-04-1.33) ** Not married 20.0 1.31 (1.19-1.44) *** 38.6 1.0
Lives alone No 17.3 1.0 40.9 1.29 (1.10-1.52) ** Yes 19.0 1.11 (0.97-1.25) 38.0 1.0
Source: The British Household Panel Survey, Waves J, M ,O & Q (2000-2007) * 0.05 significance ** 0.01 significance *** 0.001 significance
Reference group = 1.0

Table 3: Odd ratios (ORs) with 95% confidence intervals (95% CI) of better or worse psychological health over time within a multivariable GEE (AR1) model containing all significant variables from previous bivariate analyses (NT = 7399)
Independent variables Psychological health status (GHQ12) over time
Worse psychological health (N = 5836) ORs (95% CI)
Better psychological health (N = 2013) ORs (95% CI)
Age (years) 16 - 34 1.0 2.16 (1.69-2.75) *** 35 - 44 1.03 (0.90-1.18) 1.65 (1.29-2.12) *** 45 - 54 0.88 (0.76-1.01) 1.66 (1.28-2.15) *** 55 - 64 0.59 (0.50-0.70) *** 1.54 (1.18-2.02) ** 65 + 0.74 (0.63-0.87) *** 1.0
Gender Male 1.0 a 1.21 (1.05-1.39) **
Female 1.55 (1.41-1.71) *** 1.0 a Household income/£1000 increase Continuous NA 1.01 (1.00-1.01) * Social participation: Active in local groups
Participates 1.0 a NA Zero participation 1.03 (0.95-1.13) NA
Generalised trust Trusts others 1.0 a 1.32 (1.17-1.48) ***
Can't trust others 1.25 (1.15-1.36) *** 1.0 a Social networks: Talks with neighbours
Talks 2+/wk 1.0 a NA Talks less 1.12 (1.01-1.24) * NA
Social class: derived from occupation-based RGSC schema
High SC NA 1.06 (0.93-1.21) Low SC NA 1.0 a
Living alone Lives alone NA 1.0 a
Lives with others NA 1.01 (0.84-1.22)
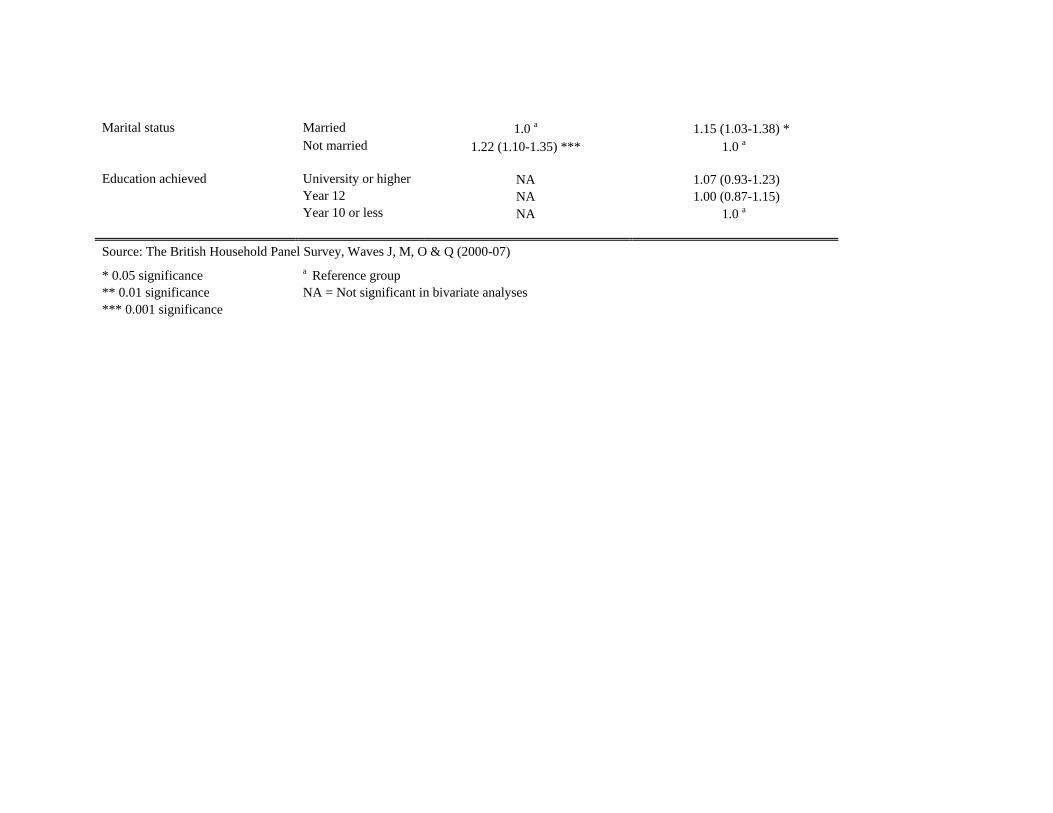
Marital status Married 1.0 a 1.15 (1.03-1.38) * Not married 1.22 (1.10-1.35) *** 1.0 a
Education achieved University or higher NA 1.07 (0.93-1.23)
Year 12 NA 1.00 (0.87-1.15) Year 10 or less NA 1.0 a
Source: The British Household Panel Survey, Waves J, M, O & Q (2000-07)
* 0.05 significance a Reference group ** 0.01 significance NA = Not significant in bivariate analyses *** 0.001 significance
Related Documents