Lost Lake 2017 AIS Monitoring & Protection & Rehabilitation District. Control Strategy Assessment Report January 2018 1 INTRODUCTION Lost Lake, Vilas County, is a shallow (mixed) lowland drainage lake with a maximum depth of 24 feet and a surface area of 552 acres. This eutrophic lake has a relatively large watershed when compared to the size of the lake (20:1) and has a water residence time of approximately 6 months. Following the discovery of Eurasian watermilfoil (EWM) in 2013 and curly-leaf pondweed (CLP) in 2014, the Lost Lake Protection and Rehabilitation District (LLPRD) initiated an Aquatic Invasive Species (AIS) early detection and response framework with increased AIS population monitoring. The initial project design included a set of AIS mapping surveys to coordinate and qualitatively monitor EWM hand-removal efforts (Figure 1). While EWM hand-harvesting efforts were discontinued after 2015, the series of two monitoring events per year continued. The first monitoring event during each calendar year is the Early Season Aquatic Invasive Species (ESAIS) Survey. This late-spring/early-summer survey provides an early look at the lake to help guide an EWM hand- harvesting management program as well to coincide with the peak growth stage of CLP. As the name suggests, the late-Summer EWM Peak-Biomass Survey occurs when EWM is at its peak growth stage. This survey provides the most useful assessment of the EWM population in a given year and can also be used to assess any hand-harvesting efforts that occurred since the ESAIS Survey. Partial funding for the monitoring and control strategy (2013-2018) was received through two Wisconsin Department of Natural Resources (WDR) AIS-Early Detection and Response (EDR) grants. This report discusses the AIS monitoring efforts conducted in 2017 on Lost Lake. EURASIAN WATERMILFOIL Eurasian water-milfoil is unique in that its primary mode of propagation is not by seed. The perennial plant primarily spreads by shoot fragmentation, which has supported its transport between lakes via boats and other equipment. In addition to its propagation method, EWM has two other competitive advantages over native aquatic plants, 1) it retains most of its biomass over winter and resumes active growth almost immediately following ice-out, and 2) once its stems reach the water surface, it often does not stop growing like most native plants, instead it continues to grow along the surface creating a canopy that blocks light from reaching native plants. EWM populations on Lost Lake were initially targeted through professional hand-harvesting activities (2013-2015). The hand-harvesting provided modest reductions in the areas where the hand-harvesting occurred, but the EWM population increase was greater than the amount of EWM that was being Figure 1. EWM hand-harvesting planning and monitoring diagram.

Welcome message from author
This document is posted to help you gain knowledge. Please leave a comment to let me know what you think about it! Share it to your friends and learn new things together.
Transcript

Lost Lake 2017 AIS Monitoring & Protection & Rehabilitation District. Control Strategy Assessment Report
January 2018 1
INTRODUCTION
Lost Lake, Vilas County, is a shallow (mixed) lowland drainage lake with a maximum depth of 24 feet and a surface area of 552 acres. This eutrophic lake has a relatively large watershed when compared to the size of the lake (20:1) and has a water residence time of approximately 6 months. Following the discovery of Eurasian watermilfoil (EWM) in 2013 and curly-leaf pondweed (CLP) in 2014, the Lost Lake Protection and Rehabilitation District (LLPRD) initiated an Aquatic Invasive Species (AIS) early detection and response framework with increased AIS population monitoring. The initial project design included a set of AIS mapping surveys to coordinate and qualitatively monitor EWM hand-removal efforts (Figure 1). While EWM hand-harvesting efforts were discontinued after 2015, the series of two monitoring events per year continued. The first monitoring event during each calendar year is the Early Season Aquatic Invasive Species (ESAIS) Survey. This late-spring/early-summer survey provides an early look at the lake to help guide an EWM hand-harvesting management program as well to coincide with the peak growth stage of CLP. As the name suggests, the late-Summer EWM Peak-Biomass Survey occurs when EWM is at its peak growth stage. This survey provides the most useful assessment of the EWM population in a given year and can also be used to assess any hand-harvesting efforts that occurred since the ESAIS Survey. Partial funding for the monitoring and control strategy (2013-2018) was received through two Wisconsin Department of Natural Resources (WDR) AIS-Early Detection and Response (EDR) grants. This report discusses the AIS monitoring efforts conducted in 2017 on Lost Lake. EURASIAN WATERMILFOIL
Eurasian water-milfoil is unique in that its primary mode of propagation is not by seed. The perennial plant primarily spreads by shoot fragmentation, which has supported its transport between lakes via boats and other equipment. In addition to its propagation method, EWM has two other competitive advantages over native aquatic plants, 1) it retains most of its biomass over winter and resumes active growth almost immediately following ice-out, and 2) once its stems reach the water surface, it often does not stop growing like most native plants, instead it continues to grow along the surface creating a canopy that blocks light from reaching native plants. EWM populations on Lost Lake were initially targeted through professional hand-harvesting activities (2013-2015). The hand-harvesting provided modest reductions in the areas where the hand-harvesting occurred, but the EWM population increase was greater than the amount of EWM that was being
Figure 1. EWM hand-harvesting planning and monitoring diagram.

Lost Lake 2017 AIS Monitoring & Protection & Rehabilitation District. Control Strategy Assessment Report
January 2018 2
removed each year (Figure 2). Once the population exceeded a threshold where these activities were thought to no longer be feasible, the LLPRD opted to discontinue further active management until it understands if the EWM population will continue to increase or if it will plateau at a level where the ecosystem function and navigation, recreation, and aesthetics are not impeded. The decision to cease active management of the EWM population was partially based on the WDNR EWM Long-Term Trends Monitoring Program.
September 2014 September 2015
September 2016 September 2017
Figure 2. Eurasian Water Milfoil population progression on Lost Lake.
Starting in 2005, WDNR Science Services began conducting annual point-intercept aquatic plant surveys on a set of lakes to understand how EWM populations vary over time. This was in response to commonly held beliefs of the time that once EWM becomes established in a lake, its population would
!( !(
!(!(!(!(!(!(!(!(!(!(
!(
!(
!(!(!(!(
!( !(
!(
!(!(
!(
!(
!(
!(
!(
!(!(!(!(
!(
!(
!(
"p
!(
!(
!(
!(
!(!(
!(!(!(
!(!(!(!(!(!(!(!(!(!(!(!(!(!(!(!(
!(!(!(!(!(!(!(
!(!(!(!(!(!(
!(!(!(!(!(!(!(!(!(!( !(!(!(!(!(!(
!(!(!(!(!(!(!(!(!(!(!(
!(!(!(!(!(!(!(!(!(!(!(!(!(!(!(!(!(!(!(!( !(!(!(!(!(!(!(!(!(!(!(!(!(
!(!(!(!(!( !(!(
!(!(!(!(!(!(!(!(!(!( !(!(!(!(!(!(!(!(!(
!(!(!(
!(
!(!(!(!(!(
!(
!(!(!(
!(!(!(!(!(!(
!(
!(!(
!(!(
!(!(
!(
!(!(!(
!(
!(!(!(!(!(!(!(!(
!(!(!(
!(
!(!(
!(
!(!(
!(!(!(!(!(!(!(!(!(!(!(!(!(!(
!(!(
!(!(!(!(!(!(!(!(!(
!(
!(!(!(!(!(
!(!(!(!(!(!(
!(
!(
!(!(
!(
"p
Legend
Surface Matting
Highly ScatteredScatteredDominant
Highly Dominant
Single or Few PlantsClumps of PlantsSmall Plant Colony
!(
!(
!(
!(
!(
!(
!(
!(
!(
!(
!(
!(!(!(!(!(!(!(!(!(!(
!(
!(!(!(
!(
!( !(!(
!(!(!(!(!(
!(!(!(
!(!(
!(
!(
!(
!(
!(
!(
!(!(
!(
!(
!( !(
!(!(!(
!(
"p

Lost Lake 2017 AIS Monitoring & Protection & Rehabilitation District. Control Strategy Assessment Report
January 2018 3
continue to increase over time. As outlined in The Science Behind the “So-Called” Super Weed (Nault 2016), EWM population dynamics on lakes are not that simplistic. The results of this ongoing study often referred to as the WDNR Long-Term EWM Trends Monitoring Research Project, indicate that EWM populations in unmanaged lakes can fluctuate greatly between years. Following initial infestation, EWM expansion was rapid on some lakes, but overall was variable and unpredictable. On some lakes, the EWM populations reached a relatively stable equilibrium whereas other lakes had more moderate year-to-year variation. Regional climatic factors also seem to be a driver in EWM populations, as many unmanaged EWM populations in the study declined in 2015 even though the lakes were at vastly different points in time following initial detection within the lake. The largest concentration of EWM in 2017 was found within the eastern bay of Lost Lake similar to the results of the 2013-2016 surveys (Figure 2). The majority of the colonized population of EWM was of a highly scattered or scattered density. The extent of the 2017 EWM population in Lost Lake is roughly the same as in 2016, perhaps slightly less dense. An increase in the number of single or few plant occurrences were located in the northernmost bay of the lake during 2017 compared to previous years. CURLY-LEAF PONDWEED
Curly-leaf pondweed is a European exotic first discovered in Wisconsin in the early 1900’s that has an unconventional lifecycle giving it a competitive advantage over our native plants. The plants begin rapidly growing almost immediately after, if not before, ice-out and by early-summer they reach their peak growth. As they are growing, each plant produces numerous turions (asexual reproductive structures) which break away from the plant and settle to the bottom following the plant’s senescence in early summer (Photograph 1). The deposited turions lie dormant until autumn when a portion of them sprout to produce small winter foliage, and they remain in this state until spring foliage is produced. The portion of turions that do not sprout can remain dormant for at least 5 years (likely longer) and still sprout (Johnson et al. 2012). The advanced growth in spring gives the plant a significant head start over native vegetation. In certain lakes, CLP can become so abundant that it hampers recreational activities within the lake. In instances where large CLP populations are present, its mid-summer die-back can cause significant algal blooms spurred from the release of nutrients during the plants’ decomposition (James et al. 2002). However, in some lakes, mostly in northern Wisconsin, CLP appears to integrate itself within the community without becoming a nuisance or having a measurable impact to the ecological function of the lake. The CLP population in Lost Lake was found to have dramatically increased from 2014 to 2016 (Figure 3). Much of the CLP population in the western bay expanded to form large, continuous, and dense colonies in 2016. A total of 17.9 acres of colonized CLP was mapped during the June 2016 survey, all of which was described of as being of dominant or greater densities. Approximately 2.0 acres of the
Photograph 1. Curly-leaf pondweed turion. From Lost Lake, 2015.

Lost Lake 2017 AIS Monitoring & Protection & Rehabilitation District. Control Strategy Assessment Report
January 2018 4
CLP was described as surface matting, the highest density rating used in the qualitative mapping methodology. An additional 6.7 acres of CLP was described as highly dominant during the 2016 survey. These highly visible, very dense CLP colonies completely dominate the aquatic plant population and can significantly inhibit navigation for boaters until the plant dies back in early July. For reasons not completely known, the CLP population on Lost Lake has been documented to persist much later in the growing season than other waterbodies.
June 2014 June 2015
June 2016
Figure 3. Curly-leaf Pondweed population progression on Lost Lake.
As discussed above, some lakes in northern Wisconsin contain CLP populations that appear to have integrated within the aquatic plant community without becoming a nuisance or causing measurable impacts to the lake ecosystem. Acknowledging that possibility for Lost Lake, the LLPRD did not reactively conduct active management on the CLP population in 2014-2016, rather monitored the population dynamics. In 2016, reductions in navigation and recreation were documented on Lost Lake.
!(!(!(!(!(
!(
!(!(!(!(
!(
"p
!(
!(
!(!(!(!(!(!(!(!(!(!(!(
!(!(!(!(!(
!(!(!(!(!(!(!(!(!( !(!(!(!(!( !(!(!(!(!(!(!(!(!(!(!(!(!(!(!(!(
!(!(!(!(!(!(!(!(!(!(
!(!(!(!(!(!(!(!(!(!(!(!(!(!(!(!(!( !(!(!(!(
!(!(!(!(!(!(!(!(!(!(!(!(
!(!(
!(!(!(!(!(!(!(!(!(!(!(!(!(!(!(!(!(!(
!(
"p
"p!(!(!(
!(!(!(!(
!(!(
!(!(!(
!(!(!(!(!(
!(
!(
!(
!(
!(!(!(!(!(
!(!(!(!(!(!(!(!( !(!(!(!(!(!(!(!(!(
!(!(!(!(!(!(!(!(
!(!(!(!(!(!(!(!(!(!(!(!(!(!(!(
!(!(!(!(!(!(!(
!(!(
!(
!(!(
!(!(!(!(!(!(!(!(!(!(!(!(!(!(
!(!(!(!(!(!(
!(!(!(!(!(!(!(
!(
!(!(
!(!(!(
!(!(!(!(
!(
!(!(
!(!(
!(
!(
!( !( !(!(!(!(!(!(!(
!(!(!(!(!(!(!(!(!(
!(!(!(!(
!(!(
!(!(!(!(
!(!(!(
!(!(
!(
!(!(
!(!(!(
Legend
Surface Matting
Highly ScatteredScatteredDominant
Highly Dominant
Single or Few PlantsClumps of PlantsSmall Plant Colony
!(
!(
!(

Lost Lake 2017 AIS Monitoring & Protection & Rehabilitation District. Control Strategy Assessment Report
January 2018 5
2017 CLP Control Strategy
During the late-fall/winter of 2016-17, there were a number of correspondences between the district and Onterra discussing the possibility of conducting an herbicide control strategy during the spring of 2017. Factors such as environmentally toxicity of the treatment including likely native plant impacts, the need for multiple subsequent annual treatments, and potential regulatory opposition where weighed heavily. Following these discussions, the LLPRD board of directors supported pursuing an herbicide spot treatment targeting the largest and densest population of CLP during the spring of 2017. The preliminary strategy was outlined within the 2016 AIS Monitoring & Control Strategy Assessment Report originally distributed in mid-February 2017. The WDNR provided written review of the preliminary plan approximately a month later and subsequently initiated a round-table meeting at the Town of Saint Germain Community Center on April 10th, 2017. Based upon the WDNR’s review comments and discussion held at the April meeting, updates to the monitoring strategy were made, including the addition of an herbicide concentration monitoring component. This component would allow an understanding of how the herbicide dissipated following the treatment. The revised strategy was included in a revised version of the 2016 AIS Monitoring & Control Strategy Assessment Report (May 2017). The report also addressed a WDNR comment requesting increased clarity that CLP control strategies require repeat annual treatments to ensure the LLPRD was aware of this reality. The LLPRD and the chosen third-party applicator selected by the district, Clean Lakes, applied for a WDNR permit during late-March 2017 to target the CLP within 29.5 acres in the western bay with liquid endothall at 2.0 ppm active ingredient (ai), a typical herbicide spot-treatment dose targeting this species. The EPA-approved endothall label (Aquathol® K) recommends 1.5 to 3.0 ppm ai for spot treatments of CLP although the label approves application up to 5.0 ppm ai. The 2017 Lost Lake herbicide application equates to 5.3% of the lake’s acreage and 3.8% of the lake’s mixing volume (lake is polymictic). Treatment Monitoring Strategy
The theoretical objective of an herbicide treatment strategy is to maximize target species (CLP) mortality while minimizing impacts to native aquatic plant species. Monitoring herbicide treatments and defining their success incorporates both quantitative and qualitative methods. As the name suggests, quantitative monitoring involves comparing number data (or quantities) such as plant frequency of occurrence before and after the control strategy is implemented. Qualitative monitoring is completed by comparing visual data such as AIS colony density ratings before and after the treatments. It is important to note that there are no regulatory requirements nor hard-fast protocols that determine what needs to be done as a part of an AIS control program. The monitoring is completed to understand how well the actions are working to control the target species and to what levels those same actions may be affecting non-target species. The control actions, and the methods used to monitor their efficacy, are evolving, so flexibility in when and how these methods, both quantitative and qualitative, are used is important. Project goals change, funding sources are not always clear, and decisions are often made in the field; therefore, pretreatment data and post treatment data may not always match

Lost Lake 2017 AIS Monitoring & Protection & Rehabilitation District. Control Strategy Assessment Report
January 2018 6
entirely, so judgements in treatment impacts and management decisions need to be made with limited data at times. Qualitative Aquatic Plant Monitoring
Using sub-meter GPS technology, CLP locations have been mapped on Lost Lake since discovery in 2014 (Figure 4). The qualitative mapping is completed typically when the target species is at its peak growth stage and can be seen from the water surface. Observations are recorded to represent points on the lake (single or few plants, clumps of plants, or small plant colonies) or larger beds, which are delineated with polygons and given density ratings (highly scattered < scattered < dominant < highly dominant < surface matted). Submersible video and/or rake tows may be used for determining colony extents, but these methods are not appropriate as the sole method for determining density. Continued monitoring of the CLP population over time using this methodology will allow an understanding of population dynamics within the system in the context of the control actions that have taken place. The results of these surveys will also be used to determine if additional areas in the lake are to be targeted for active management techniques. Quantitative Aquatic Plant Monitoring
For spot treatment strategies like the 2017 treatment on Lost Lake, quantitative evaluation methodologies generally follow WDNR guidance in which point-intercept data are collected within the treatment area before and after the spring treatment. Quantitative sampling utilizing a point-intercept grid over the treatment area is typically only completed on treatment areas 10 acres or larger to allow for sufficient sampling points to assure confidence in statistics generated from the results. Quantitative sampling can be completed on smaller treatment areas, but greater differences in pre- and post-data must be documented to bring about confidence in the statistical analysis. An approximate four-week gap is standard between an herbicide treatment and a post treatment assessment to allow time for plant death. Curly-leaf pondweed may be starting to naturally senesce (die back) by that time, making it difficult to determine if a reduction in CLP following a spring treatment was caused by the treatment, natural senescence, or both. The theoretical goal of CLP management is to kill the plants each year before they are able to produce and deposit new turions. Not all of the turions produced in one year sprout new plants the following year; many lie dormant in the sediment to sprout in subsequent years. This results in a sediment turion bank being developed. Normally a control strategy for an established CLP population includes 5-7 years of treatments of the same area to deplete the existing turion bank within the sediment. Because CLP has only been present in Lost Lake for a few years, some theorize that the turion base may be small and if a control program is initiated at this time, may not require as many successive treatments as a more established population would. Johnson et al. (2012) investigated 9 midwestern lakes that received five consecutive annual large-scale endothall treatments to control CLP. The greatest reductions in CLP frequency, biomass, and turions was observed in the first 2 years of the control program, but continued reductions were observed following all five years of the project. Quantitative data collected annually immediately before the treatment takes place allows for a determination if the CLP population is being reduced in the area over time. To assess the CLP
Lost Lake 2017 AIS Monitoring & Protection & Rehabilitation District. Control Strategy Assessment Report
January 2018 7
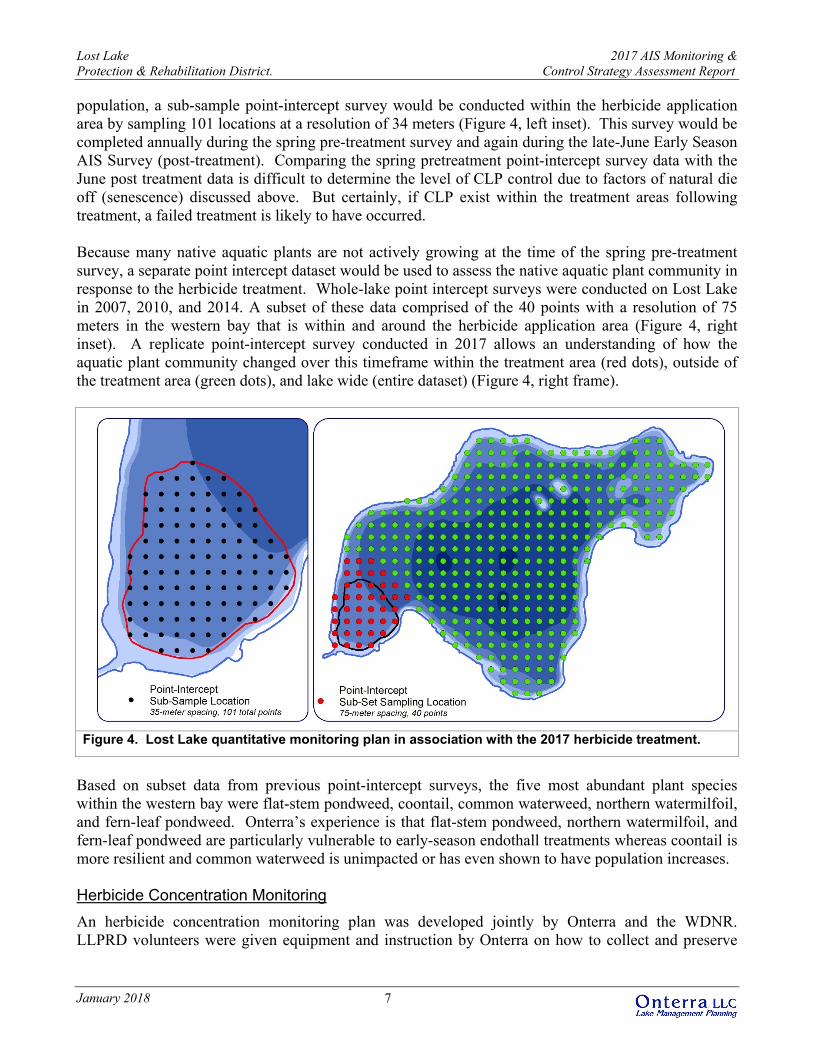
population, a sub-sample point-intercept survey would be conducted within the herbicide application area by sampling 101 locations at a resolution of 34 meters (Figure 4, left inset). This survey would be completed annually during the spring pre-treatment survey and again during the late-June Early Season AIS Survey (post-treatment). Comparing the spring pretreatment point-intercept survey data with the June post treatment data is difficult to determine the level of CLP control due to factors of natural die off (senescence) discussed above. But certainly, if CLP exist within the treatment areas following treatment, a failed treatment is likely to have occurred. Because many native aquatic plants are not actively growing at the time of the spring pre-treatment survey, a separate point intercept dataset would be used to assess the native aquatic plant community in response to the herbicide treatment. Whole-lake point intercept surveys were conducted on Lost Lake in 2007, 2010, and 2014. A subset of these data comprised of the 40 points with a resolution of 75 meters in the western bay that is within and around the herbicide application area (Figure 4, right inset). A replicate point-intercept survey conducted in 2017 allows an understanding of how the aquatic plant community changed over this timeframe within the treatment area (red dots), outside of the treatment area (green dots), and lake wide (entire dataset) (Figure 4, right frame).
Figure 4. Lost Lake quantitative monitoring plan in association with the 2017 herbicide treatment.
Based on subset data from previous point-intercept surveys, the five most abundant plant species within the western bay were flat-stem pondweed, coontail, common waterweed, northern watermilfoil, and fern-leaf pondweed. Onterra’s experience is that flat-stem pondweed, northern watermilfoil, and fern-leaf pondweed are particularly vulnerable to early-season endothall treatments whereas coontail is more resilient and common waterweed is unimpacted or has even shown to have population increases. Herbicide Concentration Monitoring
An herbicide concentration monitoring plan was developed jointly by Onterra and the WDNR. LLPRD volunteers were given equipment and instruction by Onterra on how to collect and preserve

Lost Lake 2017 AIS Monitoring & Protection & Rehabilitation District. Control Strategy Assessment Report
January 2018 8
water samples from Lost Lake that would be analyzed by the Wisconsin State Laboratory of Hygiene for concentrations of endothall. Specifically, water samples were collected with a 6-foot integrated sampler at 3 locations in the treatment area and 2 locations downstream within the Lost Creek at 7 intervals spanning 72 hours after treatment. A recent article by Nault et al. 2017 investigated 28 large-scale herbicide treatments in Wisconsin and found that “herbicide dissipation from the treatment sites into surrounding untreated waters was rapid (within 1 day) and lakewide low-concentration equilibriums were reached within the first few days after application.” This research indicates that lake-wide concentrations of herbicides reach equilibrium within an entire lake by roughly 3 days after treatment. Said another way, the concentration measured in the center of the lake at three days after treatment has been shown to be reflective of the concentration measured anywhere else in the lake at that time. Therefore, the sampling design for the 2017 spot treatment on Lost Lake included collection of a single herbicide concentration sample in the center of the lake at 72 hours after treatment. The data collected in the center of the lake would serve as a surrogate for the likely herbicide concentrations in non-treated parts of the lake. Pretreatment Survey
On May 4, 2017, Onterra ecologists conducted the Spring Pre-treatment Confirmation and Refinement Survey on Lost Lake. A temperature profile indicated the that water temperatures were 49°F throughout the water column. As a part of the survey, the crew conducted a sub-sample point-intercept survey of the proposed treatment area (Figure 4, left frame) and located CLP on approximately 84% of sample locations. Based on water temperatures and the stage of CLP/native plant growth observed during the survey, Onterra advised the district that the treatment should occur as soon as the permit is finalized by the WDNR and the applicator could be mobilized. Ideally, the treatment would occur before mid-depth water temperatures exceed 55°F, but certainly not after they exceed 60°F. The manufacturers of endothall (Aquathol® K), United Phosphorus, Inc. (UPI), have shown that increased systemic activity of the endothall occur when water temperatures are colder (<60°F). Also, at these water temperatures, some of the native plants are dormant and potentially less impacted by the control strategy. The permit was approved by the WDNR on May 17, 2017 and the herbicide treatment occurred on May 24, 2017. The original intent was to alter the dam operations during the herbicide treatment in attempt to keep the herbicide from being flushed downstream before it could impact the CLP as well as reduce potential downstream impacts of the herbicide on vulnerable growth stages of wild rice. However, the heavy amounts of rain during this timeframe greatly limited the ability to impact discharge rates through manipulation of the dam’s spillway. Treatment Results
Herbicide Concentration Data
Endothall is an aquatic herbicide that is applied as either a dipotassium salt or an amine salt. These active ingredients break down following application to endothall acid, the form that acts as an herbicide (Netherland 2009). The 2017 treatment of CLP on Lost Lake used the dipotassium salt at a concentration of 2.0 ppm active ingredient (ai). When broken down into the acid, 2.0 ppm ai equates to 1.42 ppm acid equivalent (ae). The WI State Laboratory of Hygiene is able to test water samples for
Lost Lake 2017 AIS Monitoring & Protection & Rehabilitation District. Control Strategy Assessment Report
January 2018 9
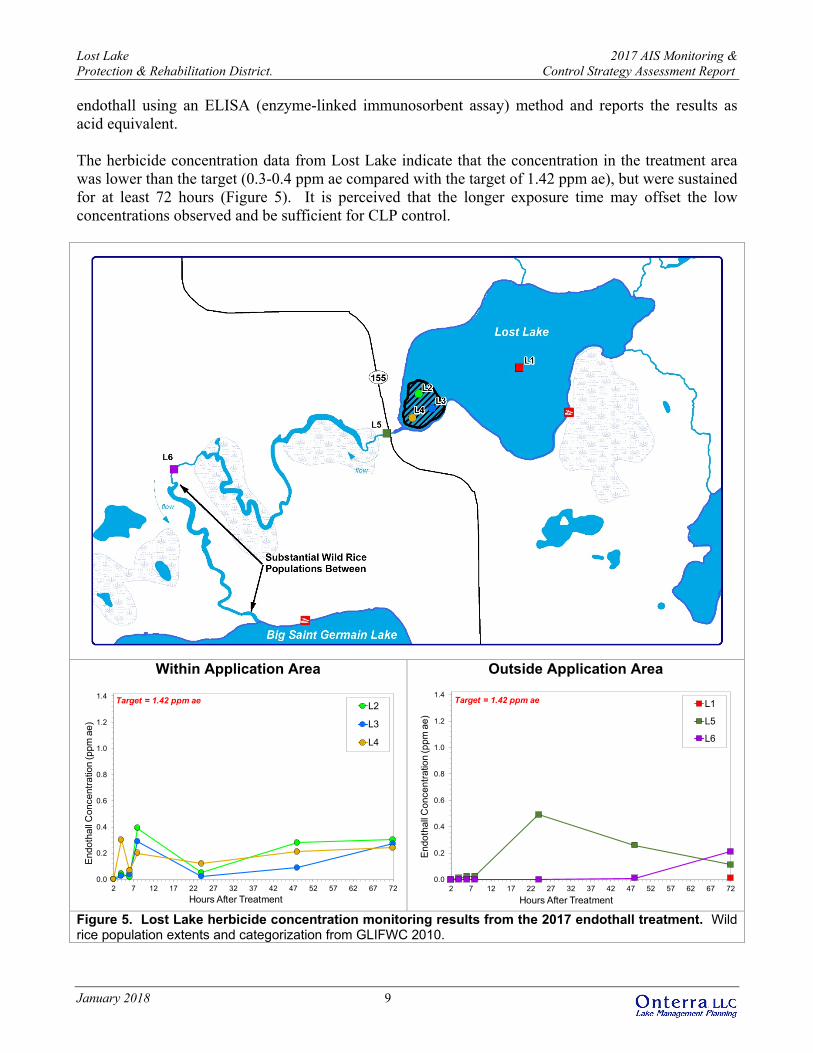
endothall using an ELISA (enzyme-linked immunosorbent assay) method and reports the results as acid equivalent. The herbicide concentration data from Lost Lake indicate that the concentration in the treatment area was lower than the target (0.3-0.4 ppm ae compared with the target of 1.42 ppm ae), but were sustained for at least 72 hours (Figure 5). It is perceived that the longer exposure time may offset the low concentrations observed and be sufficient for CLP control.
Within Application Area Outside Application Area
Figure 5. Lost Lake herbicide concentration monitoring results from the 2017 endothall treatment. Wild rice population extents and categorization from GLIFWC 2010.
0.0
0.2
0.4
0.6
0.8
1.0
1.2
1.4
2 7 12 17 22 27 32 37 42 47 52 57 62 67 72
End
otha
ll C
once
ntra
tion
(ppm
ae)
Hours After Treatment
L2
L3
L4
Target = 1.42 ppm ae
0.0
0.2
0.4
0.6
0.8
1.0
1.2
1.4
2 7 12 17 22 27 32 37 42 47 52 57 62 67 72
En
doth
all C
onc
ent
ratio
n (p
pm a
e)
Hours After Treatment
L1
L5
L6
Target = 1.42 ppm ae

Lost Lake 2017 AIS Monitoring & Protection & Rehabilitation District. Control Strategy Assessment Report
January 2018 10
Low-level herbicide concentrations (0.21 ppm ae) were documented downstream in the Lost Creek (Figure 5), but much below concentrations the published literature documents as having impacts to wild rice (Nelson et al. 2003). That being said, the laboratory research has documented reduced wild rice seedling biomass at the lowest endothall concentration it tested (sustained 0.71 ppm ae for 72 hours). Wild rice impacts at the endothall concentration and exposure times found in Lost Creek have not been tested. At the center of the lake, endothall concentrations were 0.009 ppm ae at 3 days after the treatment. The scientific literature and Onterra’s experience suggest that Lost Lake should have had an equilibrium concentration within the entire waterbody by 3 days after treatment. Based on the almost immeasurable endothall concentrations observed in the center of the lake at this time, the impacts of the spot treatment were likely to be confined to the approximate area of the treatment and not have impacts lake-wide. Efficacy (CLP Control)
The late-June ESAIS Survey revealed that the herbicide treatment was highly effective, with no CLP being located in the western lobe of the lake (Map 1). Because CLP was present at other locations around Lost Lake, it is believed that natural senescence had not factored into the lack of CLP within the area treated. Two relatively small dominant CLP colonies were observed along the northern and western shorelines. Low-density and small-sized CLP populations were documented in a few other parts of the lake during the late-June survey. Field surveyors noted turion formation was occurring at the time of the survey. As noted above, CLP was located at approximately 84% of the sub-sample locations a week prior to the treatment and was not located at any of the 101 sub-sample points within the western bay during the late-June survey. Given the typical life-cycle of CLP, it would be unexpected to find significant amounts of CLP growing during a mid-summer point-intercept survey. However, during the August point-intercept survey of Lost Lake, CLP was located at 9 sampling locations, with the majority being located in the western bay of the lake where the treatment occurred earlier in spring (17% within the treatment area sub-set). This suggests that the CLP plants observed during August had sprouted from turions after the late-June survey. Curly-leaf pondweed has been documented growing within Lost Lake during previous years’ late-summer EWM Peak-Biomass Mapping Surveys. Selectivity (native plant impacts)
The point-intercept sub-set analysis (corresponding locations shown in Figure 4, right frame) reviews the aquatic plant community within the treatment area (red data), those in the non-treated part of the lake (green data,) and within the entire lake-wide dataset (blue data) (Figure 6 and Figure 7). The following analysis will explore the population changes in context of the spring 2017 point-intercept survey. Additional conversation of population changes not entirely related to the herbicide treatment are being explored as a part of an ongoing lake management planning project being undertaken by the LLPRD. Appendix A contains the full matrix of lake-wide point-intercept data results.
Lost Lake 2017 AIS Monitoring & Protection & Rehabilitation District. Control Strategy Assessment Report
January 2018 11
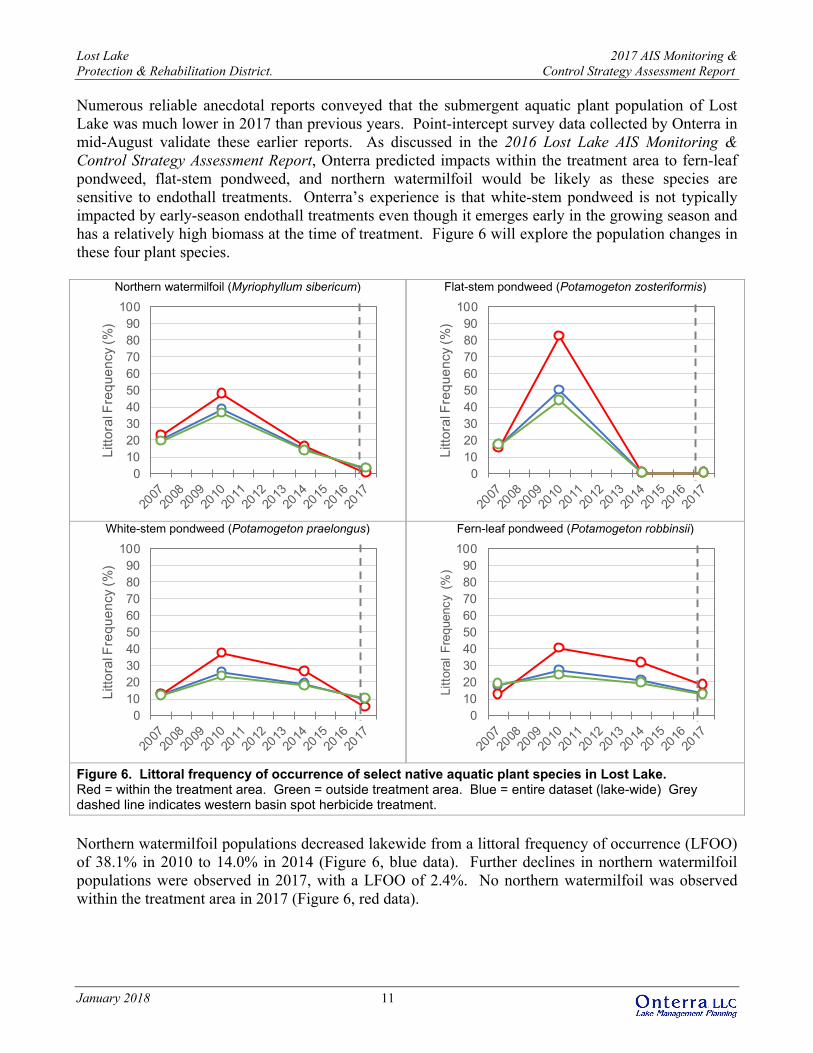
Numerous reliable anecdotal reports conveyed that the submergent aquatic plant population of Lost Lake was much lower in 2017 than previous years. Point-intercept survey data collected by Onterra in mid-August validate these earlier reports. As discussed in the 2016 Lost Lake AIS Monitoring & Control Strategy Assessment Report, Onterra predicted impacts within the treatment area to fern-leaf pondweed, flat-stem pondweed, and northern watermilfoil would be likely as these species are sensitive to endothall treatments. Onterra’s experience is that white-stem pondweed is not typically impacted by early-season endothall treatments even though it emerges early in the growing season and has a relatively high biomass at the time of treatment. Figure 6 will explore the population changes in these four plant species.
Northern watermilfoil (Myriophyllum sibericum) Flat-stem pondweed (Potamogeton zosteriformis)
White-stem pondweed (Potamogeton praelongus) Fern-leaf pondweed (Potamogeton robbinsii)
Figure 6. Littoral frequency of occurrence of select native aquatic plant species in Lost Lake. Red = within the treatment area. Green = outside treatment area. Blue = entire dataset (lake-wide) Grey dashed line indicates western basin spot herbicide treatment.
Northern watermilfoil populations decreased lakewide from a littoral frequency of occurrence (LFOO) of 38.1% in 2010 to 14.0% in 2014 (Figure 6, blue data). Further declines in northern watermilfoil populations were observed in 2017, with a LFOO of 2.4%. No northern watermilfoil was observed within the treatment area in 2017 (Figure 6, red data).
0102030405060708090
100
Litt
ora
l Fre
qu
en
cy (
%)
0102030405060708090
100
Litt
ora
l Fre
qu
en
cy (
%)
0102030405060708090
100
Litt
ora
l Fre
qu
en
cy (
%)
0102030405060708090
100
Litt
oral
Fre
quen
cy (
%)
Lost Lake 2017 AIS Monitoring & Protection & Rehabilitation District. Control Strategy Assessment Report
January 2018 12
The flat-stem pondweed population of Lost Lake has fluctuated greatly over the period of study. No flat-stem pondweed was observed in Lost Lake during 2014 nor 2017 after being the second-most dominant plant species in 2010 (50% LFOO). Both white-stem pondweed and fern-leaf pondweed lake-wide LFOOs increased in 2010 compared to 2007 (Figure 6, blue data). Both populations also declined from 2010 to 2014. Figure 6 confirms that the populations of these two species were higher in the treatment areas (red data) compared to non-treated parts of the lake (green data) during 2010 and 2014. While a lake-wide decline in white-stem pondweed was observed between 2014 to 2017 (Figure 6, blue data), the decline was greater in the treatment area (Figure 6, red data). Fern-leaf pondweed populations also declined lake-wide from 2014 to 2017, but the declines in the treatment area were similar to the lake-wide declines. Figure 7 explores the population changes of species Onterra does not typically observe being impacted by early-season endothall spot treatments. Coontail was the most dominant plant species in Lost Lake during 2007, 2010, and 2014. Lakewide coontail populations have been steadily declining since 2007 (Figure 7, blue data). The 2014 lake-wide coontail LFOO was 38.7% and reduced to 13.2% in 2017. Almost 66% of the sampling locations with the treatment area contained coontail in 2014 and was reduced to just over 10% in 2017 (Figure 7, red data). This decrease was greater than was observed lake-wide. Common waterweed has been shown to metabolize endothall much quicker than other species (particularly pondweeds) and not translocate the herbicide making it tolerant of endothall treatments (Keckemet and Nelson 1968). For reasons not understood, the lakewide common waterweed population reduced from approximately 37% LFOO in 2010 to 6% LFOO in 2014 (Figure 7, blue data), with only one of the 2014 sampling locations with the treatment area containing common waterweed (Figure 7, red data). The lake-wide LFOO in 2017 was statistically unchanged from 2014 although an increase was observed within the treated part of the lake. Slender naiad has been shown to be particularly susceptible to large-scale 2,4-D treatments during the year of treatment (Nault et al. 2017). The population of this annual species was found to increase within the endothall treatment area and lake-wide from 2014 to 2017 on Lost Lake. Slender naiad was the most dominant plant species in Lost Lake during 2017. Wild celery is typically not impacted by most early-season herbicide treatments as this species emerges later in the year after the herbicide has dissipated/degraded. Wild celery population increases were observed lake-wide in Lost Lake from 4.7% LFOO in 2014 to 20.0% LFOO in 2017 (Figure 7, blue data). Increases in the wild celery population within the treated area were less than observed lakewide. Wild celery is the second-most dominant plant species in Lost Lake during 2017. Large-leaf pondweed populations have steadily decreased from almost 17% LFOO in 2007 to 4.4% in 2017 (Figure 7, blue data). Within the treatment area, only 1 sampling point contained large-leaf pondweed in 2014 before the treatment and no sampling points contained large-leaf pondweed after the treatment (Figure 7, red data). Clasping-leaf pondweed populations were statistically unchanged lake-wide (Figure 7, blue data) but indicate reduction within the treated part of lost lake between 2014 and 2017 (Figure 7, red data). Small pondweed, slender pondweed, and stiff pondweed have all been identified from Lost Lake. These morphologically similar looking species are sometimes referred to as thin-leaved pondweeds.

Lost Lake 2017 AIS Monitoring & Protection & Rehabilitation District. Control Strategy Assessment Report
January 2018 13
Analysis of these data requires grouping or “lumping” of the species. Only 1 location in Lost Lake contained any of these species in 2007 (Appendix A). The population of thin-leaved pondweeds increased to almost 40% in 2014. No locations contained thin-leaved pondweeds in 2017.
Coontail (Ceratophyllum demersum) Common waterweed (Elodea canadensis)
Wild celery (Vallisneria americana) Slender naiad (Najas flexilis)
Large-leaf pondweed (Potamogeton amplifolius) Clasping-leaf pondweed (Potamogeton richardsonii)
Figure 7. Littoral frequency of occurrence of select native aquatic plant species in Lost Lake. Red = within the treatment area. Green = outside treatment area. Blue = entire dataset (lake-wide) Grey dashed line indicates western basin spot herbicide treatment.
0102030405060708090
100
Litt
ora
l Fre
qu
en
cy (
%)
0102030405060708090
100
Litt
ora
l Fre
qu
en
cy (
%)
0102030405060708090
100
Litt
ora
l Fre
qu
en
cy (
%)
0102030405060708090
100L
itto
ral F
req
ue
ncy
(%
)
0102030405060708090
100
Litt
ora
l Fre
qu
en
cy (
%)
0102030405060708090
100
Litt
ora
l Fre
qu
en
cy (
%)

Lost Lake 2017 AIS Monitoring & Protection & Rehabilitation District. Control Strategy Assessment Report
January 2018 14
Water Quality
As reported by the Milwaukee Journal Sentinel, January 1 through July 31, 2017 was Wisconsin’s wettest period on record (records date back 123 years). These conditions can reduce water clarity by increasing nutrient run-off that fuels algal growth but also by delivering an increase amount of staining organic compounds from the watershed. Lost Lake’s water clarity can vary largely from year to year, with some annual growing season Secchi disk readings averaging 9 or more feet while other years, like 2017, averageing 4.4 feet. The water clarity of Lost Lake is largely driven by free-floating algae but also impacted by dissolved humic substances and organic acids which give the lake a light tea color in some years (30 SU in 2017). The large amount of early season rains delivered increased nutrients and organic acids to the lake that greatly impacted water clarity during 2017. While historic water clarity data is a little spotty, data exists from 15 individual years going back to 1990. The data indicate that 2017 had the lowest average growing season Secchi disk transparency values of this dataset. Water clarity values early in the growing season (April-June) were 4 feet lower than the historic average (Figure 8) indicating that the lower water clarity was not a result of warm water algal growth. A full examination of Lost Lakes water quality parameters will be included in the forthcoming lake management planning project.
Figure 8. Average monthly Secchi disk transparency values from Lost Lake
0
1
2
3
4
5
6
7
8
9
10
0 50 100 150 200
Se
cch
i D
isk
De
pth
(fe
et)
2017 Secchi Disk Transparency Average Historic Secchi Disk Transparency
April May June July August Sept. Oct.

Lost Lake 2017 AIS Monitoring & Protection & Rehabilitation District. Control Strategy Assessment Report
January 2018 15
CONCLUSIONS & DISCUSSION
As discussed in the Introduction Section, the LLPRD’s 2017 strategy was to monitor the EWM population within the lake to determine if the populations increased and active management would be warranted in 2017. During 2017, the EWM population remained relatively stable since 2016 and continues to be below levels that are having a substantial impact on the overall ecosystem function nor is the population limiting the navigability, recreation, or aesthetics to lake users. The LLPRD has elected to continue monitoring the EWM population in the absence of active management in 2018. Some lakes in northern Wisconsin contain CLP populations that appear to have integrated within the aquatic plant community without becoming a nuisance or causing measurable impacts to the lake ecosystem. Acknowledging that possibility for Lost Lake, the LLPRD did not reactively conduct active management of the CLP population in 2014-2016, rather monitored the population dynamics. The population increased substantially in 2016 and the LLPRD responded by planning and implementing a CLP treatment during the spring of 2017. The treatment appears to have effectively controlled a single years’ worth of growth prior to turion formation within the targeted area. A concerning reduction in the overall plant community of Lost Lake has been documented since 2010, with 2017 containing some of the lowest aquatic plant populations in the past decade. If the reduction was caused by the herbicide control program, the impacts would be beyond an acceptable level. Because this was the first year an herbicide treatment was conducted on Lost Lake, it is easy to make the assumption that the treatment caused the native plant declines. Therefore, Onterra investigated the scientific link between the herbicide treatment and the native plant declines. While it cannot be ruled out entirely, Onterra believes the evidence presented in the bullet points below suggests that the lake-wide native plant declines were not solely caused by the herbicide control strategy.
For those plant species in decline, that decline has been relatively consistent over time and the population were already low during the most recent survey before the treatment (2014). Comparing the 2014 and 2017 survey indicate that lake-wide declines are being observed, not just within the area exposed to the herbicide treatment.
An incredible amount of precipitation fell within Lost Lake’s watershed in 2017, causing high amounts of water to flow out of Lost Lake. The dam operator noted that the dam was open at its highest level for 10 consecutive days to try to bring the water levels down in Lost Lake. With the proximity of the herbicide treatment in the western bay where the outlet exists, it is likely that more herbicide dissipated out of the lake compared to what dissipated to the east into the main body of the lake. The herbicide concentration data in the Lost Creek across from Hwy 155 (Site L5, Figure 5) confirm dissipation out of the lake, almost mimicking the concentrations observed within the treatment area.
Hypothetically, there was no loss of herbicide out of Lost Lake and the herbicide applied to the treatment area spread evenly throughout the lake, the calculated lake-wide concentration would be 0.054 ppm ae. That concentration would be far too low to impact aquatic plants. The manufacturers of endothall (UPI) recommend whole-lake target concentrations of 0.53 ppm ae (0.75 ppm ai) to 0.71 ppm ae (1.0 ppm ai). This is an order of magnitude (10X) greater than the calculated potential whole-lake concentrations from the 2017 spot treatment of Lost Lake.

Lost Lake 2017 AIS Monitoring & Protection & Rehabilitation District. Control Strategy Assessment Report
January 2018 16
And at the manufacturer-recommended whole-lake endothall concentrations, the native plant impacts are typically much less than the declines observed on Lost Lake in 2017.
The herbicide concentration monitoring indicated almost an undetectable amount of endothall (0.009 ppm ae) being located in the center of the lake at 3 days after the treatment. This concentration is below the potential lake-wide concentration (0.054 ppm ae) discussed in the previous bullet point, which suggests more herbicide dissipated out of the lake than migrated to the east and mixed within the entire lake.
Having data from a number of area lakes, Onterra investigated if large aquatic plant declines were observed on other systems as well. While some large changes in aquatic plant populations were documented within this limited dataset, declines of native species to the level observed on Lost Lake were only observed in one other dataset (Boot Lake, Vilas County). Onterra and the LLPRD promote continued research and investigation that will be helpful in long-term aquatic plant management planning on Lost Lake. The 2017 herbicide treatment effectively controlled the CLP population in the western bay, presumably before significant viable turions were formed. The existing turion base will result in a CLP population within this area in 2018. This was already becoming evident by 17% of point-intercept samples within the western bay containing CLP during the mid-August survey. As planned, the district will again target this area for herbicide control in 2018. At the LLPRD’s 2016 Annual Meeting, the district voted in favor of increasing their tax levy to include sufficient funds to initiate a CLP control and monitoring strategy using herbicides commencing during the spring of 2017 and to be repeated annually for 3 or more years. At the LLPRD’s January 4, 2018 First Quarter District Meeting, the board of directors voted unanimously to conduct another endothall spot treatment in the western bay of the lake. The same aquatic plant monitoring strategy conducted in 2017 is proposed for 2018. This would include a whole-lake point-intercept survey in 2018 to assess the native plant community. Onterra proposes that the district and WDNR consider writing an amendment to their existing AIS-Education, Planning, and Prevention Grant to help offset the costs of the point-intercept survey, which is not included in the current budget. The LLPRD voted unanimously to conduct this survey in 2018 and will be soliciting WDNR funding assistance. Onterra also recommends conducting volunteer-based herbicide concentration monitoring following the 2018 treatment, however with refinements for efficiency to lower the costs of analyzing the samples and the time commitment from the volunteers. A motion to continue with the water sampling in 2018 was approved unanimously by the LLPRD. A project is also underway to update the Lake Management Plan for Lost Lake. Previous lake management planning efforts were initiated by the Town of Saint Germain Lakes Committee in 2004 and 2010. The updated plan will contain historic and current data from the lake as well as provide guidance for its management by integrating stakeholder perceptions and goals. Study components will include investigations of the water quality, watershed, shoreline condition, aquatic plants, and fisheries data integration.

Lost Lake 2017 AIS Monitoring & Protection & Rehabilitation District. Control Strategy Assessment Report
January 2018 17
Following data analysis and report creation, likely March-April 2018, the Lost Lake Planning Committee and Onterra staff will meet to discuss the project results and begin creation of management goals and actions the LLPRD will pursue to manage their lake in both a recreationally enjoyable and ecologically sound manner. This will include EWM and CLP management goals as the project shifts from an Early Detection and Response Phase to an Established Population Management Phase. LITERATURE CITED
Benson, A. J., C.C. Jacono, P.L. Fuller, E. R. McKercher., and M. M. Richerson. 2004. Summary Report of Nonindigenous Aquatic Species in U.S. Fish and Wildlife Service Region 5. U.S. Fish and Wildlife Service, Arlington, Va. 145 pp.
Bolduan B.R., G.C. Van Eeckhout, H.W. Wade HW and J.E. Gannon. 1994. Potamogeton crispus - The other invader. Lake and Reservoir Management 10:113-125.
Great Lakes Indian Fish and Wildlife Service (GLIFWC). 2010. Wisconsin Ceded Territory Manoomin Inventory. GLIFWC Project Report 2010-1.
James WF, Barko JW, Eakin HL, Sorge PW. 2002. Phosphorus budget and management strategies for an urban Wisconsin lake. Lake Reservoir Manage. 18:149–163.
Johnson JA, AR Jones & RM. Newman. 2012: Evaluation of lakewide, early season herbicide treatments for controlling invasive curlyleaf pondweed (Potamogeton crispus) in Minnesota lakes, Lake and Reservoir Management, 28:4, 346-363
Keckemet, O. and R.T. Nelson. 1968. Mode of action, persistence and fate of endothall in the aquatic environment. Proc. South. Weed Sci. Soc. 21:45-46
Nault, M. 2016. The science behind the “so-called” super weed. Wisconsin Natural Resources 2016: 10-12.
Nault ME, M Barton, J Hauxwell, EJ Heath, TA Hoyman, A Mikulyuk, MD Netherland, S Provost, J Skogerboe & S Van Egeren. 2017: Evaluation of large-scale low-concentration 2,4-D treatments for Eurasian and hybrid watermilfoil control across multiple Wisconsin lakes, Lake and Reservoir Management (TBD)
Nelson, L.S., C.S. Owens, and K.D. Getsinger. 2003. Response of Wild Rice to Selected Aquatic Herbicides. US Army Corps of Engineers, Engineer Research and Development Center. ERDC/EL TR-03014.
Netherland, M.D. 2009. Chapter 11, “Chemical Control of Aquatic Weeds.” Pp. 65-77 in Biology and Control of Aquatic Plants: A Best Management Handbook, L.A. Gettys, W.T. Haller, & M. Bellaud (eds.) Aquatic Ecosystem Restoration Foundation, Marietta, GA. 210 pp

Lost Lake 2017 AIS Monitoring & Protection & Rehabilitation District. Control Strategy Assessment Report
January 2018 18
APPENDIX A
2007 2010 2014 2017 % Change Direction % Change Direction % Change Direction % Change Direction
Bidens beckii Water marigold 0.0 2.4 0.9 1.5 ▲ -64.3 ▼ 72.0 ▲ ▲Ceratophyllum demersum Coontail 58.8 54.0 38.7 13.2 -8.3 ▼ -28.2 ▼ -66.0 ▼ -77.6 ▼Myriophyllum sibiricum Northern w atermilfoil 20.2 38.1 14.0 2.4 88.9 ▲ -63.1 ▼ -82.6 ▼ -87.9 ▼Myriophyllum spicatum Eurasian w atermilfoil 0.0 0.0 0.0 2.4 - - ▲ ▲Myriophyllum verticillatum Whorled w atermilfoil 0.0 0.4 0.0 0.0 ▲ -100.0 ▼ - -Nuphar variegata Spatterdock 1.7 0.8 0.4 0.5 -52.8 ▼ -46.4 ▼ 14.6 ▲ -71.0 ▼Nymphaea odorata White w ater lily 0.8 0.0 0.0 1.0 -100.0 ▼ - ▲ 16.1 ▲Ranunculus aquatilis White w ater crow foot 0.4 0.0 0.0 0.0 -100.0 ▼ - - -100.0 ▼
Chara spp. Muskgrasses 3.8 2.0 0.9 1.0 -47.5 ▼ -57.1 ▼ 14.6 ▲ -74.2 ▼Eleocharis acicularis Needle spikerush 3.4 1.2 0.9 1.0 -64.6 ▼ -28.5 ▼ 14.6 ▲ -71.0 ▼Elodea canadensis Common w aterw eed 16.4 36.9 6.0 5.4 125.2 ▲ -83.9 ▼ -9.9 ▼ -67.3 ▼Filamentous algae Filamentous algae 2.1 0.0 5.5 4.4 -100.0 ▼ ▲ -20.6 ▼ 109.0 ▲Fissidens spp. & Fontinalis spp. Aquatic Moss 0.0 0.0 0.0 0.5 - - ▲ ▲Heteranthera dubia Water stargrass 0.8 0.0 0.4 0.5 -100.0 ▼ ▲ 14.6 ▲ -42.0 ▼Isoetes spp. Quillw ort spp. 8.4 4.4 3.8 10.2 -48.1 ▼ -12.3 ▼ 167.5 ▲ 21.9 ▲Juncus pelocarpus Brow n-fruited rush 0.8 0.8 0.4 0.0 -5.6 ▼ -46.4 ▼ -100.0 ▼ -100.0 ▼Lobelia dortmanna Water lobelia 0.0 0.4 0.0 0.0 ▲ -100.0 ▼ - -Najas flexilis Slender naiad 3.4 11.9 6.0 21.5 254.2 ▲ -50.0 ▼ 260.3 ▲ 538.5 ▲Nitella spp. Stonew orts 0.0 0.8 0.0 0.0 ▲ -100.0 ▼ - -Pontederia cordata Pickerelw eed 0.0 0.4 0.0 0.0 ▲ -100.0 ▼ - -Potamogeton amplifolius Large-leaf pondw eed 19.3 9.9 9.8 4.4 -48.7 ▼ -1.3 ▼ -55.1 ▼ -77.3 ▼Potamogeton berchtoldii Slender pondw eed 0.0 0.0 17.9 0.0 - ▲ -100.0 ▼ -Potamogeton crispus Curly-leaf pondw eed 0.0 0.0 0.0 4.4 - - ▲ ▲Potamogeton foliosus Leafy pondw eed 0.4 0.0 0.0 0.0 -100.0 ▼ - - -100.0 ▼Potamogeton gramineus Variable-leaf pondw eed 4.2 4.0 3.4 1.5 -5.6 ▼ -14.2 ▼ -57.0 ▼ -65.2 ▼Potamogeton illinoensis Illinois pondw eed 0.4 0.0 0.0 0.0 -100.0 ▼ - - -100.0 ▼Potamogeton praelongus White-stem pondw eed 12.2 25.8 18.7 9.3 111.7 ▲ -27.4 ▼ -50.5 ▼ -23.9 ▼Potamogeton pusillus Small pondw eed 0.4 2.8 27.2 0.0 561.1 ▲ 880.4 ▲ -100.0 ▼ -100.0 ▼Potamogeton pusillus, P. berchtoldii, & P. strictifolius Thin-leaved pondw eed spp. 0.4 13.9 38.7 0.0 3205.6 ▲ 178.8 ▲ -100.0 ▼ -100.0 ▼Potamogeton richardsonii Clasping-leaf pondw eed 1.7 4.4 3.4 2.4 159.7 ▲ -22.0 ▼ -28.4 ▼ 45.1 ▲Potamogeton robbinsii Fern-leaf pondw eed 17.6 26.6 21.3 13.2 50.7 ▲ -20.0 ▼ -38.1 ▼ -25.4 ▼Potamogeton strictifolius Stif f pondw eed 0.0 12.7 0.0 0.0 ▲ -100.0 ▼ - -Potamogeton zosteriformis Flat-stem pondw eed 16.8 50.0 0.0 0.0 197.5 ▲ -100.0 ▼ - -100.0 ▼Sagittaria sp. (rosette) Arrow head sp. (rosette) 0.0 4.8 0.0 5.4 ▲ -100.0 ▼ ▲ ▲Schoenoplectus acutus Hardstem bulrush 0.0 0.0 0.4 0.0 - ▲ -100.0 ▼ -Schoenoplectus tabernaemontani Softstem bulrush 0.0 0.4 0.0 0.0 ▲ -100.0 ▼ - -Stuckenia pectinata Sago pondw eed 0.0 0.8 1.3 0.5 ▲ 60.9 ▲ -61.8 ▼ ▲Vallisneria americana Wild celery 15.5 14.7 4.7 20.0 -5.6 ▼ -68.1 ▼ 327.3 ▲ 28.6 ▲
▲ or ▼ = Change Statistically Valid (Chi-square; α = 0.05)
2007-2017
Dic
ots
No
n-d
ico
ts
▲ or ▼ = Change Statistically Valid (Chi-square; α = 0.05)
2014-2017
Scientific Name Common Name
LFOO (%) 2007-2010 2010-2014

"p
"p
"p
"p
"p
!(!(!(
!(!(
!(
!(!(
!(
!(
!(
!(!(!(!(!(!(!(
!(
!(
!(!(
!(
!(
!(
!(
!(
!(
!(
!(!(
!(!(!(
!(
.900
FeetMap 1
Sources:Aquatic Plants: Onterra, 2017Bathymetry: Onterra, 2017
Map date: July 6, 2017Filename: LostVilas_CLP_June17.mxd
k
Project Location in Wisconsin
Vilas County, WisconsinLate-June 2017
CLP Survey Results
Lost Lake815 Prosper Rd
De Pere, WI 54115920.338.8860
www.onterra-eco.com
Legend
Surface Matting (none found)
Dominant Highly Dominant (none found)
Highly Scattered (none found)
Small Plant Colony!(
Single or Few Plants!(
Clump of Plants!(Scattered (none found)
May 22, 2017 CLPTreatment Area
Flow
Related Documents

![Clp [automação residencial com clp]](https://static.cupdf.com/doc/110x72/556bdec9d8b42ab2138b510c/clp-automacao-residencial-com-clp.jpg)