Citation: Khoonin, W.; Shantavasinkul, P.C.; Santivarangkna, C.; Trachootham, D. Loss of Eicosapentaenoic Acid (EPA) after Retort Sterilization of the EPA-BCAA Fortified Complete Nutrition Drink. Foods 2022, 11, 2023. https:// doi.org/10.3390/foods11142023 Academic Editors: Amalia Piscopo and Antonella Pasqualone Received: 3 June 2022 Accepted: 5 July 2022 Published: 8 July 2022 Publisher’s Note: MDPI stays neutral with regard to jurisdictional claims in published maps and institutional affil- iations. Copyright: © 2022 by the authors. Licensee MDPI, Basel, Switzerland. This article is an open access article distributed under the terms and conditions of the Creative Commons Attribution (CC BY) license (https:// creativecommons.org/licenses/by/ 4.0/). foods Article Loss of Eicosapentaenoic Acid (EPA) after Retort Sterilization of the EPA-BCAA Fortified Complete Nutrition Drink Watcharapol Khoonin 1 , Prapimporn Chattranukulchai Shantavasinkul 2,3 , Chalat Santivarangkna 4 and Dunyaporn Trachootham 4, * 1 Doctor of Philosophy Program in Nutrition, Faculty of Medicine, Ramathibodi Hospital, and Institute of Nutrition, Mahidol University, Nakhon Pathom 73170, Thailand; [email protected] 2 Division of Nutrition and Biochemical Medicine, Department of Medicine, Faculty of Medicine Ramathibodi Hospital, Mahidol University, Bangkok 10400, Thailand; [email protected] 3 Graduate Program in Nutrition, Faculty of Medicine Ramathibodi Hospital, Mahidol University, Bangkok 10400, Thailand 4 Institute of Nutrition, Mahidol University, Nakhon Pathom 73170, Thailand; [email protected] * Correspondence: [email protected]; Tel.: +66-2-8002380 (ext. 326) Abstract: Retort sterilization is cost-effective for small-scale production of specialized nutrition products. However, the sensory properties and stability of active ingredients after sterilization remain undetermined. This study aimed to investigate the effect of retort on the existence of functional compounds and the sensory satisfaction of a fortified complete nutrition formula with branched-chain amino acids (BCAAs), and fish oil providing eicosapentaenoic acid (EPA). Changes in EPA and BCAA contents after retort were determined by using LC-MS/MS. Nutrient values, osmolality, rheology and sensory acceptance of the processed fortified and control formulas were compared. After retort, the fortified formula had an increase in all types of BCAAs but 30% loss of EPA (p = 0.001). The fortified formula had slightly higher protein and fiber contents, along with increased osmolality. It had higher viscosity and shear stress, but similar IDDSI level at 0. Among flavors tested, the fortified formula with Japanese rice flavor received the highest satisfaction scores with over 80% sensory acceptance. In conclusion, retort sterilization preserved BCAAs of the functional drink, but the addition of 30% fish oil was required to compensate for the EPA loss. The sterilized fortified formula with Japanese rice flavor was sensory acceptable. Keywords: retort processing; complete nutrition drink; functional ingredients; fortification; EPA; BCAA; sensory property; personalized nutrition 1. Introduction Nutrition intervention is intended to fulfill individual nutrient requirements. When regular meals cannot meet the energy and nutritional needs of the elderly, the liquid complete nutrition formula is frequently selected to complete the personal nutrition goal [1]. The nutritional formulas have been created over the past several decades with a variety of intended uses to promote clinical outcomes. Numerous new formulas use a variety of terms such as nutrition drink, and enteral formula for tube feeding [2]. While standard formulations were intended to achieve the basic macro- and micronutrient requirements of individuals, specialty formulas have been developed for special needs such as immune- enhancing formulas containing arginine, glutamine, nucleotides, and ω-3 fatty acids [3]. The products must meet the safety standard and be shelf-stable at room temperature, meet optimum nutrient requirements, possess proper osmolality, and include adequate functional compounds [4]. Commercially available complete nutrition products are mostly sold in powder form. However, improper preparation of liquid food from powder results in adverse events, including blockage of tube feeding, poor absorption, and inadequate nutrient intake [5]. Therefore, a ready-to-eat complete nutrition formula is needed. Foods 2022, 11, 2023. https://doi.org/10.3390/foods11142023 https://www.mdpi.com/journal/foods

Welcome message from author
This document is posted to help you gain knowledge. Please leave a comment to let me know what you think about it! Share it to your friends and learn new things together.
Transcript

Citation: Khoonin, W.;
Shantavasinkul, P.C.; Santivarangkna,
C.; Trachootham, D. Loss of
Eicosapentaenoic Acid (EPA) after
Retort Sterilization of the EPA-BCAA
Fortified Complete Nutrition Drink.
Foods 2022, 11, 2023. https://
doi.org/10.3390/foods11142023
Academic Editors: Amalia Piscopo
and Antonella Pasqualone
Received: 3 June 2022
Accepted: 5 July 2022
Published: 8 July 2022
Publisher’s Note: MDPI stays neutral
with regard to jurisdictional claims in
published maps and institutional affil-
iations.
Copyright: © 2022 by the authors.
Licensee MDPI, Basel, Switzerland.
This article is an open access article
distributed under the terms and
conditions of the Creative Commons
Attribution (CC BY) license (https://
creativecommons.org/licenses/by/
4.0/).
foods
Article
Loss of Eicosapentaenoic Acid (EPA) after Retort Sterilization ofthe EPA-BCAA Fortified Complete Nutrition DrinkWatcharapol Khoonin 1, Prapimporn Chattranukulchai Shantavasinkul 2,3 , Chalat Santivarangkna 4
and Dunyaporn Trachootham 4,*
1 Doctor of Philosophy Program in Nutrition, Faculty of Medicine, Ramathibodi Hospital,and Institute of Nutrition, Mahidol University, Nakhon Pathom 73170, Thailand; [email protected]
2 Division of Nutrition and Biochemical Medicine, Department of Medicine, Faculty of Medicine RamathibodiHospital, Mahidol University, Bangkok 10400, Thailand; [email protected]
3 Graduate Program in Nutrition, Faculty of Medicine Ramathibodi Hospital, Mahidol University,Bangkok 10400, Thailand
4 Institute of Nutrition, Mahidol University, Nakhon Pathom 73170, Thailand; [email protected]* Correspondence: [email protected]; Tel.: +66-2-8002380 (ext. 326)
Abstract: Retort sterilization is cost-effective for small-scale production of specialized nutritionproducts. However, the sensory properties and stability of active ingredients after sterilization remainundetermined. This study aimed to investigate the effect of retort on the existence of functionalcompounds and the sensory satisfaction of a fortified complete nutrition formula with branched-chainamino acids (BCAAs), and fish oil providing eicosapentaenoic acid (EPA). Changes in EPA and BCAAcontents after retort were determined by using LC-MS/MS. Nutrient values, osmolality, rheology andsensory acceptance of the processed fortified and control formulas were compared. After retort, thefortified formula had an increase in all types of BCAAs but 30% loss of EPA (p = 0.001). The fortifiedformula had slightly higher protein and fiber contents, along with increased osmolality. It had higherviscosity and shear stress, but similar IDDSI level at 0. Among flavors tested, the fortified formulawith Japanese rice flavor received the highest satisfaction scores with over 80% sensory acceptance.In conclusion, retort sterilization preserved BCAAs of the functional drink, but the addition of 30%fish oil was required to compensate for the EPA loss. The sterilized fortified formula with Japaneserice flavor was sensory acceptable.
Keywords: retort processing; complete nutrition drink; functional ingredients; fortification; EPA;BCAA; sensory property; personalized nutrition
1. Introduction
Nutrition intervention is intended to fulfill individual nutrient requirements. Whenregular meals cannot meet the energy and nutritional needs of the elderly, the liquidcomplete nutrition formula is frequently selected to complete the personal nutrition goal [1].The nutritional formulas have been created over the past several decades with a varietyof intended uses to promote clinical outcomes. Numerous new formulas use a variety ofterms such as nutrition drink, and enteral formula for tube feeding [2]. While standardformulations were intended to achieve the basic macro- and micronutrient requirements ofindividuals, specialty formulas have been developed for special needs such as immune-enhancing formulas containing arginine, glutamine, nucleotides, and ω-3 fatty acids [3].The products must meet the safety standard and be shelf-stable at room temperature,meet optimum nutrient requirements, possess proper osmolality, and include adequatefunctional compounds [4]. Commercially available complete nutrition products are mostlysold in powder form. However, improper preparation of liquid food from powder resultsin adverse events, including blockage of tube feeding, poor absorption, and inadequatenutrient intake [5]. Therefore, a ready-to-eat complete nutrition formula is needed.
Foods 2022, 11, 2023. https://doi.org/10.3390/foods11142023 https://www.mdpi.com/journal/foods

Foods 2022, 11, 2023 2 of 17
Considering safety as a critical property of food for special medical purposes, ther-mal processing is still the most effective means to appropriately sterilize foodstuffs [6].Ultra-high temperature (UHT) processing with aseptic filling is considered one of the bestways to sterilize food while preserving nutrients and sensory properties [7,8]. However,significant loss of vitamin C and B can still be found after UHT processing [9]. Furthermore,the technique requires a large volume of production due to the significant loss of rawmaterials during processing [8]. Thus, UHT-aseptic filling is suitable for manufacturinglarge batches of standard formulas but not small batches of personalized or specializedproducts. Among thermal processing methods, retort sterilization is considered the mostcost-effective strategy for small-scale production of low acidic food [10]. Previous stud-ies showed that retort processing of food products could result in undesirable sensorialand nutritional alterations and the loss of heat-sensitive nutrients such as vitamin C andpolyunsaturated fatty acids [11]. Although the nutrient loss in conventional complete nutri-tion formulas after sterilization is well recognized, the amounts of functional compoundsremaining in a special formula thereafter are unclear.
To close the above gap of knowledge, this study aimed to investigate the effect ofretort on the existence of functional compounds and the sensory satisfaction with a fortifiedcomplete nutrition formula containing branched-chain amino acids (BCAAs) and fish oilproviding eicosapentaenoic acid (EPA). Recently, we developed a specialized nutritiousliquid containing the functional compounds EPA and BCAA with the aim of preventingsarcopenia. Sarcopenia is a progressive loss of muscle caused by muscle degradationassociated with malnutrition, aging, and chronic inflammation [12,13]. The functionalformula is intended to provide an anti-inflammatory effect from EPA [14] and promotemuscle synthesis by supplying BCAA [15]. To create the fortified formula, EPA and BCAAwere added into a conventional liquid complete nutrition formula. Flavoring agents wereadded to mask the fishy odor of fish oil, the bitterness of amino acids, and the soy-like tasteof soy protein in the nutrition formula. In this study, the sterilization process was selectedto achieve the lethality value (F0) and ensure sterility. The impact of retort processing onadded nutritional value was evaluated. Changes in osmolality and sensory satisfaction ofthe processed products were compared with those of the control formula.
2. Materials and Methods2.1. Formula Preparation
For both control and fortified formulas, a conventional formula (Blendera-MF, ThaiOtsuka Pharmaceutical Co., Ltd., Samut Sakhon, Thailand) was mixed with water at a ratioof 1 kcal per milliliter of water, using an automatic mixer at the rate of 350 rpm at 65 ◦Cfor 15 min. Only for the fortified formula, the fish oil containing 1.1 g of EPA per serving(PronovaPure®, BASF Pharma, Florham Park, NJ, USA) and BCAAs including 1.66 g ofleucine, 0.42 g of isoleucine, and 0.42 g of valine per serving (Ajinomoto Co., (Thailand)Ltd., Bangkok, Thailand), were added and mixed into the control formula liquid. A varietyof heat-stable flavoring agents were added, and the sensory acceptance of the variousflavored fortified products was compared. The ingredients of the control and fortifiedformulas are shown in Table 1.
2.2. Sterilization
For one package, 250 mL of the liquid mixture was filled into a laminated retortpouch and sealed tightly. The horizontal stationary retorting system (Km Grand Pack Co.,Ltd., Samut Prakan, Thailand) at the pilot plant of the Institute of Nutrition was usedfor sterilization. All of the packages were heated in a pressurized retorting system at thespecified temperature–time profiles (116 ◦C− 25 min), which yielded a lethality (F0) valueof 6.3 for the control formula and of 5.08 for the fortified formula. The graphical plot of theheat penetration study is shown in Figure S1. The heat profile was determined with theTrackSense ® Pro Micro Wireless, Ellab AS, Hillerød, Denmark thermocouple sensor (EllabAS, Hillerød, Denmark).

Foods 2022, 11, 2023 3 of 17
Table 1. Ingredients of the control and fortified formulas (250 g/serving).
Ingredient Control Formula Fortified Formula
Maltodextrin 22.14 22.14Sucrose 11.00 11.00
Soy protein 9.37 9.37Rice bran oil 7.61 7.61
Multimineral mixture 1.25 1.25Fructo-oligosaccharide (FOS) 1.24 1.24
Sodium caseinate 0.81 0.81MCT oil 0.66 0.66
Multivitamin mixture 0.19 0.19EPA - 1.10
Leucine - 1.66Isoleucine - 0.41
Valine - 0.41MCT = medium-chain triacylglycerides; EPA = eicosapentaenoic acid.
We produced 10 L of each formula for batch processing. In this study, after theprocessing condition for F0 was found, we manufactured one batch of each formula toobtain the physical, chemical, sensory, and microbiological properties.
2.3. Physicochemical Properties
Proximate composition was analyzed according to the AOAC Official Methods. Crudeprotein was assessed by the Kjeldahl method using a conversion factor of 6.25 (AOAC991.20). Crude fat content was determined by solvent extraction (acid hydrolysis methods)using the Soxhlet apparatus (AOAC 922.06). Moisture content was analyzed by the vacuumdrying method (AOAC 925.45). Ash content was analyzed by incinerating the sample ina muffle furnace (AOAC 945.46). Carbohydrate was calculated by deduction of crude fatprotein, fat, moisture, and ash from a total of 100%. Total dietary fiber was determinedby the enzymatic-gravimetric method (AOAC 985.29). The energy was calculated bymultiplying the weight of protein, carbohydrate, and fat content with the conversion factorvalues of 4, 4, and 9, respectively. Microbiological analysis was performed by an ISO/IEC17025 certified laboratory. The tests followed AOAC methods for low-acid canned food.Osmolality was measured using a single-sample osmometer (Advance Instrument LLC,Norwood, MA, USA). The color parameters of finished products were evaluated with acolorimeter (Hunterlab model ColorFlex EZ, Hunter Associates Laboratory, Inc., Reston,VA, USA). pH was measured by pH meter (Metler Toledo, Columbus, OH, USA). Therheological properties of the control and fortified formulas were measured with a ThermoElectron Corporation HAAKE MARS modular advanced rheometer system with a cupand rotor viscometer (cup CCB25 DIN/SS and rotor CC25 DIN/Ti). The temperature wascontrolled by a thermostatic bath set at 25 ◦C. The results were processed with the HAAKERheoWIN Job Manager and the HAAKE RheoWIN Data Manager software. Rheologycurves were provided in a shear rate interval between 0.0001 and 1000 s−1, and data pointswere collected (Thermo Electron Corporation, Karlsruhe, Germany). Texture categorizationwas evaluated by using the IDDSI flow test (https://iddsi.org/Testing-Methods, accessedon 1 June 2022). The complete nutrition liquid was filled in a 10 mL syringe. The liquidwas allowed to flow through the syringe for 10 s. Then, the remaining amount of liquidin the syringe was measured. The liquid would be categorized as IDDSI level 0, 1, 2, 3, or4 when less than 1 mL, 1 to less than 4 mL, 4 to less than 8 mL, 8 to less than 10 mL, and10 mL remained, respectively.
2.4. Analysis of EPA
One mL of sample was collected from the conventional and fortified complete nutritionformulas before and after the retort sterilization. For EPA analysis, the lipid extractionmethod with hexane/isopropanol previously described in the analysis of EPA in salmon

Foods 2022, 11, 2023 4 of 17
and plasma was modified to use in this study [16,17]. The processed liquid food wasextracted with 3:2 volume by volume of hexane:isopropanol at 1:10 volume by volumeof sample to solvent. After mixing, the mixture was incubated at −20 ◦C for 10 min,followed by centrifugation at 14,000× g at 4 ◦C for 5 min. Then, the hexane extract layerwas collected and dried to remove solvents using a SpeedVac concentrator (CentriVapBenchtop Vacuum Concentrators, Labconco, Kansas City, MO, USA) at room temperaturefor 15 min. One mL of 80% methanol was added to the sample. Nine hundred microlitersof the extract underwent alkaline hydrolysis by the addition of 100 µL of 0.3 M KOH in 80%methanol, followed by incubation at 80 ◦C for 30 min. After the sample was cooled down,10 µL of formic acid was added to neutralize the pH. One milliliter of hexane was added forthe extraction of fatty acids, mixed for 5 min, and centrifuged at 1000× g. The hexane layerwas collected and evaporated with a SpeedVac concentrator to remove the solvent. Then,the sample was reconstituted with 1 mL of 80% methanol and filtered through a 0.2 µmNylon filter prior to the liquid chromatography-tandem mass spectrometry (LC-MS/MS)analysis. For the calibration curve generation, 0, 125, 250, 500, 750, and 1000 ng/mL of EPAin 80% methanol were used. An internal standard, EPA-d5 (MaxSpec, Cayman Chemical,Ann Arbor, MI, USA), was added equally to all samples and standard solutions at thebeginning of sample preparation.
Liquid chromatography was performed using an Ultimate 3000 Ultra High-performanceliquid chromatography (UHPLC, Thermo Scientific, Waltham, MA, USA) equipped with aHypersil GOLD™ C18 column (100 × 2.1 mm, particle size 1.9 µm) at 50 ◦C. The mobilephases A and B were acetonitrile and 5 mM ammonium acetate in water, respectively. Theflow rate was 0.6 mL/min with a run time of 10 min. The gradient run included at 0–6.5 min:40% B, at 6.5–9 min: 2% B, and at 9–10 min: 40% B. The injection volume was 5 µL. Theretention times of EPA and EPA-d3 were equal at 1.7 min. Mass spectrometry (MS) wasconducted using a TSQ Quantis triple quadrupole mass spectrometer (Thermo Scientific,USA). The MS condition was negative ion electrospray ionization (−ESI) with sprayingvoltage at 3500 V under N2 Sheath. Sheath and auxiliary gases were 30 and 15 arbitraryunits (Arb). Ion transfer tube (ITT) and vaporizing temperatures were 325 ◦C and 350 ◦C,respectively. The mass spectrometer analysis was performed in selected reaction monitoring(SRM) mode for simultaneous analysis of multiple masses (Table S1). The mass to chargeratios (m/z) of EPA precursor and quantified product masses were 301 and 257, respectively.A collision energy of 12 V was used for the transition. The confirmation product mass forEPA was m/z 203.3 with a collision energy of 13 V for the transition. The mass to chargeratios (m/z) of EPA-d5 precursor and quantified product masses were 306.3 and 262.3,respectively. A collision energy of 12 V was used for the transition.
To optimize analytical conditions determining BCAA and EPA contents in the formulas,the LC conditions and ESI sensitivity that affect the sensitivity and separation of eachcompound were retrieved from previous studies on a blood sample [17,18]. Internalcalibration of each compound was performed by using the isotopic forms of the respectivestandard as the internal standard.
2.5. Analysis of BCAAs
Acid hydrolysis was performed as previously described to release all available aminoacids in the complete nutrition liquid. The protein was hydrolyzed by using 6 N HClsolution at 120 ◦C for 2 h [19]. The dried sample was then reconstituted with 0.02 M HCland centrifuged at 13,000 rpm for 5 min [20]. The supernatant was collected, and thefinal volume of 5 mL was adjusted with water. Then, the sample was filtered througha 0.2 µm Nylon filter and kept in a glass vial for further analysis. The metabolomicsamino acid mixtures unlabeled standard (MSK-A2-US-1.2: Cambridge Isotope Laboratories,Inc., Tewksbury, MA, USA) was used for the preparation of standard solutions of valine,isoleucine, and leucine. Internal standards including 13C/15N-valine, 13C/15N-isoleucine,and 13C/15N-leucine were supplied by stable isotope-labeled metabolomics amino acidmixtures (MSK-A2-1.2: Cambridge Isotope Laboratories, Inc., Tewksbury, MA, USA).

Foods 2022, 11, 2023 5 of 17
Liquid chromatography was performed using an Ultimate 3000 Ultra High-performanceliquid chromatography (UHPLC; Thermo Scientific, Waltham, MA, USA) equipped with aHypersil GOLD™ C18 column (100 × 2.1 mm, particle size 1.9 µm) at 30 ◦C. The mobilephase was 5:95 of methanol: 20 mM ammonium formate in water. The flow rate was0.3 mL/min with a run time of 5 min. The injection volume was 5 µL. The retention timesof valine, 13C/15N-valine, isoleucine, 13C/15N-isoleucine, leucine, and 13C/15N-leucinewere 1.21, 1.19, 1.81, 1.85, 1.98, and 2.01 min, respectively. Mass spectrometry (MS) wasconducted using a TSQ Quantis triple quadrupole mass spectrometer (Thermo Scientific,Waltham, MA, USA). The MS condition was composed of positive ion electrospray ioniza-tion (+ESI) combined with spraying voltage at 3500 V under N2 Sheath. Sheath, auxiliaryand sweep gases were 50, 10, and 1 Arbs. Ion transfer tube (ITT) and vaporizing tempera-tures were 325 ◦C and 350 ◦C, respectively. The mass spectrometry analysis was performedin selected reaction monitoring (SRM) mode for simultaneous analysis of multiple masses,as shown in Table S1. The mass to charge ratios (m/z) of valine precursor and quantifiedproduct masses were 118 and 72, respectively. The collision energy of 10 V was used for thetransition. The confirmation product mass for valine was m/z 55 with a collision energyof 21 V for the transition. The mass to charge ratios (m/z) of 13C/ 15N-valine precursorand quantified product masses were 306.3 and 262.3, respectively. A collision energy of11 V was used for the transition. The mass to charge ratios (m/z) of isoleucine precursorand quantified product masses were 132 and 86, respectively. A collision energy of 10 Vwas used for the transition. The confirmation product mass for isoleucine was m/z 69with a collision energy of 17 V for the transition. The mass to charge ratios (m/z) of 13C/15N-isoleucine precursor and quantified product masses were 139.2 and 74, respectively.A collision energy of 18 V was used for the transition. The mass to charge ratios (m/z) ofleucine precursor and quantified product masses were 132 and 86, respectively. A collisionenergy of 10 V was used for the transition. The confirmation product mass for isoleucinewas m/z 44 with a collision energy of 22 V for the transition. The mass to charge ratios(m/z) of 13C/15N-leucine precursor and quantified product masses were 139.2 and 92,respectively. A collision energy of 18 V was used for the transition.
2.6. Sensory Evaluation
The control formula in this study is commonly used for tube feeding; therefore, itoriginally does not contain any flavoring agents. In this study, we developed a fortifiedformula containing fish oil and branch-chained amino acids, which could generate fishodor and bitter taste, respectively. To mask the unpleasant taste and smell, several flavoringagents were added and tested for consumers’ satisfaction. The enriched formula wasmasked with non-caloric food flavors, i.e., vanilla, strawberry, lemongrass, cooked Japaneserice odor, chocolate, coconut, peanut, almond, coffee, or spearmint. After a preliminaryevaluation by two trained panelists, four flavors including vanilla, strawberry, lemongrass,and cooked Japanese rice (Aromatech Flavours Co., Ltd., Bangkok, Thailand) were selectedfor sensory tests. Eighty healthy volunteers tasted 30 cc each of the control and fortifiedformulas in random sequence. Then, they rated their liking for color, appearance, odor,taste, mouthfeel, and total acceptability in 5-point hedonic scales (with word anchors,ranging from 5 = “like extremely” to 1 = “dislike extremely” with 3 as “neither like nordislike”). The average score of at least 3 was considered sensory acceptable. The number ofparticipants giving each score was counted. The percentage of satisfaction was calculatedby dividing the number of participants giving scores ≥ 3 by the total number of participants.A previous study recommended that at least 40 participants were required for consumertests [21]. Therefore, the sample size of 80 used in this study should provide high powerand increase the reliability of the data. The sensory test was performed according to aresearch protocol ethically approved by Mahidol University Central Institutional ReviewBoard, MU-CIRB 2019/171.2506.

Foods 2022, 11, 2023 6 of 17
2.7. Statistical Analysis
The amounts of EPA and BCAA were quantitated using linear regression of standardcurves generated by plotting the ratios of the area under the curves of standards and therespective internal standards. Unpaired t-tests were used to compare the differences inparameters between the fortified and control formulas. Paired t-tests were performed todetermine significant differences in the amounts of EPA and BCAA between those of pre-and post-sterilized samples. A comparison of sensory satisfaction score categories betweengroups was performed by using the Chi-square test. Sensory satisfaction scores betweencontrol and fortified formula were compared by using an unpaired t-test. p-value < 0.05 wasconsidered statistically significant. All graphing and statistical analyses were performedusing GraphPad Prism V.9.0.2 (GraphPad Software, San Diego, CA, USA).
3. Results3.1. Microbial Load, Proximate Composition, Nutrients, Osmolality, Color, and pH of the ProcessedControl and Fortified Formulas
After retort processing, pathogenic microorganisms commonly found in low-acidhermetically sealed food were not detected (Table S2). As shown in Table 2, the energyand macro-nutrient contents of the fortified formula were relatively similar to that of thecontrol formula. However, the fortified formula had a slight reduction in moisture withincreases in protein, dietary fiber, and energy. Table 3 shows that after retort sterilization,the average osmolality in the fortified formula (549.80 ± 1.50 mOsm/kg H2O) was higherthan that of the control formula (428.8 ± 3.304 mOsm/kg H2O; p < 0.0001). After retortprocessing, the color of the fortified formula had similar lightness (p > 0.99) but was redder(p < 0.0001) and yellower (p < 0.0001) than the control formula. Both formulas were quiteneutral, as the control and fortified formula had pH of 6.70 and 6.59, respectively. Figure S2shows a comparison of the visual color before and after retort in both formulas.
Table 2. Comparison of energy and macro-nutrients in the control and fortified complete nutritionformulas after retort sterilization.
Parameter Control Formula Fortified Formula
Energy (kcal)Moisture (g)
98.7484.08
108.6582.16
Carbohydrate (g) 13.93 14.03Protein (g) 3.60 4.20
Fat (g) 3.18 3.97Dietary fiber (g) 0.32 0.76
Ash (g) 0.61 0.54The table shows the mean nutrient amount from duplicates of three random samples.
Table 3. Comparison of color, osmolality and pH in the control and fortified complete nutritionformulas after retort sterilization.
Parameter Control Formula Fortified Formula p-Value
Osmolality (mOsmol/kg H2O) 428.80 ± 3.30 549.80 ± 1.50 <0.0001Color L * 65.27 ± 0.14 65.60 ± 0.94 >0.9999
a * 6.99 ± 0.09 8.01 ± 0.44 <0.0001b * 21.24 ± 0.2 27.42 ± 0.33 <0.0001pH 6.7 6.59
Data were expressed as mean ± standard deviation (SD) of osmolality and color from 3 packages each. pH wasthe average of duplicate measurements from pooled sample. L*-a*-b* is the 3-dimensional CIELAB color system.L* = lightness axis; a* = green-red axis; + = redder; b* = blue-yellow axis, + = yellower. p-values were obtainedfrom unpaired t-tests.
3.2. Rheological Properties and Texture of the Processed Control and Fortified Formulas
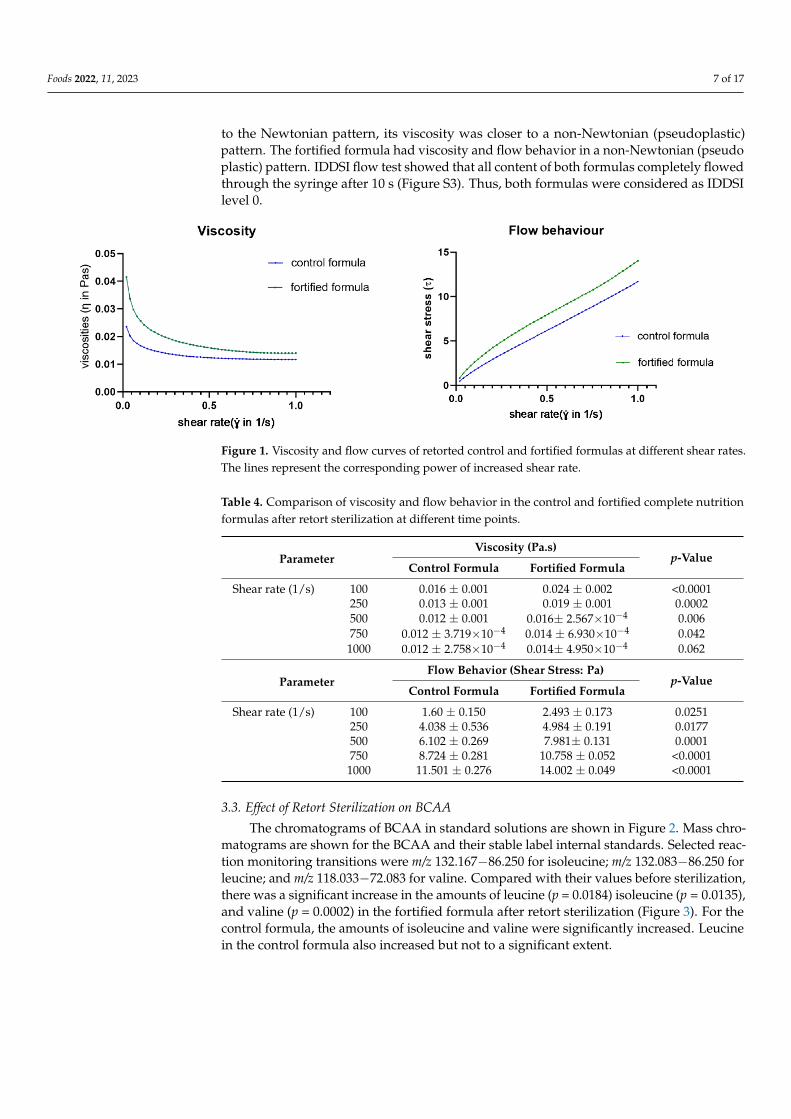
As shown in Figure 1 and Table 4, the fortified formula had a higher viscosity andshear stress than the control formula. Though the control formula had flow behavior close
Foods 2022, 11, 2023 7 of 17
to the Newtonian pattern, its viscosity was closer to a non-Newtonian (pseudoplastic)pattern. The fortified formula had viscosity and flow behavior in a non-Newtonian (pseudoplastic) pattern. IDDSI flow test showed that all content of both formulas completely flowedthrough the syringe after 10 s (Figure S3). Thus, both formulas were considered as IDDSIlevel 0.
Foods 2022, 11, x FOR PEER REVIEW 7 of 17
Table 3. Comparison of color, osmolality and pH in the control and fortified complete nutrition formulas after retort sterilization.
Parameter Control Formula Fortified Formula p-Value Osmolality (mOsmol/kg
H2O) 428.80 ± 3.30 549.80 ± 1.50 <0.0001
Color L * 65.27 ± 0.14 65.60 ± 0.94 >0.9999 a * 6.99 ± 0.09 8.01 ± 0.44 <0.0001 b * 21.24 ± 0.2 27.42 ± 0.33 <0.0001 pH 6.7 6.59
Data were expressed as mean ± standard deviation (SD) of osmolality and color from 3 packages each. pH was the average of duplicate measurements from pooled sample. L*-a*-b* is the 3-dimensional CIELAB color system. L* = lightness axis; a* = green-red axis; + = redder; b* = blue-yellow axis, + = yellower. p-values were obtained from unpaired t-tests.
3.2. Rheological Properties and Texture of the Processed Control and Fortified Formulas As shown in Figure 1 and Table 4, the fortified formula had a higher viscosity and
shear stress than the control formula. Though the control formula had flow behavior close to the Newtonian pattern, its viscosity was closer to a non-Newtonian (pseudoplastic) pattern. The fortified formula had viscosity and flow behavior in a non-Newtonian (pseudo plastic) pattern. IDDSI flow test showed that all content of both formulas completely flowed through the syringe after 10 s (Figure S3). Thus, both formulas were considered as IDDSI level 0.
Figure 1. Viscosity and flow curves of retorted control and fortified formulas at different shear rates. The lines represent the corresponding power of increased shear rate.
Table 4. Comparison of viscosity and flow behavior in the control and fortified complete nutrition formulas after retort sterilization at different time points.
Parameter Viscosity (Pa.s)
p-Value Control Formula Fortified Formula
Shear rate (1/s) 100 0.016 ± 0.001 0.024 ± 0.002 <0.0001 250 0.013 ± 0.001 0.019 ± 0.001 0.0002 500 0.012 ± 0.001 0.016± 2.567× 10⁻⁴ 0.006 750 0.012 ± 3.719× 10⁻⁴ 0.014 ± 6.930× 10⁻⁴ 0.042 1000 0.012 ± 2.758× 10⁻⁴ 0.014± 4.950× 10⁻⁴ 0.062
Parameter Flow Behavior (Shear Stress: Pa)
p-Value Control Formula Fortified Formula
Shear rate (1/s) 100 1.60 ± 0.150 2.493 ± 0.173 0.0251 250 4.038 ± 0.536 4.984 ± 0.191 0.0177 500 6.102 ± 0.269 7.981± 0.131 0.0001 750 8.724 ± 0.281 10.758 ± 0.052 <0.0001 1000 11.501 ± 0.276 14.002 ± 0.049 <0.0001
Figure 1. Viscosity and flow curves of retorted control and fortified formulas at different shear rates.The lines represent the corresponding power of increased shear rate.
Table 4. Comparison of viscosity and flow behavior in the control and fortified complete nutritionformulas after retort sterilization at different time points.
ParameterViscosity (Pa.s)
p-ValueControl Formula Fortified Formula
Shear rate (1/s) 100 0.016 ± 0.001 0.024 ± 0.002 <0.0001250 0.013 ± 0.001 0.019 ± 0.001 0.0002500 0.012 ± 0.001 0.016± 2.567×10⁻⁴ 0.006750 0.012 ± 3.719×10⁻⁴ 0.014 ± 6.930×10⁻⁴ 0.042
1000 0.012 ± 2.758×10⁻⁴ 0.014± 4.950×10⁻⁴ 0.062
ParameterFlow Behavior (Shear Stress: Pa)
p-ValueControl Formula Fortified Formula
Shear rate (1/s) 100 1.60 ± 0.150 2.493 ± 0.173 0.0251250 4.038 ± 0.536 4.984 ± 0.191 0.0177500 6.102 ± 0.269 7.981± 0.131 0.0001750 8.724 ± 0.281 10.758 ± 0.052 <0.0001
1000 11.501 ± 0.276 14.002 ± 0.049 <0.0001
3.3. Effect of Retort Sterilization on BCAA
The chromatograms of BCAA in standard solutions are shown in Figure 2. Mass chro-matograms are shown for the BCAA and their stable label internal standards. Selected reac-tion monitoring transitions were m/z 132.167−86.250 for isoleucine; m/z 132.083−86.250 forleucine; and m/z 118.033−72.083 for valine. Compared with their values before sterilization,there was a significant increase in the amounts of leucine (p = 0.0184) isoleucine (p = 0.0135),and valine (p = 0.0002) in the fortified formula after retort sterilization (Figure 3). For thecontrol formula, the amounts of isoleucine and valine were significantly increased. Leucinein the control formula also increased but not to a significant extent.

Foods 2022, 11, 2023 8 of 17
Foods 2022, 11, x FOR PEER REVIEW 8 of 17
3.3. Effect of Retort Sterilization on BCAA The chromatograms of BCAA in standard solutions are shown in Figure 2. Mass
chromatograms are shown for the BCAA and their stable label internal standards. Selected reaction monitoring transitions were m/z 132.167−86.250 for isoleucine; m/z 132.083−86.250 for leucine; and m/z 118.033−72.083 for valine. Compared with their values before sterilization, there was a significant increase in the amounts of leucine (p = 0.0184) isoleucine (p = 0.0135), and valine (p = 0.0002) in the fortified formula after retort sterilization (Figure 3). For the control formula, the amounts of isoleucine and valine were significantly increased. Leucine in the control formula also increased but not to a significant extent.
Figure 2. Mass spectra of the precursor and product ion masses of branch-chain amino acids (leucine, isoleucine, and valine), scanned by LC-MS/MS. Precursor ion and product ion spectrums of leucine (a,b), isoleucine (c,d), and valine (e,f), respectively. The number in the oval represents the mass per charge (m/z) ratio of the precursor. The m/z values for quantitative and confirmed product ions for each amino acid are labeled.
Figure 2. Mass spectra of the precursor and product ion masses of branch-chain amino acids (leucine,isoleucine, and valine), scanned by LC-MS/MS. Precursor ion and product ion spectrums of leucine(a,b), isoleucine (c,d), and valine (e,f), respectively. The number in the oval represents the mass percharge (m/z) ratio of the precursor. The m/z values for quantitative and confirmed product ions foreach amino acid are labeled.

Foods 2022, 11, 2023 9 of 17Foods 2022, 11, x FOR PEER REVIEW 9 of 17
Figure 3. Effect of retort sterilization on the amount of branch-chain amino acids in control and fortified formulas. Standard curves of leucine (a), isoleucine (c), and valine (e), obtained from the ratio of area under the curve (AUC) between respective standards and internal standards and the concentrations of each amino acid, analyzed by LC-MS/ MS. R2 and p-values were obtained by using linear regressions. Bar graphs show the amounts of leucine (b), isoleucine (d), and valine (f) in the control and fortified formulas before and after retort processing. * and *** mean p < 0.05 and 0.001, comparing before and after retort using paired t-tests.
3.4. Effect of Retort Sterilization on EPA EPA was not an ingredient in the initial food powder. Measurement of EPA was
conducted to identify the quantity of EPA before and after heat treatment with the presence of a complete nutrition food matrix. Compared to the pre-sterilized sample, Figure 4 shows a 30% decrease in EPA in the post-sterilized fortified formula (p = 0.0016).
Figure 3. Effect of retort sterilization on the amount of branch-chain amino acids in control andfortified formulas. Standard curves of leucine (a), isoleucine (c), and valine (e), obtained from theratio of area under the curve (AUC) between respective standards and internal standards and theconcentrations of each amino acid, analyzed by LC-MS/ MS. R2 and p-values were obtained by usinglinear regressions. Bar graphs show the amounts of leucine (b), isoleucine (d), and valine (f) in thecontrol and fortified formulas before and after retort processing. * and *** mean p < 0.05 and 0.001,comparing before and after retort using paired t-tests.
3.4. Effect of Retort Sterilization on EPA
EPA was not an ingredient in the initial food powder. Measurement of EPA wasconducted to identify the quantity of EPA before and after heat treatment with the presenceof a complete nutrition food matrix. Compared to the pre-sterilized sample, Figure 4 showsa 30% decrease in EPA in the post-sterilized fortified formula (p = 0.0016).

Foods 2022, 11, 2023 10 of 17Foods 2022, 11, x FOR PEER REVIEW 10 of 17
Figure 4. Effect of retort sterilization on the amount of EPA in control and fortified formulas. Precursor ion spectrum and product spectrum of EPA (a)-left panel) and the internal standard, EPA-d5 (a)-right panel). The number under EPA or EPA-d5 represents the mass per charge (m/z) ratio of the precursor (b). Standard curves of EPA (c), obtained from the ratio of area under the curve (AUC) between respective standards and internal standards and the concentrations of each amino acid, analyzed by LC-MS/ MS. R2 and p-values were obtained by using linear regressions. Bar graphs show the amount of EPA (d) in the control and fortified formulas before and after retort processing. ** means p < 0.01, comparing before and after retort by using paired t-tests.
3.5. Sensory Evaluation of Fortified Formula As shown in Table 5, Japanese rice flavor fortified formula was the only one that
received average sensory satisfaction scores above 3 for all parameters. The average sensory satisfaction scores for color, appearance and odor of the Japanese flavor one were not different from those of the control formula. However, the average scores for total acceptability, taste, and mouthfeel were lower than those for the control. Interestingly, the taste, mouthfeel and total acceptability of the Japanese rice flavor fortified formula were significantly better than those of the other flavors. Figure 5 shows that the Japanese rice flavor fortified formula consistently earned the highest proportions of acceptable scores (≥3) from participants. Figure 6b–d shows no difference in the satisfactory score categories for color, appearance, and odor between control and Japanese rice flavored enriched formula. In contrast, the proportions of acceptable scores for taste, mouthfeel, and overall acceptability were significantly higher for the control formula (Figure 6a,e,f).
Figure 4. Effect of retort sterilization on the amount of EPA in control and fortified formulas. Precursorion spectrum and product spectrum of EPA (a)-left panel) and the internal standard, EPA-d5 (a)-rightpanel). The number under EPA or EPA-d5 represents the mass per charge (m/z) ratio of the precursor(b). Standard curves of EPA (c), obtained from the ratio of area under the curve (AUC) betweenrespective standards and internal standards and the concentrations of each amino acid, analyzed byLC-MS/ MS. R2 and p-values were obtained by using linear regressions. Bar graphs show the amountof EPA (d) in the control and fortified formulas before and after retort processing. ** means p < 0.01,comparing before and after retort by using paired t-tests.
3.5. Sensory Evaluation of Fortified Formula
As shown in Table 5, Japanese rice flavor fortified formula was the only one thatreceived average sensory satisfaction scores above 3 for all parameters. The averagesensory satisfaction scores for color, appearance and odor of the Japanese flavor one werenot different from those of the control formula. However, the average scores for totalacceptability, taste, and mouthfeel were lower than those for the control. Interestingly,the taste, mouthfeel and total acceptability of the Japanese rice flavor fortified formulawere significantly better than those of the other flavors. Figure 5 shows that the Japaneserice flavor fortified formula consistently earned the highest proportions of acceptablescores (≥3) from participants. Figure 6b–d shows no difference in the satisfactory scorecategories for color, appearance, and odor between control and Japanese rice flavored

Foods 2022, 11, 2023 11 of 17
enriched formula. In contrast, the proportions of acceptable scores for taste, mouthfeel,and overall acceptability were significantly higher for the control formula (Figure 6a,e,f).Nevertheless, Figure 6a shows that over 80% of panelists accepted the fortified completenutrition drink.
Table 5. Sensory satisfaction scores for the control and various flavor-fortified formulas.
Formula TotalAcceptability Color Appearance Odor Taste Mouthfeel
Control 3.89 ± 0.76 3.53 ± 0.80 3.64 ± 0.73 3.61 ± 0.92 3.80 ± 0.97 3.90 ± 0.69
Japaneserice 3.23 ± 1.01 **** 3.45 ± 0.74 3.51 ± 0.76 3.40 ± 1.06 3.10 ± 1.13 *** 3.36 ± 1.00 ***
Strawberry 2.84 ± 0.93 **** 3.45 ± 0.90 3.43 ± 0.78 2.89 ± 1.04 **** 2.56 ± 1.07 **** 3.09 ± 0.93 ****
Vanilla 2.85 ± 0.89 **** 3.44 ± 0.88 3.44 ± 0.71 2.81 ± 0.92 **** 2.68 ± 0.92 **** 3.25 ± 0.85 ****
Lemongrass 2.58 ± 0.88 **** 3.31 ± 0.77 3.41 ± 0.72 2.24 ± 0.85 **** 2.31 ± 0.92 **** 2.94 ± 0.82 ****
Data are expressed as mean ± standard deviation (SD) of the average sensory scores. (****) and (***) representp < 0.0001 and 0.001, respectively, compared to control formula. p-values were obtained using ANOVA followedby Bonferroni’s multiple comparison test.
Foods 2022, 11, x FOR PEER REVIEW 11 of 17
Nevertheless, Figure 6a shows that over 80% of panelists accepted the fortified complete nutrition drink.
Table 5. Sensory satisfaction scores for the control and various flavor-fortified formulas.
Formula Total
Acceptability Color Appearance Odor Taste Mouthfeel
Control 3.89 ± 0.76 3.53 ± 0.80 3.64 ± 0.73 3.61 ± 0.92 3.80 ± 0.97 3.90 ± 0.69 Japanese
rice 3.23 ± 1.01 **** 3.45 ± 0.74 3.51 ± 0.76 3.40 ± 1.06 3.10 ± 1.13 *** 3.36 ± 1.00 ***
Strawberry 2.84 ± 0.93 **** 3.45 ± 0.90 3.43 ± 0.78 2.89 ± 1.04 ****
2.56 ± 1.07 ****
3.09 ± 0.93 ****
Vanilla 2.85 ± 0.89 **** 3.44 ± 0.88 3.44 ± 0.71 2.81 ± 0.92
**** 2.68 ± 0.92
**** 3.25 ± 0.85 ****
Lemongrass 2.58 ± 0.88 **** 3.31 ± 0.77 3.41 ± 0.72 2.24 ± 0.85
**** 2.31 ± 0.92
**** 2.94 ± 0.82 ****
Data are expressed as mean ± standard deviation (SD) of the average sensory scores. (****) and (***) represent p < 0.0001 and 0.001, respectively, compared to control formula. p-values were obtained using ANOVA followed by Bonferroni’s multiple comparison test.
Figure 5. Acceptability of fortified formulas with different flavors. The stacked bars show the number of participants who assigned different scores on 5-point hedonic scales from 1 to 5 for total acceptability (a), color (b), appearance (c), odor (d), taste (e), and mouthfeel (f) of the fortified
Figure 5. Acceptability of fortified formulas with different flavors. The stacked bars show thenumber of participants who assigned different scores on 5-point hedonic scales from 1 to 5 for totalacceptability (a), color (b), appearance (c), odor (d), taste (e), and mouthfeel (f) of the fortified formulawith Japanese rice, strawberry, vanilla, and lemongrass flavors. A score above 3 is acceptable.

Foods 2022, 11, 2023 12 of 17
Foods 2022, 11, x FOR PEER REVIEW 12 of 17
formula with Japanese rice, strawberry, vanilla, and lemongrass flavors. A score above 3 is acceptable.
Figure 6. Results of sensory evaluation for control and fortified formulas of the rice-flavored control and fortified formulas. The stacked bars show the number of participants who assigned different scores on 5-point hedonic scales from 1 to 5 for total acceptability (a), color (b), appearance (c), odor (d), taste (e), and mouthfeel (f) of the control and fortified formulas with Japanese rice flavor. A score above 3 is acceptable. (***) and (**) mean p < 0.001 and < 0.01, respectively, obtained by chi-square tests.
4. Discussion Accurate preparation of nutrition drinks is very critical yet challenging for home
caregivers and hospital staff [22–24]. Therefore, a ready-to-eat complete nutrition drink is an ideal product choice in both household and health services [22,25]. Although no standard guideline has established for the recommended daily dose of EPA and BCAAs, specialty complete nutrient formulas fortified with amino acids and fatty acids are in increasing demand, especially for cancer patients and elderly people at risk of sarcopenia [12,13,26]. Nevertheless, development of such a product has several concerns including shelf stability, nutrient and functional values, and physical and sensory properties. This study demonstrated that it is feasible to formulate a ready-to-eat complete nutrition formula containing EPA and BCAAs. The findings of this work suggest that the fortified formula had 10 kcal more energy, higher fiber, and less moisture along with increased viscosity and osmolality compared to the control formula. The reason behind the change was likely due to the addition of BCAAs and EPA, which increased the total solids. When we titrated equal volumes of both formulas, the solute could be more concentrated, resulting in increased viscosity, nutrient values and osmolality in the fortified formula. A
Figure 6. Results of sensory evaluation for control and fortified formulas of the rice-flavored control andfortified formulas. The stacked bars show the number of participants who assigned different scores on5-point hedonic scales from 1 to 5 for total acceptability (a), color (b), appearance (c), odor (d), taste (e),and mouthfeel (f) of the control and fortified formulas with Japanese rice flavor. A score above 3 isacceptable. (***) and (**) mean p < 0.001 and < 0.01, respectively, obtained by chi-square tests.
4. Discussion
Accurate preparation of nutrition drinks is very critical yet challenging for home care-givers and hospital staff [22–24]. Therefore, a ready-to-eat complete nutrition drink is anideal product choice in both household and health services [22,25]. Although no standardguideline has established for the recommended daily dose of EPA and BCAAs, specialtycomplete nutrient formulas fortified with amino acids and fatty acids are in increasingdemand, especially for cancer patients and elderly people at risk of sarcopenia [12,13,26].Nevertheless, development of such a product has several concerns including shelf stability,nutrient and functional values, and physical and sensory properties. This study demon-strated that it is feasible to formulate a ready-to-eat complete nutrition formula containingEPA and BCAAs. The findings of this work suggest that the fortified formula had 10 kcalmore energy, higher fiber, and less moisture along with increased viscosity and osmolalitycompared to the control formula. The reason behind the change was likely due to theaddition of BCAAs and EPA, which increased the total solids. When we titrated equalvolumes of both formulas, the solute could be more concentrated, resulting in increased

Foods 2022, 11, 2023 13 of 17
viscosity, nutrient values and osmolality in the fortified formula. A previous study alsoobserved that osmolality increased by 126–136 mOsm/ 100 mL after fortification withprotein hydrolysate in pasteurized human milk [27]. Interestingly, BCAAs contents in thefunctional liquid nutrition formula were well-preserved after retort sterilization. However,a 30% loss of EPA was found after the heat treatment. The color of the fortified formulaafter retort sterilization was redder and yellower than that of the control formula. However,the color acceptance of the fortified formula was not significantly different from that ofthe control formula. The color change was likely from the addition of BCAA and heattreatment. Maillard reaction, the non-enzymatic browning of food consisting of amino acidsand reducing sugar, usually occurs when the product undergoes a thermal process, whichalso affects texture and flavor [28]. The fish odor in the fortified formula was effectivelymasked with Japanese rice flavoring agents, resulting in no significant difference in odorsatisfaction scores between both formulas. Though the average satisfactory score for tasteof the Japanese rice flavor-fortified formula was still lower than that of the control, its scorewas significantly better than those of the other flavors. This finding is consistent with theprevious work showing that an artificial flavoring agent with a sweet taste can mask bitteroral medication [29]. Although the overall acceptability score for the fortified formula waslower, the Japanese rice flavored one still received over 80% sensory acceptance.
In this study, the conventional complete nutrition formula contained some BCAA,and the fortified formula contained an additional amount of BCAA. Interestingly, afterretort sterilization at 116 ◦C for 25 min, the concentrations of isoleucine, leucine, andvaline were significantly increased in the fortified formula, while a significant increasein isoleucine was also observed in the control formula. A previous study reported thatthe concentrations of BCAA-rich supplement Aminoleban®® were stable after heating upto 60 min at a maximum temperature of 80 ◦C [30]. In contrast, another study found asignificant decrease in various free amino acids, including valine in infant formula afterautoclaving for 5 min at 105 ◦C and 5600 kg/m2 of pressure. The authors speculated thatthe Maillard reaction was likely the main cause of BCAA degradation [31]. The discrepancyin the results from various studies may be due to differences in heating temperature andamino acid measurement, i.e., total amino acids in our study and free amino acids in thestudy by Yeung et al., 2006 [31]. In fact, at 116 ◦C, protein denaturation is highly likelyto occur, and the protein structure would be more vulnerable to acid hydrolysis duringthe sample preparation, resulting in a higher yield of amino acids [32]. Therefore, it ispredicted that when a patient consumes our retorted product, complete gastrointestinaldigestion will likely occur since the protein has been denatured and opened for access tothe enzyme. Future clinical studies are warranted to confirm this speculation.
In contrast to the amino acids, there was a significant loss of EPA after retort steriliza-tion. This is consistent with a previous study showing a decrease in polyunsaturated fattyacids (PUFAs) in canned fish after heat treatment [11]. The mechanism behind the EPAloss is likely attributable to the increased lipid oxidation level. High temperature couldinduce free radical generation, followed by secondary oxidized lipid products. The rateof decreasing PUFA depended on the heating profile [33]. In this study, 30% loss of EPAwas found after heat treatment. Therefore, in a subsequent batch production process, anadditional 30% of fish oil was added as a raw material, yielding a final concentration ofEPA in the fortified formula similar to the pre-sterilization level.
The fortified formula had higher osmolality (534 mOsm/kg), compared with thecontrol formula (393 mOsm/kg). The osmolality of the fortified formula was higher thanthe normo-osmotic value (300 and 350 mOsm/kg) and was considered hyperosmolar(>500 mOsm/kg) [34]. The osmolality of complete nutrition liquid was shown to playsome role in the complications of enteral feeding, such as feeding intolerance and gas-trointestinal complications, i.e., osmotic diarrhea [35]. Nevertheless, a previous studyin critical patients found no associations between receiving hyperosmolar nutrition andmedication via nasogastric tube, and feeding intolerance, diarrhea, constipation, gastricresidual volume, nausea, and vomiting [34]. However, an increased risk of diarrhea was

Foods 2022, 11, 2023 14 of 17
found to be associated with hyperosmolar medication via the naso-duodenal route (OR138.7 (95% CI: 2.33; 8245)) [33]. Therefore, further evaluation in clinical setting research isneeded to monitor this product for possible complications.
The rheological properties of complete nutrition formulas are especially important fornutrition therapy in patients with dysphagia (swallowing difficulty). Though the fortifiedformula was slightly more viscous than the control formula, the IDDSI levels of bothformulas were similar. Thus, for oral intake, the application of the fortified formula shouldbe similar to that of the control. However, the application for tube feeding may be different.The higher viscosity and shear stress at all shear rates observed in the fortified formulasuggest that it may flow more slowly in the tube, potentially requiring longer time tofinish tube feeding compared to the control. Future clinical studies are needed to confirmthis speculation.
Sensory properties are critical for patient acceptance of complete nutrition drinks. TheEPA-BCAA fortified formula had an unwanted fish odor, bitter taste, and bean flavor. Heattreatment such as retort sterilization could generate more volatile compounds and worsenthe sensory properties. Previous studies recommended masking the bitterness or brownflavors of amino acids with almond, hazelnut, chocolate, coffee, caramel, rum raisin, andmalt [36]. Fish odor is usually masked by a citrus flavor, such as lime or lemongrass [37]. Inthis study, among the variety of flavors used, we found that rice flavor could provide themost effective masking performance against the unwanted taste and odor of the EPA-BCAAfortified formula. Since the average sensory satisfaction scores for the odor of the fortifiedformula with Japanese rice flavor were not significantly different from those of the control,Japanese rice flavor seems to effectively mask the fish odor. The 2-acetyl-1-pyrroline (2AP)is considered to be the signature volatile compound contributing to the rice aroma [38].Further studies on the mechanism of the odor masking effect by 2AP are worthwhile.
The strength of this study was its method of measuring total amino acids by usingacid hydrolysis in sample preparations, which could mimic gastrointestinal digestion whenconsuming the product. Importantly, the equivalent mass of Leu and Ile was difficult todistinguish with single-step identification [18]. Both amino acids came out at highly similarretention times when run through high-performance liquid chromatography (HPLC) and asingle quadrupole mass spectrometer (only precursor molecular mass). With the help oftriple quadrupole mass spectrometry, LC-MS/MS could distinguish Leu and Ile based onthe differential fragment mass [39]. There were some limitations of this study. Althoughmasking the odor and taste with a flavoring agent could make the EPA-BCAA fortifiedformula sensory acceptable, its overall acceptability score was still significantly lower thanthat of the control formula. To completely overcome the challenge, microencapsulationof fish oil using whey protein concentrate, sodium caseinate and glucose syrup wereshown to reduce lipid oxidation and, therefore, lessen the fish odor [40]. Future studies arewarranted to develop an affordable technology to improve the sensory properties of thefortified nutritious drink. As a last note, the product was processed by retort in order tomake it shelf-stable. Since the retort condition achieved F0 = 6 and no detectable pathogenicbacteria, the product could be kept at room temperature for at least 6 months according toThai Food and Drug Administration standards. A future study to identify the shelf-life ofthe product at room temperature is warranted.
5. Conclusions
The findings suggested that it is feasible to formulate a ready-to-eat shelf-stablecomplete nutrition drink containing EPA and BCAA. Retort at 116 ◦C for 25 min wasselected for sterilization. Such processing resulted in no loss of BCAA but a 30% loss ofEPA. Thus, a 30% addition of fish oil should be supplied as a raw material for productionto achieve desirable EPA content in the finished product. Compared to the control formula,the processed fortified formula had slightly higher protein and fiber contents, along withincreased osmolality and viscosity. However, its IDDSI texture category did not change.Among the flavors tested, the fortified formula with Japanese rice flavor received the

Foods 2022, 11, 2023 15 of 17
highest satisfaction scores, with over 80% sensory acceptance. The fish odor was effectivelymasked with a Japanese rice flavoring agent, while the bitter taste was reduced. The presentstudy indicated that retort technology could be an effective sterilization method for specialcomplete nutrition formulas to be used in personalized nutrition. Clinical studies arewarranted to investigate its absorption kinetics and functional efficacy.
Supplementary Materials: The following supporting information can be downloaded at: https://www.mdpi.com/article/10.3390/foods11142023/s1, Figure S1: The graphical plot of heat penetrationstudy of the retort sterilization process; Figure S2: Color of the control and fortified completenutrition drink before and after retort sterilization. Figure S3: Texture categorization of complete andfortified formulas according to IDDSI. Table S1: Selected parent-product ion m/z transitions and MSconditions used for BCAA and EPA quantification by LC-MS/MS. Table S2: Microbial assessment ofthe control and fortified formulas.
Author Contributions: Conceptualization, W.K., P.C.S., C.S., and D.T.; methodology, W.K., P.C.S.,C.S., and D.T.; investigation, W.K., and D.T.; data curation and formal analysis, W.K. and D.T.;writing—original draft preparation, W.K.; writing—review and editing, P.C.S., C.S., and D.T.; fund-ing acquisition, W.K., and D.T. All authors have read and agreed to the published version ofthe manuscript.
Funding: This research was funded by Research and Researchers for Industries (RRI), grant No.PHD62I0005, Thailand Science Research and Innovation (TSRI) and Thai Otsuka Pharmaceutical Co.,Ltd., Thailand.
Institutional Review Board Statement: The study was conducted according to the guidelines of theDeclaration of Helsinki, and approved by the Mahidol University Central Institutional Review Board(MU-CIRB) (protocol No. MU-CIRB 2019/171.2506, COA. No. MU-CIRB 2019/156.2706, approvedon 20 September 2019).
Informed Consent Statement: Informed consent was obtained from all subjects involved in the study.
Data Availability Statement: The data presented in this study are available upon reasonable requestto the corresponding author.
Acknowledgments: The authors are grateful to Hongthai Srichum and Numphung Rungrung fortheir technical assistance in retort sterilization. We thank Thunnalin Winuprasith and NappassornPeasura for their advice in the measurement of rheological properties. We thank BASF Pharma,Florham Park, NJ, USA for providing fish oil as a gift.
Conflicts of Interest: W.K. and D.T. have received a research grant for this work from ThailandScience Research and Innovation (TSRI) and Thai Otsuka Pharmaceutical Co., Ltd., Thailand. Thefunders had no role in the design of the study; in the collection, analyses, or interpretation of data; inthe writing of the manuscript, or in the decision to publish the results. The authors declare no conflictof interest.
References1. Volkert, D.; Beck, A.M.; Cederholm, T.; Cruz-Jentoft, A.; Goisser, S.; Hooper, L.; Kiesswetter, E.; Maggio, M.; Raynaud-Simon,
A.; Sieber, C.C.; et al. ESPEN guideline on clinical nutrition and hydration in geriatrics. Clin. Nutr. 2019, 38, 10–47. [CrossRef][PubMed]
2. Limketkai, B.N.; Shah, N.D.; Sheikh, G.N.; Allen, K. Classifying enteral nutrition: Tailored for clinical practice. Curr. Gastroenterol.Rep. 2019, 21, 47. [CrossRef] [PubMed]
3. Joerger, M.; Schneider, S.M. Enteral Nutrition to Prevent and Treat Undernutrition. In Advanced Nutrition and Dietetics in NutritionSupport; John Wiley & Sons, Ltd: New Jersey, NJ, USA, 2018; pp. 194–206.
4. Bankhead, R.; Boullata, J.; Brantley, S.; Corkins, M.; Guenter, P.; Krenitsky, J.; Lyman, B.; Metheny, N.A.; Mueller, C.; Robbins,S.; et al. A.S.P.E.N. Enteral nutrition practice recommendations. J. Parenter. Enter. Nutr. 2009, 33, 122–167. [CrossRef] [PubMed]
5. Blumenstein, I.; Shastri, Y.M.; Stein, J. Gastroenteric tube feeding: Techniques, problems and solutions. World J. Gastroenterol.2014, 20, 8505–8524. [CrossRef]
6. Karel, M.; Lund, D.B. Physical Principles of Food Preservation: Revised and Expanded, 2nd ed.; Marcel Dekker, Inc.: New York, NY,USA, 2003; pp. 170–177.
7. D’Incecco, P.; Limbo, S.; Hogenboom, J.A.; Pellegrino, L. Novel technologies for extending the shelf life of drinking milk: Concepts,research trends, and current applications. LWT 2021, 148, 111746. [CrossRef]

Foods 2022, 11, 2023 16 of 17
8. Rasane, P.; Sharma, N.; Fatma, S.; Kaur, S.; Jha, A.; Kaur, D.; Singh, J. Ultra-high temperature (UHT) processing: Technologicalsignificance and updates. Curr. Nutr. Food Sci. 2020, 16, 1183–1195. [CrossRef]
9. Oamen, E.E.; Hansen, A.P.; Swartzel, K.R. Effect of ultra-high temperature steam injection processing and aseptic storage onlabile water-soluble vitamins in milk. J. Dairy Sci. 1989, 72, 614–619. [CrossRef]
10. Sevenich, R.; Mathys, A. Continuous versus discontinuous ultra-high-pressure systems for food sterilization with focus onultra-high-pressure homogenization and high-pressure thermal sterilization: A review. Compr. Rev. Food Sci. 2018, 17, 646–662.[CrossRef]
11. Mesías, M.; Holgado, F.; Sevenich, R.; Briand, J.C.; Márquez Ruiz, G.; Morales, F.J. Fatty acids profile in canned tuna and sardineafter retort sterilization and high-pressure thermal sterilization treatment. J. Food Nutr. Res. 2015, 54, 171–178.
12. Beasley, J.M.; Shikany, J.M.; Thomson, C.A. The role of dietary protein intake in the prevention of sarcopenia of aging. Nutr. Clin.Pract. 2013, 28, 684–690. [CrossRef]
13. Landi, F.; Camprubi-Robles, M.; Bear, D.E.; Cederholm, T.; Malafarina, V.; Welch, A.A.; Cruz-Jentoft, A.J. Muscle loss: The newmalnutrition challenge in clinical practice. Clin. Nutr. 2019, 38, 2113–2120. [CrossRef] [PubMed]
14. Calder, P.C. Omega-3 fatty acids and inflammatory processes. Nutrients 2010, 2, 355–374. [CrossRef]15. Mann, G.; Mora, S.; Madu, G.; Adegoke, O.A.J. Branched-chain amino acids: Catabolism in skeletal muscle and implications for
muscle and whole-body metabolism. Front. Physiol. 2021, 12, 702826. [CrossRef]16. Iberahim, N.I.; Tan, B.C. Hexane-isopropanol extraction and quality assessment of omega-3 fish oil from Atlantic salmon (Salmo
salar). IOP Conf. Ser. Mater. Sci. Eng. 2020, 932, 012038. [CrossRef]17. Serafim, V.; Tiugan, D.-A.; Andreescu, N.; Mihailescu, A.; Paul, C.; Velea, I.; Puiu, M.; Niculescu, M.D. Development and
validation of a LC–MS/MS-based assay for quantification of free and total omega 3 and 6 fatty acids from human plasma.Molecules 2019, 24, 360. [CrossRef] [PubMed]
18. Le, T.T.; Shafaei, A.; Genoni, A.; Christophersen, C.; Devine, A.; Lo, J.; Wall, P.L.; Boyce, M.C. Development and validation of asimple LC-MS/MS method for the simultaneous quantitative determination of trimethylamine-N-oxide and branched chainamino acids in human serum. Anal. Bioanal. Chem. 2019, 411, 1019–1028. [CrossRef]
19. Marino, R.; Iammarino, M.; Santillo, A.; Muscarella, M.; Caroprese, M.; Albenzio, M. Technical note: Rapid method fordetermination of amino acids in milk. J. Dairy Sci. 2010, 93, 2367–2370. [CrossRef]
20. Zhou, L.; Tang, Q.; Wasim Iqbal, M.; Xia, Z.; Huang, F.; Li, L.; Liang, M.; Lin, B.; Qin, G.; Zou, C. A Comparison of milk protein,fat, lactose, total solids and amino acid profiles of three different buffalo breeds in Guangxi, China. Ital. J. Anim. Sci. 2018,17, 873–878. [CrossRef]
21. Gacula, M., Jr.; Rutenbeck, S. Sample size in consumer test and descriptive analysis. J. Sens. Stud. 2006, 21, 129–145. [CrossRef]22. Jukic, P.N.; Gagliardi, C.; Fagnani, D.; Venturini, C.; Orlandoni, P. Home enteral nutrition therapy: Difficulties, satisfactions and
support needs of caregivers assisting older patients. Clin. Nutr. 2017, 36, 1062–1067. [CrossRef]23. Evans, S.; Daly, A.; Ashmore, C.; Gokmen-Ozel, H.; Dileva, R.; Dumbleton, B.; Chahal, S.; MacDonald, A. Nutritional content of
modular feeds: How accurate is feed production? Arch. Dis. Child. 2013, 98, 184–188. [CrossRef] [PubMed]24. Hurt, R.T.; Edakkanambeth Varayil, J.; Epp, L.M.; Pattinson, A.K.; Lammert, L.M.; Lintz, J.E.; Mundi, M.S. Blenderized tube
feeding use in adult home enteral nutrition patients. Nutr. Clin. Pract. 2015, 30, 824–829. [CrossRef] [PubMed]25. Escuro, A.A.; Hummell, A.C. Enteral formulas in nutrition support practice. Nutr. Clin. Pract. 2016, 31, 709–722. [CrossRef]
[PubMed]26. Arends, J.; Bachmann, P.; Baracos, V.; Barthelemy, N.; Bertz, H.; Bozzetti, F.; Fearon, K.; Hütterer, E.; Isenring, E.; Kaasa, S.; et al.
ESPEN guidelines on nutrition in cancer patients. Clin. Nutr. 2017, 36, 11–48. [CrossRef]27. Kreissl, A.; Zwiauer, V.; Repa, A.; Binder, C.; Haninger, N.; Jilma, B.; Berger, A.; Haiden, N. Effect of fortifiers and additional
protein on the osmolarity of human milk: Is it still safe for the premature infant? J. Pediatr. Gastroenterol. Nutr. 2013, 57, 432–437.[CrossRef]
28. Starowicz, M.; Zielinski, H. How maillard reaction influences sensorial properties (color, flavor, and texture) of food products?Food Rev. Int. 2019, 35, 707–725. [CrossRef]
29. Sohi, H.; Sultana, Y.; Khar, R.K. Taste masking technologies in oral pharmaceuticals: Recent developments and approaches. DrugDev. Ind. Pharm. 2004, 30, 429–448. [CrossRef]
30. Itou, M.; Kawaguchi, T.; Taniguchi, E.; Shiraishi, S.; Ibi, R.; Mutou, M.; Okada, T.; Uchida, Y.; Otsuka, M.; Oriishi, T.; et al. Heatingimproves poor compliance with branchebranched-chainacid-rich supplementation in patients with liver cirrhosis: A before-afterpilot study. Mol. Med. Rep. 2009, 2, 983–987. [CrossRef]
31. Yeung, C.-Y.; Lee, H.-C.; Lin, S.-P.; Yang, Y.-C.; Huang, F.-Y.; Chuang, C.-K. Negative effect of heat sterilization on the free aminoacid concentrations in infant formula. Eur. J. Clin. Nutr. 2006, 60, 136–141. [CrossRef]
32. van Lieshout, G.A.A.; Lambers, T.T.; Bragt, M.C.E.; Hettinga, K.A. How processing may affect milk protein digestion and overallphysiological outcomes: A systematic review. Crit. Rev. Food Sci. Nutr. 2020, 60, 2422–2445. [CrossRef]
33. Domiszewski, Z.; Mierzejewska, S. Effect of technological process on true retention rate of eicosapentaenoic and docosahexaenoicacids, lipid oxidation and physical properties of canned smoked sprat (Sprattus sprattus). Int. J. Food Sci. 2021, 2021, e5539376.[CrossRef]

Foods 2022, 11, 2023 17 of 17
34. Wesselink, E.; Koekkoek, K.W.A.C.; Looijen, M.; van Blokland, D.A.; Witkamp, R.F.; van Zanten, A.R.H. Associations ofhyperosmolar medications administered via nasogastric or nasoduodenal tubes and feeding adequacy, food intolerance andgastrointestinal complications amongst critically ill patients: A retrospective study. Clin. Nutr. ESPEN 2018, 25, 78–86. [CrossRef][PubMed]
35. Btaiche, I.F.; Chan, L.-N.; Pleva, M.; Kraft, M.D. critical illness, gastrointestinal complications, and medication therapy duringenteral feeding in critically ill adult patients. Nutr. Clin. Pract. 2010, 25, 32–49. [CrossRef] [PubMed]
36. Kwok, K.C.; Liang, H.H.; Niranjan, K. Optimizing conditions for thermal processes of soy milk. J. Agric. Food Chem. 2002,50, 4834–4838. [CrossRef]
37. Gonzales, R.O.; Baleta, F.N.; Bolaños, J.M. Acceptability of selected herbs as off-odor remover and flavor enhancer for driedparrot fish Scarus rivulatus. Int. J. Food Sci. Nutr. 2017, 2, 31–37.
38. Champagne, E.T. Rice Aroma and flavor: A literature review. Cereal Chem. 2008, 85, 445–454. [CrossRef]39. Mak, J.; Cowan, T.M.; Le, A. Quantitative Analysis of Underivatized Amino Acids by Liquid Chromatography-Tandem Mass
Spectrometry. In Amino Acid Analysis: Methods and Protocols; Cooper, C., Packer, N., Williams, K., Eds.; Springer: New York, NY,USA, 2019; pp. 85–109.
40. Chang, C.; Nickerson, M.T. Encapsulation of omega 3-6-9 fatty acids-rich oils using protein-based emulsions with spray drying. J.Food Sci. Technol. 2018, 55, 2850–2861. [CrossRef]
Related Documents