Los Angeles County Coordinated Entry System Rapid Re-Housing for Individuals and Youth Dashboard Methodology Published: 11/2016

Welcome message from author
This document is posted to help you gain knowledge. Please leave a comment to let me know what you think about it! Share it to your friends and learn new things together.
Transcript
Los Angeles County Coordinated Entry System Rapid Re-Housing for
Individuals and Youth Dashboard Methodology
Published: 11/2016
TABLE OF CONTENTS .............................................................. 2
INTRODUCTION ...................................................................... 4
Our Mission ................................................................................................................................................... 4
Coordinated Entry System (CES) Rapid Re-Housing (RRH) for Individuals and Youth .................................. 4
The Los Angeles County CES RRH Dashboard ............................................................................................... 4
Questions or Comments? ............................................................................................................................. 5
The Coordinated Entry System (CES) for Single Adults ................................................................................. 5
CES RRH Services and Agencies .................................................................................................................... 5
Primary Data Source ..................................................................................................................................... 6
De-duplication ............................................................................................................................................... 6
Glossary ......................................................................................................................................................... 6
DASHBOARD COMPONENTS ................................................... 8
Enrollments, Placements and Program Exits ................................................................................................ 8
Program Entries by Week ..................................................................................................................... 8
Program Entries by Month .................................................................................................................... 8
Program Entries by SPA ......................................................................................................................... 8
Housing Placements by Week ............................................................................................................... 8
Housing Placements by Month ............................................................................................................. 9
Time from Program Entry to Housing by Service Planning Area (days) ................................................ 9
Destinations by Type ............................................................................................................................. 9
Total Destinations by Service Planning Area......................................................................................... 9
Participating Organizations ................................................................................................................. 10
Program Services ........................................................................................................................................ 10
Service Cost by Week .......................................................................................................................... 10
Service Cost by Month ........................................................................................................................ 11
Service Cost by Service Planning Area ................................................................................................ 11
TABLE OF CONTENTS
INTRODUCTIONTEDASHBOARD
COMPONENTSNTS
TABLE OF CONTENTS
INTRODUCTIONTEDASHBOARD
COMPONENTSNTS
INTRODUCTIONTABLE OF CONTENTS
INTRODUCTIONTEDASHBOARD
COMPONENTSNTS
TABLE OF CONTENTS
INTRODUCTIONTEDASHBOARD
COMPONENTSNTS
INTRODUCTIONTABLE OF CONTENTS
Direct Financial Assistance by Service Planning Area ......................................................................... 11
Service Cost Details ............................................................................................................................. 11
Demographics ............................................................................................................................................. 12
Prior Living Situation ........................................................................................................................... 12
Age ...................................................................................................................................................... 12
Gender ................................................................................................................................................ 12
Disabled ............................................................................................................................................... 12
Veteran................................................................................................................................................ 13
Discharge Status (if a Veteran)............................................................................................................ 13
Priority Score ....................................................................................................................................... 13
History of Intimate Partner Violence .................................................................................................. 13
Ethnicity .............................................................................................................................................. 14
Race ..................................................................................................................................................... 14
Changes in Income ...................................................................................................................................... 14
Changes in Income by Service Planning Area for Housed Participants .............................................. 14
Income Distribution at Entry and Exit for Housed Participants .......................................................... 15
APPENDIX A: GLOSSARY OF COMMON TERMS ..................... 15
Acuity/Priority Score ........................................................................................................................... 15
Continuum of Care (CoC) .................................................................................................................... 15
Continuum of Care (CoC) Lead Agency ............................................................................................... 15
Disability .............................................................................................................................................. 16
Emergency Shelter .............................................................................................................................. 16
Homelessness...................................................................................................................................... 16
Homeless Management Information System (HMIS) ......................................................................... 17
Permanent Supportive Housing .......................................................................................................... 17
Rapid Rehousing.................................................................................................................................. 17
Transitional Housing ........................................................................................................................... 17
Vulnerability Index-Service Prioritization Decision Assistance Tool (VI-SPDAT) ................................. 17
Our Mission
Our mission is to create a centralized data dashboard to effectively measure CES RRH program
performance in Los Angeles County.
This document explains each of the dashboard’s data visualizations, including the data source,
its meaning, as well as any notable caveats or limitations. Our team created a dashboard
methodology that generates an accurate picture of the heads of households served by CES RRH
programs by integrating data from CoC HMIS, while reducing opportunities for duplication
across sources.
Coordinated Entry System (CES) Rapid Re-Housing (RRH) for Individuals and
Youth The Los Angeles Homeless Services Authority’s (LAHSA) CES RRH program provides limited term rental
subsidies and supportive services to assist individuals (including Transitional Age Youth, or TAY)
experiencing homeless to return to permanent housing as quickly as is possible.
CES RRH fills a critical service gap in Los Angeles’ continuum of homeless services by providing a housing
resource to individuals not requiring a permanent housing resource and intensive support.
From utility arears to furnishings, from deposits to employment development CES RRH types of services
received will vary based on the needs of each individual based on need – some requiring ongoing wrap
around support, others requiring one-time rental assistance. Available CES RRH services can fall into any
of the three categories below:
Housing Identification
Rent and Move-In Assistance
Rapid Re-Housing Case Management and Services
The Los Angeles County CES RRH Dashboard The dashboard provides an overview of the effectiveness of existing Los Angeles County CES RRH
programs. The dashboard is intended to inform the public and to help the Los Angeles continuum of
care make policy choices around program design and resource alignment.
The dashboard highlights measures of success - including permanent housing placements - as well as
INTRODUCTION
detailing the specific services provided, and the cost of those services. Time to results, and the
demographics of those being served by CES RRH programs are also tracked within the dashboard.
While Los Angeles CES RRH programs are active it is expected that data from this dashboard will be
updated at least quarterly; if not monthly.
There is no personally indefinable information within the dashboard.
Questions or Comments? LAHSA considers the CES RRH dashboard as a work in progress. Updated versions of the dashboard may
be released as the needs of the community changes and as new data elements become available.
If you have any questions or comments please reach out to [email protected].
The Coordinated Entry System (CES) for Single Adults The CES is a regionally coordinated system of care for homeless and imminently single adults that
provides rapid re-housing, prevention services and ongoing case management to assist individuals in
securing and maintaining safe, stable permanent housing. The regional approach to the system assists
homeless and at-risk individuals to stay in their communities-close to employment, family and
community-based supportive services to help reduce the de-stabilizing effect of homelessness.
Service providers participating in the system utilize standardized assessment tools and housing
interventions which are targeted to best meet the needs of homeless and at-risk individuals. Housing
interventions are right-sized to ensure that individuals receive just enough assistance to help stabilize
their housing crisis. Individuals with greater challenges to housing stability are targeted and prioritized
for service enriched housing while those with fewer challenges to housing stability are targeted for
rapid re-housing programs. Prevention services help those at-risk of homelessness by maintaining their
current permanent housing situation or assisting them in moving to another permanent housing
situation. Regardless of the housing intervention, the system strives to rehouse all individuals as quickly
as possible.
CES RRH Services and Agencies Within the dashboard, services are segmented into four categories. Services within these categories may
change as service offerings change.
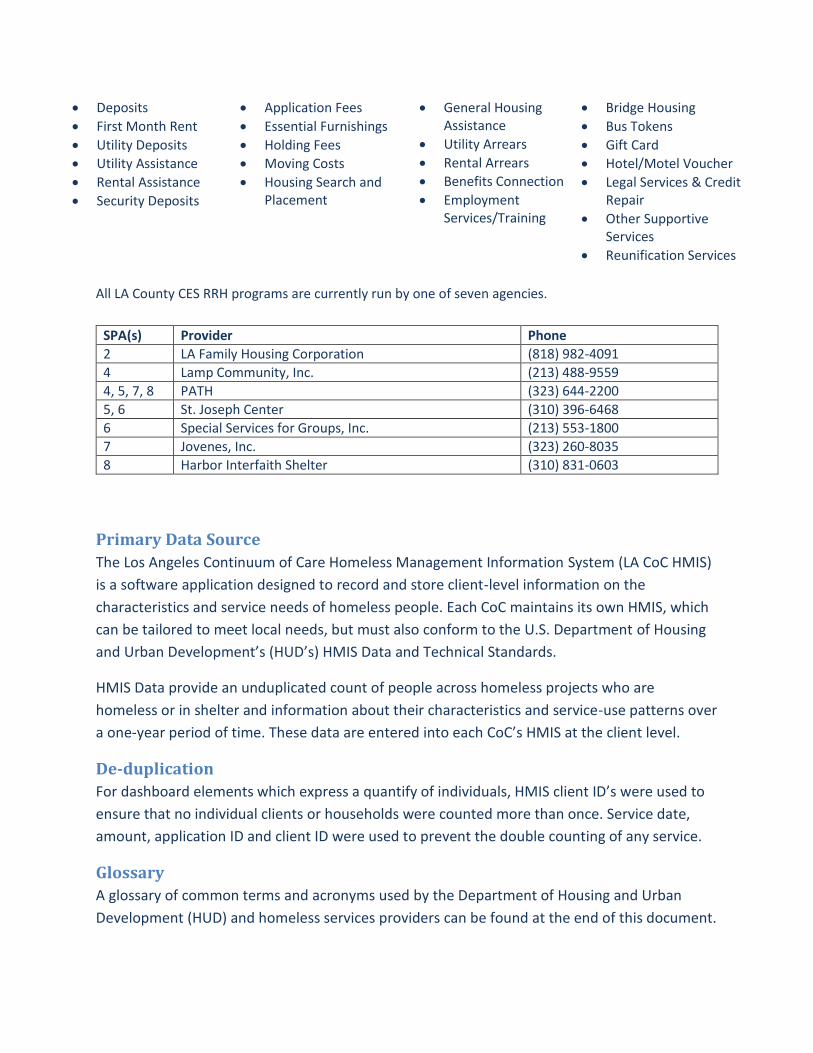
Direct Rental Assistance Housing Search & Move-In Housing Stabilization Other
Deposits
First Month Rent
Utility Deposits
Utility Assistance
Rental Assistance
Security Deposits
Application Fees
Essential Furnishings
Holding Fees
Moving Costs
Housing Search and Placement
General Housing Assistance
Utility Arrears
Rental Arrears
Benefits Connection
Employment Services/Training
Bridge Housing
Bus Tokens
Gift Card
Hotel/Motel Voucher
Legal Services & Credit Repair
Other Supportive Services
Reunification Services
All LA County CES RRH programs are currently run by one of seven agencies.
SPA(s) Provider Phone
2 LA Family Housing Corporation (818) 982-4091
4 Lamp Community, Inc. (213) 488-9559
4, 5, 7, 8 PATH (323) 644-2200
5, 6 St. Joseph Center (310) 396-6468
6 Special Services for Groups, Inc. (213) 553-1800
7 Jovenes, Inc. (323) 260-8035
8 Harbor Interfaith Shelter (310) 831-0603
Primary Data Source
The Los Angeles Continuum of Care Homeless Management Information System (LA CoC HMIS)
is a software application designed to record and store client-level information on the
characteristics and service needs of homeless people. Each CoC maintains its own HMIS, which
can be tailored to meet local needs, but must also conform to the U.S. Department of Housing
and Urban Development’s (HUD’s) HMIS Data and Technical Standards.
HMIS Data provide an unduplicated count of people across homeless projects who are
homeless or in shelter and information about their characteristics and service-use patterns over
a one-year period of time. These data are entered into each CoC’s HMIS at the client level.
De-duplication
For dashboard elements which express a quantify of individuals, HMIS client ID’s were used to
ensure that no individual clients or households were counted more than once. Service date,
amount, application ID and client ID were used to prevent the double counting of any service.
Glossary
A glossary of common terms and acronyms used by the Department of Housing and Urban
Development (HUD) and homeless services providers can be found at the end of this document.

Enrollments, Placements and Program Exits
Program Entries by Week
This line chart tracks the number of unduplicated individuals who have entered any Los
Angeles County CES RRH program within a given week.
Data Source(s): CoC HMIS Data
Program Entries by Month
This table consolidates the data in the Program Entries by Week line chart into months.
Data Source(s): CoC HMIS Data
Program Entries by SPA
The cumulative total of the stacked bars shows the distribution of unduplicated Los Angeles
County CES RRH program entrants across SPAs. The percentage of all entrants who are
contained within a specific SPA is represented by the number to the right of each bar.
Individuals within the data source who are not associated with a SPA are not represented in
this visualization.
Data Source(s): CoC HMIS Data
Housing Placements by Week
This line chart tracks the number of Los Angeles County’s homeless who have entered
permanent housing through CES RRH programs, including permanent housing destinations
with and without ongoing subsidies and/or services.
Permanent housing entries include exits from emergency shelter, transitional housing, rapid
re-housing, safe havens, and into permanent supportive housing programs (such as the HUD
Section 8 voucher program).
Individuals within the data source who have not been housed are not represented in this
visualization.
Data Source(s): CoC HMIS Data
DASHBOARD COMPONENTS
Housing Placements by Month
This table consolidates the data in the Housed Participants by Week line chart into months.
Data Source(s): CoC HMIS Data
Time from Program Entry to Housing by Service Planning Area (days)
The number of days between program entry date and either program exit, move-in date, or
first date of rental assistance (whichever occurred first) for an individual is represented by
each circle’s position on the x-axis. The y-axis indicates which SPA each individual is
associated with. The gray trend lines indicate the average number of days from entry to
housing for the individuals within each SPA.
Individuals within the data source who have not been housed are not represented in this
visualization.
Data Source(s): CoC HMIS Data
Destinations by Type
The cumulative total of the stacked bars shows the distribution of unduplicated Los Angeles
County CES RRH program participants across destination types. The percentage of
participants who are represented within each destination type is indicated by a number to
the right of each bar.
Individuals within the data source who are not associated with a destination are not
represented in this visualization.
Data Source(s): CoC HMIS Data
Total Destinations by Service Planning Area
The cumulative total of the bars shows the distribution of unduplicated Los Angeles County
CES RRH program participants across destination types, segmented by SPA. The number of
participants who are represented within each destination type within each SPA is indicated
by the number on top of each bar.
Individuals within the data source who are not associated with a destination are not
represented in this visualization.
Data Source(s): CoC HMIS Data
Participating Organizations
This sections contains the logos of the organizations involved in administering the Los
Angeles county CES RRH programs, which are represented in this dashboard.
Data Source(s): CoC HMIS Data
Program Services
Service Cost by Week
Each line tracks the total cost attributed to each service category within each month for
participants within Los Angeles County CES RRH programs.
Each individual may have received a service type more than once, or multiple service types.
Service groupings are as follows:
Housing Search and Move-In
o Application Fees
o Essential Furnishings
o Holding Fees
o Moving Costs
o Housing Search and Placement
Direct Rental Assistance
o Deposits
o First Month Rent
o Utility Deposits
o Utility Assistance
o Rental Assistance
o Security Deposits
Housing Stabilization
o General Housing Assistance
o Utility Arrears
o Rental Arrears
o Benefits Connection
o Employment Services/Training
Other
o Bridge Housing
o Bus Tokens
o Gift Card
o Hotel/Motel Voucher
o Legal Services & Credit Repair
o Other Supportive Services
o Reunification Services
Data Source(s): CoC HMIS Data
Service Cost by Month
This table consolidates the data in the Service Cost by Week line chart into months.
Data Source(s): CoC HMIS Data
Service Cost by Service Planning Area
This table tracks the number of unduplicated Los Angeles County CES RRH program entrants
within each month who to date have received one or more of the services represented in
the Service Cost by Week and Service Cost by Month visualizations.
Data Source(s): CoC HMIS Data
Direct Financial Assistance by Service Planning Area
This table tracks the number of unduplicated Los Angeles County CES RRH program entrants
within each month who to date have received one or more of what are categorized within
this dashboard as a direct financial services. Direct financial services include rental
assistance, deposits, move-in costs, utilities and holding fees.
Data Source(s): CoC HMIS Data
Service Cost Details
This table displays the data used in the Service Cost by Service Planning Area table in a
detailed view of services.
Data Source(s): CoC HMIS Data
Demographics
Prior Living Situation
The cumulative total of the stacked bars shows the distribution of unduplicated Los Angeles
County CES RRH program entrants across the available categories of prior living situations.
Prior meaning prior to entering an CES RRH program; an individual may still reside in this
living situation while in an CES RRH program.
Individuals within the data source who are not associated with a prior living situation are
not represented in this visualization.
Data Source(s): CoC HMIS Data
Age
The cumulative total of the stacked bars shows the distribution of unduplicated Los Angeles
County CES RRH program entrants across age ranges. The percentage of all entrants who
are contained within each range is represented by the number to the right of each bar.
Data Source(s): CoC HMIS Data
Gender
The cumulative total of the stacked bars shows the distribution of unduplicated Los Angeles
County CES RRH program entrants across genders. The percentage of all entrants who are
contained within each category is represented by the number to the right of each bar.
Data Source(s): CoC HMIS Data
Disabled
The cumulative total of the stacked bars shows the number of unduplicated Los Angeles
County CES RRH program entrants who do and do not identify as disabled. The percentage
of all entrants who are contained within each category is represented by the number to the
right of each bar.
Disability is defined in the glossary of this methodology.
Data Source(s): CoC HMIS Data
Veteran
The cumulative total of the stacked bars shows the number of unduplicated Los Angeles
County CES RRH program entrants who do and do not identify as a veteran. The percentage
of all entrants who are contained within each category is represented by the number to the
right of each bar.
Data Source(s): CoC HMIS Data
Discharge Status (if a Veteran)
The cumulative total of the stacked bars shows the distribution of unduplicated Los Angeles
County CES RRH program entrants who identify as veterans across discharge status. The
percentage of all entrants who are contained within each category is represented by the
number to the right of each bar.
Veteran individuals within the data source who are not associated with a discharge status
are not represented in this visualization.
Data Source(s): CoC HMIS Data
Priority Score
The cumulative total of the stacked bars shows the distribution of unduplicated Los Angeles
County CES RRH program entrants across priority scores. The percentage of all entrants who
are contained within each category is represented by the number to the right of each bar.
Priority score is determined by the VI-SPDAT, defined in the glossary of this methodology.
The lower the priority score, the more vulnerable the individual.
Individuals within the data source who are not associated with a priority score are not
represented in this visualization.
Data Source(s): CoC HMIS Data
History of Intimate Partner Violence
The cumulative total of the stacked bars shows the number of unduplicated Los Angeles
County CES RRH program entrants who do and do not identify as having been a victim of
intimate partner violence. The percentage of all entrants who are contained within each
category is represented by the number to the right of each bar.
Data Source(s): CoC HMIS Data
Ethnicity
The cumulative total of the stacked bars shows the distribution of unduplicated Los Angeles
County CES RRH program entrants who do and do not identify themselves as Hispanic or
Latinos. The percentage of all entrants who are contained within each category is
represented by the number to the right of each bar.
Data Source(s): CoC HMIS Data
Race
The cumulative total of the stacked bars shows the distribution of unduplicated Los Angeles
County CES RRH program entrants who identify themselves within one or more of
five different racial categories. The percentage of all entrants who are contained within
each category is represented by the number to the right of each bar.
Data Source(s): CoC HMIS Data
Changes in Income
Changes in Income by Service Planning Area for Housed Participants
This table tracks the average monthly income among unduplicated Los Angeles County CES
RRH program participants within each SPA. Entry monthly income is the earliest recorded
income amount recorded for each individual, typically upon program entry. Income at exit is
based on the income recorded as close to the date of each participant was housed. The
average percentage of income change from entry to exit within each SPA is tracked in the
income change column.
Individuals within the data source who have not been housed are not represented in this
visualization.
Data Source(s): CoC HMIS Data
Income Distribution at Entry and Exit for Housed Participants
This table consolidates the data in the Changes in Income by SPA for Housed Participants
table into months.
The average income entry monthly income, and the income at exit for an individual is
represented by each circle’s position on the x-axis. The y-axis identifies each circle as being
an entry or exit income. The gray trend lines indicate the average income.
Individuals within the data source who have not been housed are not represented in this
visualization.
Data Source(s): CoC HMIS Data
Acuity/Priority Score
A score assigned to a homeless person or family by use of the VI-SPDAT tool, which conveys
their relative need for each type of housing assistance
Continuum of Care (CoC)
A collaborative funding and planning approach that helps communities plan for and
provide, as necessary, a full range of emergency, transitional, and permanent housing and
other service resources to address the various needs of homeless persons. HUD also refers
to the group of community stakeholders involved in the decision making processes as the
“Continuum of Care.”
Continuum of Care (CoC) Lead Agency
An organization designated by the CoC primary decision making body to be the entity that
submits the CoC application. The CoC lead agency is responsible for the coordination and
oversight of the CoC planning efforts, and has the authority to certify and submit the CoC
homeless assistance funding application. For most of Los Angeles County, LAHSA is the CoC
Lead. The Cities of Long Beach, Glendale, and Pasadena lead their own Continua.
APPENDIX A: GLOSSARY OF COMMON TERMS
Disability
An individual is disabled if they are diagnosed with one or more of the following conditions:
1. A physical, mental, or emotional impairment, including an impairment caused by
alcohol or drug abuse, post-traumatic stress disorder, or brain injury that:
a. Is expected to be long-continuing or of indefinite duration;
b. Substantially impedes the individual's ability to live independently; and
c. Could be improved by the provision of more suitable housing conditions.
2. A developmental disability, as defined in section 102 of the Developmental
Disabilities Assistance and Bill of Rights Act of 2000 (42 U.S.C. 15002); or
3. The disease of acquired immunodeficiency syndrome (AIDS) or any condition arising
from the etiologic agency for acquired immunodeficiency syndrome (HIV).
Emergency Shelter
Facilities that provide temporary or transitional shelter for the homeless in general or for
specific populations of the homeless. Most serve specific sub-populations including single
adults, families with children, et al.
Homelessness
As established by the US Department of Housing and Urban Development (HUD), there are
four categories of homelessness. They are:
1. People who are living in a place not meant for human habitation, in emergency
shelter, in transitional housing, or are exiting an institution where they temporarily
resided if they were in shelter or a place not meant for human habitation before
entering the institution.
2. People who are losing their primary nighttime residence, which may include a motel
or hotel or a doubled up situation, within 14 days and lack resources or support
networks to remain in housing.
3. Families with children or unaccompanied youth who are unstably housed and likely to
continue in that state. This is a new category of homelessness, and it applies to
families with children or unaccompanied youth (up to age 24) who have not had a
lease or ownership interest in a housing unit in the last 60 or more days, have had two
or more moves in the last 60 days, and who are likely to continue to be unstably
housed because of disability or multiple barriers to employment.
4. People who are fleeing or attempting to flee domestic violence, dating violence,
sexual assault, stalking, or other dangerous or life-‐threatening situations related to
violence; have no other residence; and lack the resources or support networks to
obtain other permanent housing.
Homeless Management Information System (HMIS)
An electronic database used to hold information on the characteristics and service needs of
homeless people in the U.S. Users of HMIS include homeless service providers, Continuums
of Care, Public Housing Authorities, Broad utilization of HMIS can help provide a consistent
and accurate snapshot of a region’s homeless population, including a population count,
information on service use, and a measurement of the effectiveness of homeless programs,
as HMIS also helps track the number of chronically homeless clients and placements into
permanent housing
Permanent Supportive Housing
Affordable housing with supportive services, designed for persons with disabilities.
Rapid Rehousing
Programs that provide financial assistance and services, such as security deposits, move-in
assistance, short- or medium-term rental subsidies, to help those who are experiencing
homelessness be quickly re-housed and stabilized.
Transitional Housing
Transitional housing facilitates the movement of homeless individuals and families to
permanent housing. Homeless persons may live in transitional housing for up to 24 months
and receive supportive services such as childcare and job training.
Vulnerability Index-Service Prioritization Decision Assistance Tool (VI-SPDAT)
Service providers must know homeless individuals personally to identify the best ways to
help them escape homelessness. The VI-SPDAT is a “supertool” that combines two widely
used Outreach assessments to gauge a homeless person or family’s physical and emotional
condition, safety, security and socialization, among other factors. The VI-SPDAT assigns an
Acuity score and helps identify who should be recommended for each housing and support
intervention to effectively prioritize who is eligible and in greatest need of services and
housing.
The Vulnerability Index, developed by Community Solutions, is a street outreach tool currently in use in more than 100 communities. Rooted in leading medical research, the VI helps determine the chronicity and medical vulnerability of homeless individuals.
The Service Prioritization Decision Assistance Tool, developed by OrgCode Consulting, is an intake and case management tool. Based on a wide body of social science research, the tool helps service providers allocate resources in a logical, targeted way.
The tool helps identify the best type of support and housing intervention for an individual
by relying on three categories of recommendation:
Permanent Supportive Housing: Individuals or families who need permanent housing with ongoing access to services and case management to remain stably housed. Rapid Re-Housing: Individuals or families with moderate health, mental health and/or emotional health issues, but who are likely to be able to achieve housing stability over a short time period through a medium or short-term rent subsidy and access to support services. Affordable Housing: Individuals or families who do not require intensive supports but
may still benefit from access to affordable housing. In these cases, the tool recommends
affordable or subsidized housing but no specific intervention drawn uniquely from the
homeless services world.
Related Documents