COORDINATED COMPLIANCE, MONITORING, AND REPORTING PLAN INCORPORATING QUALITY ASSURANCE PROJECT PLAN COMPONENTS GREATER LOS ANGELES AND LONG BEACH HARBOR WATERS Prepared for Caltrans Cities of Bellflower, Lakewood, Long Beach, Los Angeles, Paramount, Rancho Palos Verdes, Rolling Hills, Rolling Hills Estates, and Signal Hill Los Angeles County Los Angeles County Flood Control District Ports of Long Beach and Los Angeles Prepared by Anchor QEA, L.P. 27201 Puerta Real, Suite 350 Mission Viejo, California 92691 June 2013

Welcome message from author
This document is posted to help you gain knowledge. Please leave a comment to let me know what you think about it! Share it to your friends and learn new things together.
Transcript
COORDINATED COMPLIANCE, MONITORING, AND REPORTING PLAN INCORPORATING QUALITY ASSURANCE PROJECT PLAN COMPONENTS
GREATER LOS ANGELES AND LONG BEACH HARBOR WATERS
Prepared for
Caltrans
Cities of Bellflower, Lakewood, Long Beach, Los Angeles, Paramount, Rancho Palos Verdes,
Rolling Hills, Rolling Hills Estates, and Signal Hill
Los Angeles County
Los Angeles County Flood Control District
Ports of Long Beach and Los Angeles
Prepared by
Anchor QEA, L.P.
27201 Puerta Real, Suite 350
Mission Viejo, California 92691
June 2013
Coordinated Compliance, Monitoring, and Reporting Plan June 2013 Greater Los Angeles and Long Beach Harbor Waters Page i
TITLE AND APPROVAL SHEETS (ELEMENT A1)
Coordinated Compliance, Monitoring, and Reporting Plan incorporating Quality Assurance
Project Plan Components related the Greater Los Angeles and Long Beach Harbor Waters
Approval sheets are included in the PQAPP.
DISTRIBUTION LIST (ELEMENT A3)
Individuals listed below will receive a copy of this document.
Department of Transportation, District 07
Robert Wu, District TMDL Coordinator
Design Division, Storm Water Unit
100 South Main Street, Suite 100, MS 13
Los Angeles, California 90012
Phone: (213) 897-8636
Email: [email protected]
Chien-Pei M. Yu
Design Division, Storm Water Unit
100 South Main Street, Suite 100, MS 13
Los Angeles, California 90012
Phone: (213) 897-0974
Email: [email protected]
City of Bellflower
Barnardo Iniguez, Environmental Services
Manager
16600 Civic Center Drive
Bellflower, California 90706
Phone: (562) 804-1424, ext. 2233
Email: [email protected]
City of Lakewood, Public Works
Konya Vivanti, Senior Management Analyst
5050 Clark Avenue
Lakewood, California 90712
Phone: (562) 866-9771, Extension 2507
Email: [email protected]
City of Los Angeles
Donna Toy-Chen, Assistant Division Manager
Watershed Protection Division
Bureau of Sanitation
1149 South Broadway, 10th Floor
Los Angeles, California 90015
Phone: (213)485-3928
Email: [email protected]
City of Los Angeles, Public Works
Shokoufe Marashi, Environmental Specialist
III
1149 S. Broadway Street, 10th Floor
Los Angeles, California 90015
Phone: (213) 485-3937
Email: [email protected]
Coordinated Compliance, Monitoring, and Reporting Plan June 2013 Greater Los Angeles and Long Beach Harbor Waters Page ii
City of Long Beach, Department of Public
Works
Anthony Arevalo
Storm Water and Environmental Compliance
Office
333 W. Ocean Boulevard, 9th Floor
Long Beach, California 90802
Phone: (562) 570-6023
Email: [email protected]
Ana DeAnda, Assistant Administrative
Analyst
333 W. Ocean Boulevard, 9th Floor
Long Beach, California 90802
Phone: (562) 570-6023
Email: [email protected]
City of Paramount
Chris Cash, Director of Public Works
16400 Colorado Avenue
Paramount, California 90723
Phone: (562) 220-2020
Email: [email protected]
City of Rancho Palos Verdes, Public Works
Andy Winje, P.E., Associate Engineer
30940 Hawthorne Boulevard
Rancho Palos Verdes, California 90275
Phone: (310) 544-5249
Email: [email protected]
City of Rolling Hills
Yolanta Schwartz, Planning Director
2 Portuguese Bend Road
Rolling Hills, California 90274
Phone: (310) 377-1521
City of Rolling Hills Estates
Greg Grammer, Assistant City Manager
4045 Palos Verdes Drive North
Rolling Hills Estates, California 90274
Phone: (310) 377-1577
City of Signal Hill
Steve Myrter, Public Works Director
2175 Cherry Avenue
Signal Hill, California 90755
Phone: (562) 989-7356
Email: [email protected]
Los Angeles Regional Water Quality Control
Board
Thanhloan Nguyen, Water Resources Control
Engineer
320 W. 4th Street
Los Angeles, California 90013
Phone: (213) 576-6689
Email: [email protected]
Coordinated Compliance, Monitoring, and Reporting Plan June 2013 Greater Los Angeles and Long Beach Harbor Waters Page iii
Los Angeles County and Los Angeles County
Flood Control District
William Johnson, Associate Civil Engineer
P.O. Box 1460
Alhambra, California 91802-1460
Phone: (626) 458-4319
Email: [email protected]
Port of Long Beach
Matt Arms
Manager of Water Quality
925 Harbor Plaza
Long Beach, California 90802
Phone: (562) 590-4160
Email: [email protected]
James Vernon, Environmental Specialist
925 Harbor Plaza
Long Beach, California 90802
Phone: (562) 283-7114
Email: [email protected]
Port of Los Angeles
Kathryn Curtis
Marine Environmental Supervisor
425 S. Palos Verdes Street
San Pedro, California 90731
Phone: (310) 732-3681
Email: [email protected]
Andrew Jirik, Environmental Specialist
425 S. Palos Verdes Street
San Pedro, California 90731
Phone: (310) 732-3681
Email: [email protected]
Coordinated Compliance, Monitoring, and Reporting Plan June 2013 Greater Los Angeles and Long Beach Harbor Waters Page iv
TABLE OF CONTENTS
TITLE AND APPROVAL SHEETS (ELEMENT A1) ................................................................... I
DISTRIBUTION LIST (ELEMENT A3) ........................................................................................ I
FORWARD/DOCUMENT ORGANIZATION ....................................................................... XIII
EXECUTIVE SUMMARY ...................................................................................................... ES-1
1 PROBLEM DEFINITION AND BACKGROUND (ELEMENT A5) ...................................... 1
1.1 Introduction......................................................................................................................1
1.2 Background .......................................................................................................................1
1.3 Harbor Toxics Total Maximum Daily Load ....................................................................1
1.3.1 Numeric Targets .........................................................................................................2
1.4 Compliance Measures ......................................................................................................2
1.5 Reporting Requirements ..................................................................................................3
1.6 Programmatic Quality Assurance Project Plan ..............................................................4
1.7 Coordinated Compliance and Monitoring Reporting Plan ............................................5
1.8 Objectives .........................................................................................................................6
1.9 Integration with Other Monitoring Programs ...............................................................6
2 PROJECT TASK AND ORGANIZATION (ELEMENT A4) ................................................. 7
2.1 Responsible Parties ...........................................................................................................7
2.2 Roles and Responsibilities ................................................................................................8
2.2.1 Project Managers ........................................................................................................8
2.2.2 Field Coordinator .......................................................................................................9
2.2.3 Laboratory Project Managers .....................................................................................9
2.2.4 Data Managers ..........................................................................................................10
3 PROJECT TASK DESCRIPTION (ELEMENT A6) .............................................................. 11
3.1 Summary of Monitoring Plan ........................................................................................11
3.2 Project Schedule .............................................................................................................11
3.3 Deliverables ....................................................................................................................12
4 SAMPLING PROCESS AND DESIGN (ELEMENT B01) .................................................... 13
4.1 Station Locations ............................................................................................................13
4.2 Field Sampling Parameters ............................................................................................16

Table of Contents
Coordinated Compliance, Monitoring, and Reporting Plan June 2013 Greater Los Angeles and Long Beach Harbor Waters Page v
4.2.1 Water.........................................................................................................................16
4.2.2 Sediment ...................................................................................................................16
4.2.3 Fish Tissue .................................................................................................................14
4.3 Sample Frequency ..........................................................................................................19
4.3.1 Water.........................................................................................................................19
4.3.2 Sediment ...................................................................................................................20
4.3.3 Fish Tissue .................................................................................................................20
4.4 Station and Sample Identification .................................................................................20
4.5 Critical Information .......................................................................................................22
5 SAMPLE COLLECTION (ELEMENT B02) ......................................................................... 23
5.1 Water ..............................................................................................................................23
5.1.1 In Situ Measurements ...............................................................................................23
5.1.2 Grab Samples ............................................................................................................24
5.2 Sediment .........................................................................................................................25
5.3 Fish Tissue ......................................................................................................................25
5.3.1 Targeted Species .......................................................................................................16
5.3.2 Fish Collection and Processing ................................................................................26
5.4 Field Equipment Decontamination Procedures ...........................................................28
5.5 Waste Disposal ...............................................................................................................29
5.5.1 Water.........................................................................................................................29
5.5.2 Sediment ...................................................................................................................29
5.5.3 Fish Tissue .................................................................................................................29
5.6 Sampling Platform and Equipment ...............................................................................29
5.7 Positioning and Vertical Controls .................................................................................30
6 SAMPLE HANDLING AND CUSTODY (ELEMENT B03) ................................................ 31
6.1 Sample Shipping .............................................................................................................31
6.2 Chain-of-Custody Procedures .......................................................................................32
7 FIELD MEASUREMENTS AND ANALYTICAL METHODS (ELEMENT B04) ................ 33
7.1 Water ..............................................................................................................................33
7.2 Sediment Triad Sampling ...............................................................................................34
7.2.1 Chemistry ..................................................................................................................34
7.2.2 Toxicity .....................................................................................................................35
Table of Contents
Coordinated Compliance, Monitoring, and Reporting Plan June 2013 Greater Los Angeles and Long Beach Harbor Waters Page vi
7.2.3 Benthic Community .................................................................................................36
7.3 Sediment Quality Objective Assessment ......................................................................36
7.3.1 Chemistry Line of Evidence .....................................................................................36
7.3.2 Benthic Line of Evidence .........................................................................................37
7.3.3 Quality Control of Chemistry and Benthic Lines of Evidence Data Assessment .39
7.4 Fish Tissue ......................................................................................................................40
7.5 Analyte Lists, Analytical Methods, and Reporting Limits ...........................................40
7.6 Laboratory Turn Around Times ....................................................................................41
8 QUALITY OBJECTIVES AND CRITERIA (ELEMENT A7) .............................................. 42
8.1 Field Measurements .......................................................................................................42
8.2 Laboratory Analyses .......................................................................................................42
9 SPECIAL TRAINING AND CERTIFICATIONS (ELEMENT A8) ...................................... 44
10 DOCUMENTATION AND RECORDS (ELEMENT A9) .................................................... 45
11 QUALITY CONTROL (ELEMENT B05) ............................................................................. 46
11.1 Field Quality Assurance/Quality Control Samples.......................................................46
11.2 Laboratory Quality Assurance/Quality Control ...........................................................46
11.2.1 Laboratory Quality Control Definitions .................................................................46
12 INSTRUMENT/EQUIPMENT TESTING, INSPECTION, AND MAINTENANCE
(ELEMENT B06) .................................................................................................................. 47
12.1 Field Instruments/Equipment .......................................................................................47
12.2 Laboratory Instruments/Equipment..............................................................................47
13 INSTRUMENT/EQUIPMENT CALIBRATION AND FREQUENCY (ELEMENT B07) .... 49
13.1 Field Equipment .............................................................................................................49
13.2 Analytical Laboratory Equipment .................................................................................49
14 INSPECTION/ACCEPTANCE OF SUPPLIES AND CONSUMABLES (ELEMENT B08).. 51
14.1 Field ................................................................................................................................51
14.2 Analytical Laboratories ..................................................................................................51
15 NON-DIRECT MEASUREMENTS (ELEMENT B09) ......................................................... 52
16 DATA MANAGEMENT (ELEMENT B10) .......................................................................... 53
16.1 Overview of Data Management Process .......................................................................53
Table of Contents
Coordinated Compliance, Monitoring, and Reporting Plan June 2013 Greater Los Angeles and Long Beach Harbor Waters Page vii
16.2 Field Records ..................................................................................................................53
16.2.1 Water.........................................................................................................................54
16.2.2 Sediment ...................................................................................................................55
16.2.3 Fish Tissue .................................................................................................................55
16.3 Field Data Option 1: Custom Field Application ...........................................................55
16.4 Field Data Option 2: Field Collection Logs ...................................................................56
16.5 Field Electronic Data Deliverable Requirements .........................................................56
16.6 Laboratory Record Requirements .................................................................................56
16.7 Laboratory Electronic Deliverable Requirements ........................................................58
17 ASSESSMENT AND RESPONSE ACTIONS (ELEMENT C1) ............................................ 59
17.1 Assessments and Response Actions ...............................................................................59
17.2 Corrective Actions .........................................................................................................59
17.2.1 Field Activities ..........................................................................................................59
17.2.2 Laboratory .................................................................................................................60
18 REPORTS TO MANAGEMENT (ELEMENT C2) ............................................................... 61
19 DATA REVIEW, VERIFICATION, AND VALIDATION (ELEMENT D1) ....................... 62
20 VERIFICATION AND VALIDATION METHODS (ELEMENT D2) ................................. 63
21 RECONCILIATION WITH USER REQUIREMENTS (ELEMENT D3) ............................. 65
22 SEDIMENT QUALITY OBJECTIVES PART 1 – STRESSOR INVESTIGATIONS ............ 66
23 REFERENCES ...................................................................................................................... 68
List of Tables
Table A SWAMP QAPP Elements and Corresponding CCMRP Sections
Table ES-1 Station Locations
Table 1 Sediment Quality 303(d) Listings for Harbor Waters
Table 2 Final, Mass-Based TMDLs and Allocations for Metals, PAHs, DDT, and PCBs
Table 3 Final Concentration-Based Sediment WLAs for Metals in Consolidated Slip
and Fish Harbor
Table 4 10-Year Recurring Schedule
Table 5 Deliverables Schedule
Table of Contents
Coordinated Compliance, Monitoring, and Reporting Plan June 2013 Greater Los Angeles and Long Beach Harbor Waters Page viii
Table 6 Station Locations
Table 7 Collection of Data Parameters by Station
Table 8 Sample Nomenclature
Table 9 Informational vs. Critical Data
Table 10 Field Standard Operating Procedures
Table 11 Sampling Methods and Processing
Table 12 Sample Containers and Holding Conditions
Table 13 Equipment and Support Facilities Needed
Table 14 Field Measurement SOPs
Table 15 Field Instruments
Table 16 Parameters to be Monitored and Corresponding Analytical Methods
Table 17 Water Parameters, Analytical Methods, and RLs
Table 18 Sediment Parameters, Analytical Methods, and RLs
Table 19 Fish Tissue Parameters, Analytical Methods, and RLs
Table 20 Turnaround Times for Laboratory Analyses
Table 21 DQOs for Field Measurements
Table 22 Laboratory and Reporting Data Quality Objectives
Table 23 DQOs for Sediment Toxicity and Benthic Infauna Analyses
Table 24 Specialized Personnel Training or Certification
Table 25 Frequencies and Performance Criteria for Field Quality Assurance/Quality
Control Sampling
Table 26 Frequencies and Performance Criteria for Laboratory Quality
Assurance/Quality Control Samples
Table 27 Laboratory Quality Assurance/Quality Control Definitions
Table 28 Testing, Inspection, Maintenance of Sampling Equipment, and Analytical
Instruments
Table 29 Instrument/Equipment Calibration and Frequency
Table 30 Recommended Further Actions for Each of the Sediment Quality Categories
List of Figures
Figure ES-1 TMDL Compliance Water and Sediment Monitoring Sample Locations
Figure ES-2 TMDL Compliance Fish Tissue Monitoring Sample Locations
Figure 1 Organizational Chart
Table of Contents
Coordinated Compliance, Monitoring, and Reporting Plan June 2013 Greater Los Angeles and Long Beach Harbor Waters Page ix
Figure 2 TMDL Compliance Water and Sediment Monitoring Sample Locations
Figure 3 TMDL Compliance Fish Tissue Monitoring Sample Locations
Figure 4 Water and Sediment Sample Nomenclature
Figure 5 Tissue Sample Nomenclature
Figure 6 Field Duplicate Sample Nomenclature
Figure 7 Field Blank/Equipment Blank Sample Nomenclature
Figure 8 Data Flow Diagram
List of Appendices
Appendix A Standard Operating Procedures
Appendix B Field EDD File Specifications
Appendix C Laboratory Data EDD File Specifications
Coordinated Compliance, Monitoring, and Reporting Plan June 2013 Greater Los Angeles and Long Beach Harbor Waters Page x
LIST OF ACRONYMS AND ABBREVIATIONS
ADR Automated Data Review
Bight Program Southern California Bight Regional Monitoring Program
BRI Benthic Response Index
CA LRM California Logistic Regression Model
CCMRP Coordinated Compliance, Monitoring, and Reporting Plan
CDFW California Department of Fish and Wildlife
cm centimeter
COC chain-of-custody
CSI Chemical Score Index
CTR California Toxics Rule
CWA Clean Water Act
DGPS Differential Global Positioning System
DO dissolved oxygen
DQO Data Quality Objectives
eCOC electronic chain-of-custody
EDD Electronic Data Deliverable
EDL estimated detection limit
ELAP Environmental Laboratory Accreditation Program
FCEC Fish Contamination Education Collaborative
FGC Fish and Game Commission
Greater Harbor Waters Greater Los Angeles and Long Beach Harbor Waters (including
Consolidated Slip)
Harbor Toxics TMDL Total Maximum Daily Load for Toxic Pollutants in Dominguez
Channel and Greater Los Angeles and Long Beach Harbor
Waters
HDPE high density polyethylene
IBI Index of Biotic Integrity
IDL Interactive Data Language
List of Acronyms and Abbreviations
Coordinated Compliance, Monitoring, and Reporting Plan June 2013 Greater Los Angeles and Long Beach Harbor Waters Page xi
ITP Incidental Take Permit
LA load allocation
LOD limit of detection
LOE lines of evidence
MBC MBC Applied Environmental Sciences
MDL method detection limit
MEC MEC Analytical
MLLW mean lower low water
MLOE multiple lines of evidence
mm millimeter
MPSL-DFG Marine Pollution Studies Laboratory – Department of Fish and
Game
MRL method reporting limit
MS4 Municipal Separate Storm Sewer Systems
NAD83 North American Datum 1983
NLAP National Environmental Laboratory Accreditation Program
NOAA National Oceanic and Atmospheric Administration
NPDES National Pollutant Discharge Elimination System
OEHHA Office of Environmental Health Hazard Assessment
Order Waste Discharge Requirements for Municipal Separate Storm
Sewer Systems Discharges within the Coastal Watersheds of Los
Angeles County, Except Those Discharges Originating from the
City of Long Beach MS4
PAH polycyclic aromatic hydrocarbon
PCB polychlorinated biphenyl
PQAPP Programmatic Quality Assurance Project Plan
PTFE polytetrafluoroethylene
QA quality assurance
QAPP Quality Assurance Project Plan
List of Acronyms and Abbreviations
Coordinated Compliance, Monitoring, and Reporting Plan June 2013 Greater Los Angeles and Long Beach Harbor Waters Page xii
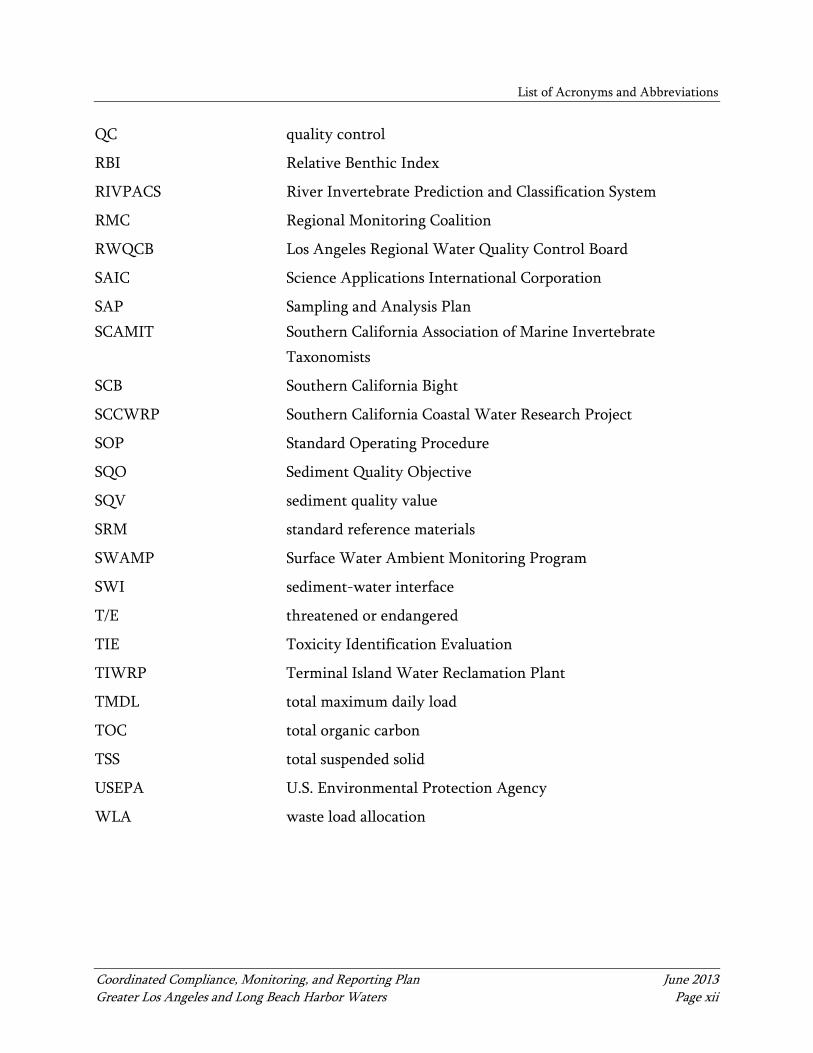
QC quality control
RBI Relative Benthic Index
RIVPACS River Invertebrate Prediction and Classification System
RMC Regional Monitoring Coalition
RWQCB Los Angeles Regional Water Quality Control Board
SAIC Science Applications International Corporation
SAP Sampling and Analysis Plan
SCAMIT Southern California Association of Marine Invertebrate
Taxonomists
SCB Southern California Bight
SCCWRP Southern California Coastal Water Research Project
SOP Standard Operating Procedure
SQO Sediment Quality Objective
SQV sediment quality value
SRM standard reference materials
SWAMP Surface Water Ambient Monitoring Program
SWI sediment-water interface
T/E threatened or endangered
TIE Toxicity Identification Evaluation
TIWRP Terminal Island Water Reclamation Plant
TMDL total maximum daily load
TOC total organic carbon
TSS total suspended solid
USEPA U.S. Environmental Protection Agency
WLA waste load allocation
Coordinated Compliance, Monitoring, and Reporting Plan June 2013 Greater Los Angeles and Long Beach Harbor Waters Page xiii
FORWARD/DOCUMENT ORGANIZATION
The Coordinated Compliance, Monitoring, and Reporting Plan (CCMRP) is developed to be
consistent with other California state and regional monitoring programs, as well as other
plans developed to support the Total Maximum Daily Load for Toxic Pollutants in
Dominguez Channel and Greater Los Angeles and Long Beach Harbor Waters (Harbor Toxics
TMDL). These programs, including California’s Surface Water Ambient Monitoring
Program (SWAMP), California’s Sediment Quality Objectives (SQO), and the Southern
California Bight Regional Monitoring Program (Bight Program), as well as a supplemental
Programmatic Quality Assurance Project Plan (PQAPP), are described in greater detail
below, and provide the foundation for work to be undertaken as part of this CCMRP.
Surface Water Ambient Monitoring Program
SWAMP is a coordinated, statewide umbrella program that integrates water quality
monitoring performed under the State Water Regional Control Board and Regional Water
Quality Control Boards, as well as other agencies, dischargers, and private groups. SWAMP
provides a consistent approach to sampling, data analysis, quality assurance, and data
management. Detailed methods and procedures outlined by SWAMP promote statewide
data comparability and will be widely utilized in monitoring conducted for the Harbor
Toxics TMDL program.
Sediment Quality Objectives Program
The SQO program provides guidance for the application of the Water Quality Control Plan
for Enclosed Bays and Estuaries – Part I Sediment Quality (SWRCB 2009). SQOs have been
developed for contaminants of concern in bays and estuaries in California based on an
approach that incorporates multiple lines of evidence (MLOE; Bay et al. 2009). These MLOE
include sediment chemistry, sediment toxicity, and benthic community composition.
Further information is provided below. This CCMRP calls for the use of the SQO program to
aid implementation of the Harbor Toxics TMDL program.
Forward/Document Organization
Coordinated Compliance, Monitoring, and Reporting Plan June 2013 Greater Los Angeles and Long Beach Harbor Waters Page xiv
Sediment Chemistry Line of Evidence
The chemistry line of evidence (LOE) requires chemical analysis of a suite of constituents.
Two indices are used to interpret the results: the California Logistic Regression Model (CA
LRM) and the Chemical Score Index (CSI). Results produced by these indices are
subsequently used to produce a single score representing the chemistry LOE.
Sediment Toxicity Line of Evidence
The toxicity LOE requires two toxicity tests: acute amphipod survival and a sub-lethal test
(i.e., bivalve embryo development). The results of each test are compared to classification
ranges (nontoxic, low toxicity, moderate toxicity, or high toxicity) and assigned a
corresponding score. The two test scores are integrated to produce a single score for the
toxicity LOE.
Benthic Community Line of Evidence
The benthic community LOE is comprised of enumerating and identifying organisms to
species level (when possible) and evaluating results based on four indices: the Index of Biotic
Integrity (IBI), the Relative Benthic Index (RBI), the Benthic Response Index (BRI), and the
River Invertebrate Prediction and Classification System (RIVPACS). The four indices are
weighted together to provide an overall score for the benthic community LOE.
Integration of Multiple Lines of Evidence
First, integration of MLOEs aids in determining two broad effects categories. The chemistry
and toxicity LOEs are evaluated together to determine the potential for chemically-mediated
effects; likewise, the toxicity and benthic community LOEs are combined to determine the
severity of biological effects. Finally, integration of the two effects categories results in an
overall station assessment in which the station is placed into one of six impact categories
(unimpacted, likely unimpacted, possibly impacted, likely impacted, clearly impacted, or
inconclusive).

Forward/Document Organization
Coordinated Compliance, Monitoring, and Reporting Plan June 2013 Greater Los Angeles and Long Beach Harbor Waters Page xv
Southern California Bight Regional Monitoring Program
The Southern California Bight (SCB) is the approximate 400 miles of coastline from Point
Conception in Santa Barbara County to Cabo Colnett in Ensenada, Mexico. The Southern
California Coastal Water Research Project (SCCWRP) coordinates an extensive monitoring
program within the SCB approximately every 5 years. The Bight program began in 1994 and
data gathered during monitoring events has allowed for long-term tracking of benthic
communities, fisheries, water quality, sediment chemistry and toxicity, and the general
health of the SCB over time. This complex program incorporates multiple agencies and
organizations, and, as such, a series of guidance documents for field data collection,
laboratory analyses, quality assurance, and data management have been created for each
monitoring event. The most recent monitoring event occurred in 2008, and associated
guidance is referenced and utilized in this CCMRP.
Programmatic Quality Assurance Project Plan
A PQAPP (Anchor QEA 2013) was developed to ensure high quality data collection as part
of compliance monitoring and special studies required by and in support of the Harbor
Toxics TMDL. The PQAPP includes the following key elements that focus on analytical
methods and data generated during a project:
Program management
Field sampling data quality objectives
Laboratory data quality objectives
Data review, verification, and validation
Coordinated Compliance, Monitoring, and Reporting Plan
The PQAPP was not intended to adhere to all recommended elements of the SWAMP QAPP
guidance document. This document, the CCMRP, and any other Sampling and Analysis
Plans developed to support Harbor Toxics TMDL-related studies, incorporates all relevant
PQAPP elements (e.g., presented in italicized text throughout this document) in addition to
supplemental information specific to each study in order to develop a single, all-inclusive,
monitoring plan compatible with SWAMP QAPP requirements.
Forward/Document Organization
Coordinated Compliance, Monitoring, and Reporting Plan June 2013 Greater Los Angeles and Long Beach Harbor Waters Page xvi
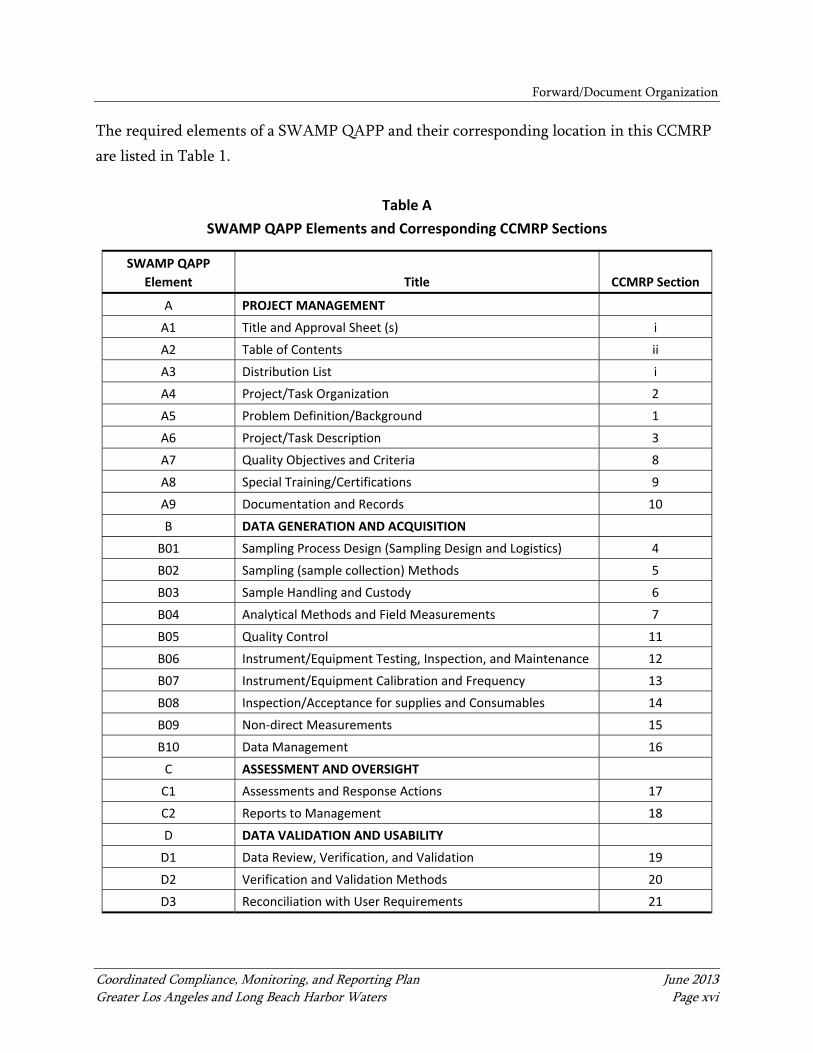
The required elements of a SWAMP QAPP and their corresponding location in this CCMRP
are listed in Table 1.
Table A
SWAMP QAPP Elements and Corresponding CCMRP Sections
SWAMP QAPP
Element Title CCMRP Section
A PROJECT MANAGEMENT
A1 Title and Approval Sheet (s) i
A2 Table of Contents ii
A3 Distribution List i
A4 Project/Task Organization 2
A5 Problem Definition/Background 1
A6 Project/Task Description 3
A7 Quality Objectives and Criteria 8
A8 Special Training/Certifications 9
A9 Documentation and Records 10
B DATA GENERATION AND ACQUISITION
B01 Sampling Process Design (Sampling Design and Logistics) 4
B02 Sampling (sample collection) Methods 5
B03 Sample Handling and Custody 6
B04 Analytical Methods and Field Measurements 7
B05 Quality Control 11
B06 Instrument/Equipment Testing, Inspection, and Maintenance 12
B07 Instrument/Equipment Calibration and Frequency 13
B08 Inspection/Acceptance for supplies and Consumables 14
B09 Non‐direct Measurements 15
B10 Data Management 16
C ASSESSMENT AND OVERSIGHT
C1 Assessments and Response Actions 17
C2 Reports to Management 18
D DATA VALIDATION AND USABILITY
D1 Data Review, Verification, and Validation 19
D2 Verification and Validation Methods 20
D3 Reconciliation with User Requirements 21
Coordinated Compliance, Monitoring, and Reporting Plan June 2013 Greater Los Angeles and Long Beach Harbor Waters Page ES-1
EXECUTIVE SUMMARY
On March 23, 2012, the Total Maximum Daily Load for Toxic Pollutants in Dominguez
Channel and Greater Los Angeles and Long Beach Harbor Waters (Harbor Toxics TMDL)
became effective and was promulgated to protect and restore fish tissue, water, and sediment
quality in Dominguez Channel and Greater Los Angeles and Long Beach Harbor Waters
(including Consolidated Slip; Greater Harbor Waters) by remediating contaminated sediment
and controlling the sediment loading and accumulation of contaminated sediment in the
harbor.
Each named responsible party is required to conduct compliance monitoring activities;
however, the Harbor Toxics TMDL encourages collaboration and coordination of monitoring
efforts. This document is the Coordinated Compliance, Monitoring, and Reporting Plan
(CCMRP) for the Greater Harbor Waters. Because the Greater Los Angeles and Long Beach
Harbor Responsible Parties recommend a coordinated monitoring effort, all monitoring
efforts are proposed to be located in receiving waters at a point that suitably represents the
combined discharge of cooperating parties.
Compliance Monitoring Program
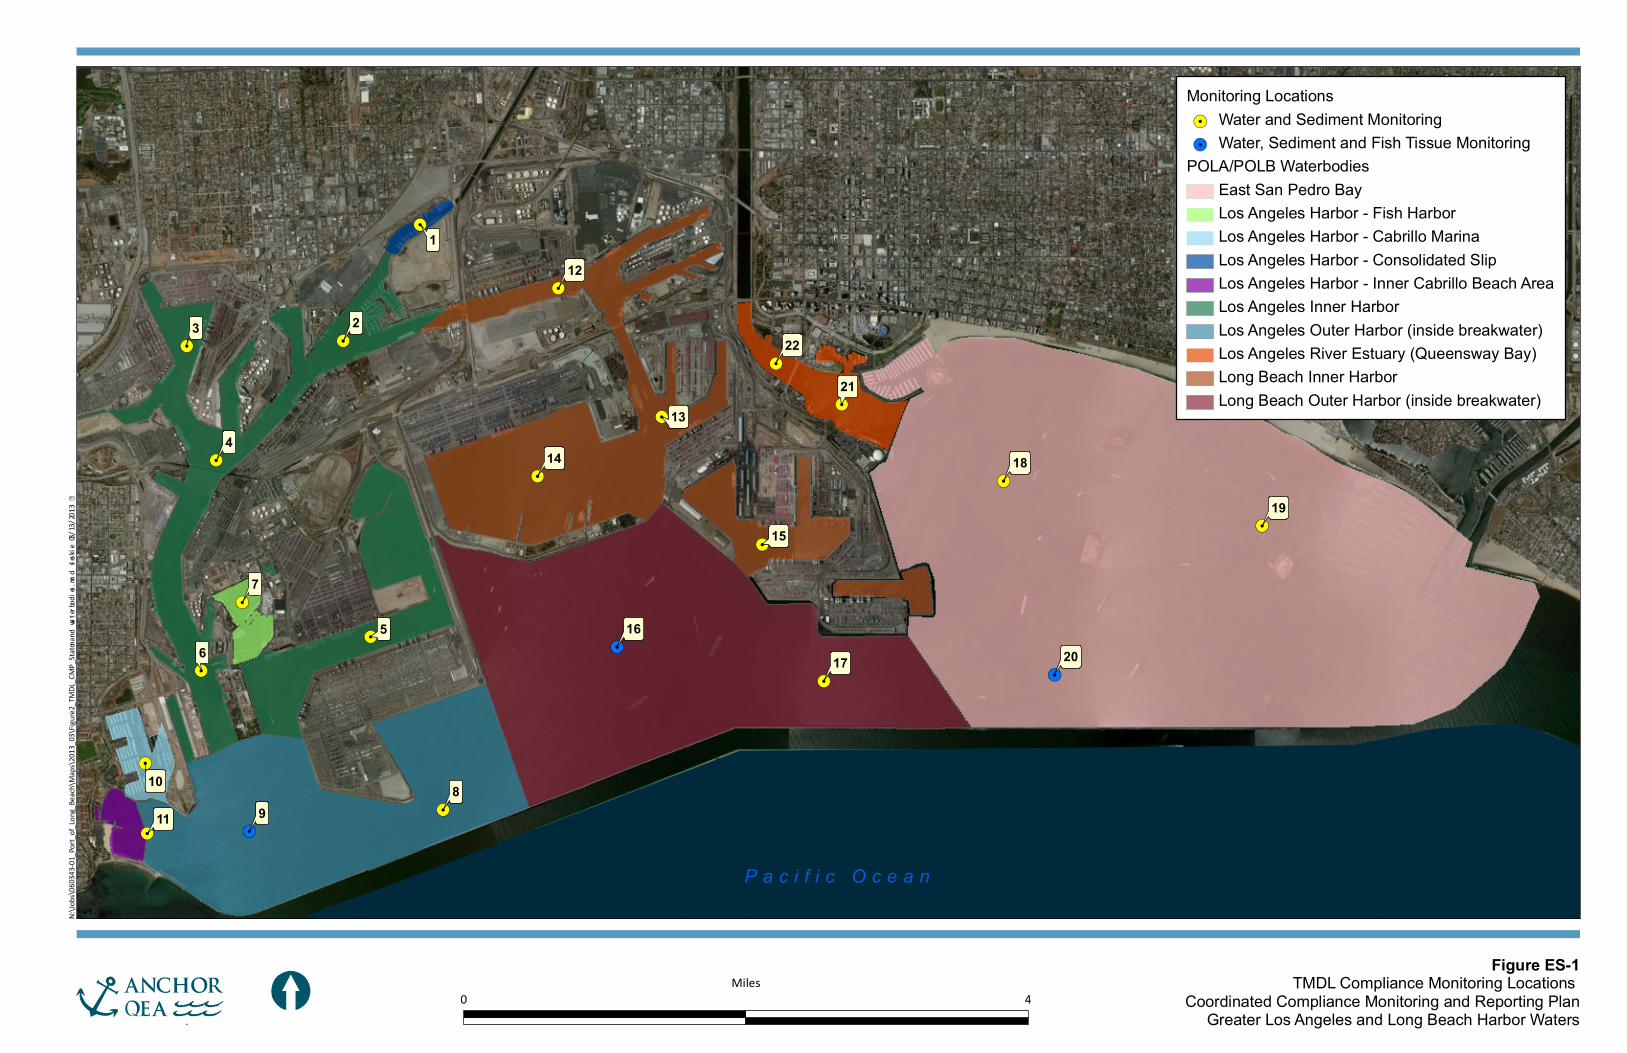
The monitoring program consists of the collection of water and sediment samples at a total of
22 stations (Table ES-1; Figure ES-1) and the collection of fish tissue samples within four
waterbodies (Table ES-1; Figure ES-2). To maintain consistency and to take advantage of
coordinated sampling efforts with other regional monitoring programs, sample collection
methods will adhere to Bight or Surface Water Ambient Monitoring Program (SWAMP)
monitoring protocols (BCEC 2008; and CDFG 2001).

Executive Summary
Coordinated Compliance, Monitoring, and Reporting Plan June 2013 Greater Los Angeles and Long Beach Harbor Waters Page ES-2
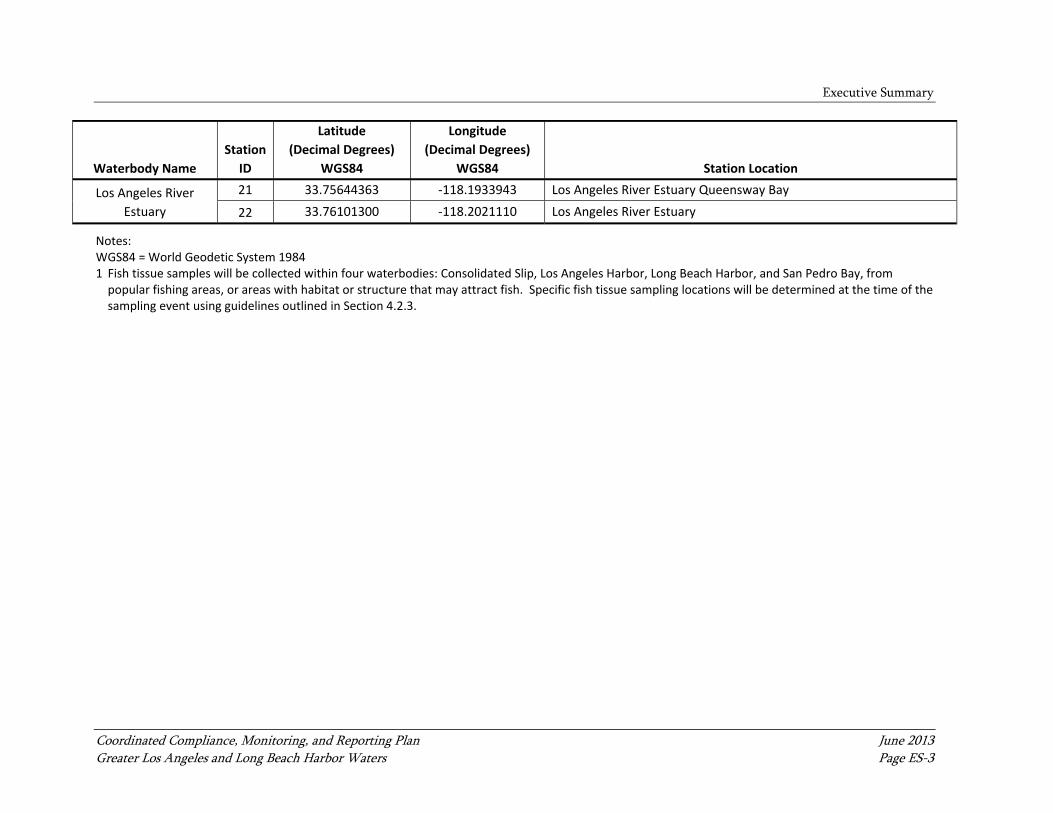
Table ES‐1
Station Locations
Waterbody Name
Station
ID
Latitude
(Decimal Degrees)
WGS84
Longitude
(Decimal Degrees)
WGS84 Station Location
Consolidated Slip1 1 33.77484789 ‐118.2453739 Center of Consolidated Slip
Los Angeles Inner
Harbor
2 33.76489964 ‐118.2520890 East Turning Basin
3 33.76228823 ‐118.2740995 Center of the Port of Los Angeles West Basin
4 33.75184257 ‐118.2709906 Main Turning Basin north of Vincent Thomas Bridge
5 33.73244349 ‐118.2513428 Between Pier 300 and Pier 400
6 33.72572842 ‐118.2714880 Main Channel south of Port O'Call
Fish Harbor 7 33.73580102 ‐118.2672600 Center of inner portion of Fish Harbor
Los Angeles Outer
Harbor1
8 33.71466100 ‐118.2423894 Los Angeles Outer Harbor between Pier 400 and middle breakwater
9 33.71204959 ‐118.2634051 Los Angeles Outer Harbor between the southern end of the
reservation point and the San Pedro breakwater
Cabrillo Marina 10 33.71938642 ‐118.2790736 Center of West Channel
Inner Cabrillo Beach 11 33.71180088 ‐118.2810632 Center of Inner Cabrillo Beach
Long Beach Inner
Harbor
12 33.76726235 ‐118.2335604 Cerritos Channel between the Heim Bridge and the Turning Basin
13 33.75383222 ‐118.2163996 Back Channel between Turning Basin and West Basin
14 33.74898245 ‐118.2308246 Center of West Basin
15 33.74214303 ‐118.1994876 Center of Southeast Basin
Long Beach Outer
Harbor1
16 33.73144867 ‐118.2210007 Center of Long Beach Outer Harbor
17 33.72759372 ‐118.1860575 Between the southern end of Pier J and the Queens Gate
San Pedro Bay1
18 33.75383222 ‐118.1813321 Northwest of San Pedro Bay near Los Angeles River Estuary
19 33.73667149 ‐118.1315908 East of San Pedro Bay
20 33.72547972 ‐118.1573319 South of San Pedro Bay inside breakwater
Executive Summary
Coordinated Compliance, Monitoring, and Reporting Plan June 2013 Greater Los Angeles and Long Beach Harbor Waters Page ES-3
Waterbody Name
Station
ID
Latitude
(Decimal Degrees)
WGS84
Longitude
(Decimal Degrees)
WGS84 Station Location
Los Angeles River
Estuary
21 33.75644363 ‐118.1933943 Los Angeles River Estuary Queensway Bay
22 33.76101300 ‐118.2021110 Los Angeles River Estuary
Notes: WGS84 = World Geodetic System 1984 1 Fish tissue samples will be collected within four waterbodies: Consolidated Slip, Los Angeles Harbor, Long Beach Harbor, and San Pedro Bay, from popular fishing areas, or areas with habitat or structure that may attract fish. Specific fish tissue sampling locations will be determined at the time of the sampling event using guidelines outlined in Section 4.2.3.
!.
!.!.
!.
!.
!.
!.
!.
!.
!.
!.
!.
!.
!.
!.
!.
!.
!.
!.
!.
!.
!.
98
7
65
4
3 2
1
22
21
20
19
18
17
16
15
14
13
12
11
10
N:\Job
s\0603
43-01_
Port_o
f_Lon
g_Beac
h\Maps
\2013_
03\Fig
ure2_T
MDL_C
MP_St
atona
nd wat
erbod
ies.mx
d sles
kie 03
/13/20
13
0 4Miles[
Monitoring Locations!. Water and Sediment Monitoring!. Water, Sediment and Fish Tissue Monitoring
POLA/POLB WaterbodiesEast San Pedro BayLos Angeles Harbor - Fish HarborLos Angeles Harbor - Cabrillo MarinaLos Angeles Harbor - Consolidated SlipLos Angeles Harbor - Inner Cabrillo Beach AreaLos Angeles Inner HarborLos Angeles Outer Harbor (inside breakwater)Los Angeles River Estuary (Queensway Bay)Long Beach Inner HarborLong Beach Outer Harbor (inside breakwater)
Figure ES-1TMDL Compliance Monitoring Locations
Coordinated Compliance Monitoring and Reporting PlanGreater Los Angeles and Long Beach Harbor Waters
P a c i f i c O c e a n

Figure ES-2Proposed Fish Tissue Compliance Monitoring LocationsCoordinated Compliance Monitoring and Reporting Plan
Greater Los Angeles and Long Beach Harbor Waters0 2 4
Miles
norca
l1:\gi
s\Job
s\120
711-0
.011_
Port_
of_Lo
s_An
geles
\POL
A-PO
LB_B
ioacc
umula
iton_
Mode
ling_
Supp
ort\M
aps\F
ig_ES
-2Prop
osed
FishT
issue
Comp
lianc
eMon
itorin
gLoc
ation
s\ 05
2920
13_S
JL
POLA/POLB WaterbodiesEast San Pedro BayLos Angeles Harbor - Fish HarborLos Angeles Harbor - Cabrillo MarinaLos Angeles Harbor - Consolidated SlipLos Angeles Harbor - Inner Cabrillo Beach AreaLos Angeles Inner HarborLos Angeles Outer Harbor (inside breakwater)Los Angeles River Estuary (Queensway Bay)Long Beach Inner HarborLong Beach Outer Harbor (inside breakwater)Proposed Compliance Monitoring Location
Cabrillo Pier
Pier J
POLB Shallow Water Habitat
P a c i f i c O c e a n
Consolidated Slip
[
Executive Summary
Coordinated Compliance, Monitoring, and Reporting Plan June 2013 Greater Los Angeles and Long Beach Harbor Waters Page ES-6
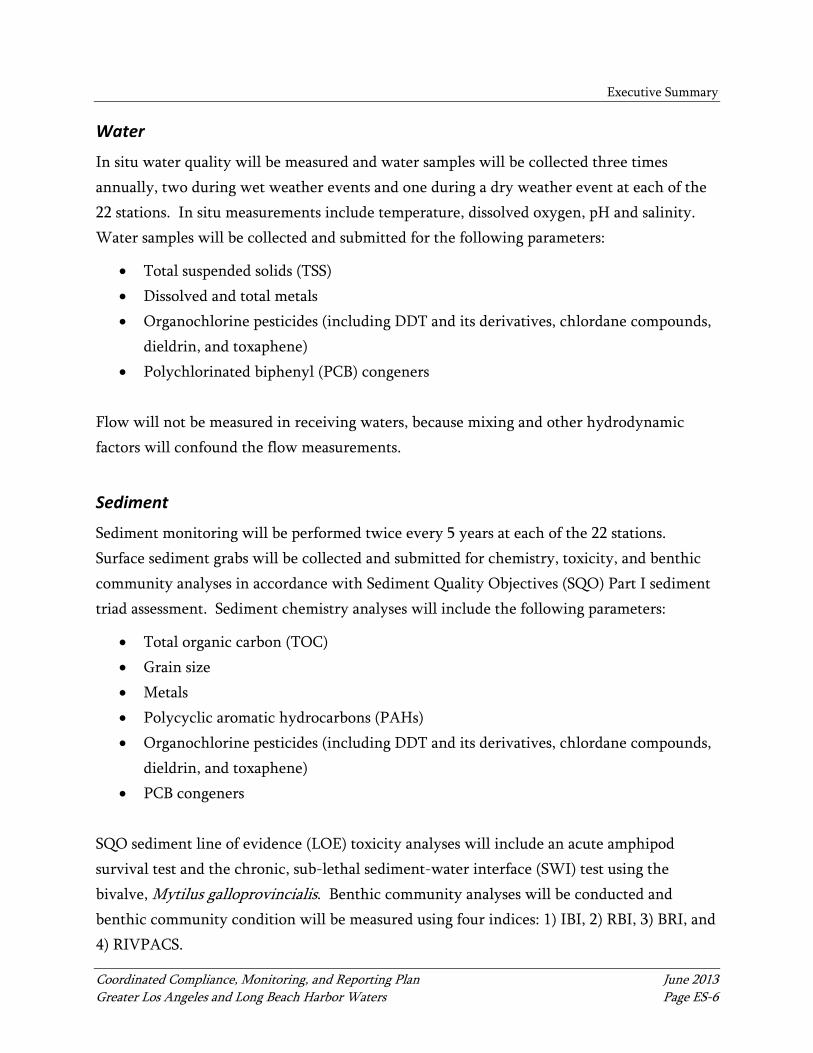
Water
In situ water quality will be measured and water samples will be collected three times
annually, two during wet weather events and one during a dry weather event at each of the
22 stations. In situ measurements include temperature, dissolved oxygen, pH and salinity.
Water samples will be collected and submitted for the following parameters:
Total suspended solids (TSS)
Dissolved and total metals
Organochlorine pesticides (including DDT and its derivatives, chlordane compounds,
dieldrin, and toxaphene)
Polychlorinated biphenyl (PCB) congeners
Flow will not be measured in receiving waters, because mixing and other hydrodynamic
factors will confound the flow measurements.
Sediment
Sediment monitoring will be performed twice every 5 years at each of the 22 stations.
Surface sediment grabs will be collected and submitted for chemistry, toxicity, and benthic
community analyses in accordance with Sediment Quality Objectives (SQO) Part I sediment
triad assessment. Sediment chemistry analyses will include the following parameters:
Total organic carbon (TOC)
Grain size
Metals
Polycyclic aromatic hydrocarbons (PAHs)
Organochlorine pesticides (including DDT and its derivatives, chlordane compounds,
dieldrin, and toxaphene)
PCB congeners
SQO sediment line of evidence (LOE) toxicity analyses will include an acute amphipod
survival test and the chronic, sub-lethal sediment-water interface (SWI) test using the
bivalve, Mytilus galloprovincialis. Benthic community analyses will be conducted and
benthic community condition will be measured using four indices: 1) IBI, 2) RBI, 3) BRI, and
4) RIVPACS.
Executive Summary
Coordinated Compliance, Monitoring, and Reporting Plan June 2013 Greater Los Angeles and Long Beach Harbor Waters Page ES-7
Tissue
Fish tissue samples will be collected once every 2 years at only four stations: one in
Consolidated Slip, one each in Los Angeles Outer Harbor and Long Beach Outer Harbor
Outer Los Angeles and Long Beach Harbors, and one in (eastern) San Pedro Bay. Composite
samples of three fish species (white croaker [Genyonemus lineatus], California halibut
[Paralichthys californicus], and shiner surfperch [Cymatogaster aggregate]) will be collected
at all stations, with the exception of Consolidated Slip; only white croaker will be collected
at this station. Fish tissue samples will be submitted for the following parameters:
Percent lipids
Organochlorine pesticides (including DDT and its derivatives, chlordane compounds,
dieldrin, and toxaphene)
PCB congeners
Coordinated Compliance, Monitoring, and Reporting Plan June 2013 Greater Los Angeles and Long Beach Harbor Waters Page 1
1 PROBLEM DEFINITION AND BACKGROUND (ELEMENT A5)
1.1 Introduction
The Total Maximum Daily Load for Toxic Pollutants in Dominguez Channel and Greater Los
Angeles and Long Beach Harbor Waters (Harbor Toxics TMDL) became effective on March
23, 2012. The requirements of the Harbor Toxics TMDL are specified in Attachment A to
Resolution No. R11-008, Amendment to the Water Quality Control Plan – Los Angeles
Region. The Harbor Toxics TMDL was promulgated to protect and restore fish tissue, water
and sediment quality in Dominguez Channel and Greater Los Angeles and Long Beach
Harbor Waters (including Consolidated Slip; Greater Harbor Waters).
1.2 Background
Section 303 (d)(1)(A) of the Clean Water Act (CWA) requires states to identify waterbodies
within its boundaries for which effluent limitations are not stringent enough to implement
water quality standards applicable to those waters. This list of impaired waterbodies is
commonly referred to as the Section 303(d) list. Subsequently, in accordance with Section
303 (d)(1)(C), states are required to develop a total maximum daily load (TMDL) for
pollutants not meeting the effluent limitations and at a level necessary to implement the
established water quality standards. A TMDL represents the maximum amount of a pollutant
a waterbody can receive and still meet water quality standards.
The 2010 California 303(d) List of Water Quality Limited Segments identified Los Angeles
Harbor—including Inner Cabrillo Beach, Cabrillo Marina, Consolidated Slip, Fish Harbor,
Inner Harbor, Outer Harbor, San Pedro Bay, and Los Angeles River Estuary—as water
segments where standards are not met and a TMDL is required. One or more pollutants or
endpoints for each waterbody were listed as the cause of impairment for these waterbodies
that comprise the Greater Harbor Waters (Table 1).
1.3 Harbor Toxics Total Maximum Daily Load
To protect marine life and minimize human health risks due to the consumption of fish, the
Harbor Toxics TMDL includes annual contaminant limits in surface sediment, stormwater
effluent, and fish tissues in the Greater Harbor Waters. These limits are defined as target
Problem Definition and Background (Element A5)
Coordinated Compliance, Monitoring, and Reporting Plan June 2013 Greater Los Angeles and Long Beach Harbor Waters Page 2
loads or concentrations for compliance with the Harbor Toxics TMDL. The intent of a
TMDL is to: 1) determine the quantity of contaminants a system can assimilate while
protecting water quality; 2) determine all inputs of contaminants to the system and linkages
of inputs to impairments; and 3) allocate reductions to each source to bring the waterbody
into compliance with established criteria for the protection of beneficial uses related to water
quality.
1.3.1 Numeric Targets
Applicable water quality objectives for the Harbor Toxics TMDL are narrative objectives for
chemical constituents, bioaccumulation, and toxicity in the Basin Plan and the numeric
water quality criteria promulgated in 40 CFR section 131.38 (the California Toxics Rule
[CTR]). In addition, sediment condition objectives were determined using sediment quality
guidelines and the State Water Quality Control Plan for Enclosed Bays and Estuaries – Part 1
Sediment Quality (Sediment Quality Objectives [SQO] Part 1).
Water targets were determined by the Basin Plan and the CTR.
Sediment targets were determined by the narrative standards of the Basin Plan, the SQO, and
sediment quality guidelines recommend in Long et al. (1998) and MacDonald et al. (2000).
The Harbor Toxics TMDL anticipates that revisions to specific sediment quality targets may
be determined by development of site-specific sediment quality values (SQV).
Fish tissue targets were determined from Fish Contaminant Goals and Advisory Tissue Levels
for Common Contaminants in California Sport Fish: chlordane, DDTs, dieldrin,
methylmercury, polychlorinated biphenyls (PCBs), selenium, and toxaphene, developed by
Office of Environmental Health Hazard Assessment (OEHHA; 2008) to assist agencies in
developing fish tissue-based criteria for pollution mitigation or elimination and to protect
humans from consumption of contaminated fish.
1.4 Compliance Measures
The Harbor Toxics TMDL set waste load allocations (WLAs) in the Greater Harbor
waterbodies limit sediment bound pollutant loadings from upstream and on-land sources. In

Problem Definition and Background (Element A5)
Coordinated Compliance, Monitoring, and Reporting Plan June 2013 Greater Los Angeles and Long Beach Harbor Waters Page 3
addition, the Harbor Toxics TMDL set load allocations (LAs) in the Greater Harbor
waterbodies to limit concentrations in bedded sediments believed to impact marine benthos
(direct effects) and fish tissue (indirect effects). Mass based limits for chemical constituents
are provided in Table 2 and Table 3.
Water quality currently meets water quality objectives for beneficial use. However,
monitoring is required to confirm no degradation is occurring. Water column
concentrations will be compared to CTR values.
Compliance with sediments may be demonstrated via any one of three different means:
1. Final sediment allocations, as presented above, are met.
2. The qualitative sediment condition of Unimpacted or Likely Unimpacted via the
interpretation and integration of MLOE as defined in the SQO Part 1, is met, with the
exception of chromium, which is not included in the SQO Part 1.
3. Sediment numeric targets are met in bed sediments over a 3-year averaging period.
Compliance with the fish tissues may be demonstrated via any of four different means:
1. Fish tissue targets are met in species resident to the Harbor Toxics TMDL
waterbodies.
2. Final sediment allocations (based on sediment-fish tissue linkage in the Harbor
Toxics TMDL) are met.
3. Sediment numeric targets to protect fish tissue are met in bed sediment over a 3-year
averaging period.
4. SQO protective of fish tissue is achieved through the Statewide Enclosed Bays and
Estuaries Plan (the SQO for Indirect Effects is under development).
1.5 Reporting Requirements
The Harbor Toxics TMDL identifies specific reporting requirements for compliance. The
Coordinated Compliance, Monitoring, and Reporting Plan (CCMRP) will be provided to the
Los Angeles Regional Water Quality Control Board’s (RWQCB’s) Executive Officer for
approval within 20 months after the effective date of the Harbor Toxics TMDL. A data
summary report will be submitted to the RWQCB within 15 months after monitoring starts
Problem Definition and Background (Element A5)
Coordinated Compliance, Monitoring, and Reporting Plan June 2013 Greater Los Angeles and Long Beach Harbor Waters Page 4
and annually thereafter. The report will include data summaries with comparison to CTR
and sediment quality values. SQO analysis will be conducted and reported to characterize
the sediment condition.
1.6 Programmatic Quality Assurance Project Plan
The Programmatic Quality Assurance Project Plan (PQAPP; Anchor QEA 2013) was
developed to ensure high quality data collection as part of compliance monitoring and special
studies required by and in support of the Harbor Toxics TMDL. The PQAPP includes the
following key elements that focus on analytical methods and data generated during a project:
Program Management. This section identifies the specific roles and responsibilities of
data collectors and data managers and describes the process through which field and
analytical data will be processed, reduced, and stored in an EQuIS database by the
managing consultant.
Field Sampling Data Quality Objectives. This section includes detailed information
on field collection requirements including sample processing, sample handling,
sample identification, sample custody and shipping requirements, field quality control
(QC) sample requirements with associated performance criteria, field records, and
field electronic data deliverable (EDD) requirements.
Laboratory Data Quality Objectives. This section includes detailed information on
analytical methods, analyte lists and reporting limits, laboratory QC sample
requirements with associated performance criteria and corrective actions, laboratory
record requirements, and laboratory EDD requirements.
Data Review, Verification, and Validation. This section outlines the procedures used
to ensure the project data quality objectives are met.
The PQAPP was designed to be programmatic in nature and not targeted at one study, given
the plans for both compliance monitoring and a variety of other Harbor Toxics TMDL-
related sampling and analysis activities over the next 5 years. Consequently, while the
PQAPP complies with SWAMP protocols and is SWAMP compatible, it is not written in the
format of a SWAMP Quality Assurance Project Plan (QAPP). In addition, it does not include
all elements of SWAMP QAPP (SWRCB 2008) guidance. This format was not possible
because not all special studies have been designed or contractors determined. Instead, the
Problem Definition and Background (Element A5)
Coordinated Compliance, Monitoring, and Reporting Plan June 2013 Greater Los Angeles and Long Beach Harbor Waters Page 5
PQAPP states that elements of the SWAMP QAPP guidance document relating to project-
specific field collection requirements should be included in the CCMRP or any subsequent
Sampling and Analysis Plans (SAPs) developed to support Harbor Toxics TMDL-related
studies. The benefit of the programmatic approach outlined in the PQAPP is that there will
be a uniform data collection and management program for all Harbor Toxics TMDL-related
studies that provides high quality data and efficiencies due to standardization of sample
collection, nomenclature, analysis, data review/validation, processing, storage, management,
and seamless data export to the Regional Monitoring Coalition (RMC) and State databases,
regardless of study type or contractors performing the work.
This CCMRP has been designed accordingly to incorporate relevant PQAPP elements in
addition to supplemental information specific to the compliance monitoring program in
order to develop a single, all-inclusive, monitoring plan compatible with SWAMP QAPP
requirements.
1.7 Coordinated Compliance and Monitoring Reporting Plan
The Harbor Toxics TMDL requires monitoring activities by the responsible parties in three
waterbody areas:
1. Dominguez Channel, Torrance Lateral, and Dominguez Channel Estuary
2. Greater Los Angeles and Long Beach Harbor Waters (including Consolidated Slip)
3. Los Angeles River and San Gabriel River
The CCMRP outlines the monitoring activities to be conducted by the cooperating parties for
the Greater Harbor Waters. To be consistent with and potentially collaborate with other
regional monitoring programs, the sample collection methods prescribed within this CCMRP
are to be conducted in accordance with methods established for use during Bight or SWAMP
compatible programs. Compliance monitoring and reporting activities must also be
conducted in accordance with the PQAPP developed for the Harbor Waters Toxics TMDL to
ensure usability and provide benefit with other Harbor Waters Toxics TMDL related
programs and studies.
Problem Definition and Background (Element A5)
Coordinated Compliance, Monitoring, and Reporting Plan June 2013 Greater Los Angeles and Long Beach Harbor Waters Page 6
1.8 Objectives
The goal of this document is to develop an approach to Harbor Toxics TMDL required
compliance monitoring and reporting elements that will be approved by the RWQCB and
considers all aspects of sample collection and handling, analysis, data evaluation, validation
and management, quality assurance/quality control, and reporting.
This document fulfills the Harbor Toxics TMDL requirement for the development of a
Compliance Monitoring and Reporting Plan that incorporates all elements of SWAMP
compatible QAPPs.
1.9 Integration with Other Monitoring Programs
In 2012, the RWQCB adopted Order No. R4-2012-0175 (National Pollutant Discharge
Elimination System [NPDES] Permit No. CAS004001), Waste Discharge Requirements for
Municipal Separate Storm Sewer Systems (MS4) Discharges within the Coastal Watersheds of
Los Angeles County, Except Those Discharges Originating from the City of Long Beach MS4
(Order). The Order includes requirements that are consistent with and implement WLAs
and monitoring requirements that are assigned to discharges from the Los Angeles County
MS4 for established TMDLs. Each individual named Permittee of the Order is responsible
for discharges from the MS4 for which they are owners and/or operators. For comingled
discharges, compliance is determined from the group of Permittees. Individual Permittees
are responsible for the determination of compliance with effluent limits.
The provisions included within the Order allow for coordination of integrated monitoring
programs for the alignment and efficient implementation of monitoring requirements with
Harbor Toxics TMDL monitoring requirements. For example, the Order specifies that
receiving water monitoring will be conducted at Harbor Toxics TMDL compliance
monitoring stations. However, it should be emphasized that participation in the RMC for
the Greater Los Angeles and Long Beach Harbor Waters including Consolidated Slip does not
supersede the requirements of the Order, and each RMC responsible party is individually
responsible for ensuring requirements of the Order are met.
Coordinated Compliance, Monitoring, and Reporting Plan June 2013 Greater Los Angeles and Long Beach Harbor Waters Page 7
2 PROJECT TASK AND ORGANIZATION (ELEMENT A4)
2.1 Responsible Parties
The Harbor Toxics TMDL names the following responsible parties for the Greater Harbor
Waters:
Greater Harbor Waters MS4 Permittees
Caltrans
City of Bellflower
City of Lakewood
City of Long Beach
City of Los Angeles
City of Paramount
City of Signal Hill
City of Rolling Hills
City of Rolling Hills Estates
Rancho Palos Verdes
Los Angeles County
Los Angeles County Flood Control District
City of Long Beach (including the Port of Long Beach)
City of Los Angeles (including the Port Los Angeles)
California State Lands Commission
Individual and General Stormwater Permit Enrollees
Other Non-Stormwater Permittees, including City of Los Angeles’ Terminal Island
Water Reclamation Plant (TIWRP)
The Los Angeles River Estuary responsible parties subgroup includes the following entities:
Caltrans
City of Long Beach
City of Los Angeles
City of Signal Hill
Los Angeles County
Los Angeles County Flood Control District
Project Task and Organization (Element A4)
Coordinated Compliance, Monitoring, and Reporting Plan June 2013 Greater Los Angeles and Long Beach Harbor Waters Page 8
The Consolidated Slip responsible parties subgroup includes the following entities:
City of Los Angeles
Los Angeles County
Los Angeles County Flood Control District
The Harbor Toxics TMDL encourages collaboration and coordination of monitoring efforts
amongst the responsible parties to avoid duplication and reduce associated monitoring costs.
2.2 Roles and Responsibilities
The specific roles and responsibilities of project managers, data managers, and laboratory
project managers are shown on Figure 1. A list of names and responsible parties and their
respective roles will be provided to the RMC in letter format. The list will be updated as
necessary during the course of the project.
2.2.1 Project Managers
The RMC’s project managers will be responsible for project administration and will serve as
the lead contacts for Harbor Toxics TMDL compliance monitoring and related special
studies. The RMC project managers will also serve as the point of contact between the RMC
and the consulting team and will manage all project activities.
The managing consultant’s Harbor Toxics TMDL study project manager will be responsible
for:
Managing the overall Harbor Toxics TMDL program
Ensuring the project and the RMC’s objectives are met throughout the conduct of
project activities
Coordinating internal communications with the RMC, the RMC contractors,
managing consultant’s data manager and quality assurance (QA) manager
Overseeing all project deliverables
Performing the administrative tasks needed to ensure timely and successful
completion of the Harbor Toxics TMDL program studies
Resolution of project concerns or conflicts related to technical matters
Project Task and Organization (Element A4)
Coordinated Compliance, Monitoring, and Reporting Plan June 2013 Greater Los Angeles and Long Beach Harbor Waters Page 9
For each compliance monitoring event or special study, the RMC will select a contractor to
be the special study/monitoring study project manager. This project manager will be
identified in the SAP prepared prior to conducting the study. The monitoring/special study
project manager will be responsible for:
Providing oversight, overall special study project management, and progress reports
Communicating with the TMDL study project manager and the RMC
Organizing field staff
Coordinating with subcontract laboratories
Scheduling sampling days
Installing and maintaining field sampling equipment, sample handling and transport,
data transmittal in accordance with the PQAPP and CCMRP, and study reporting
2.2.2 Field Coordinator
For each compliance monitoring event or special study, a field coordinator will be identified
in the SAP prepared by the contractor awarded the work. The field coordinator for each
sampling program will be responsible for day-to-day technical and quality assurance and
quality control (QA/QC) oversight. The field coordinator will ensure that appropriate
protocols for sample collection, preservation, and holding times are observed, and will
submit environmental samples to selected laboratories for chemical and physical analyses.
The field coordinator will also be responsible for submitting the finalized field data to the
QA manager in a pre-determined format, as discussed in Section 16.1 of this CCMRP.
2.2.3 Laboratory Project Managers
The laboratory manager of any laboratory testing samples for the RMC will oversee all
laboratory operations associated with the receipt of the environmental samples, chemical and
physical analyses, and laboratory report preparation for this project. The laboratory manager
will review all laboratory reports and prepare case narratives describing any anomalies and
exceptions that occurred during analysis.
The analytical testing laboratories will be responsible for the following:
Delivering sample confirmation receipt notifications to the field coordinator and QA
manager (by submittal to the TMDL Study project manager)
Project Task and Organization (Element A4)
Coordinated Compliance, Monitoring, and Reporting Plan June 2013 Greater Los Angeles and Long Beach Harbor Waters Page 10
Performing the analytical methods described in this CCMRP
Following documentation, custody, and sample logbook procedures
Ensuring that personnel engaged in preparation and analysis tasks have appropriate,
documented training
Meeting all reporting and QA/QC requirements
Delivering electronic data files as specified in Section 16
Meeting turnaround times for deliverables
2.2.4 Data Managers
The managing consultant’s QA manager will provide QA oversight for field sampling and
laboratory programs associated with the Harbor Toxics TMDL study, ensuring that samples
are collected and documented appropriately, coordinating with selected analytical
laboratories, ensuring data quality, overseeing data validation, and supervising project QA
coordination.
The managing consultant will compile field observations and analytical data from
laboratories into a database, review the data for completeness and consistency, append the
database with qualifiers assigned by the data validator, and ensure that the data obtained is in
a format suitable for inclusion in the appropriate databases and delivery to various agencies.
The managing consultant’s designated data validator will be responsible for verifying and
validating all analytical data and submitting assigned data qualifiers to the database manager.
Coordinated Compliance, Monitoring, and Reporting Plan June 2013 Greater Los Angeles and Long Beach Harbor Waters Page 11
3 PROJECT TASK DESCRIPTION (ELEMENT A6)
3.1 Summary of Monitoring Plan
The project area is a dynamic system. First and foremost, the project area contains the
busiest container Port complex in the United States (Journal of Commerce 2012). The
project area is defined by numerous channels, slips, and marinas throughout the Inner
Harbors and relatively open water in the Outer Harbors. Three major rivers and drainage
channels, the Los Angeles River, Dominguez Channel, and San Gabriel River, discharge to
the project area. Storm events are infrequent, but during the winter month’s stormwater
discharges from surrounding watersheds are substantial. Therefore, natural variability, both
temporal and spatial, must be considered when designing and evaluating a monitoring
program. This monitoring program is appropriately designed to address these concerns by
conducting frequently recurring monitoring events during both summer and winter seasons
and at multiple stations throughout the project area.
The monitoring program consists of the collection of water, sediment, and tissue samples.
Water will be collected during multiple events, both dry and wet weather, annually.
Sediment samples will be collected every 2 to 3 years to assess sediment quality per SQO Part
1 (Bay et al. 2009). Fish tissue samples will be collected biennially.
3.2 Project Schedule
Compliance Monitoring and Reporting Plans will be submitted 20 months after the effective
date of the Harbor Toxics TMDL for RWQCB Executive Officer approval. Monitoring will
begin six months after the monitoring plan is approved by the Executive Officer and
continue annually until the Executive Officer has determined no additional monitoring is
necessary (i.e., compliance has been achieved) or an amended program is appropriate.
Annual monitoring reports will be submitted. A summary of the field schedule projected on
a 10-year recurring timeline is presented in Table 4. Adaptions will be made as necessary
through the course of the project.
Project Task Description (Element A6)
Coordinated Compliance, Monitoring, and Reporting Plan June 2013 Greater Los Angeles and Long Beach Harbor Waters Page 12
3.3 Deliverables
The PQAPP, along with this document, the CCMRP, are the first deliverables to the
RWQCB. Once approved and monitoring is initiated, monitoring reports will be submitted
to the RWQCB annually. The first report is due 15 months after monitoring begins, and
subsequent reports will be submitted annually thereafter. A schedule of reports due to the
RWQCB is presented in Table 5.
Annual monitoring reports will include a description of monitoring activities conducted for a
given year, a summary table of water, sediment, and tissue analytical results, a data validation
report, a summary of any deviations from the proposed sampling program, and associated
quality assurance/quality control issues, including any action/response activities. As
prescribed, the annual monitoring reports will provide a statement assessing whether or not
monitoring results indicate compliance or non-compliance with waste load and load
allocations.
Coordinated Compliance, Monitoring, and Reporting Plan June 2013 Greater Los Angeles and Long Beach Harbor Waters Page 13
4 SAMPLING PROCESS AND DESIGN (ELEMENT B01)
4.1 Station Locations
The station locations for water and sediment sample collections are presented on Figure 2. A
total of 22 stations are included in the compliance monitoring program. These stations are
consistent with the Harbor Toxics TMDL Basin Plan Amendment (RWQCB and USEPA
2011) monitoring requirements and descriptions. Because the Greater Los Angeles and Long
Beach Harbors Responsible Parties propose a coordinated monitoring effort, stations were
located in receiving waters at a point that suitably represents the combined discharge of
cooperating parties. Detailed station location information is presented in Table 6. Fish tissue
sample collections will take place within four waterbodies: Consolidated Slip, Los Angeles
Outer Harbor, Long Beach Outer Harbor, and (eastern) San Pedro Bay (Figure 3). Precise
station locations are not provided in this CCMRP. Instead, guidelines for station locations
within the four waterbodies are provided in Section 4.1.1, which will be used to identify
specific sampling locations prior to each sampling event.
In years when sampling for the sediment quality component of the compliance monitoring
program aligns with the Southern California Bight Regional Monitoring Program (Bight
Program), station locations may be modified in order to meet the Bight Program’s
requirement that station locations representing different strata (bay, port, marina, and
estuary) be selected randomly. Therefore, Bight Program stations that are located within the
same waterbody segment (e.g., turning basin, channel) as the Harbor Toxics TMDL-specified
station locations will be considered representative of the Harbor Toxics TMDL-specified
station location. If a Bight Program station is not located within the same waterbody
segment, then the Harbor Toxics TMDL-specified station location will be sampled.
Prior to each sediment sampling event, it is anticipated correspondence with the RWQCB
will be required to confirm the location of sediment sampling stations for two reasons:
1. The Bight Program randomly selects stations locations, and confirmation with the
RWQCB regarding whether a Bight Program station is representative of a Harbor
Toxics TMDL-specified station will be required.
Sampling Process and Design (Element B01)
Coordinated Compliance, Monitoring, and Reporting Plan June 2013 Greater Los Angeles and Long Beach Harbor Waters Page 14
2. In non-Bight Program years, sediment stations may be altered from the Harbor
Toxics TMDL-specified locations listed in Table 4 to address the need for
confirmation of Bight Program or other program SQO results.
4.1.1 Fish Tissue
In accordance with the requirements of the Harbor Toxics TMDL (RWQCB 2011), fish tissue
monitoring must be conducted in the following four waterbodies: Consolidated Slip, Port of
Angeles, Port of Long Beach, and (Eastern) San Pedro Bay (Figure 3). The proposed target
sampling areas were designed to address two concerns raised by stakeholders during the
public review period for this TMDL: 1) popular fishing areas for local anglers; and 2) known
contaminated sites. To address the stakeholder concerns about popular fishing areas three
proposed target sampling areas will be monitored: 1) Cabrillo Pier in Los Angeles Outer
Harbor; 2) Pier J in Eastern San Pedro Bay; and 3) Outer Long Beach Harbor shallow water
habitat. Cabrillo Pier and Pier J are well-known, popular fishing spots for local anglers,
according to the Fish Contamination Education Collaborative (FCEC), a regional educational
outreach program whose purpose is to protect vulnerable populations from the risks
associated with fish consumption (FCEC 2013). Due to its popularity, Cabrillo Pier was also
included in the 1992 regional seafood consumption study (SCCWRP and MBC 1994). There
are no public fishing piers in Outer Long Beach Harbor; however, the Outer Long Beach
Harbor shallow water habitat located east of Pier 400 is recommended for fish collection due
to the higher diversity and abundance of benthic organisms and fishes in this area, as
compared to those in the deep water habitat of the Outer Long Beach Harbor waterbody
(SAIC 2010). In addition, this area has been recommended by experienced anglers for the
collection of the target fish species listed in Section 5.3.1 (Kenny Nielson, personal
communication). To address the stakeholder concerns about known contaminated sites,
Consolidated Slip, specified as a target fish sampling location in the Harbor Toxics TMDL,
will be monitored.
This CCMRP does not specify exact locations (i.e., geographic coordinates) for fish collection
by trawling or other methods. Instead, guidelines have been established that allow for some
flexibility in selecting the most appropriate fish collection area within each waterbody to
improve the chances for success of the fish monitoring program.
Sampling Process and Design (Element B01)
Coordinated Compliance, Monitoring, and Reporting Plan June 2013 Greater Los Angeles and Long Beach Harbor Waters Page 15
Specifically, the following guidelines will be followed for the collection of fish within the
four waterbodies specified in the TMDL:
1. Fish collection should be targeted as close to the following four areas as practicable,
while accounting for limitations in the sampling vessel due to size and draft, and the
type of equipment (e.g., trawl and seine) necessary for fish collection:
Cabrillo Pier (Los Angeles Outer Harbor)
Long Beach Outer Harbor breakwater (inside), midway between Angel’s Gate and
Queen’s Gate
Pier J ([Eastern] San Pedro Bay)
Consolidated Slip
2. Every effort should be taken to ensure than any particular trawl track (or alternative
fish sampling technique) occurs within the proposed target sampling areas. However,
it is recognized that numerous factors (e.g., safe navigation around vessels and
structures, wind, currents, and presence or absence of targeted fish species) may
require the collection of fish outside the boundaries of the target sampling areas.
3. If extensive efforts have been made and insufficient fish have been caught at the
target locations, all available resources, such as fish finders or echosounders, should be
used to find an alternative sampling location that is as close to the original sampling
location as practicable, and still within the waterbody specified in the Harbor Toxics
TMDL (i.e., Los Angeles Outer Harbor, Long Beach Outer Harbor, [Eastern] San
Pedro Bay, and Consolidated Slip). The field crew will note the reasons for relocation
in the field log and fish collection efforts will be attempted at the secondary location.
It is recognized that fish tissue sampling will also be important in waterbodies other than
those prescribed by the TMDL (e.g., Fish Harbor, Inner Los Angeles Harbor, Inner Long
Beach Harbor) to better understand the linkages between sediment contaminants and fish
tissue contaminant concentrations in these waterbodies and throughout the entire Harbor.
Fish tissue sampling in waterbodies not specified in the TMDL will be conducted as part of
special studies that will be designed to address sediment-fish linkages, characterize the food
web structure of the target fish species, support the development of a site-specific Harbor
bioaccumulation model, and, ultimately, determine compliance with the TMDL.
Sampling Process and Design (Element B01)
Coordinated Compliance, Monitoring, and Reporting Plan June 2013 Greater Los Angeles and Long Beach Harbor Waters Page 16
4.2 Field Sampling Parameters
A summary of water, sediment, and fish tissue data to be collected at each station is
presented in Table 7. A schedule for data collection and the type and number of samples by
matrix to be collected over the 20-year project is provided in Table 4.
4.2.1 Water
Water samples will be collected at each of the 22 Harbor Toxics TMDL-specified station
locations (or approved, alternative Bight Program locations). Water quality measurements
and samples will be collected at three depths during wet and dry weather events (surface,
mid-water column, and bottom). Surface samples are defined as those collected between
0 and 1 meter below the water surface. Mid-water column sample depths will be based on
overall water depth and are to be determined in the field. Bottom surface samples are
defined as those collected within 1 meter above the mudline.
Actual locations will be within 15 meters of the proposed sampling station. If a station
cannot be sampled, the sampling site will be moved to a location within 100 meters
horizontal distance from the original site, staying within plus or minus 10 percent of the
depth of the original station.
4.2.2 Sediment
Surface sediment samples will be collected at each of the 22 Harbor Toxics TMDL-specified
station locations (or approved, alternative Bight Program locations). Actual locations will be
within 15 meter of the proposed sampling station. If a station cannot be sampled, the
sampling site will be moved to a location within 100 meter horizontal distance from the
original site, staying within plus or minus 10 percent of the depth of the original station.
4.2.3 Targeted Species
The Harbor Toxics TMDL requires the collection of three different fish species: white
croaker (Genyonemus lineatus), a sport fish, and a prey fish. White croaker was likely
selected as a target species for the TMDL compliance monitoring program for numerous
reasons. A regional fish consumption study (SCCWRP and MBC 1994) demonstrated that
white croaker was caught off Cabrillo Pier and the Cabrillo Beach Boat Ramp in Los
Sampling Process and Design (Element B01)
Coordinated Compliance, Monitoring, and Reporting Plan June 2013 Greater Los Angeles and Long Beach Harbor Waters Page 17
Angeles/Long Beach Harbor and consumed by some recreational anglers. The health
advisory and safe eating guidelines developed by OEHHA (2009) suggest that white croaker
caught from Ventura to San Mateo Point should not be eaten (regardless of age or gender);
these guidelines are based on elevated concentrations of PCBs and DDTs in croaker fillets,
which have historically been above fish consumption advisory tissue levels. White croaker is
found in nearshore habitats and is a bottom-dwelling species that primarily feeds on benthic
organisms including polychaetes and clams. Consequently, it is likely that white croaker is
indirectly exposed to sediment contaminants through the consumption of benthic organisms
(Moore 1999). This species is also a preferred target species for monitoring because they are
abundant throughout Los Angeles/Long Beach Harbor and easy to catch, as demonstrated by
the Biological Baseline studies conducted in 1988, 2000, and 2008 (MEC 1988, 2002; SAIC
2010).
The selection of a sport fish species for compliance monitoring was based on similar rationale
as to what is described above for white croaker. For the selection of sport fish, the following
considerations were evaluated:
The sport fish selected should be one that is fished in the Harbor and consumed,
based on the Southern California Coastal Water Research Project (SCCWRP) and
MBC Applied Environmental Sciences regional fish consumption survey (SCCWRP
and MBC 1994).
The sport fish selected should be one for which there is a fish consumption advisory
(OEHHA 2009), or the sport fish selected should be one that has been shown to have
elevated concentrations of PCBs and DDTs in muscle tissue.
The sport fish selected should be abundant in the Los Angeles/Long Beach Harbor.
Based on these considerations, California halibut (Paralichthys californicus) was selected as
the sport fish for the monitoring program. The SCCWRP and MBC (1994) fish consumption
survey demonstrated that this species was caught and consumed by anglers in Los
Angeles/Long Beach Harbor (i.e., Cabrillo Pier and Cabrillo Beach Boat Ramp). OEHHA
(2009) recommends reduced servings of halibut caught in the Los Angeles/Long Beach
Harbor region, and concentrations of PCBs and DDTs have been elevated in some halibut
caught within the harbor. Biological baseline studies in 2000 and 2008 demonstrated that
California halibut is abundant throughout the Harbor (MEC 2002; SAIC 2010). In addition,
this species has been selected because it is being studied as part of other TMDL-related

Sampling Process and Design (Element B01)
Coordinated Compliance, Monitoring, and Reporting Plan June 2013 Greater Los Angeles and Long Beach Harbor Waters Page 18
special studies being conducted to support Phase II and III TMDL implementation efforts.
Specifically, a fish movement study using both white croaker and California halibut will be
initiated in June 2013 to understand the movement of these species and their exposure to
Harbor sediments. Halibut was chosen over other fish species for the fish movement study
because juveniles and adults caught in the Harbor have large body cavities and adequate
body size and are sturdy enough to be used in a fish movement (i.e., tracking) study, which
involves the use of electronic fish tagging devices. While species such as barred sand bass
and queenfish meet the considerations for monitoring, they are not appropriate for use in the
fish movement study (i.e., barred sand bass caught in the Harbor are typically too small for
tagging and queenfish body cavities are too small for tagging). Consequently, the use of
California halibut in the monitoring program will maximize the usefulness of fish tissue data
collected as part of both TMDL programs.
A similar selection process was used to determine the most appropriate prey fish for TMDL
monitoring. For the selection of prey fish, the following considerations were evaluated:
The prey fish selected should be a species that is a prey item or a representative prey
item of white croaker and the sport fish selected for monitoring.
The prey fish selected should be one for which there is a fish consumption advisory
(OEHHA 2009) or the prey fish selected should be one that has been shown to have
elevated concentrations of PCBs and DDTs.
The prey fish selected should be one that is abundant in the Los Angeles/Long Beach
Harbor. The size of abundant prey fishes should also be considered.
Based on these considerations, shiner surfperch (Cymatogaster aggregate) was selected as the
prey fish for the monitoring program. In California, white croaker has been shown to
consume small fishes (e.g., anchovies) in addition to a wide variety of other organisms, such
as worms, shrimps, crabs, squid, clams, and other items, living or dead (CDFG 2001, 2002).
In contrast to white croaker, the California halibut diet is primarily composed of small fishes.
Halibut have been shown to prey upon Pacific sardines (Sardinops sagax caerulea), white
croaker, Northern anchovy (Engraulis mordax), atherinids (e.g., topsmelt [Atherinops
affinis]) and surfperches (including shiner surfperch [Cymatogaster aggregate] and walleye
surfperch [Hyperprosopon argenteum]), in addition to some invertebrates (Allen 1990;
CDFG 2002; CDFW 2013a). Two of the prey fishes listed above are on OEHHA’s list for
reduced consumption or no consumption (OEHHA 2009): surfperches and topsmelt,
Sampling Process and Design (Element B01)
Coordinated Compliance, Monitoring, and Reporting Plan June 2013 Greater Los Angeles and Long Beach Harbor Waters Page 19
respectively. Both surfperches and topsmelt have been shown to be abundant prey fishes in
the Los Angeles/Long Beach Harbor (SAIC 2010). However, the most abundant size classes
of shiner surfperch (4 to 6 centimeters [cm]) were smaller than those of topsmelt (6 to 8 cm;
SAIC 2010). Consequently, shiner surfperch are selected as the prey fish for the monitoring
program because the most abundant white croaker size classes in the Los Angeles/Long
Beach Harbor (16 to 20 cm) more likely to prey upon the smaller shiner surfperch than the
larger topsmelt due to the ease of catching smaller prey fish. In addition, shiner surfperch is
representative of important prey fish because their diets are similar to topsmelt; both species
have been shown to feed on zooplankton, algae, amphipods, polychaetes, and gastropods
(Odenweller 1975; Sempier 2013; UC 2013).
4.3 Sample Frequency
The proposed frequency for water, sediment, and tissue monitoring events is presented in
Table 4.
4.3.1 Water
Water samples will be collected during two wet weather events and one dry weather event
each year. The wet weather events will be targeted 24 hours after a storm event occurring
between October 1 and April 30. This 24 hour period provides time for Permittees to
monitor storm water outfalls and allows runoff from the watershed to reach the receiving
waters. In addition, for health and safety purposes, allowing 24 hours to pass before
launching vessels and conducting sampling improves the likelihood of sampling in less
dangerous conditions than those present at the start of a storm. The first storm of the season
will be targeted. The first storm is defined as having a predicted rainfall of at least 0.25
inches (0.64 cm) and a 70 percent probability of rainfall at least 24 hours prior to the event
start time. One additional wet weather event occurring in the same season will be sampled.
This wet weather event will consist of a storm that produces at least 0.1 inches (0.25 cm) of
precipitation per day and separated by an antecedent dry period (less than 0.1 inches [0.25
cm] of rain per day) of at least 72 hours. The dry weather event may be conducted any time
of the year but only after an antecedent dry period of at least 72 hours has passed since the
last rainfall event. Although unlikely, the lack of storm events, especially during drought
years, may constrain the ability to successfully monitor wet weather.
Sampling Process and Design (Element B01)
Coordinated Compliance, Monitoring, and Reporting Plan June 2013 Greater Los Angeles and Long Beach Harbor Waters Page 20
4.3.2 Sediment
SQO Part 1 (sediment triad sampling) will be performed twice every 5 years. Sediment will
be sampled in Year 1 and Year 4, and this cycle will repeat every 5 years. This schedule
guarantees no single sediment sampling event is greater than 3 years from the previous
effort, and maximizes the number of paired sampling events with biennial fish tissue
sampling efforts. The schedule outlined in Table 4 illustrates this approach. The proposed
sediment sampling approach will be conducted in the same years as the Southern California
Regional Bight Monitoring Program, assuming that program maintains the current frequency
of once every 5 years.
In accordance with the Sediment Quality Assessment Draft Technical Support Manual (Bay
et al. 2009), sediment triad sampling will be conducted between July 1 and September 30.
Benthic assemblages change with season, light, and temperature. The Sediment Quality
Assessment Draft Technical Support Manual recommends sampling during a specific time of
year for consistency and comparability of data (Bay et al. 2009). The greatest organism
abundances and diversities are typically observed in the summer months. Due to the
increased data available in summer months, this timeframe was selected to provide the best
representation of benthic community health. No other time or resource constraints are
anticipated for the collection of sediment samples.
4.3.3 Fish Tissue
Fish tissue samples will be collected once every 2 years. In accordance with the Bight Field
Operations Manual (BCEC 2008), fish tissue collection efforts will be conducted between
July 1 and September 30. Fish are more robust in the summer, as their food is more
abundant during this time. Thus, they have the potential to bioaccumulate more
contaminants during the summer. This timeframe was selected as a conservative approach to
provide data reflective of the maximum levels of bioaccumulatives present in fish tissues for
the given sampling year. No other time or resource constraints are anticipated for the
collection of fish tissue samples.
4.4 Station and Sample Identification
Each station identification code will be unique and be maintained throughout the duration of
compliance monitoring activities. The station identification codes are consistent with the
Sampling Process and Design (Element B01)
Coordinated Compliance, Monitoring, and Reporting Plan June 2013 Greater Los Angeles and Long Beach Harbor Waters Page 21
station numbers listed in Sediment Chemistry Monitoring Requirements table of the Harbor
Toxics TMDL Basin Plan Amendment (RWQCB and USEPA 2011).
Each sample will have an adhesive plastic or waterproof paper label affixed to the container
and will be labeled at the time of collection. The following information will be recorded on
the container label at the time of collection:
Project name
Sample identifier (sample identification code)
Date and time of sample collection
Preservative type (if applicable)
Analysis to be performed
The sample nomenclature should include the identifiers listed below. A catalogue of
identification codes is provided in Table 8. The identification codes shown below should be
used when applicable; however, sample identification code requirements for special studies
are not yet defined and consequently, minor modifications to the recommended
identification codes will be acceptable in these cases.
Waterbody or site as shown in Table 8
Media or sampling method code
Station number
Organism common name, if applicable
Depth interval (in metric units), if applicable
Date of collection
Indication of field duplicate (i.e., add 1000 to station number)
For equipment rinsate blank or field blank samples, “EB” or “FB” will be used, respectively,
in place of the waterbody or site and station number. The date of sample collection will be
added to end in YYYYMMDD format.
For fish tissue samples, no station number will be used. Because one station will be selected
in each of the four required waterbodies, the waterbody code will be sufficient to identify
fish tissue samples.
Sampling Process and Design (Element B01)
Coordinated Compliance, Monitoring, and Reporting Plan June 2013 Greater Los Angeles and Long Beach Harbor Waters Page 22
Sample nomenclature for water and sediment samples is shown on Figure 4, using the
following example: a surface sediment grab at 0-5 cm, station number 09 from Outer Harbor
– Los Angeles on July 31, 2013 would be written as:
OA-SS-09-0-5-20130731
Sample nomenclature for tissue samples is shown on Figure 5, using the following example:
a white croaker, fish fillet skin off, from Outer Harbor – Long Beach on July 31, 2013 would
be written as:
OB-FF-WC-20130731
Sample nomenclature for field duplicates is shown on Figure 6, using the following example:
a water sample collected at 2 meters, station number 09 from Outer Harbor – Los Angeles on
July 31, 2013, that is a field duplicate would be written as:
OA-RW-1009-2-20130731
Sample nomenclature for equipment blanks is shown on Figure 7, using the following
example: an equipment blank of the decontaminated sample processing equipment after
sample collection on July 31, 2013 would be written as:
EB-20130731
4.5 Critical Information
Supplemental information relating to the different types of data to be collected and whether
that data is considered informational or critical to the project is provided in Table 9. In
general, visual observations are informational and all other data is critical.
Coordinated Compliance, Monitoring, and Reporting Plan June 2013 Greater Los Angeles and Long Beach Harbor Waters Page 23
5 SAMPLE COLLECTION (ELEMENT B02)
Methods adhere to Bight and SWAMP protocols. A list of field standard operating
procedures (SOPs) is presented in Table 10; SOPs are provided in Appendix A. Additional
information regarding samplers and sample processing for each matrix is provided in Table
11. Specific information regarding chemical constituents to be analyzed, sample containers
and volumes, holding times, temperatures, and preservatives is presented in Table 12.
5.1 Water
Water quality monitoring consists of in situ measurements and the collection of water
samples for chemical analyses.
5.1.1 In Situ Measurements
For each sampling event and at each station, water depth and in situ1 water quality
parameters (temperature, dissolved oxygen [DO], pH, and salinity) will be collected. Water
quality parameters and water depth will be recorded on a field data sheet.
The water depth at each station should be recorded using a probe or lead line. Water quality
will be measured in situ at the station by immersing a multi-parameter instrument2 into the
water at the same location where the water sample is collected. The instrument must
equilibrate for at least one minute before collecting temperature, pH, conductivity and/or
salinity measurements and at least 90 seconds before collecting DO measurements. Because
DO takes the longest to stabilize, record this parameter after temperature, pH, and salinity.
See the SWAMP SOP for additional details on the collection of field parameters (MPSL-DFG
2007). Methods are also summarized in the SOP: In situ Water Quality Monitoring
(Appendix A). Water quality measurements will be collected at three depths during wet and
dry weather events (surface, mid-water column, and bottom).
1 Water quality parameter measurements may be taken in the laboratory immediately following sample
collection, if auto samplers are used for sample collection or if weather conditions are unsuitable for field
measurements. 2 A multi-parameter instrument is preferred; however multiple specific water quality parameter meters may
also be used.
Sampling Collection (Element B02)
Coordinated Compliance, Monitoring, and Reporting Plan June 2013 Greater Los Angeles and Long Beach Harbor Waters Page 24
The Harbor Toxics TMDL states that flow also be included as a parameter to be measured.
At the point of a stormwater or dry weather discharge, it is appropriate to measure for flow.
In these cases, flow measurements (i.e., the volume of water discharged per unit of time from
a specific discharge point) may be used to calculate suspended sediment and pollutant
loadings to a receiving waterbody. In contrast, at stations within a receiving waterbody, it is
not appropriate to measure flow for two primary reasons:
Tidal and wind currents (in bays and estuaries) or flows originating from upstream
sources (in rivers and channels) will cause inaccurate flow measurements of the
discharge after it mixes with receiving water.
Mixing of the discharge with receiving water prevents calculations of loadings
(i.e., the pollutant concentration multiplied by flow measurement) because the
discharge and its suspended sediment and pollutant load is immediately diluted in the
receiving water.
This CCMRP proposes to sample at locations within receiving waters. As such, flow will not
be measured, because mixing and other hydrodynamic factors will confound the flow
measurements and loading calculations.
5.1.2 Grab Samples
Water samples will be collected from the same three depths as the in situ water quality
measurements. Grab samples (i.e., instantaneous, not time or flow-weighted composites) for
total suspended solids (TSS) will be taken at all three depths during wet and dry weather
events. Grab samples for analytical chemistry will be taken only from the surface sample.
Water samples will be collected with a grab sampler (e.g., Niskin or Van Dorn) that has been
decontaminated prior to sample collection at each station. Sampling methods will generally
conform to U.S. Environmental Protection Agency’s (USEPA’s) clean sampling methodology
described in the SWAMP SOP (MPSL-DFG 2007). Methods are also summarized in the SOP:
Grab Water Sampling (Appendix A).
Sample processing and handling for water chemistry will be conducted in accordance with
guidance developed in the Quality Assurance Management Plan for the State of California’s
SWAMP (Pucket 2002). Aliquots for TSS, metals, organochlorine pesticides, and PCBs will
Sampling Collection (Element B02)
Coordinated Compliance, Monitoring, and Reporting Plan June 2013 Greater Los Angeles and Long Beach Harbor Waters Page 25
be taken directly from the grab sampler into appropriate containers or bottles (Table 12).
Water samples will be preserved, depending on the type of analysis, in the field in order to
meet specified holding time (Table 12). Water samples will be stored at <4°C until delivery
to the appropriate analytical laboratory.
5.2 Sediment
Surface sediment samples will be collected at each station. Multiple grab samples may be
required at each station in order to provide sufficient sediment volumes to complete all
analyses required for the SQO Part 1 assessment (Bay et al. 2009). Sediment grabs will be
evaluated for acceptance as outlined in the Bight Field Operations Manual, Section VIII
(BCEC 2008).
Surface sediment grab samples procedures will be collected using a Van Veen sampler, or
similar sampling device as appropriate for the type of sediment sample being collected, as
described in the Bight Field Operations Manual, Section VIII (BCEC 2008) and summarized
in the SOP: Surface Sediment Grab Sampling (Appendix A).
Sediment sample processing and handling for purposes of sediment chemical analyses,
sediment toxicity, and benthic community assessment in support of the SQOs Part 1
assessment will be performed in accordance with procedures specified in the Sediment
Quality Assessment Draft Technical Support Manual (Bay et al. 2009) and the Bight Field
Operations Manual (BCEC 2008). Methods are also included in SOPs: Sediment Chemistry
Sample Processing, Sediment Toxicity Sample Processing, and Benthic Infauna Processing
(Appendix A). Recommended conditions for sampling containers and sample handling and
storage are listed in Table 12. Sediment samples for chemistry and toxicity analyses will be
stored at <4°C until delivery to the appropriate analytical laboratory. Benthic infauna
samples will be stored in 10 percent buffered formalin in the short term and then
subsequently transferred to 70 percent ethanol (or equivalent) for long term storage.
5.3 Fish Tissue
Fish tissue samples will be collected and analyzed for chemical contaminants of concern.
Sampling, processing, and testing methods will be carried out in accordance with Bight
Sampling Collection (Element B02)
Coordinated Compliance, Monitoring, and Reporting Plan June 2013 Greater Los Angeles and Long Beach Harbor Waters Page 26
protocols (BCEC 2008, 2009). Methods are summarized in SOPs: Fish Collection and Fish
Processing (Appendix A). Necessary permits (e.g., scientific collection, incidental take) will
be secured prior to fish collection. Applications and procedures for permits can be found
online at the California Department of Fish and Wildlife (CDFW) website (2013b).
CDFW code section 1002 and Title 14 sections 650 and 670.7 requires a Scientific Collecting
Permit to take, collect, capture, mark, or salvage, for scientific purposes, fish and
invertebrates. CDFW section 2081(b) requires an Incidental Take Permit (ITP) for any
species listed as threatened or endangered (T/E). Although, none of the targeted species for
this study are T/E species, it is possible that T/E species will be accidentally caught as by
catch. An ITP is required for T/E species that are caught or handled in any way, even if they
are returned to the ocean.
In addition, the permit holders must notify the local CDFW office prior to collection and
submit a report of the animals taken under the permits within 30 days of the expiration date
of the permits. More information is available on CDFW’s website (2013a).
5.3.1 Fish Collection and Processing
Composite samples of three fish species (white croaker, California halibut, and shiner
surfperch) will be collected at all stations, with the exception of Consolidated Slip; only
white croaker will be collected at this station.
When possible, fish will be collected using a semi-balloon, 7.6-meter headrope otter trawl
following the methods in the Bight Field Operations Manual (BCEC 2008). If other methods
need to be employed in the case an otter trawl is not feasible (e.g., lampara net, beach seine,
fish trap, or hook and line), SWAMP methods will be used (MPSL-DFG 2001). SOPs for fish
collection are provided in Appendix A.
Once the catch is onboard the vessel, the targeted species will be identified and separated for
subsequent processing. At each station, 12 individuals of each fish species will be collected
for further processing. There is currently no legal size limit for white croaker. An ocean fish
contaminant survey was performed from 2002 to 2004 (NOAA 2007). In part, this survey
Sampling Collection (Element B02)
Coordinated Compliance, Monitoring, and Reporting Plan June 2013 Greater Los Angeles and Long Beach Harbor Waters Page 27
sought to generate information on contaminants of concern for fish caught for sustenance in
Southern California. Collection of white croaker for the Harbor Toxics TMDL study should
be consistent with this survey, which recommended a minimum length of 160 millimeters
(mm; total length). Collection of California halibut of legal size limit is preferred. The
current regulations specify at least 22 inches (or 559 mm; total length) for California halibut
(FGC 2012). Collection of adult shiner surfperch (i.e., second year age-class with a target
length of 88 mm [Odenweller 1975]) is preferred. Additional individuals of the three target
species and non-target species will be returned to the ocean as soon as possible to minimize
loss. It should be noted that field personnel may encounter by catch that are potentially
harmful while sorting for targeted species. The Bight Field Operations Manual (BCEC 2008)
and Fish Collection SOPs in Appendix A provide information on the safe handling of these
organisms.
Each targeted fish kept will be tagged with a unique identification number and then
measured for total length, fork length, and weight and examined for gross pathology in
accordance with guidance established in the Bight Field Operations Manual (BCEC 2008).
Three composite samples per species per station will be created. A composite sample will be
comprised of four individuals; therefore, a total of 12 individuals per station are required. If
more than 12 specimens are caught, then the 12 individuals best and most closely distributed
about the 75th percentile of the length distribution of all individuals will be used for the
composites. The selected 12 individual fish will then be arranged by size and the smallest
four fish, the middle four fish, and the largest four fish within a species will be grouped for
each composite to satisfy the 75 percent rule (the smallest individual in a composite is no less
than 75 percent of the total length of the largest individual in a composite; USEPA 2000).
This may permit data evaluation based on size class, if necessary. Skin-off fillets will be used
for white croaker, California halibut, and shiner surfperch to be consistent with the 2002 –
2004 Southern California Coastal Marine Fish Contaminants Survey (NOAA 2007).
Dissection and compositing methods will be performed in the analytical laboratory in
accordance with USEPA guidance (USEPA 2000).
Fish tissue will be analyzed for chemical parameters. Processing and preservation will be
performed in accordance with the methods described in the Bight Field Operations Manual
Sampling Collection (Element B02)
Coordinated Compliance, Monitoring, and Reporting Plan June 2013 Greater Los Angeles and Long Beach Harbor Waters Page 28
and Bioaccumulation Workplan (BCEC 2008, 2009). Fish will be processed in the field
according to the steps below.
Sacrifice fish and leave whole body intact.
Blot fish dry and pack each fish in aluminum foil (shiny side out).
Place each packed fish in a labeled, food grade, resalable plastic bag and store on ice.
Ship overnight to the analytical laboratory on wet or blue ice. If samples are held
more than 24 hours, pack on dry ice.
Chain-of-custody forms will be maintained. Tissue compositing will be conducted by the
analytical laboratory. Recommended conditions for sampling containers, sample handling
and storage are listed in Table 12.
5.4 Field Equipment Decontamination Procedures
Sample containers, instruments, working surfaces, technician protective gear, and other
items that may come into contact with sample material must meet high standards of
cleanliness. All equipment and instruments used that are in direct contact with various
media collected for chemical analysis must be made of glass, stainless steel, high-density
polyethylene (HDPE) or polytetrafluoroethylene (PTFE) and will be cleaned prior to each
day’s use and between sampling or compositing events. The decontamination procedure is as
follows:
1. Pre-wash rinse with tap or site water.
2. Wash with solution of warm tap water or site water and Alconox™ soap.
3. Rinse with tap or site water.
4. Rinse thoroughly with organic-free water.
5. Cover (no contact) all decontaminated items with aluminum foil.
6. Store in a clean, closed container for next use.
Disposable gloves will be discarded after processing each station and replaced prior to
handling decontaminated instruments or work surfaces.
Water quality probes will be rinsed three times with distilled water prior to collecting
measurements at each station.
Sampling Collection (Element B02)
Coordinated Compliance, Monitoring, and Reporting Plan June 2013 Greater Los Angeles and Long Beach Harbor Waters Page 29
5.5 Waste Disposal
All disposable sampling materials and personal protective equipment used in sample
processing, such as disposable coveralls, gloves, and paper towels, will be placed in
heavyweight garbage bags or other appropriate containers. Disposable supplies will be
removed from the site by sampling personnel and placed in a normal refuse container for
disposal as solid waste. Waste disposal procedures for specific media are as follows.
5.5.1 Water
Excess water from the sampler will be returned to the collection site, prior to moving to the
next sampling location.
5.5.2 Sediment
Any incidental sediment remaining after sampling will be washed overboard at the
collection site, prior to moving to the next sampling location. Any sediment spilled on the
deck of the sampling vessel will be washed into surface waters at the collection site after
sampling.
5.5.3 Fish Tissue
After target fish have been collected, the remaining catch should be returned to the sea.
Dead specimens should be discarded offshore, outside the breakwater, to avoid spoiling of
nearshore areas (i.e., harbors and bays).
5.6 Sampling Platform and Equipment
The subcontractor will provide the sampling vessel and all equipment necessary for safe
operation during sampling. The vessel shall conform to U.S. Coast Guard safety standards.
The vessel should be equipped with the proper equipment for the safe deployment and
retrieval of sampling gear, such as an A-frame and/or davit with an associated electrical or
hydraulic winch system. An A-frame should be used for the deployment of fish sampling
(e.g., trawl) gear. An A-frame or davit may also be used for the deployment of water quality
and sediment sampling gear. In addition, the vessel should have sufficient deck space for
sample processing and water pumps available to aid in sample processing and cleaning of the
Sampling Collection (Element B02)
Coordinated Compliance, Monitoring, and Reporting Plan June 2013 Greater Los Angeles and Long Beach Harbor Waters Page 30
deck and equipment between stations. A list of equipment and support facilities that may be
necessary to conduct sampling is provided in Table 13. Subcontractors are responsible for
providing a complete list of equipment and support facilities to be used for sampling.
5.7 Positioning and Vertical Controls
On-vessel navigation and positioning will be accomplished using a differential global
positioning system (DGPS). The navigation system will be used to guide the vessel to
pre-determined core sampling locations, with an accuracy of plus or minus 10 feet. The
vessel will maintain position using a three-point anchoring system. The coordinates of the
actual sampling locations will be reported in latitude and longitude in degrees, decimal, and
minutes (to three decimal places). Positions will be relative to the North American Datum
1983 (NAD83).
Upon locating the sampling location, station depth will be measured using an onboard,
calibrated fathometer or a leadline. The mudline elevation relative to mean lower low water
(MLLW) datum will be determined by adding the tidal elevation to the measured depth. In
the Port of Los Angeles, the Los Angeles, California, tide gauge (Station ID 9410660) will be
referenced. In the Port of Long Beach and San Pedro Bay, the Long Beach Terminal Island
tide gauge (Station ID 9410680) will be referenced. Vertical elevations will be reported to
the nearest 0.1 foot relative to MLLW.
Coordinated Compliance, Monitoring, and Reporting Plan June 2013 Greater Los Angeles and Long Beach Harbor Waters Page 31
6 SAMPLE HANDLING AND CUSTODY (ELEMENT B03)
6.1 Sample Shipping
All samples will be shipped or hand delivered to the analytical laboratory no later than the
day after collection. Samples collected on Friday may be held until the following Monday
for shipment provided that this delay does not jeopardize any hold time requirements.
Specific sample shipping procedures are as follows:
Each cooler or container containing the samples for analysis will be shipped via
overnight delivery to the laboratory. In the event that Saturday delivery is required,
the field coordinator will contact the analytical laboratory before 3 p.m. on Friday to
ensure that the laboratory is aware of the number of containers shipped and the
airbill tracking numbers for those containers. Following each shipment, the field
coordinator will call the laboratory and verify that the shipment from the day before
has been received and is in good condition.
Coolant ice will be sealed in separate double plastic bags and placed in the shipping
containers.
Individual sample containers will be placed in a sealable plastic bag, packed to
prevent breakage, and transported in a sealed ice chest or other suitable container.
Glass jars will be separated in the shipping container by shock-absorbent material
(e.g., bubble wrap) to prevent breakage.
The shipping containers will be clearly labeled with sufficient information (name of
project, time and date container was sealed, person sealing the container, and
consultant’s office name and address) to enable positive identification.
The shipping waybill number will be documented on all COC forms accompanying
the samples.
A sealed envelope containing COC forms will be enclosed in a plastic bag and taped to
the inside lid of the cooler.
A minimum of two signed and dated custody seals will be placed on adjacent sides of
each cooler prior to shipping.
Each cooler will be wrapped securely with strapping tape, labeled “Glass – Fragile”
and “This End Up,” and will be clearly labeled with the laboratory’s shipping address
and the consultant’s return address.
Sample Handing and Custody (Element B03)
Coordinated Compliance, Monitoring, and Reporting Plan June 2013 Greater Los Angeles and Long Beach Harbor Waters Page 32
Upon transfer of sample possession to the analytical laboratory, the persons transferring
custody of the sample container will sign the COC form. Upon receipt of samples at the
laboratory, the custody seals will be broken, and the receiver will record the condition of the
samples on a sample receipt form. COC forms will be used internally in the laboratory to
track sample handling and final disposition.
6.2 Chain‐of‐Custody Procedures
Samples are considered to be in one’s custody if they are: 1) in the custodian’s possession or
view; 2) in a secured location (under lock) with restricted access; or 3) in a container that is
secured with an official seal(s) so that the sample cannot be reached without breaking the
seal(s).
Chain-of-custody (COC) procedures will be followed for all samples throughout the
collection, handling, and analysis process. The principal document used to track possession
and transfer of samples is the COC form. Each sample will be represented on a COC form
the day it is collected. All manual data entries will be made using an indelible ink pen.
Corrections will be made by drawing a single line through the error, writing in the correct
information, then dating and initialing the change. Blank lines and spaces on the COC form
will be lined out, dated, and initialed by the individual maintaining custody. Electronic COC
(eCOC) forms will be emailed directly to the laboratory and QA manager.
A COC form will accompany each container of samples to the analytical laboratories. Each
person in custody of samples will sign the COC form and ensure the samples are not left
unattended unless properly secured. Copies of all COC forms will be retained in the project
files.
Coordinated Compliance, Monitoring, and Reporting Plan June 2013 Greater Los Angeles and Long Beach Harbor Waters Page 33
7 FIELD MEASUREMENTS AND ANALYTICAL METHODS (ELEMENT B04)
Field SOPs for field measurements are listed in Table 14 and included in Appendix A. Field
instruments are presented in Table 15. Water, sediment, and tissue analytical chemistry will
be performed by a laboratory certified by the California Environmental Laboratory
Accreditation Program (ELAP) and/or National Environmental Laboratory Accreditation
Program (NELAP) on contract with Ports of Long Beach and Los Angeles. Sample containers
and preservatives, as appropriate, will be provided by the analytical laboratory. The
laboratory will maintain documentation certifying the cleanliness of bottles and the purity of
preservatives provided. A summary of the major chemical constituents to be analyzed is
presented in Table 16. A complete list of analytes by matrix is included in Tables 17, 18, and
19.
7.1 Water
In situ water quality field measurements will be made for the following parameters:
pH
Temperature
DO
Salinity
Water quality will be measured in situ at the station location by immersing a water quality
sonde into the water at the same location where the water sample is collected. See Appendix
A and the SWAMP SOP for additional details on the collection of field parameters (MPSL-
DFG 2007).
Water samples will be analyzed for the following:
TSS
Dissolved and total metals
Organochlorine pesticides (including DDT and its derivatives, chlordane compounds,
dieldrin, and toxaphene)
PCBs
Field Measurements and Analytical Methods (Element B04)
Coordinated Compliance, Monitoring, and Reporting Plan June 2013 Greater Los Angeles and Long Beach Harbor Waters Page 34
Table 17 lists the specific compounds to be analyzed and details the analytical methods and
target reporting limits. Sample volumes and preservation techniques for required analyses
are included in Table 12. The sample volume needed may vary due to the analytical methods
and reporting limit capabilities of the laboratory.
7.2 Sediment Triad Sampling
7.2.1 Chemistry
Sediment chemistry is one of three essential lines of evidence (LOE) required for the SQO
Part 1 (sediment triad assessment), which helps determines the type of chemical exposure
and its potential for producing adverse biological effects. Determination of the chemistry
LOE is comprised of two main components: 1) measurement of a suite of constituents and 2)
interpretation of the results using two indices of chemical exposure: CA CLR and chemical
score index (CSI; Bay et al. 2009).
Sediment samples will be analyzed for the following:
Total organic carbon (TOC)
Grain size
Metals
Polycyclic aromatic hydrocarbons (PAHs)
Organochlorine pesticides (including DDT and its derivatives, chlordane compounds,
dieldrin, and toxaphene)
PCB congeners
Specific compounds to be analyzed and analytical methods and target reporting limits are
provided in Table 18. Sample volumes and preservation techniques for required analyses are
presented in Table 12. Sediment chemical analyses will be conducted in accordance with
Sediment Quality Assessment Draft Technical Support Manual (Bay et al. 2009). The sample
volume needed may vary due to the analytical methods and reporting limit capabilities of the
laboratory.
Field Measurements and Analytical Methods (Element B04)
Coordinated Compliance, Monitoring, and Reporting Plan June 2013 Greater Los Angeles and Long Beach Harbor Waters Page 35
7.2.2 Toxicity
Sediment toxicity is the second essential LOE for conducting a SQO Part 1 assessment.
Toxicity tests will be conducted in accordance with Sediment Quality Assessment Draft
Technical Support Manual (Bay et al. 2009). Methods are summarized in the SOP: Sediment
Toxicity Testing (Appendix A). Two sediment toxicity tests, including an acute amphipod
survival and a chronic, sub-lethal test are required for the assessment (Bay et al. 2009). For
consistency and comparability with the Bight program and over time, the Eohaustorius
estuarius amphipod toxicity test should be used for compliance monitoring. E. estuarius has
been historically used during Bight Monitoring in the Los Angeles and Long Beach Harbors
in 1998, 2003, and 2008 (SCCWRP 2003, 2007; Nautilus 2009) and Ports of Long Beach and
Los Angeles’ Biological Baseline Monitoring in 2008 (SAIC 2010). The continued use of this
species as part of future monitoring events will allow for the greatest data comparability over
time. However, due to the intolerance of E. estuarius for sediment with a high percent of
clay, alternative species accepted by the SQO guidance (e.g., Leptocheirus plumulosus)
should be considered in areas expected to have a high percent of fines. It is unlikely, due to
holding time restraints, that grain size data will be available from the analytical laboratory
prior to species determination for toxicity testing. As such, species determinations should be
made via best professional judgment based on the physical appearance and texture of test
sediments and availability of test organisms at the time of sample collection. The field
manager and toxicity laboratory manager should work together to identify the grain size and
appropriate test species for each test sediment. It is not uncommon to use two different
species within the same study to accommodate testing sediments of differing grain size.
The chronic, sublethal toxicity test that should be conducted as part of an SQO assessment in
the Los Angeles/Long Beach Harbor Complex is the mussel (Mytilus galloprovincialis)
sediment-water interface test. Recent Bight monitoring in 2008 employed the sediment-
water interface (SWI) test and, continued use of this test will provide the best data
comparability between previous and future sampling events. In accordance with the original
intent of the SWI test design (Anderson et al. 1996), M. galloprovincialis larvae should be
exposed to intact cores. In contrast, homogenized sediment was used in the Bight 2008
testing program. The use of intact cores instead of homogenized sediment will reduce the
potential for confounding effects of ammonia and sulfides found in deeper sediment, while
still testing for the toxic effects of chemicals fluxing from sediment to overlying water.

Field Measurements and Analytical Methods (Element B04)
Coordinated Compliance, Monitoring, and Reporting Plan June 2013 Greater Los Angeles and Long Beach Harbor Waters Page 36
A description of these toxicity test methods specified under the SQO policy is provided in
Chapter 4 of the Sediment Quality Assessment Draft Technical Support Manual (Bay et al.
2009). Specifically, Chapter 4 provides guidance on sample preparation, organism
acclimation, test methods, QA/QC procedures, and data analysis and interpretation (Bay et
al. 2009).
7.2.3 Benthic Community
The third essential LOE for sediment quality assessment is the composition of the benthic
community. The benthic LOE is a direct measure of the effect that sediment contaminant
exposure has on the benthic biota of California’s bays and estuaries. Determination of the
benthic LOE is based on four measures of benthic community condition: 1) Index of Biotic
Integrity (IBI), 2) Relative Benthic Index (RBI), 3) Benthic Response Index (BRI), and 4)
River Invertebrate Prediction and Classification System (RIVPACS; Bay et al. 2009). Benthic
community analyses will be conducted in accordance with Sediment Quality Assessment
Draft Technical Support Manual (Bay et al. 2009). Chapter 5 of the Sediment Quality
Assessment Draft Technical Support Manual (Bay et al. 2009) details recommended
laboratory procedures for the processing of benthic infauna samples and subsequent data
analysis necessary for the SQO Part 1 assessment. Methods are included in the SOP: Benthic
Infauna Community Analysis (Appendix A).
7.3 Sediment Quality Objective Assessment
The SQO assessment incorporates the MLOE described above (chemistry, toxicity, and
benthic community) to develop final station assessments. SQO assessment should be
conducted in accordance with the Water Quality Control Plan (SWRCB and CalEPA 2009)
and the Technical Support Manual (Bay et al. 2009). The calculation of the toxicity LOE is
straightforward, as described in the Technical Support Manual. Consequently, only
supplemental guidance is provided here for the chemistry and benthic LOEs.
7.3.1 Chemistry Line of Evidence
Calculation of the chemistry LOE should follow methods described in the Water Quality
Control Plan (SWRCB and CalEPA 2009) and the Technical Support Manual (Bay et al.
2009). Specific attention should be given to guidance on the summing of total high
Field Measurements and Analytical Methods (Element B04)
Coordinated Compliance, Monitoring, and Reporting Plan June 2013 Greater Los Angeles and Long Beach Harbor Waters Page 37
molecular weight PAHs, low molecular weight PAHs, total PCBs, and total DDTs; guidance
on using the specific chemical constituents in each class to sum, managing non-detects, and
applying a multiplication factor as part of the total PCB concentration estimate should be
strictly followed.
For individual analytes with a non-detect result, an estimated concentration represented by
half the detection limit should be consistently used. Using this method will ensure
consistency across all monitoring events. This stipulation does not apply to non-detect
results used in a sum (as previously described). While there are other ways that non-detects
can be estimated (i.e., non-detect equals detection limit), the recommended method is in
agreement with the Technical Support Manual (Bay et al. 2009).
Calculations may be performed using various tools, including a calculator, Microsoft Excel®,
or programming languages (i.e., Interactive Data Language [IDL]). SCCWRP has also
developed a data integration tool in Microsoft Excel® (Data Integration Tool v5.4) for
calculating each LOE and the final MLOE. The current version is available on the Sediment
Quality Assessment Tools page of the SCCWRP website (SCCWRP 2009). It should be noted
that this tool is currently under revision.
7.3.2 Benthic Line of Evidence
Calculation of the benthic LOE should follow methods described in the Water Quality
Control Plan (SWRCB and CalEPA 2009) and the Technical Support Manual (Bay et al.
2009). As part of this calculation, data should be prepared and benthic indices calculated in
accordance with this manual. The preparation of data for benthic indices calculations is a
critical step that has significant impacts on the results and SQO outcome. The Technical
Support Manual (Bay et al. 2009) describes most key steps required to prepare data prior to
benthic indices calculations. In addition, the Technical Support Manual states that data
should be prepared by identifying each taxon to the appropriate level “in keeping with the
benthic macrofauna species list for the relevant habitat.”
Field Measurements and Analytical Methods (Element B04)
Coordinated Compliance, Monitoring, and Reporting Plan June 2013 Greater Los Angeles and Long Beach Harbor Waters Page 38
While a seemingly uncomplicated task, to address this data requirement in full, the following
steps should be taken to ensure consistency with SCCWRP data assessment tools, as it will
allow for the most comprehensive quality control:
Species collected from within the Los Angeles/Long Beach Harbor Complex should be
compared to the “Benthic Lookup” worksheet found within the Data Integration Tool
v5.4 Excel file (SCCRWP 2008). Species should be matched to corresponding names
within this species list, and if no corresponding species exists, species should be
matched to the next lowest taxonomic level (genus, family, order, class, or phylum).
Species may be identified to the nearest taxonomic level using the Southern California
Association of Marine Invertebrate Taxonomists (SCAMIT) Taxonomic Toolbox
available at http://www.scamit.org/taxontools/.
Species not matching a corresponding species or the next lowest taxonomic level
should be checked to ascertain that the species name is the most recently accepted
name for that organism. For example, Caesia perpinguis (Hinds 1844) should be
recorded as Nassarius perpinguis. The most recently accepted species names may be
checked at the following website:
http://www.bily.com/pnwsc/web-content/Articles/Name%20Changes%20
from%20the%20Lights%20Manual.html.
If benthic species or taxon does not match any taxon provided in the Benthic Lookup
worksheet, they should be excluded from benthic indices calculations entirely (i.e.,
their names should be removed from the species listed at that station), until revision
of the Data Integration Tool v5.4 is complete, which will allow for the ability to
include some species that may not be on the list, but are in fact marine benthic
invertebrates.
Upon conversion of species names to the lowest taxonomic level, duplicate, triplicate,
or more taxon results should be compiled into one taxon result with one
corresponding abundance. For example, if the abundance data show two organisms
identified as Lineus bilineatus (which can be converted to the family Lineidae, as it is
the lowest matching taxonomic level) and four organisms identified as Lineidae, then
there should be one line item for Lineidae with a total of six organisms
(Ranasinghe 2010).
Field Measurements and Analytical Methods (Element B04)
Coordinated Compliance, Monitoring, and Reporting Plan June 2013 Greater Los Angeles and Long Beach Harbor Waters Page 39
Within the Benthic Lookup worksheet found within the Data Integration Tool v5.4
Excel file, there is a species level column that indicates whether or not a species
should be dropped. SCCWRP states that “when present, ‘Drop’ in this column
indicates that abundances of this taxon are included in index calculations, but it is not
included for counting numbers of taxa because lower taxonomic level entries in this
taxon are also present” (SCCWRP 2008). It is critical that programming language or
user-designed spreadsheets used to calculate benthic indices incorporate this “drop”
instruction.
The supplemental data preparation steps previously described must be followed such that QC
checks can be conducted on the numerical results of the indices using the SCCWRP Data
Integration Tool v5.4, assuming initial indices calculations were performed using a
programming language such as IDL, SAS® software, or separate Excel file. In addition, if
species names are not matched to the Benthic Lookup worksheet when they should be, the
match between observed and expected species could be reduced, which would affect the
RIVPACS score and could also have an impact on the result of other benthic indices due the
inclusion of total number of taxa or subclasses of taxa (i.e., molluscs) in the calculation of
these indices. If species names are included in the data analyses when they do not match the
species list, the scores of the benthic indices could be impacted, which could potentially
affect the benthic LOE outcome.
7.3.3 Quality Control of Chemistry and Benthic Lines of Evidence Data
Assessment
A minimum of 10 percent of any data entry performed prior to data assessment should be
assessed as part of the QC program. If major issues are found, then 100 percent of data entry
conducted should be reviewed. If LOE calculations are done using an alternative method to
the SCCWRP data integration tool, data from 10 percent of the samples (minimum of five
samples) should be entered into the data integration tool and results of each individual LOE
(i.e., CSI, the California Logistic Regression Model [CA LRM], RIVPACS, and IBI.) for each
sample should be compared to results using alternative methods. If the data integration tool
is the primary method used for the calculation, then 10 percent of the data should be
checked using a calculator or alternative method. If major issues are found with indices
Field Measurements and Analytical Methods (Element B04)
Coordinated Compliance, Monitoring, and Reporting Plan June 2013 Greater Los Angeles and Long Beach Harbor Waters Page 40
calculations, then 100 percent of indices calculations should be reviewed. Results of the QC
checks should be presented as part of a QA/QC report attached to any SQO assessments
conducted.
7.4 Fish Tissue
The laboratory will receive 12 whole fish per station per species. Three composites of four
fish will be used for analysis. Individual fish will be sexed before processing. White croaker,
California halibut, and shiner surfperch will be filleted, and skin-off muscle fillets will be
analyzed. Fish tissue samples will be analyzed for the following:
Percent lipids
Organochlorine Pesticides (including DDT and its derivatives, chlordane compounds,
dieldrin, and toxaphene)
PCB congeners
Specific compounds to be analyzed and analytical methods and target reporting limits are
provided in Table 19. Sample volumes and preservation techniques for required analyses are
included in Table 12.
7.5 Analyte Lists, Analytical Methods, and Reporting Limits
Analyte lists and target reporting limits for water, sediment, and fish tissue are identified in
Tables 17, 18, and 19, respectively. Analytical methods and target detection limits were
selected to comply with SWAMP guidance (SWRCB 2008). The analyte list for sediments
includes the recommended chemical analytes needed to calculate the chemistry exposure
line of evidence for application of the California sediment quality assessment framework
(SWRCB 2009).
The laboratory should report detected compounds down to the MDL, if applicable.
Laboratories should also provide the instrument verified limit of detection (LOD) for each
analyte in the lab report and EDD. Reported values between the MDL and method reporting
limit (MRL) should be qualified with a “J.” Non-detects should be reported at the lowest
calibration level (typically the MRL) or LOD, whichever is lower. In some cases, non-detects
may be reported at the MDL.
Field Measurements and Analytical Methods (Element B04)
Coordinated Compliance, Monitoring, and Reporting Plan June 2013 Greater Los Angeles and Long Beach Harbor Waters Page 41
7.6 Laboratory Turn Around Times
Turnaround times for laboratory analyses are presented in Table 20.
Coordinated Compliance, Monitoring, and Reporting Plan June 2013 Greater Los Angeles and Long Beach Harbor Waters Page 42
8 QUALITY OBJECTIVES AND CRITERIA (ELEMENT A7)
8.1 Field Measurements
Guidance for data quality objectives (DQOs) for field measurements is derived from the
SWAMP guidance for water parameters (SWRCB 2008) and from Bight Field Operations
Manual for fish tissue parameters (BCEC 2008). Quality objectives for parameters that will
be measured in the field, including in situ water quality and fish measurements are presented
in Table 21. A description of sediment grab quality objectives and criteria are located in
Bight Field Operations Manual on pages 24 – 25 (2008).
Field measurements will be made in triplicate on five percent of the measurements. Each
result will be recorded along with the average of the three results, the difference between
the largest and smallest result, and the percent difference between the largest and smallest
result. The percent difference will be calculated as follows:
Percent difference = 100*(largest-smallest)/average
Triplicate measurements, the average of the results, and percent difference will be recorded
on the field data sheet. The percent difference, as appropriate, will be compared against the
precision criteria established for field measurements in Table 21. If precision does not meet
the established criteria the equipment should be inspected to ensure that it is working
properly. Re-calibrate equipment if necessary and then repeat the triplicate measurements
process until DQOs are achieved.
8.2 Laboratory Analyses
It is critical to ensure that the data collected are of acceptable quality so that the project
objectives for each special study or monitoring program sampling are achievable. Guidance
for laboratory DQOs is derived from the SWAMP guidance (SWRCB 2008). The quality of
the laboratory data are assessed by precision, accuracy, representativeness, comparability,
completeness, and sensitivity.
Quality Objectives and Criteria (Element A7)
Coordinated Compliance, Monitoring, and Reporting Plan June 2013 Greater Los Angeles and Long Beach Harbor Waters Page 43
The definitions for the data quality indicators are as follows:
Precision is the ability of an analytical method or instrument to reproduce its own
measurement. It is a measure of the variability, or random error, in sampling, sample
handling, and laboratory analysis.
Accuracy is a measure of the closeness of an individual measurement (or an average of
multiple measurements) to the true or expected value.
Representativeness expresses the degree to which data accurately and precisely
represent an environmental condition. Examples of how representativeness will be
assessed and controlled for include generating analyte lists from known contaminants
of concern, field observations made during sample collection, and analytical methods
evaluated during data validation.
Comparability expresses the confidence with which one dataset can be evaluated in
relation to another dataset. For this program, comparability of data will be
established through the use of standard analytical methodologies and reporting
formats, and of common traceable calibration and reference materials.
Completeness is a measure of the amount of data that is determined to be valid in
proportion to the amount of data collected.
Sensitivity is related to the instrument calibration low level standard, method
detection limits (MDLs), and/or estimated detection limits (EDLs). For each study,
analytical methods will be selected to achieve reporting limits that comply with, or
are close to, target detection limits.
Chemistry laboratory data quality objectives are presented in Table 22. Sediment toxicity
and benthic community data quality objectives are provided in Table 23.

Coordinated Compliance, Monitoring, and Reporting Plan June 2013 Greater Los Angeles and Long Beach Harbor Waters Page 44
9 SPECIAL TRAINING AND CERTIFICATIONS (ELEMENT A8)
For sample preparation tasks, field crews will be trained in standardized sample collection
requirements so that the samples collected and the data generated from the samples are
consistent among field crews. The field coordinator must ensure that all field crew members
are fully trained in the collection and processing of sediment, surface water, tissues,
decontamination protocols, and sample transport and COC procedures.
Supplemental information related to field sampling and laboratory analyses is provided in
Table 24. All field personnel are responsible for complying with quality assurance/quality
control requirements that pertain to their organizational and technical function. Each field
staff member must have a combination of experience and education to adequately
demonstrate a specific knowledge of their particular function. Analytical laboratories must
be certified by the California ELAP and/or NELAP for the analyses they are responsible for
performing.
Coordinated Compliance, Monitoring, and Reporting Plan June 2013 Greater Los Angeles and Long Beach Harbor Waters Page 45
10 DOCUMENTATION AND RECORDS (ELEMENT A9)
Document requirements for field records and laboratory reports are provided in Section 16 –
Data Management. Each project team member (field coordinator, QA manager, etc.) is
responsible for documenting all necessary project information and should maintain files for
individual tasks. Upon completion of each sampling event, project team members must
provide electronic copies of such files to the Harbor Toxics TMDL project manager.
Electronic documents will be maintained by the managing consultant and RMC.
Coordinated Compliance, Monitoring, and Reporting Plan June 2013 Greater Los Angeles and Long Beach Harbor Waters Page 46
11 QUALITY CONTROL (ELEMENT B05)
Procedures and formulas for calculating quality control results can be found in the SWAMP
Manual (SWRCB 2008). Section 8 describes what should be done if control limits are
exceeded and how corrective actions will be assessed and documented. Precision and bias
are also discussed in Section 8. This section identifies quality control activities, including
blanks, spikes, and duplicates and provides a definition of the various QA/QC related terms.
11.1 Field Quality Assurance/Quality Control Samples
Field QA/QC samples will be collected along with environmental samples. Field QA/QC
samples are useful in identifying possible problems resulting from sample collection or
sample processing in the field. The collection of field QA/QC samples will follow SWAMP
guidance and may include field (homogenization) duplicates, rinsate (equipment) blanks,
and/or field blanks (SWRCB 2008). Rinsate blanks will be collected by pouring distilled
water into a decontaminated grab sampler and poured into an appropriate bottle. Field
blanks are required whenever samples for trace metals analysis are being collected. The field
blank will be prepared by pouring distilled water for its original container into a sample
bottle while in the field; this sample will be analyzed for metals. The field duplicate will be
collected and analyzed in the same manner as the original sample immediately following the
collection of the original sample. Field QA/QC sample frequencies and performance criteria
are presented in Table 25.
11.2 Laboratory Quality Assurance/Quality Control
Additional sample volume will be collected to ensure that the laboratory has sufficient
sample volume to run the program-required analytical QA/QC samples for analysis, as
specified in Table 26.
11.2.1 Laboratory Quality Control Definitions
Laboratory QA/QC definitions are identified in Table 27.
Coordinated Compliance, Monitoring, and Reporting Plan June 2013 Greater Los Angeles and Long Beach Harbor Waters Page 47
12 INSTRUMENT/EQUIPMENT TESTING, INSPECTION, AND MAINTENANCE
(ELEMENT B06)
This section describes procedures for testing, inspection, and maintenance of field and
laboratory equipment. A summary is provided in Table 28.
12.1 Field Instruments/Equipment
The field coordinator or designee will maintain inventories of field instruments and
equipment and will be responsible for the preparation, documentation, and implementation
of preventative maintenance. The frequency and types of maintenance will be based on the
manufacturer’s recommendations and/or previous experience with the equipment. The
frequency of maintenance is dependent on the type and stability of the equipment, the
methods used, the intended use of the equipment, and the recommendations of the
manufacturer. Detailed information regarding the calibration and frequency of equipment
calibration is provided in specific manufacturer’s instruction manuals.
The field coordinator or designee will also be responsible for navigation and will confirm
proper operation of the navigation equipment daily. This verification may consist of internal
diagnostics or visiting a location with known coordinates to confirm the coordinates
indicated by the navigation system. The samplers will be inspected daily for any mechanical
problems. Any problems will be noted in the field logbook and corrected prior to continuing
sampling operations.
12.2 Laboratory Instruments/Equipment
The selected laboratories will maintain an inventory of instruments and equipment and the
frequency of maintenance will be based on the manufacturer’s recommendations and/or
previous experience with the equipment.
Selected laboratories will have a preventative maintenance program, as detailed in their QA
Plans, organized to maintain proper instrument and equipment performance, and to prevent
instrument and equipment failure during use. The program considers instrumentation,
equipment, and parts that are subject to wear, deterioration, or other changes in operational
characteristics, the availability of spare parts, and the frequency at which maintenance is
Instrument/Equipment Testing, Inspection, and Maintenance (Element B06)
Coordinated Compliance, Monitoring, and Reporting Plan June 2013 Greater Los Angeles and Long Beach Harbor Waters Page 48
required. Any equipment that has been overloaded, mishandled, shown to give suspect
results, determined to be defective will be taken out of service, or tagged with the
discrepancy note, will be stored in a designated area until the equipment has been repaired.
After repair, the equipment will be tested to ensure that it is in proper operational condition.
The QA manager will be promptly notified in writing if defective equipment casts doubt on
the validity of analytical data. The QA manager will also be notified immediately regarding
any delays due to instrument malfunctions that could impact holding times. Selected
laboratories will be responsible for the preparation, documentation, and implementation of
the preventative maintenance program. All maintenance records will be checked according
to the schedule on an annual basis and recorded by the responsible individual. A laboratory
QA/QC manager or designee shall be responsible for verifying compliance.
Coordinated Compliance, Monitoring, and Reporting Plan June 2013 Greater Los Angeles and Long Beach Harbor Waters Page 49
13 INSTRUMENT/EQUIPMENT CALIBRATION AND FREQUENCY (ELEMENT B07)
Proper calibration of equipment and instrumentation is an integral part of the process that
provides quality data. Instrumentation and equipment used to generate data must be
calibrated at a frequency that ensures sufficient and consistent accuracy and reproducibility.
13.1 Field Equipment
Field equipment will be calibrated prior to the sampling event according to manufacturer’s
recommendations using manufacturer’s standards. A calibration check will be performed at
the beginning of each day. The equipment, calibration, and maintenance information will be
documented in the instrument calibration log. The frequency of calibration is dependent on
the type and stability of the equipment, the methods used the intended use of the equipment,
and the recommendations of the manufacturer. Detailed information regarding the
calibration and frequency of equipment calibration is provided in specific manufacturer’s
instruction manuals. Equipment that fails calibration will be recalibrated prior to use.
Supplemental information is provided in Table 29.
13.2 Analytical Laboratory Equipment
As part of their QC program, selected laboratories will perform two types of calibrations. A
periodic calibration is performed at prescribed intervals for relevant instruments and
laboratory equipment (i.e., balances, drying ovens, refrigerators, and thermometers), and
operational calibrations are performed daily, at a specified frequency, or prior to analysis
(i.e., initial calibrations) according to method requirements. Calibration procedures and
frequency are discussed in the laboratory QA Plan. Calibrations are discussed in the
laboratory SOPs for analyses.
The laboratory QA/QC manager will be responsible for ensuring that the laboratory
instrumentation is calibrated in accordance with specifications. Implementation of the
calibration program shall be the responsibility of the respective laboratory manager.
Recognized procedures (USEPA, ASTM, or manufacturer’s instructions) shall be used when
available.
Instrument/Equipment Calibration and Frequency (Element B07)
Coordinated Compliance, Monitoring, and Reporting Plan June 2013 Greater Los Angeles and Long Beach Harbor Waters Page 50
Physical standards (i.e., weights or certified thermometers) shall be traceable to nationally
recognized standards such as the National Institute of Standards and Technology (NIST).
Chemical reference standards shall be NIST standard reference materials (SRMs) or vendor-
certified materials traceable to these standards.
The calibration requirements for each method and respective corrective actions shall be
accessible, either in the laboratory SOPs or the laboratory’s QA Plan for each instrument or
analytical method in use. An instrument that fails calibration will be recalibrated prior to
use. All calibrations shall be preserved on electronic media.
Coordinated Compliance, Monitoring, and Reporting Plan June 2013 Greater Los Angeles and Long Beach Harbor Waters Page 51
14 INSPECTION/ACCEPTANCE OF SUPPLIES AND CONSUMABLES (ELEMENT B08)
14.1 Field
Equipment and supplies purchased for use in field sampling will be inspected for damage as
they are received. Confirmation that sample bottles are laboratory-certified clean will be
made when received.
14.2 Analytical Laboratories
Equipment and supplies purchased for use in analytical laboratories will be inspected for
damage as they are received. Supplies purchased from outside sources must be of adequate
quality to sustain confidence in the laboratory’s test. If no independent quality assurance of
outside supplies is available, the laboratory will first perform tests with the new supplies to
be sure they comply with specified requirements.
Coordinated Compliance, Monitoring, and Reporting Plan June 2013 Greater Los Angeles and Long Beach Harbor Waters Page 52
15 NON‐DIRECT MEASUREMENTS (ELEMENT B09)
Measurements of tide are being provided by the National Oceanic and Atmospheric
Administration (NOAA 2013). When in the Port of Los Angeles, use Los Angeles, California,
tide gauge 9410660. When in Port of Long Beach or San Pedro Bay, use Long Beach
Terminal Island tide gauge 9410680. Tide predictions are assumed to be accurate. No other
non-direct measurements are anticipated for this project.
Coordinated Compliance, Monitoring, and Reporting Plan June 2013 Greater Los Angeles and Long Beach Harbor Waters Page 53
16 DATA MANAGEMENT (ELEMENT B10)
16.1 Overview of Data Management Process
Data will be stored in a customizable database program called EQuisS (version 5, EarthSoft
2013), maintained by the managing consultant. After each field event, field data will be
imported into the EQuIS database either by direct import using a custom field application
export or manual submittal of a field EDD containing information from field collection logs
(Figure 8). Field data collection and management options are described below, along with
field EDD requirements. Water quality data will be exported into an EDD format compatible
with the 2012 NPDES MS4 permit (RWQCB 2012), specifically the Southern California
Storm Water Monitoring Coalition’s Standardized Data Transfer Formats, or any
subsequently revised RWQCB required format. These field data will undergo quality control
checks such as sample identification code review, transcription error review, and
completeness verification. Independent of the field data, laboratory data will be submitted to
the QA manager in specified PDF and EDD formats. This data will undergo verification and
validation using Automated Data Review (ADR) software and then will be uploaded into the
EQuIS database with the applied final validation qualifiers. These two datasets will be linked
in the database to retain corresponding field data for each sample. Data will be exported
from EQuIS in custom formats to meet agency database requirements.
16.2 Field Records
All collected field samples will be documented using a custom field application or field
collection logs that will be manually converted to a field EDD prior to data submittal.
Additionally, the field coordinator or designee will keep a daily record of significant events,
observations, and measurements on a daily log. Entries for each day will begin on a new
page. The person recording information must enter the date and time and initial each entry.
In general, sufficient information will be recorded during sampling so that reconstruction of
the event can occur without relying on the memory of the field personnel. The daily log will
contain the following information, at a minimum:
Project name
Field personnel on site
Site visitors
Weather conditions
Data Management (Element B10)
Coordinated Compliance, Monitoring, and Reporting Plan June 2013 Greater Los Angeles and Long Beach Harbor Waters Page 54
Field observations
Maps and/or drawings
Date and time sample collected
Sampling method and description of activities
Identification or serial numbers of instruments or equipment used
Deviations from the PQAPP, CCMRP, and SAP
Conferences associated with field sampling activities
After each field event, field data will be imported into the EQuIS database either by direct
import using a custom field application export or manual submittal of a field EDD containing
information from field collection logs. The field data collection and management options are
described below along with field EDD requirements.
16.2.1 Water
Refer to SWAMP SOP (MPSL-DFG 2007) for standardized language for taking notes. Upon
arrival at a sampling site, record visual observations on the appearance of the water and other
information related to water quality and water use. A field data sheet will be completed for
each water sample collection location. The field form should indicate sample time and
where the sample was collected within the water column (i.e., surface, mid-depth, or
bottom). Required data for field EDDs is included as Appendix B.
At a minimum each field data sheet will include the name of personnel, date, time, location
coordinates (measured by DGPS), weather (e.g., heavy rains, cold front, very dry, very wet),
wind speed and direction (see Beaufort Scale as presented in MPSL-DFG 2007), collection
depth, physical description of the water sample (e.g., suspended of floating material, color,
odor, or sheen), biological activity (e.g., presence of fish, birds, macrophytes, phytoplankton),
description of in-water activities (e.g., recreational boating, active discharges), and the water
quality parameter measurements. If the water quality conditions are exceptionally poor,
note that standards are not met in the observations, (e.g., dissolved oxygen is below state
criteria).
Data Management (Element B10)
Coordinated Compliance, Monitoring, and Reporting Plan June 2013 Greater Los Angeles and Long Beach Harbor Waters Page 55
Continuous water quality monitoring data collected will be saved in raw format on the field
laptop and also saved to a dedicated project file currently maintained by the managing
consultant. After completion of each sampling event, data will be transferred to the RMC.
16.2.2 Sediment
A surface sediment collection form will be completed for each grab sediment sample.
Required data for field EDDs is included as Appendix B. In addition to standard entries of
personnel, date, and time, the form will include information regarding station coordinates,
grab sampler penetration, and physical characteristics of the sediment, such as texture, color,
odor, and sheen.
A representative grab sample from each location will be photographed. Project, sample
identification number, attempt number (if more than one attempt), and sample date and time
will be labeled on a white board and included in each photograph.
16.2.3 Fish Tissue
Several datasheets will be utilized in association with fish tissue collection at each location.
Required data for field EDDs is included as Appendix B. Data should be collected to include
general trawl information and individual fish data, including length, weight, and gross
pathology.
16.3 Field Data Option 1: Custom Field Application
Electronic Field EDDs can be generated from a custom field application that provides
electronic data entry forms for field information and generates field collection logs, sample
labels, and eCOCs. A custom field application improves data quality by minimizing
handwritten errors through the use of required data entry elements and controlled, unique
identifiers for locations, samples, and analytical test requests. In addition, it promotes
efficiency in the field and provides eCOCs for laboratory sample check-in and for loading
field information to the managing consultant’s data management system, further reducing
transcription errors. When a custom field application is used in place of field collection logs,
all information and generated forms are backed up to removable storage devices and should
be emailed to the QA manager at the end of each field day for data security. The same
Data Management (Element B10)
Coordinated Compliance, Monitoring, and Reporting Plan June 2013 Greater Los Angeles and Long Beach Harbor Waters Page 56
elements required for the field logs described in Section 16.4 would be captured in the
custom field application. To use this application, the field coordinator should coordinate
with the QA manager.
16.4 Field Data Option 2: Field Collection Logs
All field sample collection information will be recorded on field collection logs maintained
by the field coordinator, or designee, for each activity. Key information should be recorded
for each sample such as sample station, station coordinates, sample identification code, and
sample matrix. The information recorded during sample collection should fulfill the
requirements of the Field EDD described in Section 16.5.
Notes will be taken in indelible, waterproof blue or black ink. Errors will be corrected by
crossing out with a single line, dating, and initialing. Each field collection log will be marked
with the project name, number, and date. The field logs will be will be scanned at the end of
each field day and emailed to the special study/monitoring study project manager.
16.5 Field Electronic Data Deliverable Requirements
Field data collection, including observations, field measurements, and sample generation,
will be facilitated by submittal of a Field EDD generated from the custom field application or
field collection logs. Field data must be submitted to the managing consultant. It is
imperative that the field sample data match field forms and the COC forms. The Field EDD
template (Excel workbook format) will be provided by the QA manager upon request.
Required, conditional, and optional fields will be identified in the Field EDD template along
with defined valid values. Required fields must be filled out prior to submittal of field data.
Conditional fields are required for specific matrices, collection methods, or if a field QC
sample is collected. Optional fields may be populated at the field coordinator’s discretion.
Columns may be left blank but should not be deleted. Any questions with regards to filling
out the Field EDD should be directed to the QA manager.
16.6 Laboratory Record Requirements
Analytical data records (bookmarked PDF and EDD formats) will be generated by the
laboratory and submitted to the managing consultant upon completion. If the files are too
Data Management (Element B10)
Coordinated Compliance, Monitoring, and Reporting Plan June 2013 Greater Los Angeles and Long Beach Harbor Waters Page 57
large to be emailed, a notification email with download instructions can be sent to the
managing consultant. The data package level will depend on the sampling event. The field
coordinator or QA manager will identify the required data package level on the COC.
The analytical laboratory will be required to report the following, where applicable:
Case Narrative. This summary will discuss problems encountered during any aspect
of analysis, if any. It should discuss, but is not be limited to, QC issues, sample
shipment, sample storage, and analytical difficulties. Any problems encountered,
actual or perceived, and their resolutions will be documented in as much detail as
appropriate. Analytical QC samples that exceed project performance criteria and/or
lab performance criteria should also be discussed in the case narrative.
COC Records. Legible copies of the COC forms will be provided as part of the data
package. This documentation will include the time of receipt and condition of each
sample received by the laboratory. Additional internal tracking of sample custody by
the laboratory will also be documented on a sample receipt form. The form must
include all sample shipping container temperatures measured at the time of sample
receipt.
Sample Results. The data package will summarize the results for each sample
analyzed. The summary will include the following information when applicable:
Field sample identification code and corresponding laboratory identification code
Sample matrix
Date and time of sample extraction
Date and time of analysis
Final concentration volumes and dilution factors
Instrument and analyst identification
MRLs and MDLs accounting for sample-specific factors (e.g., dilution and total
solids)
Analytical results with reporting units identified
Data qualifiers and their definitions
Raw data including instrument printouts, chromatograms, and bench sheets
(required for full data packages)
Data Management (Element B10)
Coordinated Compliance, Monitoring, and Reporting Plan June 2013 Greater Los Angeles and Long Beach Harbor Waters Page 58
QA/QC Summaries. Contract Laboratory Program (CLP)-like form summaries should
be generated for all required laboratory QC components and samples (e.g., method
blanks, instrument daily tunes, surrogate spikes, internal standards, laboratory control
samples). These summaries should include spike volumes, parent sample
concentrations, percent recoveries, relative percent differences, area counts, and
laboratory control limits as applicable. For full data packages, the associated raw data
files should be included.
Instrument Calibration Data. CLP-like form summaries of calibration data (i.e., initial
calibration, initial calibration verification, and continuing calibration verification)
should be included in all data packages. For full data packages, the associated raw
data files should be included.
All instrument data shall be fully restorable at the laboratory from electronic backup.
Laboratories will be required to maintain all records relevant to project analyses for a
minimum of 5 years.
16.7 Laboratory Electronic Deliverable Requirements
EDDs will be submitted by the lab in the ADR format. ADR software is a tool used to
streamline data validation by automatically evaluating the laboratory QC samples to the
performance criteria established in this CCMRP. A1 and A3 files will be required.
Specifications and valid values can be found in Appendix C. An ADR electronic QAPP will
be developed and distributed to the laboratories as required prior to project implementation.
Updates to the specifications, valid values, and electronic QAPPs will occur over time and
will be distributed to the laboratories when they become available.
Coordinated Compliance, Monitoring, and Reporting Plan June 2013 Greater Los Angeles and Long Beach Harbor Waters Page 59
17 ASSESSMENT AND RESPONSE ACTIONS (ELEMENT C1)
The following sections describe the types of assessments that may be conducted for this
project and how these assessments will be reported to project management.
17.1 Assessments and Response Actions
Laboratory and field performance audits consist of on-site reviews of QA systems and
equipment for sampling, calibration, and measurement. The field coordinator is responsible
for assessment of field activities and has the authority to issue a stop work order on sample
collection. The Harbor Toxics TMDL study project manager or designee provides additional
oversight on all field and laboratory activities and consequently may also issue a stop work
order on sample collection if warranted. Laboratory audits are not anticipated to be
conducted as part of this study; however, all laboratory audit reports will be made available
to the project QA manager upon request. The laboratory is required to have written
procedures addressing internal QA/QC (i.e., QA Plan), which will be reviewed by the project
QA manager to ensure compliance with the project SAP. The laboratory must ensure that
personnel engaged in sampling and analysis tasks have appropriate training. As part of the
audit process, the laboratory will provide written details of any and all method modifications
planned for consultant’s review. Laboratory non-conformances will be documented and
submitted to the QA manager for review. All non-conformances will be discussed in the
final data report.
17.2 Corrective Actions
The following sections identify the responsibilities of key project team members and actions
to be taken in the event of an error, problem, or nonconformance to protocols identified in
this document.
17.2.1 Field Activities
The field coordinators will be responsible for correcting equipment malfunctions during the
field sampling effort. The project QA manager will be responsible for resolving situations
identified by the field coordinators that may result in noncompliance with this SAP. All
corrective measures will be immediately documented in the field logbook.
Assessment and Response Actions (Element C1)
Coordinated Compliance, Monitoring, and Reporting Plan June 2013 Greater Los Angeles and Long Beach Harbor Waters Page 60
17.2.2 Laboratory
The laboratory is required to comply with their SOPs. The laboratory manager will be
responsible for ensuring that appropriate corrective actions are initiated as required for
conformance with this CCMRP. All laboratory personnel will be responsible for reporting
problems that may compromise the quality of the data.
The laboratory project manager will be notified immediately if any QC sample grossly
exceeds the laboratory in-house control limits. The analyst will identify and correct the
anomaly before continuing with the sample analysis. If the anomaly cannot be corrected,
the laboratory manager will document the corrective action taken in a memorandum
submitted to the QA manager within 5 days of the initial notification. A narrative describing
the anomaly, the steps taken to identify and correct the anomaly, and the treatment of the
relevant sample batch (i.e., recalculation, reanalysis, and re-extraction) will be submitted
with the data package.
Coordinated Compliance, Monitoring, and Reporting Plan June 2013 Greater Los Angeles and Long Beach Harbor Waters Page 61
18 REPORTS TO MANAGEMENT (ELEMENT C2)
QA reports to management will include verbal status reports, written reports on field
sampling activities and laboratory processes, data validation reports, and final project reports.
These reports shall be the responsibility of the Harbor Toxics TMDL study project manager.
Progress reports will be prepared by the field coordinators and delivered to the Harbor
Toxics TMDL study Project manager following each sampling event. These progress reports
will contain final versions (peer reviewed) of field logs, field notebooks, COCs, observations,
etc.
Coordinated Compliance, Monitoring, and Reporting Plan June 2013 Greater Los Angeles and Long Beach Harbor Waters Page 62
19 DATA REVIEW, VERIFICATION, AND VALIDATION (ELEMENT D1)
During the validation process, analytical data will be electronically and/or manually
evaluated for method and laboratory QC compliance, and their validity and applicability for
program purposes will be determined.
Based on the findings of the validation process, data validation qualifiers may be assigned.
The validated project data, including qualifiers, will be entered into the project database,
thus enabling this information to be retained or retrieved, as needed.
Coordinated Compliance, Monitoring, and Reporting Plan June 2013 Greater Los Angeles and Long Beach Harbor Waters Page 63
20 VERIFICATION AND VALIDATION METHODS (ELEMENT D2)
Data verification includes a review for completeness and accuracy by the field coordinator
and laboratory manager; review by the data managers for outliers and omissions; and the use
of performance criteria to identify laboratory quality control sample outliers. For this
program, completeness checks (target analyte lists, etc.), holding time compliance and
laboratory QC sample performance evaluations (method blank detections, surrogate
recoveries, laboratory control sample recoveries, etc.) will be conducted with ADR software.
ADR will generate a report of all results that are outside of the performance criteria
presented in this CCMRP. Data validation will then be conducted by the data validator and
consists of accepting, rejecting, or applying qualifiers to data based on the ADR verification
findings, analytical method criteria, NFG data validation guidance (USEPA 1999, 2004, 2005,
2008), and professional judgment. A data validation report will be generated to document
qualifications applied to data. All validated data will be entered into the EQuIS database, and
a final data file will be exported. Verification of the database export against the PDF data
report will be performed by the QA manager or designee. Any errors found in the data file
export will be corrected in the database and reviewed for systemic reporting errors. Once all
discrepancies are resolved, the database will be established.
All laboratory data will receive a Stage 2A validation (USEPA 2009). The recommended QC
checks identified in a Stage 2A validation are as follows:
Completeness
Holding times
Requested methods were performed
MRL/EDL project requirements were met
Sample-related QC data were analyzed at the required frequencies
QC performance criteria were met for the following:
Laboratory control samples
Matrix spike/matrix spike duplicate
Standard reference material
Surrogate recoveries
Method blanks
Field QC samples
Verification and Validation Methods (Element D2)
Coordinated Compliance, Monitoring, and Reporting Plan June 2013 Greater Los Angeles and Long Beach Harbor Waters Page 64
The project QA manager will be responsible for the final review of all data generated from
analyses of samples.
Coordinated Compliance, Monitoring, and Reporting Plan June 2013 Greater Los Angeles and Long Beach Harbor Waters Page 65
21 RECONCILIATION WITH USER REQUIREMENTS (ELEMENT D3)
The QA manager will review data at the completion of each task to determine if DQOs have
been met. If data do not meet the project’s specifications, the QA manager will review the
errors and determine if the problem is due to calibration/maintenance, sampling techniques,
or other factors and will suggest corrective action, if appropriate. It is expected that the
problem would be able to be corrected by retraining, revision of techniques, or replacement
of supplies/equipment; if not, the DQOs will be reviewed for feasibility. If specific DQOs are
not achievable, the QA manager will recommend appropriate modifications. If matrix
interference is suspected to have attributed to the exceedance, adequate laboratory
documentation must be presented to demonstrate that instrument performance and/or
laboratory technique did not bias the result. In cases where the DQOs have been exceeded
and corrective actions did not resolve the outlier, data will be qualified per USEPA National
Functional Guidelines (USEPA 1999, 2004, 2005, 2008). In these instances, the usability of
the data will be determined by the extent of the exceedance. Rejected data will be assigned
an “R” qualifier and will not be used for any purposes.

Coordinated Compliance, Monitoring, and Reporting Plan June 2013 Greater Los Angeles and Long Beach Harbor Waters Page 66
22 SEDIMENT QUALITY OBJECTIVES PART 1 – STRESSOR INVESTIGATIONS
The SQO Part 1 assessment process categorizes sediment quality and associated benthic
health based on MLOE; however, it does not identify the cause of impacts, if present, to the
benthic community. For stations that do not meet the SQO for aquatic life (i.e., for stations
categorized as Possibly Impacted, Likely Impacted, or Clearly Impacted), the SQO Part 1
Technical Guidance recommends additional investigations in order to identify the cause of
sediment impacts (Bay et al. 2009). Table 30 provides a summary of possible outcomes from
the integration of three LOEs (sediment chemistry, sediment toxicity, and benthic
community).
The Harbor Toxics TMDL mandates, “if moderate toxicity as defined in the SQO Part 1 is
observed, results shall be highlighted in annual reports and further analysis and evaluation to
determine causes and remedies shall be required in accordance with the EO approved
monitoring plan.” This CCMRP recommends a modified approach to stressor investigations.
Stressor investigations will be conducted if the SQO Part 1 station assessment results in a
final category of Likely Impacted or Clearly Impacted. Stressor investigations may be
considered if the SQO Part 1 station assessment results in a final category of Possibly
Impacted. This recommendation is predicated on three points:
Compliance with the Harbor Toxics TMDL may be demonstrated by meeting (i.e.,
final station assessment is Unimpacted or Likely Unimpacted) the SQO Part 1
Stations may be categorized as Unimpacted or Likely Unimpacted even if moderate
toxicity is observed
Stations may be categorized as Possibly Impacted of Likely Impacted even if no or low
toxicity is observed
Attainment of the Harbor Toxics TMDL is the ultimate goal. Stressor investigation studies,
as recommended in the SQO Part 1 Technical Guidance (Bay et al. 2009), will more
effectively benefit the objectives of the Harbor Toxics TMDL when the SQO Part 1
assessment is not met; rather than when it has been met but moderate toxicity is still
observed.
Sediment Quality Objectives Part 1 – Stressor Investigations
Coordinated Compliance, Monitoring, and Reporting Plan June 2013 Greater Los Angeles and Long Beach Harbor Waters Page 67
The SQO Part 1 Technical Guidance (Bay et al. 2009) recommends a phased approach to
stressor identification, including:
Confirmation that pollutants are indeed the basis for the impact – determine that the
benthic community is not impaired due to confounding factors such as physical
disturbance or non-pollutant constituents
Establishment of what specific chemical(s) is the cause of impact – using either
statistical analyses, laboratory toxicity identification evaluations (TIEs), or
bioavailability analyses, determine the specific chemical(s) causing impairment; then,
confirm initial results
Identification of the source of the chemical(s) – conduct additional field
investigations to determine source of contaminants causing impairment
In the event sediment quality is categorized as impaired in accordance with SQO Part I, the
results will be evaluated to determine the feasibility and scale of a stressor identification
study. For example, instead of conducting a separate stressor identification study for each
station, it may be more effective to conduct a single stressor identification study for a region
if multiple stations located in relative proximity exhibited similar impairments. A site-
specific monitoring and reporting plan (separate from this document) will be developed and
submitted for approval prior to commencement of investigations. Site-specific monitoring
and report plans will address each phase of a stressor identification study (Bay et al. 2009)
and will include the following components:
Sample Methodology – when, where, why, and how confirmatory samples will be
collected and analyzed
Quality Assurance/Quality Control – methodology to ensure samples are collected,
analyzed and evaluated according to the Harbor Toxics TMDL program established
standards
Coordinated Compliance, Monitoring, and Reporting Plan June 2013 Greater Los Angeles and Long Beach Harbor Waters Page 68
23 REFERENCES
Allen, M.J., 1990. The Biological Environment of the California halibut, Paralichtys
californicus. CADFW Fish Bulletin174: The California Halibut, Paralichtys
californicus, Resource and Fisheries. Available from:
http://www.oac.cdlib.org/view?docId=kt2q2n98z7&brand=oac4&doc.view=entire_tex
t.
Anchor QEA, L.P., 2013. Programmatic Quality Assurance Project Plan Supporting
Compliance Monitoring and Special Studies Related to the Harbor Toxics Total
Maximum Daily Load. January 2013.
Anderson et al. (Anderson B.S., J.W. Hunt, M. Hester, B.M. Phillips), 1996. Assessment of
Sediment Toxicity at the Sediment-water Interface. In: G.K. Ostrander (ed.)
Techniques in Aquatic Toxicology. Lewis Publishers, Ann Arbor, MI.
Bay et al. (Bay, S.M., D.J. Greenstein, J.A. Ranasinghe, D.W. Diehl, and A.E. Fetscher), 2009.
Sediment Quality Assessment Draft Technical Support Manual. Technical Report
582. Southern California Coastal Water Research Project. May 2009.
BCEC (Bight Coastal Ecology Committee), 2008. Southern California Bight 2008 Regional
Marine Monitoring Survey (Bight ’08) Field Operations Manual. July 2008.
BCEC, 2009. Southern California Bight 2008 Regional Marine Monitoring Survey (Bight ’08)
Bioaccumulation Workplan. July 2009.
CDFG (California Department of Fish and Game), 2001. White Croaker. California’s Marine
Living Resources: A Status Report. December 2001.
CDFG, 2002. Life History Database. Biological Characteristics of Nearshore Fishes of
California. Version 1.0. October 25, 2002. Available from:
http://www.dfg.ca.gov/marine/lifehistory.asp.
CDFW (California Department of Fish and Wildlife), 2013a. Marine Sportfish Identification.
Available from: http://www.dfg.ca.gov/marine/mspcont8.asp.
CDFW, 2013b. Collecting and Research Take Permits. Available from:
http://www.dfg.ca.gov/wildlife/nongame/research_permit/.
EarthSoft, 2013. EQuiS database. Version 5. Available from:
http://www.earthsoft.com/products/professional/.
References
Coordinated Compliance, Monitoring, and Reporting Plan June 2013 Greater Los Angeles and Long Beach Harbor Waters Page 69
FCEC (Fish Contamination Education Collaborative), 2013. California Fishing, Pier Fishing.
Cited: May 14, 2013. Available from: http://www.pvsfish.org/index.php/pier-fishing.
FGC (Fish and Game Commission), State of California, 2012. 2012 – 2013 California Ocean
Sport Fishing Regulations Section 28.15, California Code of Regulations.
Journal of Commerce, 2012. The JOC Top 50 World Container Ports. Special Report.
August 2012. MEC (MEC Analytical, Inc.), 1998. Biological Baseline and an
Ecological Evaluation of Existing Habitats in Los Angeles Harbor and Adjacent Water.
Prepared for the Port of Los Angeles Environmental Management Division.
September 1998.
MEC (MEC Analytical Systems, Inc.), 1988. Biological Baseline and Ecological Evaluation of
Existing Habitats in Los Angeles Harbor and Adjacent Waters. Final
Report. Prepared for Port of Los Angeles.
MEC, 2002. Ports of Long Beach and Los Angeles Year 2000 Biological Baseline Study of San
Pedro Bay. Prepared for the Port of Long Beach Planning Division. Long Beach,
California. June 2002.
Moore, S.L., 1999. Age and Growth of White Croaker (Genyonemus lineatus) off Palos
Verdes and Dana Point, California. SCCWRP 1999-2000 Annual Report.
MPSL-DFG (Marine Pollution Studies Laboratory – Department of Fish and Game), 2001.
Standard Operating Procedure (SOP) for Field Collections of Organisms for Tissue
Specimens for Analysis of Trace Metals and Synthetic Organic Compounds. Part of
SWAMP Appendix D. July 20, 2001.
MPSL-DFG, 2007. Standard Operating Procedures (SOPs) for Conducting Field
Measurements and Field Collections of Water and Bed Sediment Samples in SWAMP.
October 2007.
Nautilus Environmental, 2009. Toxicological Testing and Analytical Chemistry Summary for
the Ports of Los Angeles and Long Beach, Bight ’08 Sediment Monitoring Support
DRAFT Report: July – September 2008 Test Series. Prepared for the Port of Los
Angeles and the Port of Long Beach. June 2009.
Nielson, Kenny, 2013. Personal communication between Kenny Neislon of Seaventures,
Inc., and Wendy Hovel of Anchor QEA. May 2013.
References
Coordinated Compliance, Monitoring, and Reporting Plan June 2013 Greater Los Angeles and Long Beach Harbor Waters Page 70
NOAA (National Oceanic and Atmospheric Administration), 2007. 2002 – 2004 Southern
California Coastal Marine Fish Contaminants Survey. Prepared by Industrial
Economics, Inc., on behalf of the National Resource Trustees. June 2007.
NOAA, 2013. Tides and Currents. www.tidesandcurrents.noaa.gov/products.
Odenweller, D.B., 1975. The life history of the shiner surfperch Cyamatogaster aggregata in
Anaheim Bay, California. The Marine resources of Anaheim Bay. Available from:
http://content.cdlib.org/view?docId=kt6n39n885;NAAN=13030&doc.view=frames&ch
unk.id=d0e4240&toc.id=0&brand=calisphere.
OEHHA (Office of Environmental Health Hazard Assessment), 2009. Health Advisory and
Safe Eating Guidelines for Fish from Coastal Areas of Southern California: Ventura
Harbor to San Mateo Point. June 2009.
Pucket, M., 2002. Surface Water Ambient Monitoring Program (SWAMP) Quality
Assurance Management Plan. California Department of Fish and Game. First
version. December 2002.
Ranasinghe, A., 2010. Personal communication with A. Ranasinghe at SCCWRP.
Regarding: Benthic Community Index Calculations. October 18, 2010.
RWQCB (Los Angeles Regional Water Quality Control Board), 2011. Final Basin Plan
Amendment. Attachment A to Resolution No. R11-008. Amendment to the Water
Quality Control Plan – Los Angeles Region to Incorporate the Total Maximum Daily
Load for Toxic Pollutants in Dominguez Channel and Greater Los Angeles and Long
Beach Harbor Waters. Adopted by the California Regional Water Quality Control
Board, Los Angeles Region on May 5, 2011. Available from:
http://www.waterboards.ca.gov/losangeles/board_decisions/basin_plan_amendments/t
echnical_documents/66_New/11_0630/02%20Final%20BPA%2005%2005%2011.pdf.
RWQCB, 2012. Monitoring and Reporting Program – No. CI-6948 for Order R4-2012-0175,
NPDES Permit No. CAS004001 Waste Discharge Requirements for Municipal
Separate Storm Sewer System (MS4) Discharges Within the Coastal Watersheds of Los
Angeles County, Except Those Discharges Originating from the City of Long Beach
MS4 (Attachment E). November 8, 2012.

References
Coordinated Compliance, Monitoring, and Reporting Plan June 2013 Greater Los Angeles and Long Beach Harbor Waters Page 71
RWQCB and USEPA (Los Angeles Regional Water Quality Control Board and U.S.
Environmental Protection Agency), 2011. Final Dominguez Channel and Greater Los
Angeles and Long Beach Harbor Waters Toxic Pollutants Total Maximum Daily
Loads. June 2011.
SAIC (Science Applications International Corporation), 2010. Final 2008 Biological Surveys
of Los Angeles and Long Beach Harbors.
Sempier, S. 2003. Marine Species with Aquaculture Potential (MSAP) off the coast of
Oregon and Pacific Northwest. Accessed on: April 10, 2013. Available from:
http://hmsc.oregonstate.edu/projects/msap/PS/masterlist/.
SCCWRP (Southern California Coastal Water Research Project), 2003. Southern California
Bight 1998 Regional Monitoring Program. Technical Report.
SCCWRP, 2007. Southern California Bight 2003 Regional Monitoring Program. Technical
Report.
SCCWRP, 2008. Determining Benthic Invertebrate Community Condition in Embayments.
January 21, 2008.
http://www.sccwrp.org/Data/DataTools/SedimentQualityAssessment.aspx/.
SCCWRP, 2009. Sediment Quality Assessment Tools. Data Integration Tool v5.4. Updated
October 2009. Available from:
http://www.sccwrp.org/Data/DataTools/SedimentQualityAssessment.aspx/.
SCCWRP and MBC (MBC Applied Environmental Sciences), 1994. Santa Monica Bay
Seafood Consumption Study. Technical Report 273. Prepared for Santa Monica Bay
Restoration Project. Monterey Park, CA. June 1994.
SWRCB (State Water Resources Control Board), 2008. Surface Water Ambient Monitoring
Program Quality Assurance Program Plan (SWAMP). Final Technical Report Version
1. September 2008.
SWRCB, 2009. Water Quality Control Plan for Enclosed Bays and Estuaries – Part I
Sediment Quality. August 25, 2009.
SWRCB and California Environmental Protection Agency (CalEPA), 2009. Water Quality
Control Plan for Enclosed Bays and Estuaries – Part 1 Sediment Quality. August 25,
2009.
References
Coordinated Compliance, Monitoring, and Reporting Plan June 2013 Greater Los Angeles and Long Beach Harbor Waters Page 72
UC (University of California), 2013. California Fish Website. Accessed on: 10 April 2013.
Available from: http://calfish.ucdavis.edu/species/?uid=103&ds=241.
USEPA (U.S. Environmental Protection Agency), 1999. Contract Laboratory Program
National Functional Guidelines for Superfund Organic Methods Data Review.
USEPA, Office of Emergency Response. USEPA 540/R-99/008. October 1999.
USEPA, 2000. Guidance for Assessing Chemical Contaminant Data for Use in Fish
Advisories: Volume 1, Fish Sampling and Analysis, Third Edition. EPA 823-R-93-
002B-00-007. USEPA, Office of Water, Washington, DC.
USEPA, 2004. Contract Laboratory Program National Functional Guidelines for Inorganic
Data Review. USEPA540-R-04-004. October 2004.
USEPA, 2005. National Functional Guidelines for Chlorinated Dibenzo-p-Dioxins and
Chlorinated Dibenzofurans Data Review. OSWER 9240.1-51, USEPA-540-R-05-001.
September 2005.
USEPA, 2007. 2002 – 2004 Southern California Coastal Marine Fish Contaminants Survey.
Prepared under contract 50-DGNC-2-90008. June 2007.
USEPA, 2008. Contract Laboratory Program National Functional Guidelines for Superfund
Organic Methods Data Review. USEPA, Office of Emergency Response. USEPA
540/R-08-01. June 2008.
USEPA, 2009. Guidance for Labeling Externally Validated Laboratory Analytical Data for
Superfund Use. USEPA, Office of Solid Waste and Emergency Response. OSWER
No. 9200.1-85. January 2009.

TABLES

Coordinated Compliance Monitoring and Reporting Plan June 2013 Greater Los Angeles and Long Beach Harbor Waters 120711-01
Table 1 Sediment Quality 303(d) Listings for Harbor Waters
Waterbody Pollutants Requiring TMDL (Sediment and/or Tissue) Other Requirements
Los Angeles/Long Beach Inner Harbor
Tissue: Chlordane, Dieldrin, DDT, PCBs, Toxaphene
Sediment: Metals (Copper, Zinc), Benzo(a)pyrene, Chrysene
Toxicity, benthic community effects
Los Angeles/Long Beach Outer Harbor
Tissue: Chlordane, Dieldrin, DDT, PCBs, Toxaphene
Sediment: None Toxicity
Los Angeles Harbor – Inner Cabrillo Beach
Tissue: Chlordane, Dieldrin, DDT, PCBs, Toxaphene
Sediment: Metals None
Los Angeles Harbor – Cabrillo Marina
Tissue: Chlordane, Dieldrin, DDT, PCBs, Toxaphene
Sediment: Benzo(a)pyrene, Pyrene None
Los Angeles Harbor – Fish Harbor
Tissue: Chlordane, Dieldrin, DDT, PCBs, Toxaphene
Sediment: Metals (Copper, Lead, Mercury, Zinc), Chlordane, DDT, PCBs, PAHs (Benzo[a]pyrene, Phenanthrene, Benzo[a]anthracene, Chrysene,
Pyrene, Dibenzo[a,h]anthracene)
Toxicity
Consolidated Slip
Tissue: Chlordane, Dieldrin, DDT, PCBs, Toxaphene
Sediment: Metals (Cadmium, Copper, Chromium, Lead, Zinc, Mercury), Chlordane, DDT, PCBs, PAHs
(Benzo[a]pyrene, 2-methyl-napthalene, Phenanthrene, Benzo[a]anthracene, Chrysene,
Pyrene)
Toxicity, benthic community effects
San Pedro Bay Tissue: Chlordane, Dieldrin, DDT, PCBs,
Toxaphene Sediment: Metals, Chlordane, PAHs, DDT
Toxicity
Los Angeles River Estuary
Tissue: None Sediment: Metals, Chlordane, DDT, PCBs
Toxicity
Note: Bold pollutants are required by the Harbor Toxics TMDL.
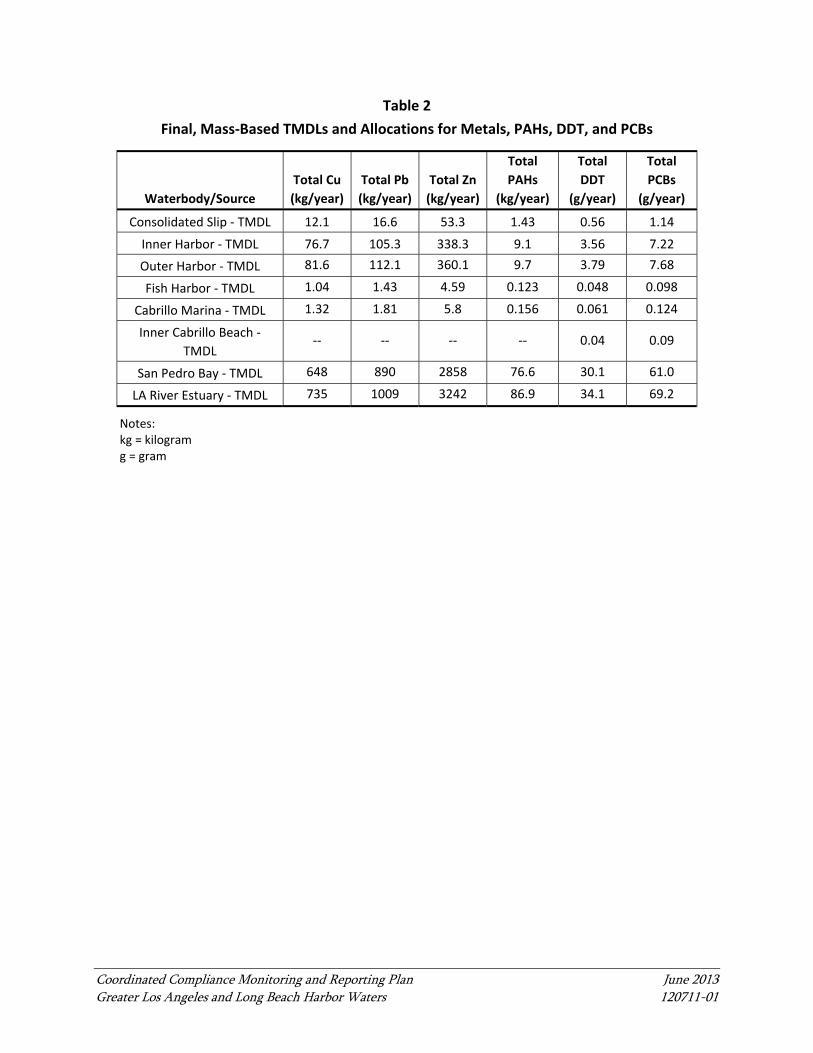
Coordinated Compliance Monitoring and Reporting Plan June 2013 Greater Los Angeles and Long Beach Harbor Waters 120711-01
Table 2
Final, Mass‐Based TMDLs and Allocations for Metals, PAHs, DDT, and PCBs
Waterbody/Source
Total Cu
(kg/year)
Total Pb
(kg/year)
Total Zn
(kg/year)
Total
PAHs
(kg/year)
Total
DDT
(g/year)
Total
PCBs
(g/year)
Consolidated Slip ‐ TMDL 12.1 16.6 53.3 1.43 0.56 1.14
Inner Harbor ‐ TMDL 76.7 105.3 338.3 9.1 3.56 7.22
Outer Harbor ‐ TMDL 81.6 112.1 360.1 9.7 3.79 7.68
Fish Harbor ‐ TMDL 1.04 1.43 4.59 0.123 0.048 0.098
Cabrillo Marina ‐ TMDL 1.32 1.81 5.8 0.156 0.061 0.124
Inner Cabrillo Beach ‐
TMDL ‐‐ ‐‐ ‐‐ ‐‐ 0.04 0.09
San Pedro Bay ‐ TMDL 648 890 2858 76.6 30.1 61.0
LA River Estuary ‐ TMDL 735 1009 3242 86.9 34.1 69.2
Notes: kg = kilogram g = gram
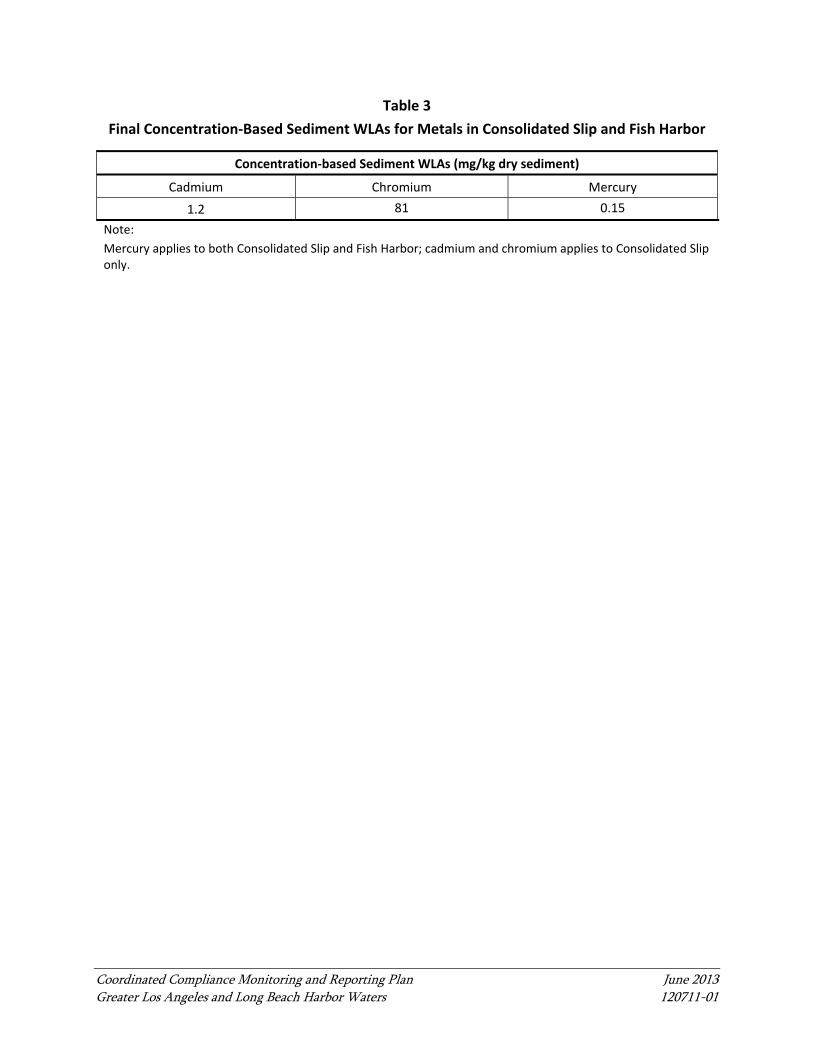
Coordinated Compliance Monitoring and Reporting Plan June 2013 Greater Los Angeles and Long Beach Harbor Waters 120711-01
Table 3
Final Concentration‐Based Sediment WLAs for Metals in Consolidated Slip and Fish Harbor
Concentration‐based Sediment WLAs (mg/kg dry sediment)
Cadmium Chromium Mercury
1.2 81 0.15
Note:
Mercury applies to both Consolidated Slip and Fish Harbor; cadmium and chromium applies to Consolidated Slip only.
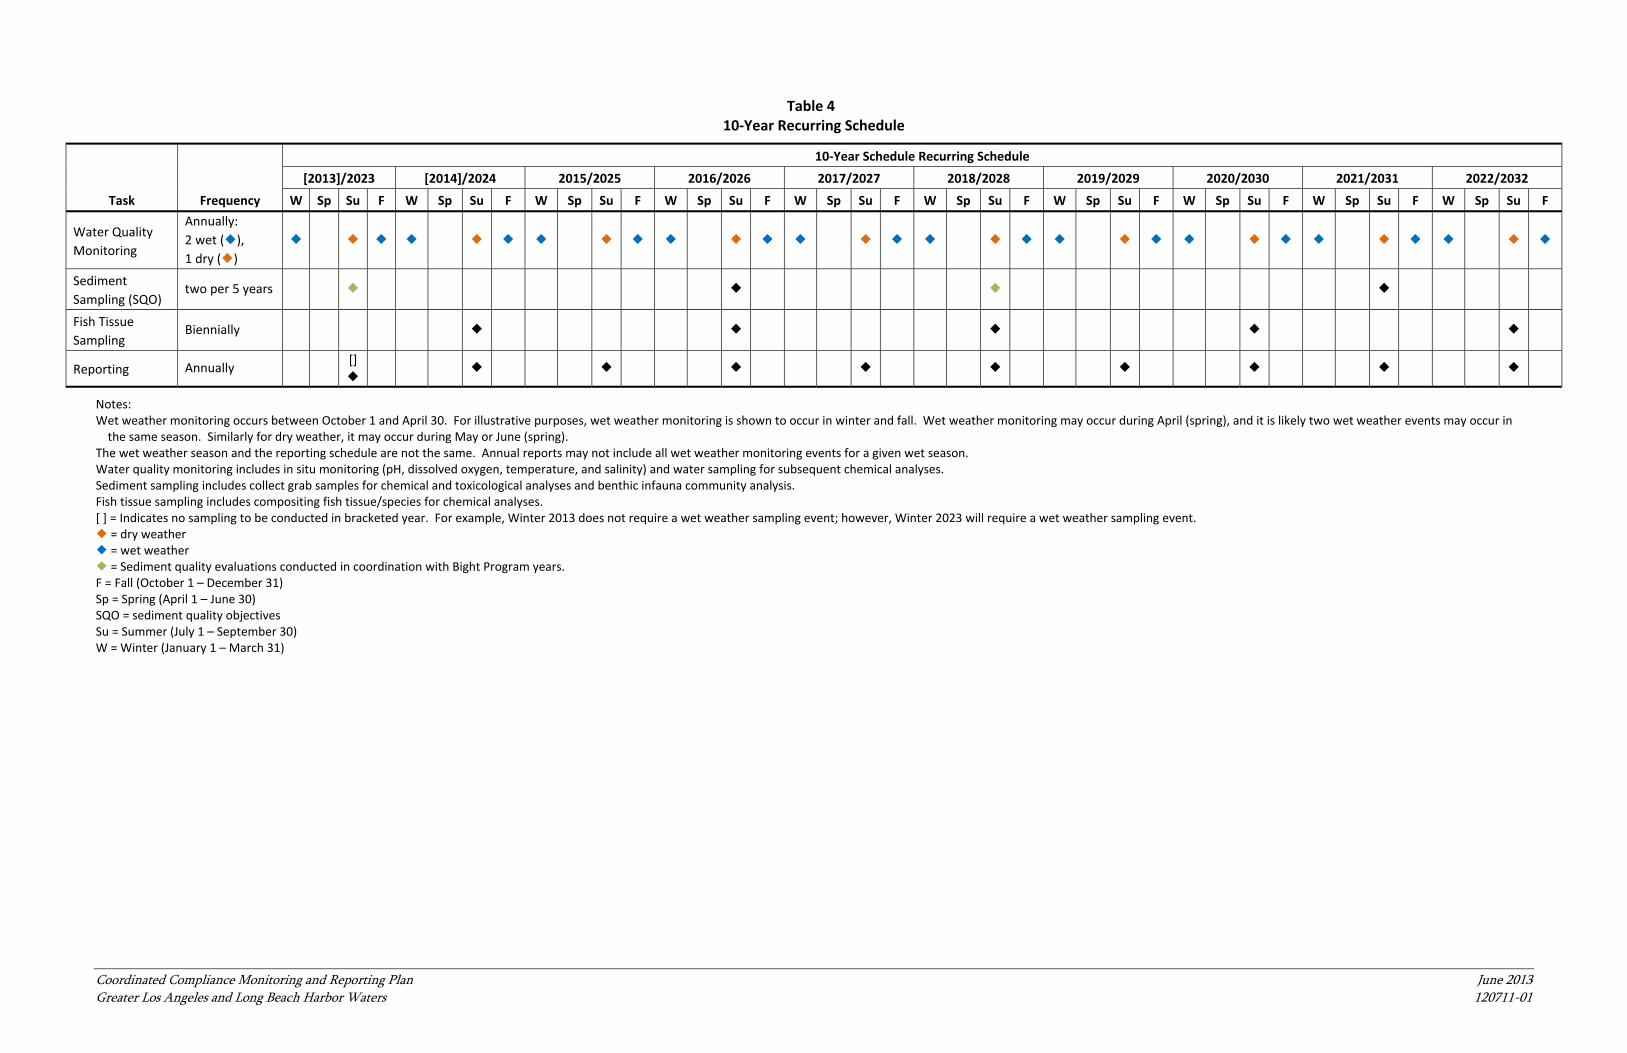
Coordinated Compliance Monitoring and Reporting Plan June 2013 Greater Los Angeles and Long Beach Harbor Waters 120711-01
Table 4 10‐Year Recurring Schedule
Task Frequency
10‐Year Schedule Recurring Schedule
[2013]/2023 [2014]/2024 2015/2025 2016/2026 2017/2027 2018/2028 2019/2029 2020/2030 2021/2031 2022/2032
W Sp Su F W Sp Su F W Sp Su F W Sp Su F W Sp Su F W Sp Su F W Sp Su F W Sp Su F W Sp Su F W Sp Su F
Water Quality
Monitoring
Annually:
2 wet (),
1 dry ()
Sediment
Sampling (SQO) two per 5 years
Fish Tissue
Sampling Biennially
Reporting Annually
[]
Notes: Wet weather monitoring occurs between October 1 and April 30. For illustrative purposes, wet weather monitoring is shown to occur in winter and fall. Wet weather monitoring may occur during April (spring), and it is likely two wet weather events may occur in the same season. Similarly for dry weather, it may occur during May or June (spring).
The wet weather season and the reporting schedule are not the same. Annual reports may not include all wet weather monitoring events for a given wet season. Water quality monitoring includes in situ monitoring (pH, dissolved oxygen, temperature, and salinity) and water sampling for subsequent chemical analyses. Sediment sampling includes collect grab samples for chemical and toxicological analyses and benthic infauna community analysis. Fish tissue sampling includes compositing fish tissue/species for chemical analyses. [ ] = Indicates no sampling to be conducted in bracketed year. For example, Winter 2013 does not require a wet weather sampling event; however, Winter 2023 will require a wet weather sampling event. = dry weather = wet weather = Sediment quality evaluations conducted in coordination with Bight Program years. F = Fall (October 1 – December 31) Sp = Spring (April 1 – June 30) SQO = sediment quality objectives Su = Summer (July 1 – September 30) W = Winter (January 1 – March 31)
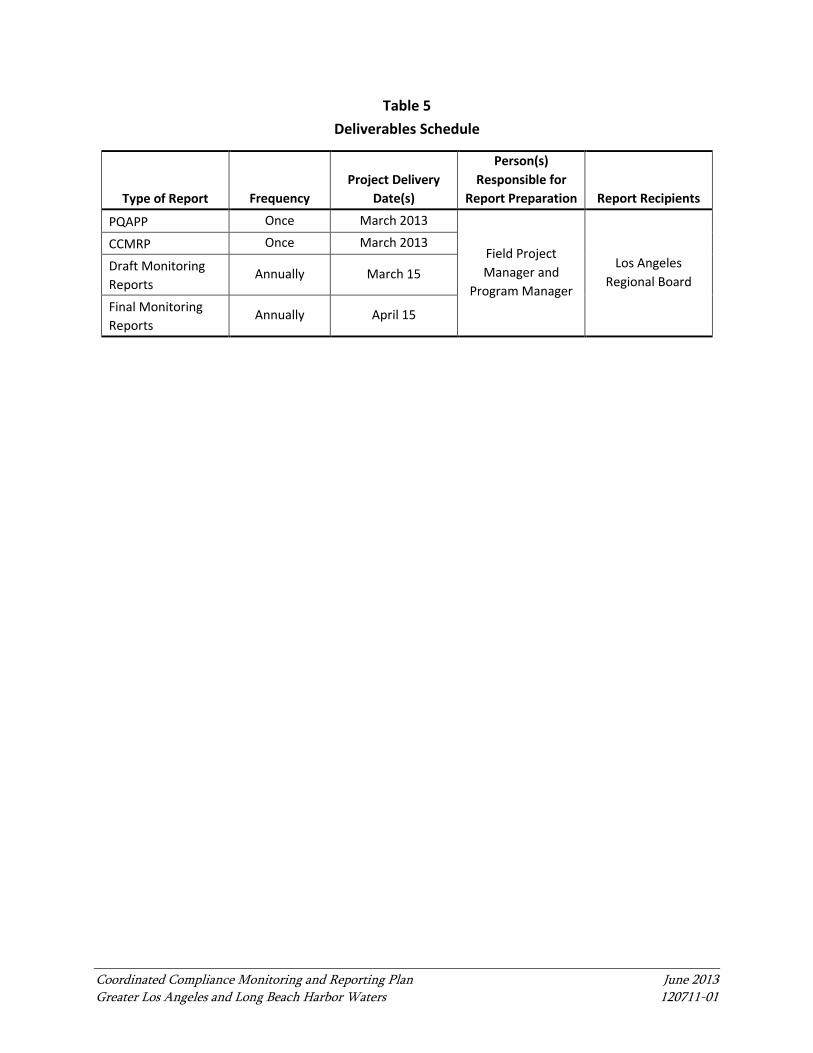
Coordinated Compliance Monitoring and Reporting Plan June 2013 Greater Los Angeles and Long Beach Harbor Waters 120711-01
Table 5 Deliverables Schedule
Type of Report Frequency Project Delivery
Date(s)
Person(s) Responsible for
Report Preparation Report Recipients
PQAPP Once March 2013
Field Project Manager and
Program Manager
Los Angeles Regional Board
CCMRP Once March 2013
Draft Monitoring Reports
Annually March 15
Final Monitoring Reports
Annually April 15
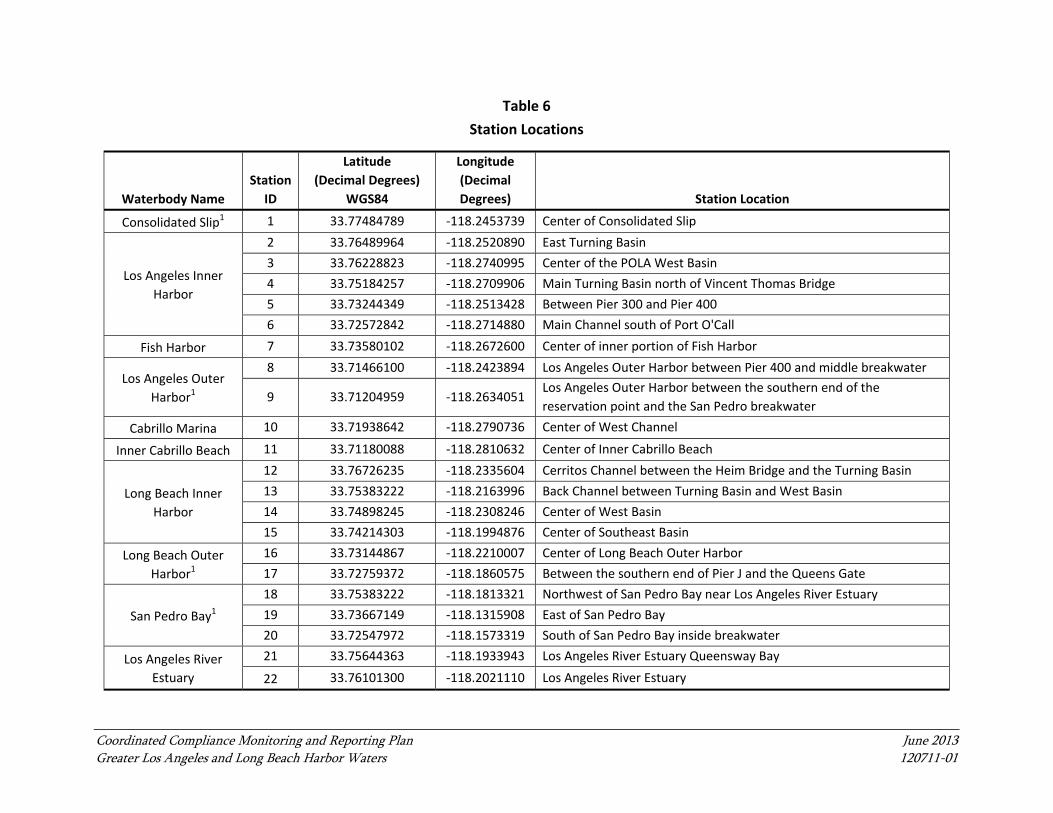
Coordinated Compliance Monitoring and Reporting Plan June 2013 Greater Los Angeles and Long Beach Harbor Waters 120711-01
Table 6
Station Locations
Waterbody Name
Station
ID
Latitude
(Decimal Degrees)
WGS84
Longitude
(Decimal
Degrees) Station Location
Consolidated Slip1 1 33.77484789 ‐118.2453739 Center of Consolidated Slip
Los Angeles Inner
Harbor
2 33.76489964 ‐118.2520890 East Turning Basin
3 33.76228823 ‐118.2740995 Center of the POLA West Basin
4 33.75184257 ‐118.2709906 Main Turning Basin north of Vincent Thomas Bridge
5 33.73244349 ‐118.2513428 Between Pier 300 and Pier 400
6 33.72572842 ‐118.2714880 Main Channel south of Port O'Call
Fish Harbor 7 33.73580102 ‐118.2672600 Center of inner portion of Fish Harbor
Los Angeles Outer
Harbor1
8 33.71466100 ‐118.2423894 Los Angeles Outer Harbor between Pier 400 and middle breakwater
9 33.71204959 ‐118.2634051 Los Angeles Outer Harbor between the southern end of the
reservation point and the San Pedro breakwater
Cabrillo Marina 10 33.71938642 ‐118.2790736 Center of West Channel
Inner Cabrillo Beach 11 33.71180088 ‐118.2810632 Center of Inner Cabrillo Beach
Long Beach Inner
Harbor
12 33.76726235 ‐118.2335604 Cerritos Channel between the Heim Bridge and the Turning Basin
13 33.75383222 ‐118.2163996 Back Channel between Turning Basin and West Basin
14 33.74898245 ‐118.2308246 Center of West Basin
15 33.74214303 ‐118.1994876 Center of Southeast Basin
Long Beach Outer
Harbor1
16 33.73144867 ‐118.2210007 Center of Long Beach Outer Harbor
17 33.72759372 ‐118.1860575 Between the southern end of Pier J and the Queens Gate
San Pedro Bay1
18 33.75383222 ‐118.1813321 Northwest of San Pedro Bay near Los Angeles River Estuary
19 33.73667149 ‐118.1315908 East of San Pedro Bay
20 33.72547972 ‐118.1573319 South of San Pedro Bay inside breakwater
Los Angeles River
Estuary
21 33.75644363 ‐118.1933943 Los Angeles River Estuary Queensway Bay
22 33.76101300 ‐118.2021110 Los Angeles River Estuary
Coordinated Compliance Monitoring and Reporting Plan June 2013 Greater Los Angeles and Long Beach Harbor Waters 120711-01
Notes: 1 Fish tissue samples will be collected within four waterbodies: Consolidated Slip, Los Angeles Harbor, Long Beach Harbor, and San Pedro Bay from popular fishing areas or areas with habitat or structure that may attract fish. Specific fish tissue sampling locations will be determined at the time of the sampling event using guidelines outlined in Section 4.2.3.
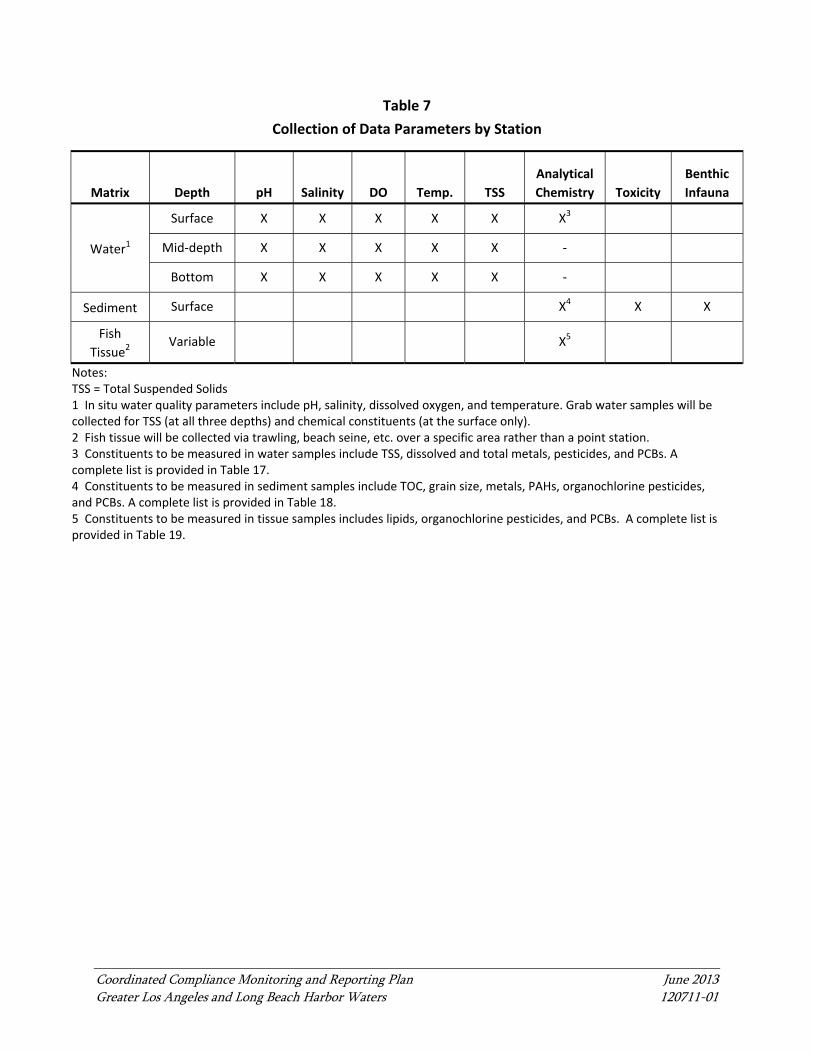
Coordinated Compliance Monitoring and Reporting Plan June 2013 Greater Los Angeles and Long Beach Harbor Waters 120711-01
Table 7
Collection of Data Parameters by Station
Matrix Depth pH Salinity DO Temp. TSS
Analytical
Chemistry Toxicity
Benthic
Infauna
Water1
Surface X X X X X X3
Mid‐depth X X X X X ‐
Bottom X X X X X ‐
Sediment Surface X4 X X
Fish
Tissue2 Variable X5
Notes: TSS = Total Suspended Solids 1 In situ water quality parameters include pH, salinity, dissolved oxygen, and temperature. Grab water samples will be collected for TSS (at all three depths) and chemical constituents (at the surface only). 2 Fish tissue will be collected via trawling, beach seine, etc. over a specific area rather than a point station. 3 Constituents to be measured in water samples include TSS, dissolved and total metals, pesticides, and PCBs. A complete list is provided in Table 17. 4 Constituents to be measured in sediment samples include TOC, grain size, metals, PAHs, organochlorine pesticides, and PCBs. A complete list is provided in Table 18. 5 Constituents to be measured in tissue samples includes lipids, organochlorine pesticides, and PCBs. A complete list is provided in Table 19.
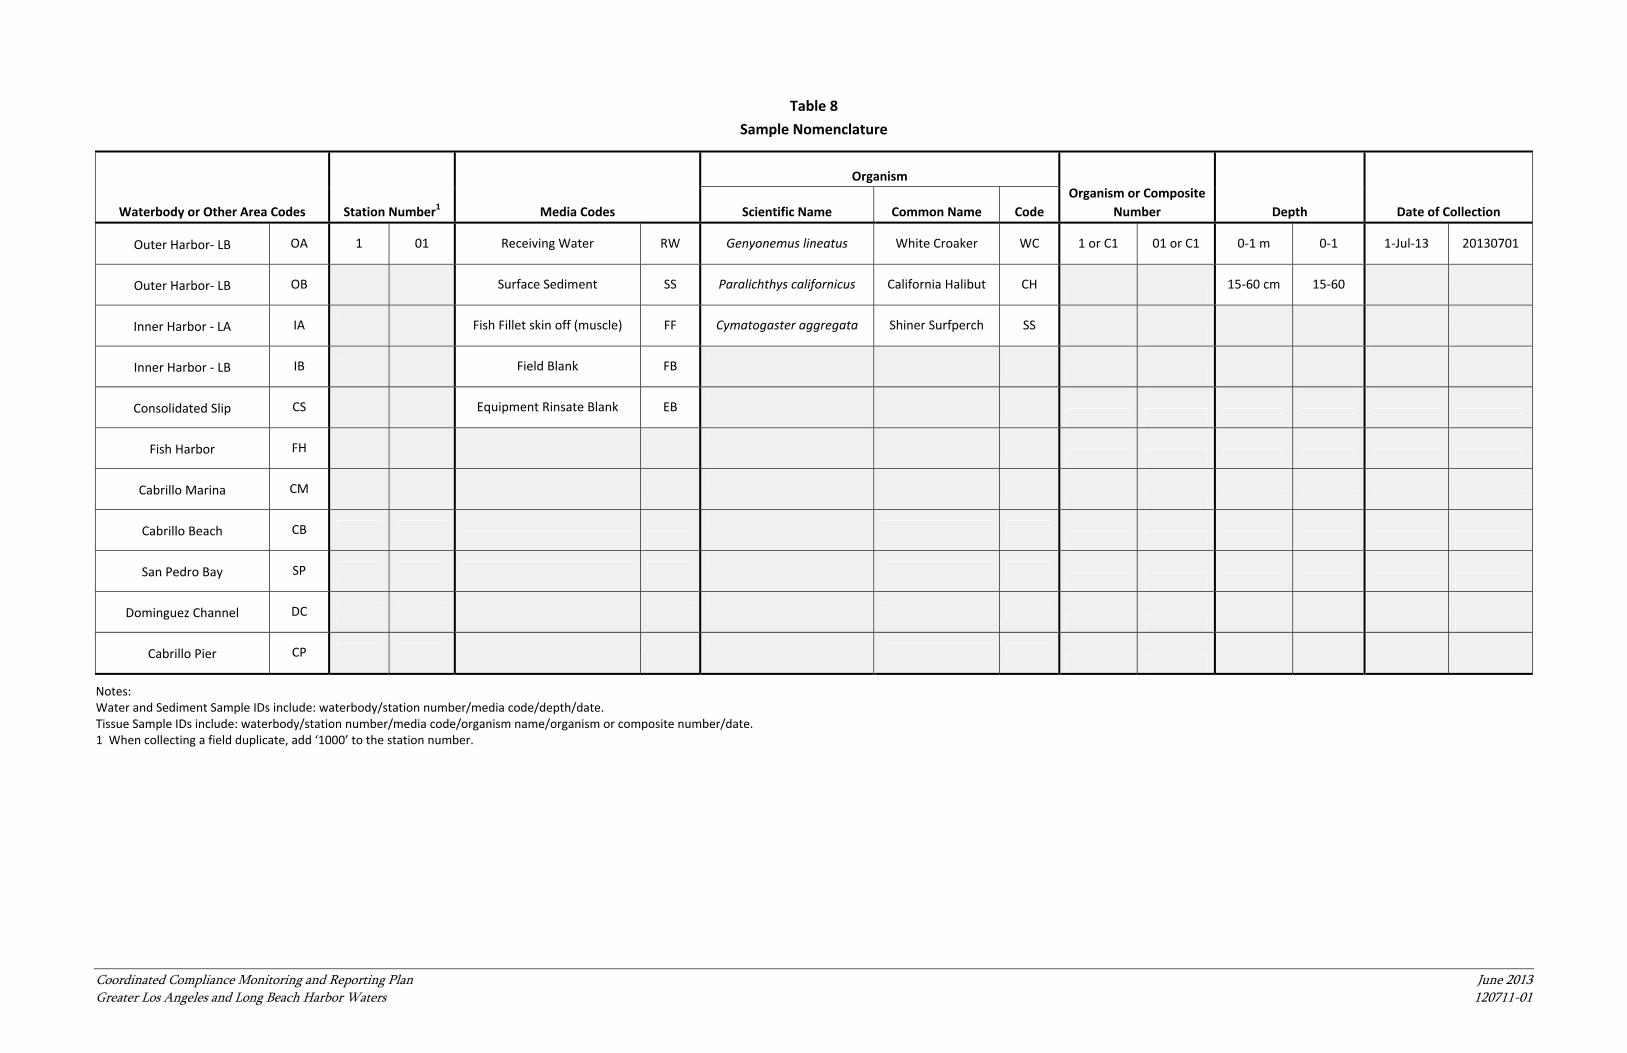
Coordinated Compliance Monitoring and Reporting Plan June 2013 Greater Los Angeles and Long Beach Harbor Waters 120711-01
Table 8
Sample Nomenclature
Waterbody or Other Area Codes Station Number1 Media Codes
Organism Organism or Composite
Number Depth Date of Collection Scientific Name Common Name Code
Outer Harbor‐ LB OA 1 01 Receiving Water RW Genyonemus lineatus White Croaker WC 1 or C1 01 or C1 0‐1 m 0‐1 1‐Jul‐13 20130701
Outer Harbor‐ LB OB Surface Sediment SS Paralichthys californicus California Halibut CH
15‐60 cm 15‐60
Inner Harbor ‐ LA IA Fish Fillet skin off (muscle) FF Cymatogaster aggregata Shiner Surfperch SS
Inner Harbor ‐ LB IB Field Blank FB
Consolidated Slip CS Equipment Rinsate Blank EB
Fish Harbor FH
Cabrillo Marina CM
Cabrillo Beach CB
San Pedro Bay SP
Dominguez Channel DC
Cabrillo Pier CP
Notes: Water and Sediment Sample IDs include: waterbody/station number/media code/depth/date. Tissue Sample IDs include: waterbody/station number/media code/organism name/organism or composite number/date. 1 When collecting a field duplicate, add ‘1000’ to the station number.
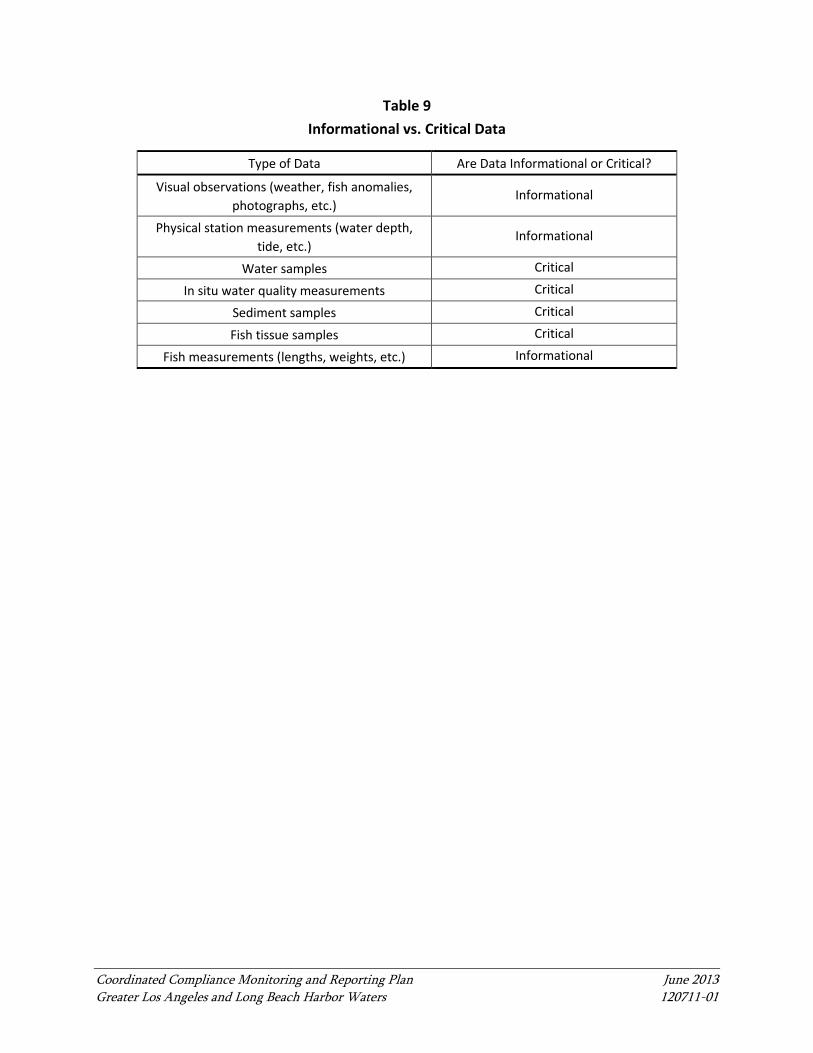
Coordinated Compliance Monitoring and Reporting Plan June 2013 Greater Los Angeles and Long Beach Harbor Waters 120711-01
Table 9 Informational vs. Critical Data
Type of Data Are Data Informational or Critical?
Visual observations (weather, fish anomalies, photographs, etc.)
Informational
Physical station measurements (water depth, tide, etc.)
Informational
Water samples Critical
In situ water quality measurements Critical
Sediment samples Critical
Fish tissue samples Critical
Fish measurements (lengths, weights, etc.) Informational
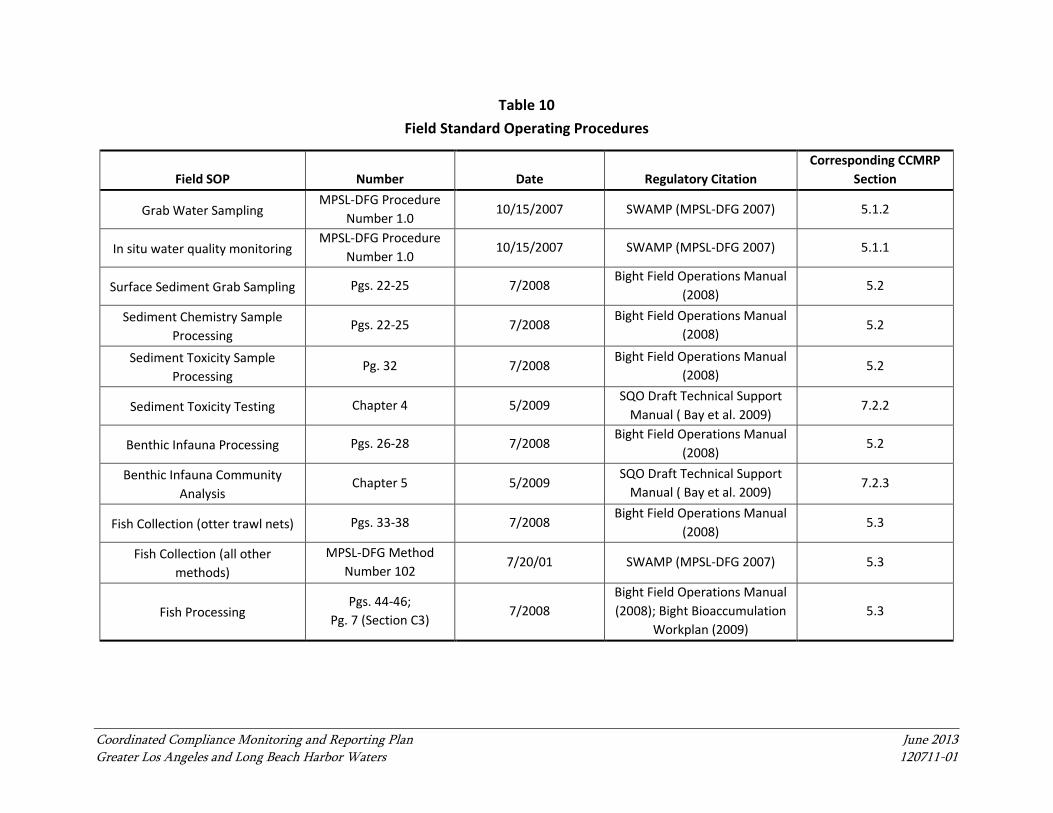
Coordinated Compliance Monitoring and Reporting Plan June 2013 Greater Los Angeles and Long Beach Harbor Waters 120711-01
Table 10 Field Standard Operating Procedures
Field SOP Number Date Regulatory Citation Corresponding CCMRP
Section
Grab Water Sampling MPSL-DFG Procedure
Number 1.0 10/15/2007 SWAMP (MPSL-DFG 2007) 5.1.2
In situ water quality monitoring MPSL-DFG Procedure
Number 1.0 10/15/2007 SWAMP (MPSL-DFG 2007) 5.1.1
Surface Sediment Grab Sampling Pgs. 22-25 7/2008 Bight Field Operations Manual
(2008) 5.2
Sediment Chemistry Sample Processing
Pgs. 22-25 7/2008 Bight Field Operations Manual
(2008) 5.2
Sediment Toxicity Sample Processing
Pg. 32 7/2008 Bight Field Operations Manual
(2008) 5.2
Sediment Toxicity Testing Chapter 4 5/2009 SQO Draft Technical Support
Manual ( Bay et al. 2009) 7.2.2
Benthic Infauna Processing Pgs. 26-28 7/2008 Bight Field Operations Manual
(2008) 5.2
Benthic Infauna Community Analysis
Chapter 5 5/2009 SQO Draft Technical Support
Manual ( Bay et al. 2009) 7.2.3
Fish Collection (otter trawl nets) Pgs. 33-38 7/2008 Bight Field Operations Manual
(2008) 5.3
Fish Collection (all other methods)
MPSL-DFG Method Number 102
7/20/01 SWAMP (MPSL-DFG 2007) 5.3
Fish Processing Pgs. 44-46;
Pg. 7 (Section C3) 7/2008
Bight Field Operations Manual (2008); Bight Bioaccumulation
Workplan (2009) 5.3
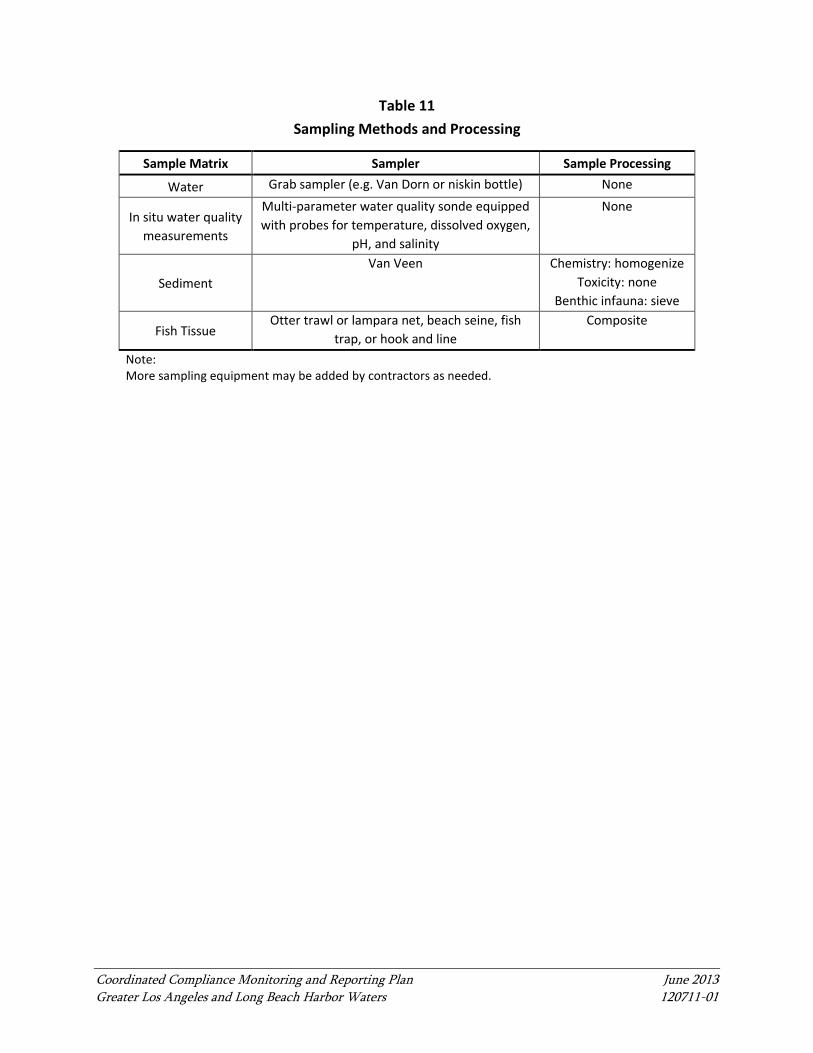
Coordinated Compliance Monitoring and Reporting Plan June 2013 Greater Los Angeles and Long Beach Harbor Waters 120711-01
Table 11 Sampling Methods and Processing
Sample Matrix Sampler Sample Processing
Water Grab sampler (e.g. Van Dorn or niskin bottle) None
In situ water quality measurements
Multi-parameter water quality sonde equipped with probes for temperature, dissolved oxygen,
pH, and salinity
None
Sediment Van Veen Chemistry: homogenize
Toxicity: none Benthic infauna: sieve
Fish Tissue Otter trawl or lampara net, beach seine, fish
trap, or hook and line Composite
Note: More sampling equipment may be added by contractors as needed.

Coordinated Compliance Monitoring and Reporting Plan June 2013 Greater Los Angeles and Long Beach Harbor Waters 120711-01
Table 12
Sample Containers and Holding Conditions
Parameter Sample Size Container Size
and Type Holding Time Preservative
Waters
Total suspended solids 1 L 1‐L HDPE 7 days Cool ≤6°C
Total Metals 100 mL 250 mL HDPE
48 hours until preservation Cool ≤6°C
6 months to analysis Ambient;
HNO3 to pH<2
Dissolved metals 100 mL 250 mL HDPE
Field filter; 48 hours until preservation
Cool ≤6°C
6 months to analysis Ambient;
HNO3 to pH<2 after filtration
Organochlorine pesticides
1 to 2 L 2 X 1‐L amber
glass
14 days to extraction Cool ≤6°C; pH
5‐9
40 days after extraction Cool ≤6°C
PCB Congeners 1 to 2 L 2 X 1‐L amber
glass None2 Cool ≤6°C
Sediments
Bulk density 50 g 4‐oz glass None established Ambient
Specific gravity 100 g 16‐oz glass None established Ambient
Total solids 10 g 8‐oz glass 14 days Cool ≤6°C
Grain size 300 g 16‐oz plastic 6 months Cool ≤6°C
DOC in porewater 1‐ 2 L
sediment1 2 X 1‐L amber
glass
48 hours for extraction, filtration and preservation; 28
days to analysis
HCl or H2SO4 to pH<2 after filtration; Cool ≤6°C and dark
TOC 10 g 4‐oz glass
28 days Cool ≤6°C
1 year, if frozen within 28 days of collection
Freeze ‐20°C
Total metals and Mercury
100 g 4‐oz glass
6 months None
1 year; samples must be extracted within 14 days of
thawing Freeze ‐20°C3
PAHs/ Organochlorine pesticides
500 g Two 8‐oz glass
14 days to extraction Cool ≤6°C
1 year to extraction; samples must be extracted within 14
days of thawing Freeze ‐20°C
40 days after extraction Cool ≤6°C
PCB Congeners 500 g Two 8‐oz glass None1 Cool ≤6°C
Freeze ‐20°C
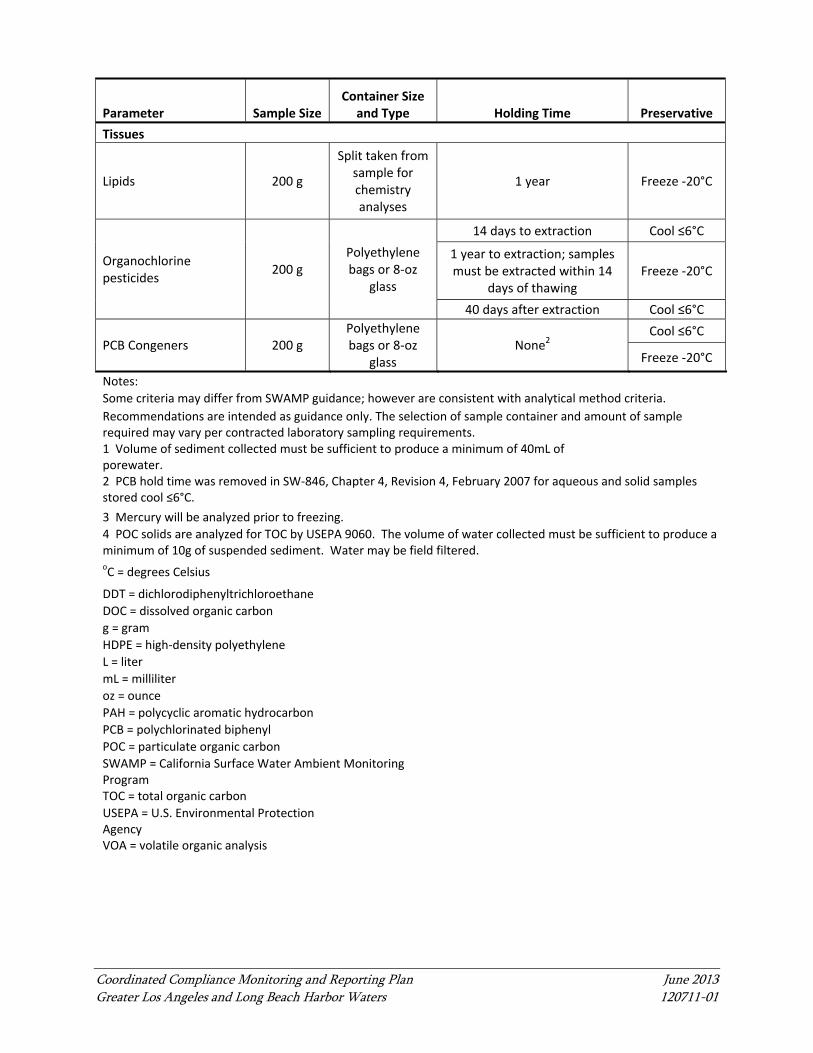
Coordinated Compliance Monitoring and Reporting Plan June 2013 Greater Los Angeles and Long Beach Harbor Waters 120711-01
Parameter Sample Size Container Size
and Type Holding Time Preservative
Tissues
Lipids 200 g
Split taken from sample for chemistry analyses
1 year Freeze ‐20°C
Organochlorine pesticides
200 g Polyethylene bags or 8‐oz
glass
14 days to extraction Cool ≤6°C
1 year to extraction; samples must be extracted within 14
days of thawing Freeze ‐20°C
40 days after extraction Cool ≤6°C
PCB Congeners 200 g Polyethylene bags or 8‐oz
glass None2
Cool ≤6°C
Freeze ‐20°C
Notes:
Some criteria may differ from SWAMP guidance; however are consistent with analytical method criteria.
Recommendations are intended as guidance only. The selection of sample container and amount of sample required may vary per contracted laboratory sampling requirements. 1 Volume of sediment collected must be sufficient to produce a minimum of 40mL of porewater. 2 PCB hold time was removed in SW‐846, Chapter 4, Revision 4, February 2007 for aqueous and solid samples stored cool ≤6°C.
3 Mercury will be analyzed prior to freezing.
4 POC solids are analyzed for TOC by USEPA 9060. The volume of water collected must be sufficient to produce a minimum of 10g of suspended sediment. Water may be field filtered. oC = degrees Celsius
DDT = dichlorodiphenyltrichloroethane
DOC = dissolved organic carbon
g = gram
HDPE = high‐density polyethylene
L = liter
mL = milliliter
oz = ounce
PAH = polycyclic aromatic hydrocarbon
PCB = polychlorinated biphenyl
POC = particulate organic carbon
SWAMP = California Surface Water Ambient Monitoring Program TOC = total organic carbon
USEPA = U.S. Environmental Protection Agency VOA = volatile organic analysis
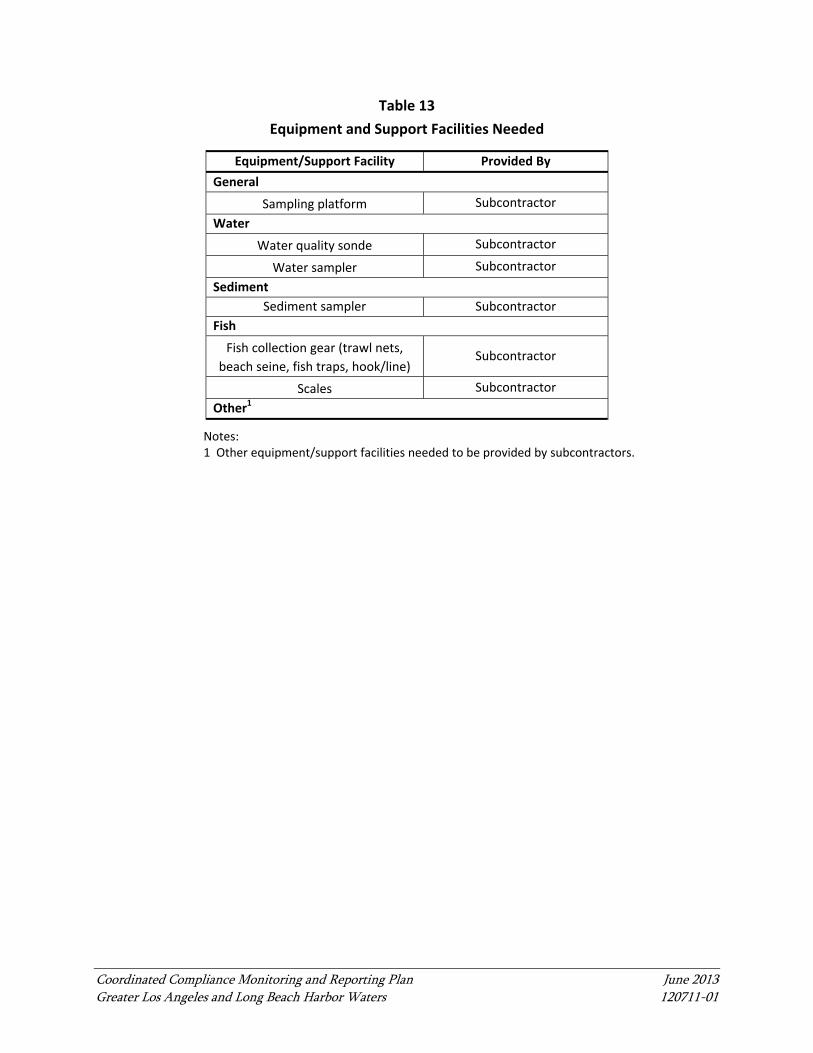
Coordinated Compliance Monitoring and Reporting Plan June 2013 Greater Los Angeles and Long Beach Harbor Waters 120711-01
Table 13
Equipment and Support Facilities Needed
Equipment/Support Facility Provided By
General
Sampling platform Subcontractor
Water
Water quality sonde Subcontractor
Water sampler Subcontractor
Sediment
Sediment sampler Subcontractor
Fish
Fish collection gear (trawl nets,
beach seine, fish traps, hook/line) Subcontractor
Scales Subcontractor
Other1
Notes: 1 Other equipment/support facilities needed to be provided by subcontractors.
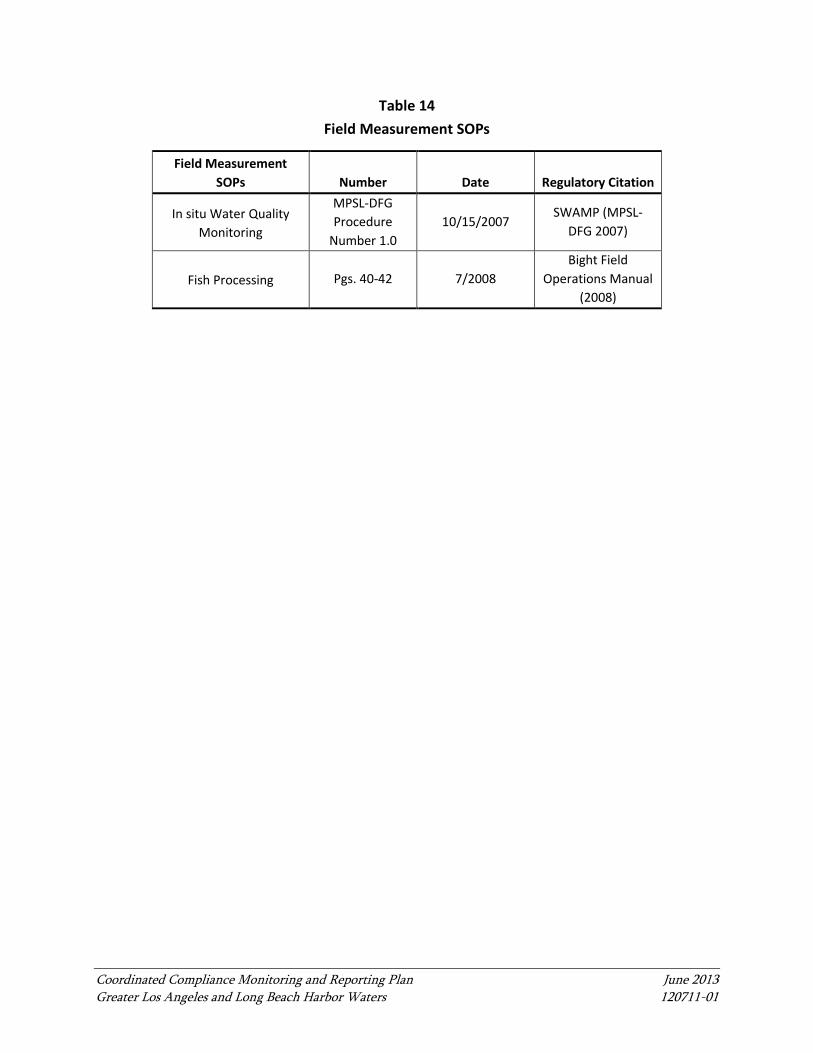
Coordinated Compliance Monitoring and Reporting Plan June 2013 Greater Los Angeles and Long Beach Harbor Waters 120711-01
Table 14 Field Measurement SOPs
Field Measurement SOPs Number Date Regulatory Citation
In situ Water Quality Monitoring
MPSL-DFG Procedure
Number 1.0 10/15/2007
SWAMP (MPSL-DFG 2007)
Fish Processing Pgs. 40-42 7/2008 Bight Field
Operations Manual (2008)

Coordinated Compliance Monitoring and Reporting Plan June 2013 Greater Los Angeles and Long Beach Harbor Waters 120711-01
Table 15 Field Instruments
Instrument Unit Major Attribute1
Water quality sonde – temperature probe ⁰C
Water quality sonde – dissolved oxygen probe
mg/L
Water quality sonde – pH probe units
Water quality sonde – salinity probe ppt
Scales g
Other2
Notes: ⁰C = degrees Celsius mg = milligram L = liter g = grams ppt = parts per thousand 1 Major attributes to be provided by subcontractors 2 Other instruments to be determined by subcontractors
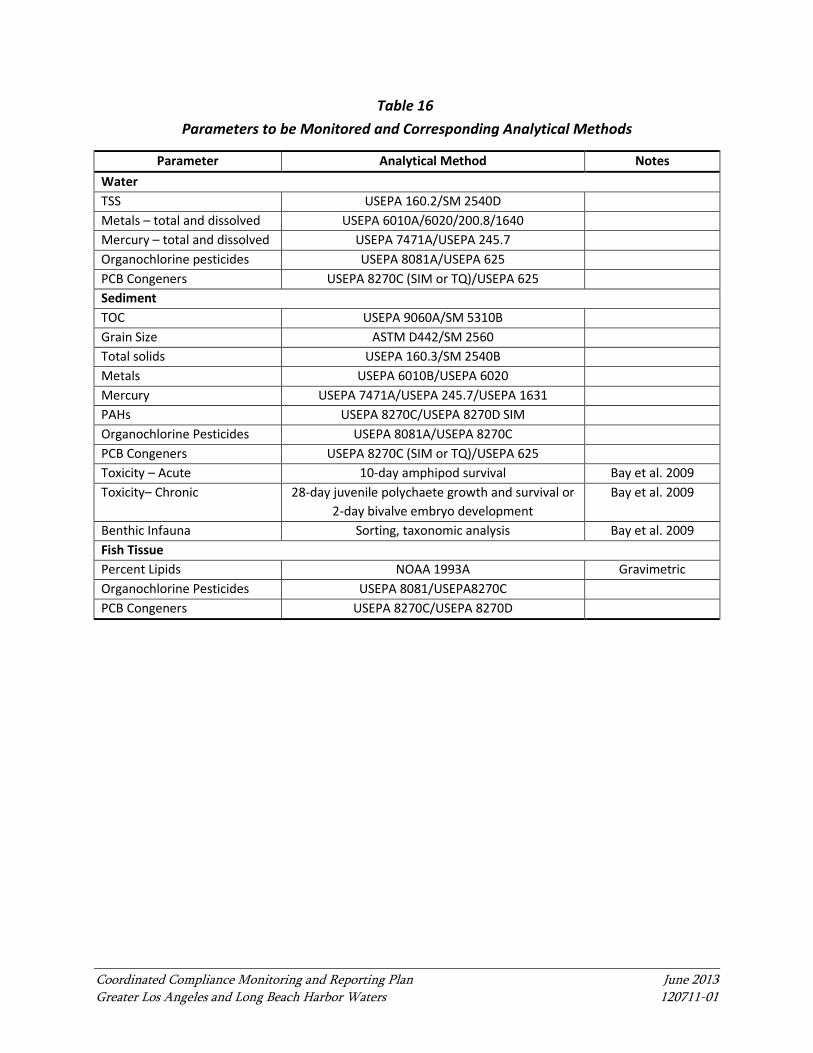
Coordinated Compliance Monitoring and Reporting Plan June 2013 Greater Los Angeles and Long Beach Harbor Waters 120711-01
Table 16 Parameters to be Monitored and Corresponding Analytical Methods
Parameter Analytical Method Notes Water TSS USEPA 160.2/SM 2540D Metals – total and dissolved USEPA 6010A/6020/200.8/1640 Mercury – total and dissolved USEPA 7471A/USEPA 245.7 Organochlorine pesticides USEPA 8081A/USEPA 625 PCB Congeners USEPA 8270C (SIM or TQ)/USEPA 625 Sediment TOC USEPA 9060A/SM 5310B Grain Size ASTM D442/SM 2560 Total solids USEPA 160.3/SM 2540B Metals USEPA 6010B/USEPA 6020 Mercury USEPA 7471A/USEPA 245.7/USEPA 1631 PAHs USEPA 8270C/USEPA 8270D SIM Organochlorine Pesticides USEPA 8081A/USEPA 8270C PCB Congeners USEPA 8270C (SIM or TQ)/USEPA 625 Toxicity – Acute 10-day amphipod survival Bay et al. 2009 Toxicity– Chronic 28-day juvenile polychaete growth and survival or
2-day bivalve embryo development Bay et al. 2009
Benthic Infauna Sorting, taxonomic analysis Bay et al. 2009 Fish Tissue Percent Lipids NOAA 1993A Gravimetric Organochlorine Pesticides USEPA 8081/USEPA8270C PCB Congeners USEPA 8270C/USEPA 8270D
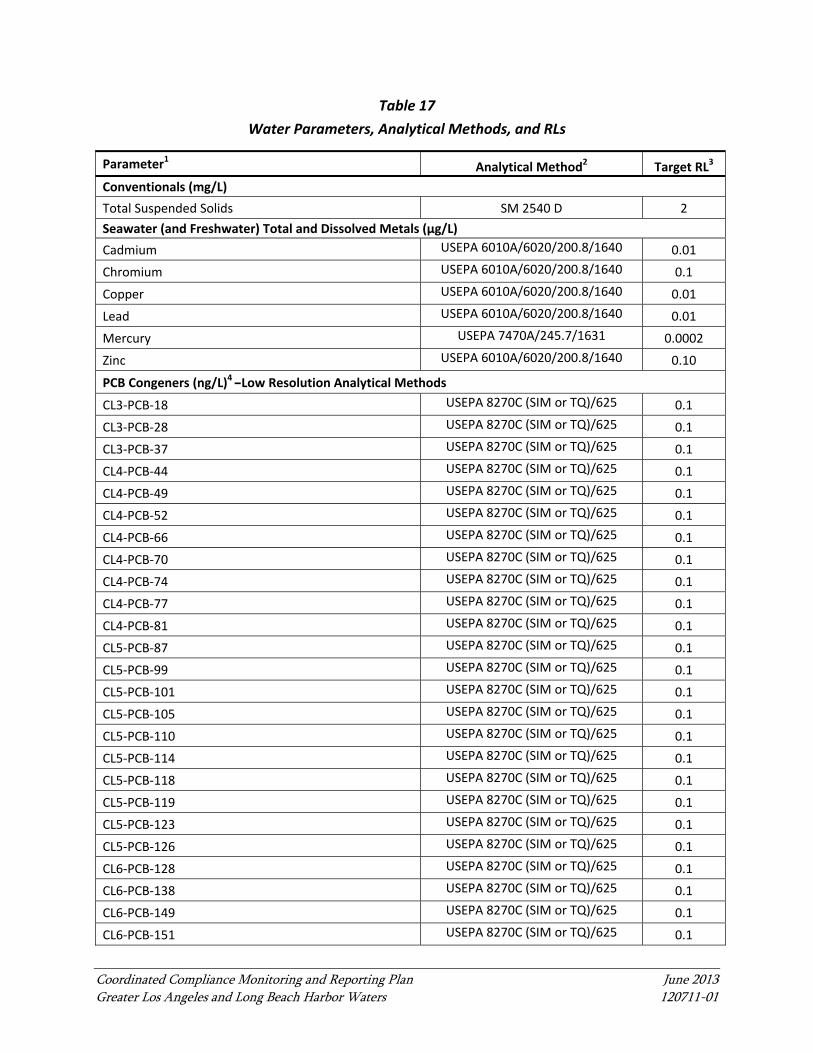
Coordinated Compliance Monitoring and Reporting Plan June 2013 Greater Los Angeles and Long Beach Harbor Waters 120711-01
Table 17
Water Parameters, Analytical Methods, and RLs
Parameter1 Analytical Method2 Target RL3
Conventionals (mg/L)
Total Suspended Solids SM 2540 D 2
Seawater (and Freshwater) Total and Dissolved Metals (µg/L)
Cadmium USEPA 6010A/6020/200.8/1640 0.01
Chromium USEPA 6010A/6020/200.8/1640 0.1
Copper USEPA 6010A/6020/200.8/1640 0.01
Lead USEPA 6010A/6020/200.8/1640 0.01
Mercury USEPA 7470A/245.7/1631 0.0002
Zinc USEPA 6010A/6020/200.8/1640 0.10
PCB Congeners (ng/L)4 – Low Resolution Analytical Methods
CL3‐PCB‐18 USEPA 8270C (SIM or TQ)/625 0.1
CL3‐PCB‐28 USEPA 8270C (SIM or TQ)/625 0.1
CL3‐PCB‐37 USEPA 8270C (SIM or TQ)/625 0.1
CL4‐PCB‐44 USEPA 8270C (SIM or TQ)/625 0.1
CL4‐PCB‐49 USEPA 8270C (SIM or TQ)/625 0.1
CL4‐PCB‐52 USEPA 8270C (SIM or TQ)/625 0.1
CL4‐PCB‐66 USEPA 8270C (SIM or TQ)/625 0.1
CL4‐PCB‐70 USEPA 8270C (SIM or TQ)/625 0.1
CL4‐PCB‐74 USEPA 8270C (SIM or TQ)/625 0.1
CL4‐PCB‐77 USEPA 8270C (SIM or TQ)/625 0.1
CL4‐PCB‐81 USEPA 8270C (SIM or TQ)/625 0.1
CL5‐PCB‐87 USEPA 8270C (SIM or TQ)/625 0.1
CL5‐PCB‐99 USEPA 8270C (SIM or TQ)/625 0.1
CL5‐PCB‐101 USEPA 8270C (SIM or TQ)/625 0.1
CL5‐PCB‐105 USEPA 8270C (SIM or TQ)/625 0.1
CL5‐PCB‐110 USEPA 8270C (SIM or TQ)/625 0.1
CL5‐PCB‐114 USEPA 8270C (SIM or TQ)/625 0.1
CL5‐PCB‐118 USEPA 8270C (SIM or TQ)/625 0.1
CL5‐PCB‐119 USEPA 8270C (SIM or TQ)/625 0.1
CL5‐PCB‐123 USEPA 8270C (SIM or TQ)/625 0.1
CL5‐PCB‐126 USEPA 8270C (SIM or TQ)/625 0.1
CL6‐PCB‐128 USEPA 8270C (SIM or TQ)/625 0.1
CL6‐PCB‐138 USEPA 8270C (SIM or TQ)/625 0.1
CL6‐PCB‐149 USEPA 8270C (SIM or TQ)/625 0.1
CL6‐PCB‐151 USEPA 8270C (SIM or TQ)/625 0.1
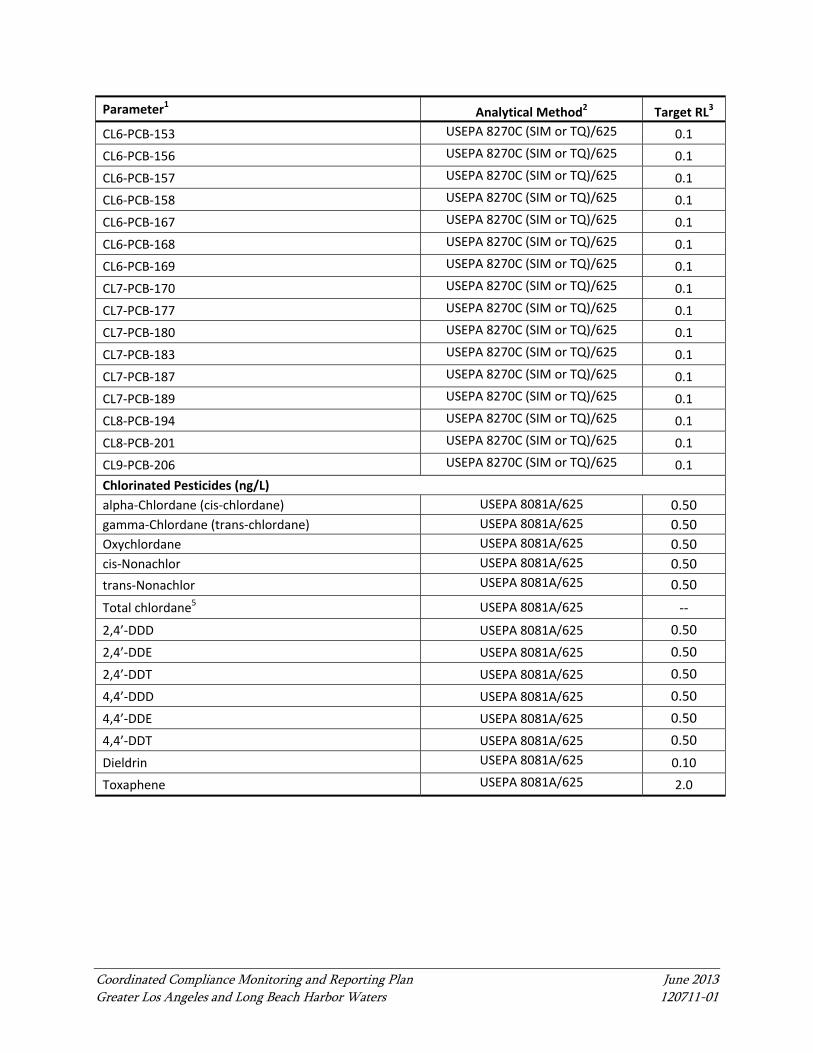
Coordinated Compliance Monitoring and Reporting Plan June 2013 Greater Los Angeles and Long Beach Harbor Waters 120711-01
Parameter1 Analytical Method2 Target RL3
CL6‐PCB‐153 USEPA 8270C (SIM or TQ)/625 0.1
CL6‐PCB‐156 USEPA 8270C (SIM or TQ)/625 0.1
CL6‐PCB‐157 USEPA 8270C (SIM or TQ)/625 0.1
CL6‐PCB‐158 USEPA 8270C (SIM or TQ)/625 0.1
CL6‐PCB‐167 USEPA 8270C (SIM or TQ)/625 0.1
CL6‐PCB‐168 USEPA 8270C (SIM or TQ)/625 0.1
CL6‐PCB‐169 USEPA 8270C (SIM or TQ)/625 0.1
CL7‐PCB‐170 USEPA 8270C (SIM or TQ)/625 0.1
CL7‐PCB‐177 USEPA 8270C (SIM or TQ)/625 0.1
CL7‐PCB‐180 USEPA 8270C (SIM or TQ)/625 0.1
CL7‐PCB‐183 USEPA 8270C (SIM or TQ)/625 0.1
CL7‐PCB‐187 USEPA 8270C (SIM or TQ)/625 0.1
CL7‐PCB‐189 USEPA 8270C (SIM or TQ)/625 0.1
CL8‐PCB‐194 USEPA 8270C (SIM or TQ)/625 0.1
CL8‐PCB‐201 USEPA 8270C (SIM or TQ)/625 0.1
CL9‐PCB‐206 USEPA 8270C (SIM or TQ)/625 0.1
Chlorinated Pesticides (ng/L)
alpha‐Chlordane (cis‐chlordane) USEPA 8081A/625 0.50
gamma‐Chlordane (trans‐chlordane) USEPA 8081A/625 0.50
Oxychlordane USEPA 8081A/625 0.50
cis‐Nonachlor USEPA 8081A/625 0.50
trans‐Nonachlor USEPA 8081A/625 0.50
Total chlordane5 USEPA 8081A/625 ‐‐
2,4’‐DDD USEPA 8081A/625 0.50
2,4’‐DDE USEPA 8081A/625 0.50
2,4’‐DDT USEPA 8081A/625 0.50
4,4’‐DDD USEPA 8081A/625 0.50
4,4’‐DDE USEPA 8081A/625 0.50
4,4’‐DDT USEPA 8081A/625 0.50
Dieldrin USEPA 8081A/625 0.10
Toxaphene USEPA 8081A/625 2.0
Coordinated Compliance Monitoring and Reporting Plan June 2013 Greater Los Angeles and Long Beach Harbor Waters 120711-01
Notes: High volume alternative sampling techniques may be used to achieve lower reporting limits for these analyses. 1 Specific analytes used for each study conducted for the RMC may vary by waterbody, according to the listings. 2 Laboratories may use different versions of recommended methods (i.e. USEPA 8270C) as long as the QA/QC elements identified in this CCMRP are met. 3 Matrix interference and/or dilutions due to non‐target analytes may increase target reporting limits. The method detection limit (MDL) should be at least three times lower than the reporting limit (40 CFR 136) but will vary per instrument by MDL study. Detected data between the MDL and the RL will be reported and flagged by the lab as estimated. Non‐detected data may be reported at the MDL. 4 PCB co‐elutions will vary by instrument and column, and may increase reporting limits for some congeners. 5 Total chlordane is calculated using the following compounds: alpha‐chlordane, gamma‐chlordane, oxychlordane, cis‐nonachlor, and trans‐nonachlor. µg/L = microgram per liter ng/L = nanogram per liter CCMRP = Coordinated Compliance Monitoring and Reporting Plan CFR = Code of Federal Regulations DDT = dichlorodiphenyltrichloroethane DDD = dichlorodiphenyldichloroethane DDE = dichlorodiphenyldichloroethylene MDL = method detection limit QA/QC = quality assurance/quality control RL = reporting limit SIM = selected ion monitoring SM = standard method TMDL = total maximum daily load PCB = polychlorinated biphenyl TBD = to be determined ‐‐ = no RL available
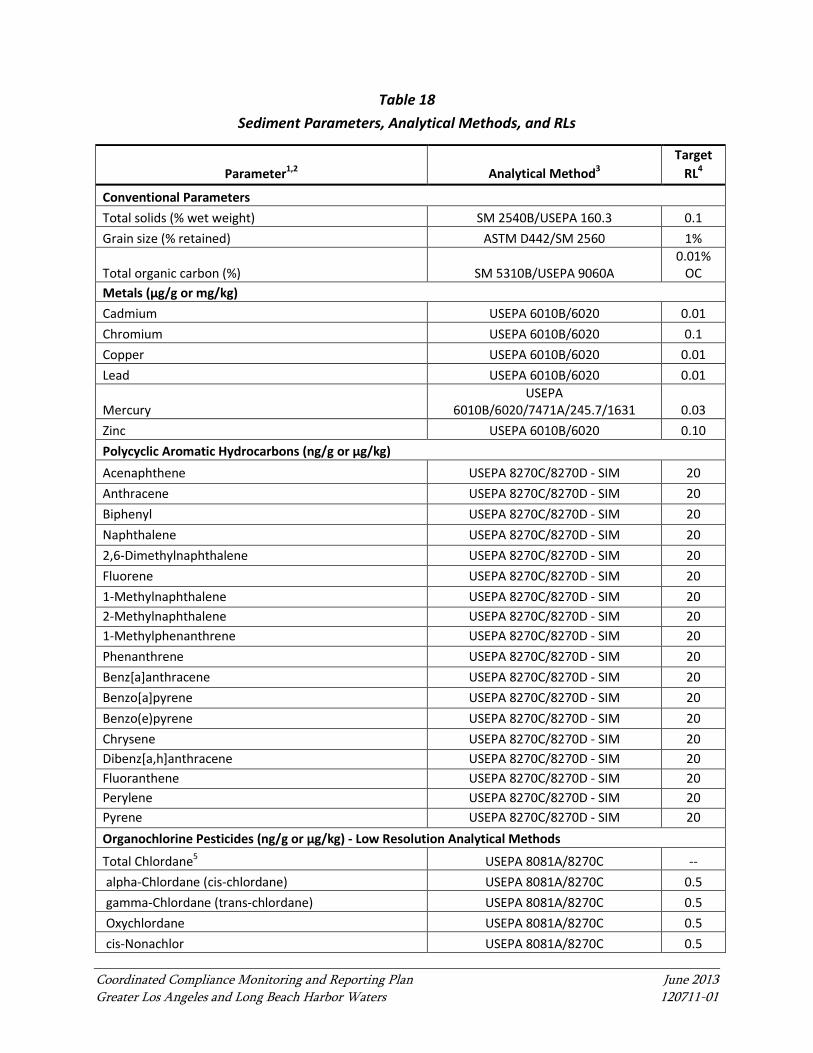
Coordinated Compliance Monitoring and Reporting Plan June 2013 Greater Los Angeles and Long Beach Harbor Waters 120711-01
Table 18 Sediment Parameters, Analytical Methods, and RLs
Parameter1,2 Analytical Method3 Target
RL4
Conventional Parameters Total solids (% wet weight) SM 2540B/USEPA 160.3 0.1 Grain size (% retained) ASTM D442/SM 2560 1%
Total organic carbon (%) SM 5310B/USEPA 9060A 0.01%
OC Metals (µg/g or mg/kg) Cadmium USEPA 6010B/6020 0.01 Chromium USEPA 6010B/6020 0.1 Copper USEPA 6010B/6020 0.01 Lead USEPA 6010B/6020 0.01
Mercury USEPA
6010B/6020/7471A/245.7/1631 0.03 Zinc USEPA 6010B/6020 0.10 Polycyclic Aromatic Hydrocarbons (ng/g or µg/kg) Acenaphthene USEPA 8270C/8270D - SIM 20 Anthracene USEPA 8270C/8270D - SIM 20 Biphenyl USEPA 8270C/8270D - SIM 20 Naphthalene USEPA 8270C/8270D - SIM 20 2,6-Dimethylnaphthalene USEPA 8270C/8270D - SIM 20 Fluorene USEPA 8270C/8270D - SIM 20 1-Methylnaphthalene USEPA 8270C/8270D - SIM 20 2-Methylnaphthalene USEPA 8270C/8270D - SIM 20 1-Methylphenanthrene USEPA 8270C/8270D - SIM 20 Phenanthrene USEPA 8270C/8270D - SIM 20 Benz[a]anthracene USEPA 8270C/8270D - SIM 20 Benzo[a]pyrene USEPA 8270C/8270D - SIM 20 Benzo(e)pyrene USEPA 8270C/8270D - SIM 20 Chrysene USEPA 8270C/8270D - SIM 20 Dibenz[a,h]anthracene USEPA 8270C/8270D - SIM 20 Fluoranthene USEPA 8270C/8270D - SIM 20 Perylene USEPA 8270C/8270D - SIM 20 Pyrene USEPA 8270C/8270D - SIM 20 Organochlorine Pesticides (ng/g or µg/kg) - Low Resolution Analytical Methods
Total Chlordane5 USEPA 8081A/8270C -- alpha-Chlordane (cis-chlordane) USEPA 8081A/8270C 0.5 gamma-Chlordane (trans-chlordane) USEPA 8081A/8270C 0.5 Oxychlordane USEPA 8081A/8270C 0.5 cis-Nonachlor USEPA 8081A/8270C 0.5
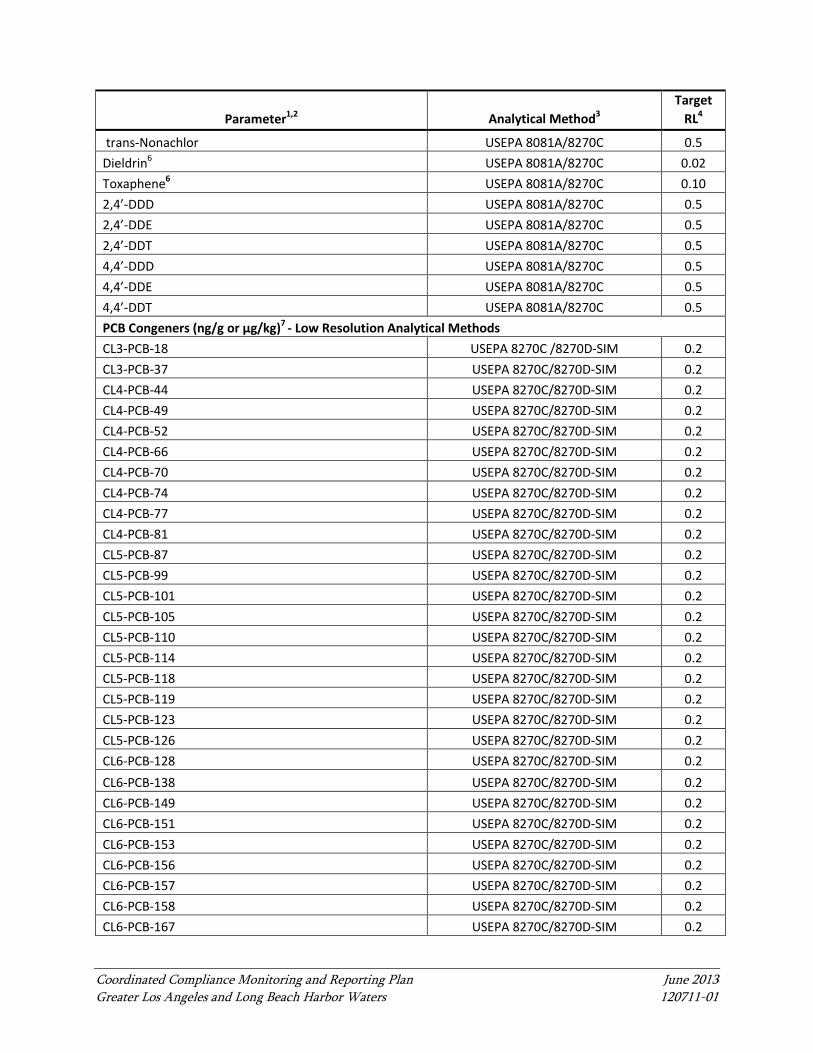
Coordinated Compliance Monitoring and Reporting Plan June 2013 Greater Los Angeles and Long Beach Harbor Waters 120711-01
Parameter1,2 Analytical Method3 Target
RL4
trans-Nonachlor USEPA 8081A/8270C 0.5 Dieldrin6 USEPA 8081A/8270C 0.02 Toxaphene6 USEPA 8081A/8270C 0.10 2,4’-DDD USEPA 8081A/8270C 0.5 2,4’-DDE USEPA 8081A/8270C 0.5 2,4’-DDT USEPA 8081A/8270C 0.5 4,4’-DDD USEPA 8081A/8270C 0.5 4,4’-DDE USEPA 8081A/8270C 0.5 4,4’-DDT USEPA 8081A/8270C 0.5 PCB Congeners (ng/g or µg/kg)7 - Low Resolution Analytical Methods CL3-PCB-18 USEPA 8270C /8270D-SIM 0.2 CL3-PCB-37 USEPA 8270C/8270D-SIM 0.2 CL4-PCB-44 USEPA 8270C/8270D-SIM 0.2 CL4-PCB-49 USEPA 8270C/8270D-SIM 0.2 CL4-PCB-52 USEPA 8270C/8270D-SIM 0.2 CL4-PCB-66 USEPA 8270C/8270D-SIM 0.2 CL4-PCB-70 USEPA 8270C/8270D-SIM 0.2 CL4-PCB-74 USEPA 8270C/8270D-SIM 0.2 CL4-PCB-77 USEPA 8270C/8270D-SIM 0.2 CL4-PCB-81 USEPA 8270C/8270D-SIM 0.2 CL5-PCB-87 USEPA 8270C/8270D-SIM 0.2 CL5-PCB-99 USEPA 8270C/8270D-SIM 0.2 CL5-PCB-101 USEPA 8270C/8270D-SIM 0.2 CL5-PCB-105 USEPA 8270C/8270D-SIM 0.2 CL5-PCB-110 USEPA 8270C/8270D-SIM 0.2 CL5-PCB-114 USEPA 8270C/8270D-SIM 0.2 CL5-PCB-118 USEPA 8270C/8270D-SIM 0.2 CL5-PCB-119 USEPA 8270C/8270D-SIM 0.2 CL5-PCB-123 USEPA 8270C/8270D-SIM 0.2 CL5-PCB-126 USEPA 8270C/8270D-SIM 0.2 CL6-PCB-128 USEPA 8270C/8270D-SIM 0.2 CL6-PCB-138 USEPA 8270C/8270D-SIM 0.2 CL6-PCB-149 USEPA 8270C/8270D-SIM 0.2 CL6-PCB-151 USEPA 8270C/8270D-SIM 0.2 CL6-PCB-153 USEPA 8270C/8270D-SIM 0.2 CL6-PCB-156 USEPA 8270C/8270D-SIM 0.2 CL6-PCB-157 USEPA 8270C/8270D-SIM 0.2 CL6-PCB-158 USEPA 8270C/8270D-SIM 0.2 CL6-PCB-167 USEPA 8270C/8270D-SIM 0.2
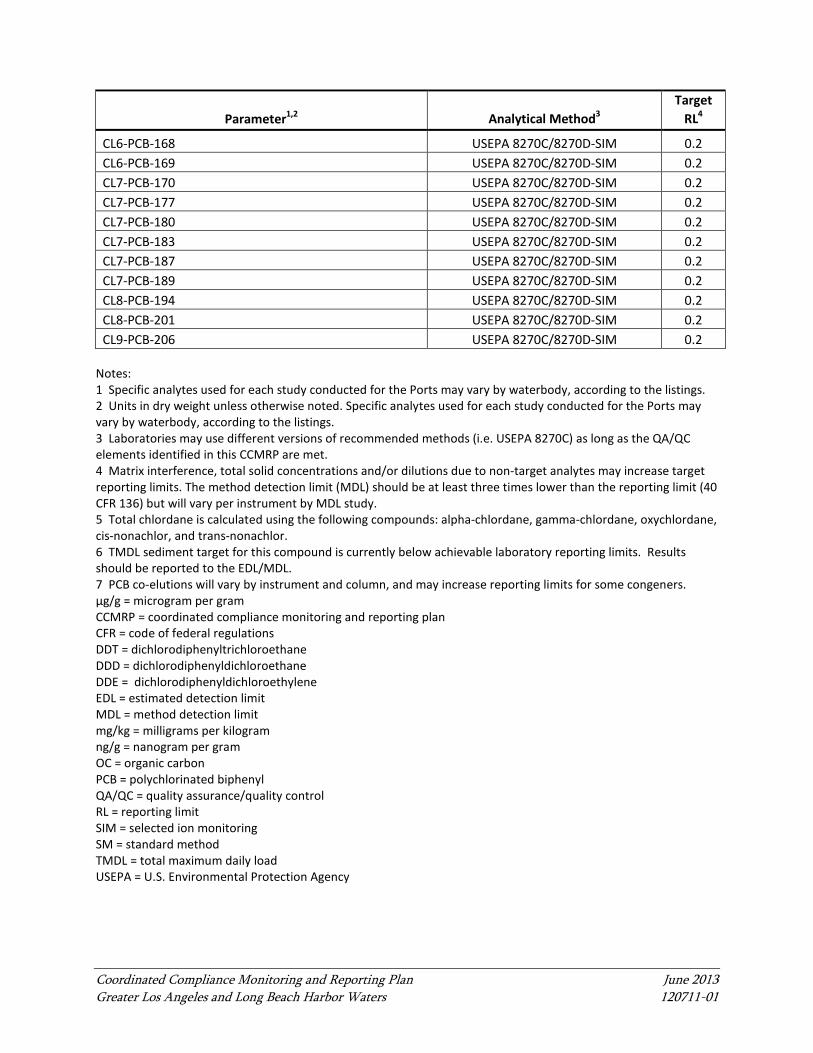
Coordinated Compliance Monitoring and Reporting Plan June 2013 Greater Los Angeles and Long Beach Harbor Waters 120711-01
Parameter1,2 Analytical Method3 Target
RL4
CL6-PCB-168 USEPA 8270C/8270D-SIM 0.2 CL6-PCB-169 USEPA 8270C/8270D-SIM 0.2 CL7-PCB-170 USEPA 8270C/8270D-SIM 0.2 CL7-PCB-177 USEPA 8270C/8270D-SIM 0.2 CL7-PCB-180 USEPA 8270C/8270D-SIM 0.2 CL7-PCB-183 USEPA 8270C/8270D-SIM 0.2 CL7-PCB-187 USEPA 8270C/8270D-SIM 0.2 CL7-PCB-189 USEPA 8270C/8270D-SIM 0.2 CL8-PCB-194 USEPA 8270C/8270D-SIM 0.2 CL8-PCB-201 USEPA 8270C/8270D-SIM 0.2 CL9-PCB-206 USEPA 8270C/8270D-SIM 0.2
Notes: 1 Specific analytes used for each study conducted for the Ports may vary by waterbody, according to the listings. 2 Units in dry weight unless otherwise noted. Specific analytes used for each study conducted for the Ports may vary by waterbody, according to the listings. 3 Laboratories may use different versions of recommended methods (i.e. USEPA 8270C) as long as the QA/QC elements identified in this CCMRP are met. 4 Matrix interference, total solid concentrations and/or dilutions due to non-target analytes may increase target reporting limits. The method detection limit (MDL) should be at least three times lower than the reporting limit (40 CFR 136) but will vary per instrument by MDL study. 5 Total chlordane is calculated using the following compounds: alpha-chlordane, gamma-chlordane, oxychlordane, cis-nonachlor, and trans-nonachlor. 6 TMDL sediment target for this compound is currently below achievable laboratory reporting limits. Results should be reported to the EDL/MDL. 7 PCB co-elutions will vary by instrument and column, and may increase reporting limits for some congeners. µg/g = microgram per gram CCMRP = coordinated compliance monitoring and reporting plan CFR = code of federal regulations DDT = dichlorodiphenyltrichloroethane DDD = dichlorodiphenyldichloroethane DDE = dichlorodiphenyldichloroethylene EDL = estimated detection limit MDL = method detection limit mg/kg = milligrams per kilogram ng/g = nanogram per gram OC = organic carbon PCB = polychlorinated biphenyl QA/QC = quality assurance/quality control RL = reporting limit SIM = selected ion monitoring SM = standard method TMDL = total maximum daily load USEPA = U.S. Environmental Protection Agency
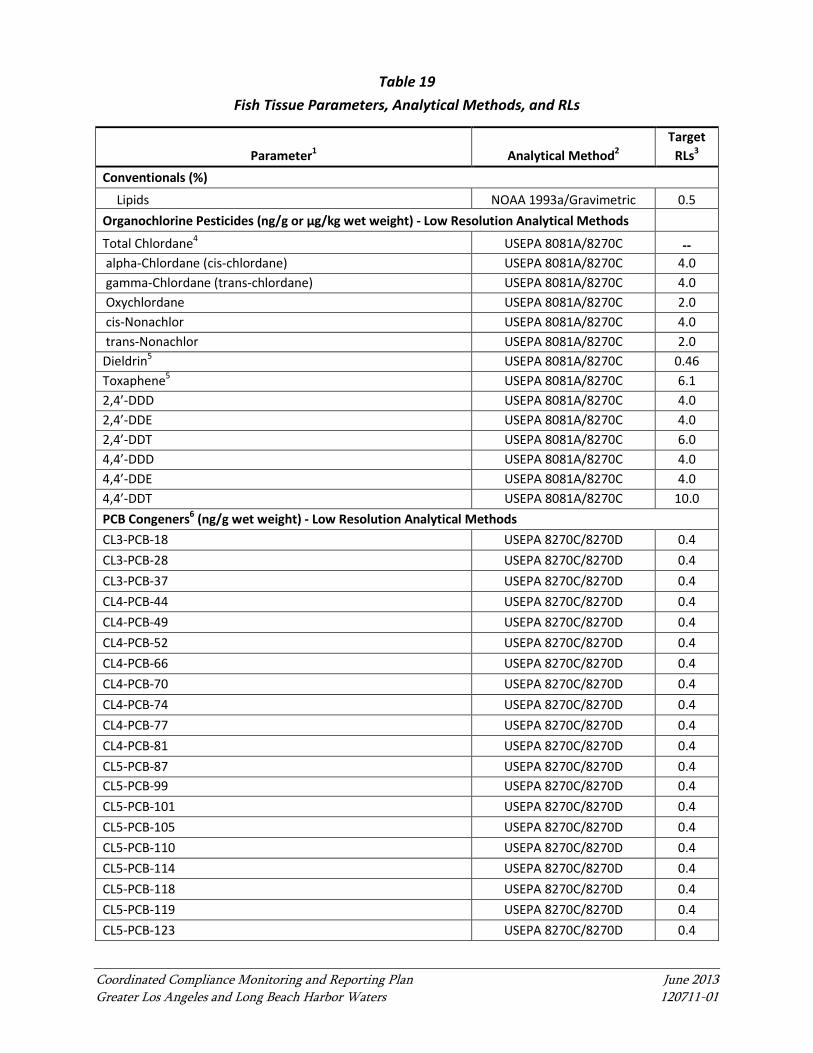
Coordinated Compliance Monitoring and Reporting Plan June 2013 Greater Los Angeles and Long Beach Harbor Waters 120711-01
Table 19 Fish Tissue Parameters, Analytical Methods, and RLs
Parameter1 Analytical Method2 Target
RLs3 Conventionals (%)
Lipids NOAA 1993a/Gravimetric 0.5 Organochlorine Pesticides (ng/g or µg/kg wet weight) - Low Resolution Analytical Methods Total Chlordane4 USEPA 8081A/8270C -- alpha‐Chlordane (cis‐chlordane) USEPA 8081A/8270C 4.0 gamma‐Chlordane (trans‐chlordane) USEPA 8081A/8270C 4.0 Oxychlordane USEPA 8081A/8270C 2.0 cis‐Nonachlor USEPA 8081A/8270C 4.0 trans‐Nonachlor USEPA 8081A/8270C 2.0 Dieldrin5 USEPA 8081A/8270C 0.46 Toxaphene5 USEPA 8081A/8270C 6.1 2,4’‐DDD USEPA 8081A/8270C 4.0 2,4’‐DDE USEPA 8081A/8270C 4.0 2,4’‐DDT USEPA 8081A/8270C 6.0 4,4’‐DDD USEPA 8081A/8270C 4.0 4,4’‐DDE USEPA 8081A/8270C 4.0 4,4’‐DDT USEPA 8081A/8270C 10.0 PCB Congeners6 (ng/g wet weight) - Low Resolution Analytical Methods CL3‐PCB‐18 USEPA 8270C/8270D 0.4 CL3‐PCB‐28 USEPA 8270C/8270D 0.4 CL3‐PCB‐37 USEPA 8270C/8270D 0.4 CL4‐PCB‐44 USEPA 8270C/8270D 0.4 CL4‐PCB‐49 USEPA 8270C/8270D 0.4 CL4‐PCB‐52 USEPA 8270C/8270D 0.4 CL4‐PCB‐66 USEPA 8270C/8270D 0.4 CL4‐PCB‐70 USEPA 8270C/8270D 0.4 CL4‐PCB‐74 USEPA 8270C/8270D 0.4 CL4‐PCB‐77 USEPA 8270C/8270D 0.4 CL4‐PCB‐81 USEPA 8270C/8270D 0.4 CL5‐PCB‐87 USEPA 8270C/8270D 0.4 CL5‐PCB‐99 USEPA 8270C/8270D 0.4 CL5‐PCB‐101 USEPA 8270C/8270D 0.4 CL5‐PCB‐105 USEPA 8270C/8270D 0.4 CL5‐PCB‐110 USEPA 8270C/8270D 0.4 CL5‐PCB‐114 USEPA 8270C/8270D 0.4 CL5‐PCB‐118 USEPA 8270C/8270D 0.4 CL5‐PCB‐119 USEPA 8270C/8270D 0.4 CL5‐PCB‐123 USEPA 8270C/8270D 0.4
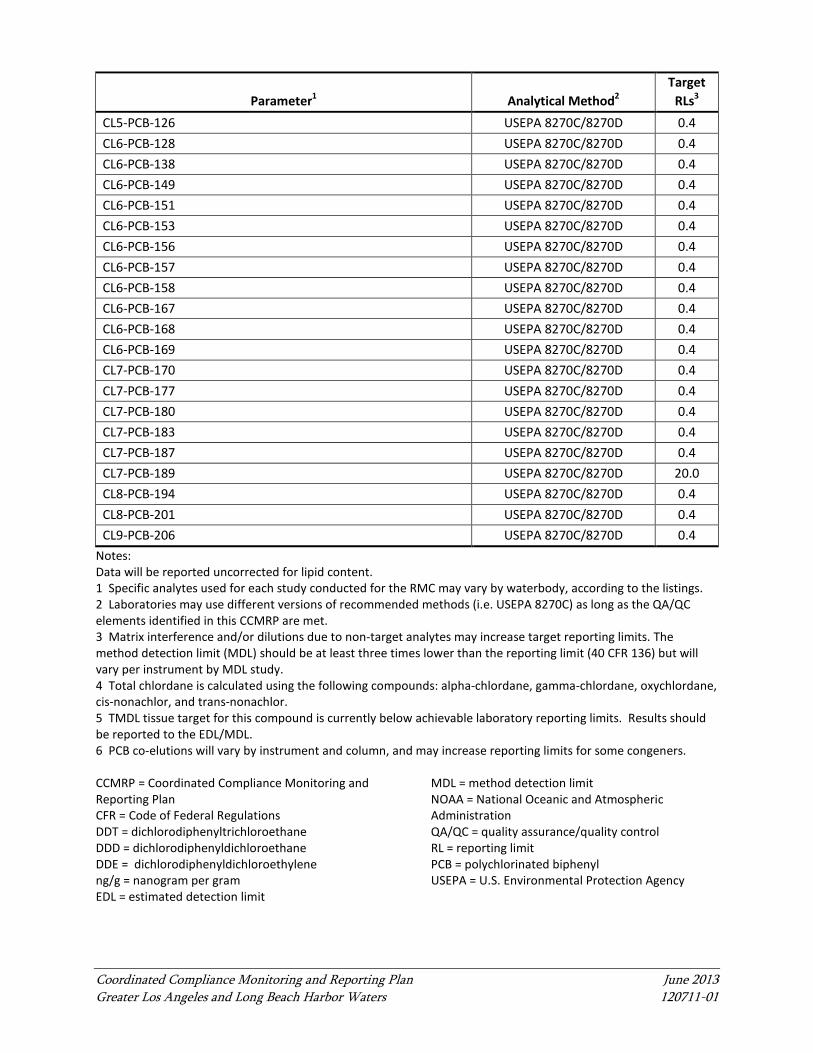
Coordinated Compliance Monitoring and Reporting Plan June 2013 Greater Los Angeles and Long Beach Harbor Waters 120711-01
Parameter1 Analytical Method2 Target
RLs3 CL5‐PCB‐126 USEPA 8270C/8270D 0.4 CL6‐PCB‐128 USEPA 8270C/8270D 0.4 CL6‐PCB‐138 USEPA 8270C/8270D 0.4 CL6‐PCB‐149 USEPA 8270C/8270D 0.4 CL6‐PCB‐151 USEPA 8270C/8270D 0.4 CL6‐PCB‐153 USEPA 8270C/8270D 0.4 CL6‐PCB‐156 USEPA 8270C/8270D 0.4 CL6‐PCB‐157 USEPA 8270C/8270D 0.4 CL6‐PCB‐158 USEPA 8270C/8270D 0.4 CL6‐PCB‐167 USEPA 8270C/8270D 0.4 CL6‐PCB‐168 USEPA 8270C/8270D 0.4 CL6‐PCB‐169 USEPA 8270C/8270D 0.4 CL7‐PCB‐170 USEPA 8270C/8270D 0.4 CL7‐PCB‐177 USEPA 8270C/8270D 0.4 CL7‐PCB‐180 USEPA 8270C/8270D 0.4 CL7‐PCB‐183 USEPA 8270C/8270D 0.4 CL7‐PCB‐187 USEPA 8270C/8270D 0.4 CL7‐PCB‐189 USEPA 8270C/8270D 20.0 CL8‐PCB‐194 USEPA 8270C/8270D 0.4 CL8‐PCB‐201 USEPA 8270C/8270D 0.4 CL9‐PCB‐206 USEPA 8270C/8270D 0.4
Notes: Data will be reported uncorrected for lipid content. 1 Specific analytes used for each study conducted for the RMC may vary by waterbody, according to the listings. 2 Laboratories may use different versions of recommended methods (i.e. USEPA 8270C) as long as the QA/QC elements identified in this CCMRP are met. 3 Matrix interference and/or dilutions due to non‐target analytes may increase target reporting limits. The method detection limit (MDL) should be at least three times lower than the reporting limit (40 CFR 136) but will vary per instrument by MDL study. 4 Total chlordane is calculated using the following compounds: alpha‐chlordane, gamma‐chlordane, oxychlordane, cis‐nonachlor, and trans‐nonachlor. 5 TMDL tissue target for this compound is currently below achievable laboratory reporting limits. Results should be reported to the EDL/MDL. 6 PCB co‐elutions will vary by instrument and column, and may increase reporting limits for some congeners. CCMRP = Coordinated Compliance Monitoring and Reporting Plan CFR = Code of Federal Regulations DDT = dichlorodiphenyltrichloroethane DDD = dichlorodiphenyldichloroethane DDE = dichlorodiphenyldichloroethylene ng/g = nanogram per gram EDL = estimated detection limit
MDL = method detection limit NOAA = National Oceanic and Atmospheric Administration QA/QC = quality assurance/quality control RL = reporting limit PCB = polychlorinated biphenyl USEPA = U.S. Environmental Protection Agency
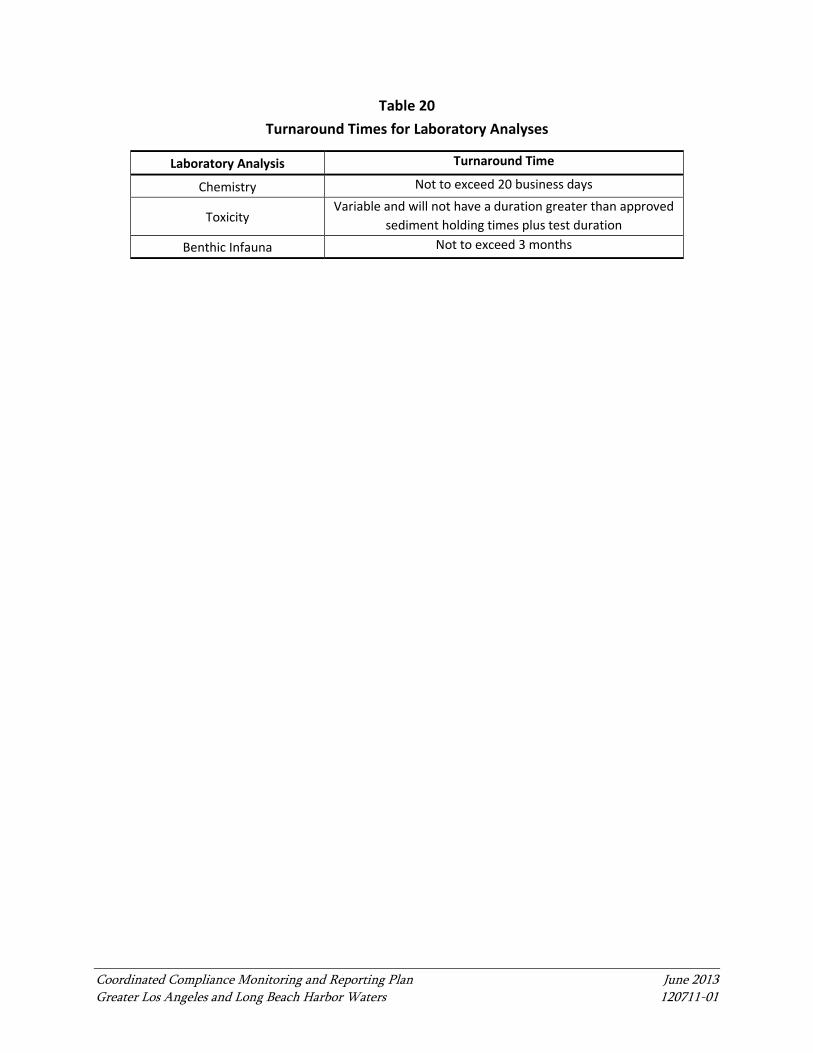
Coordinated Compliance Monitoring and Reporting Plan June 2013 Greater Los Angeles and Long Beach Harbor Waters 120711-01
Table 20 Turnaround Times for Laboratory Analyses
Laboratory Analysis Turnaround Time
Chemistry Not to exceed 20 business days
Toxicity Variable and will not have a duration greater than approved
sediment holding times plus test duration Benthic Infauna Not to exceed 3 months
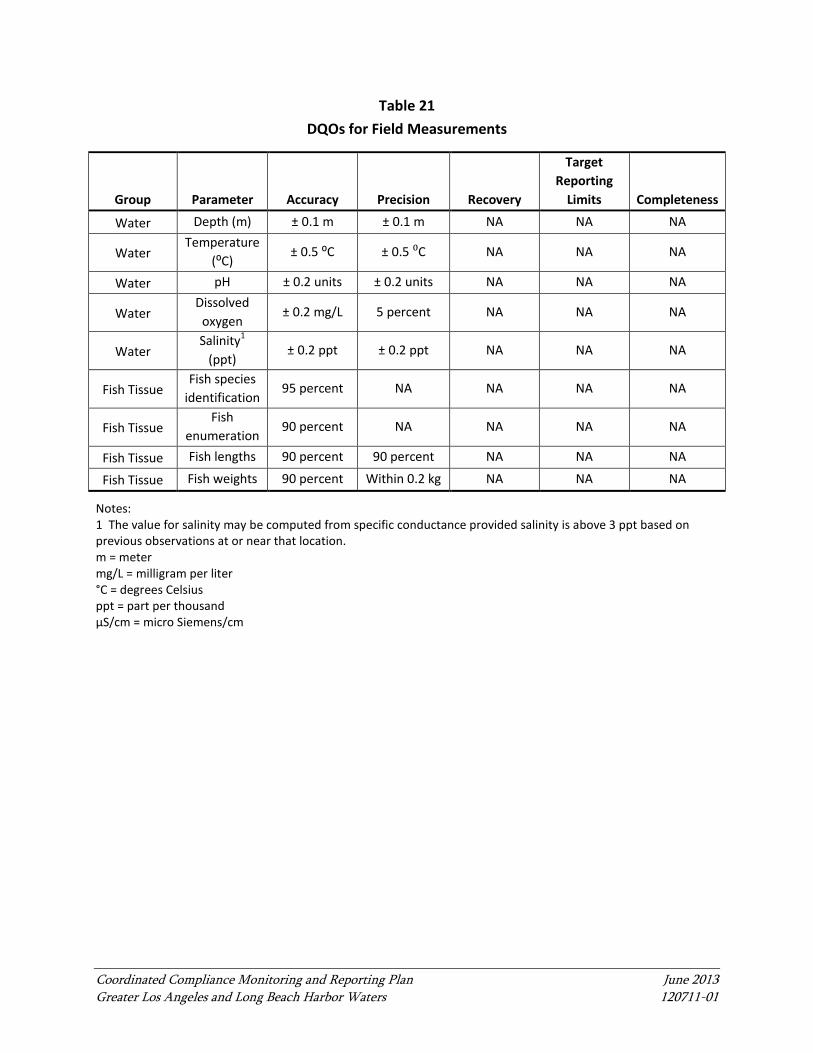
Coordinated Compliance Monitoring and Reporting Plan June 2013 Greater Los Angeles and Long Beach Harbor Waters 120711-01
Table 21 DQOs for Field Measurements
Notes: 1 The value for salinity may be computed from specific conductance provided salinity is above 3 ppt based on previous observations at or near that location. m = meter mg/L = milligram per liter °C = degrees Celsius ppt = part per thousand µS/cm = micro Siemens/cm
Group Parameter Accuracy Precision Recovery
Target Reporting
Limits Completeness
Water Depth (m) ± 0.1 m ± 0.1 m NA NA NA
Water Temperature
(⁰C) ± 0.5 ⁰C ± 0.5 ⁰C NA NA NA
Water pH ± 0.2 units ± 0.2 units NA NA NA
Water Dissolved
oxygen ± 0.2 mg/L 5 percent NA NA NA
Water Salinity1
(ppt) ± 0.2 ppt ± 0.2 ppt NA NA NA
Fish Tissue Fish species
identification 95 percent NA NA NA NA
Fish Tissue Fish
enumeration 90 percent NA NA NA NA
Fish Tissue Fish lengths 90 percent 90 percent NA NA NA
Fish Tissue Fish weights 90 percent Within 0.2 kg NA NA NA
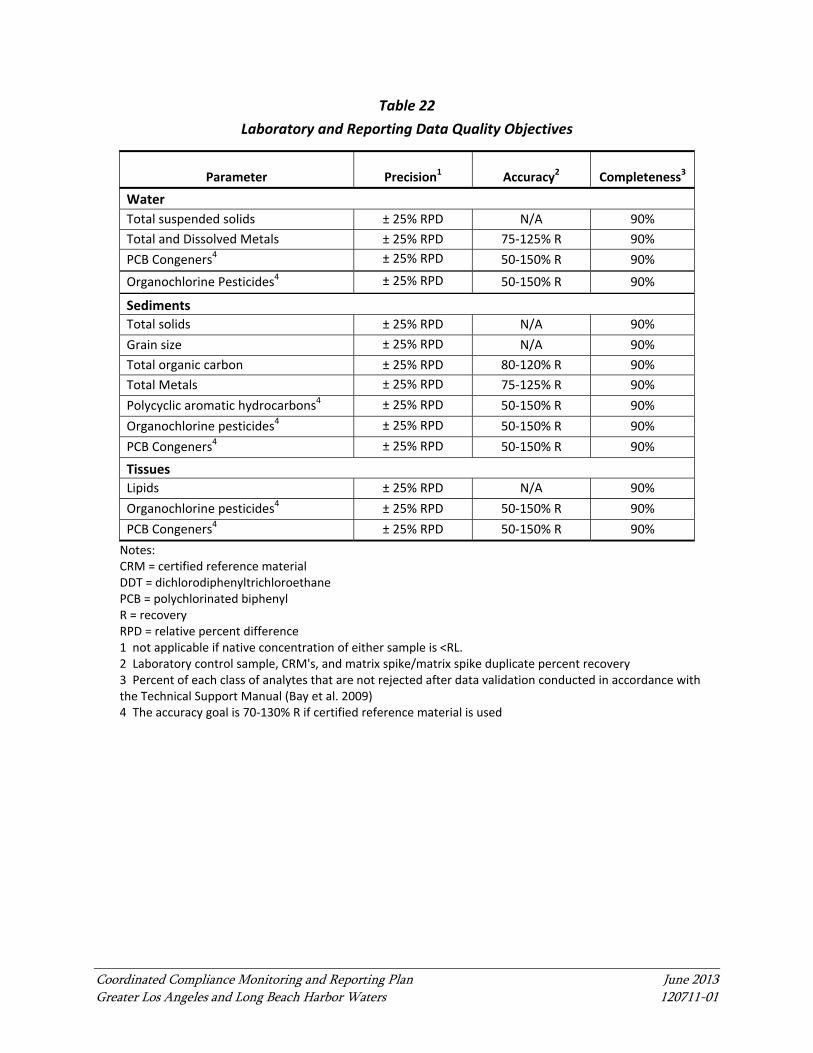
Coordinated Compliance Monitoring and Reporting Plan June 2013 Greater Los Angeles and Long Beach Harbor Waters 120711-01
Table 22
Laboratory and Reporting Data Quality Objectives
Parameter Precision1 Accuracy2 Completeness3
Water
Total suspended solids ± 25% RPD N/A 90%
Total and Dissolved Metals ± 25% RPD 75‐125% R 90%
PCB Congeners4 ± 25% RPD 50‐150% R 90%
Organochlorine Pesticides4 ± 25% RPD 50‐150% R 90%
Sediments
Total solids ± 25% RPD N/A 90%
Grain size ± 25% RPD N/A 90%
Total organic carbon ± 25% RPD 80‐120% R 90%
Total Metals ± 25% RPD 75‐125% R 90%
Polycyclic aromatic hydrocarbons4 ± 25% RPD 50‐150% R 90%
Organochlorine pesticides4 ± 25% RPD 50‐150% R 90%
PCB Congeners4 ± 25% RPD 50‐150% R 90%
Tissues
Lipids ± 25% RPD N/A 90%
Organochlorine pesticides4 ± 25% RPD 50‐150% R 90%
PCB Congeners4 ± 25% RPD 50‐150% R 90%
Notes: CRM = certified reference material DDT = dichlorodiphenyltrichloroethane PCB = polychlorinated biphenyl R = recovery RPD = relative percent difference 1 not applicable if native concentration of either sample is <RL. 2 Laboratory control sample, CRM's, and matrix spike/matrix spike duplicate percent recovery 3 Percent of each class of analytes that are not rejected after data validation conducted in accordance with the Technical Support Manual (Bay et al. 2009) 4 The accuracy goal is 70‐130% R if certified reference material is used
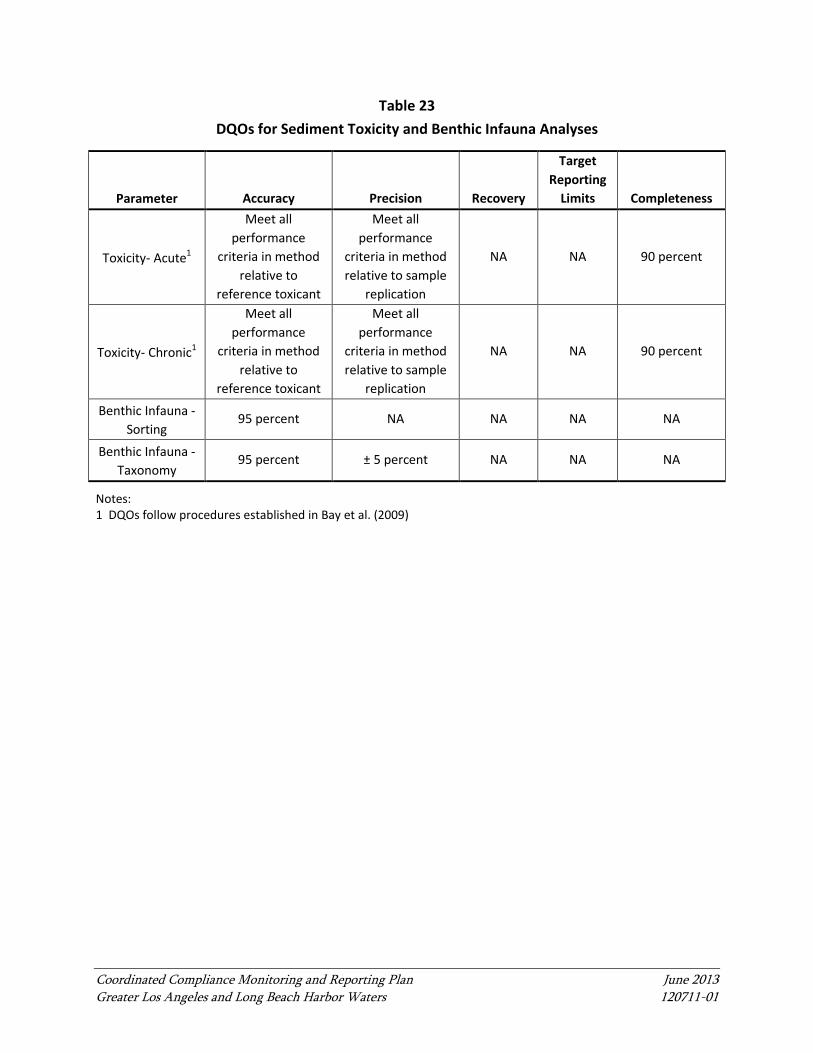
Coordinated Compliance Monitoring and Reporting Plan June 2013 Greater Los Angeles and Long Beach Harbor Waters 120711-01
Table 23 DQOs for Sediment Toxicity and Benthic Infauna Analyses
Parameter Accuracy Precision Recovery
Target Reporting
Limits Completeness
Toxicity- Acute1
Meet all performance
criteria in method relative to
reference toxicant
Meet all performance
criteria in method relative to sample
replication
NA NA 90 percent
Toxicity- Chronic1
Meet all performance
criteria in method relative to
reference toxicant
Meet all performance
criteria in method relative to sample
replication
NA NA 90 percent
Benthic Infauna -Sorting
95 percent NA NA NA NA
Benthic Infauna -Taxonomy
95 percent ± 5 percent NA NA NA
Notes: 1 DQOs follow procedures established in Bay et al. (2009)
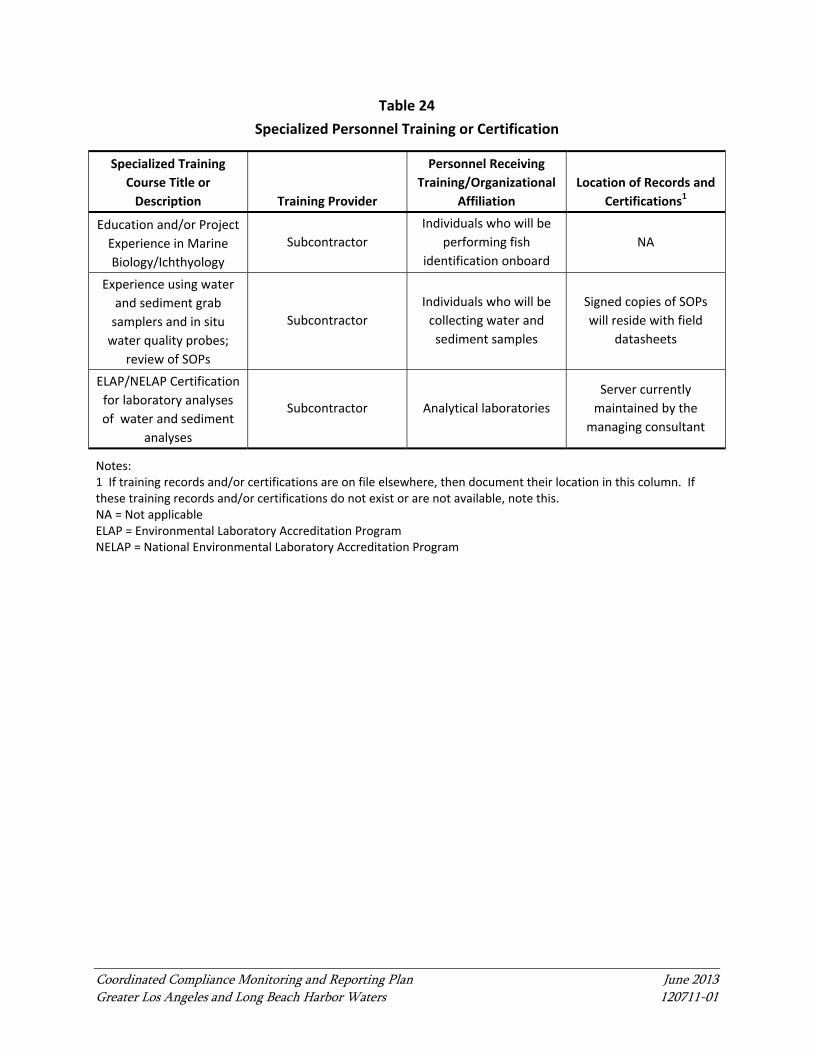
Coordinated Compliance Monitoring and Reporting Plan June 2013 Greater Los Angeles and Long Beach Harbor Waters 120711-01
Table 24
Specialized Personnel Training or Certification
Specialized Training
Course Title or
Description Training Provider
Personnel Receiving
Training/Organizational
Affiliation
Location of Records and
Certifications1
Education and/or Project
Experience in Marine
Biology/Ichthyology
Subcontractor
Individuals who will be
performing fish
identification onboard
NA
Experience using water
and sediment grab
samplers and in situ
water quality probes;
review of SOPs
Subcontractor
Individuals who will be
collecting water and
sediment samples
Signed copies of SOPs
will reside with field
datasheets
ELAP/NELAP Certification
for laboratory analyses
of water and sediment
analyses
Subcontractor Analytical laboratories
Server currently
maintained by the
managing consultant
Notes: 1 If training records and/or certifications are on file elsewhere, then document their location in this column. If these training records and/or certifications do not exist or are not available, note this. NA = Not applicable ELAP = Environmental Laboratory Accreditation Program NELAP = National Environmental Laboratory Accreditation Program
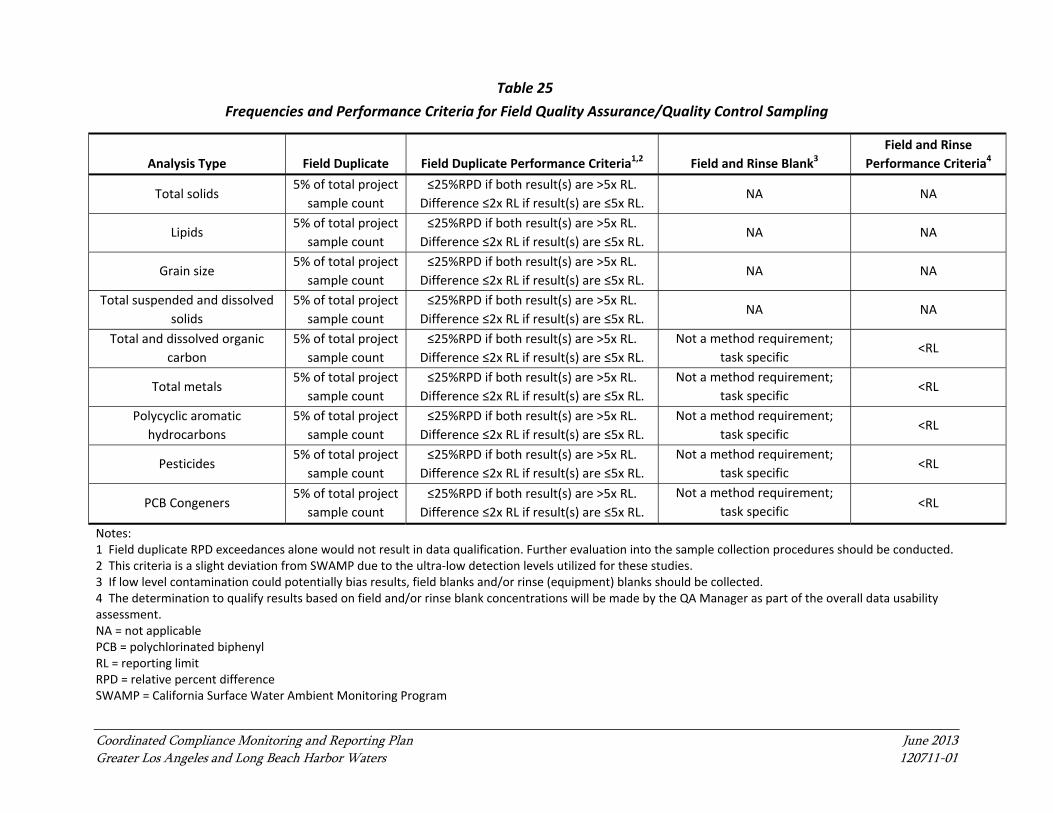
Coordinated Compliance Monitoring and Reporting Plan June 2013 Greater Los Angeles and Long Beach Harbor Waters 120711-01
Table 25
Frequencies and Performance Criteria for Field Quality Assurance/Quality Control Sampling
Analysis Type Field Duplicate Field Duplicate Performance Criteria1,2 Field and Rinse Blank3
Field and Rinse
Performance Criteria4
Total solids 5% of total project
sample count
≤25%RPD if both result(s) are >5x RL.
Difference ≤2x RL if result(s) are ≤5x RL. NA NA
Lipids 5% of total project
sample count
≤25%RPD if both result(s) are >5x RL.
Difference ≤2x RL if result(s) are ≤5x RL. NA NA
Grain size 5% of total project
sample count
≤25%RPD if both result(s) are >5x RL.
Difference ≤2x RL if result(s) are ≤5x RL. NA NA
Total suspended and dissolved
solids
5% of total project
sample count
≤25%RPD if both result(s) are >5x RL.
Difference ≤2x RL if result(s) are ≤5x RL. NA NA
Total and dissolved organic
carbon
5% of total project
sample count
≤25%RPD if both result(s) are >5x RL.
Difference ≤2x RL if result(s) are ≤5x RL.
Not a method requirement;
task specific <RL
Total metals 5% of total project
sample count
≤25%RPD if both result(s) are >5x RL.
Difference ≤2x RL if result(s) are ≤5x RL.
Not a method requirement;
task specific <RL
Polycyclic aromatic
hydrocarbons
5% of total project
sample count
≤25%RPD if both result(s) are >5x RL.
Difference ≤2x RL if result(s) are ≤5x RL.
Not a method requirement;
task specific <RL
Pesticides 5% of total project
sample count
≤25%RPD if both result(s) are >5x RL.
Difference ≤2x RL if result(s) are ≤5x RL.
Not a method requirement;
task specific <RL
PCB Congeners 5% of total project
sample count
≤25%RPD if both result(s) are >5x RL.
Difference ≤2x RL if result(s) are ≤5x RL.
Not a method requirement;
task specific <RL
Notes: 1 Field duplicate RPD exceedances alone would not result in data qualification. Further evaluation into the sample collection procedures should be conducted. 2 This criteria is a slight deviation from SWAMP due to the ultra‐low detection levels utilized for these studies. 3 If low level contamination could potentially bias results, field blanks and/or rinse (equipment) blanks should be collected. 4 The determination to qualify results based on field and/or rinse blank concentrations will be made by the QA Manager as part of the overall data usability assessment. NA = not applicable PCB = polychlorinated biphenyl RL = reporting limit RPD = relative percent difference SWAMP = California Surface Water Ambient Monitoring Program

Coordinated Compliance Monitoring and Reporting Plan June 2013 Greater Los Angeles and Long Beach Harbor Waters 120711-01
Table 26
Frequencies and Performance Criteria for Laboratory Quality Assurance/Quality Control Samples
Analysis Type Initial Calibration1,2
Continuing
Calibration
Verification
LCS or
SRM3 Replicates
Matrix
Spikes
Matrix Spike
Duplicates
Method
Blanks
Surrogate
Spikes
Internal
Standard
Total solids Daily or each batch N/A N/A 1 per 20
samples N/A N/A N/A N/A N/A
Lipids Daily or each batch N/A N/A 1 per 20
samples N/A N/A N/A N/A N/A
Grain size Daily or each batch N/A N/A 1 per 20
samples N/A N/A N/A N/A N/A
Total suspended
and dissolved
solids
Daily or each batch N/A N/A 1 per 20
samples N/A N/A N/A N/A N/A
Total metals Daily or each batch
Per 10
analytical
runs
1 per 20
samples
or 1 per
batch
1 per 20
samples
or 1 per
batch
1 per 20
samples or 1
per batch
N/A Each
batch N/A
Per
method
PCB Congeners by
low resolution
method
As needed Every 12
hours
1 per 20
samples
or 1 per
batch
N/A
1 per 20
samples or 1
per batch
1 per 20
samples or 1
per batch
Each
batch
Every
sample
Every
sample
Polycyclic
aromatic
hydrocarbons
As needed Every 12
hours
1 per 20
samples
or 1 per
batch
N/A
1 per 20
samples or 1
per batch
1 per 20
samples or 1
per batch
Each
batch
Every
sample
Every
sample
Pesticides by low
resolution
method
As needed
Per 10
analytical
runs
1 per 20
samples
or 1 per
batch
N/A
1 per 20
samples or 1
per batch
1 per 20
samples or 1
per batch
Each
batch
Every
sample
Every
sample
Coordinated Compliance Monitoring and Reporting Plan June 2013 Greater Los Angeles and Long Beach Harbor Waters 120711-01
Notes: Primary column is considered the column that contains the highest value with the least interference. Values should have RPDs less than 40 percent or they are P flagged. ICALS = 20 percent or less and CCALS = 15 percent or less. 1 For physical tests, calibration and certification of drying ovens and weighing scales are conducted annually. 2 Calibrations should be conducted per analytical methods or instrument manufacturers specifications. 3 When a Standard Reference Material is not available, an LCS will be analyzed. DDT = dichlorodiphenyltrichloroethane LCS = Laboratory control sample SRM = standard reference material N/A = not applicable PCB = polychlorinated biphenyl
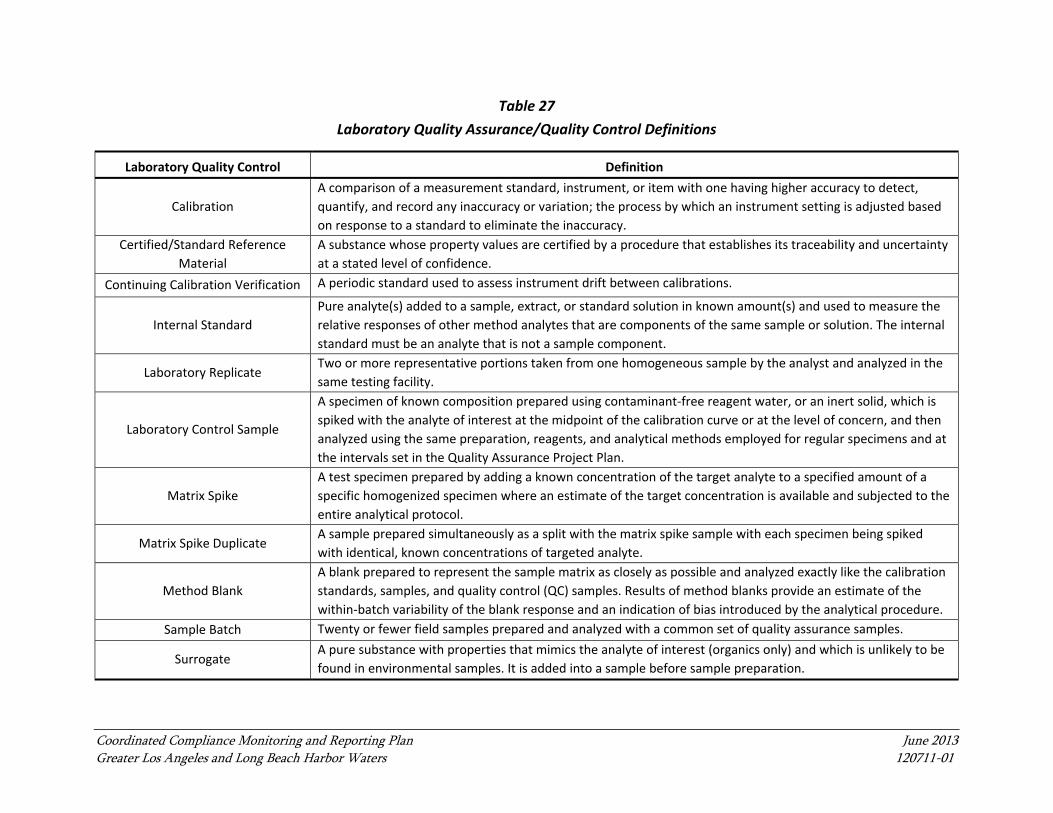
Coordinated Compliance Monitoring and Reporting Plan June 2013 Greater Los Angeles and Long Beach Harbor Waters 120711-01
Table 27
Laboratory Quality Assurance/Quality Control Definitions
Laboratory Quality Control Definition
Calibration
A comparison of a measurement standard, instrument, or item with one having higher accuracy to detect,
quantify, and record any inaccuracy or variation; the process by which an instrument setting is adjusted based
on response to a standard to eliminate the inaccuracy.
Certified/Standard Reference
Material
A substance whose property values are certified by a procedure that establishes its traceability and uncertainty
at a stated level of confidence.
Continuing Calibration Verification A periodic standard used to assess instrument drift between calibrations.
Internal Standard
Pure analyte(s) added to a sample, extract, or standard solution in known amount(s) and used to measure the
relative responses of other method analytes that are components of the same sample or solution. The internal
standard must be an analyte that is not a sample component.
Laboratory Replicate Two or more representative portions taken from one homogeneous sample by the analyst and analyzed in the
same testing facility.
Laboratory Control Sample
A specimen of known composition prepared using contaminant‐free reagent water, or an inert solid, which is
spiked with the analyte of interest at the midpoint of the calibration curve or at the level of concern, and then
analyzed using the same preparation, reagents, and analytical methods employed for regular specimens and at
the intervals set in the Quality Assurance Project Plan.
Matrix Spike
A test specimen prepared by adding a known concentration of the target analyte to a specified amount of a
specific homogenized specimen where an estimate of the target concentration is available and subjected to the
entire analytical protocol.
Matrix Spike Duplicate A sample prepared simultaneously as a split with the matrix spike sample with each specimen being spiked
with identical, known concentrations of targeted analyte.
Method Blank
A blank prepared to represent the sample matrix as closely as possible and analyzed exactly like the calibration
standards, samples, and quality control (QC) samples. Results of method blanks provide an estimate of the
within‐batch variability of the blank response and an indication of bias introduced by the analytical procedure.
Sample Batch Twenty or fewer field samples prepared and analyzed with a common set of quality assurance samples.
Surrogate A pure substance with properties that mimics the analyte of interest (organics only) and which is unlikely to be
found in environmental samples. It is added into a sample before sample preparation.
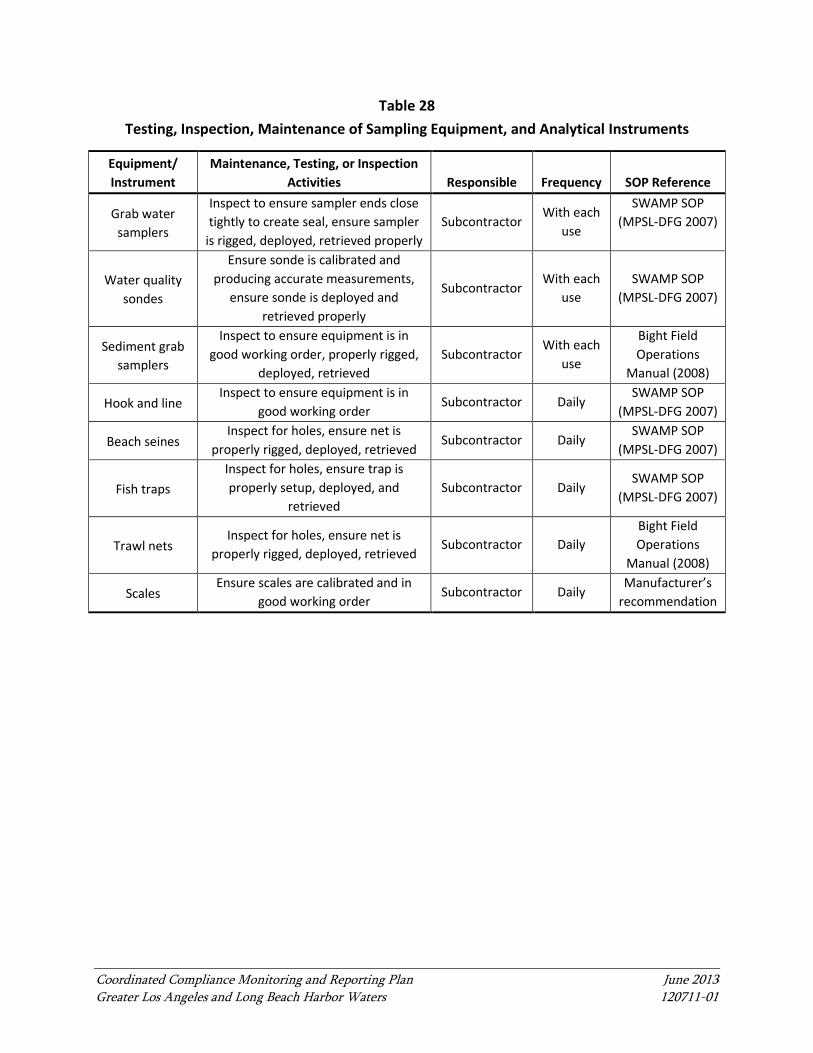
Coordinated Compliance Monitoring and Reporting Plan June 2013 Greater Los Angeles and Long Beach Harbor Waters 120711-01
Table 28 Testing, Inspection, Maintenance of Sampling Equipment, and Analytical Instruments
Equipment/ Instrument
Maintenance, Testing, or Inspection Activities Responsible Frequency SOP Reference
Grab water samplers
Inspect to ensure sampler ends close tightly to create seal, ensure sampler
is rigged, deployed, retrieved properly Subcontractor
With each use
SWAMP SOP (MPSL-DFG 2007)
Water quality sondes
Ensure sonde is calibrated and producing accurate measurements,
ensure sonde is deployed and retrieved properly
Subcontractor With each
use SWAMP SOP
(MPSL-DFG 2007)
Sediment grab samplers
Inspect to ensure equipment is in good working order, properly rigged,
deployed, retrieved Subcontractor
With each use
Bight Field Operations
Manual (2008)
Hook and line Inspect to ensure equipment is in
good working order Subcontractor Daily
SWAMP SOP (MPSL-DFG 2007)
Beach seines Inspect for holes, ensure net is
properly rigged, deployed, retrieved Subcontractor Daily
SWAMP SOP (MPSL-DFG 2007)
Fish traps Inspect for holes, ensure trap is properly setup, deployed, and
retrieved Subcontractor Daily
SWAMP SOP (MPSL-DFG 2007)
Trawl nets Inspect for holes, ensure net is
properly rigged, deployed, retrieved Subcontractor Daily
Bight Field Operations
Manual (2008)
Scales Ensure scales are calibrated and in
good working order Subcontractor Daily
Manufacturer’s recommendation
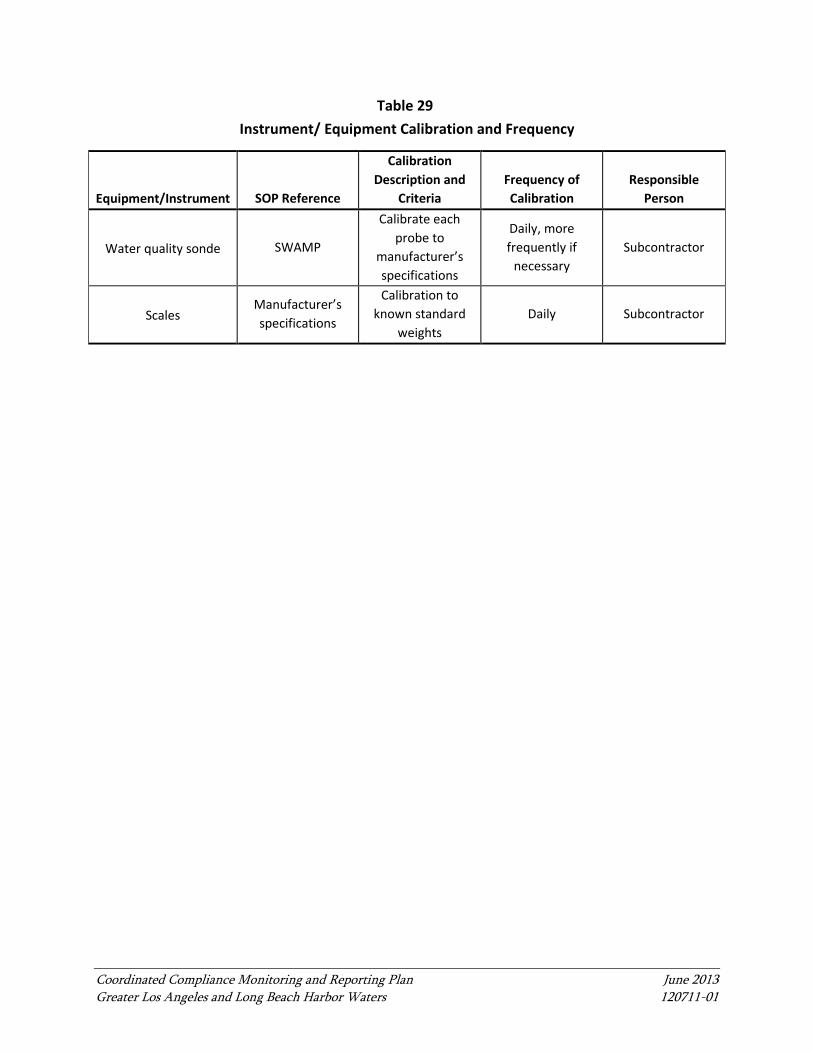
Coordinated Compliance Monitoring and Reporting Plan June 2013 Greater Los Angeles and Long Beach Harbor Waters 120711-01
Table 29 Instrument/ Equipment Calibration and Frequency
Equipment/Instrument SOP Reference
Calibration Description and
Criteria Frequency of Calibration
Responsible Person
Water quality sonde SWAMP
Calibrate each probe to
manufacturer’s specifications
Daily, more frequently if
necessary Subcontractor
Scales Manufacturer’s specifications
Calibration to known standard
weights Daily Subcontractor
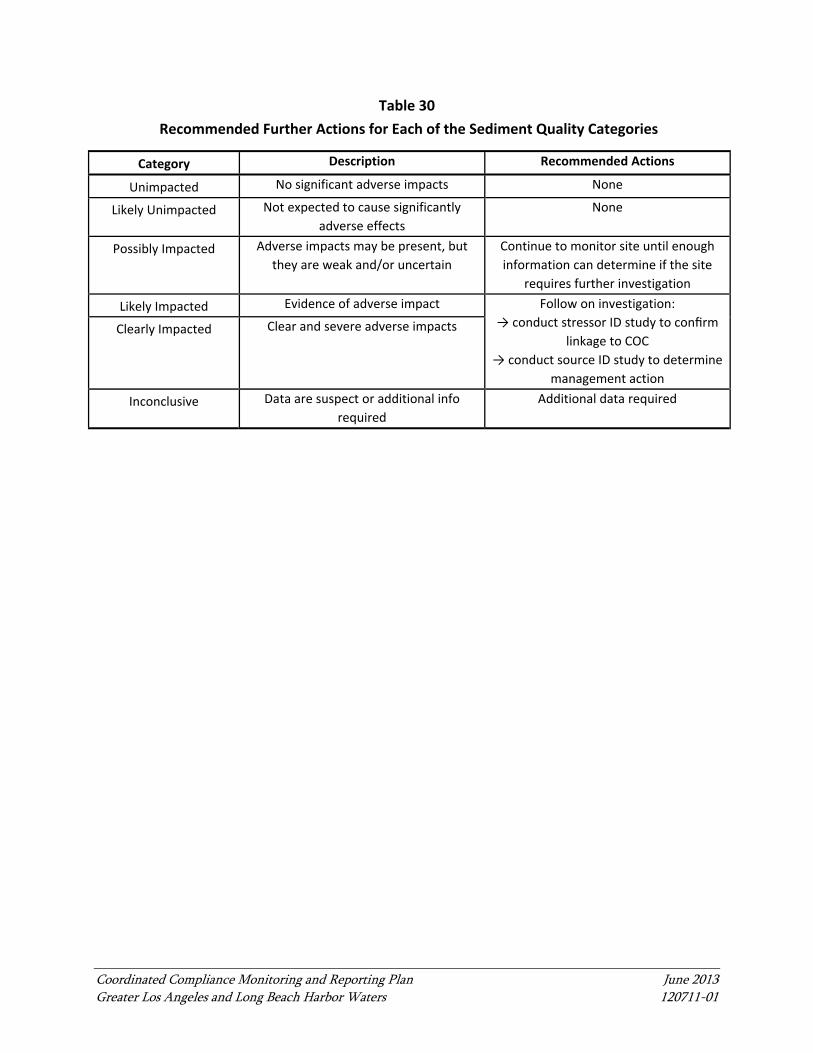
Coordinated Compliance Monitoring and Reporting Plan June 2013 Greater Los Angeles and Long Beach Harbor Waters 120711-01
Table 30
Recommended Further Actions for Each of the Sediment Quality Categories
Category Description Recommended Actions
Unimpacted No significant adverse impacts None
Likely Unimpacted Not expected to cause significantly
adverse effects
None
Possibly Impacted Adverse impacts may be present, but
they are weak and/or uncertain
Continue to monitor site until enough
information can determine if the site
requires further investigation
Likely Impacted Evidence of adverse impact Follow on investigation:
→ conduct stressor ID study to confirm
linkage to COC
→ conduct source ID study to determine
management action
Clearly Impacted Clear and severe adverse impacts
Inconclusive Data are suspect or additional info
required
Additional data required
FIGURES
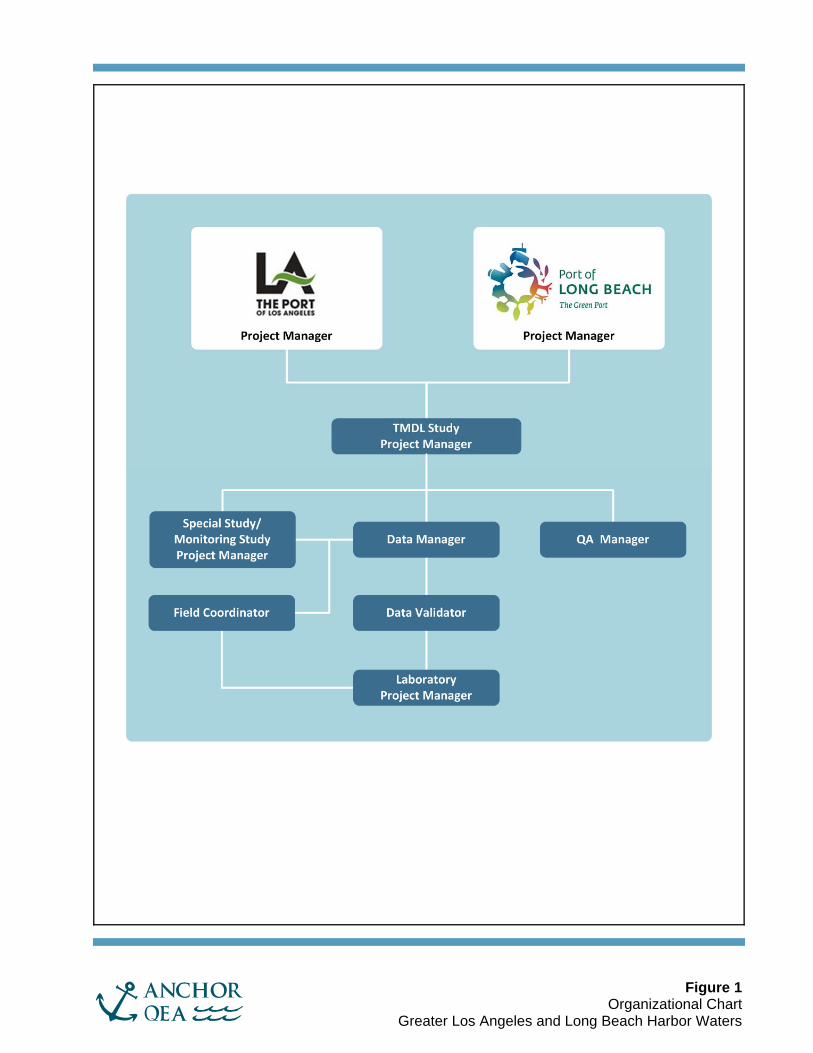
Figure 1 Organizational Chart
Greater Los Angeles and Long Beach Harbor Waters

!.
!.!.
!.
!.
!.
!.
!.
!.
!.
!.
!.
!.
!.
!.
!.
!.
!.
!.
!.
!.
!.
98
7
65
4
3 2
1
22
21
20
19
18
17
16
15
14
13
12
11
10
N:\Job
s\0603
43-01_
Port_o
f_Lon
g_Beac
h\Maps
\2013_
03\Fig
ure2_T
MDL_C
MP_St
atona
nd wat
erbod
ies.mx
d sles
kie 03
/13/20
13
0 4Miles[
Monitoring Locations!. Water and Sediment Monitoring!. Water, Sediment and Fish Tissue Monitoring
POLA/POLB WaterbodiesEast San Pedro BayLos Angeles Harbor - Fish HarborLos Angeles Harbor - Cabrillo MarinaLos Angeles Harbor - Consolidated SlipLos Angeles Harbor - Inner Cabrillo Beach AreaLos Angeles Inner HarborLos Angeles Outer Harbor (inside breakwater)Los Angeles River Estuary (Queensway Bay)Long Beach Inner HarborLong Beach Outer Harbor (inside breakwater)
Figure 2TMDL Compliance Monitoring Locations
Coordinated Compliance Monitoring and Reporting PlanGreater Los Angeles and Long Beach Harbor Waters
P a c i f i c O c e a n
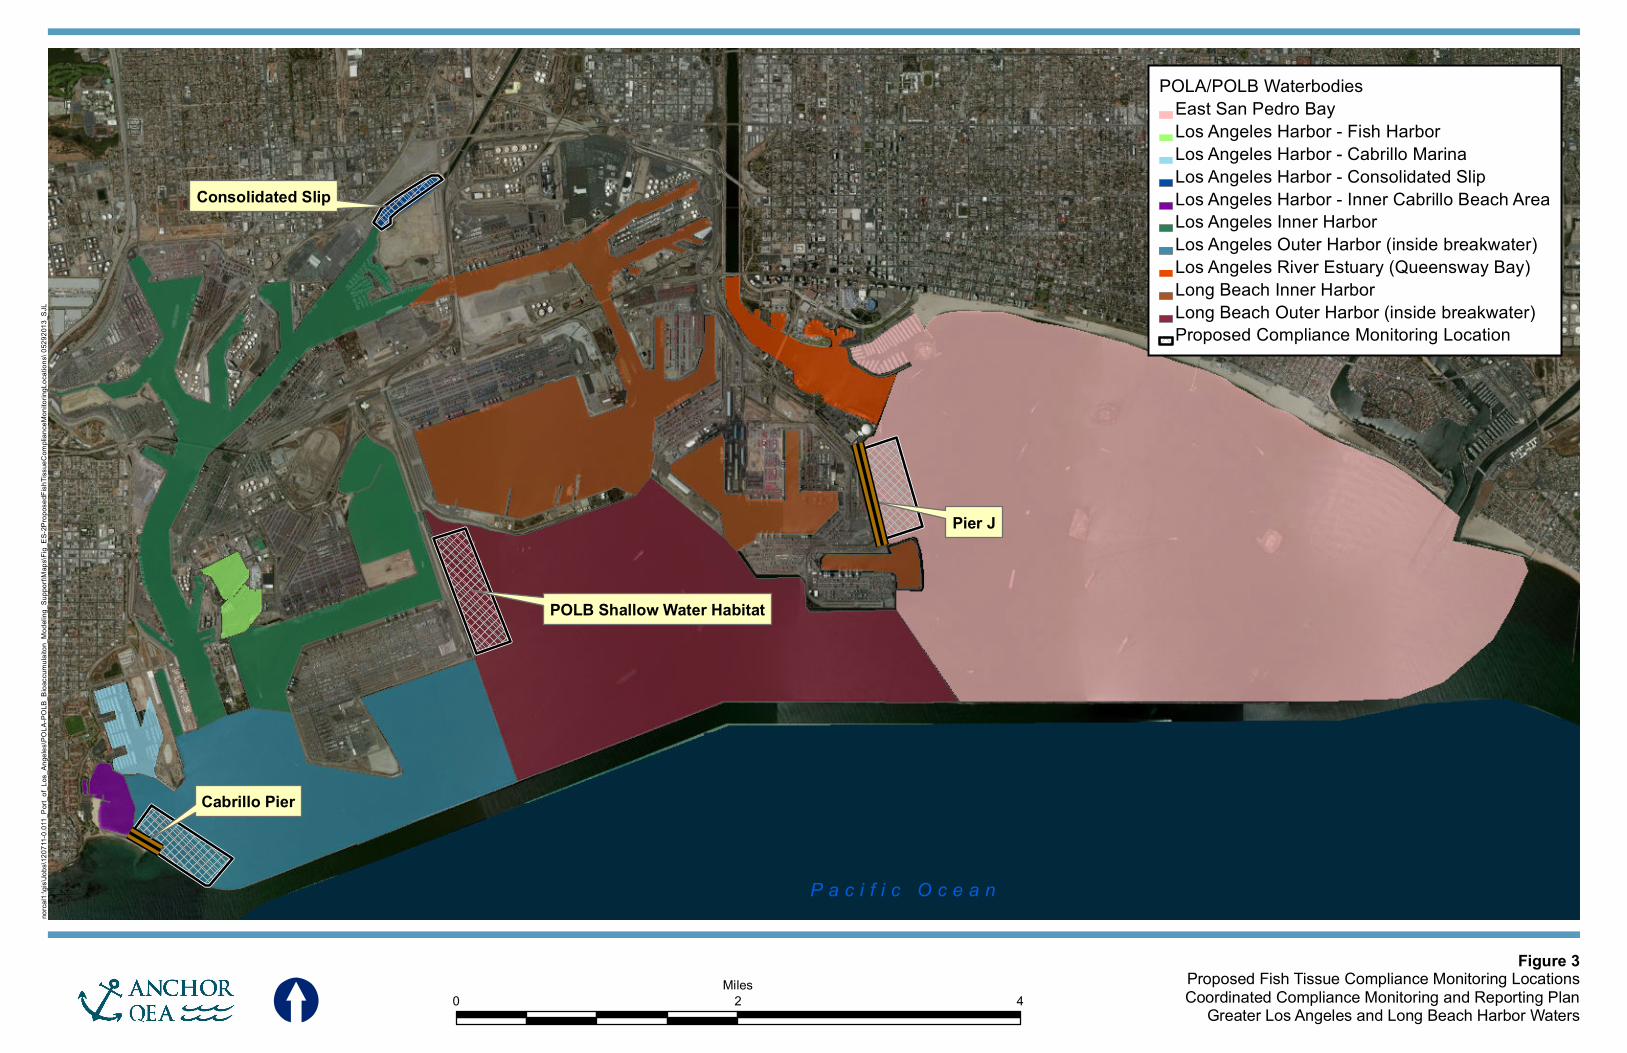
Figure 3Proposed Fish Tissue Compliance Monitoring LocationsCoordinated Compliance Monitoring and Reporting Plan
Greater Los Angeles and Long Beach Harbor Waters0 2 4
Miles
norca
l1:\gi
s\Job
s\120
711-0
.011_
Port_
of_Lo
s_An
geles
\POL
A-PO
LB_B
ioacc
umula
iton_
Mode
ling_
Supp
ort\M
aps\F
ig_ES
-2Prop
osed
FishT
issue
Comp
lianc
eMon
itorin
gLoc
ation
s\ 05
2920
13_S
JL
POLA/POLB WaterbodiesEast San Pedro BayLos Angeles Harbor - Fish HarborLos Angeles Harbor - Cabrillo MarinaLos Angeles Harbor - Consolidated SlipLos Angeles Harbor - Inner Cabrillo Beach AreaLos Angeles Inner HarborLos Angeles Outer Harbor (inside breakwater)Los Angeles River Estuary (Queensway Bay)Long Beach Inner HarborLong Beach Outer Harbor (inside breakwater)Proposed Compliance Monitoring Location
Cabrillo Pier
Pier J
POLB Shallow Water Habitat
P a c i f i c O c e a n
Consolidated Slip
[
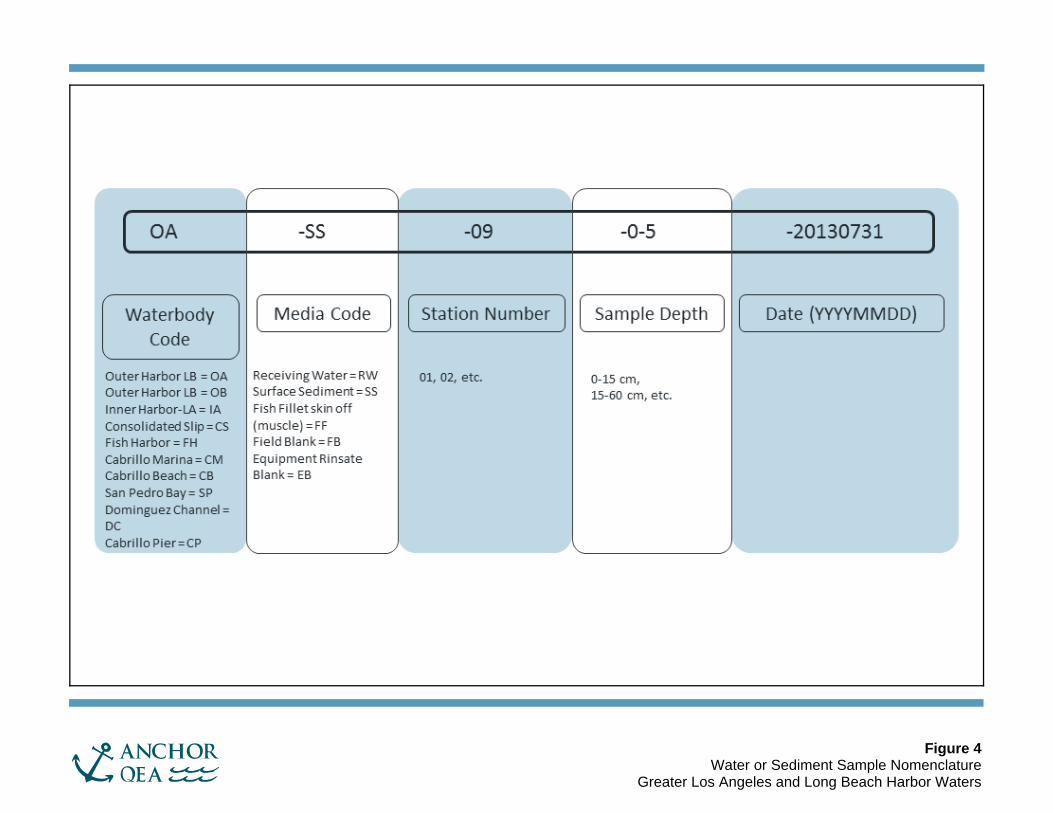
Figure 4 Water or Sediment Sample Nomenclature
Greater Los Angeles and Long Beach Harbor Waters
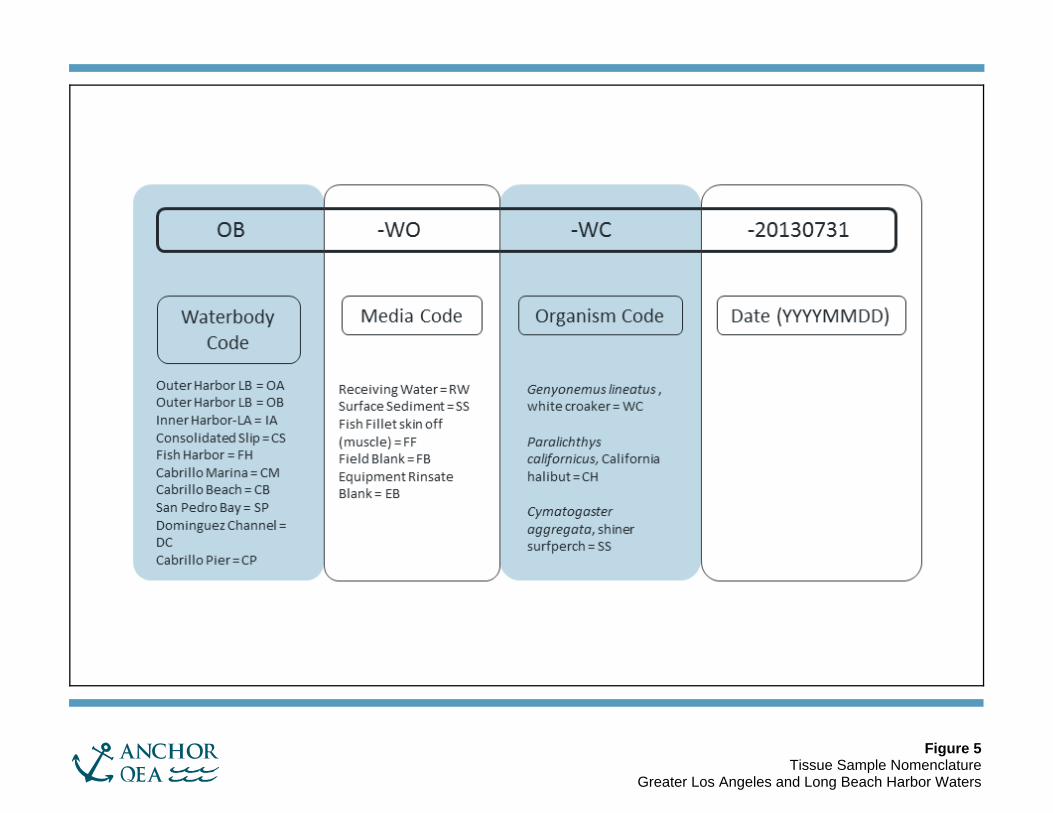
Figure 5 Tissue Sample Nomenclature
Greater Los Angeles and Long Beach Harbor Waters

Figure 6 Field Duplicate Sample Nomenclature
Greater Los Angeles and Long Beach Harbor Waters
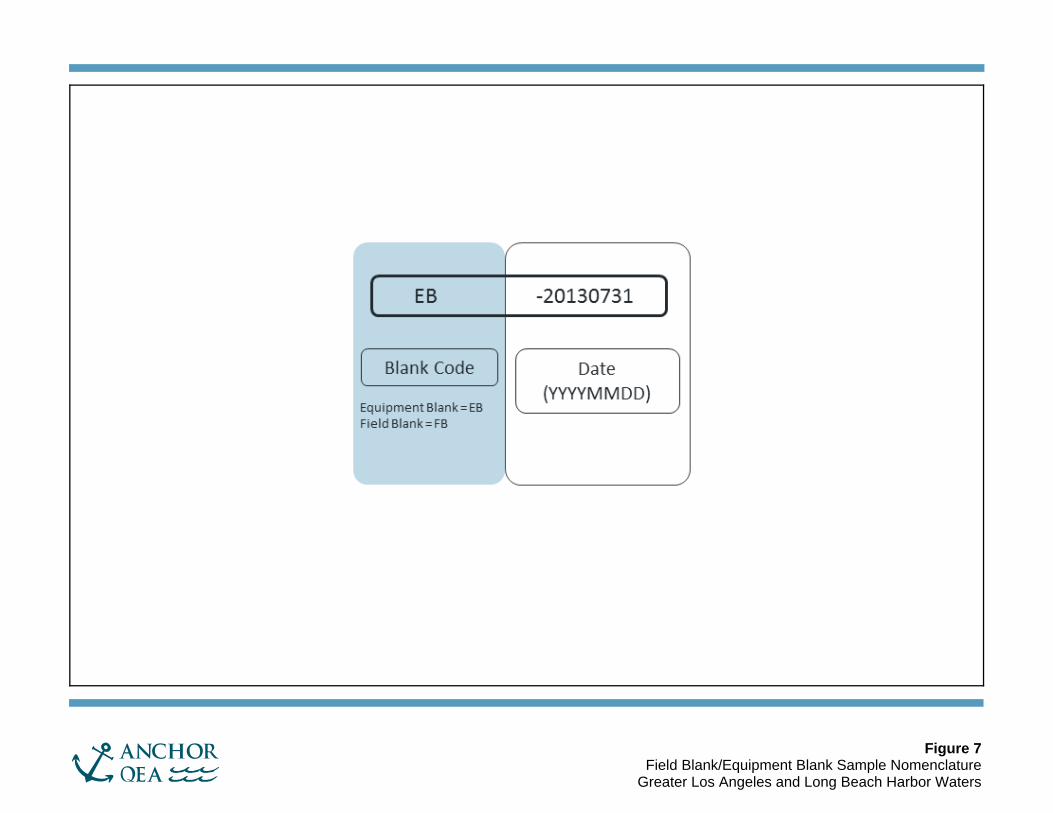
Figure 7 Field Blank/Equipment Blank Sample Nomenclature
Greater Los Angeles and Long Beach Harbor Waters
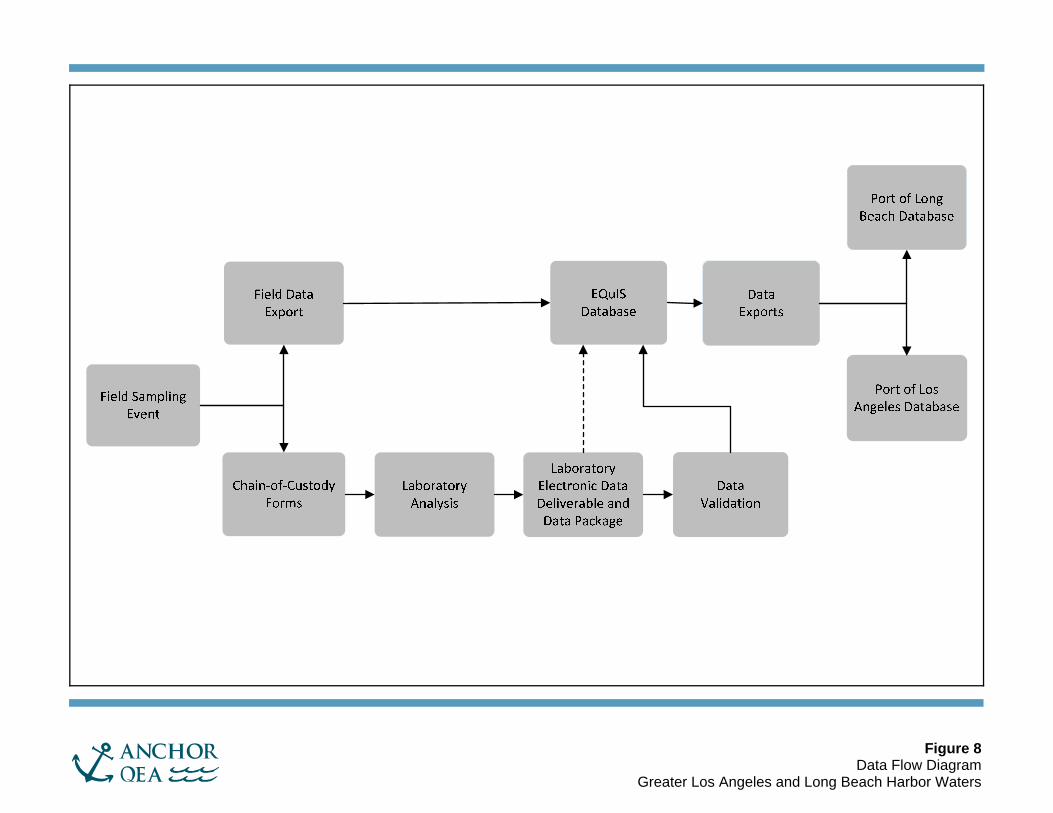
Figure 8 Data Flow Diagram
Greater Los Angeles and Long Beach Harbor Waters
APPENDIX A STANDARD OPERATING PROCEDURES
STANDARD OPERATING PROCEDURE: GRAB WATER SAMPLING
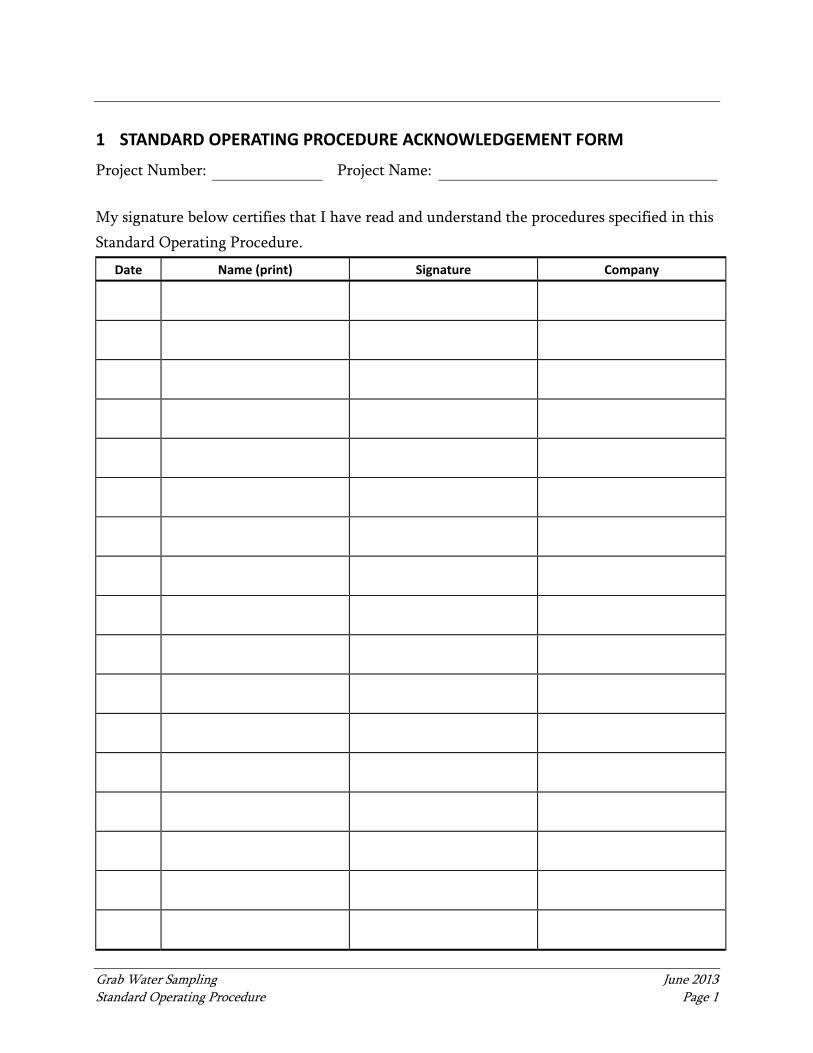
Grab Water Sampling June 2013 Standard Operating Procedure Page 1
1 STANDARD OPERATING PROCEDURE ACKNOWLEDGEMENT FORM
Project Number: Project Name:
My signature below certifies that I have read and understand the procedures specified in this
Standard Operating Procedure.
Date Name (print) Signature Company
Grab Water Sampling June 2013 Standard Operating Procedure Page 2
1.1 Scope and Application
This Standard Operating Procedure (SOP) describes the procedures for the collection of grab
water samples using a Niskin, Van Dorn, or equivalent sampler. Grab water samples will be
collected at locations described in the Coordinated Compliance Monitoring and Reporting
Plan (CCMRP).
1.2 Purpose
The purpose of water sampling is to obtain data on water chemistry for contaminants of
concern.
1.3 Personnel Qualifications
Field personnel executing these procedures will read, be familiar with, and comply with the
requirements of this SOP and corresponding documents (i.e., CCMRP and Programmatic
Quality Assurance Project Plan [PQAPP]). Field personnel will be under the direct
supervision of qualified professionals who are experienced in performing the tasks required
for sample collection.
1.4 Procedures
Water samples will be collected from the same three depths as the in situ water quality
measurements. Grab samples (i.e., instantaneous, not time- or flow-weighted composites) for
total suspended solids (TSS) will be taken at all three depths during wet and dry weather
events. Grab samples for analytical chemistry will be taken only from the surface sample
(-3 feet below water surface). Water samples will be collected with a grab sampler (e.g.,
Niskin or Van Dorn) that has been decontaminated prior to sample collection at each station.
Sampling methods will generally conform to U.S. Environmental Protection Agency’s
(USEPA’s) clean sampling methodology described in the Surface Water Ambient Monitoring
Program (SWAMP) SOP (MPSL-DFG 2007).
Sample processing and handling for water chemistry will be conducted in accordance with
guidance developed in the Quality Assurance Management Plan for the State of California’s
SWAMP (California Department of Fish and Game, Pucket 2002). Aliquots for TSS, metals,
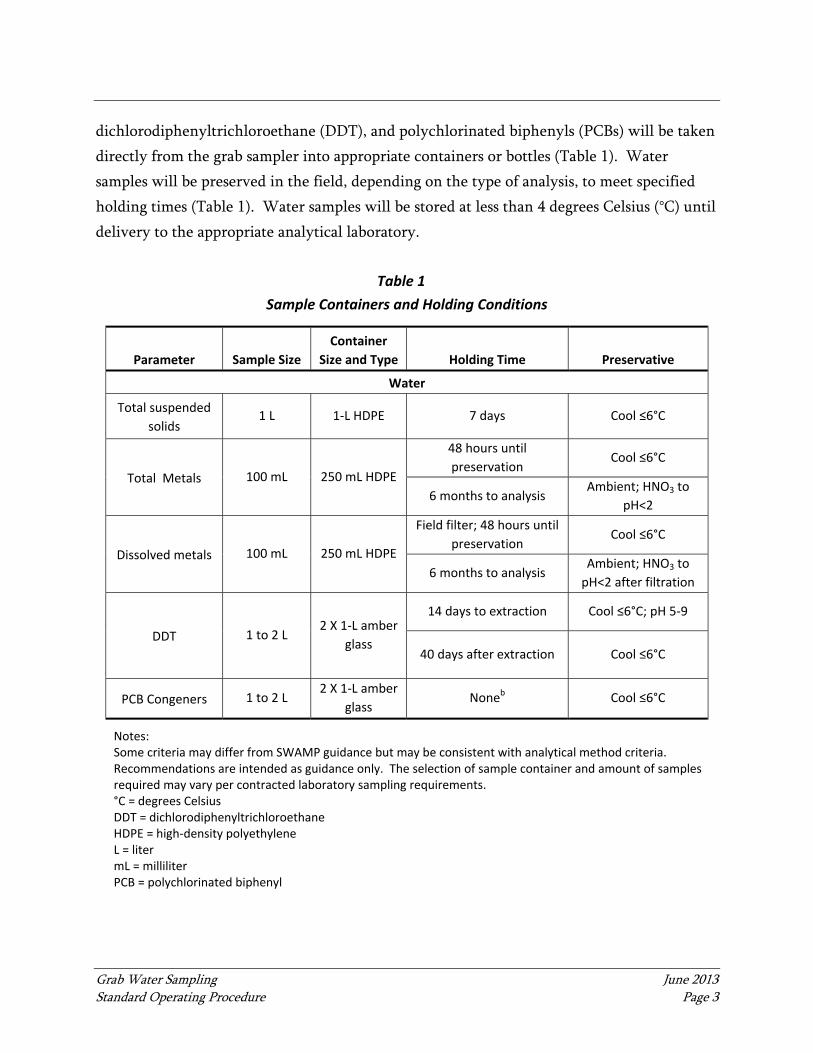
Grab Water Sampling June 2013 Standard Operating Procedure Page 3
dichlorodiphenyltrichloroethane (DDT), and polychlorinated biphenyls (PCBs) will be taken
directly from the grab sampler into appropriate containers or bottles (Table 1). Water
samples will be preserved in the field, depending on the type of analysis, to meet specified
holding times (Table 1). Water samples will be stored at less than 4 degrees Celsius (°C) until
delivery to the appropriate analytical laboratory.
Table 1
Sample Containers and Holding Conditions
Parameter Sample Size
Container
Size and Type Holding Time Preservative
Water
Total suspended
solids 1 L 1‐L HDPE 7 days Cool ≤6°C
Total Metals 100 mL 250 mL HDPE
48 hours until
preservation Cool ≤6°C
6 months to analysis Ambient; HNO3 to
pH<2
Dissolved metals 100 mL 250 mL HDPE
Field filter; 48 hours until
preservation Cool ≤6°C
6 months to analysis Ambient; HNO3 to
pH<2 after filtration
DDT 1 to 2 L 2 X 1‐L amber
glass
14 days to extraction Cool ≤6°C; pH 5‐9
40 days after extraction Cool ≤6°C
PCB Congeners 1 to 2 L 2 X 1‐L amber
glass Noneb Cool ≤6°C
Notes: Some criteria may differ from SWAMP guidance but may be consistent with analytical method criteria. Recommendations are intended as guidance only. The selection of sample container and amount of samples required may vary per contracted laboratory sampling requirements. °C = degrees Celsius DDT = dichlorodiphenyltrichloroethane HDPE = high‐density polyethylene L = liter mL = milliliter PCB = polychlorinated biphenyl
Grab Water Sampling June 2013 Standard Operating Procedure Page 4
1.5 Quality Assurance/Quality Control
Quality control procedures will consist of following standard practices for the collection of
water quality samples. Entries in the field forms and on sample container labels will be
double checked by the field team staff to verify that the information is correct. It is the
responsibility of the Field Team Leader to periodically check to ensure that water sampling
procedures are in conformance with those stated in this SOP.
Field quality assurance/quality control samples to be collected are included in Table 2.
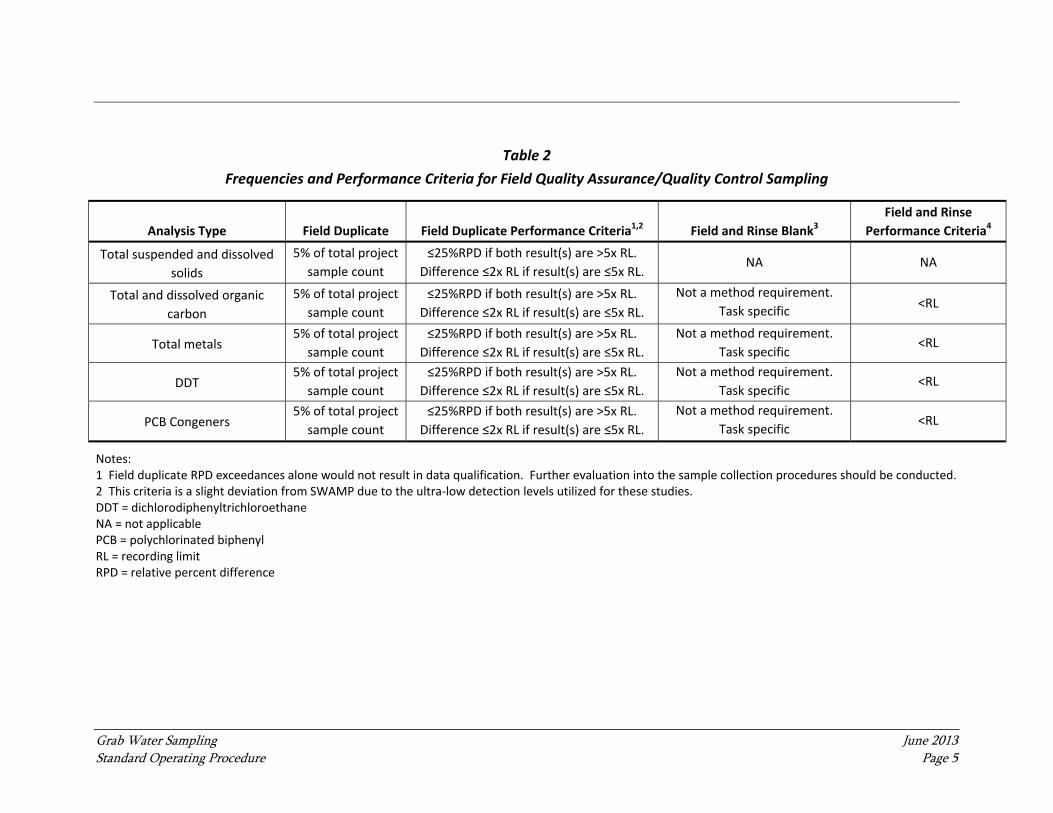
Grab Water Sampling June 2013 Standard Operating Procedure Page 5
Table 2
Frequencies and Performance Criteria for Field Quality Assurance/Quality Control Sampling
Analysis Type Field Duplicate Field Duplicate Performance Criteria1,2 Field and Rinse Blank3
Field and Rinse
Performance Criteria4
Total suspended and dissolved
solids
5% of total project
sample count
≤25%RPD if both result(s) are >5x RL.
Difference ≤2x RL if result(s) are ≤5x RL. NA NA
Total and dissolved organic
carbon
5% of total project
sample count
≤25%RPD if both result(s) are >5x RL.
Difference ≤2x RL if result(s) are ≤5x RL.
Not a method requirement.
Task specific <RL
Total metals 5% of total project
sample count
≤25%RPD if both result(s) are >5x RL.
Difference ≤2x RL if result(s) are ≤5x RL.
Not a method requirement.
Task specific <RL
DDT 5% of total project
sample count
≤25%RPD if both result(s) are >5x RL.
Difference ≤2x RL if result(s) are ≤5x RL.
Not a method requirement.
Task specific <RL
PCB Congeners 5% of total project
sample count
≤25%RPD if both result(s) are >5x RL.
Difference ≤2x RL if result(s) are ≤5x RL.
Not a method requirement.
Task specific <RL
Notes: 1 Field duplicate RPD exceedances alone would not result in data qualification. Further evaluation into the sample collection procedures should be conducted. 2 This criteria is a slight deviation from SWAMP due to the ultra‐low detection levels utilized for these studies. DDT = dichlorodiphenyltrichloroethane NA = not applicable PCB = polychlorinated biphenyl RL = recording limit RPD = relative percent difference
STANDARD OPERATING PROCEDURE: IN SITU WATER QUALITY MONITORING

In Situ Water Quality Monitoring June 2013 Standard Operating Procedure Page 1
1 STANDARD OPERATING PROCEDURE ACKNOWLEDGEMENT FORM
Project Number: Project Name:
My signature below certifies that I have read and understand the procedures specified in this
Standard Operating Procedure.
Date Name (print) Signature Company
In Situ Water Quality Monitoring June 2013 Standard Operating Procedure Page 2
1.1 Scope and Application
This Standard Operating Procedure (SOP) describes the procedures for the collection of in
situ water quality data using a multi-probe water quality instrument.
1.2 Personnel Qualifications
Field personnel executing these procedures will read, be familiar with, and comply with the
requirements of this SOP and corresponding documents (i.e., Coordinated Compliance
Monitoring and Reporting Program [CCMRP] and Programmatic Quality Assurance Project
Plan [PQAPP]). Field personnel will be under the direct supervision of qualified
professionals who are experienced in performing the tasks required for sample collection.
1.3 Pre‐Sampling Procedures
Prior to use in the field, the water quality instrument will be calibrated according to the
manufacturer’s recommendation. Calibration will be documented on a calibration log.
1.4 Procedure
For each sampling event and at each station, water depth and in situ water quality
parameters (temperature, dissolved oxygen [DO], pH, and salinity) will be collected. Water
quality parameters and water depth will be recorded on a field data sheet or in the field
electronic data deliverable (EDD).
The water depth at each station will be recorded using a probe or lead line. Water quality
will be measured in situ at the station by immersing a multi-parameter instrument into the
water at the desired depths. The instrument must equilibrate for at least one minute before
collecting temperature, pH, conductivity, or salinity measurements, and at least 90 seconds
before collecting DO measurements. Because DO takes the longest to stabilize, this
parameter will be recorded after temperature, pH, conductivity, or salinity. See the surface
water ambient monitoring program (SWAMP) SOP for additional details on the collection of
field parameters (MPSL-DFG 2007). Water quality measurements will be collected at three
depths during wet and dry weather events (surface [-3 feet below], mid-water column [to be
determined in the field], and bottom [3 feet above mudline]).
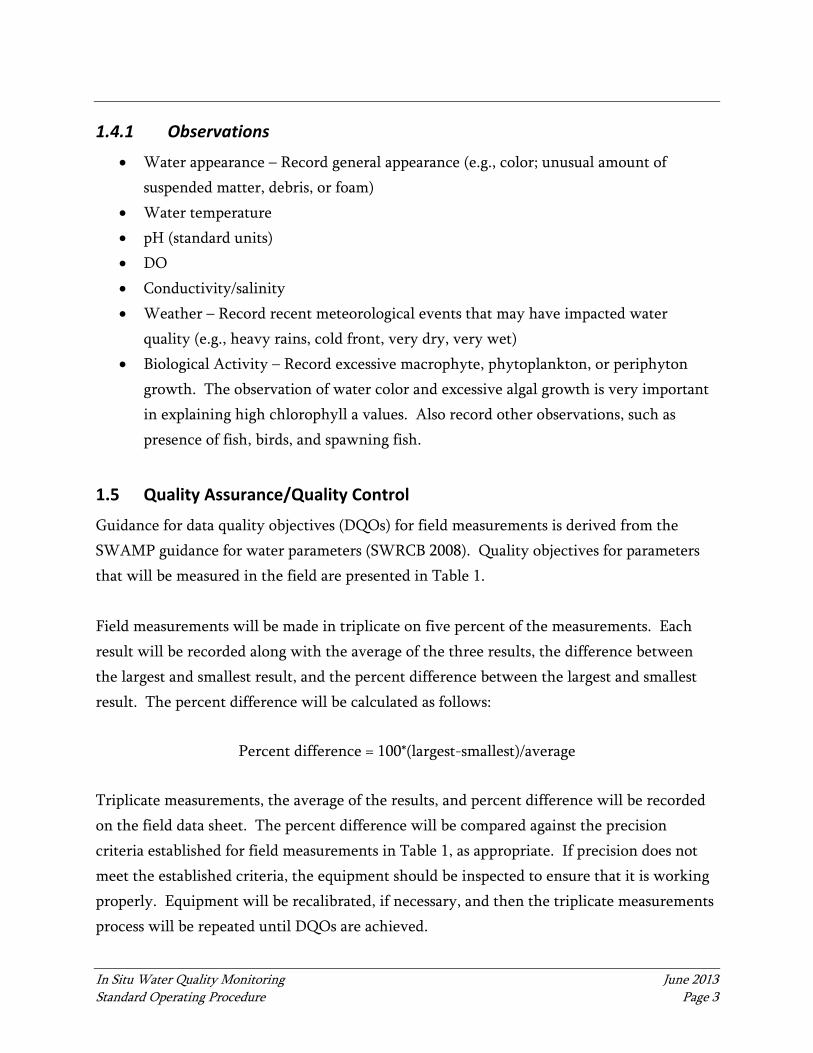
In Situ Water Quality Monitoring June 2013 Standard Operating Procedure Page 3
1.4.1 Observations
Water appearance – Record general appearance (e.g., color; unusual amount of
suspended matter, debris, or foam)
Water temperature
pH (standard units)
DO
Conductivity/salinity
Weather – Record recent meteorological events that may have impacted water
quality (e.g., heavy rains, cold front, very dry, very wet)
Biological Activity – Record excessive macrophyte, phytoplankton, or periphyton
growth. The observation of water color and excessive algal growth is very important
in explaining high chlorophyll a values. Also record other observations, such as
presence of fish, birds, and spawning fish.
1.5 Quality Assurance/Quality Control
Guidance for data quality objectives (DQOs) for field measurements is derived from the
SWAMP guidance for water parameters (SWRCB 2008). Quality objectives for parameters
that will be measured in the field are presented in Table 1.
Field measurements will be made in triplicate on five percent of the measurements. Each
result will be recorded along with the average of the three results, the difference between
the largest and smallest result, and the percent difference between the largest and smallest
result. The percent difference will be calculated as follows:
Percent difference = 100*(largest-smallest)/average
Triplicate measurements, the average of the results, and percent difference will be recorded
on the field data sheet. The percent difference will be compared against the precision
criteria established for field measurements in Table 1, as appropriate. If precision does not
meet the established criteria, the equipment should be inspected to ensure that it is working
properly. Equipment will be recalibrated, if necessary, and then the triplicate measurements
process will be repeated until DQOs are achieved.

In Situ Water Quality Monitoring June 2013 Standard Operating Procedure Page 4
Table 1
DQOs for Field Measurements
Notes: 1 The value for salinity may be computed from specific conductance provided salinity is above 3 ppt based on previous observations at or near that location. °C = degrees Celsius m = meter mg/L = milligram per liter NA = not applicable ppt = parts per thousand
Group Parameter Accuracy Precision Recovery
Target
Reporting
Limits Completeness
Water Depth (m) ± 0.1 m ± 0.1 m NA NA NA
Water Temperature (⁰C) ± 0.5 ⁰C ± 0.5 ⁰C NA NA NA
Water pH ± 0.2 units ± 0.2 units NA NA NA
Water Dissolved oxygen ± 0.2 mg/L 5 percent NA NA NA
Water Salinity1 (ppt) ± 0.2 ppt ± 0.2 ppt NA NA NA
STANDARD OPERATING PROCEDURE: SURFACE SEDIMENT GRAB SAMPLING
Surface Sediment Grab Sampling June 2013 Standard Operating Procedure Page 1
1 STANDARD OPERATING PROCEDURE ACKNOWLEDGEMENT FORM
Project Number: Project Name:
My signature below certifies that I have read and understand the procedures specified in this
Standard Operating Procedure.
Date Name (print) Signature Company
Surface Sediment Grab Sampling June 2013 Standard Operating Procedure Page 2
1.1 Scope and Application
This Standard Operating Procedure (SOP) is applicable to the collection of surface sediment
samples using a Van Veen grab sampler (or similar). Surface sediment samples will be
collected at locations described in the Coordinated Compliance Monitoring and Reporting
Plan (CCMRP).
1.2 Purpose
The purpose of sediment sampling is to obtain data on localized community structure of
infaunal invertebrate assemblages, sediment chemistry for contaminants of concern, and
sediment toxicity.
1.3 Personnel Qualifications
Field personnel executing these procedures will read, be familiar with, and comply with the
requirements of this SOP and corresponding documents (i.e., CCMRP and Programmatic
Quality Assurance Project Plan [PQAPP]). Field personnel will be under the direct
supervision of qualified professionals who are experienced in performing the tasks required
for sample collection.
1.4 General Procedures
The Field Team Leader is responsible for collecting all of the required information associated
with each station occupation and each grab sampling event. While the field computer is the
preferred method of collecting these data, paper data forms may be used. The required
station occupation information includes the following:
Station ID
Date
Vessel name
System used for navigation
Weather and sea conditions
Latitude and longitude
Depth
Distance from station target location
Surface Sediment Grab Sampling June 2013 Standard Operating Procedure Page 3
1.5 Grab Sampling Procedures
Surface sediment samples will be collected at each station. Multiple grab samples will be
required at each station to provide sufficient sediment volumes to complete all analyses
required for the Sediment Quality Objectives (SQO) Part 1 assessment (Bay et al. 2009). The
grabs will be numbered sequentially; grab numbers, visual observations, and the type of
sample each grab was used for (e.g. benthic infauna, chemistry, or toxicity) will be recorded
on datasheets. For benthic infauna processing, the entire grab sample will be processed. For
grab samples used for chemistry and toxicity analyses, only the top 5 centimeters (cm) will
be collected.
1.6 Deployment and Retrieval of the Grab Sampler
Prior to deployment, the grab sampler will be cocked with the safety key in place, then
hoisted over the side of the vessel and the safety key removed. The grab sampler will be
lowered at up to 2 meters per second (m/sec) until it is approximately 5 m above the bottom,
then lowered at 1 m/sec to minimize the effects of bow wave disturbance of the surface
sediment. In water depths greater than 300 m, the rate of deployment may have to be
reduced to less than 1 m/sec to avoid “kiting” of the grab sampler or premature tripping in
the water column. After bottom contact has been made (indicated by slack in the winch
wire), the tension on the wire will slowly be increased, causing the lever arms to close the
grab sampler. Once the grab sampler is back on board, the top doors will be opened for
inspection.
While a radius limit of 100 m (200 m for island stratum) has been established for sampling,
once sampling processes have begun, the Field Team Leader will ensure that the vessel
remains in the same position with as much precision as conditions allow. Because analytical
results from separate grab samples will be used to characterize the benthic community,
contaminant load, and toxicity of the sediment, each successive grab must be collected as
close as possible to the others.
1.7 Criteria for Acceptable Grab Samples
Sample acceptance criteria are shown in Figure 1. Upon retrieval of the grab sampler, the
acceptability of the sample must be determined. Acceptability is based on two

Surface Sediment Grab Sampling June 2013 Standard Operating Procedure Page 4
characteristics: sample condition and depth of penetration. Sample condition will be judged
using criteria for surface disturbance, leakage, canting, and washing.
Figure 1.
Examples of acceptable and unacceptable grab sample conditions.
A grab sample will be judged acceptable if the sediment has an even surface with minimal
disturbance and little or no leakage of the overlying water (see Figure 1). Heavily canted
samples will be unacceptable. Samples with a large amount of humping along the midline of
the grab, which indicates washing of the sample during retrieval, will also be unacceptable.
While some humping will be evident in samples taken from firm sediment where
penetration has been poor, this can be due to the closing action of the grab and is not
necessarily evidence of unacceptable washing.
If the sample condition is acceptable, the overlying water will be drained off and the depth
of penetration will be determined by insertion of a plastic (rather than metal) ruler vertically
along the grab midline and measuring to the nearest 0.5 cm. Sediment penetration depth
must be at least 5 cm; however, penetration depths of 7 to more than 10 cm should be
obtained in silt (fine sand to clay). In habitats where sediments are unusually soft, it may be
necessary to remove the lead weights to prevent the grab sampler from toppling onto its side,
deeming the sample unacceptable.
Extra caution should be taken to drain the overlying water from the grabs for chemistry and
toxicity samples. It is recommended that a siphon be employed for these grab samples to
Surface Sediment Grab Sampling June 2013 Standard Operating Procedure Page 5
avoid disturbance and loss of the surface sediments. The overlying water in grabs intended
for infaunal samples may be drained by slightly opening the jaws of the grab and allowing
the water to run off, as long as all drained water is captured for screening with the sediments.
If both sample condition and penetration are acceptable in the first grab, sampling at the
station will proceed. It is required that all of the grabs taken at a station be of similar
sediment type and depth penetration.
If sampling success at a particular station is inconsistent, the site may be abandoned after a
minimum of nine attempts. The reason for site abandonment must be documented. The
station should be relocated within the radius limit and +/-10% of the depth of the target site.
If a station is relocated, the new coordinates should be recorded in the field computer or on a
datasheet.
1.8 Sample Processing
Sediment sample processing and handling for purposes of sediment chemical analyses,
sediment toxicity, and benthic infauna assessment in support of the SQOs Part 1 assessment
will be performed in accordance with procedures specified in the Sediment Quality
Assessment Draft Technical Support Manual (Bay et al. 2009) and the Bight Field Operations
Manual (BCEC 2008). The following information will be recorded for each grab:
Time when the grab reaches the sediment surface
Sediment composition (type)
Sediment odor
Sediment color
Presence of shell hash (note if 50% or greater)
Sample types produced from sediment grab
Methods for processing samples are described in the corresponding SOPs for each type of
sample. Recommended conditions for sampling containers, sample handling, and storage are
listed in Table 11 of the CCMRP.
Surface Sediment Grab Sampling June 2013 Standard Operating Procedure Page 6
1.9 Quality Assurance/Quality Control
It is the responsibility of the Field Team Leader to periodically check and ensure that the
sampling procedures are in conformance with those stated in this SOP.
STANDARD OPERATING PROCEDURE: SEDIMENT CHEMISTRY SAMPLE PROCESSING

Sediment Chemistry Sample Processing June 2013 Standard Operating Procedure Page 1
1 STANDARD OPERATING PROCEDURE ACKNOWLEDGEMENT FORM
Project Number: Project Name:
My signature below certifies that I have read and understand the procedures specified in this
Standard Operating Procedure.
Date Name (print) Signature Company
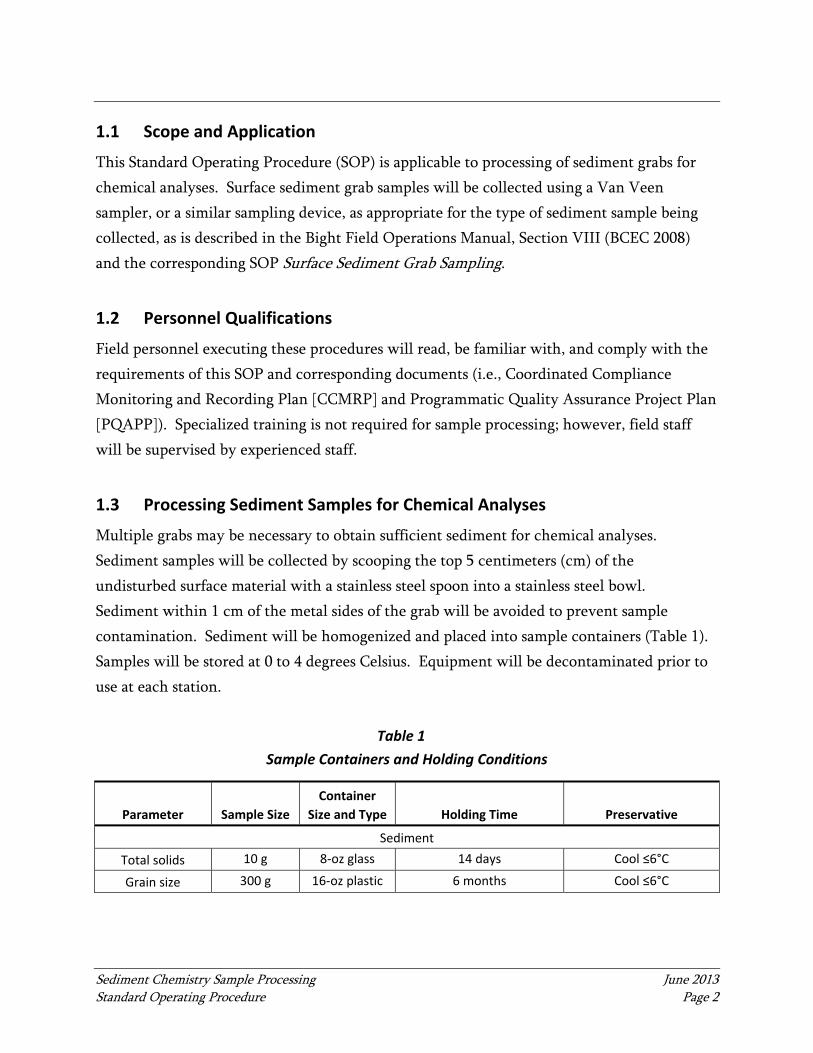
Sediment Chemistry Sample Processing June 2013 Standard Operating Procedure Page 2
1.1 Scope and Application
This Standard Operating Procedure (SOP) is applicable to processing of sediment grabs for
chemical analyses. Surface sediment grab samples will be collected using a Van Veen
sampler, or a similar sampling device, as appropriate for the type of sediment sample being
collected, as is described in the Bight Field Operations Manual, Section VIII (BCEC 2008)
and the corresponding SOP Surface Sediment Grab Sampling.
1.2 Personnel Qualifications
Field personnel executing these procedures will read, be familiar with, and comply with the
requirements of this SOP and corresponding documents (i.e., Coordinated Compliance
Monitoring and Recording Plan [CCMRP] and Programmatic Quality Assurance Project Plan
[PQAPP]). Specialized training is not required for sample processing; however, field staff
will be supervised by experienced staff.
1.3 Processing Sediment Samples for Chemical Analyses
Multiple grabs may be necessary to obtain sufficient sediment for chemical analyses.
Sediment samples will be collected by scooping the top 5 centimeters (cm) of the
undisturbed surface material with a stainless steel spoon into a stainless steel bowl.
Sediment within 1 cm of the metal sides of the grab will be avoided to prevent sample
contamination. Sediment will be homogenized and placed into sample containers (Table 1).
Samples will be stored at 0 to 4 degrees Celsius. Equipment will be decontaminated prior to
use at each station.
Table 1
Sample Containers and Holding Conditions
Parameter Sample Size
Container
Size and Type Holding Time Preservative
Sediment
Total solids 10 g 8‐oz glass 14 days Cool ≤6°C
Grain size 300 g 16‐oz plastic 6 months Cool ≤6°C
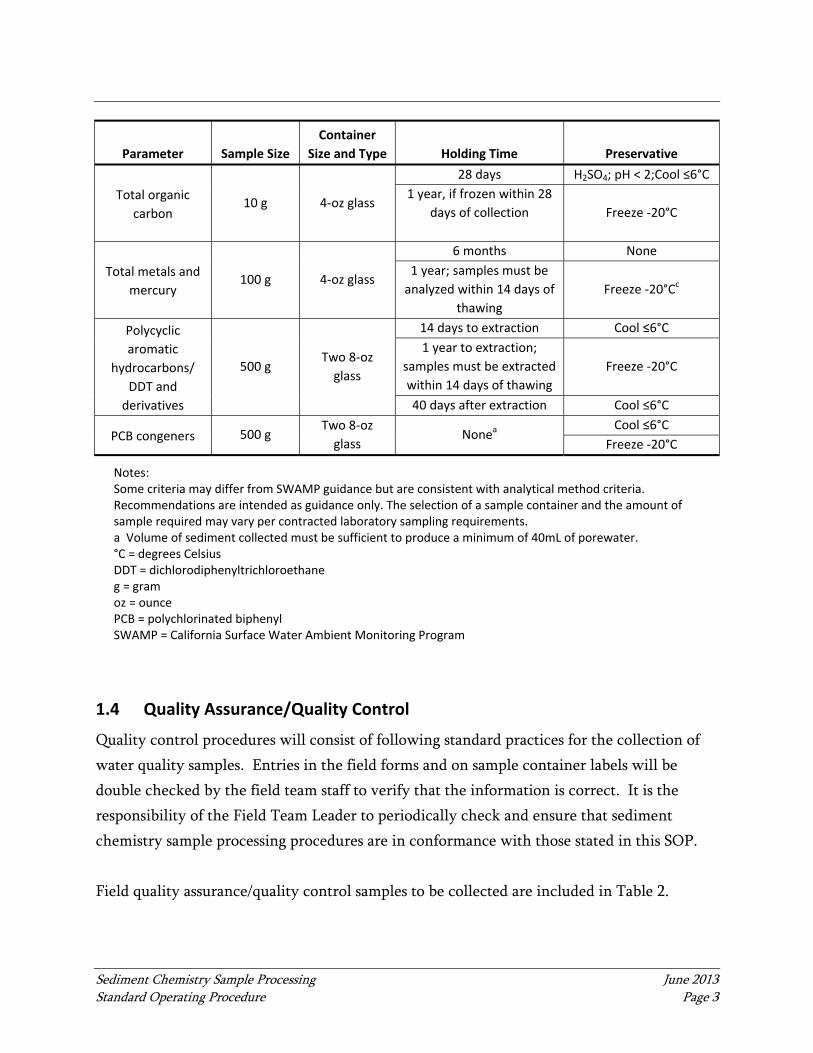
Sediment Chemistry Sample Processing June 2013 Standard Operating Procedure Page 3
Parameter Sample Size
Container
Size and Type Holding Time Preservative
Total organic
carbon 10 g 4‐oz glass
28 days H2SO4; pH < 2;Cool ≤6°C
1 year, if frozen within 28
days of collection
Freeze ‐20°C
Total metals and
mercury 100 g 4‐oz glass
6 months None
1 year; samples must be
analyzed within 14 days of
thawing
Freeze ‐20°Cc
Polycyclic
aromatic
hydrocarbons/
DDT and
derivatives
500 g Two 8‐oz
glass
14 days to extraction Cool ≤6°C
1 year to extraction;
samples must be extracted
within 14 days of thawing
Freeze ‐20°C
40 days after extraction Cool ≤6°C
PCB congeners 500 g Two 8‐oz
glass Nonea
Cool ≤6°C
Freeze ‐20°C
Notes: Some criteria may differ from SWAMP guidance but are consistent with analytical method criteria. Recommendations are intended as guidance only. The selection of a sample container and the amount of sample required may vary per contracted laboratory sampling requirements. a Volume of sediment collected must be sufficient to produce a minimum of 40mL of porewater. °C = degrees Celsius DDT = dichlorodiphenyltrichloroethane g = gram oz = ounce PCB = polychlorinated biphenyl SWAMP = California Surface Water Ambient Monitoring Program
1.4 Quality Assurance/Quality Control
Quality control procedures will consist of following standard practices for the collection of
water quality samples. Entries in the field forms and on sample container labels will be
double checked by the field team staff to verify that the information is correct. It is the
responsibility of the Field Team Leader to periodically check and ensure that sediment
chemistry sample processing procedures are in conformance with those stated in this SOP.
Field quality assurance/quality control samples to be collected are included in Table 2.
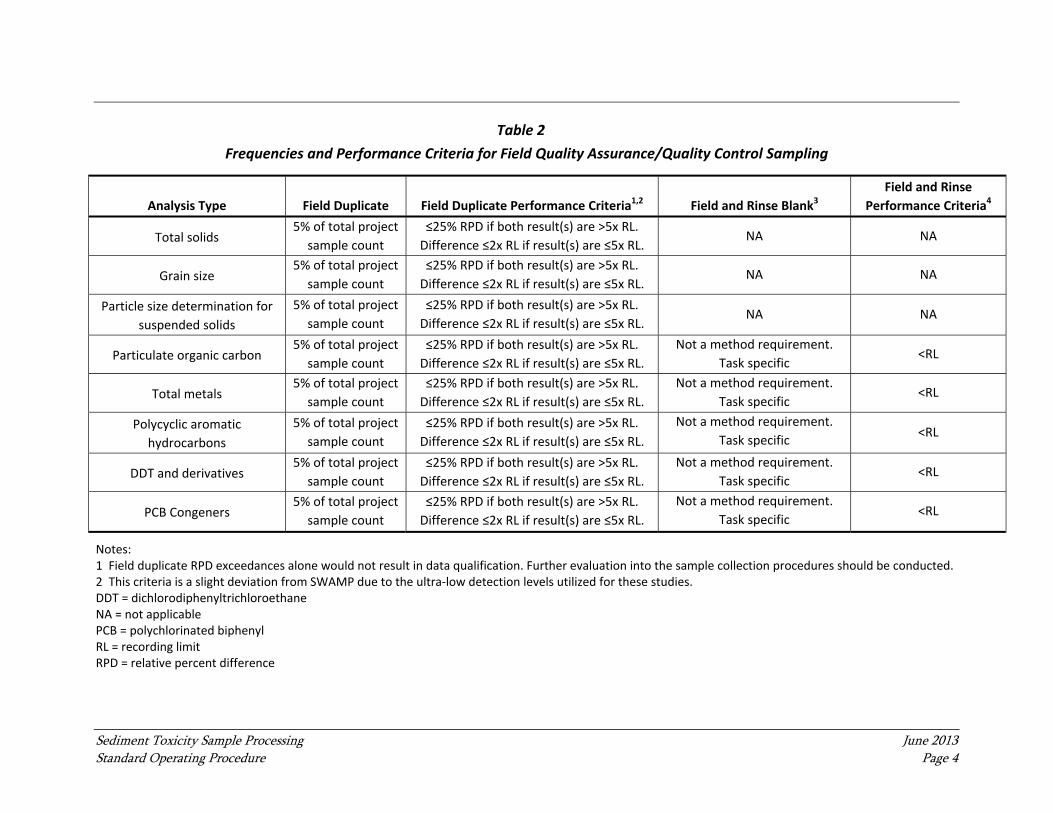
Sediment Toxicity Sample Processing June 2013 Standard Operating Procedure Page 4
Table 2
Frequencies and Performance Criteria for Field Quality Assurance/Quality Control Sampling
Analysis Type Field Duplicate Field Duplicate Performance Criteria1,2 Field and Rinse Blank3
Field and Rinse
Performance Criteria4
Total solids 5% of total project
sample count
≤25% RPD if both result(s) are >5x RL.
Difference ≤2x RL if result(s) are ≤5x RL. NA NA
Grain size 5% of total project
sample count
≤25% RPD if both result(s) are >5x RL.
Difference ≤2x RL if result(s) are ≤5x RL. NA NA
Particle size determination for
suspended solids
5% of total project
sample count
≤25% RPD if both result(s) are >5x RL.
Difference ≤2x RL if result(s) are ≤5x RL. NA NA
Particulate organic carbon 5% of total project
sample count
≤25% RPD if both result(s) are >5x RL.
Difference ≤2x RL if result(s) are ≤5x RL.
Not a method requirement.
Task specific <RL
Total metals 5% of total project
sample count
≤25% RPD if both result(s) are >5x RL.
Difference ≤2x RL if result(s) are ≤5x RL.
Not a method requirement.
Task specific <RL
Polycyclic aromatic
hydrocarbons
5% of total project
sample count
≤25% RPD if both result(s) are >5x RL.
Difference ≤2x RL if result(s) are ≤5x RL.
Not a method requirement.
Task specific <RL
DDT and derivatives 5% of total project
sample count
≤25% RPD if both result(s) are >5x RL.
Difference ≤2x RL if result(s) are ≤5x RL.
Not a method requirement.
Task specific <RL
PCB Congeners 5% of total project
sample count
≤25% RPD if both result(s) are >5x RL.
Difference ≤2x RL if result(s) are ≤5x RL.
Not a method requirement.
Task specific <RL
Notes: 1 Field duplicate RPD exceedances alone would not result in data qualification. Further evaluation into the sample collection procedures should be conducted. 2 This criteria is a slight deviation from SWAMP due to the ultra‐low detection levels utilized for these studies. DDT = dichlorodiphenyltrichloroethane NA = not applicable PCB = polychlorinated biphenyl RL = recording limit RPD = relative percent difference
STANDARD OPERATING PROCEDURE: SEDIMENT TOXICITY SAMPLE PROCESSING
Sediment Toxicity Sample Processing June 2013 Standard Operating Procedure Page 1
1 STANDARD OPERATING PROCEDURE ACKNOWLEDGEMENT FORM
Project Number: Project Name:
My signature below certifies that I have read and understand the procedures specified in this
Standard Operating Procedure.
Date Name (print) Signature Company
Sediment Toxicity Sample Processing June 2013 Standard Operating Procedure Page 2
1.1 Scope and Application
This Standard Operating Procedure (SOP) is applicable to processing of sediment grabs for
toxicity analyses. Surface sediment grab sampling procedures will be collected using a Van
Veen sampler or similar sampling device as appropriate for the type of sediment sample being
collected, as described in the Bight Field Operations Manual, Section VIII (BCEC 2008) and
the corresponding SOP Surface Sediment Grab Sampling.
1.2 Personnel Qualifications
Field personnel executing these procedures will read, be familiar with, and comply with the
requirements of this SOP and the corresponding documents (i.e., Coordinated Compliance
Monitoring and Reporting Plan [CCMRP] and Programmatic Quality Assurance Project Plan
[PQAPP]). Specialized training is not required for sample processing; however, all field staff
will be supervised by experienced staff.
1.3 Processing Sediment Samples for Toxicity Tests
Sediment will be collected for an acute amphipod toxicity test and the sediment-water
interface (SWI) test. Multiple grabs may be necessary to obtain sufficient sediment for the
amphipod test. Sediment samples will be collected by scooping the top 5 cm of the
undisturbed surface material with a stainless steel spoon into a stainless steel bowl.
Sediment within 1 cm of the metal sides of the grab will be avoided to prevent sample
contamination. Sediment for the amphipod test will be homogenized and placed into
double-lined, plastic sediment bags. Samples will be stored at 0 to 4 degrees Celsius.
The SWI test is used to assess toxicity of solid phase sediment samples using the embryo or
larval stages of marine and estuarine invertebrates. This test is designed to be conducted on a
relatively undisturbed core sample containing the upper 5 cm of sediment, which requires
the use of the special sample processing methods described in the following paragraphs.
Sediment will be collected from a grab sample with a polycarbonate core (7.5 cm inner
diameter). This sub-sample must be the first sediment taken from an undisturbed grab. The
core will be pressed 5 cm into the sediment, and a pre-cleaned acrylic plate or a gloved hand
will be inserted under the bottom of the core to prevent loss of sample as the core is
removed.
Sediment Toxicity Sample Processing June 2013 Standard Operating Procedure Page 3
Core sub-sample integrity will be verified by the presence of sediment overlying water and
the required depth of sediment. If an inordinate volume of sediment is lost, the sample will
be discarded, and a new one will be collected. After the core is removed from the grab and
deemed acceptable, it will be gently wiped of exterior sediment, and the bottom will be
capped quickly with a polyethylene plastic cap (7.5 cm inner diameter). The top will then be
capped, and both ends will be taped to the tube. Each core tube will be labeled with station
identification, date, time, and replicate number. Core tubes will be stored upright at or less
than 4 degrees Celsius. Care must be taken to minimize tilting, shaking, or vibrating cores
during transport. Precautions should also be taken to prevent contamination of the core
contents by water from melting ice during storage.
Equipment will be decontaminated prior to use at each station.
1.4 Quality Assurance/Quality Control
It is the responsibility of the Field Team Leader to periodically check and ensure that the
sediment toxicity sample processing procedures are in conformance with those stated in this
SOP.

STANDARD OPERATING PROCEDURE: SEDIMENT TOXICITY TESTING
Sediment Toxicity Testing June 2013 Standard Operating Procedure Page 1
1 STANDARD OPERATING PROCEDURE ACKNOWLEDGEMENT FORM
Project Number: Project Name:
My signature below certifies that I have read and understand the procedures specified in this
Standard Operating Procedure.
Date Name (print) Signature Company
Sediment Toxicity Testing June 2013 Standard Operating Procedure Page 2
1.1 Scope and Application
This Standard Operating Procedure (SOP) provides a description of the sediment toxicity test
methods specified under the draft Sediment Quality Objective (SQO; Bay et al. 2009) policy.
It is intended to supplement published toxicity protocols by providing information on
specific aspects of the methods that are used in many California monitoring programs so that
future analyses will yield comparable and high-quality results.
1.2 Purpose
Sediment toxicity provides two types of information in this assessment: 1) the potential
bioavailability of contaminants and 2) a measure of contaminant biological effects. Multiple
toxicity tests are needed to assess toxicity because no single method exists that can capture
the full spectrum of potential contaminant effects.
1.3 Procedures
Toxicity assessment under the SQO framework requires two types of tests: a short-term
amphipod survival test and a sub-lethal test.
1.3.1 Species
The short term amphipod survival test will be performed with Eohaustorius estuarius, except
for sediments with a high percent of fines, in which case Leptocheirus plumulosus will be
used. The sub-lethal test will consist of the sediment-water interface test (SWI) with the
bivalve, Mytilus galloprovincialis.
1.3.2 Sample Preparation
The amphipod survival tests should be started within one month of sample collection and
SWI tests within 2 weeks of sample collection in order to minimize potential changes in
toxicity due to storage. Samples should be tested as soon after collection as possible in order
to minimize the potential for changes in sediment quality during storage.
Sediment for the amphipod survival tests should be homogenized and press-sieved in order
to remove native animals that might be either predators or the same species as a test
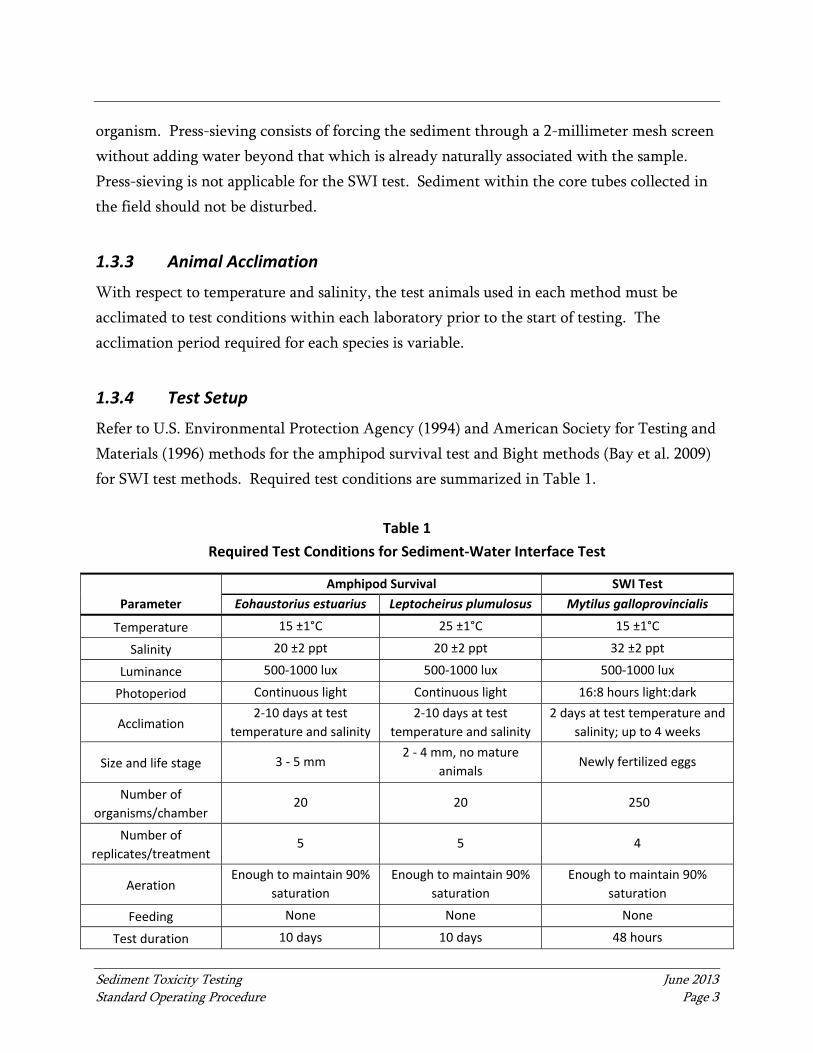
Sediment Toxicity Testing June 2013 Standard Operating Procedure Page 3
organism. Press-sieving consists of forcing the sediment through a 2-millimeter mesh screen
without adding water beyond that which is already naturally associated with the sample.
Press-sieving is not applicable for the SWI test. Sediment within the core tubes collected in
the field should not be disturbed.
1.3.3 Animal Acclimation
With respect to temperature and salinity, the test animals used in each method must be
acclimated to test conditions within each laboratory prior to the start of testing. The
acclimation period required for each species is variable.
1.3.4 Test Setup
Refer to U.S. Environmental Protection Agency (1994) and American Society for Testing and
Materials (1996) methods for the amphipod survival test and Bight methods (Bay et al. 2009)
for SWI test methods. Required test conditions are summarized in Table 1.
Table 1
Required Test Conditions for Sediment‐Water Interface Test
Parameter
Amphipod Survival SWI Test
Eohaustorius estuarius Leptocheirus plumulosus Mytilus galloprovincialis
Temperature 15 ±1°C 25 ±1°C 15 ±1°C
Salinity 20 ±2 ppt 20 ±2 ppt 32 ±2 ppt
Luminance 500‐1000 lux 500‐1000 lux 500‐1000 lux
Photoperiod Continuous light Continuous light 16:8 hours light:dark
Acclimation 2‐10 days at test
temperature and salinity
2‐10 days at test
temperature and salinity
2 days at test temperature and
salinity; up to 4 weeks
Size and life stage 3 ‐ 5 mm 2 ‐ 4 mm, no mature
animals Newly fertilized eggs
Number of
organisms/chamber 20 20 250
Number of
replicates/treatment 5 5 4
Aeration Enough to maintain 90%
saturation
Enough to maintain 90%
saturation
Enough to maintain 90%
saturation
Feeding None None None
Test duration 10 days 10 days 48 hours
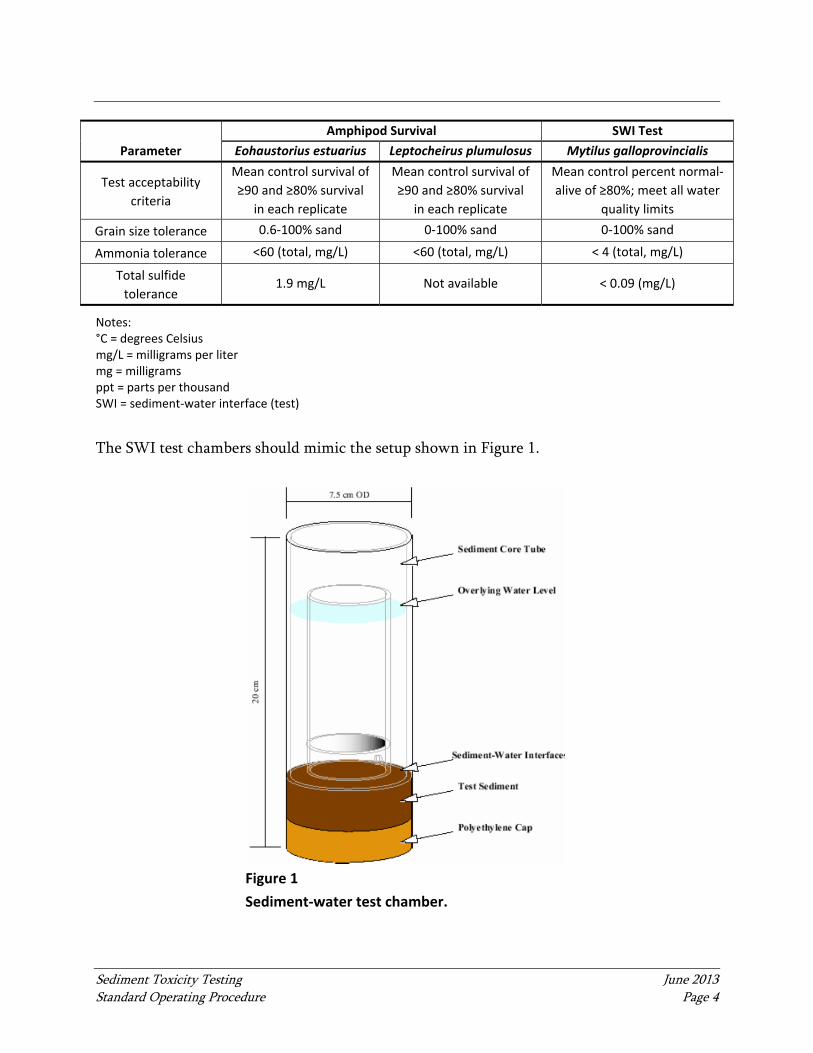
Sediment Toxicity Testing June 2013 Standard Operating Procedure Page 4
Parameter
Amphipod Survival SWI Test
Eohaustorius estuarius Leptocheirus plumulosus Mytilus galloprovincialis
Test acceptability
criteria
Mean control survival of
≥90 and ≥80% survival
in each replicate
Mean control survival of
≥90 and ≥80% survival
in each replicate
Mean control percent normal‐
alive of ≥80%; meet all water
quality limits
Grain size tolerance 0.6‐100% sand 0‐100% sand 0‐100% sand
Ammonia tolerance <60 (total, mg/L) <60 (total, mg/L) < 4 (total, mg/L)
Total sulfide
tolerance 1.9 mg/L Not available < 0.09 (mg/L)
Notes: °C = degrees Celsius mg/L = milligrams per liter mg = milligrams ppt = parts per thousand SWI = sediment‐water interface (test)
The SWI test chambers should mimic the setup shown in Figure 1.
Figure 1
Sediment‐water test chamber.
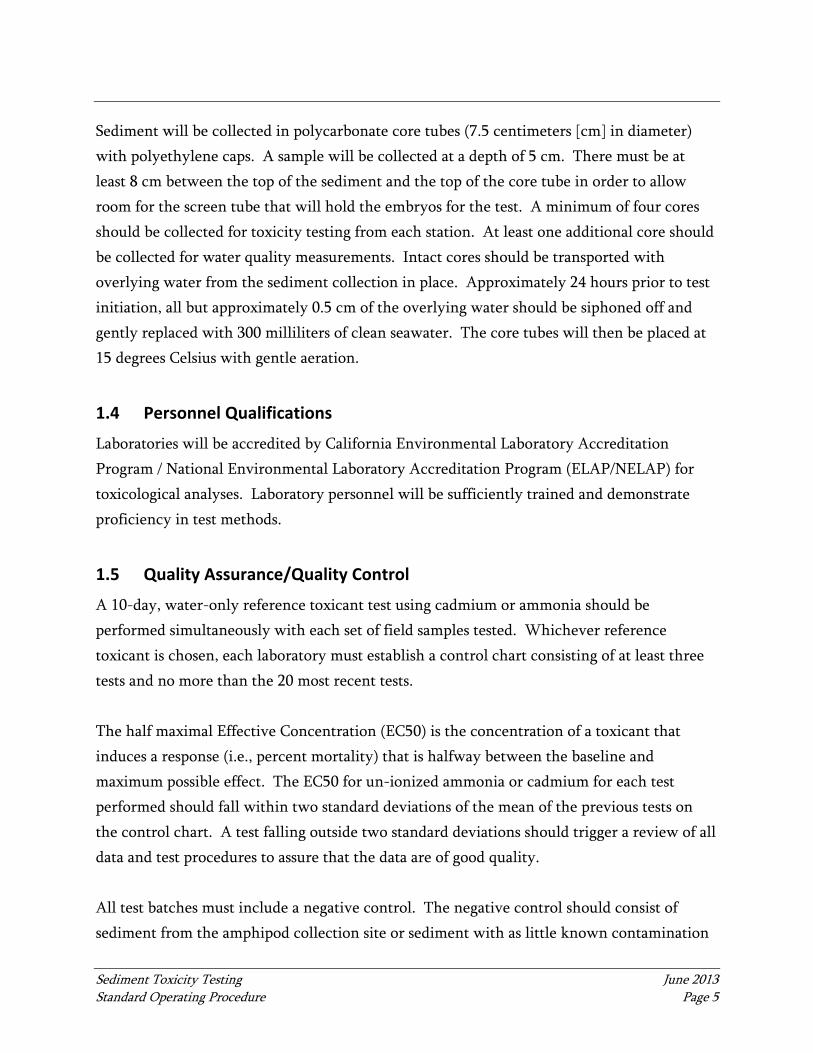
Sediment Toxicity Testing June 2013 Standard Operating Procedure Page 5
Sediment will be collected in polycarbonate core tubes (7.5 centimeters [cm] in diameter)
with polyethylene caps. A sample will be collected at a depth of 5 cm. There must be at
least 8 cm between the top of the sediment and the top of the core tube in order to allow
room for the screen tube that will hold the embryos for the test. A minimum of four cores
should be collected for toxicity testing from each station. At least one additional core should
be collected for water quality measurements. Intact cores should be transported with
overlying water from the sediment collection in place. Approximately 24 hours prior to test
initiation, all but approximately 0.5 cm of the overlying water should be siphoned off and
gently replaced with 300 milliliters of clean seawater. The core tubes will then be placed at
15 degrees Celsius with gentle aeration.
1.4 Personnel Qualifications
Laboratories will be accredited by California Environmental Laboratory Accreditation
Program / National Environmental Laboratory Accreditation Program (ELAP/NELAP) for
toxicological analyses. Laboratory personnel will be sufficiently trained and demonstrate
proficiency in test methods.
1.5 Quality Assurance/Quality Control
A 10-day, water-only reference toxicant test using cadmium or ammonia should be
performed simultaneously with each set of field samples tested. Whichever reference
toxicant is chosen, each laboratory must establish a control chart consisting of at least three
tests and no more than the 20 most recent tests.
The half maximal Effective Concentration (EC50) is the concentration of a toxicant that
induces a response (i.e., percent mortality) that is halfway between the baseline and
maximum possible effect. The EC50 for un-ionized ammonia or cadmium for each test
performed should fall within two standard deviations of the mean of the previous tests on
the control chart. A test falling outside two standard deviations should trigger a review of all
data and test procedures to assure that the data are of good quality.
All test batches must include a negative control. The negative control should consist of
sediment from the amphipod collection site or sediment with as little known contamination
Sediment Toxicity Testing June 2013 Standard Operating Procedure Page 6
as possible. The control also must have previously demonstrated that it meets test control
acceptability requirements. If any of the chambers within a test exceed this ammonia
concentration, 50% of the overlying water in all chambers within the experiment may be
changed up to twice per day until all are below the target concentration. The mean control
survival for each test batch must be 90% or greater. Individually, each control replicate must
have at least 80% survival. In addition, water quality parameters must be within acceptable
limits, and initial size ranges for the amphipods must be followed.

STANDARD OPERATING PROCEDURE: BENTHIC INFAUNA PROCESSING
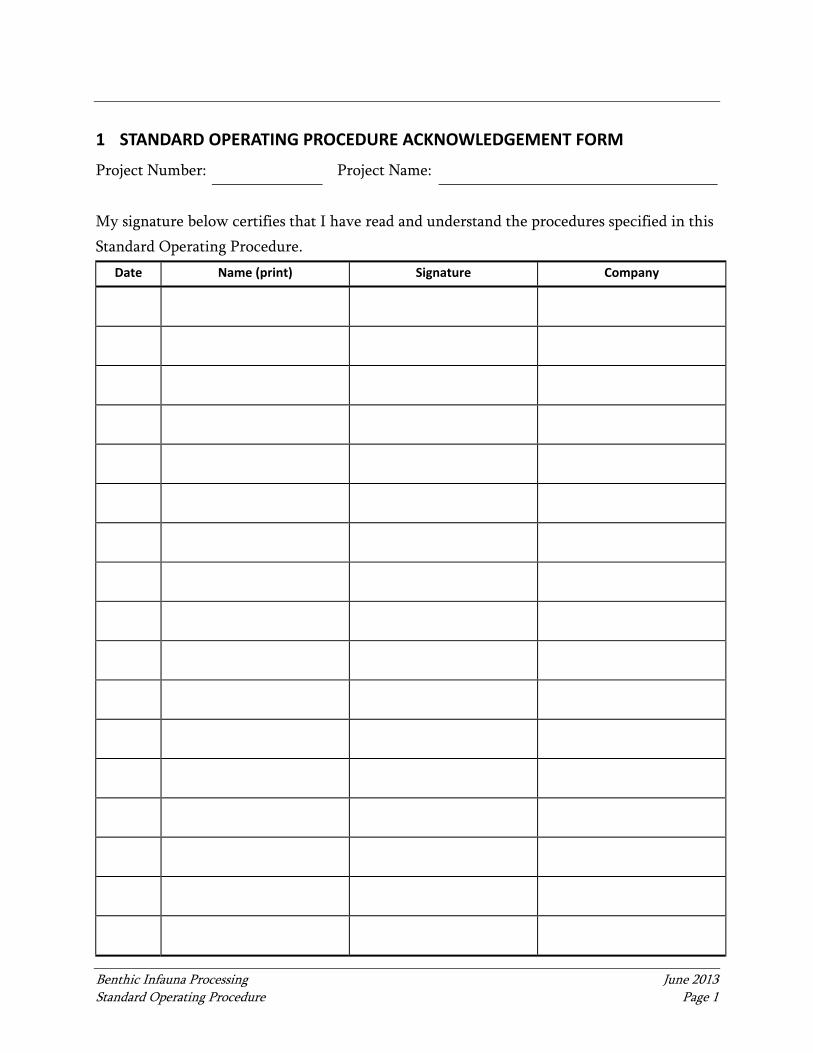
Benthic Infauna Processing June 2013 Standard Operating Procedure Page 1
1 STANDARD OPERATING PROCEDURE ACKNOWLEDGEMENT FORM
Project Number: Project Name:
My signature below certifies that I have read and understand the procedures specified in this
Standard Operating Procedure.
Date Name (print) Signature Company
Benthic Infauna Processing June 2013 Standard Operating Procedure Page 2
1.1 Scope and Application
This Standard Operating Procedure (SOP) is applicable to processing of sediment grabs for
benthic infauna community analyses. Surface sediment grab samples will be collected using
a Van Veen sampler, or similar sampling device as appropriate for the type of sediment
sample being collected, as described in the Bight Field Operations Manual, Section VIII
(BCEC 2008) and the corresponding SOP Surface Sediment Grab Sampling.
1.2 Personnel Qualifications
Field personnel executing these procedures will read, be familiar with, and comply with the
requirements of this SOP and the corresponding documents (i.e., Coordinated Compliance
Monitoring and Reporting Plan [CCMRP], Programmatic Quality Assurance Project Plan
[PQAPP]). Specialized training is not required for sample processing; however, field staff
will be trained and supervised by experienced staff.
1.3 Benthic Infaunal Sample Processing
After the sample description has been completed, the entire sediment grab sample intended
for biological analysis is washed from the sampler through a 1.0-millimeter (mm) screen or
sieve. The use of a sediment-washing table is recommended, but not required. The table is
useful because it provides a flat, smooth surface over which to spread and wash the sample,
providing a means of gently breaking up the sediment before it runs off the end of the table
into the screen box. The screen box must be equipped with stainless steel mesh with 1.0-mm
openings. Wire diameter should be similar to that found in the U.S. Standard 1.00-mm Sieve
(i.e., 0.58 mm). The surface area of the screen should be adequate to easily accept the sample
without buildup. Raw water used to wash the samples is to be filtered to prevent the
introduction of surface-water organisms. Thoroughly wash the sediment from the sampler
and transfer it to a sediment-washing table (or a screen box, metal sieve, etc.) for screening.
An alternative sieving method for small vessels without wash water would involve semi-
submerging the sieve in seawater and swirling it in the water (taking care to prevent the loss
of grab organisms and/or the introduction of surface water organisms) until the sediment
washes away.
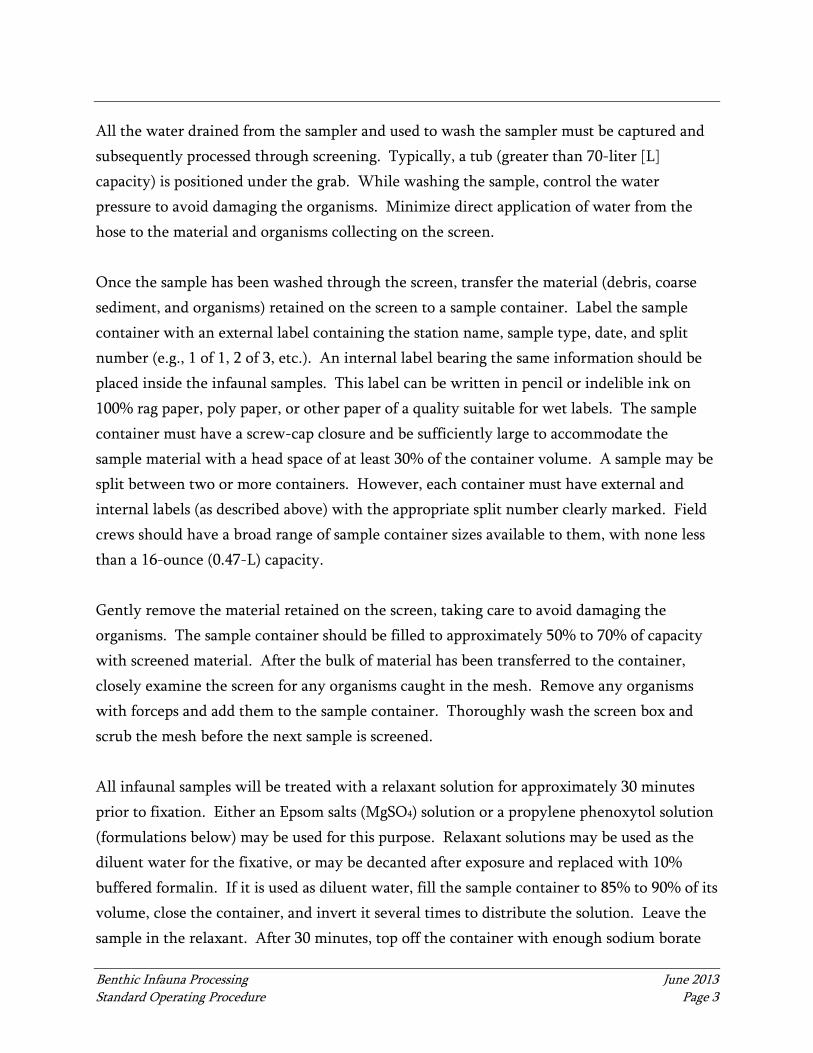
Benthic Infauna Processing June 2013 Standard Operating Procedure Page 3
All the water drained from the sampler and used to wash the sampler must be captured and
subsequently processed through screening. Typically, a tub (greater than 70-liter [L]
capacity) is positioned under the grab. While washing the sample, control the water
pressure to avoid damaging the organisms. Minimize direct application of water from the
hose to the material and organisms collecting on the screen.
Once the sample has been washed through the screen, transfer the material (debris, coarse
sediment, and organisms) retained on the screen to a sample container. Label the sample
container with an external label containing the station name, sample type, date, and split
number (e.g., 1 of 1, 2 of 3, etc.). An internal label bearing the same information should be
placed inside the infaunal samples. This label can be written in pencil or indelible ink on
100% rag paper, poly paper, or other paper of a quality suitable for wet labels. The sample
container must have a screw-cap closure and be sufficiently large to accommodate the
sample material with a head space of at least 30% of the container volume. A sample may be
split between two or more containers. However, each container must have external and
internal labels (as described above) with the appropriate split number clearly marked. Field
crews should have a broad range of sample container sizes available to them, with none less
than a 16-ounce (0.47-L) capacity.
Gently remove the material retained on the screen, taking care to avoid damaging the
organisms. The sample container should be filled to approximately 50% to 70% of capacity
with screened material. After the bulk of material has been transferred to the container,
closely examine the screen for any organisms caught in the mesh. Remove any organisms
with forceps and add them to the sample container. Thoroughly wash the screen box and
scrub the mesh before the next sample is screened.
All infaunal samples will be treated with a relaxant solution for approximately 30 minutes
prior to fixation. Either an Epsom salts (MgSO4) solution or a propylene phenoxytol solution
(formulations below) may be used for this purpose. Relaxant solutions may be used as the
diluent water for the fixative, or may be decanted after exposure and replaced with 10%
buffered formalin. If it is used as diluent water, fill the sample container to 85% to 90% of its
volume, close the container, and invert it several times to distribute the solution. Leave the
sample in the relaxant. After 30 minutes, top off the container with enough sodium borate
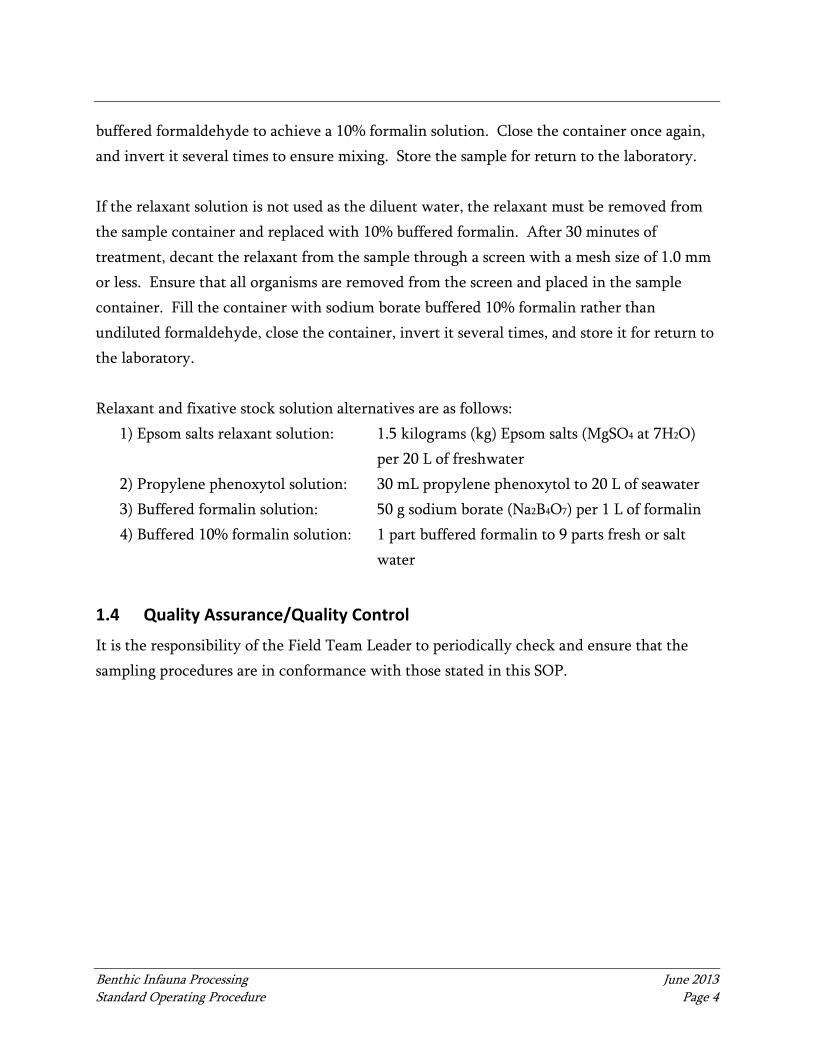
Benthic Infauna Processing June 2013 Standard Operating Procedure Page 4
buffered formaldehyde to achieve a 10% formalin solution. Close the container once again,
and invert it several times to ensure mixing. Store the sample for return to the laboratory.
If the relaxant solution is not used as the diluent water, the relaxant must be removed from
the sample container and replaced with 10% buffered formalin. After 30 minutes of
treatment, decant the relaxant from the sample through a screen with a mesh size of 1.0 mm
or less. Ensure that all organisms are removed from the screen and placed in the sample
container. Fill the container with sodium borate buffered 10% formalin rather than
undiluted formaldehyde, close the container, invert it several times, and store it for return to
the laboratory.
Relaxant and fixative stock solution alternatives are as follows:
1) Epsom salts relaxant solution: 1.5 kilograms (kg) Epsom salts (MgSO4 at 7H2O)
per 20 L of freshwater
2) Propylene phenoxytol solution: 30 mL propylene phenoxytol to 20 L of seawater
3) Buffered formalin solution: 50 g sodium borate (Na2B4O7) per 1 L of formalin
4) Buffered 10% formalin solution: 1 part buffered formalin to 9 parts fresh or salt
water
1.4 Quality Assurance/Quality Control
It is the responsibility of the Field Team Leader to periodically check and ensure that the
sampling procedures are in conformance with those stated in this SOP.
STANDARD OPERATING PROCEDURE: BENTHIC INFAUNA COMMUNITY ANALYSIS
Benthic Infauna Community Analysis June 2013 Standard Operating Procedure Page 1
1 STANDARD OPERATING PROCEDURE ACKNOWLEDGEMENT FORM
Project Number: Project Name:
My signature below certifies that I have read and understand the procedures specified in this
Standard Operating Procedure.
Date Name (print) Signature Company
Benthic Infauna Community Analysis June 2013 Standard Operating Procedure Page 2
1.1 Scope and Application
The goal of this Standard Operating Procedure (SOP) is to provide recommendations for
laboratory processing, quality assurance (QA), quality control (QC), and data analysis
procedures that are recommended for assessing the condition of soft bottom benthic
macroinvertebrate communities of California’s bays and estuaries. It is intended to
supplement protocols presently used in California with regard to methods that meet the
requirements of the sediment quality assessment framework contained in the draft Sediment
Quality Objectives (SQO) policy.
Benthic infauna analyses will be conducted in accordance with Sediment Quality Assessment
Draft Technical Support Manual (Bay et al. 2009). Chapter 5 of the Sediment Quality
Assessment Draft Technical Support Manual (Bay et al. 2009) details recommended
laboratory procedures for the processing of benthic infauna samples and subsequent data
analysis necessary for the SQO Part 1 assessment.
1.2 Personnel Qualifications
Personnel performing benthic sorting of organisms into major phyla will have sufficient
training and experience to perform this task. Taxonomists will have a combination of
education and experience to identify organisms to species level. The Quality Control/Quality
Assurance (QA/QC) procedures described below shall be used to verify accuracy.
1.3 Procedures
Benthic infauna sample processing in the laboratory includes the following tasks.
1.3.1 Sample Preservation
Samples that are received from the field in formalin fixative must be washed and transferred
to alcohol preservative. The removal of formalin is necessary for two reasons.
Formaldehyde becomes increasingly acidic over time and prolonged exposure damages
organisms with calcareous structures (e.g., shelled mollusks) which are often essential for
accurate identifications. Secondly, formaldehyde is a noxious, potentially dangerous
chemical. Replacing formaldehyde with ethanol makes subsequent sample handling safer.
Benthic Infauna Community Analysis June 2013 Standard Operating Procedure Page 3
Other benefits of the washing process are the removal of excess silt from mud balls and fecal
pellets that may have broken down during fixation and, in some cases, the opportunity to
separate most of the organisms in a sample from inorganic debris using an elutriation process
(defined below).
Samples fixed in formalin in the field should remain in formalin fixative for at least 72 hours,
but no sample should remain in fixative for longer than two weeks because formalin will
decalcify mollusks and echinoderms. Benthic community samples should be preserved in a
70% ethanol solution. Denatured alcohol and dyes for staining organisms are not
recommended. The alcohol preservative should be buffered with marble chips, especially if
the ethanol is produced by industrial distillation rather than fermentation. Ethanol is
commonly purchased as a 95% ethanol solution. To prepare 1 L of 70% ethanol solution, 263
ml of purified water (i.e., filtered and de-ionized by reverse osmosis) is added to 737 ml of
95% ethanol. If samples contain a high percent of crustaceans, it is recommended to
substitute some water with glycerin (i.e., 70% ethanol, 25% purified water, 5% glycerin) to
help maintain exoskeleton shape.
1.3.2 Sample Sorting
Organisms that were alive at time of collection are removed from the organic and inorganic
residues (debris) that compose the sample. They are then sorted into broad taxonomic
categories for analysis by taxonomists. Sorting must be accurate and complete to ensure the
value of subsequent steps in the sample analysis process. Quality control procedures
described in the following paragraphs are used to ensure that sorting accuracy and
completeness meet data quality objectives.
Several sorting techniques are used for the removal of benthic organisms from sediment.
Commonly, a small amount of sample is placed in a Petri dish, and each organism is
systematically sorted and removed under a dissecting microscope using forceps. The
elutriation or “floating” method is an effective technique when a sample is primarily coarse
sand or highly organic. Inorganic material in the sample is separated from the lighter
organic debris and organisms by the following elutriation process: After washing the
formalin from the sample, spread the sample material out in a shallow pan or flat tray and

Benthic Infauna Community Analysis June 2013 Standard Operating Procedure Page 4
cover with water. Gently agitate the sample by hand to allow the lighter fraction of debris
and organisms to separate from the heavier material. The densest material settles to the
bottom while the less dense material, such as organic material, arthropods, and other soft-
bodied organisms, becomes suspended. The solution is then poured through the sieve and
sorted. The denser material (i.e., sand grains and mollusks) is covered with water, so that it
is more easily sorted and removed under a dissecting microscope. The water containing the
lighter material should be decanted through a sieve, repeating the process several times until
no more material is observed in the decanted water. Then the material in the decanted
water is collected into a small sample container, topped with preservative, and returned to
the original sample container along with the balance of the sample material. The sample
container should be filled with preservative and its lid tightly affixed. Both containers
should be labeled properly with internal labels.
It is generally recommended that sorting be done in 70% ethanol, with care taken to ensure
that the sample being sorted is always fully covered with alcohol. It is not uncommon for
Ophiuroidea to be removed from the ethanol and air dried to assist with identification.
Organisms removed from the sample are sorted into taxonomic groups for subsequent
taxonomic analysis. Remove all individual organisms and fragments from the sample with
the exception of nematodes, foraminifera, and planktonic species or life stages. All
fragments, such as decapod chelae and legs, should be placed in their respective taxa groups.
The number and identity of taxa groups composing the sorted sample, the number of
containers used if sample is split, and the time (to the nearest one-half hour) required to sort
the sample should be recorded on the sorting record form.
Aggregate the taxa groups into one or more sample containers. It is generally recommended
that each sample container and taxa group be internally labeled with station name, sampling
date and depth, and split number (if more than one container is used). Labels should be
written in pencil or indelible ink on 100% rag paper, poly paper, or other paper suitable for
permanent wet labels.
Benthic Infauna Community Analysis June 2013 Standard Operating Procedure Page 5
1.3.3 Taxonomic Analysis
The purpose of sorting into taxonomic groups is to facilitate taxonomic analysis by project
taxonomists, with each group being analyzed by a single taxonomist. Therefore, the specifics
of taxonomic groups may vary with the number of project taxonomists available and the
details of their taxonomic expertise.
Organisms in samples are identified and counted, voucher specimens are prepared to
document identifications, and taxonomic analysis accuracy may be evaluated by reanalyzing
selected samples.
1.3.4 Data Analysis to Determine Benthic Invertebrate Community Condition
The composition of the benthic community constitutes an essential line of evidence (LOE)
for sediment quality assessment. The Benthic LOE is a direct measure of the effect that
sediment contaminant exposure has on the benthic biota of California’s bays and estuaries.
Determination of the Benthic LOE is based on four measures of benthic community
condition: 1) the Index of Biotic Integrity (IBI), 2) the Relative Benthic Index (RBI), 3) the
Benthic Response Index (BRI), and 4) the River Invertebrate Prediction and Classification
System (RIVPACS). This chapter includes computational tools for calculating the Benthic
LOE category and provides an example of the step-by-step process for its determination.
1.4 Quality Assurance/Quality Control (QA/QC)
Quality control of sorting is essential to ensure the value of all the subsequent steps in the
sample analysis process. A standard sorting form is usually used for tracking the sample. It
includes the name of the technician responsible, time required for sorting, comments, and
re-sorting results. Re-sorting of samples is employed for QC purposes. It is a good practice
to have, at a minimum, 10 to 20% of all samples re-sorted to monitor sorter performance.
There are two recommended approaches used for re-sorting: the aliquot sample method and
the whole sample method. A laboratory may choose one of these two methods but, for
consistency, a single method should be employed by a laboratory for all samples in a single
project. The re-sort method used should be noted on the sorting form along with the re-sort
results.
Benthic Infauna Community Analysis June 2013 Standard Operating Procedure Page 6
Whole Sample Method. At least 10% of the samples processed by each sorter are
completely re-sorted.
Aliquot Method. A representative aliquot of at least 10% of the sample volume of
every sample processed by each sorter is re-sorted.
Regardless of the method employed, an experienced sorter other than the original sorter
conducts all re-sorting. Percent sorting efficiency is calculated as follows:
Whole Sample Method:
% Efficiency = 100 · [#Organisms sorted ÷ (#Organisms sorted + #Organisms from Re-sort)]
Aliquot Method:
% Efficiency = 100 · [#Organisms sorted ÷ (#Organisms sorted + #Organisms from Re-sort · %aliquot)]
If sorting efficiency is greater than 95% (i.e., no more than 5% of the organisms in the
original sample are missed), then no further action is required. Sorting efficiencies below
95% initiate continuous monitoring of the underperforming technician. Failure to achieve
95% sorting efficiency initiates re-sorting of all samples previously sorted by that technician.
Organisms found during re-sort should be included in the results from the sample. The
calculated sorting efficiency is recorded on the sorting form for each sample that is re-sorted.
The laboratory responsible for sorting should retain sample debris left after sorting until
cleared for disposal. The debris should be properly labeled and preserved with 70% ethanol.
Specific attention should be given to nomenclature rules because this information
significantly affects the efficiency of the benthic indices calculations and QA/QC procedures.
Species lists provided should be strictly adhered to, and the most up-to-date taxon names and
exact spelling of taxon names based on the species lists should be used. Doing so will prevent
miscounting of key organisms and erroneous benthic indices calculations.
STANDARD OPERATING PROCEDURE: FISH COLLECTION (OTTER TRAWL NETS)
Fish Collection (Otter Trawl Nets) June 2013 Standard Operating Procedure Page 1
1 STANDARD OPERATING PROCEDURE ACKNOWLEDGEMENT FORM
Project Number: Project Name:
My signature below certifies that I have read and understand the procedures specified in this
Standard Operating Procedure.
Date Name (print) Signature Company
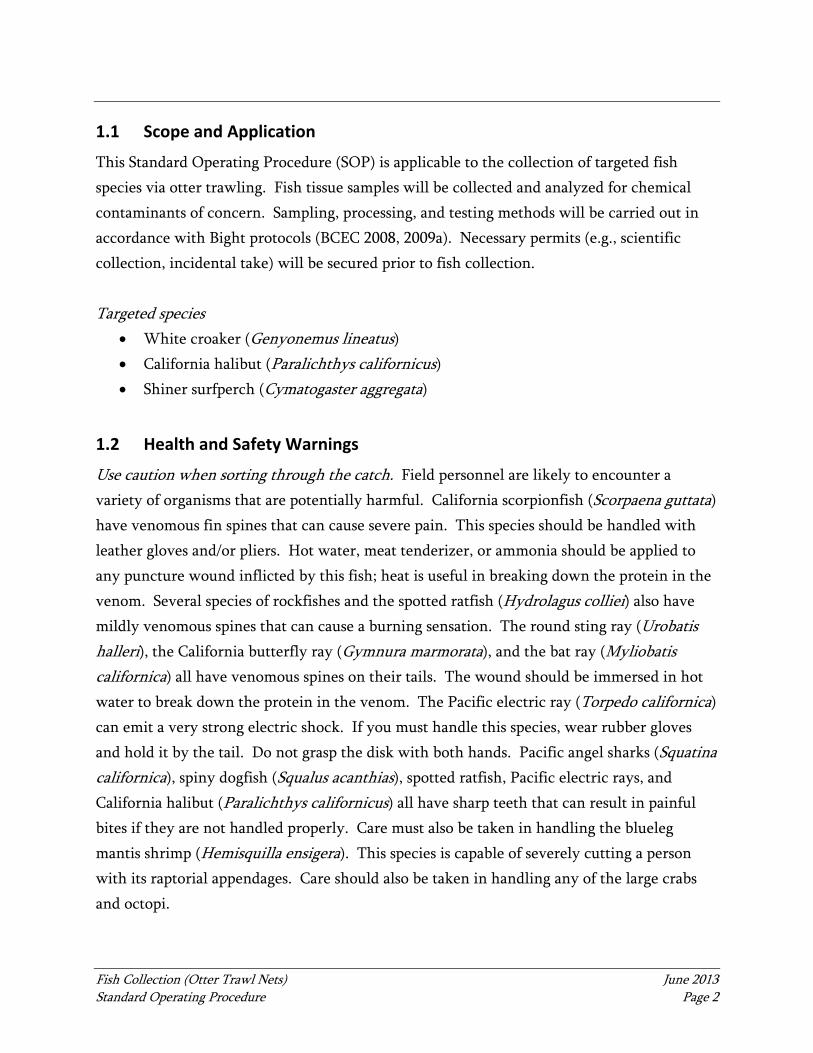
Fish Collection (Otter Trawl Nets) June 2013 Standard Operating Procedure Page 2
1.1 Scope and Application
This Standard Operating Procedure (SOP) is applicable to the collection of targeted fish
species via otter trawling. Fish tissue samples will be collected and analyzed for chemical
contaminants of concern. Sampling, processing, and testing methods will be carried out in
accordance with Bight protocols (BCEC 2008, 2009a). Necessary permits (e.g., scientific
collection, incidental take) will be secured prior to fish collection.
Targeted species
White croaker (Genyonemus lineatus)
California halibut (Paralichthys californicus)
Shiner surfperch (Cymatogaster aggregata)
1.2 Health and Safety Warnings
Use caution when sorting through the catch. Field personnel are likely to encounter a
variety of organisms that are potentially harmful. California scorpionfish (Scorpaena guttata)
have venomous fin spines that can cause severe pain. This species should be handled with
leather gloves and/or pliers. Hot water, meat tenderizer, or ammonia should be applied to
any puncture wound inflicted by this fish; heat is useful in breaking down the protein in the
venom. Several species of rockfishes and the spotted ratfish (Hydrolagus colliei) also have
mildly venomous spines that can cause a burning sensation. The round sting ray (Urobatis
halleri), the California butterfly ray (Gymnura marmorata), and the bat ray (Myliobatis
californica) all have venomous spines on their tails. The wound should be immersed in hot
water to break down the protein in the venom. The Pacific electric ray (Torpedo californica)
can emit a very strong electric shock. If you must handle this species, wear rubber gloves
and hold it by the tail. Do not grasp the disk with both hands. Pacific angel sharks (Squatina
californica), spiny dogfish (Squalus acanthias), spotted ratfish, Pacific electric rays, and
California halibut (Paralichthys californicus) all have sharp teeth that can result in painful
bites if they are not handled properly. Care must also be taken in handling the blueleg
mantis shrimp (Hemisquilla ensigera). This species is capable of severely cutting a person
with its raptorial appendages. Care should also be taken in handling any of the large crabs
and octopi.
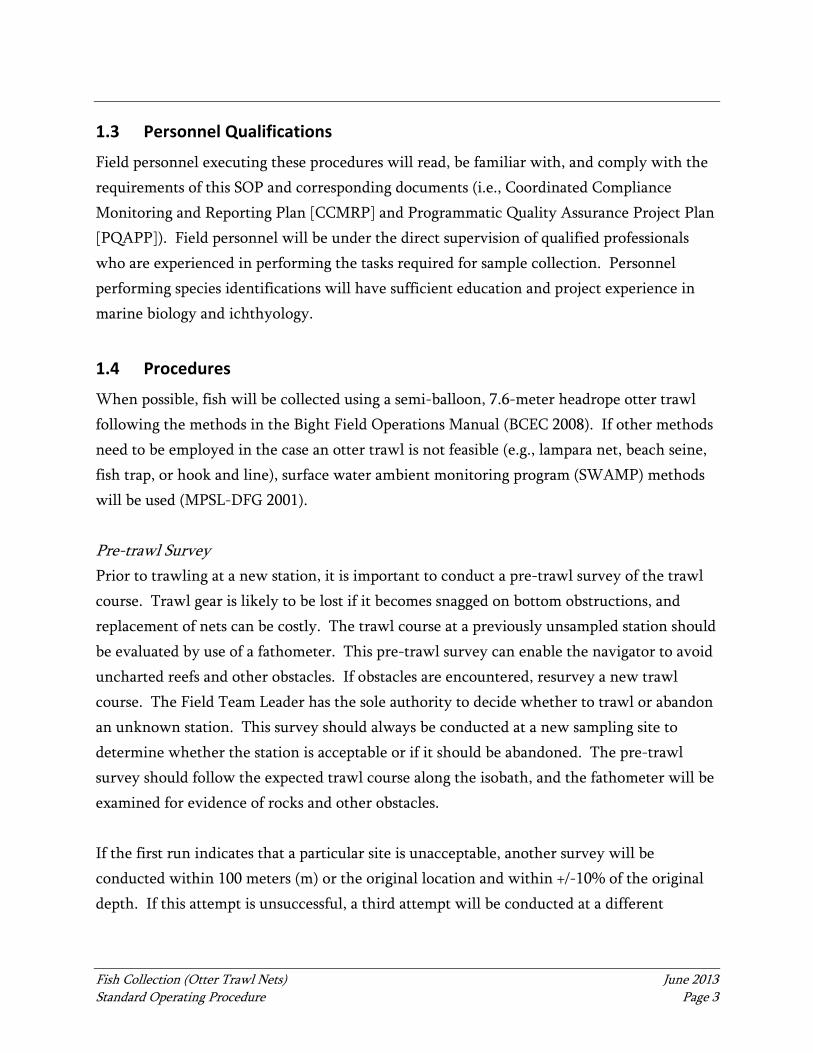
Fish Collection (Otter Trawl Nets) June 2013 Standard Operating Procedure Page 3
1.3 Personnel Qualifications
Field personnel executing these procedures will read, be familiar with, and comply with the
requirements of this SOP and corresponding documents (i.e., Coordinated Compliance
Monitoring and Reporting Plan [CCMRP] and Programmatic Quality Assurance Project Plan
[PQAPP]). Field personnel will be under the direct supervision of qualified professionals
who are experienced in performing the tasks required for sample collection. Personnel
performing species identifications will have sufficient education and project experience in
marine biology and ichthyology.
1.4 Procedures
When possible, fish will be collected using a semi-balloon, 7.6-meter headrope otter trawl
following the methods in the Bight Field Operations Manual (BCEC 2008). If other methods
need to be employed in the case an otter trawl is not feasible (e.g., lampara net, beach seine,
fish trap, or hook and line), surface water ambient monitoring program (SWAMP) methods
will be used (MPSL-DFG 2001).
Pre-trawl Survey
Prior to trawling at a new station, it is important to conduct a pre-trawl survey of the trawl
course. Trawl gear is likely to be lost if it becomes snagged on bottom obstructions, and
replacement of nets can be costly. The trawl course at a previously unsampled station should
be evaluated by use of a fathometer. This pre-trawl survey can enable the navigator to avoid
uncharted reefs and other obstacles. If obstacles are encountered, resurvey a new trawl
course. The Field Team Leader has the sole authority to decide whether to trawl or abandon
an unknown station. This survey should always be conducted at a new sampling site to
determine whether the station is acceptable or if it should be abandoned. The pre-trawl
survey should follow the expected trawl course along the isobath, and the fathometer will be
examined for evidence of rocks and other obstacles.
If the first run indicates that a particular site is unacceptable, another survey will be
conducted within 100 meters (m) or the original location and within +/-10% of the original
depth. If this attempt is unsuccessful, a third attempt will be conducted at a different
Fish Collection (Otter Trawl Nets) June 2013 Standard Operating Procedure Page 4
location using the same protocols (within 100 m of the original location, and within +/-10%
of original depth). The site will be abandoned after three unsuccessful attempts.
Net Preparation
The trawl components should be properly prepared prior to trawling so that the trawl can be
deployed in an orderly and safe manner upon arrival at a station. Nets should be inspected
for holes prior to deployment, and repaired as needed. The net should be laid out and
stacked on the stern of the vessel in the same configuration that it will be deployed: cod-end
to the stern, floats up, and foot rope down. The trawl net should be checked to make sure
that the cod-end is tied correctly, the doors should be connected properly to the leg lines,
and the bridles should be securely fastened to the doors and to the tow wire.
Trawling
Trawls will be towed along, rather than across, isobaths. While the vessel is underway, the
net and doors will be placed in the water. It is important that the floats skim the surface and
that the net is not entangled (e.g., crossed leg lines, bunched or hooked portions of the net)
prior to paying out the bridles. The bridles should be paid out by personnel on either side of
the net, so as to avoid becoming entangled in the rigging during deployment.
Use of the proper scope (i.e., length of hydrowire paid out versus the water depth) is
important for successful trawls. After the net touches the bottom, a sufficient length of
hydrowire (towing wire) should be paid out to ensure that the net is pulled from a horizontal
rather than a vertical position. Insufficient scope will prevent the net from consistently
fishing the bottom and will result in a no-catch or a short-catch situation. In general, the
required scope declines with increasing depth because the additional weight of the
hydrowire enhances the horizontal component of the towing forces (Table 1).
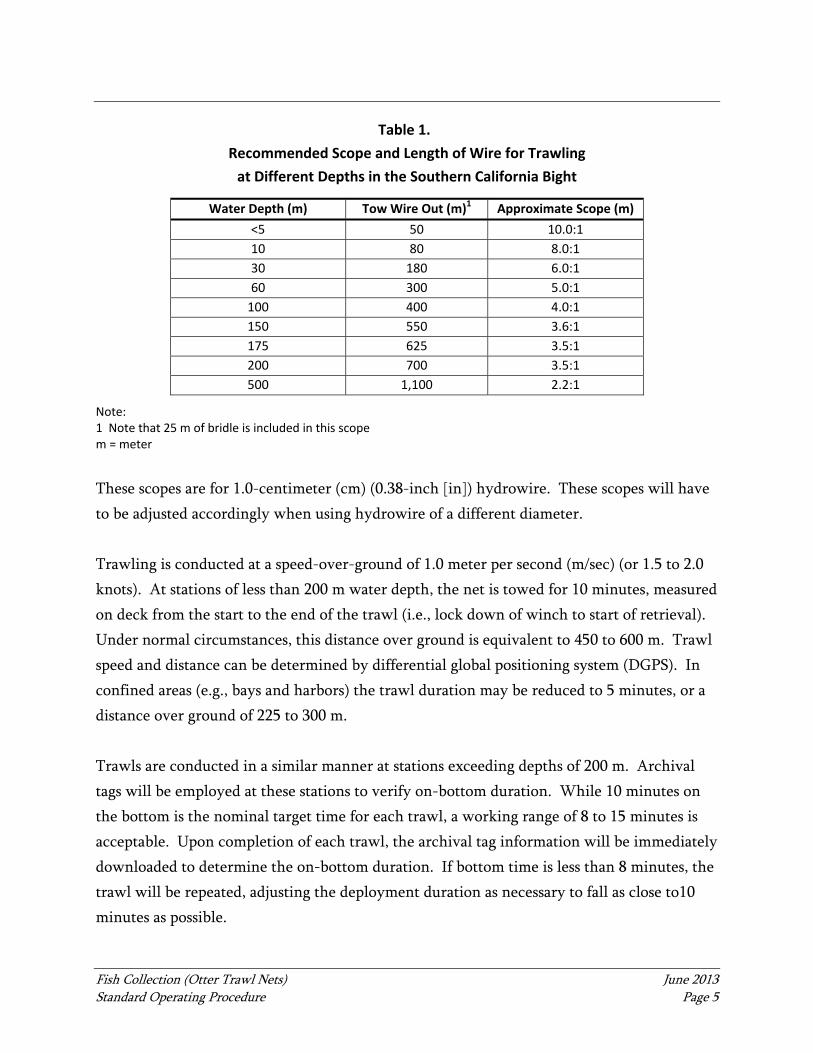
Fish Collection (Otter Trawl Nets) June 2013 Standard Operating Procedure Page 5
Table 1.
Recommended Scope and Length of Wire for Trawling
at Different Depths in the Southern California Bight
Water Depth (m) Tow Wire Out (m)1 Approximate Scope (m)
<5 50 10.0:1
10 80 8.0:1
30 180 6.0:1
60 300 5.0:1
100 400 4.0:1
150 550 3.6:1
175 625 3.5:1
200 700 3.5:1
500 1,100 2.2:1
Note: 1 Note that 25 m of bridle is included in this scope m = meter
These scopes are for 1.0-centimeter (cm) (0.38-inch [in]) hydrowire. These scopes will have
to be adjusted accordingly when using hydrowire of a different diameter.
Trawling is conducted at a speed-over-ground of 1.0 meter per second (m/sec) (or 1.5 to 2.0
knots). At stations of less than 200 m water depth, the net is towed for 10 minutes, measured
on deck from the start to the end of the trawl (i.e., lock down of winch to start of retrieval).
Under normal circumstances, this distance over ground is equivalent to 450 to 600 m. Trawl
speed and distance can be determined by differential global positioning system (DGPS). In
confined areas (e.g., bays and harbors) the trawl duration may be reduced to 5 minutes, or a
distance over ground of 225 to 300 m.
Trawls are conducted in a similar manner at stations exceeding depths of 200 m. Archival
tags will be employed at these stations to verify on-bottom duration. While 10 minutes on
the bottom is the nominal target time for each trawl, a working range of 8 to 15 minutes is
acceptable. Upon completion of each trawl, the archival tag information will be immediately
downloaded to determine the on-bottom duration. If bottom time is less than 8 minutes, the
trawl will be repeated, adjusting the deployment duration as necessary to fall as close to10
minutes as possible.
Fish Collection (Otter Trawl Nets) June 2013 Standard Operating Procedure Page 6
All archival tag information should be retained electronically and submitted with the other
data types at the end of the project.
At the end of the prescribed trawl time, the net will be retrieved and brought on board the
vessel, the cod-end will be opened, and the catch will be deposited into a tub or holding
tank. The catch will subsequently be released to the scientific crew for processing.
Criteria for Accepting a Trawl
If a trawl is retrieved with little or no catch in the cod-end, its acceptability will be evaluated
according to whether the trawl was conducted properly. The criteria used to evaluate the
success of any trawl will include ensuring that proper depth, scope, speed, and distance (or
duration) were maintained; whether the net was fouled (net tangled); and whether the catch
shows evidence that it was on the bottom (e.g., rocks, benthic invertebrates, or fish). If any
of the trawl procedures were not followed, if the net was fouled or torn (the tear must be
sufficient to allow escapement), or if there was no evidence of contact with the bottom
(downloading the archival tag information can be useful), the trawl will be considered
unacceptable and the site will be re-trawled. When evaluating whether to abandon or re-
trawl a station, the Field Team Leader should keep in mind that the goal is to collect the
targeted species.
If a retrieved net has been sufficiently torn to allow escapement during the course of a trawl,
the station will be abandoned. If the trawl hangs up on the bottom, the site will be
resampled or abandoned at the discretion of the Field Team Leader. If re-trawling the
station proves unsuccessful after two further attempts, the site will be abandoned.
Trawl Data Log
If for any reason the field computer stops functioning, the field crew will be responsible for
keeping a trawl data log. The information recorded in the log will include water depth,
length of tow wire used, and times and coordinates (latitude and longitude) for the net on
the bottom and the end of the trawl (beginning of trawl retrieval). Similar information may
also be recorded for when the net was deployed (net over) and when the net was retrieved
(net on deck). Any anomalous conditions, such as rocky substrate, rocks in the catch, or a
torn net, should also be recorded in the log.
Fish Collection (Otter Trawl Nets) June 2013 Standard Operating Procedure Page 7
1.5 Quality Assurance/Quality Control
It is the responsibility of the Field Team Leader to periodically check to ensure that fish
collection procedures are in conformance with those stated in this SOP.

STANDARD OPERATING PROCEDURE: FISH COLLECTION (ALL OTHER METHODS)
Fish Collection (All Other Methods) June 2013 Standard Operating Procedure Page 1
1 STANDARD OPERATING PROCEDURE ACKNOWLEDGEMENT FORM
Project Number: Project Name:
My signature below certifies that I have read and understand the procedures specified in this
Standard Operating Procedure.
Date Name (print) Signature Company
Fish Collection (All Other Methods) June 2013 Standard Operating Procedure Page 2
1.1 Scope and Application
This Standard Operating Procedure (SOP) is applicable to the collection of targeted fish
species via methods other than otter trawling (i.e., lampara net, beach seine, fish trap, or
hook and line). Fish tissue samples will be collected and analyzed for chemical contaminants
of concern. Sampling, processing, and testing methods will be carried out in accordance with
surface water ambient monitoring program (SWAMP) methods (MPSL-DFG 2001).
Necessary permits (e.g., scientific collection, incidental take) will be secured prior to fish
collection.
Targeted species:
White croaker (Genyonemus lineatus)
California halibut (Paralichthys californicus)
Shiner surfperch (Cymatogaster aggregata)
1.2 Health and Safety Warnings
Use caution when sorting through the catch. Field personnel are likely to encounter a
variety of organisms that are potentially harmful. California scorpionfish (Scorpaena guttata)
have venomous fin spines that can cause severe pain. This species should be handled with
leather gloves and/or pliers. Hot water, meat tenderizer, or ammonia should be applied to
any puncture wound inflicted by this fish; heat is useful in breaking down the protein in the
venom. Several species of rockfishes and the spotted ratfish (Hydrolagus colliei) also have
mildly venomous spines that can cause a burning sensation. The round sting ray (Urobatis
halleri), the California butterfly ray (Gymnura marmorata), and the bat ray (Myliobatis
californica) all have venomous spines on their tails. The wound should be immersed in hot
water to break down the protein in the venom. The Pacific electric ray (Torpedo californica)
can emit a very strong electric shock. If you must handle this species, wear rubber gloves
and hold it by the tail. Do not grasp the disk with both hands. Pacific angel sharks (Squatina
californica), spiny dogfish (Squalus acanthias), spotted ratfish, Pacific electric rays, and
California halibut (Paralichthys californicus) all have sharp teeth that can result in painful
bites if they are not handled properly. Care must also be taken in handling the blueleg
mantis shrimp (Hemisquilla ensigera). This species is capable of severely cutting a person
Fish Collection (All Other Methods) June 2013 Standard Operating Procedure Page 3
with its raptorial appendages. Care should also be taken in handling any of the large crabs
and octopi.
1.3 Personnel Qualifications
Field personnel executing these procedures will read, be familiar with, and comply with the
requirements of this SOP and corresponding documents (i.e., Coordinated Compliance
Monitoring and Reporting Plan [CCMRP] and Programmatic Quality Assurance Project Plan
[PQAPP]). Field personnel will be under the direct supervision of qualified professionals
who are experienced in performing the tasks required for sample collection. Personnel
performing species identifications will have sufficient education and project experience in
marine biology and ichthyology.
1.4 Procedures
Fish will be collected using the appropriate gear for the desired species and existing water
conditions.
Fyke or Hoop Net
Six 36-inch-diameter hoops connected with 1-inch square mesh net will be used to collect
fish, primarily catfish. The net will be placed parallel to the shore with the open hoop end
facing downstream. The net will be placed in areas of slow moving water. A partially
opened can of cat food will be placed in the upstream end of the net. Between two and six
nets will be placed at a site overnight. Upon retrieval a grappling hook will be used to pull
up the downstream anchor. The hoops and net will be pulled together and placed on a 30-
gallon plastic bag in the boat. With polyethylene gloves, the desired fish will be placed in a
30-gallon plastic bag and kept in an ice chest with ice until the appropriate number and size
of fish are collected.
Gill Nets
A 100 yard monofilament gill net of the appropriate mesh size for the desired fish will be set
out over the bow of the boat parallel to shore. The net will be retrieved after being set for 1
to 4 hours. The boat engine will be turned off and the net pulled over the side or bow of the
boat. The net will be retrieved starting from the down-current end. If the current is too
Fish Collection (All Other Methods) June 2013 Standard Operating Procedure Page 4
strong to pull in by hand, then the boat will be slowly motored forward and the net pulled
over the bow. Before the net is brought into the boat, the fish will be picked out of the net,
placed in another 30 gallon plastic bag, and kept in an ice chest with ice.
Beach Seines
In areas of shallow water, beach seines of the appropriate length, height, and mesh size will
be used. One sampler in a wetsuit or waders will pull the beach seine out from shore. The
weighted side of the seine must drag on the bottom while the float side is on the surface.
The offshore sampler will pull the seine out as far as necessary, and then will pull the seine
parallel to shore and then back to shore, forming a half circle. Another sampler will hold the
other end on shore while this is occurring. When the offshore sampler reaches shore, the
two samplers will come together with the seine. The seine will be pulled onto shore, making
sure that the weighted side drags the bottom. When the seine is completely pulled onshore,
the target fish will be collected with polyethylene gloves and placed in a 30-gallon plastic
bag and kept in an ice chest with ice. The beach seine will be rinsed off in the ambient water
and placed in the rinsed 30-gallon plastic bucket.
Cast Net
A 10- or 12-foot cast net will be used to collect fish off a pier, boat, or shallow water. The
cast net will be rinsed in ambient water prior to use and stored in a covered plastic bucket.
The target fish will be sampled with polyethylene gloves, placed in a 30-gallon plastic bag,
and kept in an ice chest with ice.
Hook and Line
Fish will be caught off a pier, boat, or shore by hook and line. Hooked fish will be taken off
with polyethylene gloves, placed in a Ziploc™ bag or a 30-gallon plastic bag, and kept in an
ice chest with ice.
Spearfishing
Certain species of fish are captured more easily by SCUBA divers spearing the fish. Only
appropriately trained divers following the dive safety program guidelines will be used for this
method of collection. Generally, fish in the kelp beds are more easily captured by spearing.
The fish will be shot in the head area to prevent the fillets from being damaged or
Fish Collection (All Other Methods) June 2013 Standard Operating Procedure Page 5
contaminated. Spear tips will be washed with a detergent and rinsed with ambient water
prior to use.
1.5 Quality Assurance/Quality Control
It is the responsibility of the Field Team Leader to periodically check to ensure that fish
collection procedures are in conformance with those stated in this SOP.
STANDARD OPERATING PROCEDURE: FISH PROCESSING
Fish Processing June 2013 Standard Operating Procedure Page 1
1 STANDARD OPERATING PROCEDURE ACKNOWLEDGEMENT FORM
Project Number: Project Name:
My signature below certifies that I have read and understand the procedures specified in this
Standard Operating Procedure.
Date Name (print) Signature Company
Fish Processing June 2013 Standard Operating Procedure Page 2
1.1 Scope and Application
Fish tissue samples will be collected and analyzed for chemical contaminants of concern.
Sampling, processing, and testing methods will be carried out in accordance with Bight
protocols (BCEC 2008, 2009a). Necessary permits (e.g., scientific collection, incidental take)
will be secured prior to fish collection.
Targeted species
White croaker (Genyonemus lineatus)
California halibut (Paralichthys californicus)
Shiner surfperch (Cymatogaster aggregata)
1.2 Personnel Qualifications
Field personnel executing these procedures will read, be familiar with, and comply with the
requirements of this Standard Operating Procedure (SOP) and corresponding documents
(i.e., Coordinated Compliance Monitoring and Reporting Plan [CCMRP] and Programmatic
Quality Assurance Project Plan [PQAPP]). Field personnel will be under the direct
supervision of qualified professionals who are experienced in performing the tasks required
for sample collection. Personnel performing species identifications will have sufficient
education and project experience in marine biology and ichthyology.
1.3 Procedures
Once the catch is onboard the vessel, the targeted species will be identified and separated for
subsequent processing. At each station, 12 individuals of each fish species will be collected
for further processing. There is currently no legal size limit for white croaker. An ocean fish
contaminant survey was performed from 2002 to 2004 (NOAA 2007). In part, this survey
sought to generate information on contaminants of concern for fish caught for sustenance in
Southern California. Collection of white croaker for the Harbor Toxics TMDL study should
be consistent with this survey, which recommended a minimum length of 160 millimeters
(mm) (total length). Collection of California halibut that are of legal size limit is preferred.
The current regulations specify at least 22 inches, or 559 mm, (total length) for California
halibut (FGC 2012). Collection of adult shiner surfperch (i.e., second year age-class with a
target length of 88 mm [Odenweller 1975]) is preferred. Additional individuals of the three
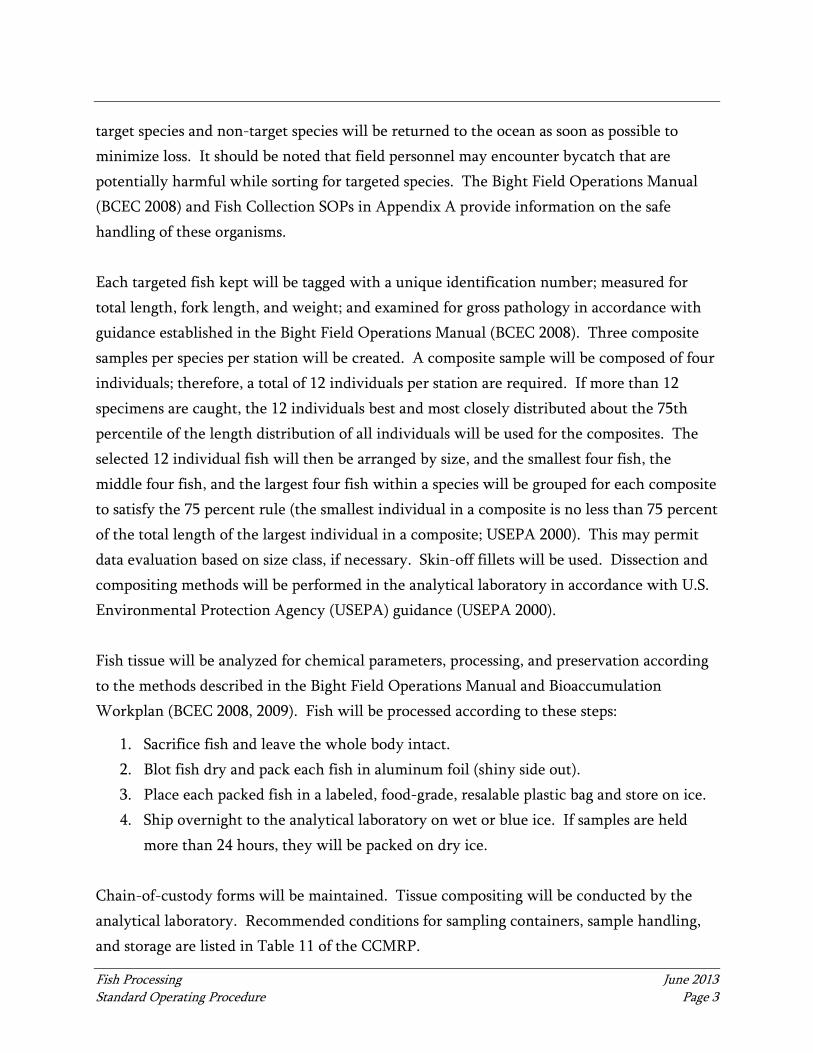
Fish Processing June 2013 Standard Operating Procedure Page 3
target species and non-target species will be returned to the ocean as soon as possible to
minimize loss. It should be noted that field personnel may encounter bycatch that are
potentially harmful while sorting for targeted species. The Bight Field Operations Manual
(BCEC 2008) and Fish Collection SOPs in Appendix A provide information on the safe
handling of these organisms.
Each targeted fish kept will be tagged with a unique identification number; measured for
total length, fork length, and weight; and examined for gross pathology in accordance with
guidance established in the Bight Field Operations Manual (BCEC 2008). Three composite
samples per species per station will be created. A composite sample will be composed of four
individuals; therefore, a total of 12 individuals per station are required. If more than 12
specimens are caught, the 12 individuals best and most closely distributed about the 75th
percentile of the length distribution of all individuals will be used for the composites. The
selected 12 individual fish will then be arranged by size, and the smallest four fish, the
middle four fish, and the largest four fish within a species will be grouped for each composite
to satisfy the 75 percent rule (the smallest individual in a composite is no less than 75 percent
of the total length of the largest individual in a composite; USEPA 2000). This may permit
data evaluation based on size class, if necessary. Skin-off fillets will be used. Dissection and
compositing methods will be performed in the analytical laboratory in accordance with U.S.
Environmental Protection Agency (USEPA) guidance (USEPA 2000).
Fish tissue will be analyzed for chemical parameters, processing, and preservation according
to the methods described in the Bight Field Operations Manual and Bioaccumulation
Workplan (BCEC 2008, 2009). Fish will be processed according to these steps:
1. Sacrifice fish and leave the whole body intact.
2. Blot fish dry and pack each fish in aluminum foil (shiny side out).
3. Place each packed fish in a labeled, food-grade, resalable plastic bag and store on ice.
4. Ship overnight to the analytical laboratory on wet or blue ice. If samples are held
more than 24 hours, they will be packed on dry ice.
Chain-of-custody forms will be maintained. Tissue compositing will be conducted by the
analytical laboratory. Recommended conditions for sampling containers, sample handling,
and storage are listed in Table 11 of the CCMRP.
Fish Processing June 2013 Standard Operating Procedure Page 4
1.4 Quality Assurance/Quality Control
Guidance for data quality objectives (DQOs) for field measurements is derived from the
surface water ambient monitoring program (SWAMP) guidance from the Bight Field
Operations Manual for fish tissue parameters (BCEC 2008). Quality objectives for parameters
that will be measured in the field are presented in Table 1.
All field measurements will be made in triplicate. Each result will be recorded along with
the average of the three results, the difference between the largest and smallest result, and
the percent difference between the largest and smallest result. The percent difference will
be calculated as follows:
Percent difference = 100*(largest-smallest)/average
Triplicate measurements, the average of the results, and percent difference will be recorded
on the field data sheet. The percent difference will be compared against the precision
criteria established for field measurements in Table 1, as appropriate. If precision does not
meet the established criteria, the equipment should be inspected to ensure that it is working
properly. Equipment will be recalibrated, if necessary, and then the triplicate measurements
process will be repeated until DQOs are achieved.
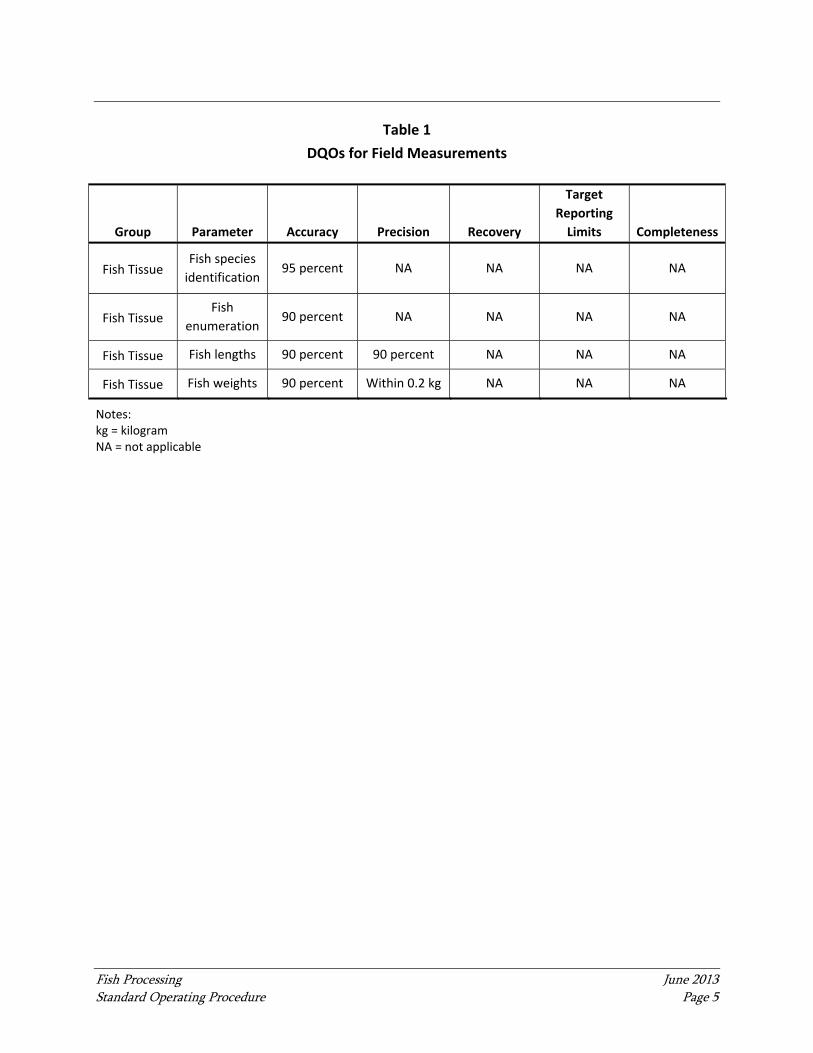
Fish Processing June 2013 Standard Operating Procedure Page 5
Table 1
DQOs for Field Measurements
Notes: kg = kilogram NA = not applicable
Group Parameter Accuracy Precision Recovery
Target
Reporting
Limits Completeness
Fish Tissue Fish species
identification 95 percent NA NA NA NA
Fish Tissue Fish
enumeration 90 percent NA NA NA NA
Fish Tissue Fish lengths 90 percent 90 percent NA NA NA
Fish Tissue Fish weights 90 percent Within 0.2 kg NA NA NA
APPENDIX B FIELD EDD FILE SPECIFICATIONS
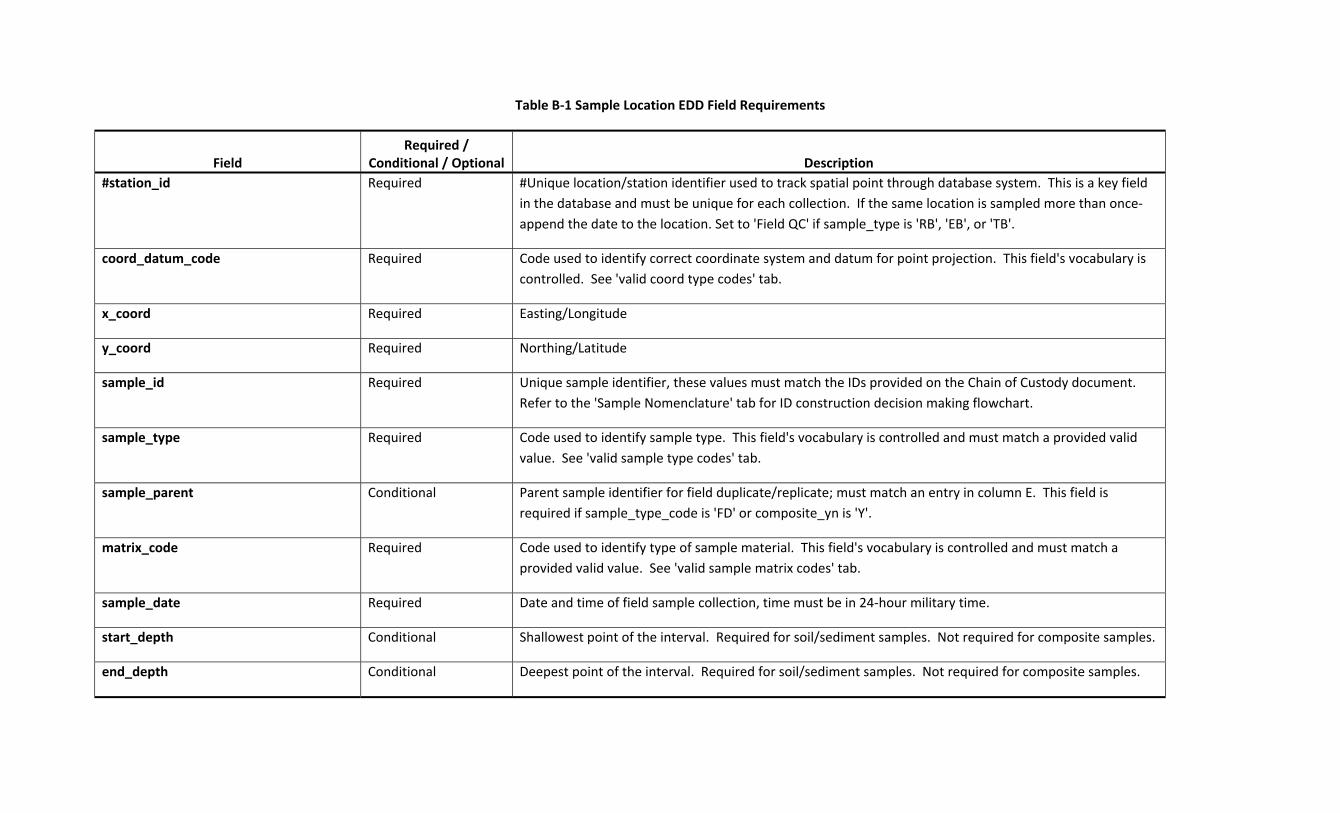
Table B‐1 Sample Location EDD Field Requirements
Field Required /
Conditional / Optional Description
#station_id Required #Unique location/station identifier used to track spatial point through database system. This is a key field
in the database and must be unique for each collection. If the same location is sampled more than once‐
append the date to the location. Set to 'Field QC' if sample_type is 'RB', 'EB', or 'TB'.
coord_datum_code Required Code used to identify correct coordinate system and datum for point projection. This field's vocabulary is
controlled. See 'valid coord type codes' tab.
x_coord Required Easting/Longitude
y_coord Required Northing/Latitude
sample_id Required Unique sample identifier, these values must match the IDs provided on the Chain of Custody document.
Refer to the 'Sample Nomenclature' tab for ID construction decision making flowchart.
sample_type Required Code used to identify sample type. This field's vocabulary is controlled and must match a provided valid
value. See 'valid sample type codes' tab.
sample_parent Conditional Parent sample identifier for field duplicate/replicate; must match an entry in column E. This field is
required if sample_type_code is 'FD' or composite_yn is 'Y'.
matrix_code Required Code used to identify type of sample material. This field's vocabulary is controlled and must match a
provided valid value. See 'valid sample matrix codes' tab.
sample_date Required Date and time of field sample collection, time must be in 24‐hour military time.
start_depth Conditional Shallowest point of the interval. Required for soil/sediment samples. Not required for composite samples.
end_depth Conditional Deepest point of the interval. Required for soil/sediment samples. Not required for composite samples.

Field Required /
Conditional / Optional Description
depth_unit Conditional Code used to identify depth units. This field's vocabulary is controlled and must match a provided valid
value. See 'valid units' tab.
composite_yn Required 'Y' for Yes if sample is a composite or 'N' for No if not.
composite_desc Conditional General description of composite. Required if composite_yn is 'Y'. Should include the list of samples
combined in the composite.
archive_yn Required 'N' if the sample is active, 'Y' if the sample is archive.
sampler Required Initials or name of the custodian responsible for sampling.
sampling_company Required Company responsible for field sampling.
comment Optional Optional comment about sample.

Table B‐2 Tissue Sample EDD Field Requirements
Field Required /
Conditional / Optional Description
#sample_id Required #Unique sample identifier, these values must match the IDs entered in the Loc_Smp tab. Refer to the
'Sample Nomenclature' tab for ID construction decision making flowchart.
parent_composite Required Points to the composite that the individual is a part of.
measurement_date Required Date and time of sample measurement, time must be in 24‐hour military time.
species Required Common name (Genus species).
specimen_length Required Measured fish length (nose to caudal fork).
length_unit Required This field's vocabulary is controlled and must match a provided valid value. See 'valid units' tab.
specimen_weight Required Measured fish weight.
weight_unit Required This field's vocabulary is controlled and must match a provided valid value. See 'valid units' tab.
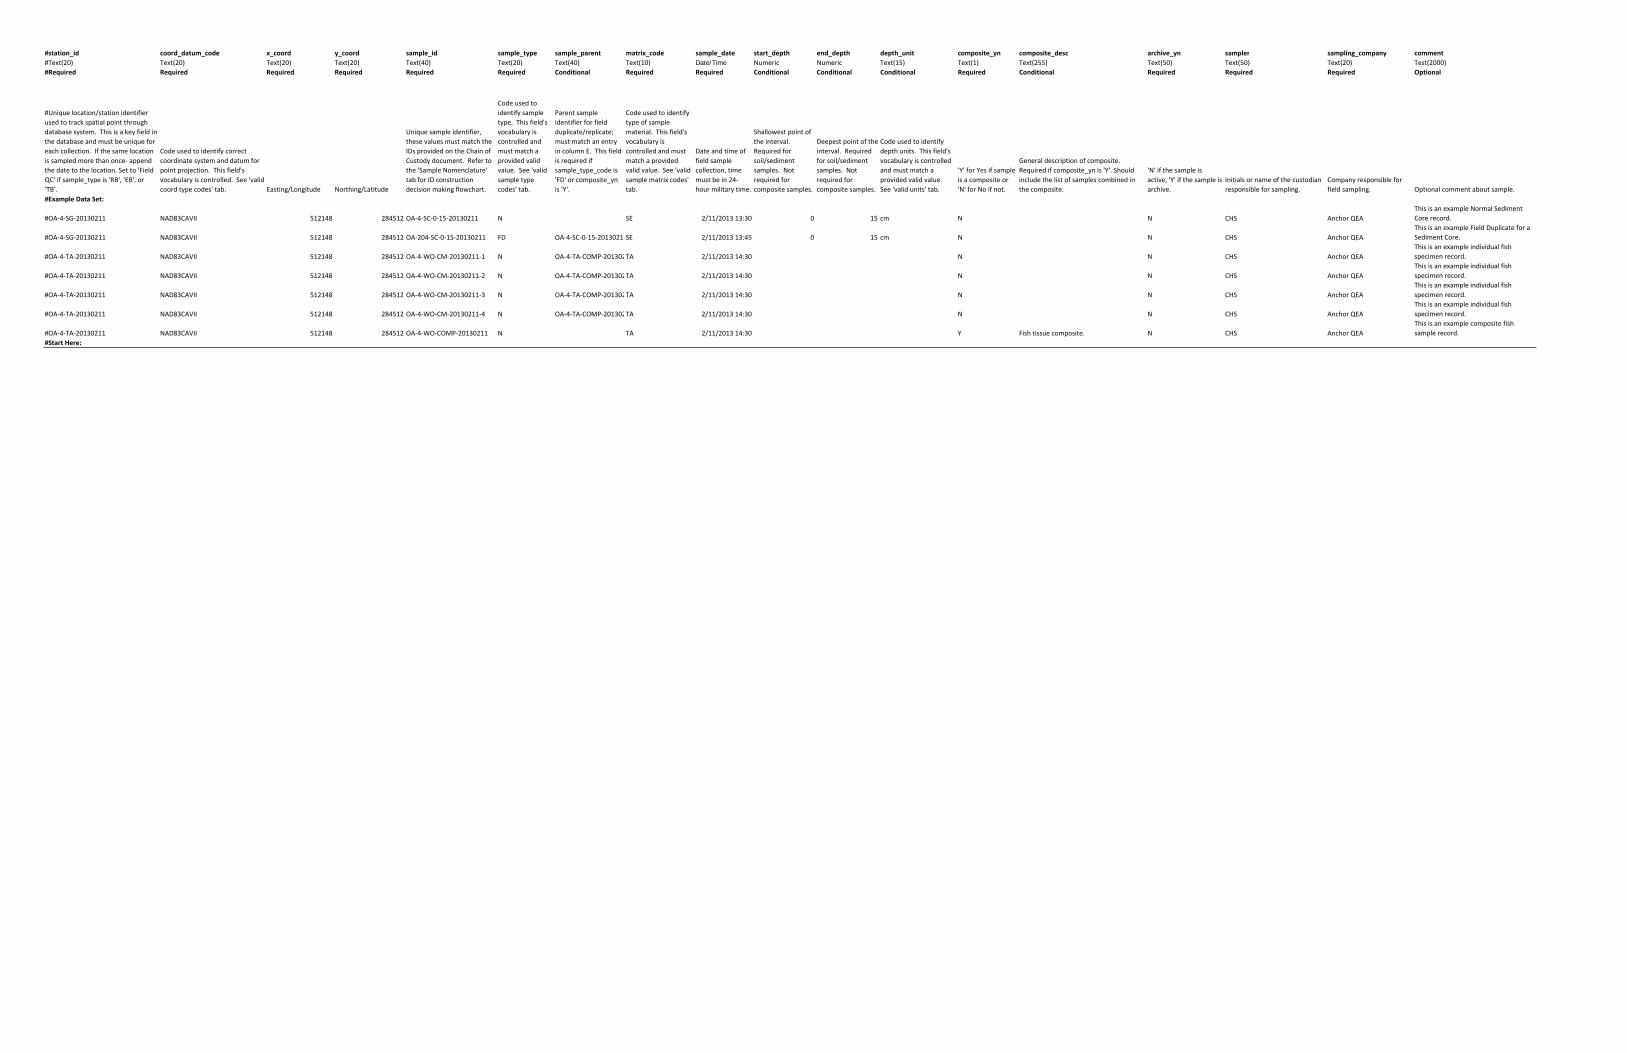
#station_id coord_datum_code x_coord y_coord sample_id sample_type sample_parent matrix_code sample_date start_depth end_depth depth_unit composite_yn composite_desc archive_yn sampler sampling_company comment
#Text(20) Text(20) Text(20) Text(20) Text(40) Text(20) Text(40) Text(10) Date/Time Numeric Numeric Text(15) Text(1) Text(255) Text(50) Text(50) Text(20) Test(2000)
#Required Required Required Required Required Required Conditional Required Required Conditional Conditional Conditional Required Conditional Required Required Required Optional
#Unique location/station identifier
used to track spatial point through
database system. This is a key field in
the database and must be unique for
each collection. If the same location
is sampled more than once‐ append
the date to the location. Set to 'Field
QC' if sample_type is 'RB', 'EB', or
'TB'.
Code used to identify correct
coordinate system and datum for
point projection. This field's
vocabulary is controlled. See 'valid
coord type codes' tab. Easting/Longitude Northing/Latitude
Unique sample identifier,
these values must match the
IDs provided on the Chain of
Custody document. Refer to
the 'Sample Nomenclature'
tab for ID construction
decision making flowchart.
Code used to
identify sample
type. This field's
vocabulary is
controlled and
must match a
provided valid
value. See 'valid
sample type
codes' tab.
Parent sample
identifier for field
duplicate/replicate;
must match an entry
in column E. This field
is required if
sample_type_code is
'FD' or composite_yn
is 'Y'.
Code used to identify
type of sample
material. This field's
vocabulary is
controlled and must
match a provided
valid value. See 'valid
sample matrix codes'
tab.
Date and time of
field sample
collection, time
must be in 24‐
hour military time.
Shallowest point of
the interval.
Required for
soil/sediment
samples. Not
required for
composite samples.
Deepest point of the
interval. Required
for soil/sediment
samples. Not
required for
composite samples.
Code used to identify
depth units. This field's
vocabulary is controlled
and must match a
provided valid value.
See 'valid units' tab.
'Y' for Yes if sample
is a composite or
'N' for No if not.
General description of composite.
Required if composite_yn is 'Y'. Should
include the list of samples combined in
the composite.
'N' if the sample is
active, 'Y' if the sample is
archive.
Initials or name of the custodian
responsible for sampling.
Company responsible for
field sampling. Optional comment about sample.
#Example Data Set:
#OA‐4‐SG‐20130211 NAD83CAVII 512148 284512 OA‐4‐SC‐0‐15‐20130211 N SE 2/11/2013 13:30 0 15 cm N N CHS Anchor QEA
This is an example Normal Sediment
Core record.
#OA‐4‐SG‐20130211 NAD83CAVII 512148 284512 OA‐204‐SC‐0‐15‐20130211 FD OA‐4‐SC‐0‐15‐20130211SE 2/11/2013 13:45 0 15 cm N N CHS Anchor QEA
This is an example Field Duplicate for a
Sediment Core.
#OA‐4‐TA‐20130211 NAD83CAVII 512148 284512 OA‐4‐WO‐CM‐20130211‐1 N OA‐4‐TA‐COMP‐201302TA 2/11/2013 14:30 N N CHS Anchor QEA
This is an example individual fish
specimen record.
#OA‐4‐TA‐20130211 NAD83CAVII 512148 284512 OA‐4‐WO‐CM‐20130211‐2 N OA‐4‐TA‐COMP‐201302TA 2/11/2013 14:30 N N CHS Anchor QEA
This is an example individual fish
specimen record.
#OA‐4‐TA‐20130211 NAD83CAVII 512148 284512 OA‐4‐WO‐CM‐20130211‐3 N OA‐4‐TA‐COMP‐201302TA 2/11/2013 14:30 N N CHS Anchor QEA
This is an example individual fish
specimen record.
#OA‐4‐TA‐20130211 NAD83CAVII 512148 284512 OA‐4‐WO‐CM‐20130211‐4 N OA‐4‐TA‐COMP‐201302TA 2/11/2013 14:30 N N CHS Anchor QEA
This is an example individual fish
specimen record.
#OA‐4‐TA‐20130211 NAD83CAVII 512148 284512 OA‐4‐WO‐COMP‐20130211 N TA 2/11/2013 14:30 Y Fish tissue composite. N CHS Anchor QEA
This is an example composite fish
sample record.
#Start Here:
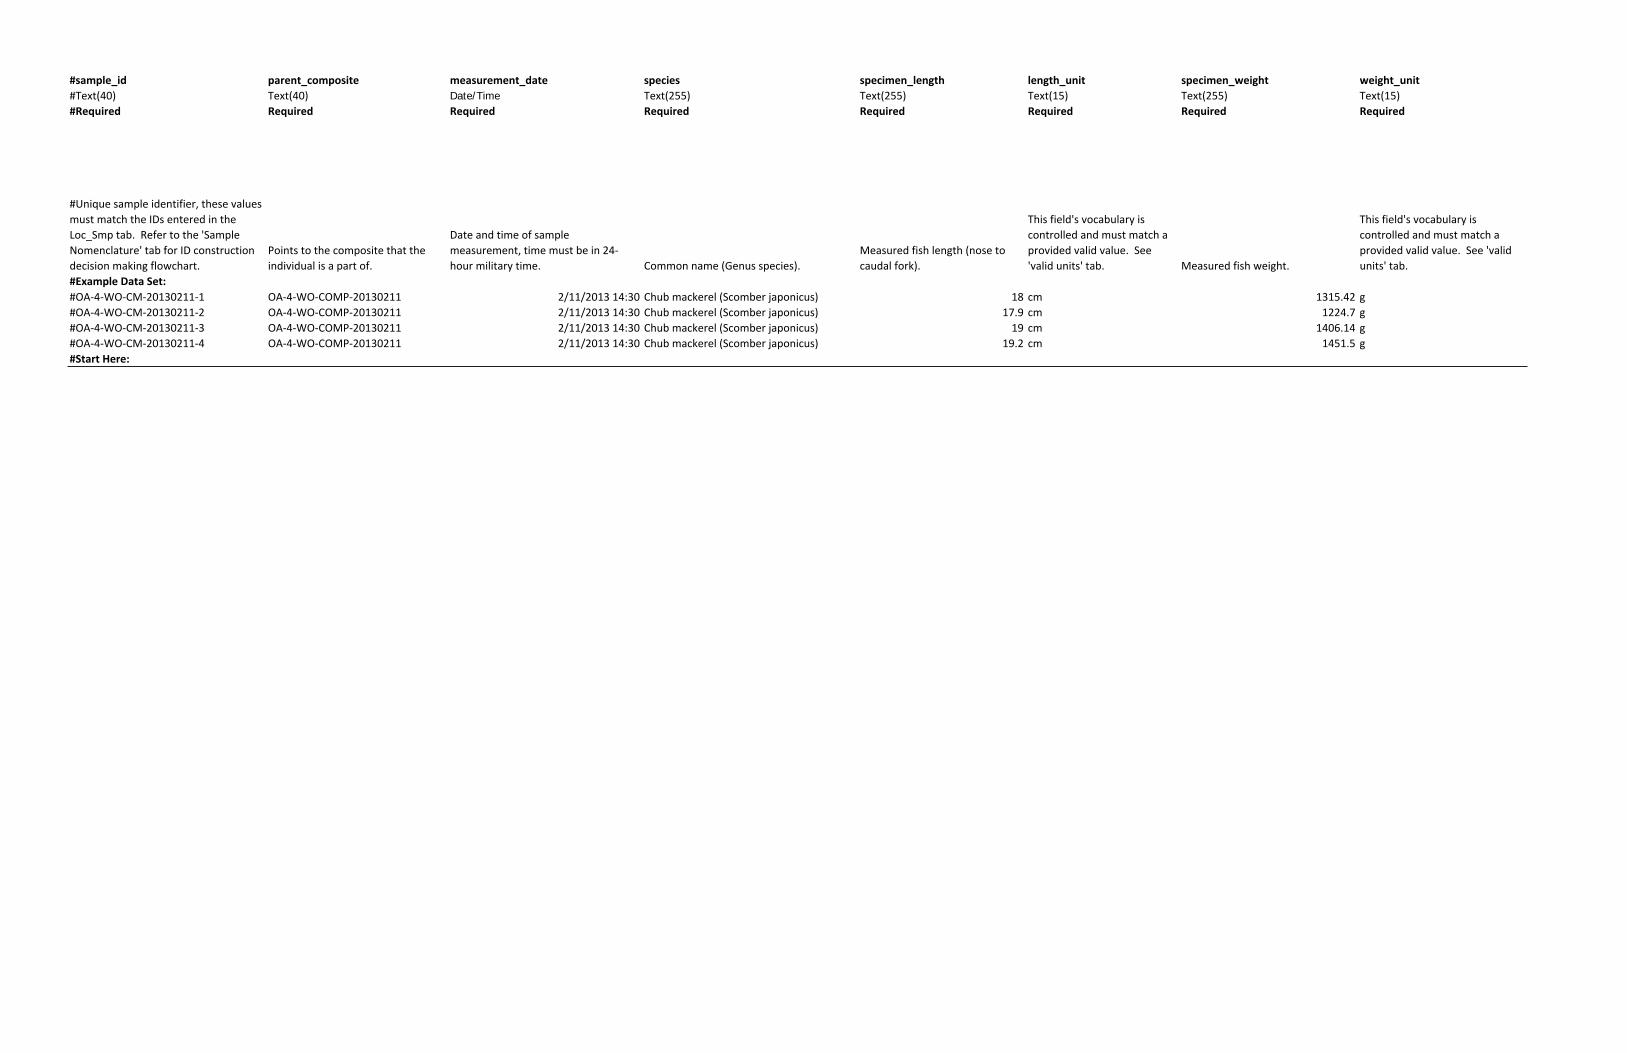
#sample_id parent_composite measurement_date species specimen_length length_unit specimen_weight weight_unit
#Text(40) Text(40) Date/Time Text(255) Text(255) Text(15) Text(255) Text(15)
#Required Required Required Required Required Required Required Required
#Unique sample identifier, these values
must match the IDs entered in the
Loc_Smp tab. Refer to the 'Sample
Nomenclature' tab for ID construction
decision making flowchart.
Points to the composite that the
individual is a part of.
Date and time of sample
measurement, time must be in 24‐
hour military time. Common name (Genus species).
Measured fish length (nose to
caudal fork).
This field's vocabulary is
controlled and must match a
provided valid value. See
'valid units' tab. Measured fish weight.
This field's vocabulary is
controlled and must match a
provided valid value. See 'valid
units' tab.
#Example Data Set:
#OA‐4‐WO‐CM‐20130211‐1 OA‐4‐WO‐COMP‐20130211 2/11/2013 14:30 Chub mackerel (Scomber japonicus) 18 cm 1315.42 g
#OA‐4‐WO‐CM‐20130211‐2 OA‐4‐WO‐COMP‐20130211 2/11/2013 14:30 Chub mackerel (Scomber japonicus) 17.9 cm 1224.7 g
#OA‐4‐WO‐CM‐20130211‐3 OA‐4‐WO‐COMP‐20130211 2/11/2013 14:30 Chub mackerel (Scomber japonicus) 19 cm 1406.14 g
#OA‐4‐WO‐CM‐20130211‐4 OA‐4‐WO‐COMP‐20130211 2/11/2013 14:30 Chub mackerel (Scomber japonicus) 19.2 cm 1451.5 g
#Start Here:
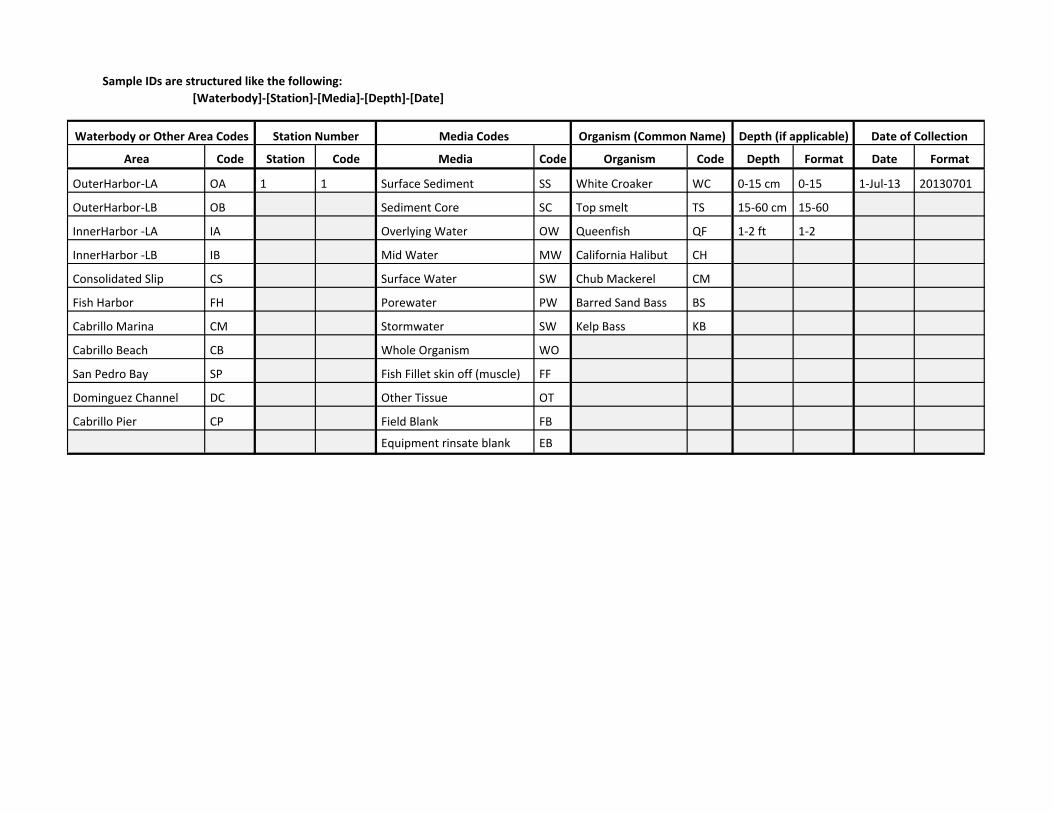
Area Code Station Code Media Code Organism Code Depth Format Date Format
OuterHarbor‐LA OA 1 1 Surface Sediment SS White Croaker WC 0‐15 cm 0‐15 1‐Jul‐13 20130701
OuterHarbor‐LB OB Sediment Core SC Top smelt TS 15‐60 cm 15‐60
InnerHarbor ‐LA IA Overlying Water OW Queenfish QF 1‐2 ft 1‐2
InnerHarbor ‐LB IB Mid Water MW California Halibut CH
Consolidated Slip CS Surface Water SW Chub Mackerel CM
Fish Harbor FH Porewater PW Barred Sand Bass BS
Cabrillo Marina CM Stormwater SW Kelp Bass KB
Cabrillo Beach CB Whole Organism WO
San Pedro Bay SP Fish Fillet skin off (muscle) FF
Dominguez Channel DC Other Tissue OT
Cabrillo Pier CP Field Blank FB
Equipment rinsate blank EB
Depth (if applicable) Date of Collection
Sample IDs are structured like the following:
[Waterbody]‐[Station]‐[Media]‐[Depth]‐[Date]
Waterbody or Other Area Codes Station Number Media Codes Organism (Common Name)
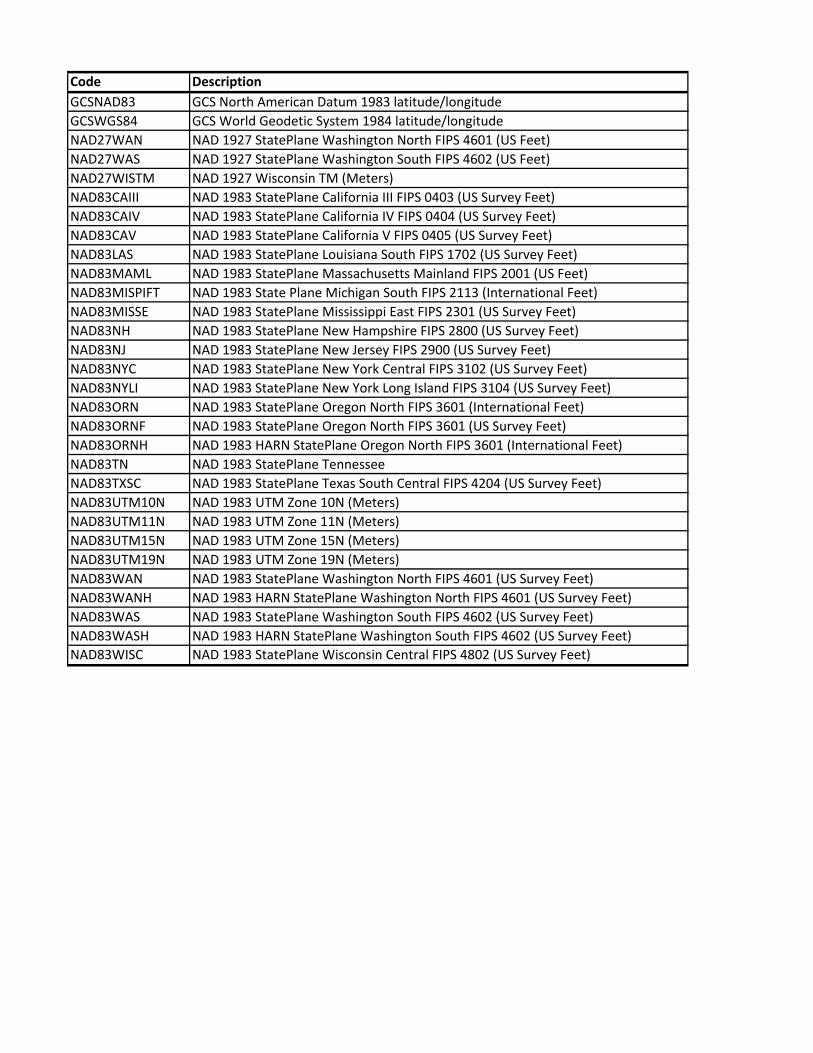
Code Description
GCSNAD83 GCS North American Datum 1983 latitude/longitude
GCSWGS84 GCS World Geodetic System 1984 latitude/longitude
NAD27WAN NAD 1927 StatePlane Washington North FIPS 4601 (US Feet)
NAD27WAS NAD 1927 StatePlane Washington South FIPS 4602 (US Feet)
NAD27WISTM NAD 1927 Wisconsin TM (Meters)
NAD83CAIII NAD 1983 StatePlane California III FIPS 0403 (US Survey Feet)
NAD83CAIV NAD 1983 StatePlane California IV FIPS 0404 (US Survey Feet)
NAD83CAV NAD 1983 StatePlane California V FIPS 0405 (US Survey Feet)
NAD83LAS NAD 1983 StatePlane Louisiana South FIPS 1702 (US Survey Feet)
NAD83MAML NAD 1983 StatePlane Massachusetts Mainland FIPS 2001 (US Feet)
NAD83MISPIFT NAD 1983 State Plane Michigan South FIPS 2113 (International Feet)
NAD83MISSE NAD 1983 StatePlane Mississippi East FIPS 2301 (US Survey Feet)
NAD83NH NAD 1983 StatePlane New Hampshire FIPS 2800 (US Survey Feet)
NAD83NJ NAD 1983 StatePlane New Jersey FIPS 2900 (US Survey Feet)
NAD83NYC NAD 1983 StatePlane New York Central FIPS 3102 (US Survey Feet)
NAD83NYLI NAD 1983 StatePlane New York Long Island FIPS 3104 (US Survey Feet)
NAD83ORN NAD 1983 StatePlane Oregon North FIPS 3601 (International Feet)
NAD83ORNF NAD 1983 StatePlane Oregon North FIPS 3601 (US Survey Feet)
NAD83ORNH NAD 1983 HARN StatePlane Oregon North FIPS 3601 (International Feet)
NAD83TN NAD 1983 StatePlane Tennessee
NAD83TXSC NAD 1983 StatePlane Texas South Central FIPS 4204 (US Survey Feet)
NAD83UTM10N NAD 1983 UTM Zone 10N (Meters)
NAD83UTM11N NAD 1983 UTM Zone 11N (Meters)
NAD83UTM15N NAD 1983 UTM Zone 15N (Meters)
NAD83UTM19N NAD 1983 UTM Zone 19N (Meters)
NAD83WAN NAD 1983 StatePlane Washington North FIPS 4601 (US Survey Feet)
NAD83WANH NAD 1983 HARN StatePlane Washington North FIPS 4601 (US Survey Feet)
NAD83WAS NAD 1983 StatePlane Washington South FIPS 4602 (US Survey Feet)
NAD83WASH NAD 1983 HARN StatePlane Washington South FIPS 4602 (US Survey Feet)
NAD83WISC NAD 1983 StatePlane Wisconsin Central FIPS 4802 (US Survey Feet)
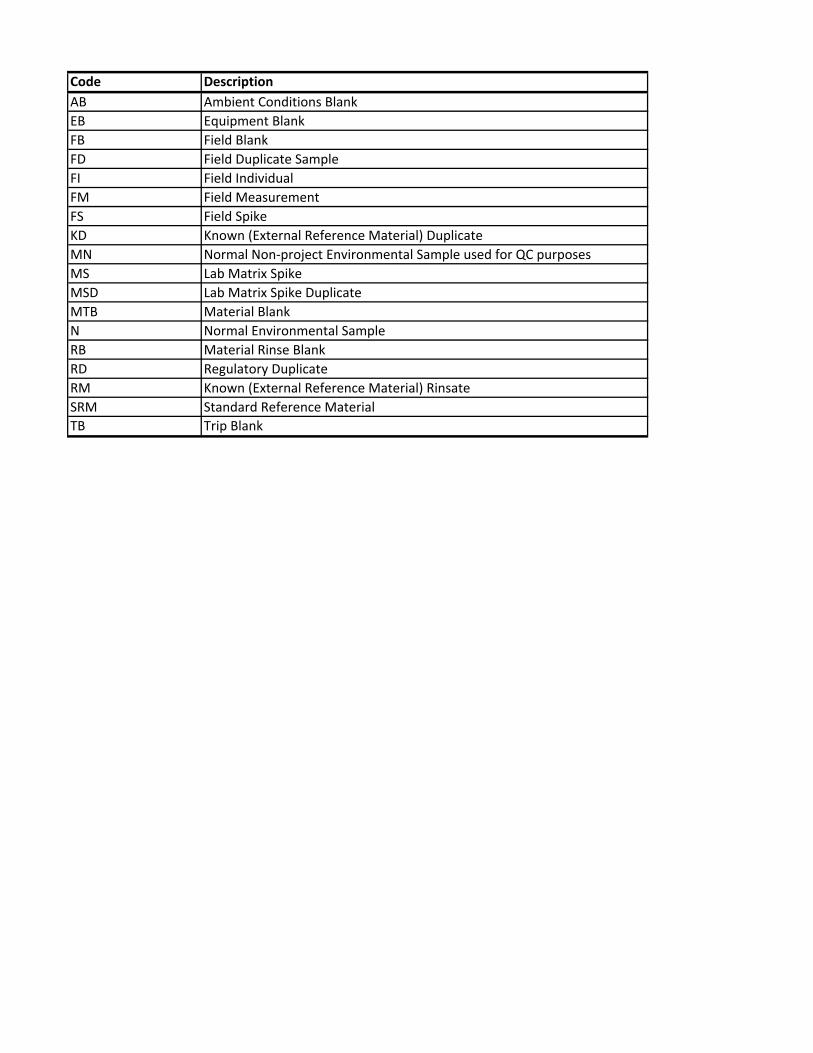
Code Description
AB Ambient Conditions Blank
EB Equipment Blank
FB Field Blank
FD Field Duplicate Sample
FI Field Individual
FM Field Measurement
FS Field Spike
KD Known (External Reference Material) Duplicate
MN Normal Non‐project Environmental Sample used for QC purposes
MS Lab Matrix Spike
MSD Lab Matrix Spike Duplicate
MTB Material Blank
N Normal Environmental Sample
RB Material Rinse Blank
RD Regulatory Duplicate
RM Known (External Reference Material) Rinsate
SRM Standard Reference Material
TB Trip Blank
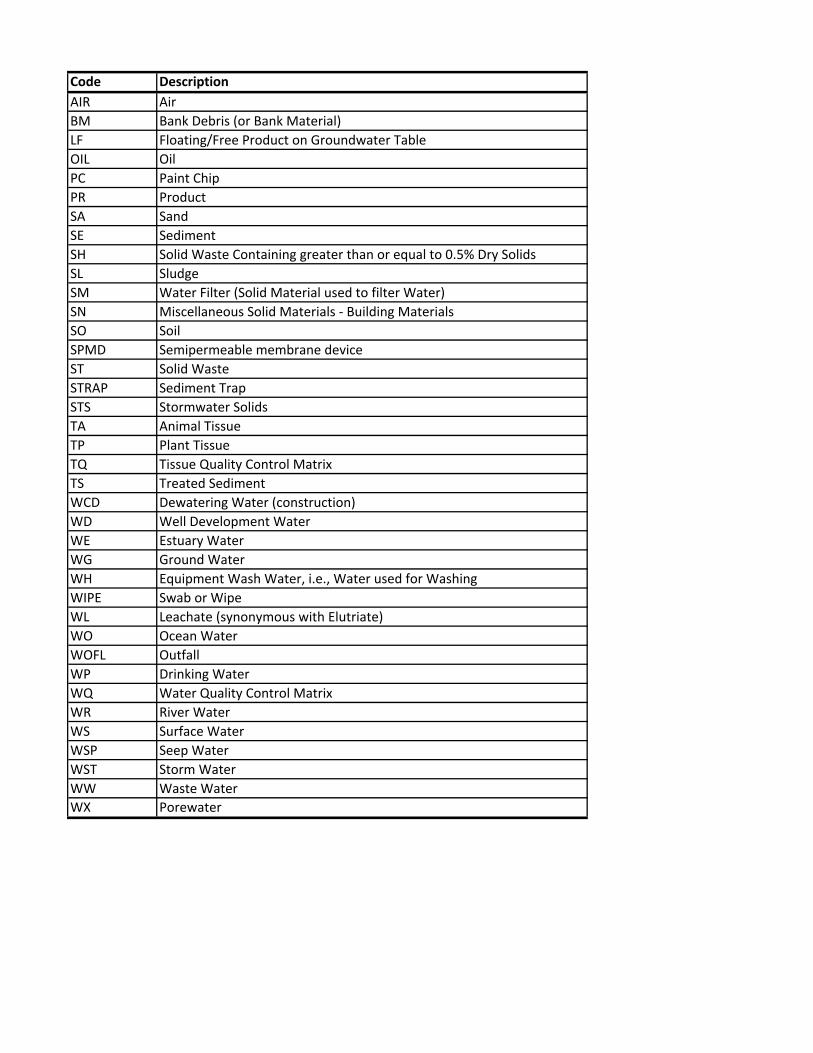
Code Description
AIR Air
BM Bank Debris (or Bank Material)
LF Floating/Free Product on Groundwater Table
OIL Oil
PC Paint Chip
PR Product
SA Sand
SE Sediment
SH Solid Waste Containing greater than or equal to 0.5% Dry Solids
SL Sludge
SM Water Filter (Solid Material used to filter Water)
SN Miscellaneous Solid Materials ‐ Building Materials
SO Soil
SPMD Semipermeable membrane device
ST Solid Waste
STRAP Sediment Trap
STS Stormwater Solids
TA Animal Tissue
TP Plant Tissue
TQ Tissue Quality Control Matrix
TS Treated Sediment
WCD Dewatering Water (construction)
WD Well Development Water
WE Estuary Water
WG Ground Water
WH Equipment Wash Water, i.e., Water used for Washing
WIPE Swab or Wipe
WL Leachate (synonymous with Elutriate)
WO Ocean Water
WOFL Outfall
WP Drinking Water
WQ Water Quality Control Matrix
WR River Water
WS Surface Water
WSP Seep Water
WST Storm Water
WW Waste Water
WX Porewater
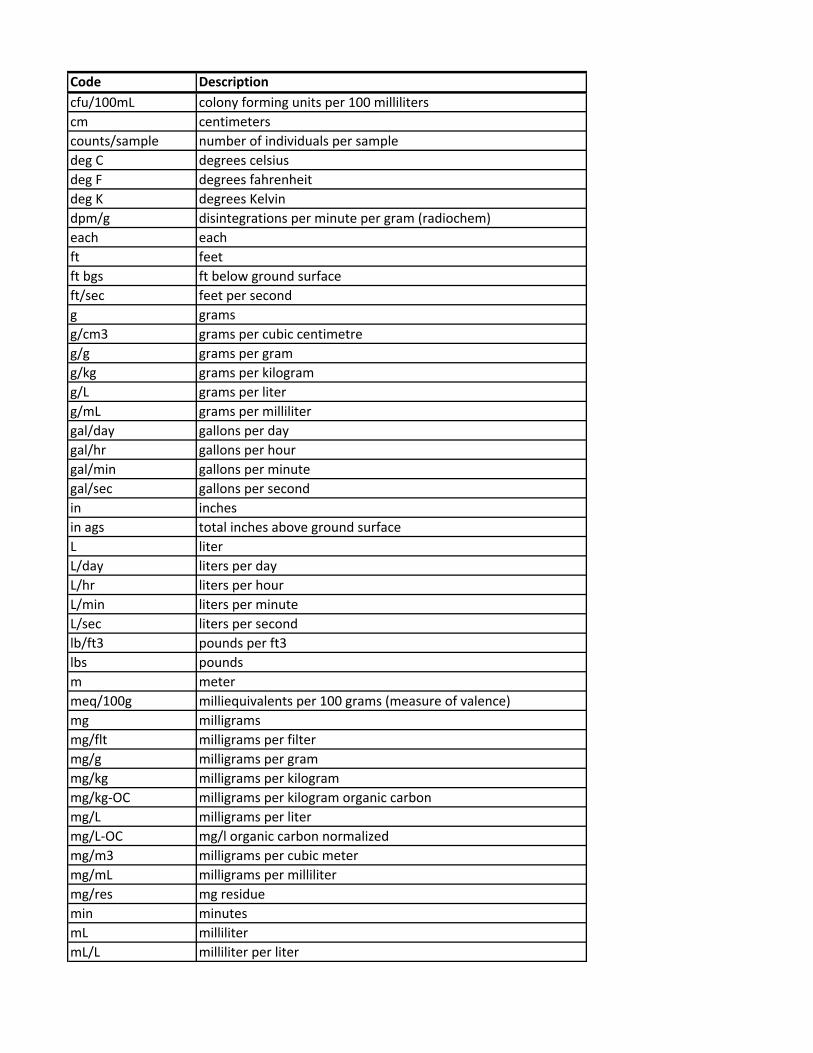
Code Description
cfu/100mL colony forming units per 100 milliliters
cm centimeters
counts/sample number of individuals per sample
deg C degrees celsius
deg F degrees fahrenheit
deg K degrees Kelvin
dpm/g disintegrations per minute per gram (radiochem)
each each
ft feet
ft bgs ft below ground surface
ft/sec feet per second
g grams
g/cm3 grams per cubic centimetre
g/g grams per gram
g/kg grams per kilogram
g/L grams per liter
g/mL grams per milliliter
gal/day gallons per day
gal/hr gallons per hour
gal/min gallons per minute
gal/sec gallons per second
in inches
in ags total inches above ground surface
L liter
L/day liters per day
L/hr liters per hour
L/min liters per minute
L/sec liters per second
lb/ft3 pounds per ft3
lbs pounds
m meter
meq/100g milliequivalents per 100 grams (measure of valence)
mg milligrams
mg/flt milligrams per filter
mg/g milligrams per gram
mg/kg milligrams per kilogram
mg/kg‐OC milligrams per kilogram organic carbon
mg/L milligrams per liter
mg/L‐OC mg/l organic carbon normalized
mg/m3 milligrams per cubic meter
mg/mL milligrams per milliliter
mg/res mg residue
min minutes
mL milliliter
mL/L milliliter per liter
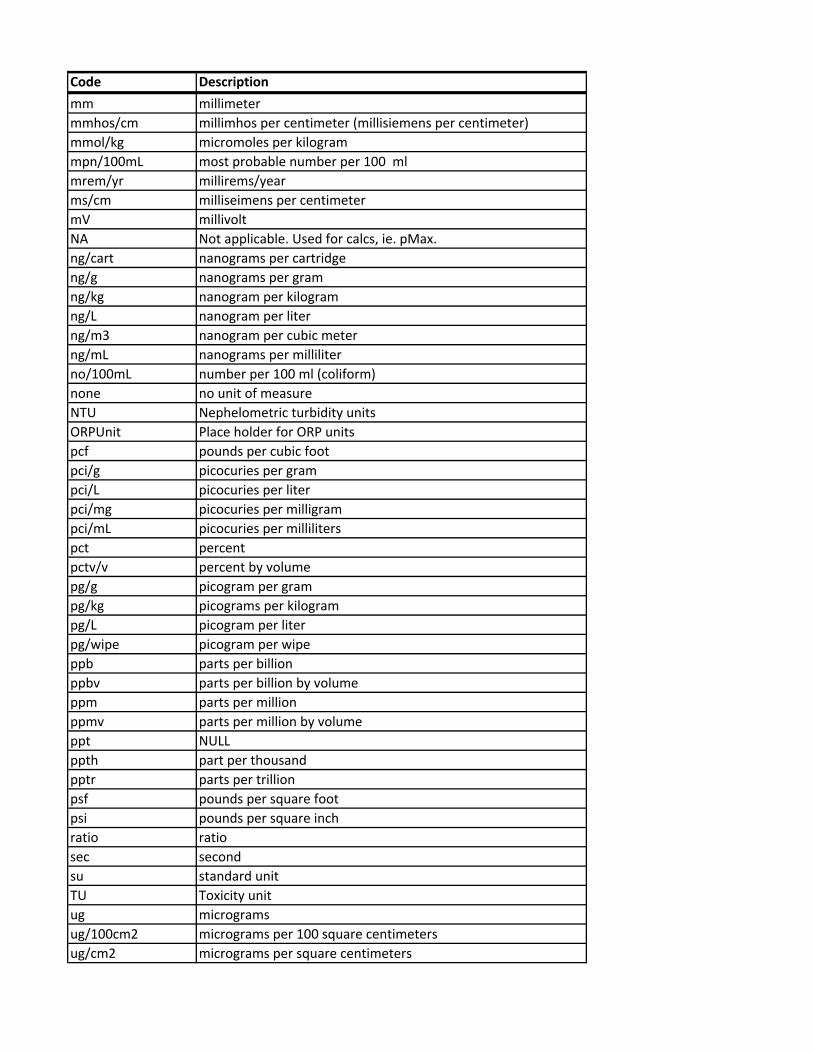
Code Description
mm millimeter
mmhos/cm millimhos per centimeter (millisiemens per centimeter)
mmol/kg micromoles per kilogram
mpn/100mL most probable number per 100 ml
mrem/yr millirems/year
ms/cm milliseimens per centimeter
mV millivolt
NA Not applicable. Used for calcs, ie. pMax.
ng/cart nanograms per cartridge
ng/g nanograms per gram
ng/kg nanogram per kilogram
ng/L nanogram per liter
ng/m3 nanogram per cubic meter
ng/mL nanograms per milliliter
no/100mL number per 100 ml (coliform)
none no unit of measure
NTU Nephelometric turbidity units
ORPUnit Place holder for ORP units
pcf pounds per cubic foot
pci/g picocuries per gram
pci/L picocuries per liter
pci/mg picocuries per milligram
pci/mL picocuries per milliliters
pct percent
pctv/v percent by volume
pg/g picogram per gram
pg/kg picograms per kilogram
pg/L picogram per liter
pg/wipe picogram per wipe
ppb parts per billion
ppbv parts per billion by volume
ppm parts per million
ppmv parts per million by volume
ppt NULL
ppth part per thousand
pptr parts per trillion
psf pounds per square foot
psi pounds per square inch
ratio ratio
sec second
su standard unit
TU Toxicity unit
ug micrograms
ug/100cm2 micrograms per 100 square centimeters
ug/cm2 micrograms per square centimeters
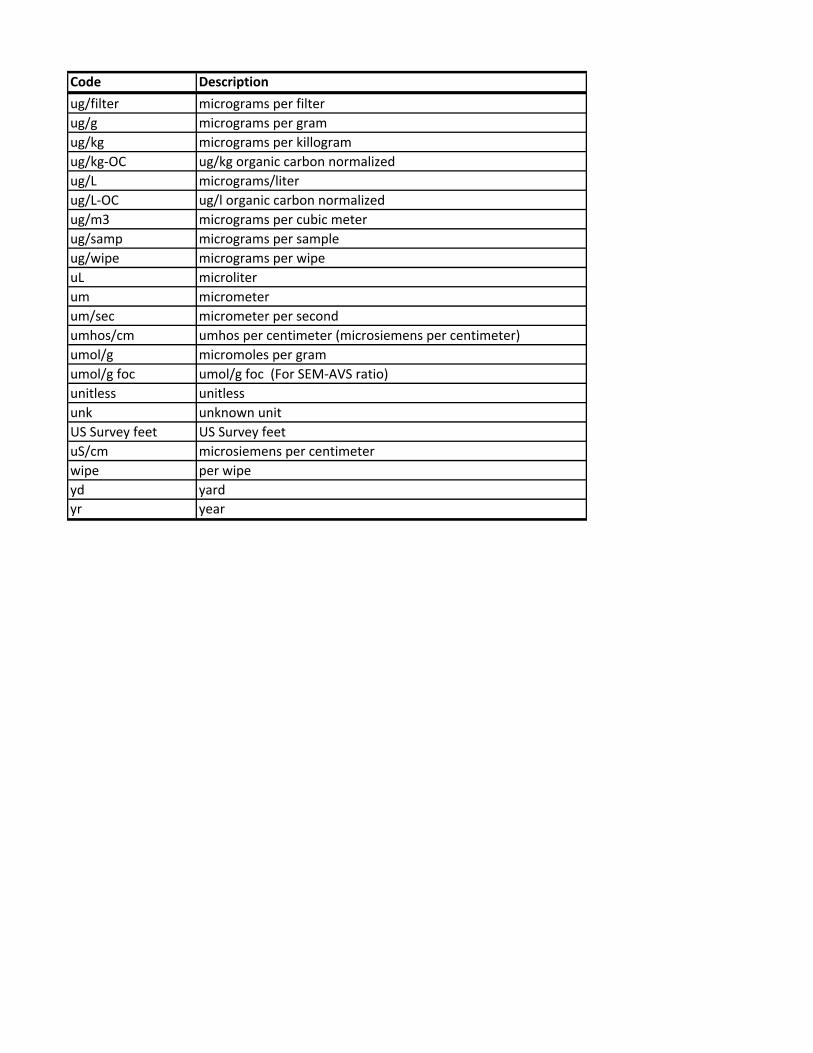
Code Description
ug/filter micrograms per filter
ug/g micrograms per gram
ug/kg micrograms per killogram
ug/kg‐OC ug/kg organic carbon normalized
ug/L micrograms/liter
ug/L‐OC ug/l organic carbon normalized
ug/m3 micrograms per cubic meter
ug/samp micrograms per sample
ug/wipe micrograms per wipe
uL microliter
um micrometer
um/sec micrometer per second
umhos/cm umhos per centimeter (microsiemens per centimeter)
umol/g micromoles per gram
umol/g foc umol/g foc (For SEM‐AVS ratio)
unitless unitless
unk unknown unit
US Survey feet US Survey feet
uS/cm microsiemens per centimeter
wipe per wipe
yd yard
yr year
APPENDIX C LABORATORY DATA EDD FILE SPECIFICATIONS
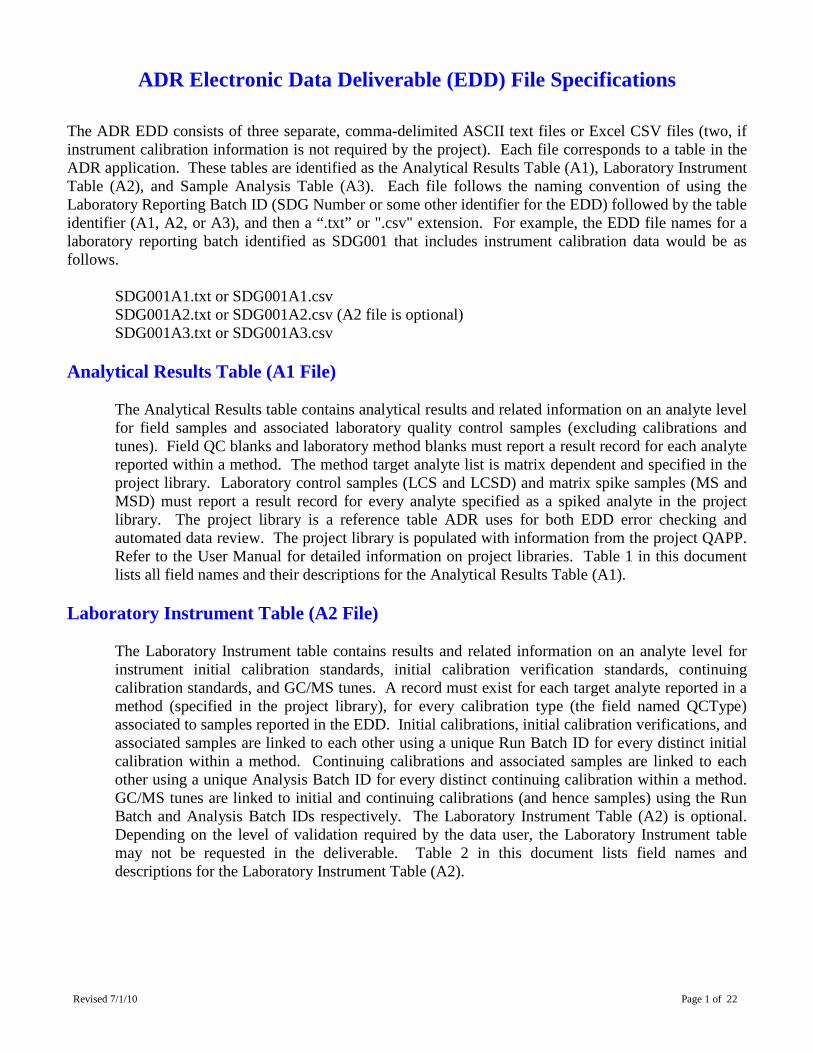
Revised 7/1/10 Page 1 of 22
ADR Electronic Data Deliverable (EDD) File Specifications The ADR EDD consists of three separate, comma-delimited ASCII text files or Excel CSV files (two, if instrument calibration information is not required by the project). Each file corresponds to a table in the ADR application. These tables are identified as the Analytical Results Table (A1), Laboratory Instrument Table (A2), and Sample Analysis Table (A3). Each file follows the naming convention of using the Laboratory Reporting Batch ID (SDG Number or some other identifier for the EDD) followed by the table identifier (A1, A2, or A3), and then a “.txt” or ".csv" extension. For example, the EDD file names for a laboratory reporting batch identified as SDG001 that includes instrument calibration data would be as follows.
SDG001A1.txt or SDG001A1.csv SDG001A2.txt or SDG001A2.csv (A2 file is optional) SDG001A3.txt or SDG001A3.csv
Analytical Results Table (A1 File)
The Analytical Results table contains analytical results and related information on an analyte level for field samples and associated laboratory quality control samples (excluding calibrations and tunes). Field QC blanks and laboratory method blanks must report a result record for each analyte reported within a method. The method target analyte list is matrix dependent and specified in the project library. Laboratory control samples (LCS and LCSD) and matrix spike samples (MS and MSD) must report a result record for every analyte specified as a spiked analyte in the project library. The project library is a reference table ADR uses for both EDD error checking and automated data review. The project library is populated with information from the project QAPP. Refer to the User Manual for detailed information on project libraries. Table 1 in this document lists all field names and their descriptions for the Analytical Results Table (A1).
Laboratory Instrument Table (A2 File)
The Laboratory Instrument table contains results and related information on an analyte level for instrument initial calibration standards, initial calibration verification standards, continuing calibration standards, and GC/MS tunes. A record must exist for each target analyte reported in a method (specified in the project library), for every calibration type (the field named QCType) associated to samples reported in the EDD. Initial calibrations, initial calibration verifications, and associated samples are linked to each other using a unique Run Batch ID for every distinct initial calibration within a method. Continuing calibrations and associated samples are linked to each other using a unique Analysis Batch ID for every distinct continuing calibration within a method. GC/MS tunes are linked to initial and continuing calibrations (and hence samples) using the Run Batch and Analysis Batch IDs respectively. The Laboratory Instrument Table (A2) is optional. Depending on the level of validation required by the data user, the Laboratory Instrument table may not be requested in the deliverable. Table 2 in this document lists field names and descriptions for the Laboratory Instrument Table (A2).
Revised 7/1/10 Page 2 of 22
Sample Analysis Table (A3 File)
The Sample Analysis table contains information on a sample level for field samples and laboratory quality control analyses (excluding calibrations and tunes). A sample record exists for each sample/method/matrix/analysis type combination. Table 3 in this document lists field names and descriptions for the Sample Analysis Table (A3).
EDD Field Properties
Tables 1, 2, and 3 in this document specify the EDD field properties for each file. These include the field name and sequence, field name description, data type and length for each field, and whether or not a particular field requires a standard field. Field elements in the EDD must be sequenced according to the order they appear in Tables 1, 2, and 3. For example, in the Analytical Result table (the A1 file), the field “ClientSampleID” will always be the first piece of information to start a new line of data (or database record), followed by the fields “LabAnalysisRefMethodID”, “AnalysisType”, and so on. Table 4 in this document lists standard values for those fields that hold standard values. Required field constraints depend on the combination of sample, matrix, method, analyte type, and calibration or QC type information reported in a record. Tables 5 through 9 in this document indicate required fields for each EDD file (table) according to the method category, matrix, analyte type, sample, and QC or calibration type reported in a record. When creating an EDD as a text file, use the ASCII character set in a file of lines terminated by a carriage return and line feed. No characters are allowed after the carriage return and line feed. Enclose each data set in double quotes (") and separate each field by a comma (comma delimited). Data fields with no information (null) may be represented by two consecutive commas. For example, in the Sample Analysis table, since the “Collected”, “ShippingBatchID”, and “Temperature” fields do not apply to laboratory generated QA/QC samples, the record for a Laboratory Control Sample by Method 8270C would be entered as follows. Note that the first two fields (“ProjectNumber” and “ProjectName”) are omitted in this example. …“LCSW100598”,,”AQ”,”LCSW100598”,”LCS”,,”8270C”,… (and so on) Do not pad fields with leading or trailing spaces if a field is populated with less than the maximum allowed number of characters. In the above example, although the “MatrixID” field can accommodate up to 10 characters, only 2 characters were entered in this field. The EDD can be constructed within Excel and saved as .csv file for import into the application. Be sure to format all cells as text beforehand, otherwise Excel will reformat entered values in some cases.
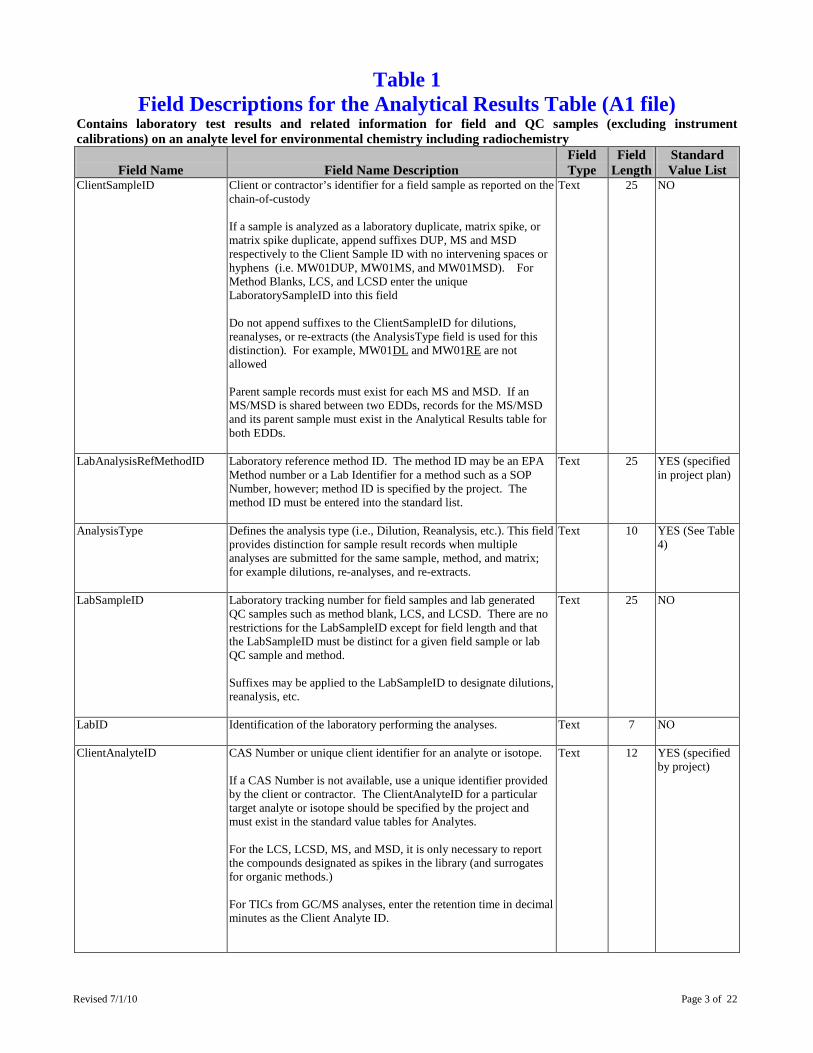
Revised 7/1/10 Page 3 of 22
Table 1 Field Descriptions for the Analytical Results Table (A1 file)
Contains laboratory test results and related information for field and QC samples (excluding instrument calibrations) on an analyte level for environmental chemistry including radiochemistry
Field Name
Field Name Description
Field Type
Field Length
Standard Value List
ClientSampleID Client or contractor’s identifier for a field sample as reported on the chain-of-custody If a sample is analyzed as a laboratory duplicate, matrix spike, or matrix spike duplicate, append suffixes DUP, MS and MSD respectively to the Client Sample ID with no intervening spaces or hyphens (i.e. MW01DUP, MW01MS, and MW01MSD). For Method Blanks, LCS, and LCSD enter the unique LaboratorySampleID into this field Do not append suffixes to the ClientSampleID for dilutions, reanalyses, or re-extracts (the AnalysisType field is used for this distinction). For example, MW01DL and MW01RE
are not allowed
Parent sample records must exist for each MS and MSD. If an MS/MSD is shared between two EDDs, records for the MS/MSD and its parent sample must exist in the Analytical Results table for both EDDs.
Text 25 NO
LabAnalysisRefMethodID Laboratory reference method ID. The method ID may be an EPA Method number or a Lab Identifier for a method such as a SOP Number, however; method ID is specified by the project. The method ID must be entered into the standard list.
Text 25 YES (specified in project plan)
AnalysisType Defines the analysis type (i.e., Dilution, Reanalysis, etc.). This field provides distinction for sample result records when multiple analyses are submitted for the same sample, method, and matrix; for example dilutions, re-analyses, and re-extracts.
Text 10 YES (See Table 4)
LabSampleID Laboratory tracking number for field samples and lab generated QC samples such as method blank, LCS, and LCSD. There are no restrictions for the LabSampleID except for field length and that the LabSampleID must be distinct for a given field sample or lab QC sample and method. Suffixes may be applied to the LabSampleID to designate dilutions, reanalysis, etc.
Text 25 NO
LabID Identification of the laboratory performing the analyses.
Text 7 NO
ClientAnalyteID CAS Number or unique client identifier for an analyte or isotope. If a CAS Number is not available, use a unique identifier provided by the client or contractor. The ClientAnalyteID for a particular target analyte or isotope should be specified by the project and must exist in the standard value tables for Analytes. For the LCS, LCSD, MS, and MSD, it is only necessary to report the compounds designated as spikes in the library (and surrogates for organic methods.) For TICs from GC/MS analyses, enter the retention time in decimal minutes as the Client Analyte ID.
Text 12 YES (specified by project)
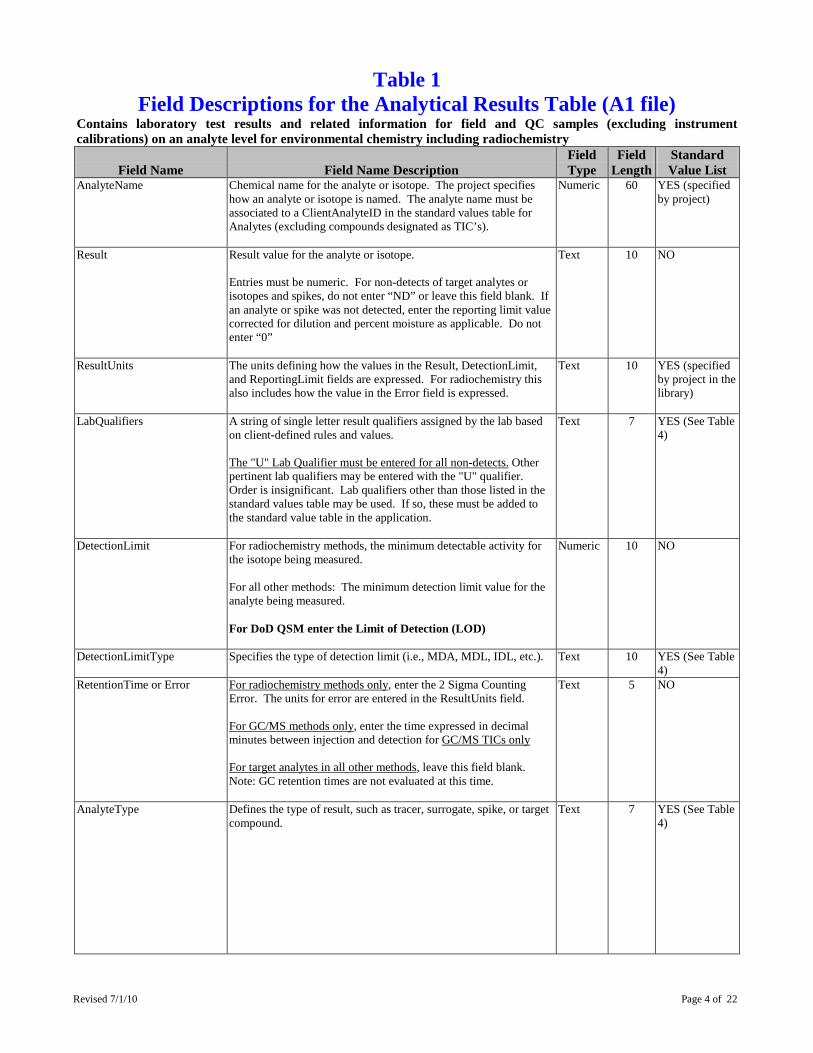
Revised 7/1/10 Page 4 of 22
Table 1 Field Descriptions for the Analytical Results Table (A1 file)
Contains laboratory test results and related information for field and QC samples (excluding instrument calibrations) on an analyte level for environmental chemistry including radiochemistry
Field Name
Field Name Description
Field Type
Field Length
Standard Value List
AnalyteName Chemical name for the analyte or isotope. The project specifies how an analyte or isotope is named. The analyte name must be associated to a ClientAnalyteID in the standard values table for Analytes (excluding compounds designated as TIC’s).
Numeric 60 YES (specified by project)
Result Result value for the analyte or isotope. Entries must be numeric. For non-detects of target analytes or isotopes and spikes, do not enter “ND” or leave this field blank. If an analyte or spike was not detected, enter the reporting limit value corrected for dilution and percent moisture as applicable. Do not enter “0”
Text 10 NO
ResultUnits The units defining how the values in the Result, DetectionLimit, and ReportingLimit fields are expressed. For radiochemistry this also includes how the value in the Error field is expressed.
Text 10 YES (specified by project in the library)
LabQualifiers A string of single letter result qualifiers assigned by the lab based on client-defined rules and values. The "U" Lab Qualifier must be entered for all non-detects.
Other pertinent lab qualifiers may be entered with the "U" qualifier. Order is insignificant. Lab qualifiers other than those listed in the standard values table may be used. If so, these must be added to the standard value table in the application.
Text 7 YES (See Table 4)
DetectionLimit For radiochemistry methods, the minimum detectable activity for the isotope being measured. For all other methods: The minimum detection limit value for the analyte being measured. For DoD QSM enter the Limit of Detection (LOD)
Numeric 10 NO
DetectionLimitType Specifies the type of detection limit (i.e., MDA, MDL, IDL, etc.).
Text 10 YES (See Table 4)
RetentionTime or Error For radiochemistry methods only
, enter the 2 Sigma Counting Error. The units for error are entered in the ResultUnits field.
For GC/MS methods only, enter the time expressed in decimal minutes between injection and detection for
GC/MS TICs only
For target analytes in all other methods
, leave this field blank. Note: GC retention times are not evaluated at this time.
Text 5 NO
AnalyteType Defines the type of result, such as tracer, surrogate, spike, or target compound.
Text 7 YES (See Table 4)
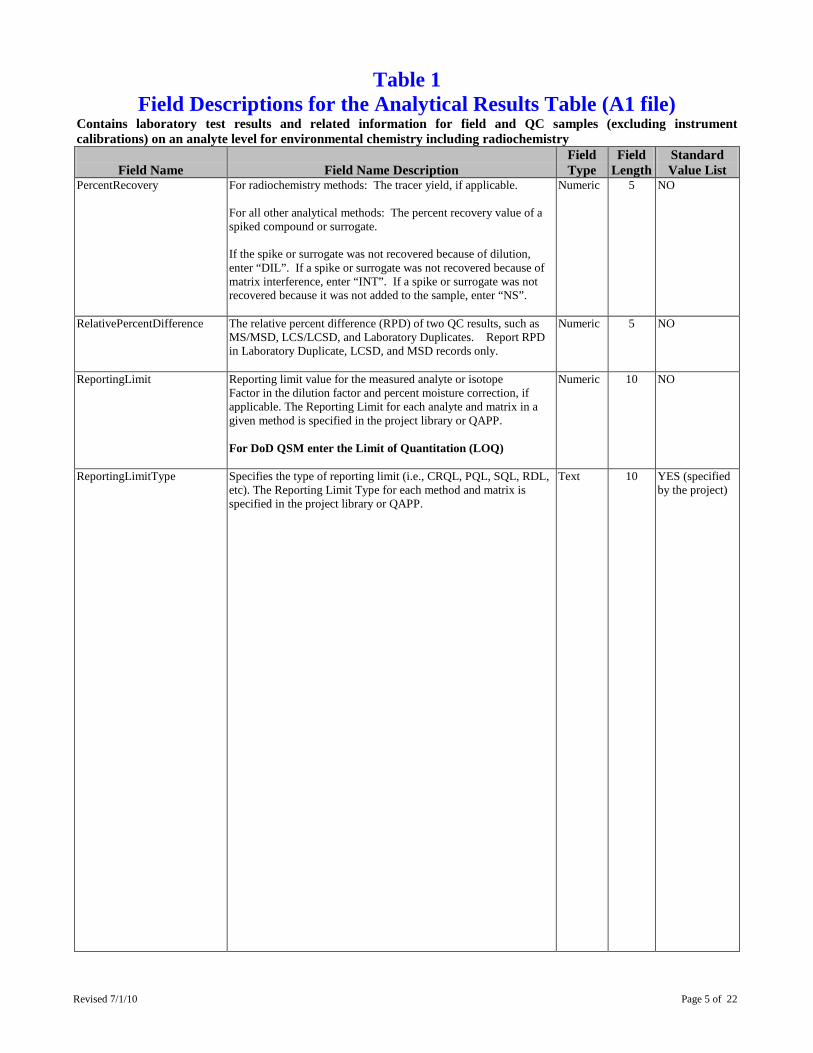
Revised 7/1/10 Page 5 of 22
Table 1 Field Descriptions for the Analytical Results Table (A1 file)
Contains laboratory test results and related information for field and QC samples (excluding instrument calibrations) on an analyte level for environmental chemistry including radiochemistry
Field Name
Field Name Description
Field Type
Field Length
Standard Value List
PercentRecovery For radiochemistry methods: The tracer yield, if applicable. For all other analytical methods: The percent recovery value of a spiked compound or surrogate. If the spike or surrogate was not recovered because of dilution, enter “DIL”. If a spike or surrogate was not recovered because of matrix interference, enter “INT”. If a spike or surrogate was not recovered because it was not added to the sample, enter “NS”.
Numeric 5 NO
RelativePercentDifference The relative percent difference (RPD) of two QC results, such as MS/MSD, LCS/LCSD, and Laboratory Duplicates. Report RPD in Laboratory Duplicate, LCSD, and MSD records only.
Numeric 5 NO
ReportingLimit Reporting limit value for the measured analyte or isotope Factor in the dilution factor and percent moisture correction, if applicable. The Reporting Limit for each analyte and matrix in a given method is specified in the project library or QAPP. For DoD QSM enter the Limit of Quantitation (LOQ)
Numeric 10 NO
ReportingLimitType Specifies the type of reporting limit (i.e., CRQL, PQL, SQL, RDL, etc). The Reporting Limit Type for each method and matrix is specified in the project library or QAPP.
Text 10 YES (specified by the project)
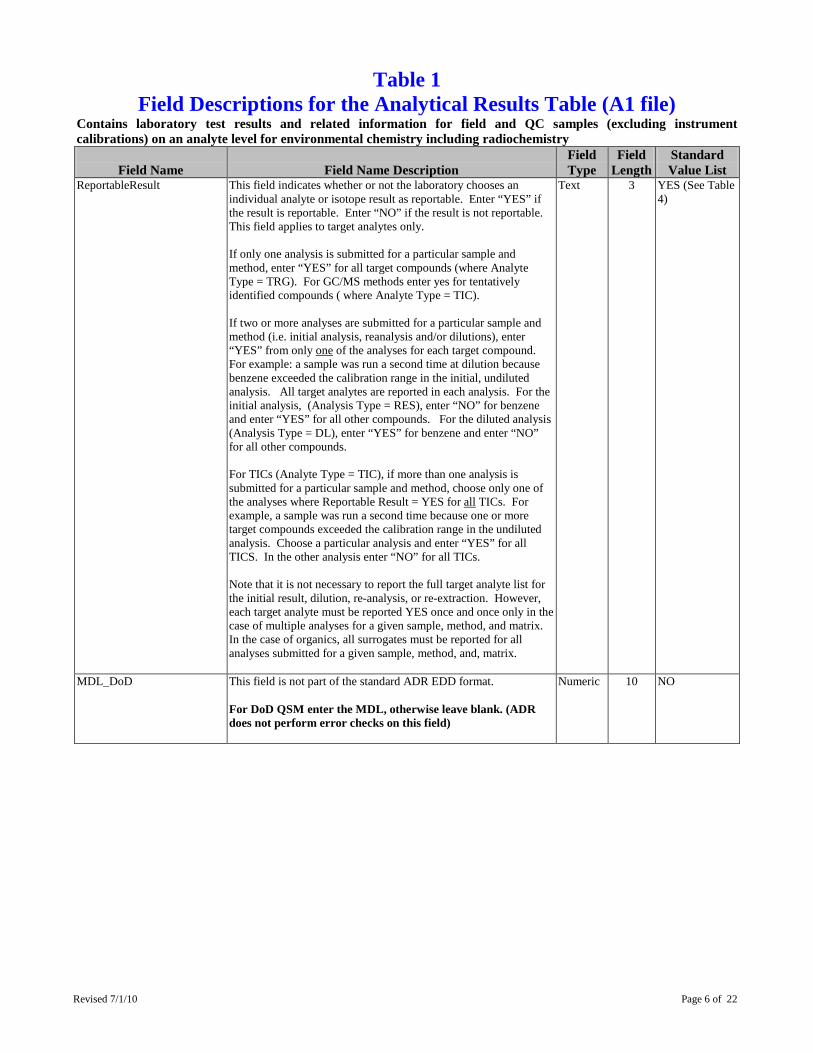
Revised 7/1/10 Page 6 of 22
Table 1 Field Descriptions for the Analytical Results Table (A1 file)
Contains laboratory test results and related information for field and QC samples (excluding instrument calibrations) on an analyte level for environmental chemistry including radiochemistry
Field Name
Field Name Description
Field Type
Field Length
Standard Value List
ReportableResult This field indicates whether or not the laboratory chooses an individual analyte or isotope result as reportable. Enter “YES” if the result is reportable. Enter “NO” if the result is not reportable. This field applies to target analytes only. If only one analysis is submitted for a particular sample and method, enter “YES” for all target compounds (where Analyte Type = TRG). For GC/MS methods enter yes for tentatively identified compounds ( where Analyte Type = TIC). If two or more analyses are submitted for a particular sample and method (i.e. initial analysis, reanalysis and/or dilutions), enter “YES” from only one
of the analyses for each target compound. For example: a sample was run a second time at dilution because benzene exceeded the calibration range in the initial, undiluted analysis. All target analytes are reported in each analysis. For the initial analysis, (Analysis Type = RES), enter “NO” for benzene and enter “YES” for all other compounds. For the diluted analysis (Analysis Type = DL), enter “YES” for benzene and enter “NO” for all other compounds.
For TICs (Analyte Type = TIC), if more than one analysis is submitted for a particular sample and method, choose only one of the analyses where Reportable Result = YES for all
TICs. For example, a sample was run a second time because one or more target compounds exceeded the calibration range in the undiluted analysis. Choose a particular analysis and enter “YES” for all TICS. In the other analysis enter “NO” for all TICs.
Note that it is not necessary to report the full target analyte list for the initial result, dilution, re-analysis, or re-extraction. However, each target analyte must be reported YES once and once only in the case of multiple analyses for a given sample, method, and matrix. In the case of organics, all surrogates must be reported for all analyses submitted for a given sample, method, and, matrix.
Text 3 YES (See Table 4)
MDL_DoD This field is not part of the standard ADR EDD format. For DoD QSM enter the MDL, otherwise leave blank. (ADR does not perform error checks on this field)
Numeric 10 NO
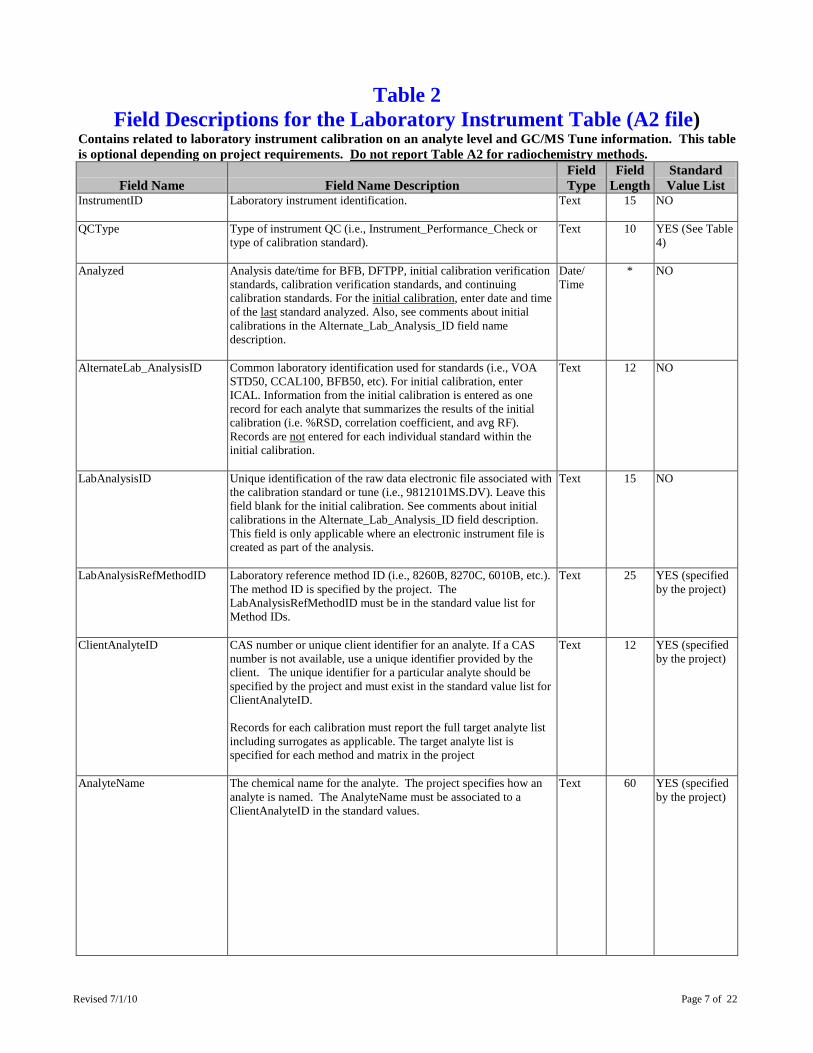
Revised 7/1/10 Page 7 of 22
Table 2 Field Descriptions for the Laboratory Instrument Table (A2 file)
Contains related to laboratory instrument calibration on an analyte level and GC/MS Tune information. This table is optional depending on project requirements. Do not report Table A2 for radiochemistry methods.
Field Name Field Name Description Field Type
Field Length
Standard Value List
InstrumentID Laboratory instrument identification.
Text 15 NO
QCType Type of instrument QC (i.e., Instrument_Performance_Check or type of calibration standard).
Text 10 YES (See Table 4)
Analyzed Analysis date/time for BFB, DFTPP, initial calibration verification standards, calibration verification standards, and continuing calibration standards. For the initial calibration, enter date and time of the last
standard analyzed. Also, see comments about initial calibrations in the Alternate_Lab_Analysis_ID field name description.
Date/ Time
* NO
AlternateLab_AnalysisID Common laboratory identification used for standards (i.e., VOA STD50, CCAL100, BFB50, etc). For initial calibration, enter ICAL. Information from the initial calibration is entered as one record for each analyte that summarizes the results of the initial calibration (i.e. %RSD, correlation coefficient, and avg RF). Records are not
entered for each individual standard within the initial calibration.
Text 12 NO
LabAnalysisID Unique identification of the raw data electronic file associated with the calibration standard or tune (i.e., 9812101MS.DV). Leave this field blank for the initial calibration. See comments about initial calibrations in the Alternate_Lab_Analysis_ID field description. This field is only applicable where an electronic instrument file is created as part of the analysis.
Text 15 NO
LabAnalysisRefMethodID Laboratory reference method ID (i.e., 8260B, 8270C, 6010B, etc.). The method ID is specified by the project. The LabAnalysisRefMethodID must be in the standard value list for Method IDs.
Text 25 YES (specified by the project)
ClientAnalyteID CAS number or unique client identifier for an analyte. If a CAS number is not available, use a unique identifier provided by the client. The unique identifier for a particular analyte should be specified by the project and must exist in the standard value list for ClientAnalyteID. Records for each calibration must report the full target analyte list including surrogates as applicable. The target analyte list is specified for each method and matrix in the project
Text 12 YES (specified by the project)
AnalyteName The chemical name for the analyte. The project specifies how an analyte is named. The AnalyteName must be associated to a ClientAnalyteID in the standard values.
Text 60 YES (specified by the project)
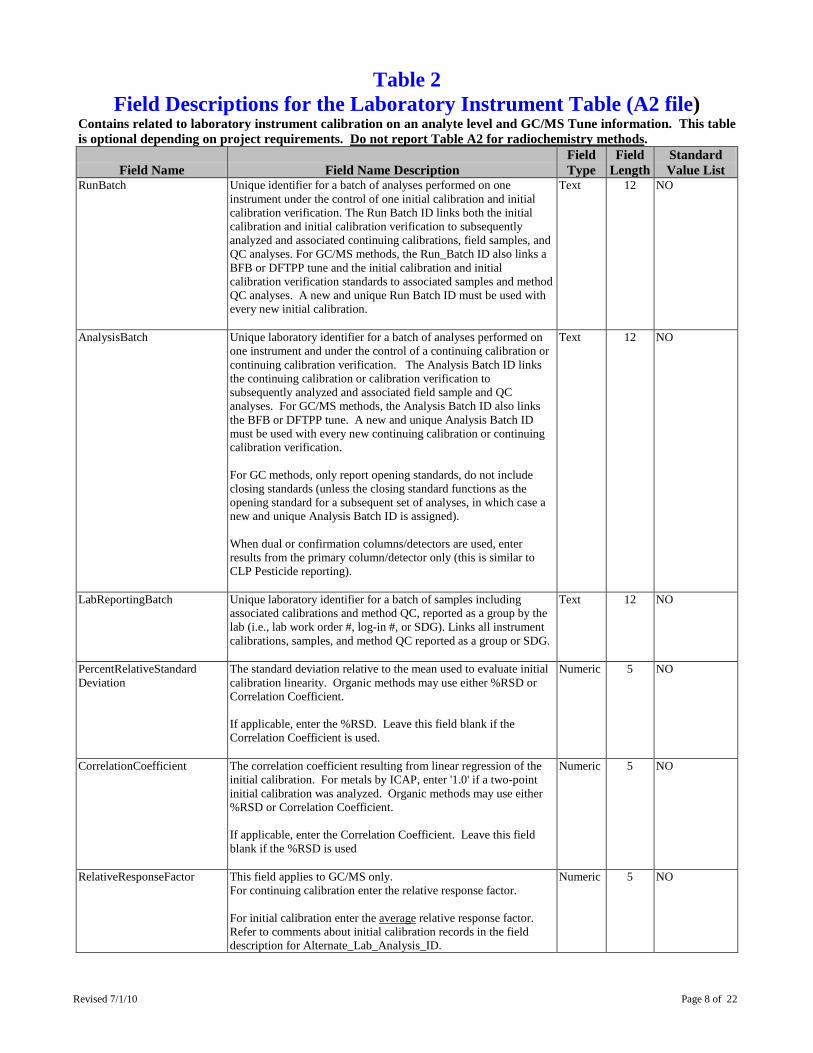
Revised 7/1/10 Page 8 of 22
Table 2 Field Descriptions for the Laboratory Instrument Table (A2 file)
Contains related to laboratory instrument calibration on an analyte level and GC/MS Tune information. This table is optional depending on project requirements. Do not report Table A2 for radiochemistry methods.
Field Name Field Name Description Field Type
Field Length
Standard Value List
RunBatch Unique identifier for a batch of analyses performed on one instrument under the control of one initial calibration and initial calibration verification. The Run Batch ID links both the initial calibration and initial calibration verification to subsequently analyzed and associated continuing calibrations, field samples, and QC analyses. For GC/MS methods, the Run_Batch ID also links a BFB or DFTPP tune and the initial calibration and initial calibration verification standards to associated samples and method QC analyses. A new and unique Run Batch ID must be used with every new initial calibration.
Text 12 NO
AnalysisBatch Unique laboratory identifier for a batch of analyses performed on one instrument and under the control of a continuing calibration or continuing calibration verification. The Analysis Batch ID links the continuing calibration or calibration verification to subsequently analyzed and associated field sample and QC analyses. For GC/MS methods, the Analysis Batch ID also links the BFB or DFTPP tune. A new and unique Analysis Batch ID must be used with every new continuing calibration or continuing calibration verification. For GC methods, only report opening standards, do not include closing standards (unless the closing standard functions as the opening standard for a subsequent set of analyses, in which case a new and unique Analysis Batch ID is assigned). When dual or confirmation columns/detectors are used, enter results from the primary column/detector only (this is similar to CLP Pesticide reporting).
Text 12 NO
LabReportingBatch Unique laboratory identifier for a batch of samples including associated calibrations and method QC, reported as a group by the lab (i.e., lab work order #, log-in #, or SDG). Links all instrument calibrations, samples, and method QC reported as a group or SDG.
Text 12 NO
PercentRelativeStandard Deviation
The standard deviation relative to the mean used to evaluate initial calibration linearity. Organic methods may use either %RSD or Correlation Coefficient. If applicable, enter the %RSD. Leave this field blank if the Correlation Coefficient is used.
Numeric 5 NO
CorrelationCoefficient The correlation coefficient resulting from linear regression of the initial calibration. For metals by ICAP, enter '1.0' if a two-point initial calibration was analyzed. Organic methods may use either %RSD or Correlation Coefficient. If applicable, enter the Correlation Coefficient. Leave this field blank if the %RSD is used
Numeric 5 NO
RelativeResponseFactor This field applies to GC/MS only. For continuing calibration enter the relative response factor. For initial calibration enter the average
Numeric
relative response factor. Refer to comments about initial calibration records in the field description for Alternate_Lab_Analysis_ID.
5 NO
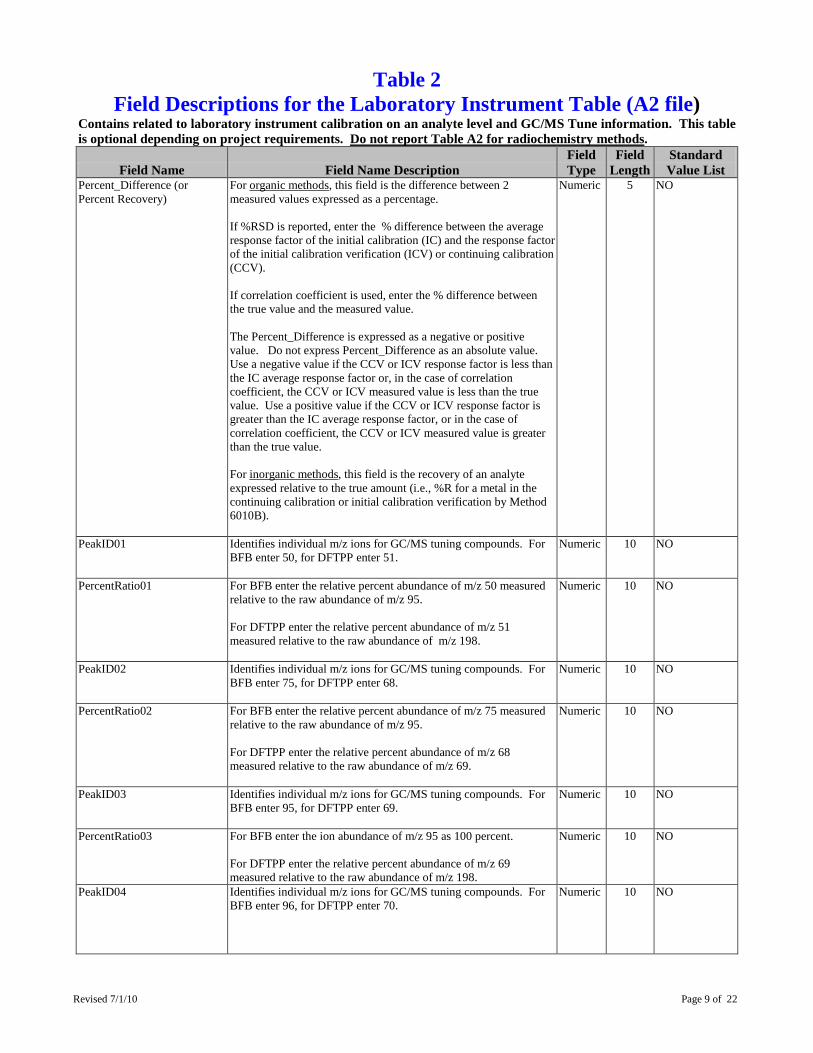
Revised 7/1/10 Page 9 of 22
Table 2 Field Descriptions for the Laboratory Instrument Table (A2 file)
Contains related to laboratory instrument calibration on an analyte level and GC/MS Tune information. This table is optional depending on project requirements. Do not report Table A2 for radiochemistry methods.
Field Name Field Name Description Field Type
Field Length
Standard Value List
Percent_Difference (or Percent Recovery)
For organic methods
, this field is the difference between 2 measured values expressed as a percentage.
If %RSD is reported, enter the % difference between the average response factor of the initial calibration (IC) and the response factor of the initial calibration verification (ICV) or continuing calibration (CCV). If correlation coefficient is used, enter the % difference between the true value and the measured value. The Percent_Difference is expressed as a negative or positive value. Do not express Percent_Difference as an absolute value. Use a negative value if the CCV or ICV response factor is less than the IC average response factor or, in the case of correlation coefficient, the CCV or ICV measured value is less than the true value. Use a positive value if the CCV or ICV response factor is greater than the IC average response factor, or in the case of correlation coefficient, the CCV or ICV measured value is greater than the true value. For inorganic methods
, this field is the recovery of an analyte expressed relative to the true amount (i.e., %R for a metal in the continuing calibration or initial calibration verification by Method 6010B).
Numeric 5 NO
PeakID01 Identifies individual m/z ions for GC/MS tuning compounds. For BFB enter 50, for DFTPP enter 51.
Numeric 10 NO
PercentRatio01 For BFB enter the relative percent abundance of m/z 50 measured relative to the raw abundance of m/z 95. For DFTPP enter the relative percent abundance of m/z 51 measured relative to the raw abundance of m/z 198.
Numeric 10 NO
PeakID02 Identifies individual m/z ions for GC/MS tuning compounds. For BFB enter 75, for DFTPP enter 68.
Numeric 10 NO
PercentRatio02 For BFB enter the relative percent abundance of m/z 75 measured relative to the raw abundance of m/z 95. For DFTPP enter the relative percent abundance of m/z 68 measured relative to the raw abundance of m/z 69.
Numeric 10 NO
PeakID03 Identifies individual m/z ions for GC/MS tuning compounds. For BFB enter 95, for DFTPP enter 69.
Numeric 10 NO
PercentRatio03 For BFB enter the ion abundance of m/z 95 as 100 percent. For DFTPP enter the relative percent abundance of m/z 69 measured relative to the raw abundance of m/z 198.
Numeric 10 NO
PeakID04 Identifies individual m/z ions for GC/MS tuning compounds. For BFB enter 96, for DFTPP enter 70.
Numeric 10 NO
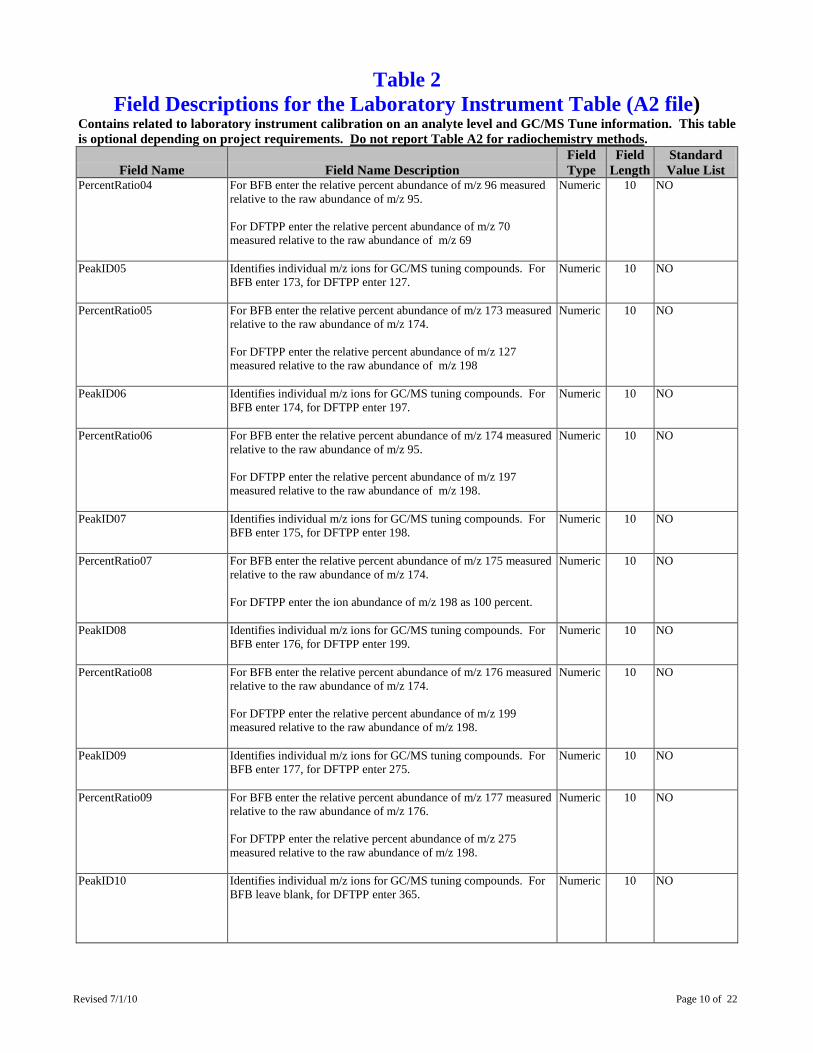
Revised 7/1/10 Page 10 of 22
Table 2 Field Descriptions for the Laboratory Instrument Table (A2 file)
Contains related to laboratory instrument calibration on an analyte level and GC/MS Tune information. This table is optional depending on project requirements. Do not report Table A2 for radiochemistry methods.
Field Name Field Name Description Field Type
Field Length
Standard Value List
PercentRatio04 For BFB enter the relative percent abundance of m/z 96 measured relative to the raw abundance of m/z 95. For DFTPP enter the relative percent abundance of m/z 70 measured relative to the raw abundance of m/z 69
Numeric 10 NO
PeakID05 Identifies individual m/z ions for GC/MS tuning compounds. For BFB enter 173, for DFTPP enter 127.
Numeric 10 NO
PercentRatio05 For BFB enter the relative percent abundance of m/z 173 measured relative to the raw abundance of m/z 174. For DFTPP enter the relative percent abundance of m/z 127 measured relative to the raw abundance of m/z 198
Numeric 10 NO
PeakID06 Identifies individual m/z ions for GC/MS tuning compounds. For BFB enter 174, for DFTPP enter 197.
Numeric 10 NO
PercentRatio06 For BFB enter the relative percent abundance of m/z 174 measured relative to the raw abundance of m/z 95. For DFTPP enter the relative percent abundance of m/z 197 measured relative to the raw abundance of m/z 198.
Numeric 10 NO
PeakID07 Identifies individual m/z ions for GC/MS tuning compounds. For BFB enter 175, for DFTPP enter 198.
Numeric 10 NO
PercentRatio07 For BFB enter the relative percent abundance of m/z 175 measured relative to the raw abundance of m/z 174. For DFTPP enter the ion abundance of m/z 198 as 100 percent.
Numeric 10 NO
PeakID08 Identifies individual m/z ions for GC/MS tuning compounds. For BFB enter 176, for DFTPP enter 199.
Numeric 10 NO
PercentRatio08 For BFB enter the relative percent abundance of m/z 176 measured relative to the raw abundance of m/z 174. For DFTPP enter the relative percent abundance of m/z 199 measured relative to the raw abundance of m/z 198.
Numeric 10 NO
PeakID09 Identifies individual m/z ions for GC/MS tuning compounds. For BFB enter 177, for DFTPP enter 275.
Numeric 10 NO
PercentRatio09 For BFB enter the relative percent abundance of m/z 177 measured relative to the raw abundance of m/z 176. For DFTPP enter the relative percent abundance of m/z 275 measured relative to the raw abundance of m/z 198.
Numeric 10 NO
PeakID10 Identifies individual m/z ions for GC/MS tuning compounds. For BFB leave blank, for DFTPP enter 365.
Numeric 10 NO
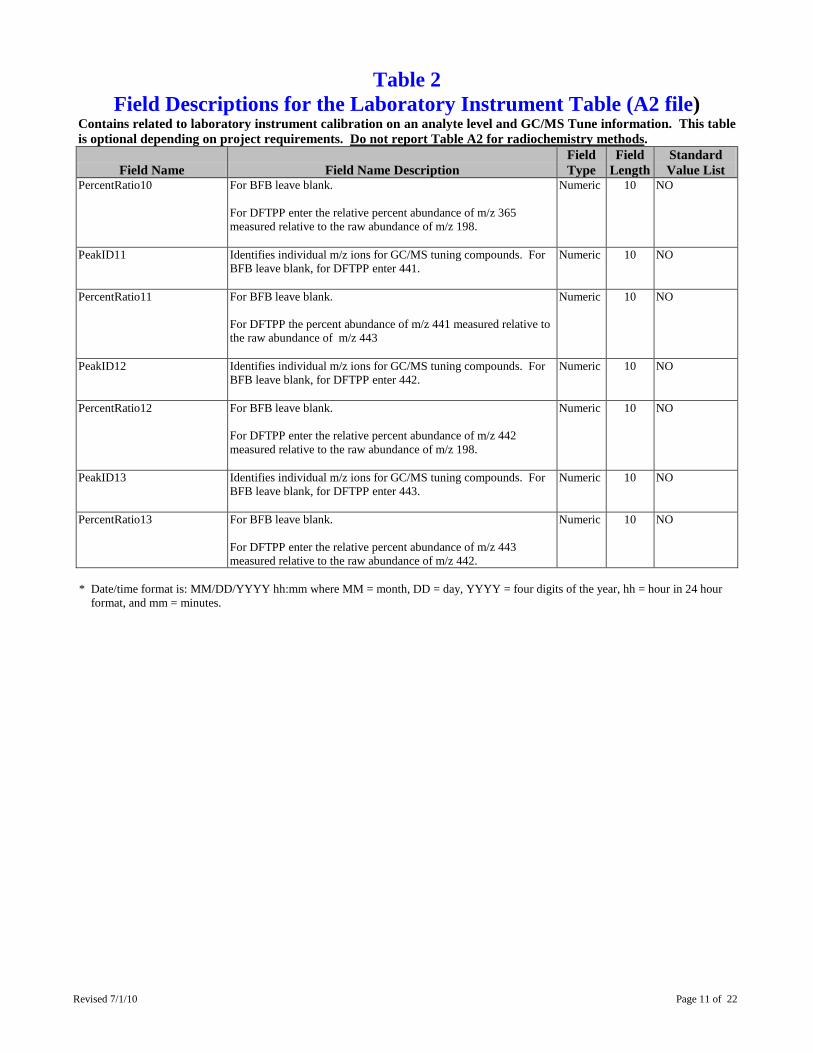
Revised 7/1/10 Page 11 of 22
Table 2 Field Descriptions for the Laboratory Instrument Table (A2 file)
Contains related to laboratory instrument calibration on an analyte level and GC/MS Tune information. This table is optional depending on project requirements. Do not report Table A2 for radiochemistry methods.
Field Name Field Name Description Field Type
Field Length
Standard Value List
PercentRatio10 For BFB leave blank. For DFTPP enter the relative percent abundance of m/z 365 measured relative to the raw abundance of m/z 198.
Numeric 10 NO
PeakID11 Identifies individual m/z ions for GC/MS tuning compounds. For BFB leave blank, for DFTPP enter 441.
Numeric 10 NO
PercentRatio11 For BFB leave blank. For DFTPP the percent abundance of m/z 441 measured relative to the raw abundance of m/z 443
Numeric 10 NO
PeakID12 Identifies individual m/z ions for GC/MS tuning compounds. For BFB leave blank, for DFTPP enter 442.
Numeric 10 NO
PercentRatio12 For BFB leave blank. For DFTPP enter the relative percent abundance of m/z 442 measured relative to the raw abundance of m/z 198.
Numeric 10 NO
PeakID13 Identifies individual m/z ions for GC/MS tuning compounds. For BFB leave blank, for DFTPP enter 443.
Numeric 10 NO
PercentRatio13 For BFB leave blank. For DFTPP enter the relative percent abundance of m/z 443 measured relative to the raw abundance of m/z 442.
Numeric 10 NO
* Date/time format is: MM/DD/YYYY hh:mm where MM = month, DD = day, YYYY = four digits of the year, hh = hour in 24 hour
format, and mm = minutes.
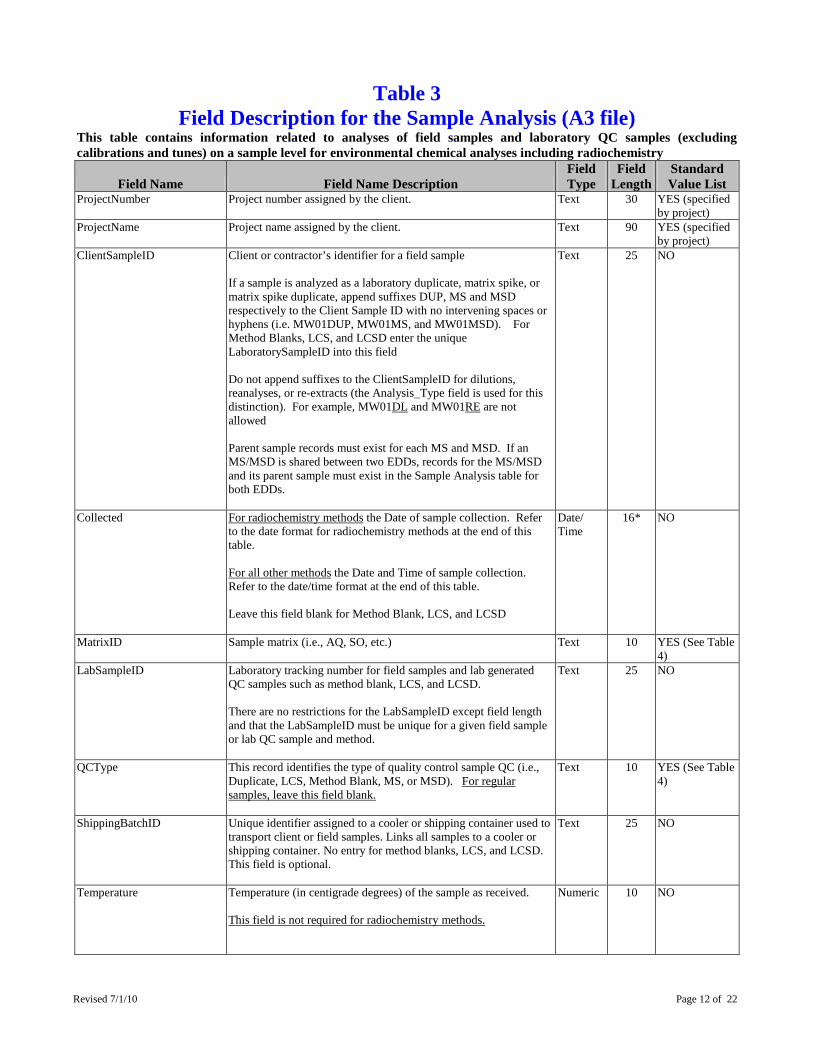
Revised 7/1/10 Page 12 of 22
Table 3 Field Description for the Sample Analysis (A3 file)
This table contains information related to analyses of field samples and laboratory QC samples (excluding calibrations and tunes) on a sample level for environmental chemical analyses including radiochemistry
Field Name Field Name Description Field Type
Field Length
Standard Value List
ProjectNumber
Project number assigned by the client. Text 30 YES (specified by project)
ProjectName
Project name assigned by the client. Text 90 YES (specified by project)
ClientSampleID Client or contractor’s identifier for a field sample If a sample is analyzed as a laboratory duplicate, matrix spike, or matrix spike duplicate, append suffixes DUP, MS and MSD respectively to the Client Sample ID with no intervening spaces or hyphens (i.e. MW01DUP, MW01MS, and MW01MSD). For Method Blanks, LCS, and LCSD enter the unique LaboratorySampleID into this field Do not append suffixes to the ClientSampleID for dilutions, reanalyses, or re-extracts (the Analysis_Type field is used for this distinction). For example, MW01DL and MW01RE
are not allowed
Parent sample records must exist for each MS and MSD. If an MS/MSD is shared between two EDDs, records for the MS/MSD and its parent sample must exist in the Sample Analysis table for both EDDs.
Text 25 NO
Collected For radiochemistry methods
the Date of sample collection. Refer to the date format for radiochemistry methods at the end of this table.
For all other methods
the Date and Time of sample collection. Refer to the date/time format at the end of this table.
Leave this field blank for Method Blank, LCS, and LCSD
Date/ Time
16* NO
MatrixID Sample matrix (i.e., AQ, SO, etc.)
Text 10 YES (See Table 4)
LabSampleID Laboratory tracking number for field samples and lab generated QC samples such as method blank, LCS, and LCSD. There are no restrictions for the LabSampleID except field length and that the LabSampleID must be unique for a given field sample or lab QC sample and method.
Text 25 NO
QCType This record identifies the type of quality control sample QC (i.e., Duplicate, LCS, Method Blank, MS, or MSD).
For regular samples, leave this field blank.
Text 10 YES (See Table 4)
ShippingBatchID Unique identifier assigned to a cooler or shipping container used to transport client or field samples. Links all samples to a cooler or shipping container. No entry for method blanks, LCS, and LCSD. This field is optional.
Text 25 NO
Temperature Temperature (in centigrade degrees) of the sample as received.
This field is not required for radiochemistry methods.
Numeric 10 NO
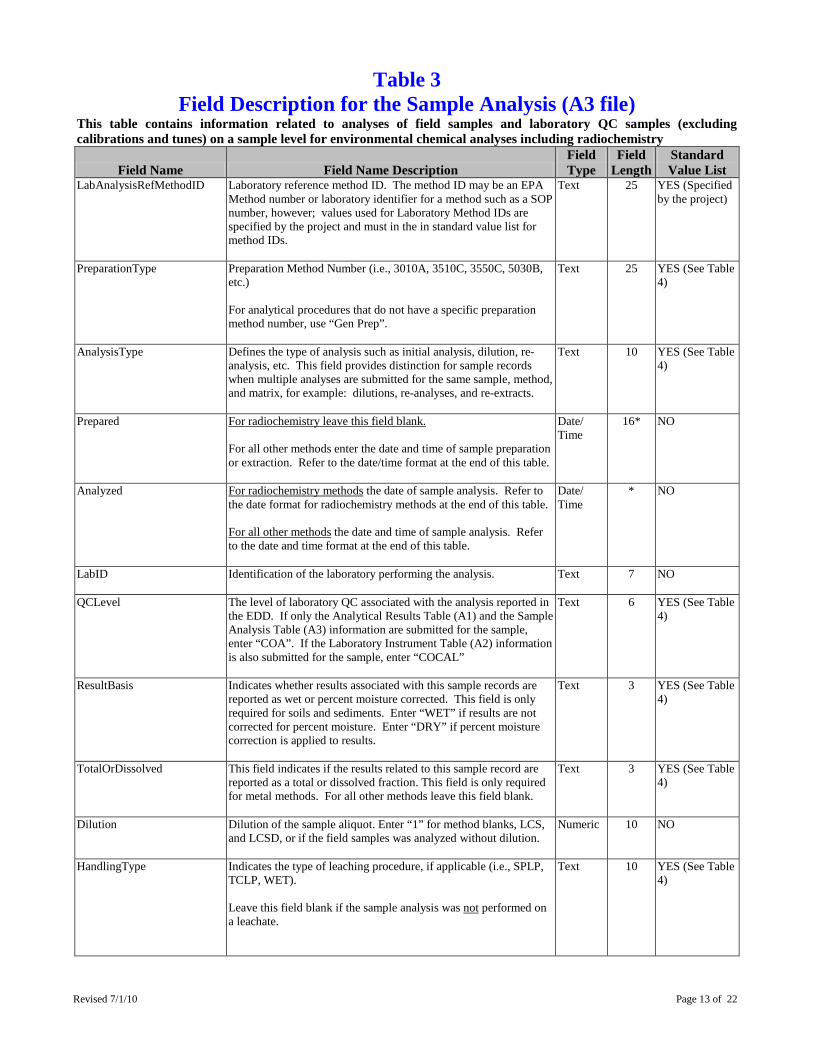
Revised 7/1/10 Page 13 of 22
Table 3 Field Description for the Sample Analysis (A3 file)
This table contains information related to analyses of field samples and laboratory QC samples (excluding calibrations and tunes) on a sample level for environmental chemical analyses including radiochemistry
Field Name Field Name Description Field Type
Field Length
Standard Value List
LabAnalysisRefMethodID Laboratory reference method ID. The method ID may be an EPA Method number or laboratory identifier for a method such as a SOP number, however; values used for Laboratory Method IDs are specified by the project and must in the in standard value list for method IDs.
Text 25 YES (Specified by the project)
PreparationType Preparation Method Number (i.e., 3010A, 3510C, 3550C, 5030B, etc.) For analytical procedures that do not have a specific preparation method number, use “Gen Prep”.
Text 25 YES (See Table 4)
AnalysisType Defines the type of analysis such as initial analysis, dilution, re-analysis, etc. This field provides distinction for sample records when multiple analyses are submitted for the same sample, method, and matrix, for example: dilutions, re-analyses, and re-extracts.
Text 10 YES (See Table 4)
Prepared For radiochemistry leave this field blank.
For all other methods enter the date and time of sample preparation or extraction. Refer to the date/time format at the end of this table.
Date/ Time
16* NO
Analyzed For radiochemistry methods
the date of sample analysis. Refer to the date format for radiochemistry methods at the end of this table.
For all other methods
the date and time of sample analysis. Refer to the date and time format at the end of this table.
Date/ Time
* NO
LabID Identification of the laboratory performing the analysis.
Text 7
NO
QCLevel The level of laboratory QC associated with the analysis reported in the EDD. If only the Analytical Results Table (A1) and the Sample Analysis Table (A3) information are submitted for the sample, enter “COA”. If the Laboratory Instrument Table (A2) information is also submitted for the sample, enter “COCAL”
Text 6 YES (See Table 4)
ResultBasis Indicates whether results associated with this sample records are reported as wet or percent moisture corrected. This field is only required for soils and sediments. Enter “WET” if results are not corrected for percent moisture. Enter “DRY” if percent moisture correction is applied to results.
Text 3 YES (See Table 4)
TotalOrDissolved This field indicates if the results related to this sample record are reported as a total or dissolved fraction. This field is only required for metal methods. For all other methods leave this field blank.
Text 3 YES (See Table 4)
Dilution Dilution of the sample aliquot. Enter “1” for method blanks, LCS, and LCSD, or if the field samples was analyzed without dilution.
Numeric 10 NO
HandlingType Indicates the type of leaching procedure, if applicable (i.e., SPLP, TCLP, WET). Leave this field blank if the sample analysis was not
performed on a leachate.
Text 10 YES (See Table 4)
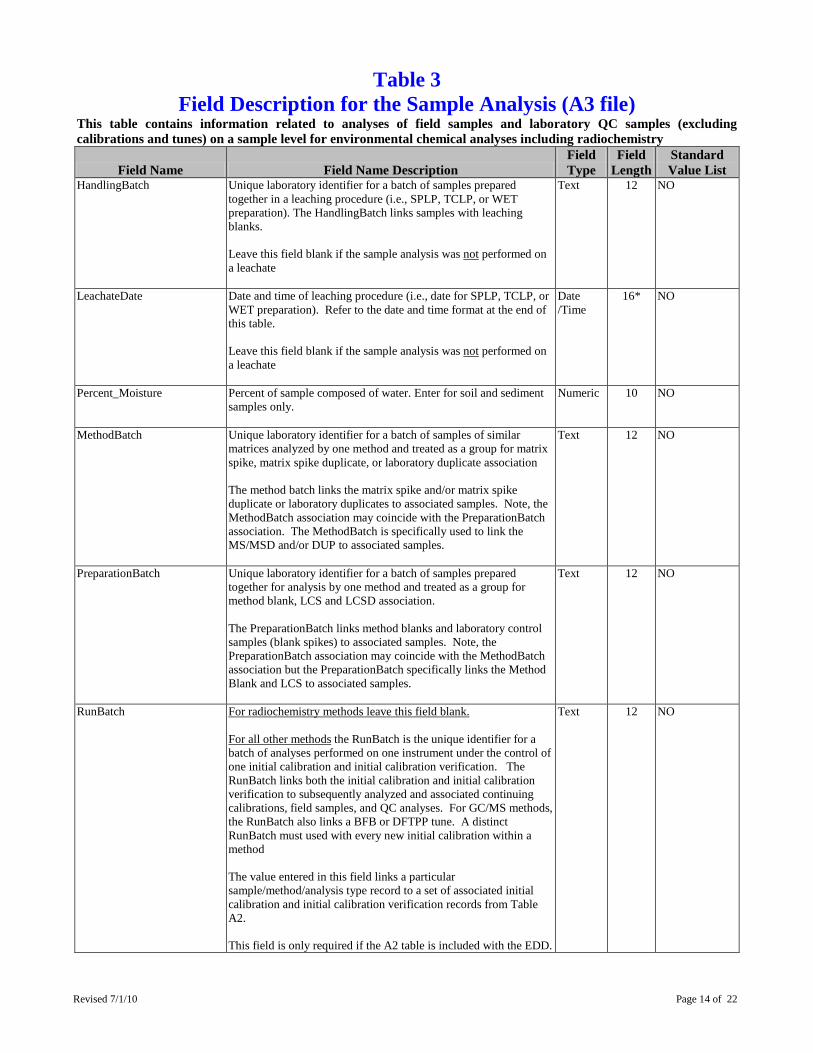
Revised 7/1/10 Page 14 of 22
Table 3 Field Description for the Sample Analysis (A3 file)
This table contains information related to analyses of field samples and laboratory QC samples (excluding calibrations and tunes) on a sample level for environmental chemical analyses including radiochemistry
Field Name Field Name Description Field Type
Field Length
Standard Value List
HandlingBatch Unique laboratory identifier for a batch of samples prepared together in a leaching procedure (i.e., SPLP, TCLP, or WET preparation). The HandlingBatch links samples with leaching blanks. Leave this field blank if the sample analysis was not
performed on a leachate
Text 12 NO
LeachateDate Date and time of leaching procedure (i.e., date for SPLP, TCLP, or WET preparation). Refer to the date and time format at the end of this table. Leave this field blank if the sample analysis was not
performed on a leachate
Date /Time
16* NO
Percent_Moisture Percent of sample composed of water. Enter for soil and sediment samples only.
Numeric 10 NO
MethodBatch Unique laboratory identifier for a batch of samples of similar matrices analyzed by one method and treated as a group for matrix spike, matrix spike duplicate, or laboratory duplicate association The method batch links the matrix spike and/or matrix spike duplicate or laboratory duplicates to associated samples. Note, the MethodBatch association may coincide with the PreparationBatch association. The MethodBatch is specifically used to link the MS/MSD and/or DUP to associated samples.
Text 12 NO
PreparationBatch Unique laboratory identifier for a batch of samples prepared together for analysis by one method and treated as a group for method blank, LCS and LCSD association. The PreparationBatch links method blanks and laboratory control samples (blank spikes) to associated samples. Note, the PreparationBatch association may coincide with the MethodBatch association but the PreparationBatch specifically links the Method Blank and LCS to associated samples.
Text 12 NO
RunBatch For radiochemistry methods leave this field blank.
For all other methods
the RunBatch is the unique identifier for a batch of analyses performed on one instrument under the control of one initial calibration and initial calibration verification. The RunBatch links both the initial calibration and initial calibration verification to subsequently analyzed and associated continuing calibrations, field samples, and QC analyses. For GC/MS methods, the RunBatch also links a BFB or DFTPP tune. A distinct RunBatch must used with every new initial calibration within a method
The value entered in this field links a particular sample/method/analysis type record to a set of associated initial calibration and initial calibration verification records from Table A2. This field is only required if the A2 table is included with the EDD.
Text 12 NO
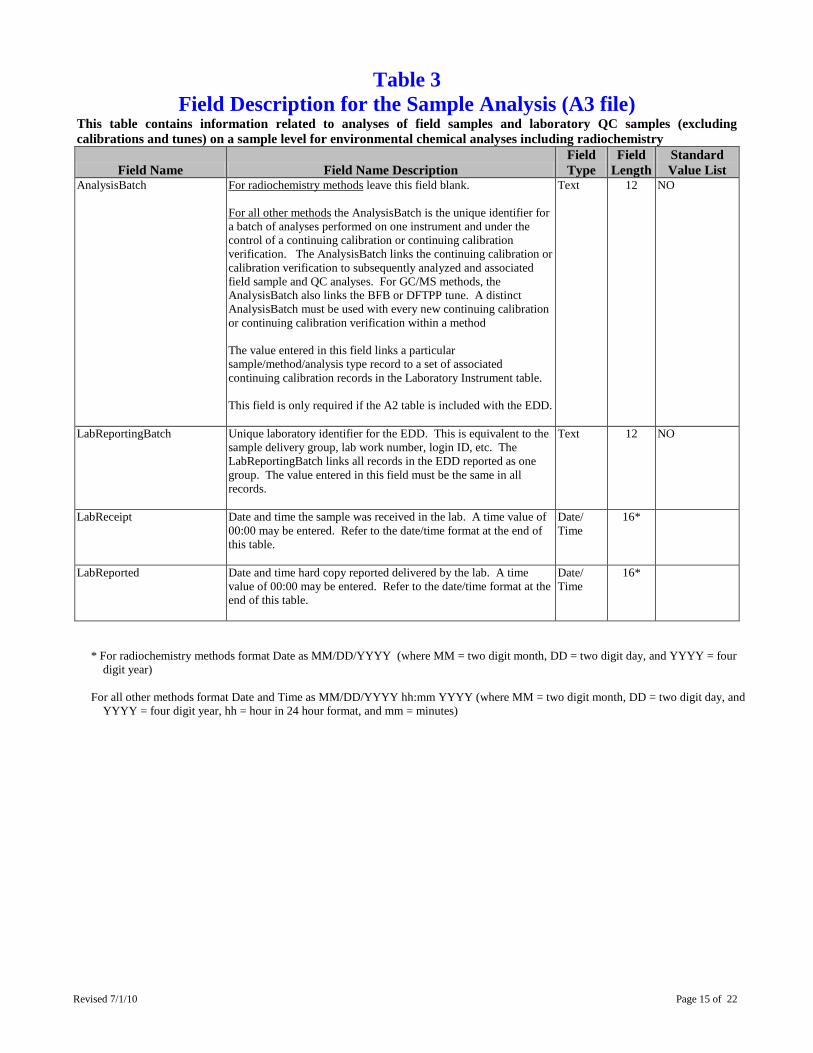
Revised 7/1/10 Page 15 of 22
Table 3 Field Description for the Sample Analysis (A3 file)
This table contains information related to analyses of field samples and laboratory QC samples (excluding calibrations and tunes) on a sample level for environmental chemical analyses including radiochemistry
Field Name Field Name Description Field Type
Field Length
Standard Value List
AnalysisBatch For radiochemistry methods
leave this field blank.
For all other methods
the AnalysisBatch is the unique identifier for a batch of analyses performed on one instrument and under the control of a continuing calibration or continuing calibration verification. The AnalysisBatch links the continuing calibration or calibration verification to subsequently analyzed and associated field sample and QC analyses. For GC/MS methods, the AnalysisBatch also links the BFB or DFTPP tune. A distinct AnalysisBatch must be used with every new continuing calibration or continuing calibration verification within a method
The value entered in this field links a particular sample/method/analysis type record to a set of associated continuing calibration records in the Laboratory Instrument table. This field is only required if the A2 table is included with the EDD.
Text 12 NO
LabReportingBatch Unique laboratory identifier for the EDD. This is equivalent to the sample delivery group, lab work number, login ID, etc. The LabReportingBatch links all records in the EDD reported as one group. The value entered in this field must be the same in all records.
Text 12 NO
LabReceipt Date and time the sample was received in the lab. A time value of 00:00 may be entered. Refer to the date/time format at the end of this table.
Date/ Time
16*
LabReported Date and time hard copy reported delivered by the lab. A time value of 00:00 may be entered. Refer to the date/time format at the end of this table.
Date/ Time
16*
* For radiochemistry methods format Date as MM/DD/YYYY (where MM = two digit month, DD = two digit day, and YYYY = four digit year)
For all other methods format Date and Time as MM/DD/YYYY hh:mm YYYY (where MM = two digit month, DD = two digit day, and
YYYY = four digit year, hh = hour in 24 hour format, and mm = minutes)
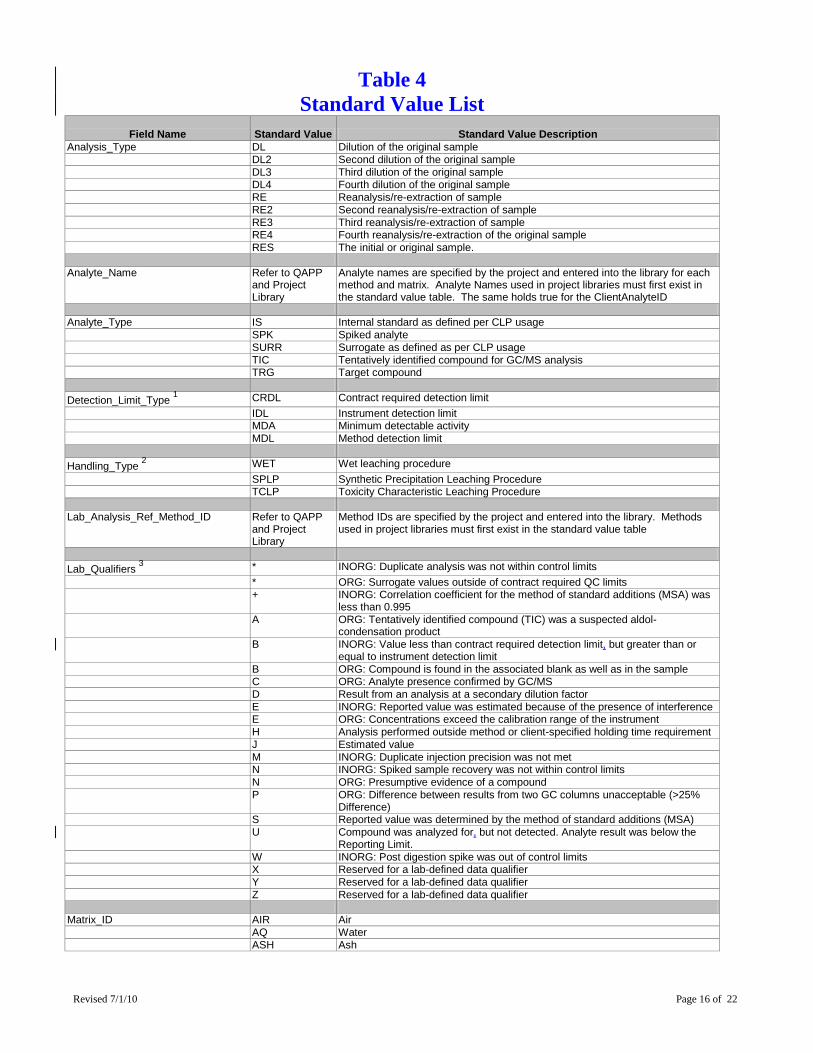
Revised 7/1/10 Page 16 of 22
Table 4 Standard Value List
Field Name Standard Value Standard Value Description
Analysis_Type DL Dilution of the original sample DL2 Second dilution of the original sample DL3 Third dilution of the original sample DL4 Fourth dilution of the original sample RE Reanalysis/re-extraction of sample RE2 Second reanalysis/re-extraction of sample RE3 Third reanalysis/re-extraction of sample RE4 Fourth reanalysis/re-extraction of the original sample RES The initial or original sample. Analyte_Name Refer to QAPP
and Project Library
Analyte names are specified by the project and entered into the library for each method and matrix. Analyte Names used in project libraries must first exist in the standard value table. The same holds true for the ClientAnalyteID
Analyte_Type IS Internal standard as defined per CLP usage SPK Spiked analyte SURR Surrogate as defined as per CLP usage TIC Tentatively identified compound for GC/MS analysis TRG Target compound Detection_Limit_Type 1 CRDL Contract required detection limit IDL Instrument detection limit MDA Minimum detectable activity MDL Method detection limit Handling_Type 2 WET Wet leaching procedure SPLP Synthetic Precipitation Leaching Procedure TCLP Toxicity Characteristic Leaching Procedure Lab_Analysis_Ref_Method_ID Refer to QAPP
and Project Library
Method IDs are specified by the project and entered into the library. Methods used in project libraries must first exist in the standard value table
Lab_Qualifiers 3 * INORG: Duplicate analysis was not within control limits * ORG: Surrogate values outside of contract required QC limits + INORG: Correlation coefficient for the method of standard additions (MSA) was
less than 0.995 A ORG: Tentatively identified compound (TIC) was a suspected aldol-
condensation product B INORG: Value less than contract required detection limit, but greater than or
equal to instrument detection limit B ORG: Compound is found in the associated blank as well as in the sample C ORG: Analyte presence confirmed by GC/MS D Result from an analysis at a secondary dilution factor
E INORG: Reported value was estimated because of the presence of interference E ORG: Concentrations exceed the calibration range of the instrument H Analysis performed outside method or client-specified holding time requirement J Estimated value M INORG: Duplicate injection precision was not met N INORG: Spiked sample recovery was not within control limits N ORG: Presumptive evidence of a compound P ORG: Difference between results from two GC columns unacceptable (>25%
Difference) S Reported value was determined by the method of standard additions (MSA) U Compound was analyzed for, but not detected. Analyte result was below the
Reporting Limit. W INORG: Post digestion spike was out of control limits X Reserved for a lab-defined data qualifier Y Reserved for a lab-defined data qualifier Z Reserved for a lab-defined data qualifier Matrix_ID AIR Air AQ Water ASH Ash
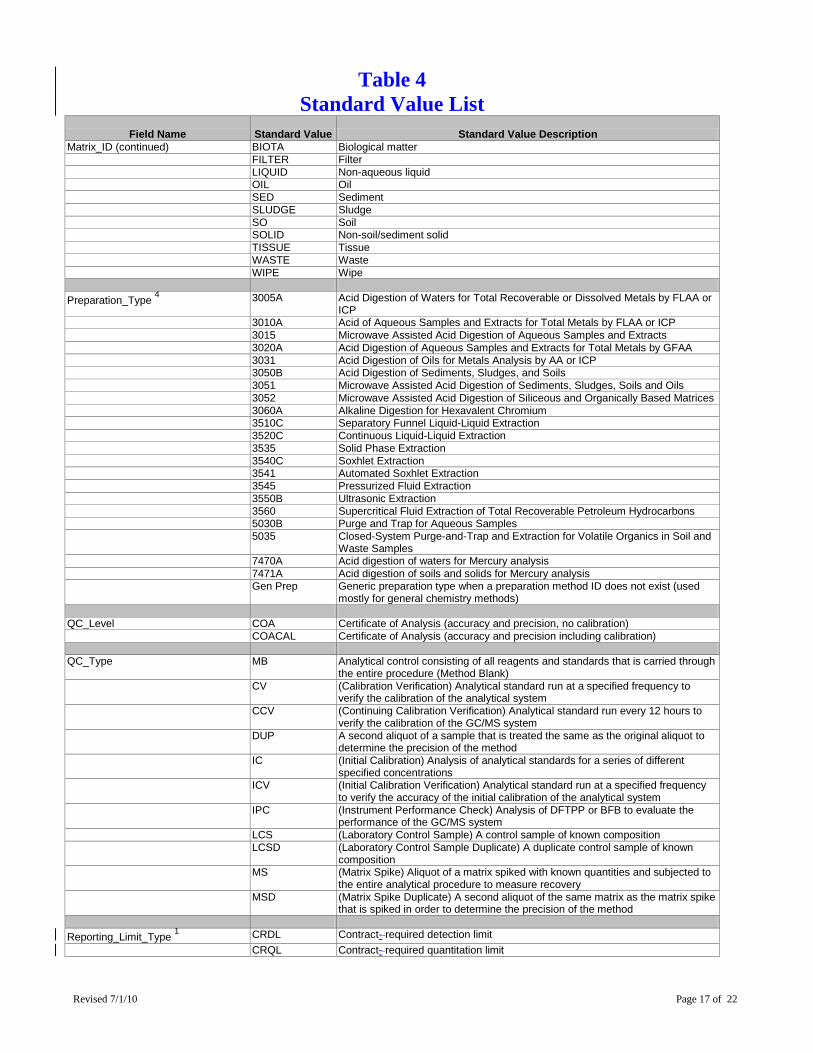
Revised 7/1/10 Page 17 of 22
Table 4 Standard Value List
Field Name Standard Value Standard Value Description
Matrix_ID (continued) BIOTA Biological matter FILTER Filter LIQUID Non-aqueous liquid OIL Oil SED Sediment SLUDGE Sludge SO Soil SOLID Non-soil/sediment solid TISSUE Tissue WASTE Waste WIPE Wipe Preparation_Type 4 3005A Acid Digestion of Waters for Total Recoverable or Dissolved Metals by FLAA or
ICP 3010A Acid of Aqueous Samples and Extracts for Total Metals by FLAA or ICP 3015 Microwave Assisted Acid Digestion of Aqueous Samples and Extracts 3020A Acid Digestion of Aqueous Samples and Extracts for Total Metals by GFAA 3031 Acid Digestion of Oils for Metals Analysis by AA or ICP 3050B Acid Digestion of Sediments, Sludges, and Soils
3051 Microwave Assisted Acid Digestion of Sediments, Sludges, Soils and Oils 3052 Microwave Assisted Acid Digestion of Siliceous and Organically Based Matrices 3060A Alkaline Digestion for Hexavalent Chromium 3510C Separatory Funnel Liquid-Liquid Extraction 3520C Continuous Liquid-Liquid Extraction 3535 Solid Phase Extraction 3540C Soxhlet Extraction 3541 Automated Soxhlet Extraction 3545 Pressurized Fluid Extraction 3550B Ultrasonic Extraction 3560 Supercritical Fluid Extraction of Total Recoverable Petroleum Hydrocarbons 5030B Purge and Trap for Aqueous Samples 5035 Closed-System Purge-and-Trap and Extraction for Volatile Organics in Soil and
Waste Samples 7470A Acid digestion of waters for Mercury analysis 7471A Acid digestion of soils and solids for Mercury analysis Gen Prep Generic preparation type when a preparation method ID does not exist (used
mostly for general chemistry methods) QC_Level COA Certificate of Analysis (accuracy and precision, no calibration) COACAL Certificate of Analysis (accuracy and precision including calibration) QC_Type MB Analytical control consisting of all reagents and standards that is carried through
the entire procedure (Method Blank) CV (Calibration Verification) Analytical standard run at a specified frequency to
verify the calibration of the analytical system CCV (Continuing Calibration Verification) Analytical standard run every 12 hours to
verify the calibration of the GC/MS system DUP A second aliquot of a sample that is treated the same as the original aliquot to
determine the precision of the method IC (Initial Calibration) Analysis of analytical standards for a series of different
specified concentrations ICV (Initial Calibration Verification) Analytical standard run at a specified frequency
to verify the accuracy of the initial calibration of the analytical system IPC (Instrument Performance Check) Analysis of DFTPP or BFB to evaluate the
performance of the GC/MS system LCS (Laboratory Control Sample) A control sample of known composition
LCSD (Laboratory Control Sample Duplicate) A duplicate control sample of known composition
MS (Matrix Spike) Aliquot of a matrix spiked with known quantities and subjected to the entire analytical procedure to measure recovery
MSD (Matrix Spike Duplicate) A second aliquot of the same matrix as the matrix spike that is spiked in order to determine the precision of the method
Reporting_Limit_Type 1 CRDL Contract- required detection limit CRQL Contract- required quantitation limit
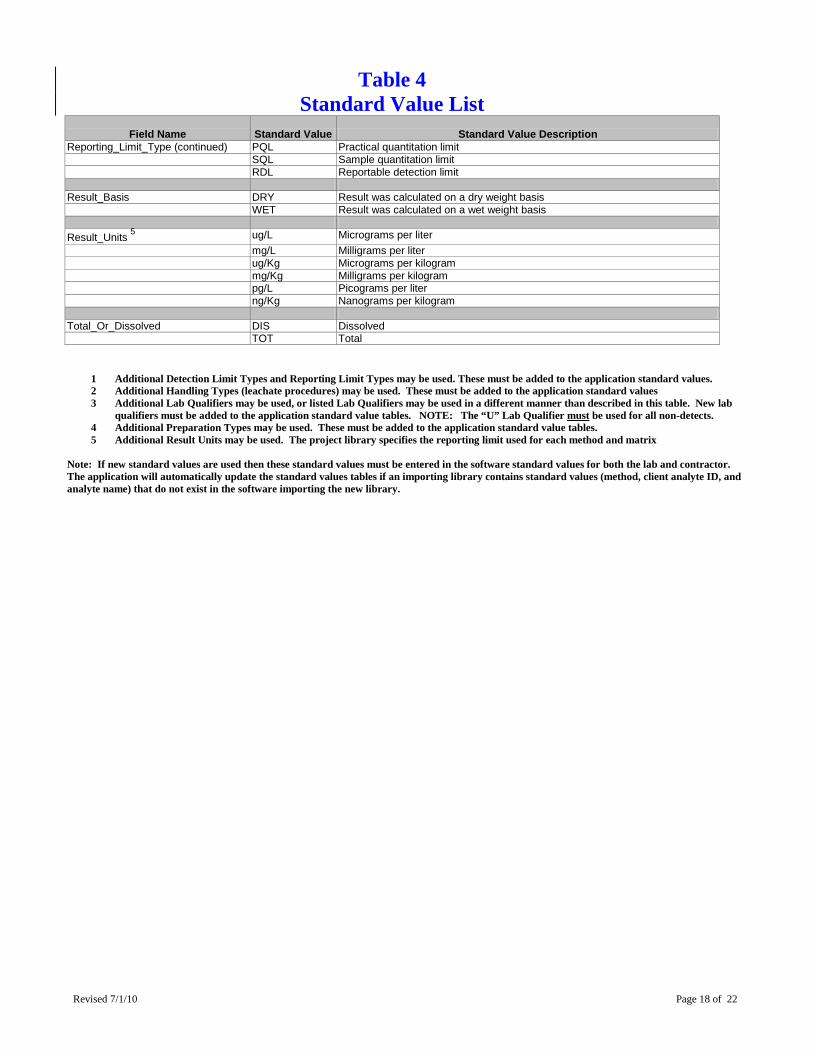
Revised 7/1/10 Page 18 of 22
Table 4 Standard Value List
Field Name Standard Value Standard Value Description
Reporting_Limit_Type (continued) PQL Practical quantitation limit SQL Sample quantitation limit RDL Reportable detection limit Result_Basis DRY Result was calculated on a dry weight basis WET Result was calculated on a wet weight basis Result_Units 5 ug/L Micrograms per liter mg/L Milligrams per liter ug/Kg Micrograms per kilogram mg/Kg Milligrams per kilogram pg/L Picograms per liter ng/Kg Nanograms per kilogram Total_Or_Dissolved DIS Dissolved TOT Total
1 Additional Detection Limit Types and Reporting Limit Types may be used. These must be added to the application standard values. 2 Additional Handling Types (leachate procedures) may be used. These must be added to the application standard values 3 Additional Lab Qualifiers may be used, or listed Lab Qualifiers may be used in a different manner than described in this table. New lab
qualifiers must be added to the application standard value tables. NOTE: The “U” Lab Qualifier must4 Additional Preparation Types may be used. These must be added to the application standard value tables.
be used for all non-detects.
5 Additional Result Units may be used. The project library specifies the reporting limit used for each method and matrix Note: If new standard values are used then these standard values must be entered in the software standard values for both the lab and contractor. The application will automatically update the standard values tables if an importing library contains standard values (method, client analyte ID, and analyte name) that do not exist in the software importing the new library.
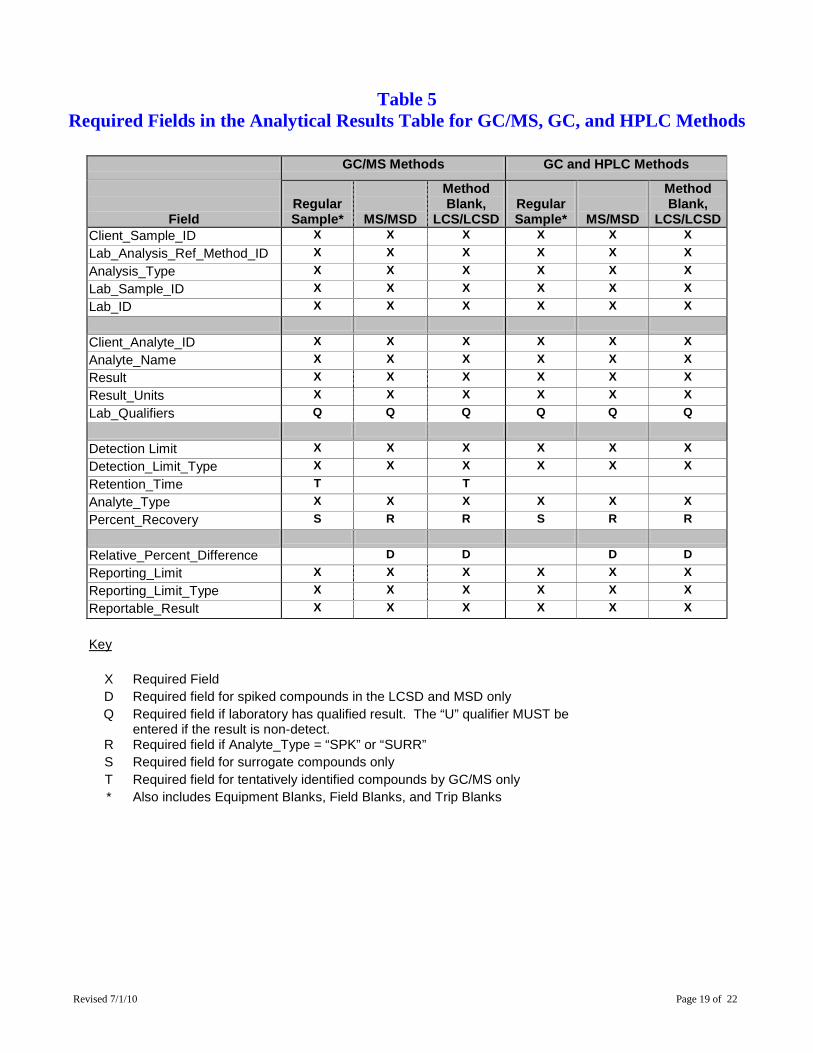
Revised 7/1/10 Page 19 of 22
Table 5
Required Fields in the Analytical Results Table for GC/MS, GC, and HPLC Methods
GC/MS Methods GC and HPLC Methods
Field
Regular Sample*
MS/MSD
Method Blank,
LCS/LCSD
Regular Sample*
MS/MSD
Method Blank,
LCS/LCSD Client_Sample_ID X X X X X X Lab_Analysis_Ref_Method_ID X X X X X X Analysis_Type X X X X X X Lab_Sample_ID X X X X X X Lab_ID X X X X X X
Client_Analyte_ID X X X X X X Analyte_Name X X X X X X Result X X X X X X Result_Units X X X X X X Lab_Qualifiers Q Q Q Q Q Q
Detection Limit X X X X X X Detection_Limit_Type X X X X X X Retention_Time T T Analyte_Type X X X X X X Percent_Recovery S R R S R R
Relative_Percent_Difference D D D D Reporting_Limit X X X X X X Reporting_Limit_Type X X X X X X Reportable_Result X X X X X X
Key
X Required Field D Required field for spiked compounds in the LCSD and MSD only Q Required field if laboratory has qualified result. The “U” qualifier MUST be
entered if the result is non-detect.
R Required field if Analyte_Type = “SPK” or “SURR” S Required field for surrogate compounds only T Required field for tentatively identified compounds by GC/MS only * Also includes Equipment Blanks, Field Blanks, and Trip Blanks
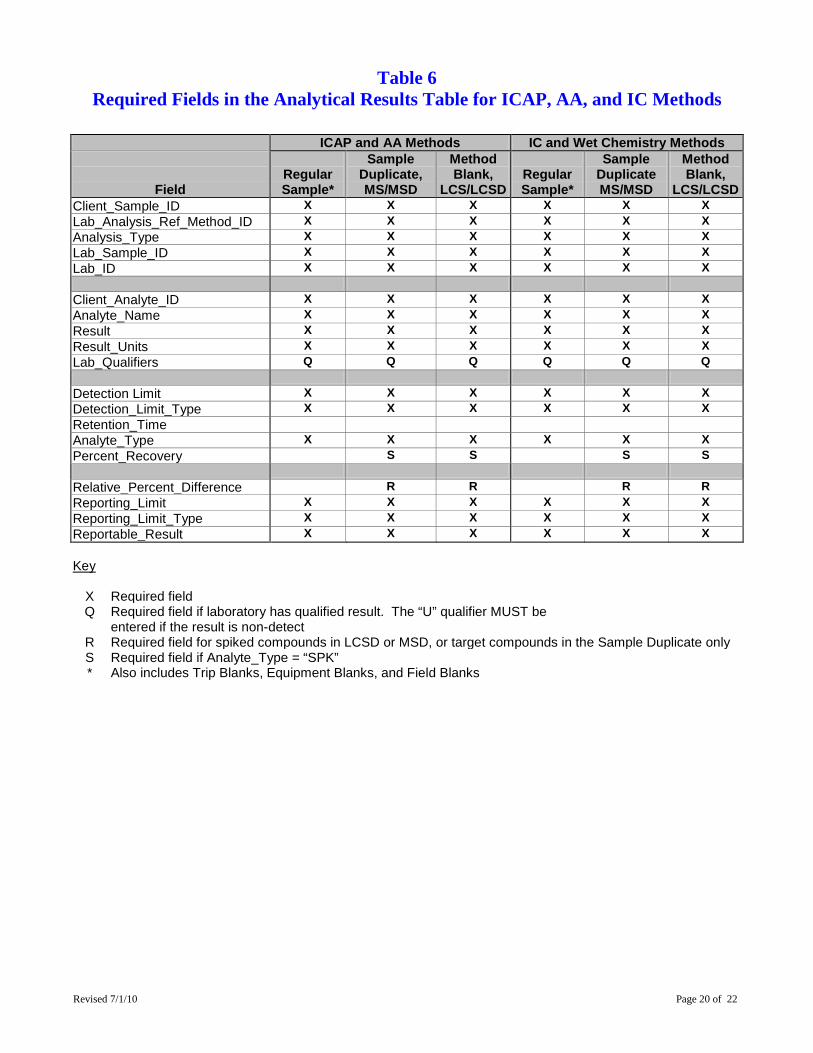
Revised 7/1/10 Page 20 of 22
Table 6 Required Fields in the Analytical Results Table for ICAP, AA, and IC Methods
ICAP and AA Methods IC and Wet Chemistry Methods
Field
Regular Sample*
Sample Duplicate, MS/MSD
Method Blank,
LCS/LCSD
Regular Sample*
Sample Duplicate MS/MSD
Method Blank,
LCS/LCSD Client_Sample_ID X X X X X X Lab_Analysis_Ref_Method_ID X X X X X X Analysis_Type X X X X X X Lab_Sample_ID X X X X X X Lab_ID X X X X X X
Client_Analyte_ID X X X X X X Analyte_Name X X X X X X Result X X X X X X Result_Units X X X X X X Lab_Qualifiers Q Q Q Q Q Q
Detection Limit X X X X X X Detection_Limit_Type X X X X X X Retention_Time Analyte_Type X X X X X X Percent_Recovery S S S S
Relative_Percent_Difference R R R R Reporting_Limit X X X X X X Reporting_Limit_Type X X X X X X Reportable_Result X X X X X X
Key
X Required field Q Required field if laboratory has qualified result. The “U” qualifier MUST be
entered if the result is non-detect
R Required field for spiked compounds in LCSD or MSD, or target compounds in the Sample Duplicate only S Required field if Analyte_Type = “SPK” * Also includes Trip Blanks, Equipment Blanks, and Field Blanks
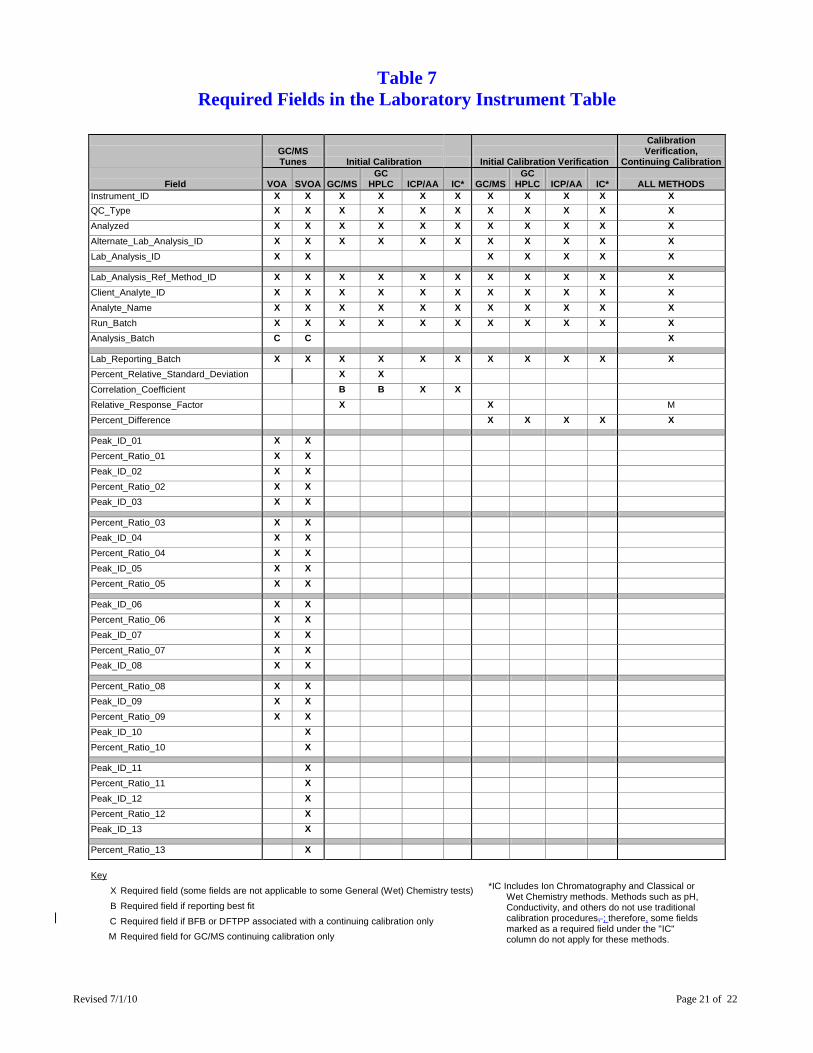
Revised 7/1/10 Page 21 of 22
Table 7 Required Fields in the Laboratory Instrument Table
GC/MS Tunes
Initial Calibration
Initial Calibration Verification
Calibration Verification,
Continuing Calibration
Field
VOA
SVOA
GC/MS GC
HPLC
ICP/AA
IC*
GC/MS GC
HPLC
ICP/AA
IC*
ALL METHODS Instrument_ID X X X X X X X X X X X QC_Type X X X X X X X X X X X Analyzed X X X X X X X X X X X Alternate_Lab_Analysis_ID X X X X X X X X X X X Lab_Analysis_ID X X X X X X X
Lab_Analysis_Ref_Method_ID X X X X X X X X X X X Client_Analyte_ID X X X X X X X X X X X Analyte_Name X X X X X X X X X X X Run_Batch X X X X X X X X X X X Analysis_Batch C C X
Lab_Reporting_Batch X X X X X X X X X X X Percent_Relative_Standard_Deviation X X Correlation_Coefficient B B X X Relative_Response_Factor X X M Percent_Difference X X X X X
Peak_ID_01 X X Percent_Ratio_01 X X Peak_ID_02 X X Percent_Ratio_02 X X Peak_ID_03 X X
Percent_Ratio_03 X X Peak_ID_04 X X Percent_Ratio_04 X X Peak_ID_05 X X Percent_Ratio_05 X X
Peak_ID_06 X X Percent_Ratio_06 X X Peak_ID_07 X X Percent_Ratio_07 X X Peak_ID_08 X X
Percent_Ratio_08 X X Peak_ID_09 X X Percent_Ratio_09 X X Peak_ID_10 X Percent_Ratio_10 X
Peak_ID_11 X Percent_Ratio_11 X Peak_ID_12 X Percent_Ratio_12 X Peak_ID_13 X
Percent_Ratio_13 X
Key
X Required field (some fields are not applicable to some General (Wet) Chemistry tests) B Required field if reporting best fit C Required field if BFB or DFTPP associated with a continuing calibration only M Required field for GC/MS continuing calibration only
*IC Includes Ion Chromatography and Classical or Wet Chemistry methods. Methods such as pH, Conductivity, and others do not use traditional calibration procedures, ; therefore, some fields marked as a required field under the "IC" column do not apply for these methods.

Revised 7/1/10 Page 22 of 22
Table 8 Required Fields in the Sample Analysis Table
GC, GC/MS, HPLC Methods ICAP and AA Methods IC and Wet Chemistry Methods
Field
Method Blanks,
LCS/LCSD
Regular Samples*, Sample Duplicate,
MS/MSD
Method Blanks,
LCS/LCSD
Regular Samples*, Sample Duplicate,
MS/MSD
Method Blanks,
LCS/LCSD
Regular Samples*, Sample Duplicate,
MS/MSD Client_Sample_ID X X X X X X Collected X X X Matrix_ID X X X X X X Lab_Sample_ID X X X X X X QC_Type X Q X Q X X
Shipping_Batch_ID X X X Temperature X X Lab_Analysis_Ref_Method_ID X X X X X X Preparation_Type X X X X X X Analysis_Type X X X X X X
Prepared A A X X N N Analyzed X X X X X X Lab_ID X X X X X X QC_Level X X X X X X Results_Basis S S S
Total_Or_Dissolved W W Dilution X X X X X X Handling_Type L L L L L L Handling_Batch L L L L L L Leachate_Date L L L L L L
Percent Moisture S S S Method_Batch X X X X X X Preparation_Batch X X X X X X Run_Batch C C C C C C Analysis_Batch C C C C C C
Lab_Reporting_Batch X X X X X X Lab_Receipt X X X Lab_Reported X X X X X X
Key
X Required field A Required field for samples prepared by methanol extraction C Required field if Instrument Calibration Table (A2) is included in EDD L Required field if analysis performed on SPLP, TCLP, or WET extracts N Required field only for samples that require preparation before analysis Q Required field for Sample Duplicate, MS, and MSD only S Required field if “Matrix_ID” = “SO” or “SED” W Required field for aqueous samples only * Includes Trip Blanks, Equipment Blanks, and Field Blanks
Related Documents