SAFER, SMARTER, GREENER DNV GL © 2014 9 December 2014 Michael Wilkinson ENERGY Long-term Performance of Wind Farms 1 EWEA Technical Workshop, Malmo, December 2014

Welcome message from author
This document is posted to help you gain knowledge. Please leave a comment to let me know what you think about it! Share it to your friends and learn new things together.
Transcript

DNV GL © 2014 9 December 2014 SAFER, SMARTER, GREENERDNV GL © 2014
9 December 2014
Michael Wilkinson
ENERGY
Long-term Performance of Wind Farms
1
EWEA Technical Workshop, Malmo, December 2014
DNV GL © 2014 9 December 2014
Does wind turbine performance degrade over time?
Recent studies from academic institutes in the UK suggest that wind farm
production degrades by a significant margin each year
Resulting in a loss of confidence from wind energy operators and the investment
community
DNV GL draws on extensive experience and high quality, high resolution data to
test these claims and perform a root cause analysis
2
Experience matters: >50 GW of operational analysis; forecasting for >40 GW; Inspections for >700 turbines per year; Largest independent provider of wind farm SCADA
DNV GL © 2014 9 December 2014
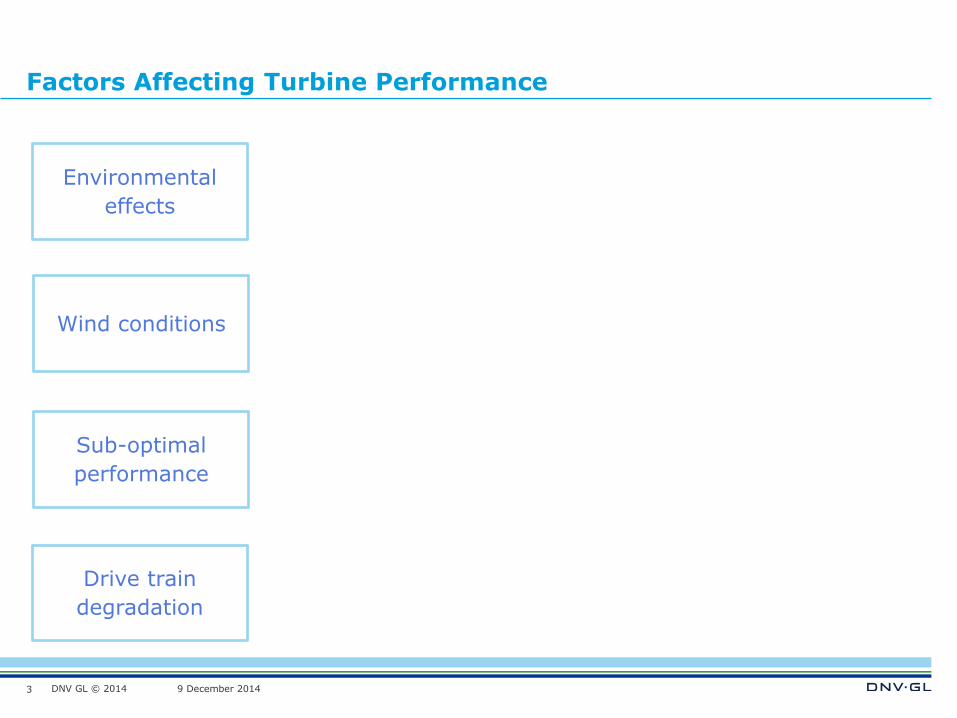
Factors Affecting Turbine Performance
3
Environmental
effects
Wind conditions
Sub-optimal
performance
Drive train
degradation
DNV GL © 2014 9 December 2014
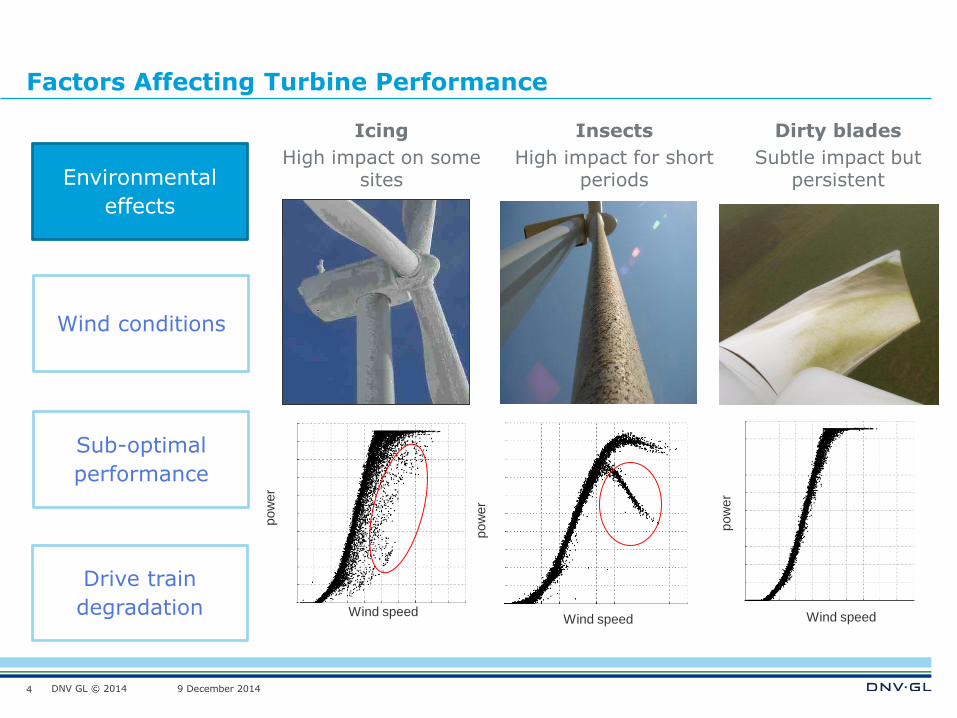
Factors Affecting Turbine Performance
4
Environmental
effects
Wind conditions
Sub-optimal
performance
Wind speed
pow
er
Wind speed
pow
er
pow
er
Wind speed
Icing
High impact on some sites
Insects
High impact for short periods
Dirty blades
Subtle impact but persistent
Drive train
degradation

DNV GL © 2014 9 December 2014
Factors Affecting Turbine Performance
5
Environmental
effects
Wind conditions
Sub-optimal
performance
Drive train
degradation
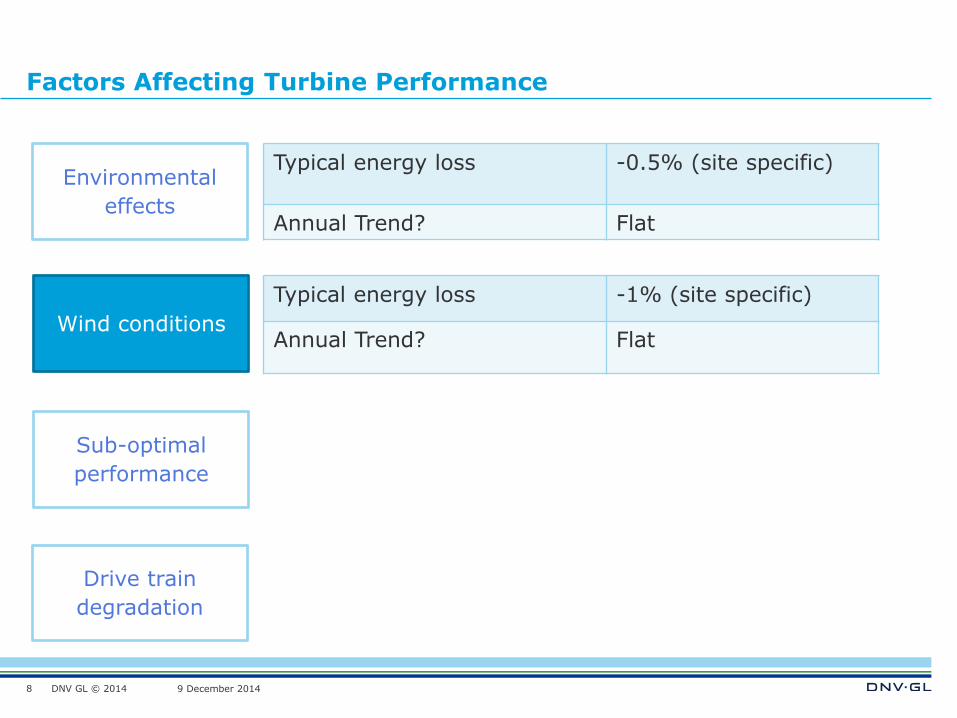
Typical energy loss -0.5% (site specific)
Annual Trend? Flat

DNV GL © 2014 9 December 2014
Factors Affecting Turbine Performance
6
Environmental
effects
Wind conditions
Sub-optimal
performance
Drive train
degradation
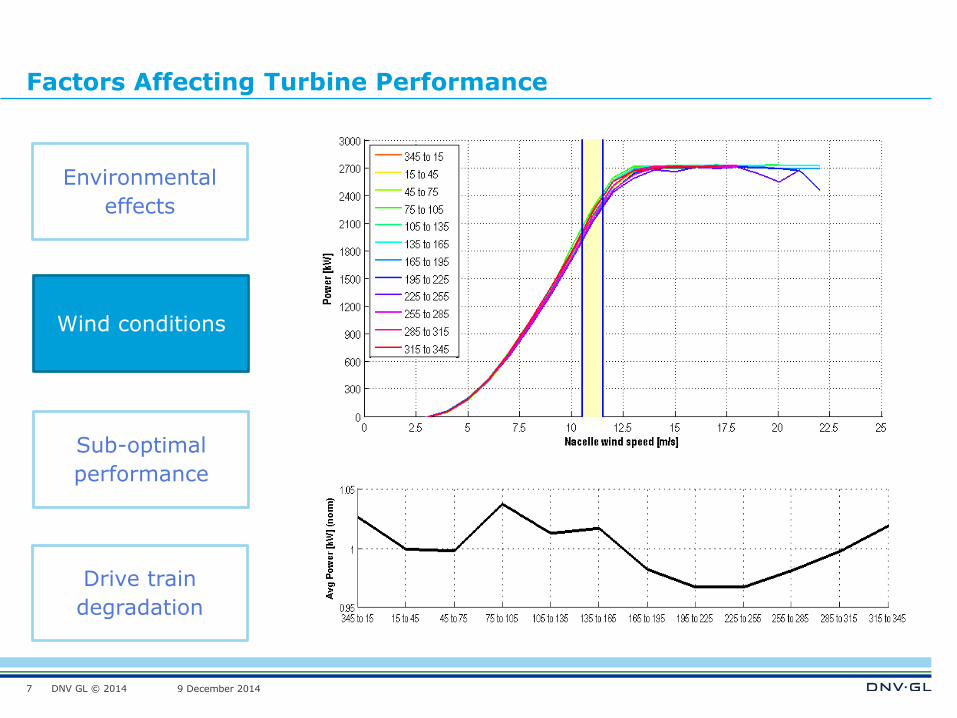
Parameters that impact the power curve:
Flow inclination
Turbulence intensity (TI)
Shear profile
Air density
Conditions that influence these parameters:
Atmospheric stability (TI, Shear, density)
Topography (flow inclination, TI, and shear)
Forestry (TI and shear)
DNV GL © 2014 9 December 2014
Factors Affecting Turbine Performance
7
Environmental
effects
Wind conditions
Sub-optimal
performance
Drive train
degradation
DNV GL © 2014 9 December 2014
Factors Affecting Turbine Performance
8
Environmental
effects
Wind conditions
Sub-optimal
performance
Drive train
degradation
Typical energy loss -1% (site specific)
Annual Trend? Flat
Typical energy loss -0.5% (site specific)
Annual Trend? Flat
DNV GL © 2014 9 December 2014
Factors Affecting Turbine Performance
9
Environmental
effects
Wind conditions
Sub-optimal
performance
Drive train
degradation
De-rating
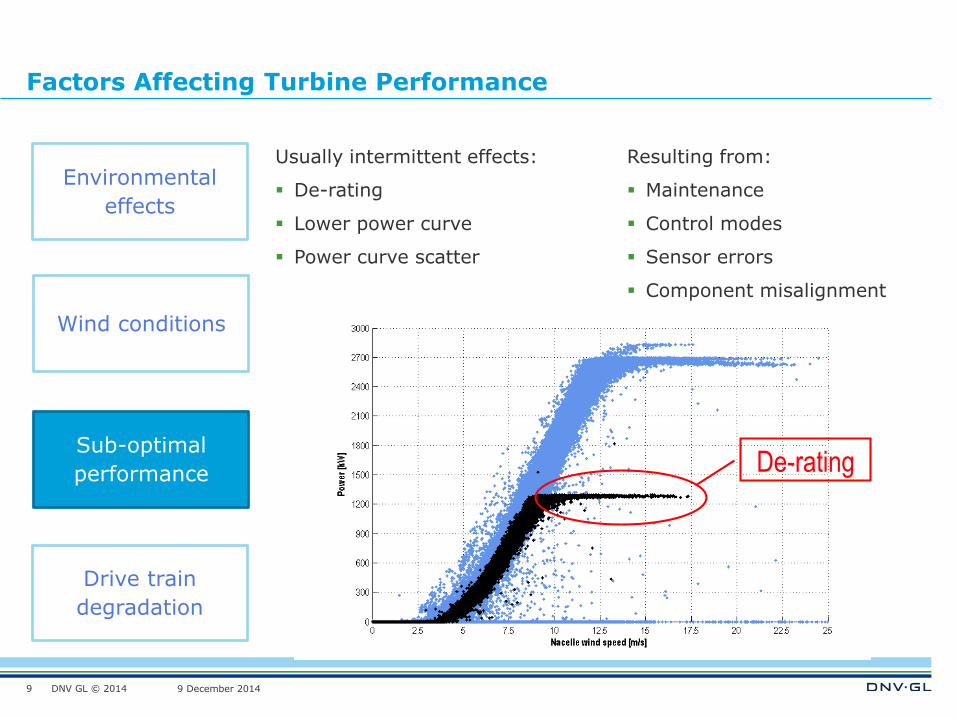
Usually intermittent effects:
De-rating
Lower power curve
Power curve scatter
Resulting from:
Maintenance
Control modes
Sensor errors
Component misalignment

DNV GL © 2014 9 December 2014
Factors Affecting Turbine Performance
10
Environmental
effects
Wind conditions
Sub-optimal
performance
Drive train
degradation
Typical energy loss -1% (operator specific)
Annual Trend? Flat
Typical energy loss -1% (site specific)
Annual Trend? Flat
Typical energy loss -0.5% (site specific)
Annual Trend? Flat

DNV GL © 2014 9 December 2014
Factors Affecting Turbine Performance
11
Gearbox Generator
Powerconverter
Transformer
Environmental
effects
Wind conditions
Sub-optimal
performance
Drive train
degradation

DNV GL © 2014 9 December 2014
Factors Affecting Turbine Performance
12
Environmental
effects
Wind conditions
Sub-optimal
performance
Drive train
degradation
DNV GL © 2014 9 December 2014
Factors Affecting Turbine Performance
13
Environmental
effects
Wind conditions
Sub-optimal
performance
Drive train
degradation
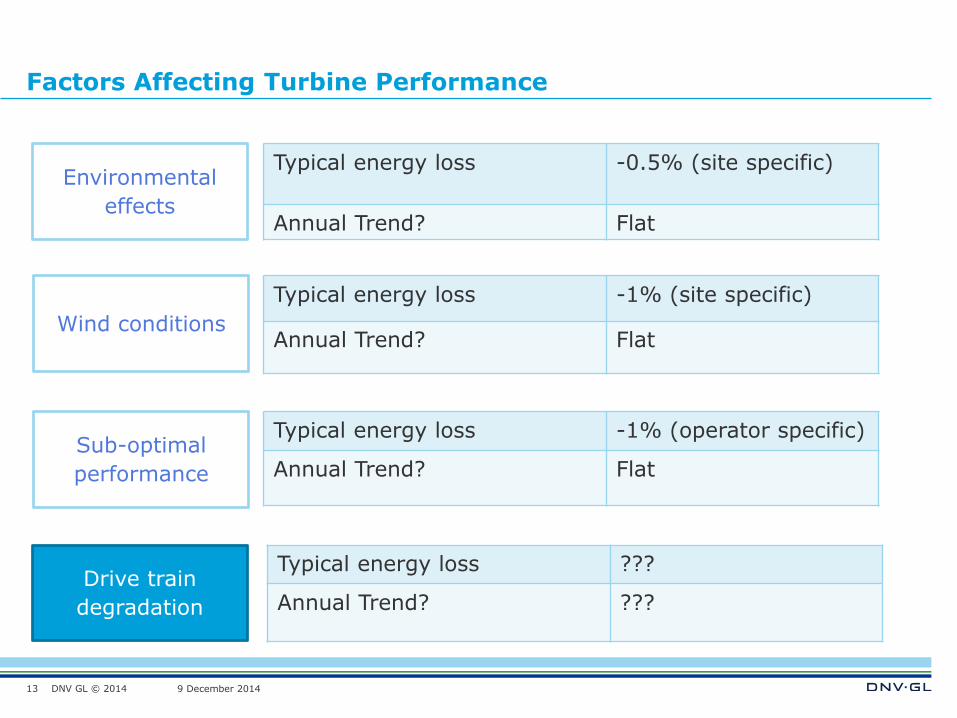
Typical energy loss ???
Annual Trend? ???
Typical energy loss -1% (operator specific)
Annual Trend? Flat
Typical energy loss -0.5% (site specific)
Annual Trend? Flat
Typical energy loss -1% (site specific)
Annual Trend? Flat

DNV GL © 2014 9 December 2014
Drive Train Degradation Study - Method
Category
Control Mode
ChangeConsistent
Anemometry
1 NO YES
2 YES YES
3 NO NO
4 YES NO
14
Identify suitable
projects
Remove
intermittent
effects
Make binned
‘clean’ power
curve
Calculate energy
loss
31 wind farms
235 turbines
Across Europe
DNV GL © 2014 9 December 2014
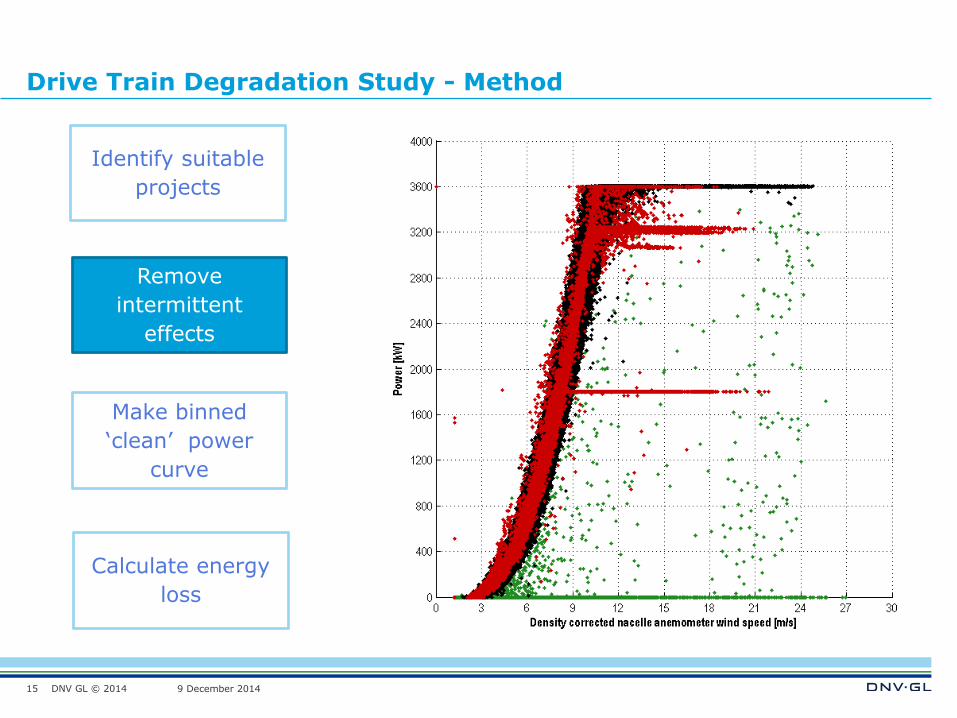
Drive Train Degradation Study - Method
15
Identify suitable
projects
Remove
intermittent
effects
Make binned
‘clean’ power
curve
Calculate energy
loss
DNV GL © 2014 9 December 2014
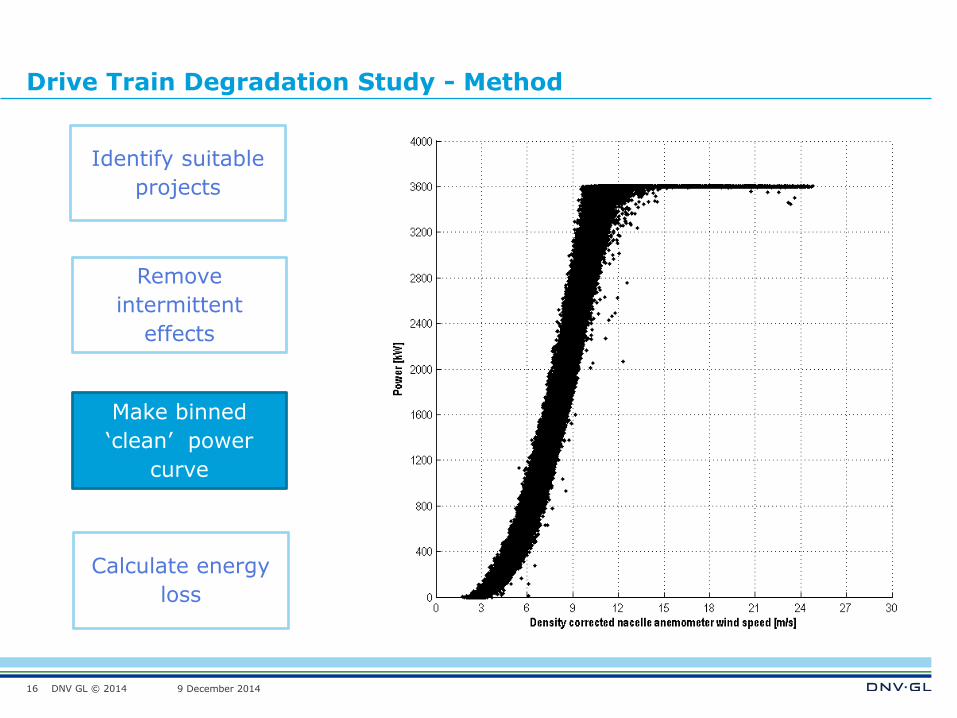
Drive Train Degradation Study - Method
16
Identify suitable
projects
Remove
intermittent
effects
Make binned
‘clean’ power
curve
Calculate energy
loss

DNV GL © 2014 9 December 2014
Drive Train Degradation Study - Method
17
Identify suitable
projects
Remove
intermittent
effects
Make binned
‘clean’ power
curve
Calculate energy
loss
DNV GL © 2014 9 December 2014
Drive Train Degradation Study - Results
18

DNV GL © 2014 9 December 2014
Drive Train Degradation Study - Results
19
31 wind farms
235 turbines
DNV GL © 2014 9 December 2014
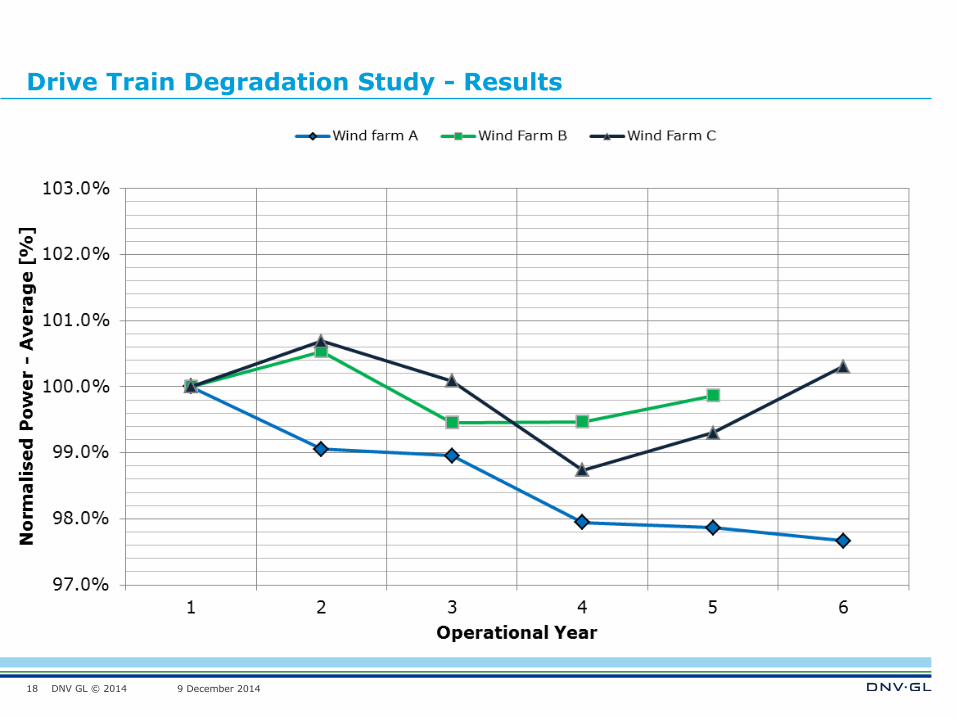
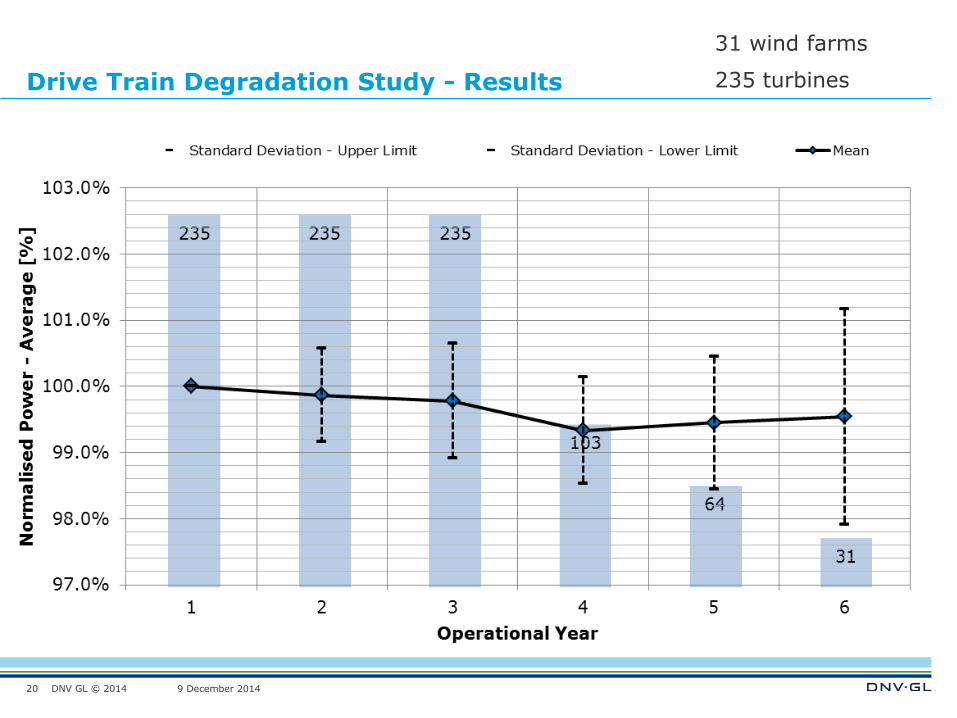
Drive Train Degradation Study - Results
20
31 wind farms
235 turbines

DNV GL © 2014 9 December 2014
Factors Affecting Turbine Performance
21
Environmental
effects
Wind conditions
Sub-optimal
performance
Drive train
degradation
Typical energy loss -0.5% (site specific)
Annual Trend? Flat
Typical energy loss -1% (site specific)
Annual Trend? Flat
Typical energy loss -1% (operator specific)
Annual Trend? Flat
Typical energy loss ???
Annual Trend? ???
DNV GL © 2014 9 December 2014
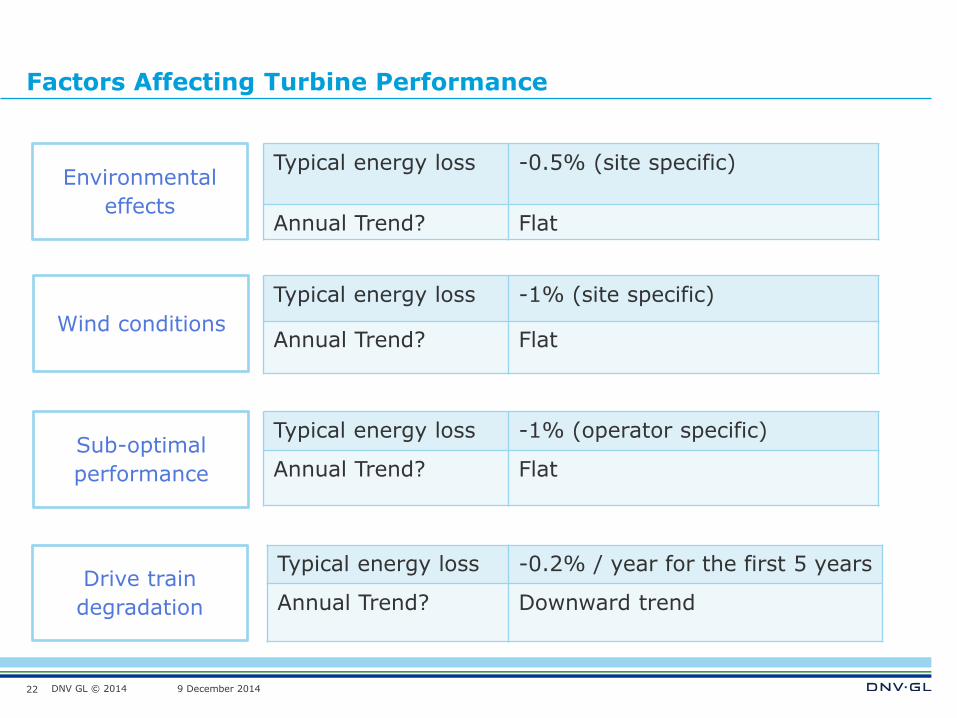
Factors Affecting Turbine Performance
22
Environmental
effects
Wind conditions
Sub-optimal
performance
Drive train
degradation
Typical energy loss -0.5% (site specific)
Annual Trend? Flat
Typical energy loss -1% (site specific)
Annual Trend? Flat
Typical energy loss -1% (operator specific)
Annual Trend? Flat
Typical energy loss -0.2% / year for the first 5 years
Annual Trend? Downward trend
DNV GL © 2014 9 December 2014
Conclusions and Further Work
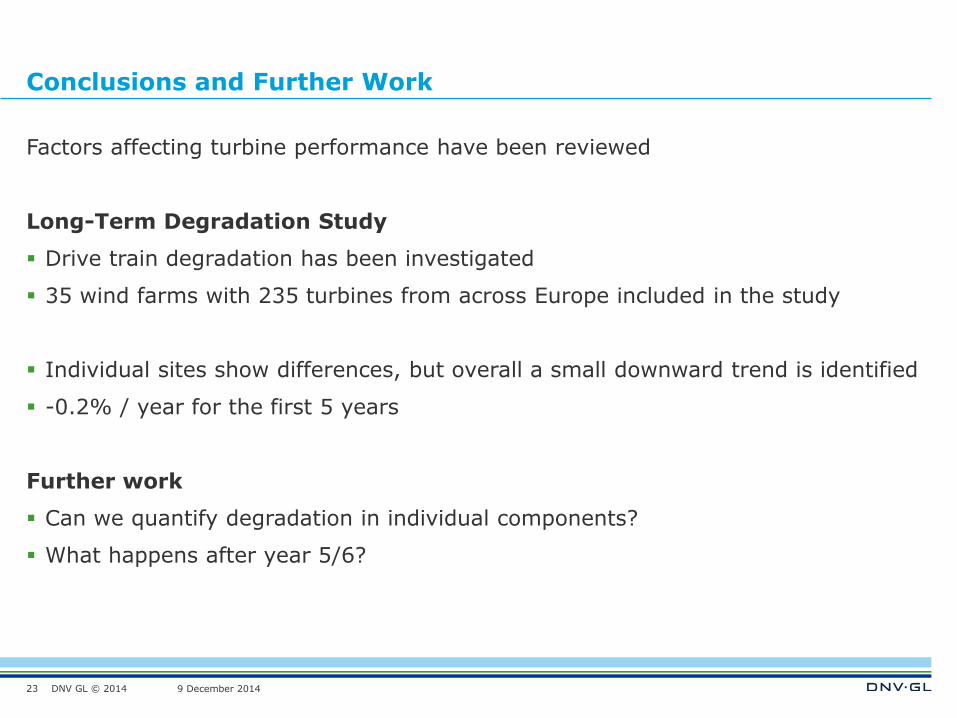
Factors affecting turbine performance have been reviewed
Long-Term Degradation Study
Drive train degradation has been investigated
35 wind farms with 235 turbines from across Europe included in the study
Individual sites show differences, but overall a small downward trend is identified
-0.2% / year for the first 5 years
Further work
Can we quantify degradation in individual components?
What happens after year 5/6?
23
DNV GL © 2014 9 December 2014
SAFER, SMARTER, GREENER
www.dnvgl.com
24
Michael Wilkinson
+44 117 972 9900

DNV GL © 2014 9 December 2014
What could cause production degradation?
3 possible elements that could cause degradation of wind farm production over
time:
25
Wind resource Availability Turbine performance
Wind speed
pow
er

DNV GL © 2014 9 December 2014
Wind resource
DNV GL Wind Index
Historical wind data from 1996 to 2014
50 meteorological stations spread
across the mainland of the UK
Each station has measured consistent
wind speed data for 10 years or more
26
DNV GL © 2014 9 December 2014
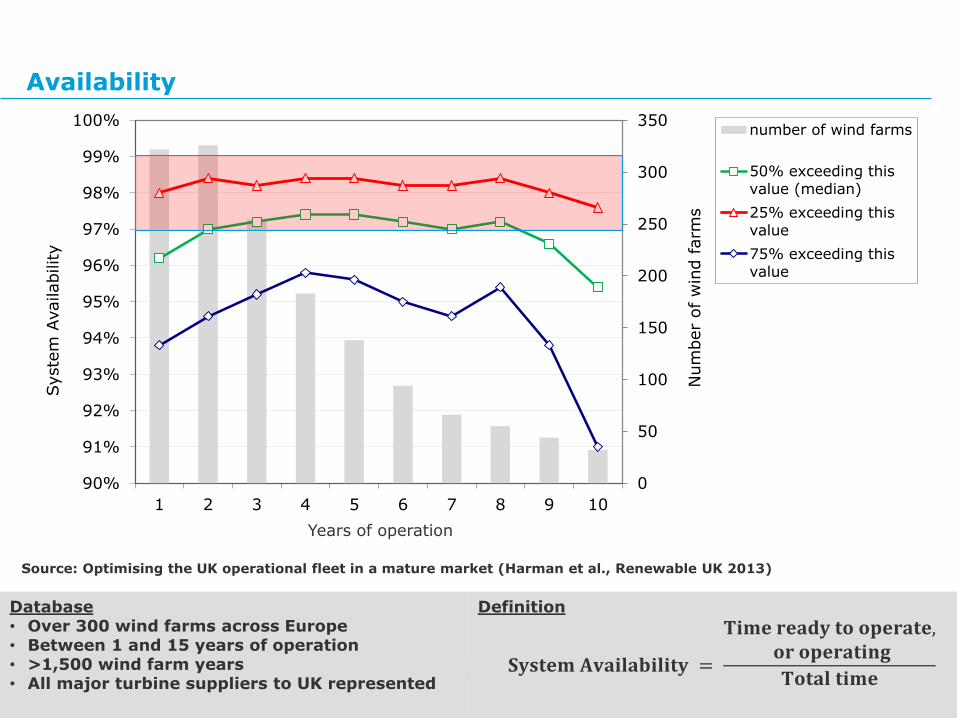
Availability
27
DefinitionDatabase• Over 300 wind farms across Europe• Between 1 and 15 years of operation• >1,500 wind farm years• All major turbine suppliers to UK represented
0
50
100
150
200
250
300
350
90%
91%
92%
93%
94%
95%
96%
97%
98%
99%
100%
1 2 3 4 5 6 7 8 9 10
Num
ber
of w
ind f
arm
s
Syste
m A
vailability
number of wind farms
50% exceeding thisvalue (median)
25% exceeding thisvalue
75% exceeding thisvalue
Years of operation
𝐒𝐲𝐬𝐭𝐞𝐦 𝐀𝐯𝐚𝐢𝐥𝐚𝐛𝐢𝐥𝐢𝐭𝐲 =
𝐓𝐢𝐦𝐞 𝐫𝐞𝐚𝐝𝐲 𝐭𝐨 𝐨𝐩𝐞𝐫𝐚𝐭𝐞,𝐨𝐫 𝐨𝐩𝐞𝐫𝐚𝐭𝐢𝐧𝐠
𝐓𝐨𝐭𝐚𝐥 𝐭𝐢𝐦𝐞
Source: Optimising the UK operational fleet in a mature market (Harman et al., Renewable UK 2013)
Related Documents