LOCKHEED MARTIN CORPORATION 2013 ANNUAL REPORT LOCKHEED MARTIN CORPORATION 2013 Annual Report

Welcome message from author
This document is posted to help you gain knowledge. Please leave a comment to let me know what you think about it! Share it to your friends and learn new things together.
Transcript

LOCKHEED MARTIN CORPORATION2013 ANNUAL REPORT
LOCKHEED MARTIN CORPORATION2013 Annual Report
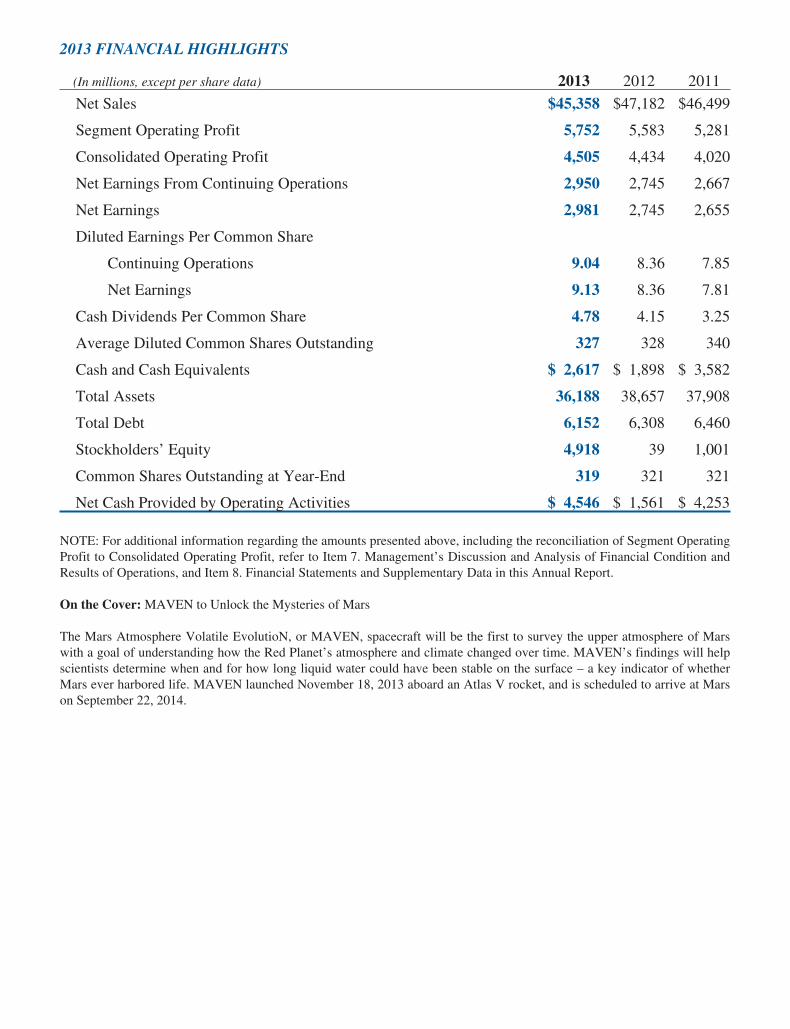
2013 FINANCIAL HIGHLIGHTS
(In millions, except per share data) 2013 2012 2011
Net Sales $45,358 $47,182 $46,499
Segment Operating Profit 5,752 5,583 5,281
Consolidated Operating Profit 4,505 4,434 4,020
Net Earnings From Continuing Operations 2,950 2,745 2,667
Net Earnings 2,981 2,745 2,655
Diluted Earnings Per Common Share
Continuing Operations 9.04 8.36 7.85
Net Earnings 9.13 8.36 7.81
Cash Dividends Per Common Share 4.78 4.15 3.25
Average Diluted Common Shares Outstanding 327 328 340
Cash and Cash Equivalents $ 2,617 $ 1,898 $ 3,582
Total Assets 36,188 38,657 37,908
Total Debt 6,152 6,308 6,460
Stockholders’ Equity 4,918 39 1,001
Common Shares Outstanding at Year-End 319 321 321
Net Cash Provided by Operating Activities $ 4,546 $ 1,561 $ 4,253
NOTE: For additional information regarding the amounts presented above, including the reconciliation of Segment OperatingProfit to Consolidated Operating Profit, refer to Item 7. Management’s Discussion and Analysis of Financial Condition andResults of Operations, and Item 8. Financial Statements and Supplementary Data in this Annual Report.
On the Cover: MAVEN to Unlock the Mysteries of Mars
The Mars Atmosphere Volatile EvolutioN, or MAVEN, spacecraft will be the first to survey the upper atmosphere of Marswith a goal of understanding how the Red Planet’s atmosphere and climate changed over time. MAVEN’s findings will helpscientists determine when and for how long liquid water could have been stable on the surface – a key indicator of whetherMars ever harbored life. MAVEN launched November 18, 2013 aboard an Atlas V rocket, and is scheduled to arrive at Marson September 22, 2014.

I 2013 AnnuAl RepoRt
2013 was a year of dynamic change. As the world’s leading aerospace and global security company, we embraced that change, continued our record of exceptional performance, and positioned Lockheed Martin for continued success.
We took proactive steps to strengthen our core and international business, drive opportunities in adjacent markets, streamline our cost structure to improve affordability, and deliver innovations that will address our customers’ challenges today and tomorrow.
Performance has always been our hallmark, and 2013 was no exception. With our customers grappling with increasing budget uncertainty, our goal was to be an anchor of dependability. We kept our promises, delivered on our commitments and acted with integrity in everything we did. This continued commitment to performance translated into higher operating margins, stronger cash flows and a record backlog. In short, we created value for our stockholders, delivered cutting-edge products for our customers, and positioned Lockheed Martin for the future.
Dear Fellow StockholDerS
Our Leadership Team: From left to right: Orlando P. Carvalho, Executive Vice President, Aeronautics; Patrick M. Dewar, Executive Vice President,Lockheed Martin International; Sondra L. Barbour, Executive Vice President, Information Systems & Global Solutions; Richard F. Ambrose, Executive Vice President, Space Systems; Marillyn A. Hewson, Chairman, President and Chief Executive Officer; Bruce L. Tanner, Executive Vice President and Chief Financial Officer; Richard H. Edwards, Executive Vice President, Missiles and Fire Control; Dale P. Bennett, Executive Vice President, Mission Systems and Training.
This letter includes references to segment operating profit, segment margin and free cash flow, which are non-GAAP financial measures. For reconciliations between our non-GAAP measures and the nearest GAAP measures, please refer to the Form 10-K portion of this Annual Report.
Lockheed Martin corporation II
Creating Value for Our Stockholders
In this time of budget constraints and changing market dynamics, we know the importance of creating value for you, our stockholders, by improving profitability and generating strong returns and cash.
Our stock closed the year at $148.66 per share, up from $92.29 per share at the close of 2012 — a 61 percent increase. In total, we generated a 68 percent total stockholder return, a result of continued outstanding financial performance and a strong dividend yield. Financial highlights include:
• Sales of $45.4 billion, down 4 percent versus 2012.• Record segment operating profit of $5.8 billion.• Record segment margin of 12.7 percent.• Record diluted earnings per share from continuing
operations of $9.04.• Record backlog of $82.6 billion.• Net earnings from continuing operations increased
7 percent to about $3.0 billion.• Cash from operations of $4.5 billion, after making
pension contributions of $2.25 billion.
Cash generation is built into our operating discipline, and we used that cash to deliver value to you while investing in our future. We continued to exceed our commitment of returning at least 50 percent of free
cash flow to our stockholders. We paid $1.5 billion in dividends — 2013 was our eleventh year in a row of a double-digit per share dividend increase. We also repurchased 16.2 million shares of stock for $1.8 billion. In total, we returned almost 90 percent of free cash flow to stockholders. At the same time, we invested $836 million into our business in capital expenditures, improving the quality and efficiency of our operations.
Delivering for Our Customers
We were encouraged to see Congress pass a two-year budget agreement in December. The stability created by this agreement will improve our ability to plan for the future and is a welcome step toward a long-term solution to our nation’s budgetary challenges.
We’re committed to supporting our customers by meeting our commitments, driving affordability and improving our agility and responsiveness. Our portfolio is strategically aligned with the technologies and services our customers want — both now and in the future. As the global security landscape evolves, we believe that the need for powerful, flexible systems like the F-35 Lightning II, Littoral Combat Ship, integrated missile defense, information technology and advanced satellites will grow. By coupling superior performance with a portfolio aligned to our customers’ needs, we believe that we’re positioned to meet the demands of customers around the globe.
Across our portfolio, we delivered many key achievements in 2013:
F-35 Lightning II: 2013 was another year of accelerating progress on our 5th generation, multirole, multi-variant, stealth fighter. The F-35 achieved numerous milestones this year:
• The F-35A completed its first in-flight missile launch.• The F-35B, Short Take-off Vertical Landing
(STOVL) variant completed its first vertical take-off, first vertical night landing, and first vertical night landing at sea on the USS Wasp.
• The F-35C carrier variant completed its first in-flight dual refueling, where two fighters were refueled simultaneously by a Lockheed Martin KC-130 Hercules.
• The Netherlands selected the F-35 as the official replacement for its fleet of F-16s.
• We celebrated the production of the 100th F-35.
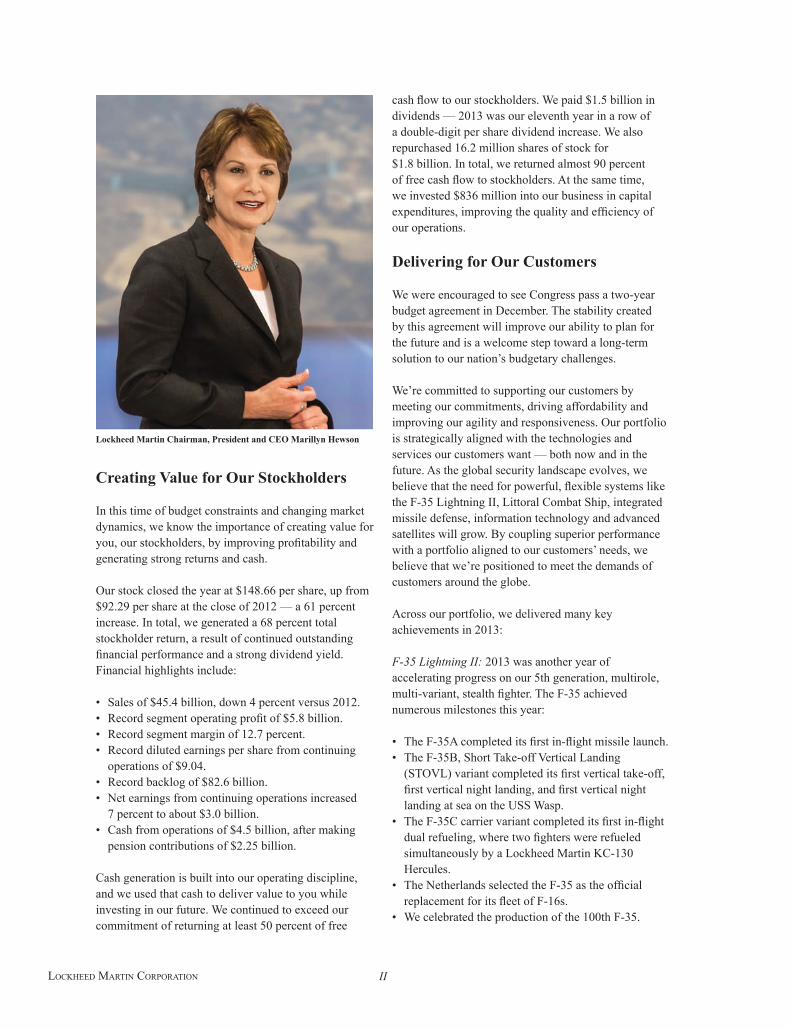
Lockheed Martin Chairman, President and CEO Marillyn Hewson
2013 AnnuAl RepoRtIII
Our continued focus on affordability is helping us adapt to our customers’ budget constraints. Costs of the airframe have declined 55 percent from initial production fighters to those rolling off the production line today. And we’re continuing our efforts to decrease costs across the entire program.
Littoral Combat Ship (LCS): It’s “full speed ahead” for the LCS program as the fleet continues to grow. A fast, maneuverable surface combatant, the LCS is a flexible, versatile platform built for today’s dynamic global security environment. This operational flexibility means it can take on missions ranging from mine-clearing to anti-submarine and anti-surface warfare, as well as security and humanitarian missions in both coastal and open waters. This year the USS Freedom deployed to Southeast Asia and participated in its first Cooperation Afloat Readiness Training exercise. And USS Freedom delivered humanitarian assistance and disaster relief supplies to the Philippines in response to the devastation caused by Typhoon Haiyan. The USS Fort Worth completed final contractor trials in San Diego, and in December we launched the Milwaukee. Construction of the Detroit, Little Rock, and Sioux City is under way.
Missile Defense: Our air and missile defense systems demonstrated an unmatched ability to protect against the full spectrum of 21st century threats — from hostile aircraft to cruise and ballistic missiles. Years ago we pioneered the combat-proven “hit-to-kill” technology that defeats incoming targets and their payloads through force of impact alone. Three of our business segments participated in a ground-breaking Missile Defense Agency test that proved the value of an integrated, layered missile shield. Aegis Ballistic Missile Defense; the Terminal High Altitude Area Defense (THAAD); and the Command, Control, Battle Management and Communications systems worked together to intercept two ballistic missile targets that were launched nearly simultaneously. In addition, the Medium Extended Air Defense System (MEADS), firing PAC-3 Missiles, intercepted and destroyed two targets attacking simultaneously from opposite directions — an unprecedented feat. These tests proved yet again that the capability and maturity of our portfolio of missile defense systems are unequaled.
We continue to see strong demand for our missile defense systems. In 2013 we signed a $3.9 billion THAAD production contract that includes systems for both the U.S. Army and the United Arab Emirates, and Kuwait became the sixth international customer for the PAC-3 Missile.
Information Technology: On the IT front, we marked major deliveries and strategic international growth in 2013. We delivered new crime-solving capabilities via the FBI’s Next Generation Identification system that improve latent fingerprint search accuracy to help solve cold cases and advance crime-solving capabilities. We were also awarded a contract to provide the United Kingdom’s Ministry of Justice with Service Integration and Management support to deliver consolidated IT services across the organization’s complex, multi-supplier IT environment. And we were selected to design and secure the Active Network Infrastructure for NATO’s new headquarters in Brussels, Belgium.
As industry and government face growing threats from persistent cyber attackers, we have been equally determined in defending against them. For our cyber security customers — and for our own internal networks — we have developed robust threat detection and mitigation processes for safeguarding IT resources and securing vital assets.
Satellites and Space Systems: Our space portfolio marked a number of milestone launches in 2013. In March, the U.S. Air Force’s second Space Based Infrared System (SBIRS) Geosynchronous Earth Orbit (GEO-2) satellite also launched successfully. SBIRS delivers critical missile warning information that helps protect the U.S. and its allies. The second Mobile User Objective System (MUOS) satellite was launched in July. The MUOS constellation delivers secure, prioritized voice and data communications, a first for mobile warfighters who need high-speed mission data on the move. NASA’s Mars Atmosphere and Volatile EvolutioN (MAVEN) spacecraft launched in November from Cape Canaveral Air Force Station, Florida. As pictured on the cover of this annual report, MAVEN will perform the first dedicated mission to survey the upper atmosphere of Mars.
Positioning for the Future
With U.S. federal budgets under pressure and long-term fiscal challenges on the horizon, we’re taking proactive measures to position Lockheed Martin for growth and continued success. Our major areas of focus are growing internationally, improving our affordability and innovating for growth.
Growing Internationally: Lockheed Martin is a global company. We do business in 70 nations around the world and have more than 1,000 global partnerships.
Lockheed Martin corporation IV
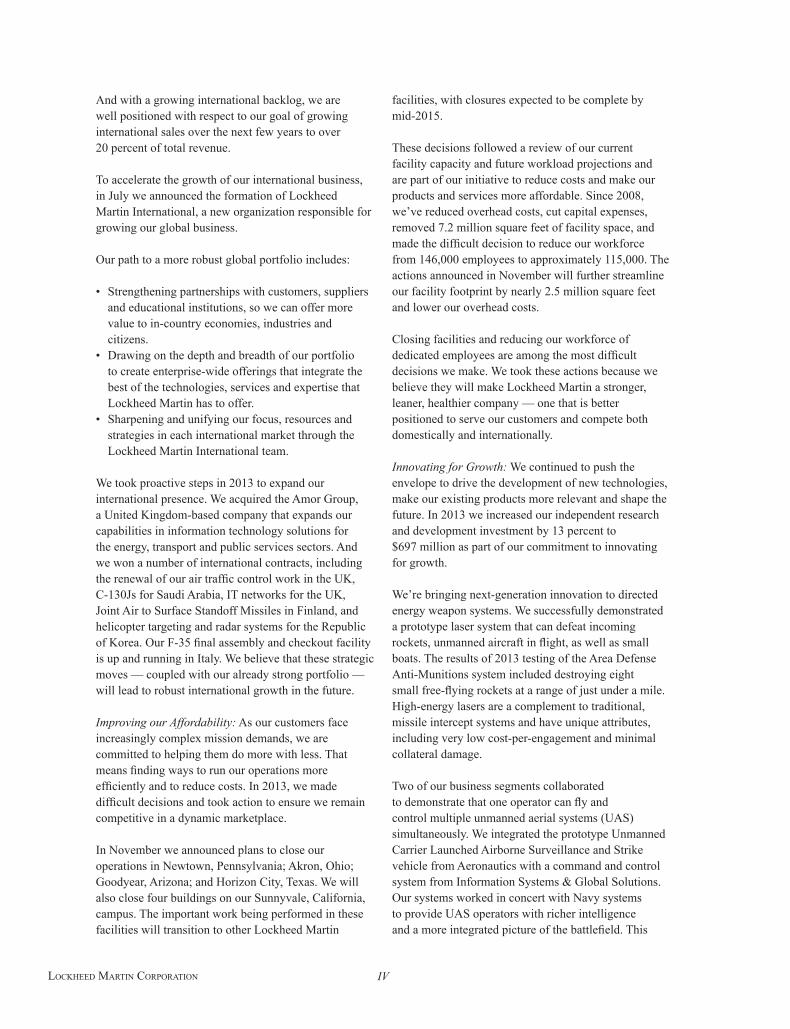
And with a growing international backlog, we are well positioned with respect to our goal of growing international sales over the next few years to over 20 percent of total revenue.
To accelerate the growth of our international business, in July we announced the formation of Lockheed Martin International, a new organization responsible for growing our global business.
Our path to a more robust global portfolio includes:
• Strengthening partnerships with customers, suppliers and educational institutions, so we can offer more value to in-country economies, industries and citizens.
• Drawing on the depth and breadth of our portfolio to create enterprise-wide offerings that integrate the best of the technologies, services and expertise that Lockheed Martin has to offer.
• Sharpening and unifying our focus, resources and strategies in each international market through the Lockheed Martin International team.
We took proactive steps in 2013 to expand our international presence. We acquired the Amor Group, a United Kingdom-based company that expands our capabilities in information technology solutions for the energy, transport and public services sectors. And we won a number of international contracts, including the renewal of our air traffic control work in the UK, C-130Js for Saudi Arabia, IT networks for the UK, Joint Air to Surface Standoff Missiles in Finland, and helicopter targeting and radar systems for the Republic of Korea. Our F-35 final assembly and checkout facility is up and running in Italy. We believe that these strategic moves — coupled with our already strong portfolio — will lead to robust international growth in the future.
Improving our Affordability: As our customers face increasingly complex mission demands, we are committed to helping them do more with less. That means finding ways to run our operations more efficiently and to reduce costs. In 2013, we made difficult decisions and took action to ensure we remain competitive in a dynamic marketplace.
In November we announced plans to close our operations in Newtown, Pennsylvania; Akron, Ohio; Goodyear, Arizona; and Horizon City, Texas. We will also close four buildings on our Sunnyvale, California, campus. The important work being performed in these facilities will transition to other Lockheed Martin
facilities, with closures expected to be complete by mid-2015. These decisions followed a review of our current facility capacity and future workload projections and are part of our initiative to reduce costs and make our products and services more affordable. Since 2008, we’ve reduced overhead costs, cut capital expenses, removed 7.2 million square feet of facility space, and made the difficult decision to reduce our workforce from 146,000 employees to approximately 115,000. The actions announced in November will further streamline our facility footprint by nearly 2.5 million square feet and lower our overhead costs.
Closing facilities and reducing our workforce of dedicated employees are among the most difficult decisions we make. We took these actions because we believe they will make Lockheed Martin a stronger, leaner, healthier company — one that is better positioned to serve our customers and compete both domestically and internationally.
Innovating for Growth: We continued to push the envelope to drive the development of new technologies, make our existing products more relevant and shape the future. In 2013 we increased our independent research and development investment by 13 percent to $697 million as part of our commitment to innovating for growth.
We’re bringing next-generation innovation to directed energy weapon systems. We successfully demonstrated a prototype laser system that can defeat incoming rockets, unmanned aircraft in flight, as well as small boats. The results of 2013 testing of the Area Defense Anti-Munitions system included destroying eight small free-flying rockets at a range of just under a mile. High-energy lasers are a complement to traditional, missile intercept systems and have unique attributes, including very low cost-per-engagement and minimal collateral damage.
Two of our business segments collaborated to demonstrate that one operator can fly and control multiple unmanned aerial systems (UAS) simultaneously. We integrated the prototype Unmanned Carrier Launched Airborne Surveillance and Strike vehicle from Aeronautics with a command and control system from Information Systems & Global Solutions. Our systems worked in concert with Navy systems to provide UAS operators with richer intelligence and a more integrated picture of the battlefield. This
2013 AnnuAl RepoRtV
innovation is an example of our ability to collaborate across our portfolio to make our systems more relevant and valuable for our customers.
Another arena where we’re innovating for growth is sustainability. This continues to be a key priority for us, as we apply innovative solutions to protect the environment, strengthen communities and drive responsible growth. One example of how innovation in sustainability is opening new markets is Ocean Thermal Energy Conversion (OTEC). OTEC uses the ocean’s natural thermal gradient to generate power. On an average day, 60 million square kilometers of tropical seas absorb an amount of solar radiation equivalent to the energy produced by approximately 250 billion barrels of oil. The temperature difference between deep and shallow ocean waters offers tremendous potential for producing energy. In 2013 we signed a contract with Reignwood Group to develop and build a 10-megawatt OTEC power plant. This plant will be the largest OTEC project developed to date, and represents a new adjacent market growth opportunity for the Corporation.
For our ongoing sustainability efforts, we were pleased to be recognized by a number of outside organizations. We were named to a highly-respected benchmark for sustainability, the 2013 Dow Jones Sustainability North America Index. CDP (formerly the Carbon Disclosure Project) scored us one of the top companies worldwide on its 2013 Global Carbon Performance Leadership Index. And we advanced to be among the top three
companies in our industry for environmental, social and governance performance as ranked by MSCI, a leading provider of indices and portfolio analytics.
Leading the Way
No review of 2013 would be complete without thanking Robert J. Stevens for his many years of service as Chairman and CEO of Lockheed Martin Corporation. His strong leadership guided our company through a period of sustained growth and exceptional performance. We salute Bob as a colleague and a friend, and we wish him the best in all his future endeavors.
As we look ahead to 2014, we do so with confidence. Our performance and innovation are as strong as ever. Our portfolio is well-aligned to our customers’ current and future needs. And our strategy has us positioned for success on the global stage. We will not flinch in meeting our customers’ most challenging expectations, and we will not falter in delivering innovation that will help our customers strengthen global security, deliver essential citizen services and advance scientific discovery. We look forward to a bright future with confidence and determination.
Marillyn A. HewsonChairman, President and Chief Executive Officer
Employee Photo Here
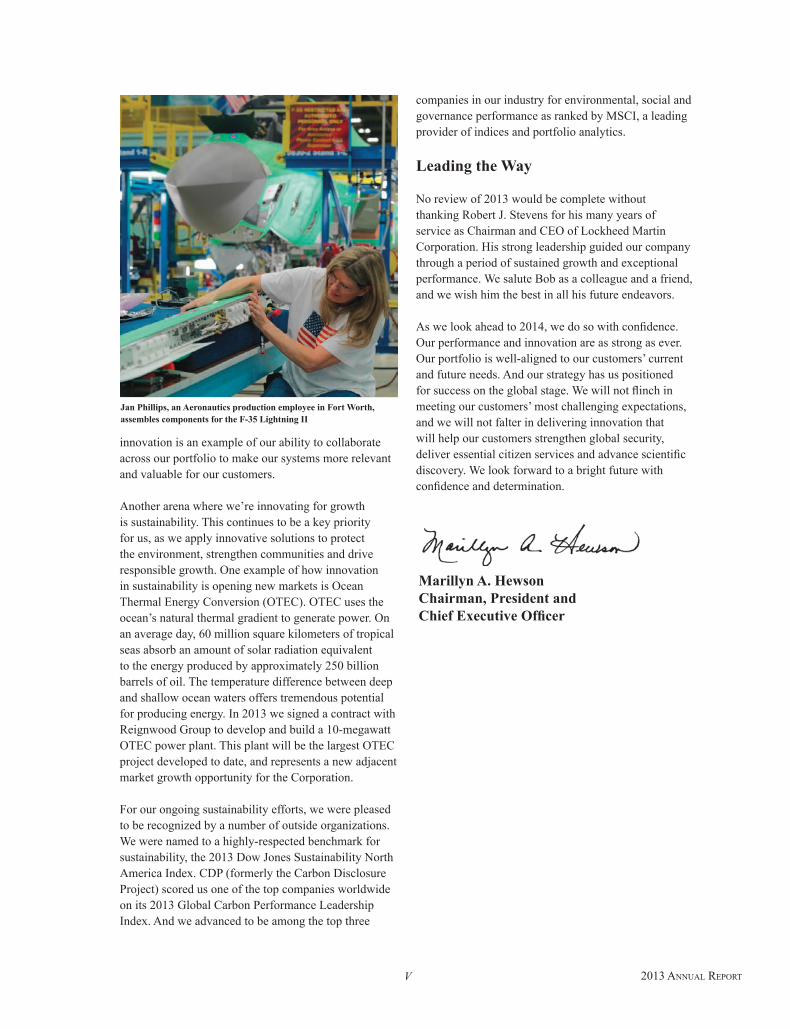
Jan Phillips, an Aeronautics production employee in Fort Worth, assembles components for the F-35 Lightning II
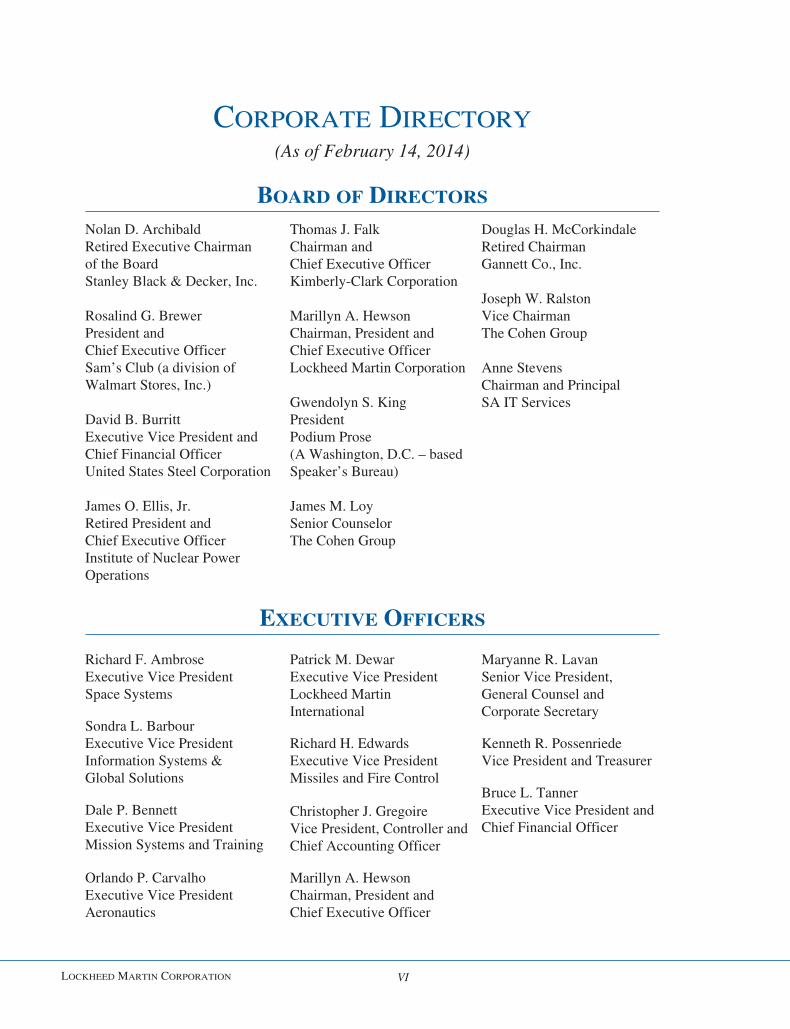
CORPORATE DIRECTORY(As of February 14, 2014)
BOARD OF DIRECTORS
Nolan D. ArchibaldRetired Executive Chairmanof the BoardStanley Black & Decker, Inc.
Rosalind G. BrewerPresident andChief Executive OfficerSam’s Club (a division ofWalmart Stores, Inc.)
David B. BurrittExecutive Vice President andChief Financial OfficerUnited States Steel Corporation
James O. Ellis, Jr.Retired President andChief Executive OfficerInstitute of Nuclear PowerOperations
Thomas J. FalkChairman andChief Executive OfficerKimberly-Clark Corporation
Marillyn A. HewsonChairman, President andChief Executive OfficerLockheed Martin Corporation
Gwendolyn S. KingPresidentPodium Prose(A Washington, D.C. – basedSpeaker’s Bureau)
James M. LoySenior CounselorThe Cohen Group
Douglas H. McCorkindaleRetired ChairmanGannett Co., Inc.
Joseph W. RalstonVice ChairmanThe Cohen Group
Anne StevensChairman and PrincipalSA IT Services
EXECUTIVE OFFICERS
Richard F. AmbroseExecutive Vice PresidentSpace Systems
Sondra L. BarbourExecutive Vice PresidentInformation Systems &Global Solutions
Dale P. BennettExecutive Vice PresidentMission Systems and Training
Orlando P. CarvalhoExecutive Vice PresidentAeronautics
Patrick M. DewarExecutive Vice PresidentLockheed MartinInternational
Richard H. EdwardsExecutive Vice PresidentMissiles and Fire Control
Christopher J. GregoireVice President, Controller andChief Accounting Officer
Marillyn A. HewsonChairman, President andChief Executive Officer
Maryanne R. LavanSenior Vice President,General Counsel andCorporate Secretary
Kenneth R. PossenriedeVice President and Treasurer
Bruce L. TannerExecutive Vice President andChief Financial Officer
LOCKHEED MARTIN CORPORATION VI
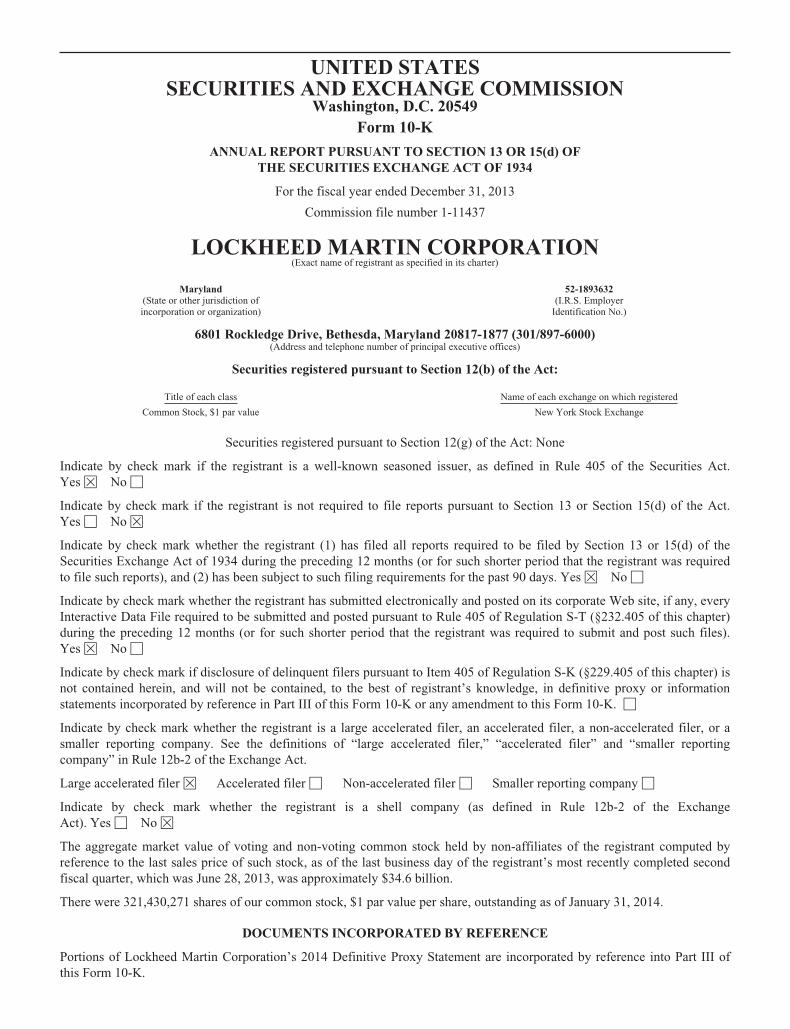
UNITED STATESSECURITIES AND EXCHANGE COMMISSION
Washington, D.C. 20549Form 10-K
ANNUAL REPORT PURSUANT TO SECTION 13 OR 15(d) OFTHE SECURITIES EXCHANGE ACT OF 1934
For the fiscal year ended December 31, 2013
Commission file number 1-11437
LOCKHEED MARTIN CORPORATION(Exact name of registrant as specified in its charter)
Maryland 52-1893632(State or other jurisdiction ofincorporation or organization)
(I.R.S. EmployerIdentification No.)
6801 Rockledge Drive, Bethesda, Maryland 20817-1877 (301/897-6000)(Address and telephone number of principal executive offices)
Securities registered pursuant to Section 12(b) of the Act:
Title of each class Name of each exchange on which registered
Common Stock, $1 par value New York Stock Exchange
Securities registered pursuant to Section 12(g) of the Act: None
Indicate by check mark if the registrant is a well-known seasoned issuer, as defined in Rule 405 of the Securities Act.Yes È No ‘
Indicate by check mark if the registrant is not required to file reports pursuant to Section 13 or Section 15(d) of the Act.Yes ‘ No È
Indicate by check mark whether the registrant (1) has filed all reports required to be filed by Section 13 or 15(d) of theSecurities Exchange Act of 1934 during the preceding 12 months (or for such shorter period that the registrant was requiredto file such reports), and (2) has been subject to such filing requirements for the past 90 days. Yes È No ‘
Indicate by check mark whether the registrant has submitted electronically and posted on its corporate Web site, if any, everyInteractive Data File required to be submitted and posted pursuant to Rule 405 of Regulation S-T (§232.405 of this chapter)during the preceding 12 months (or for such shorter period that the registrant was required to submit and post such files).Yes È No ‘
Indicate by check mark if disclosure of delinquent filers pursuant to Item 405 of Regulation S-K (§229.405 of this chapter) isnot contained herein, and will not be contained, to the best of registrant’s knowledge, in definitive proxy or informationstatements incorporated by reference in Part III of this Form 10-K or any amendment to this Form 10-K. ‘
Indicate by check mark whether the registrant is a large accelerated filer, an accelerated filer, a non-accelerated filer, or asmaller reporting company. See the definitions of “large accelerated filer,” “accelerated filer” and “smaller reportingcompany” in Rule 12b-2 of the Exchange Act.
Large accelerated filer È Accelerated filer ‘ Non-accelerated filer ‘ Smaller reporting company ‘
Indicate by check mark whether the registrant is a shell company (as defined in Rule 12b-2 of the ExchangeAct). Yes ‘ No È
The aggregate market value of voting and non-voting common stock held by non-affiliates of the registrant computed byreference to the last sales price of such stock, as of the last business day of the registrant’s most recently completed secondfiscal quarter, which was June 28, 2013, was approximately $34.6 billion.
There were 321,430,271 shares of our common stock, $1 par value per share, outstanding as of January 31, 2014.
DOCUMENTS INCORPORATED BY REFERENCE
Portions of Lockheed Martin Corporation’s 2014 Definitive Proxy Statement are incorporated by reference into Part III ofthis Form 10-K.
Lockheed Martin Corporation
Form 10-KFor the Year Ended December 31, 2013
Table of Contents
PART I Page
ITEM 1. Business . . . . . . . . . . . . . . . . . . . . . . . . . . . . . . . . . . . . . . . . . . . . . . . . . . . . . . . . . . . . . . . . . . . . . . . 3ITEM 1A. Risk Factors . . . . . . . . . . . . . . . . . . . . . . . . . . . . . . . . . . . . . . . . . . . . . . . . . . . . . . . . . . . . . . . . . . . . 9ITEM 1B. Unresolved Staff Comments . . . . . . . . . . . . . . . . . . . . . . . . . . . . . . . . . . . . . . . . . . . . . . . . . . . . . . . 18ITEM 2. Properties . . . . . . . . . . . . . . . . . . . . . . . . . . . . . . . . . . . . . . . . . . . . . . . . . . . . . . . . . . . . . . . . . . . . . . 18ITEM 3. Legal Proceedings . . . . . . . . . . . . . . . . . . . . . . . . . . . . . . . . . . . . . . . . . . . . . . . . . . . . . . . . . . . . . . . 19ITEM 4. Mine Safety Disclosures . . . . . . . . . . . . . . . . . . . . . . . . . . . . . . . . . . . . . . . . . . . . . . . . . . . . . . . . . . . 19ITEM 4(a). Executive Officers of the Registrant . . . . . . . . . . . . . . . . . . . . . . . . . . . . . . . . . . . . . . . . . . . . . . . . . 19
PART II
ITEM 5. Market for Registrant’s Common Equity, Related Stockholder Matters and Issuer Purchases ofEquity Securities . . . . . . . . . . . . . . . . . . . . . . . . . . . . . . . . . . . . . . . . . . . . . . . . . . . . . . . . . . . . . . 21
ITEM 6. Selected Financial Data . . . . . . . . . . . . . . . . . . . . . . . . . . . . . . . . . . . . . . . . . . . . . . . . . . . . . . . . . . . 23ITEM 7. Management’s Discussion and Analysis of Financial Condition and Results of Operations . . . . . . 24ITEM 7A. Quantitative and Qualitative Disclosures about Market Risk . . . . . . . . . . . . . . . . . . . . . . . . . . . . . . 54ITEM 8. Financial Statements and Supplementary Data . . . . . . . . . . . . . . . . . . . . . . . . . . . . . . . . . . . . . . . . . 55ITEM 9. Changes in and Disagreements with Accountants on Accounting and Financial Disclosure . . . . . . 87ITEM 9A. Controls and Procedures . . . . . . . . . . . . . . . . . . . . . . . . . . . . . . . . . . . . . . . . . . . . . . . . . . . . . . . . . . . 87ITEM 9B. Other Information . . . . . . . . . . . . . . . . . . . . . . . . . . . . . . . . . . . . . . . . . . . . . . . . . . . . . . . . . . . . . . . . 88
PART III
ITEM 10. Directors, Executive Officers and Corporate Governance . . . . . . . . . . . . . . . . . . . . . . . . . . . . . . . . . 89ITEM 11. Executive Compensation . . . . . . . . . . . . . . . . . . . . . . . . . . . . . . . . . . . . . . . . . . . . . . . . . . . . . . . . . . 89ITEM 12. Security Ownership of Certain Beneficial Owners and Management and Related Stockholder
Matters . . . . . . . . . . . . . . . . . . . . . . . . . . . . . . . . . . . . . . . . . . . . . . . . . . . . . . . . . . . . . . . . . . . . . . 89ITEM 13. Certain Relationships and Related Transactions, and Director Independence . . . . . . . . . . . . . . . . . . 89ITEM 14. Principal Accountant Fees and Services . . . . . . . . . . . . . . . . . . . . . . . . . . . . . . . . . . . . . . . . . . . . . . 89
PART IV
ITEM 15. Exhibits and Financial Statement Schedules . . . . . . . . . . . . . . . . . . . . . . . . . . . . . . . . . . . . . . . . . . . 90
SIGNATURES . . . . . . . . . . . . . . . . . . . . . . . . . . . . . . . . . . . . . . . . . . . . . . . . . . . . . . . . . . . . . . . . . . . . . . . . . . . . . . . . . 95
PART I
ITEM 1. Business.
General
We are a global security and aerospace company principally engaged in the research, design, development, manufacture,integration and sustainment of advanced technology systems, products and services. We also provide a broad range ofmanagement, engineering, technical, scientific, logistic, and information services. We serve both domestic and internationalcustomers with products and services that have defense, civil, and commercial applications, with our principal customersbeing agencies of the U.S. Government. In 2013, 82% of our $45.4 billion in net sales were from the U.S. Government, eitheras a prime contractor or as a subcontractor (including 61% from the Department of Defense (DoD)), 17% were frominternational customers (including foreign military sales (FMS) contracted through the U.S. Government), and 1% were fromU.S. commercial and other customers. Our main areas of focus are in defense, space, intelligence, homeland security, andinformation technology, including cyber security.
We are operating in an environment characterized by both increasing complexity in global security and continuingeconomic pressures in the U.S. and globally. A significant component of our strategy in this environment is to focus onprogram execution, improving the quality and predictability of the delivery of our products and services, and placing securitycapability quickly into the hands of both our domestic and international customers at affordable prices. Recognizing that ourcustomers are resource constrained, we are endeavoring to develop and extend our portfolio domestically in a disciplinedmanner with a focus on adjacent markets close to our core capabilities, as well as growing our international sales. Wecontinue to focus on affordability initiatives as demonstrated by our plan to close and consolidate several of our facilities aswe announced in November 2013. We also expect to continue to invest in technologies to fulfill new mission requirementsfor our customers, and invest in our people so that we have the technical skills necessary to succeed without limiting ourability to return cash to our investors in the form of dividends and share repurchases.
We operate in five business segments: Aeronautics, Information Systems & Global Solutions (IS&GS), Missiles andFire Control (MFC), Mission Systems and Training (MST), and Space Systems. We organize our business segments based onthe nature of the products and services offered.
Aeronautics
In 2013, our Aeronautics business segment generated net sales of $14.1 billion, which represented 31% of our totalconsolidated net sales. Aeronautics’ customers include the military services and various other government agencies of theU.S., and other countries. In 2013, U.S. Government customers accounted for 78% and international customers accounted for22% of Aeronautics’ net sales. Net sales from Aeronautics’ combat aircraft products and services represented 21% of ourtotal consolidated net sales in each of 2013 and 2012, and 20% of our total consolidated net sales in 2011.
Aeronautics is engaged in the research, design, development, manufacture, integration, sustainment, support, andupgrade of advanced military aircraft, including combat and air mobility aircraft, unmanned air vehicles, and relatedtechnologies. Aeronautics’ major programs include:
• F-35 Lightning II Joint Strike Fighter – international multi-role, multi-variant, fifth generation stealth fighter;• C-130 Hercules – international tactical airlifter;• F-16 Fighting Falcon – low-cost, combat-proven, international multi-role fighter;• F-22 Raptor – air dominance and multi-mission fifth generation stealth fighter; and• C-5M Super Galaxy – strategic airlifter.
The F-35 program is the largest in our corporation generating 16% of our total consolidated net sales, as well as 50% ofAeronautics’ net sales in 2013. The F-35 program consists of a development contract and multiple production contracts. Thedevelopment contract is being performed concurrent with the production contracts. Concurrent performance of developmentand production contracts is used for complex programs to test aircraft, shorten the time to field systems, and achieve overallcost savings. We expect the development portion of the F-35 program will be substantially complete in 2017, with lesssignificant efforts continuing into 2019. Production of the aircraft is expected to continue for many years given the U.S.Government’s current inventory objective of 2,443 aircraft for the Air Force, Marine Corps, and Navy; commitments fromour eight international partners and two international customers; as well as expressions of interest from other countries.During 2013, we delivered 35 aircraft to our domestic and international partners, resulting in total deliveries of 73 productionaircraft as of December 31, 2013. We have 93 production aircraft in backlog as of December 31, 2013, including orders fromour international partners. For additional information on the F-35 program, see “Status of the F-35 Program” inManagement’s Discussion and Analysis of Financial Condition and Results of Operations.
3
Aeronautics produces and provides support and sustainment services for the C-130J Super Hercules, as well as upgradesand support services for the legacy C-130 Hercules worldwide fleet. We delivered 25 C-130J aircraft in 2013, including sixto international customers, and our backlog extends through the middle of 2015. We currently have advanced funding fromthe U.S. Government for additional C-130J aircraft not currently in backlog.
Aeronautics currently produces F-16 aircraft for international customers. Aeronautics also provides service-life extension,modernization, and other upgrade programs for our customers’ F-16 aircraft. We delivered 13 F-16 aircraft in 2013, and ourbacklog extends through the middle of 2017.
While production and deliveries of F-22 aircraft were completed in 2012, Aeronautics continues to providemodernization and sustainment activities for the U.S. Air Force’s F-22 aircraft fleet. The modernization program comprisesupgrading existing systems requirements, developing new systems requirements, and adding capabilities and enhancing theperformance of the weapon systems. The sustainment program consists of sustaining the weapon systems of the F-22 fleet,providing training systems, customer support, integrated support planning, supply chain management, aircraft modificationsand heavy maintenance, systems engineering, and support products.
Aeronautics provides sustainment services for the existing U.S. Air Force C-5 Galaxy fleet and modernization activitiesto convert 49 C-5 Galaxy aircraft to the C-5M Super Galaxy configuration. These modernization activities include theinstallation of new engines, landing gear and systems, and other improvements that will enable a shorter takeoff, a higherclimb rate, an increased cargo load, and longer flight range. As of December 31, 2013, we had delivered 13 C-5M aircraftunder these modernization activities, including six C-5M aircraft delivered in 2013.
In addition to the above aircraft programs, Aeronautics is involved in advanced development programs incorporatinginnovative design and rapid prototype applications. Our Advanced Development Programs (ADP) organization, also knownas Skunk Works®, is focused on future systems, including unmanned aerial systems and next generation capabilities foradvanced strike, intelligence, surveillance, reconnaissance, situational awareness, and air mobility. We continue to exploretechnology advancement and insertion in our existing aircraft. We also are involved in numerous network-enabled activitiesthat allow separate systems to work together to increase effectiveness, and continue to invest in new technologies to maintainand enhance competitiveness in military aircraft design, development, and production.
Information Systems & Global Solutions
In 2013, our IS&GS business segment generated net sales of $8.4 billion, which represented 18% of our totalconsolidated net sales. IS&GS’ customers include the various government agencies of the U.S. and other countries, militaryservices, as well as commercial and other customers. In 2013, U.S. Government customers accounted for 93%, internationalcustomers accounted for 5%, and U.S. commercial and other customers accounted for 2% of IS&GS’ net sales. IS&GS hasbeen impacted by the continued downturn in federal information technology budgets.
IS&GS provides advanced technology systems and expertise, integrated information technology solutions, andmanagement services across a broad spectrum of applications for civil, defense, intelligence, and other governmentcustomers. In addition, IS&GS supports the needs of customers in data analytics, cyber security, air traffic management, andenergy demand management. IS&GS provides network-enabled situational awareness, delivers communications andcommand and control capability through complex mission solutions for defense applications, and integrates complex globalsystems to help our customers gather, analyze, and securely distribute critical intelligence data. Also, IS&GS is responsiblefor various classified systems and services in support of vital national security systems. While IS&GS has a portfolio ofmany smaller contracts as compared to our other business segments, this business segment’s major programs include:
• The Hanford Mission Support contract, a program to provide infrastructure and site support services to theDepartment of Energy.
• The Command, Control, Battle Management and Communications (C2BMC) contract, a program to increase theintegration of the Ballistic Missile Defense System for the U.S. Government.
• The En Route Automation Modernization (ERAM) contract, a program to replace the Federal AviationAdministration’s infrastructure with a modern automation environment that includes new functions andcapabilities.
• The Defense Information Systems Agency (DISA) – Global Information Grid Services Management-Operationscontract, a program to provide operations and maintenance to the DoD’s global data network.
• The National Science Foundation’s U.S. Antarctic Support program, which manages sites and equipment toenable universities, research institutions, and federal agencies to conduct scientific research in the Antarctic.
4
Missiles and Fire Control
In 2013, our MFC business segment generated net sales of $7.8 billion, which represented 17% of our total consolidatednet sales. MFC’s customers include the military services, principally the U.S. Army, and various government agencies of theU.S. and other countries, as well as commercial and other customers. In 2013, U.S. Government customers accounted for67% and international customers accounted for 33% of MFC’s net sales.
MFC provides air and missile defense systems; tactical missiles and air-to-ground precision strike weapon systems;logistics and other technical services; fire control systems; mission operations support, readiness, engineering support, andintegration services; and manned and unmanned ground vehicles. MFC’s major programs include:
• The Patriot Advanced Capability-3 (PAC-3) and Terminal High Altitude Area Defense (THAAD) air and missiledefense programs. PAC-3 is an advanced defensive missile for the U.S. Army and international customersdesigned to intercept and eliminate incoming airborne threats using kinetic energy. THAAD is a transportabledefensive missile system for the U.S. Government and international customers designed to engage targets bothwithin and outside of the Earth’s atmosphere.
• The Multiple Launch Rocket System (MLRS), Hellfire, Joint Air-to-Surface Standoff Missile (JASSM), andJavelin tactical missile programs. MLRS is a highly mobile, automatic system that fires surface-to-surfacerockets and missiles from the M270 and High Mobility Artillery Rocket System platforms produced for the U.S.Army and international customers. Hellfire is an air-to-ground missile used on rotary and fixed-wing aircraft,which is produced for the U.S. Army, Navy, Marine Corps, and international customers. JASSM is an air-to-ground missile launched from fixed-wing aircraft, which is produced for the U.S. Air Force and internationalcustomers. Javelin is a shoulder-fired anti-armor rocket system, which is produced for the U.S. Army, MarineCorps, and international customers.
• The Apache, Sniper®, and Low Altitude Navigation and Targeting Infrared for Night (LANTIRN®) fire controlsystems programs. The Apache fire control system provides weapons targeting capability for the Apachehelicopter for the U.S. Army and international customers. Sniper® is a targeting system for fixed-wing aircraft,and LANTIRN® is a combined navigation and targeting system for fixed-wing aircraft. Both Sniper® andLANTIRN® are produced for the U.S. Air Force and international customers.
• The Special Operations Forces Contractor Logistics Support Services program, which provides logistics supportservices to the special operations forces of the U.S. military.
• MFC’s technical services business provides a comprehensive portfolio of technical and sustainment services toenhance our customers’ mission success, with core markets in engineering services; global aviation solutions;command, control, communications, computers, intelligence, surveillance and reconnaissance (C4ISR) productsupport; counter threat services; and education and sustainment services.
Mission Systems and Training
In 2013, our MST business segment generated net sales of $7.1 billion, which represented 16% of our total consolidatednet sales. MST’s customers include the military services, principally the U.S. Navy, and various government agencies of theU.S. and other countries, as well as commercial and other customers. In 2013, U.S. Government customers accounted for75%, international customers accounted for 23%, and U.S. commercial and other customers accounted for 2% of MST’s netsales.
MST provides ship and submarine mission and combat systems; mission systems and sensors for rotary and fixed-wingaircraft; sea and land-based missile defense systems; radar systems; the Littoral Combat Ship (LCS); simulation and trainingservices; and unmanned systems and technologies. MST’s major programs include:
• The Aegis Combat System, a fleet ballistic missile defense system for the U.S. Navy and international customersand is also a sea-based element of the U.S. missile defense system.
• The LCS, a surface combatant for the U.S. Navy designed to operate in shallow waters.• MH-60 mission systems and sensors, including the digital cockpit and weapons, which MST provides for the
MH-60 maritime helicopter produced for the U.S. Navy and international customers.• The TPQ-53 Radar System, a sensor that quickly locates and neutralizes mortar and rocket threats, produced for
the U.S. Army and international customers.• The MK-41 Vertical Launching System (VLS), a shipborne missile canister launching system that provides
rapid-fire launch capability, produced for the U.S. Navy and international customers.
5
Space Systems
In 2013, our Space Systems business segment generated net sales of $8.0 billion, which represented 18% of our totalconsolidated net sales. Space Systems’ customers include various government agencies of the U.S. and commercialcustomers. In 2013, U.S. Government customers accounted for 98%, international customers accounted for 1%, and U.S.commercial and other customers accounted for 1% of Space Systems’ net sales. Net sales from Space Systems’ satelliteproducts and services represented 12% of our total consolidated net sales in each of 2013, 2012, and 2011.
Space Systems is engaged in the research and development, design, engineering, and production of satellites, strategicand defensive missile systems, and space transportation systems. Space Systems is also responsible for various classifiedsystems and services in support of vital national security systems. Space Systems’ major programs include:
• The Trident II D5 Fleet Ballistic Missile, a program with the U.S. Navy for the only current submarine-launchedintercontinental ballistic missile in production in the U.S.
• The Space Based Infrared System (SBIRS), which provides the U.S. Air Force with enhanced worldwide missilelaunch detection and tracking capabilities.
• The Advanced Extremely High Frequency (AEHF) system, the next generation of highly secure communicationssatellites for the U.S. Air Force.
• The Orion Multi-Purpose Crew Vehicle (Orion), a spacecraft for the National Aeronautics and SpaceAdministration (NASA) utilizing new technology for human exploration missions beyond low earth orbit.
• Global Positioning System (GPS) III, a program to modernize the GPS satellite system for the U.S. Air Force.• The Geostationary Operational Environmental Satellite R-Series (GOES-R), which is the National Oceanic and
Atmospheric Association’s next generation of meteorological satellites.• The Mobile User Objective System (MUOS), a next-generation narrow band satellite communication system for
the U.S. Navy.
Operating profit for our Space Systems business segment includes our share of earnings for our investment in UnitedLaunch Alliance, which provides expendable launch services to the U.S. Government.
Financial and Other Business Segment Information
For additional information regarding our business segments, including comparative segment net sales, operating profit,and related financial information for 2013, 2012, and 2011, see “Business Segment Results of Operations” in Management’sDiscussion and Analysis of Financial Condition and Results of Operations and “Note 4 – Information on Business Segments”of our consolidated financial statements.
Competition
Our broad portfolio of products and services competes both domestically and internationally against the products andservices of other large aerospace, defense, and information technology companies, as well as numerous smaller competitors,particularly in certain of our services businesses. We often form teams with other companies that are competitors in otherefforts to provide customers with the best mix of capabilities to address specific requirements. In some areas of our business,customer requirements are changing to encourage expanded competition, such as information technology contracts wherethere may be a wide range of small to large contractors bidding on procurements. Principal factors of competition include thevalue of our products and services to the customer; technical and management capability; the ability to develop andimplement complex, integrated system architectures; financing and total cost of ownership; our demonstrated ability toexecute and perform against contract requirements; and our ability to provide timely solutions.
The competition for international sales is subject to additional U.S. Government stipulations (e.g., export restrictions,market access, technology transfer, industrial cooperation, and contracting practices). We may compete against domestic andforeign companies (or teams) for contract awards by international governments. International competitions also may besubject to different laws or contracting practices of international governments that may affect how we structure our bid forthe procurement. In many international procurements, the purchasing government’s relationship with the U.S. and itsindustrial cooperation programs are also important factors in determining the outcome of a competition. It is common forinternational customers to require contractors to comply with their industrial cooperation regulations, sometimes referred toas offset requirements, and we have undertaken foreign offset agreements as part of securing some international business. Formore information concerning offset agreements, see “Contractual Commitments and Off-Balance Sheet Arrangements” inManagement’s Discussion and Analysis of Financial Condition and Results of Operations.
6
Patents
We routinely apply for and own a substantial number of U.S. and international patents related to the products andservices we provide. In addition to owning a large portfolio of intellectual property, we also license intellectual property toand from third parties. The U.S. Government has licenses in our patents that are developed in performance of governmentcontracts, and it may use or authorize others to use the inventions covered by our patents for government purposes.Unpatented research, development, and engineering skills also make an important contribution to our business. Although ourintellectual property rights in the aggregate are important to the operation of our business, we do not believe that any existingpatent, license, or other intellectual property right is of such importance that its loss or termination would have a materialadverse effect on our business taken as a whole.
Raw Materials and Seasonality
Certain of our products require relatively scarce raw materials. Historically, we have been successful in obtaining theraw materials and other supplies needed in our manufacturing processes. We seek to manage raw materials supply riskthrough long-term contracts and by maintaining a stock of key materials in inventory.
Aluminum and titanium are important raw materials used in certain of our Aeronautics and Space Systems programs.Long-term agreements have helped enable a continued supply of aluminum and titanium. Carbon fiber is an importantingredient in the composite material that is used in our Aeronautics programs, such as the F-35 aircraft. Aluminum lithium,which we use for F-16 aircraft structural components, is currently only available from limited sources. We have been advisedby some suppliers that pricing and the timing of availability of materials in some commodities markets can fluctuate widely.These fluctuations may negatively affect price and the availability of certain materials. While we do not anticipate materialproblems regarding the supply of our raw materials and believe that we have taken appropriate measures to mitigate thesevariations, if key materials become unavailable or if pricing fluctuates widely in the future, it could result in delay of one ormore of our programs, increased costs, or reduced profits.
No material portion of our business is considered to be seasonal. Various factors can affect the distribution of our salesbetween accounting periods, including the timing of government awards, the availability of government funding, productdeliveries, and customer acceptance.
Government Contracts and Regulations
Our business is heavily regulated. We contract with numerous U.S. Government agencies and entities, including allbranches of the U.S. military, the Departments of Defense, Homeland Security, Justice, Commerce, Health and HumanServices, Transportation, and Energy, the U.S. Postal Service, the Social Security Administration, the Federal AviationAdministration, NASA, and the U.S. Environmental Protection Agency. Similar government authorities exist in othercountries and regulate our international efforts.
We must comply with and are affected by laws and regulations relating to the formation, administration, andperformance of U.S. Government and other contracts. These laws and regulations, among other things:
• require certification and disclosure of all cost or pricing data in connection with certain types of contractnegotiations;
• impose specific and unique cost accounting practices that may differ from U.S. generally accepted accountingprinciples;
• impose acquisition regulations, which may change or be replaced over time, that define allowable andunallowable costs and otherwise govern our right to reimbursement under certain cost-based U.S. Governmentcontracts;
• require specific security controls to protect DoD controlled unclassified technical information and restrict the useand dissemination of information classified for national security purposes and the export of certain products,services, and technical data; and
• require the review and approval of contractor business systems, defined in the regulations as: (i) AccountingSystem; (ii) Estimating System; (iii) Earned Value Management System, for managing cost and scheduleperformance on certain complex programs; (iv) Purchasing System; (v) Material Management and AccountingSystem, for planning, controlling, and accounting for the acquisition, use, issuing, and disposition of material;and (vi) Property Management System.
7
The U.S. Government may terminate any of our government contracts and subcontracts either at its convenience or fordefault based on our performance. If a contract is terminated for convenience, we generally would be protected by provisionscovering reimbursement for costs incurred on the contract and profit on those costs. If a contract is terminated for default, wegenerally would be entitled to payments for our work that has been accepted by the U.S. Government, however, the U.S.Government could make claims to reduce the contract value or recover its procurement costs and could assess other specialpenalties. For more information regarding the U.S. Government’s right to terminate our contracts, see Item 1A – RiskFactors. For more information regarding government contracting laws and regulations, see Item 1A - Risk Factors as well as“Critical Accounting Policies – Contract Accounting / Sales Recognition” in Management’s Discussion and Analysis ofFinancial Condition and Results of Operations.
A portion of our business is classified by the U.S. Government and cannot be specifically described. The operatingresults of these classified programs are included in our consolidated financial statements. The business risks associated withclassified programs historically have not differed materially from those of our other U.S. Government programs. The internalcontrols addressing the financial reporting of classified programs are consistent with the internal control practices for non-classified contracts.
Our operations are subject to and affected by various federal, state, local, and foreign environmental protection laws andregulations regarding the discharge of materials into the environment or otherwise regulating the protection of theenvironment. While the extent of our financial exposure cannot in all cases be reasonably estimated, the costs ofenvironmental compliance have not had, and we do not expect that these costs will have, a material adverse effect on ourearnings, financial position, and cash flow, primarily because most of our environmental costs are allowable in establishingthe price of our products and services under our contracts with the U.S. Government. For information regarding thesematters, including current estimates of the amounts that we believe are required for remediation or cleanup to the extentprobable and estimable, see “Critical Accounting Policies – Environmental Matters” in Management’s Discussion andAnalysis of Financial Condition and Results of Operations and “Note 13 – Legal Proceedings, Commitments, andContingencies” of our consolidated financial statements. See also the discussion of environmental matters withinSection 1A - Risk Factors.
Backlog
At December 31, 2013, our backlog was $82.6 billion compared with $82.3 billion at December 31, 2012. Backlog isconverted into sales in future periods as work is performed or deliveries are made. Approximately $35.4 billion, or 43%, ofour backlog at December 31, 2013 is expected to be converted into sales in 2014.
Our backlog includes both funded (firm orders for our products and services for which funding has been both authorizedand appropriated by the customer – Congress, in the case of U.S. Government agencies) and unfunded (firm orders for whichfunding has not been appropriated) amounts. We do not include unexercised options or potential indefinite-delivery,indefinite-quantity orders in our backlog. If any of our contracts with firm orders were to be terminated, our backlog wouldbe reduced by the expected value of the unfilled orders of such contracts. Funded backlog was $55.0 billion at December 31,2013, as compared to $54.8 billion at December 31, 2012. For backlog related to each of our business segments, see“Business Segment Results of Operations” in Management’s Discussion and Analysis of Financial Condition and Results ofOperations.
Research and Development
We conduct research and development activities under customer-sponsored contracts and with our own independentresearch and development funds. Our independent research and development costs include basic research, applied research,development, systems, and other concept formulation studies. Generally, these costs are allocated among all contracts andprograms in progress under U.S. Government contractual arrangements. Costs we incur under customer-sponsored researchand development programs pursuant to contracts are included in net sales and cost of sales. Under certain arrangements inwhich a customer shares in product development costs, our portion of the unreimbursed costs is expensed as incurred in costof sales. Independent research and development costs charged to cost of sales were $697 million in 2013, $616 million in2012, and $585 million in 2011. See “Research and development and similar costs” in “Note 1 – Significant AccountingPolicies” of our consolidated financial statements.
Employees
At December 31, 2013, we had approximately 115,000 employees, about 95% of whom were located in the U.S.Approximately 15% of our employees are covered by any one of approximately 60 separate collective bargaining agreements
8
with various unions. A number of our existing collective bargaining agreements expire in any given year. Historically, wehave been successful in negotiating renewals to expiring agreements without any material disruption of operating activities.Management considers employee relations to be good.
Available Information
We are a Maryland corporation and were formed in 1995 by combining the businesses of Lockheed Corporation andMartin Marietta Corporation. Our principal executive offices are located at 6801 Rockledge Drive, Bethesda, Maryland20817. Our telephone number is (301) 897-6000 and our website home page on the Internet is www.lockheedmartin.com.We make our website content available for information purposes only. It should not be relied upon for investment purposes,nor is it incorporated by reference into this Annual Report on Form 10-K (Form 10-K).
Throughout this Form 10-K, we incorporate by reference information from parts of other documents filed with the U.S.Securities and Exchange Commission (SEC). The SEC allows us to disclose important information by referring to it in thismanner, and you should review that information.
Our annual reports on Form 10-K, quarterly reports on Form 10-Q, current reports on Form 8-K, proxy statements forour annual stockholders’ meetings, and amendments to those reports are available free of charge on our website,www.lockheedmartin.com/investor, as soon as reasonably practical after we electronically file the material with, or furnish itto the SEC. In addition, copies of our annual report will be made available, free of charge, upon written request. The SECalso maintains a website at www.sec.gov that contains reports, proxy statements, and other information regarding SECregistrants, including Lockheed Martin Corporation.
Forward-Looking Statements
This Form 10-K contains statements which, to the extent that they are not recitations of historical fact, constituteforward-looking statements within the meaning of the federal securities laws, and are based on our current expectations andassumptions. The words “believe,” “estimate,” “anticipate,” “project,” “intend,” “expect,” “plan,” “outlook,” “scheduled,”“forecast,” and similar expressions are intended to identify forward-looking statements. These statements are not guaranteesof future performance and are subject to risks and uncertainties.
Statements and assumptions with respect to future sales, income and cash flows, program performance, the outcome oflitigation, environmental remediation cost estimates, and planned acquisitions or dispositions of assets are examples offorward-looking statements. Numerous factors, including potentially the risk factors described in the following section, couldaffect our forward-looking statements and actual performance.
Our actual financial results likely will be different from those projected due to the inherent nature of projections. Giventhese uncertainties, the forward-looking statements should not be relied on in making investment decisions. The forward-looking statements contained in this Form 10-K speak only as of the date of its filing. Except where required by applicablelaw, we expressly disclaim a duty to provide updates to forward-looking statements after the date of this Form 10-K to reflectsubsequent events, changed circumstances, changes in expectations, or the estimates and assumptions associated with them.The forward-looking statements in this Form 10-K are intended to be subject to the safe harbor protection provided by thefederal securities laws.
ITEM 1A. Risk Factors.
An investment in our common stock or debt securities involves risks and uncertainties. We seek to identify, manage, andmitigate risks to our business, but risk and uncertainty cannot be eliminated or necessarily predicted. You should carefullyconsider the following factors, in addition to the other information contained in this Annual Report on Form 10-K, beforedeciding to purchase our common stock or debt securities.
We depend heavily on contracts with the U.S. Government.
We derived 82% of our consolidated net sales from the U.S. Government in 2013, including 61% from the Departmentof Defense (DoD). We expect to continue to derive most of our sales from work performed under U.S. Governmentcontracts. Those contracts are conditioned upon the continuing availability of Congressional appropriations. Congress usuallyappropriates funds on a fiscal-year basis even though contract performance may extend over many years. Consequently,contracts are often partially funded initially and additional funds are committed only as Congress makes furtherappropriations. If we incur costs in excess of funds obligated on a contract, we may be at risk for reimbursement of thosecosts unless and until additional funds are obligated to the contract.
9
The programs in which we participate must compete with other programs and policy imperatives for considerationduring the budget and appropriation process. Concerns about increased deficit spending, along with continued economicchallenges, continue to place pressure on U.S. and international customer budgets. While we believe that our programs arewell aligned with national defense and other priorities, shifts in domestic and international spending and tax policy, changesin security, defense, and intelligence priorities, the affordability of our products and services, general economic conditionsand developments, and other factors may affect a decision to fund or the level of funding for existing or proposed programs.
The Budget Control Act of 2011 (Budget Control Act) established limits on discretionary spending, which provided forreductions to planned defense spending of $487 billion over a 10 year period that began with government fiscal year (GFY)2012 (a U.S. Government fiscal year starts on October 1 and ends on September 30). The Budget Control Act also providedfor additional automatic spending reductions, known as sequestration, which went into effect on March 1, 2013, that wouldreduce planned defense spending by another $500 billion over a nine-year period that began in GFY 2013. These additionalspending reductions are arbitrary as they would be applied across-the-board to numerous programs and contracts withoutregard to national priorities. While the defense budget will sustain the largest single reduction, other civil agencies andprograms are also impacted by significant spending reductions. In light of the Budget Control Act and deficit reductionpressures, it is likely that discretionary spending by the U.S. Government will remain constrained for a number of years.
For GFY 2013, which ended on September 30, 2013, sequestration resulted in a $37 billion reduction to the defensebudget in addition to reductions as a result of the discretionary spending limits already imposed under the Budget ControlAct. The impacts of sequestration in GFY 2013 were less than originally expected due to congressional actions that reducedthe cuts as well as the DoD’s ability to allocate a portion of the reductions to prior year unobligated balances and multi-yearinvestment appropriations. Accordingly, we have experienced minimal impacts to date.
In December 2013, Congress and the Administration enacted the Bipartisan Budget Act of 2013 (Bipartisan BudgetAct). Notably, the Bipartisan Budget Act increased the limits on discretionary spending for GFY 2014 and GFY 2015imposed by the Budget Control Act, among other fiscal changes. In particular, the Bipartisan Budget Act allows forapproximately $63 billion of additional funding, including approximately $22 billion and $9 billion for defense spendingduring GFY 2014 and GFY 2015, respectively, and similar amounts for nondefense programs over the same period. Therevised defense spending limits are set at approximately $520 billion for GFY 2014 and approximately $521 billion for GFY2015. This agreement allows for more certainty in the budget planning process and provides the DoD the flexibility to betteraddress its priorities. However, the Bipartisan Budget Act retains the lower spending limits, including the across-the-boardspending reduction methodology, for GFYs 2016 through 2021 as provided for in the Budget Control Act. As a result, thereremains uncertainty regarding how sequester cuts beyond GFY 2015 will be applied as the DoD and other agencies may havesignificantly less flexibility regarding how to allocate cuts in future years. While we have not yet seen the specific budgetallocations by program, we continue to believe that our portfolio of products will continue to be well supported in astrategically focused allocation of budget resources.
While the recent budget actions provide a more measured and strategic approach to addressing the U.S. Government’sfiscal challenges, sequestration remains a long-term concern. If not further modified, sequestration could have significantnegative impacts on our industry and company in future periods. There may be disruption of ongoing programs, impacts toour supply chain, contractual actions (including partial or complete terminations), potential facilities closures, and thousandsof personnel reductions across the industry that will severely impact advanced manufacturing operations and engineeringexpertise, and accelerate the loss of skills and knowledge. Sequestration, or other budgetary cuts in lieu of sequestration,could have a material negative effect on our company as would any failure to address issues raised by the debt ceiling.Additionally, we are seeking to lessen our dependence on contracts with the U.S. Government by focusing on expanding intoadjacent markets close to our core capabilities and growing international sales but may not be successful in this strategy. Inresponse to continued declines in U.S. Government spending as well as the rapidly changing competitive and economiclandscape, in November 2013 we announced a plan to close and consolidate several of our facilities and reduce ourworkforce by approximately 4,000 positions. We expect these facility closures and workforce reductions will be substantiallycomplete by the middle of 2015; see more information in “Note 2 – Restructuring Charges” of our consolidated financialstatements. Further actions as described above may be necessary in future periods and could result in severance and othercharges that may have an adverse impact on our results of operations. For more information regarding U.S. Governmentbudget pressures, see “Industry Considerations” in Management’s Discussion and Analysis of Financial Condition andResults of Operations.
Under such conditions, large or complex programs, which consist of multiple contracts and phases, are potentiallysubject to increased scrutiny. Our largest program, the F-35, represented 16% of our total consolidated net sales in 2013, andis expected to represent a higher percentage of our sales in future years. A decision to cut spending or reduce planned orders
10
could have an adverse impact on our results of operations. For more information regarding the F-35 program, see “Status ofthe F-35 Program” in Management’s Discussion and Analysis of Financial Condition and Results of Operations.
Based upon our diverse range of defense, homeland security, and information technology products and services, webelieve that this makes it less likely that cuts in any specific contract or program will have a long-term effect on our business.However, termination of multiple or large programs or contracts could adversely affect our business and future financialperformance. We could incur expenses beyond those that would be reimbursed if one or more of our existing contracts wereterminated for convenience due to lack of funding or other reasons. Potential changes in funding priorities may afford new oradditional opportunities for our businesses in terms of existing, follow-on, or replacement programs. While we would expectto compete, and be well positioned as the incumbent on existing programs, we may not be successful, or the replacementprograms may be funded at lower levels.
On January 17, 2014, the U.S. Government passed its GFY 2014 budget to finance all activities through September 30,2014, the end of its current fiscal year, after operating under continuing resolution temporary funding measures fromOctober 1, 2013 to January 18, 2014. The budget provides discretionary defense spending at levels consistent with theplanned defense spending limits in the Bipartisan Budget Act and eliminated much of the uncertainty and inefficiency inprocuring products and services under the continuing resolution. In years when the U.S. Government does not complete itsbudget process before the end of its fiscal year, government operations typically are funded through a continuing resolutionthat authorizes agencies of the U.S. Government to continue to operate, but does not authorize new spending initiatives.When the U.S. Government operates under a continuing resolution, delays can occur in contract awards due to lack offunding. Historically, this has not had a material effect on our business. Should a continuing resolution be used to fund U.S.Government Operations after GFY 2014 or decisions regarding sequestration remain pending, it may cause additionalgovernment contract awards to be delayed, canceled, or funded at lower levels and cause our results of operations to varybetween periods. In some circumstances, we may continue to work without funding, and use our funds, in order to meet ourcustomer’s desired delivery dates for products or services. Such funds could be at risk if the U.S. Government does notprovide authorization and additional funding to our programs.
We are subject to a number of procurement laws and regulations. Our business and our reputation could be adverselyaffected if we fail to comply with these laws.
We must comply with and are affected by laws and regulations relating to the award, administration, and performance ofU.S. Government contracts. Government contract laws and regulations affect how we do business with our customers andimpose certain risks and costs on our business. A violation of specific laws and regulations could harm our reputation andresult in the imposition of fines and penalties, the termination of our contracts, suspension or debarment from bidding on orbeing awarded contracts, loss of our ability to export products or services, and civil or criminal investigations or proceedings.
In some instances, these laws and regulations impose terms or rights that are different than those typically found incommercial transactions. For example, the U.S. Government may terminate any of our government contracts andsubcontracts either at its convenience or for default based on our performance. Upon termination for convenience of a fixed-price type contract, we normally are entitled to receive the purchase price for delivered items, reimbursement for allowablecosts for work-in-process, and an allowance for profit on the contract or adjustment for loss if completion of performancewould have resulted in a loss.
Upon termination for convenience of a cost-reimbursable contract, we normally are entitled to reimbursement ofallowable costs plus a portion of the fee. Allowable costs would include our cost to terminate agreements with our suppliersand subcontractors. The amount of the fee recovered, if any, is related to the portion of the work accomplished prior totermination and is determined by negotiation. We attempt to ensure that adequate funds are available by notifying thecustomer when its estimated costs, including those associated with a possible termination for convenience, approach levelsspecified as being allotted to its programs. As funds are typically appropriated on a fiscal-year basis and as the costs of atermination for convenience may exceed the costs of continuing a program in a given fiscal year, occasionally programs donot have sufficient funds appropriated to cover the termination costs were the government to terminate them for convenience.Under such circumstances, the U.S. Government could assert that it is not required to appropriate additional funding.
A termination arising out of our default may expose us to liability and have a material adverse effect on our ability tocompete for future contracts and orders. In addition, on those contracts for which we are teamed with others and are not theprime contractor, the U.S. Government could terminate a prime contract under which we are a subcontractor,notwithstanding the quality of our services as a subcontractor. In the case of termination for default, the U.S. Governmentcould make claims to reduce the contract value or recover its procurement costs and could assess other special penalties.However, under such circumstances we have rights and remedial actions under laws and the Federal Acquisition Regulations(FAR).
11
In addition, certain of our U.S. Government contracts span one or more base years and multiple option years. The U.S.Government generally has the right not to exercise option periods and may not exercise an option period for various reasons.However, the U.S. Government may exercise option periods, even for contracts for which it is expected that our costs mayexceed the contract price or ceiling.
U.S. Government agencies, including the Defense Contract Audit Agency, the Defense Contract Management Agency,and various agency Inspectors General, routinely audit and investigate government contractors. These agencies review acontractor’s performance under its contracts, its cost structure, its business systems, and compliance with applicable laws,regulations, and standards. Any costs found to be misclassified may be subject to repayment. We have unaudited and/orunsettled incurred cost claims related to past years, which places risk on our ability to issue final billings on contracts forwhich authorized and appropriated funds may be expiring.
Certain deficiencies identified during government audits of contractor business systems may result in the governmentwithholding payments on our billings. Such deficiencies have not impacted our internal control over financial reporting.Withholding payments on billings are capped at 5% of billings when deficiencies impact a single business system and 10%when deficiencies impact multiple systems. Such withholdings are typically reduced to 2% after the contractor’s correctiveaction plan has been accepted and progress to implement the corrective actions has been demonstrated, and are withdrawnupon satisfactory completion and verification of the corrective action plan.
If an audit or investigation uncovers improper or illegal activities, we may be subject to civil or criminal penalties andadministrative sanctions, including reductions of the value of contracts, contract modifications or terminations, forfeiture ofprofits, suspension of payments, penalties, fines, and suspension or prohibition from doing business with the U.S.Government. In addition, we could suffer serious reputational harm if allegations of impropriety were made against us.Similar government oversight exists in most other countries where we conduct business.
Our profitability and cash flow may vary based on the mix of our contracts and programs, our performance, ourability to control costs, and evolving U.S. Government procurement policies.
Our profitability and cash flow may vary materially depending on the types of long-term government contractsundertaken, the nature of the products produced or services performed under those contracts, the costs incurred in performingthe work, the achievement of other performance objectives, and the stage of performance at which the right to receive fees isdetermined, particularly under award and incentive-fee contracts.
Our backlog includes a variety of contract types which are intended to address changing risk and reward profiles as aprogram matures. Contract types include cost-reimbursable, fixed-price incentive-fee, fixed-price, and time-and-materialscontracts. Contracts for development programs with complex design and technical challenges are typically cost-reimbursable.Under cost-reimbursable contracts, we are reimbursed for allowable costs and paid a fee, which may be fixed orperformance-based. In these cases, the associated financial risks primarily relate to a reduction in fees, and the program couldbe cancelled if cost, schedule, or technical performance issues arise.
Other contracts in backlog are for the transition from development to production (e.g., low-rate initial production (LRIP)contracts), which includes the challenge of starting and stabilizing a manufacturing production and test line while the finaldesign is being validated. These generally are cost-reimbursable or fixed-price incentive-fee contracts. Under a fixed-priceincentive-fee contract, the allowable costs incurred are eligible for reimbursement, but are subject to a cost-sharearrangement, which affects profitability. Generally, if our costs exceed the contract target cost or are not allowable under theapplicable regulations, we may not be able to obtain reimbursement for all costs and may have our fees reduced oreliminated.
There are also contracts for production as well as operations and maintenance of the delivered products that have thechallenge of achieving a stable production and delivery rate, while maintaining operability of the product after delivery.These contracts are mainly fixed-price, although some operations and maintenance contracts are time-and-materials type.Under fixed-price contracts, we receive a fixed price regardless of the actual costs we incur. We have to absorb any costs inexcess of the fixed price. Under time-and-materials contracts, we are paid for labor at negotiated hourly billing rates and forcertain expenses.
The failure to perform to customer expectations and contract requirements may result in reduced fees or losses and affectour financial performance in that period. Under each type of contract, if we are unable to control costs, our operating resultscould be adversely affected, particularly if we are unable to justify an increase in contract value to our customers. Costoverruns or the failure to perform on existing programs also may adversely affect our ability to retain existing programs andwin future contract awards.
12
The U.S. Government is currently pursuing and implementing policies that could negatively impact our profitability.Changes in procurement policy favoring more incentive-based fee arrangements, different award fee criteria, or governmentcontract negotiation offers that indicate what our costs should be may affect the predictability of our profit rates. Ourcustomers are subject to pressures that may result in a change in contract types referenced above earlier in a program’smaturity than is traditional. An example of this is the use of fixed-price incentive-fee contracts for recent LRIP contracts onthe F-35 program while the development contract is being performed concurrently. Our customers may also pursue non-traditional contract provisions in negotiation of contracts. For example, changes resulting from the F-35 developmentcontract may need to be implemented on the production contracts, a concept referred to as concurrency, which may requireus to pay for a portion of the concurrency costs. Other examples include, but are not limited to, the U.S. Government incertain circumstances requiring that bid and proposal costs be included in general and administrative costs, rather thancharged directly to contracts, and the U.S. Government enacting legislation that will decrease the level of allowableemployee compensation, which will reduce our operating profit.
Other policies could negatively impact our working capital and cash flow. For example, the government has expressed apreference for requiring progress payments rather than performance based payments on new fixed-price contracts, which ifimplemented, delays our ability to recover a significant amount of costs incurred on a contract and thus affects the timing ofour cash flows.
Increased competition and bid protests in a budget-constrained environment may make it more difficult to maintainour financial performance.
We are facing increased competition, particularly in information technology and cyber security at our InformationSystems & Global Solutions business segment, from non-traditional competitors outside of the aerospace and defenseindustry, in addition to our customers determining to source work internally rather than hiring a contractor. At the same time,our customers are facing budget constraints, trying to do more with less by cutting costs, identifying more affordablesolutions, and reducing product development cycles. In international sales, we face substantial competition from bothdomestic manufacturers and foreign manufacturers whose governments sometimes provide research and developmentassistance, marketing subsidies, and other assistance for their products. Additionally, our competitors are also focusing onincreasing their international sales to partially mitigate the effect of reduced U.S. Government budgets. To remaincompetitive, we consistently must provide superior performance, advanced technology solutions, and service at an affordablecost and with the agility that our customers require to satisfy their mission objectives.
As a leader in defense and global security, we have a large number of programs for which we are the incumbentcontractor. A substantial portion of our business is awarded through competitive bidding. The U.S. Government increasinglyhas relied upon competitive contract award types, including indefinite-delivery, indefinite-quantity, GSA Schedule, and othermulti-award contracts, which has the potential to create pricing pressure and increase our cost by requiring that we submitmultiple bids and proposals. In addition, multi-award contracts require that we make sustained efforts to obtain task ordersunder the contract. The competitive bidding process entails substantial costs and managerial time to prepare bids andproposals for contracts that may not be awarded to us or may be split among competitors. Following award, we mayencounter significant expenses, delays, contract modifications, or bid protests from unsuccessful bidders on new programawards. Bid protests could result in significant expenses to us, contract modifications or even loss of the contract award.Even where a bid protest does not result in the loss of a contract award, the resolution can extend the time until the contractactivity can begin and, therefore, delay our recognizing sales.
We are the prime contractor on most of our contracts and if our subcontractors, suppliers, or teaming agreement orventure partners fail to perform their obligations, our performance and our ability to win future business could beharmed.
For most of our contracts we rely on other companies to provide materials, major components, and products, and toperform a portion of the services that we provide to our customers. Such arrangements may involve subcontracts, teamingarrangements, ventures, or supply agreements with other companies upon which we rely (contracting parties). There is a riskthat we may have disputes with our contracting parties, including disputes regarding the quality and timeliness of workperformed, the workshare provided to that party, customer concerns about the other party’s performance, our failure toextend existing task orders or issue new task orders, or our hiring of the personnel of a subcontractor, teammate, or venturepartner, or vice versa. In addition, changes in the economic environment, including defense budgets and constraints onavailable financing, may adversely affect the financial stability of our contracting parties and their ability to meet theirperformance requirements or to provide needed supplies on a timely basis. A failure by one or more of our contracting partiesto provide the agreed-upon supplies or perform the agreed-upon services on a timely basis may affect our ability to perform
13
our obligations and require that we transition the work to other companies. Contracting party performance deficiencies mayaffect our operating results and could result in a customer terminating our contract for default. A default termination couldexpose us to liability and affect our ability to compete for future contracts and orders. Additionally, our efforts to increase theefficiency of our operations and improve the affordability of our products and services could negatively impact our ability toattract and retain suppliers.
International sales may pose different risks.
In 2013, 17% of our net sales were from international customers. We have a strategy to grow international sales over thenext several years, inclusive of sales of F-35 aircraft to our international partners and other countries. International sales aresubject to numerous political and economic factors, regulatory requirements, significant competition, and other risksassociated with doing business in foreign countries. Our exposure to such risks may increase if our international sales growas we anticipate.
Our international business is conducted through foreign military sales (FMS) contracted through the U.S. Government ordirect commercial sales (DCS) with international customers. In 2013, approximately half of our sales to internationalcustomers were FMS while the other half were DCS. These transaction types differ as FMS transactions represent sales bythe U.S. Government to international governments and our contract with the U.S. Government is subject to FAR. By contrast,DCS transactions represent sales by us directly to another government or international customer. All sales to internationalcustomers are subject to U.S. and foreign laws and regulations, including, without limitation, regulations relating to import-export control, technology transfer restrictions, taxation, repatriation of earnings, exchange controls, the Foreign CorruptPractices Act and other anti-corruption laws, and the anti-boycott provisions of the U.S. Export Administration Act. Wefrequently team with international subcontractors and suppliers who are also exposed to similar risks. While we havestringent policies in place to comply with such laws and regulations, failure by us, our employees, or others working on ourbehalf to comply with these laws and regulations could result in administrative, civil, or criminal liabilities, includingsuspension, proposed debarment, or debarment from bidding for or performing government contracts or suspension of ourexport privileges, which could have a material adverse effect on us.
While international sales, whether contracted as FMS or DCS, present risks that are different, and potentially greater,than those encountered in our domestic business, DCS with international customers may impose even greater risks as suchtransactions involve commercial relationships with parties with whom we have less familiarity and where there may besignificant cultural differences. Additionally, international procurement rules and regulations, contract laws and regulations,and contractual terms differ from those in the U.S., are less familiar to us, may be interpreted differently by foreign courts,are officially documented in the local language and, therefore, potentially subject to errors in translation, and frequently haveterms less favorable to us than the FAR. Export and import, tax, and currency risk may also be increased for DCS withinternational customers. While these risks are potentially greater than those encountered in our domestic business, our profitmargins are typically higher on DCS with international customers.
Our international business is highly sensitive to changes in regulations, political environments, or security risks that mayaffect our ability to conduct business outside of the U.S., including those regarding investment, procurement, taxation, andrepatriation of earnings. Our international business may also be impacted by changes in foreign national priorities andgovernment budgets and may be further impacted by global economic conditions and fluctuations in foreign currencyexchange rates. Sales of military products are also affected by defense budgets and U.S. foreign policy. Additionally, thetiming of orders from our international customers can be less predictable than for our domestic customers and may lead tofluctuations in the amount reported each year for our international sales.
In conjunction with defense procurements, some international customers require contractors to provide additionalincentives or to comply with industrial cooperation regulations, including entering into industrial cooperation agreements,sometimes referred to as offset agreements. Offset agreements may require in-country purchases, technology transfers, localmanufacturing support, and financial support projects as an incentive, or as a condition to a contract award. In somecountries, these offset agreements may require the establishment of a venture with a local company, which must control theventure. In these and other situations, Lockheed Martin could be liable for violations of law for actions taken by these entitiessuch as laws related to anti-corruption, import and export, anti-boycott restrictions, or local laws with which we are notfamiliar. Offset agreements generally extend over several years and may provide for penalties in the event we fail to performin accordance with the offset requirements which are typically subjective and can be outside our control.
Our business involves significant risks and uncertainties that may not be covered by indemnity or insurance.
A significant portion of our business relates to designing, developing, and manufacturing advanced defense andtechnology products and systems. New technologies may be untested or unproven. Failure of some of these products and
14
services could result in extensive loss of life or property damage. Accordingly, we also may incur liabilities that are unique toour products and services, including combat and air mobility aircraft, missile and space systems, command and controlsystems, air traffic control management systems, cyber security, homeland security, and training programs. In some, but notall circumstances, we may be entitled to certain legal protections or indemnifications from our customers, either through U.S.Government indemnifications under Public Law 85-804, qualification of our products and services by the Department ofHomeland Security under the SAFETY Act provisions of the Homeland Security Act of 2002, contractual provisions, orotherwise. We endeavor to obtain insurance coverage from established insurance carriers to cover these risks and liabilities.The amount of insurance coverage that we maintain may not be adequate to cover all claims or liabilities, existing coveragemay be cancelled while we remain exposed to the risk, and it is not possible to obtain insurance to protect against alloperational risks and liabilities. For example, we are limited in the amount of insurance we can obtain to cover certain naturalhazards such as earthquakes, and we have significant operations in geographic areas prone to this risk, such as Sunnyvale,California. Even if insurance coverage is available, we may not be able to obtain it at a price or on terms acceptable to us.Additionally, disputes with insurance carriers over coverage terms or the insolvency of one or more of our insurance carriersmay significantly affect the amount or timing of our cash flows.
Substantial costs resulting from an accident, failure of or defect in our products or services, natural catastrophe, or otherincident, or liability arising from our products and services in excess of any legal protection, indemnity and our insurancecoverage (or for which indemnity or insurance is not available or not obtained) could adversely impact our financialcondition, cash flows, or operating results. Any accident or failure of or defect in our products or services, even if fullyindemnified or insured, could negatively affect our reputation among our customers and the public, and make it moredifficult for us to compete effectively. It also could affect the cost and availability of adequate insurance in the future.
Pension funding and costs are dependent on several economic assumptions which if changed may cause our futureearnings and cash flow to fluctuate significantly as well as affect the affordability of our products and services.
Many of our employees are covered by defined benefit pension plans, and we provide certain health care and lifeinsurance benefits to eligible retirees. The impact of these plans on our U.S. generally accepted accounting principles(GAAP) earnings may be volatile in that the amount of expense we record for our postretirement benefit plans maymaterially change from year to year because those calculations are sensitive to funding levels as well as changes in severalkey economic assumptions, including interest rates, rates of return on plan assets, and other actuarial assumptions includingparticipant mortality estimates, expected rates of increase in future compensation levels and employee turnover. Changes inthese factors also affect our plan funding, cash flow, and stockholders’ equity. In addition, the funding of our plans andrecovery of costs on our contracts, as described below, may also be subject to changes caused by legislative or regulatoryactions.
With regard to cash flow, in the past few years we have made substantial cash contributions to our plans in excess of theamounts required by the Employee Retirement Income Security Act of 1974 (ERISA), as amended by the Pension ProtectionAct of 2006 (PPA). We generally are able to recover these contributions related to our plans as allowable costs on our U.S.Government contracts, including FMS, but there is a lag between when we contribute cash to our plans under pensionfunding rules and recover it under U.S. Government Cost Accounting Standards (CAS). Effective February 2012, the CASrules were revised to harmonize the measurement and period assignment of the pension cost allocable to governmentcontracts with the PPA (CAS Harmonization). In 2013, the cost impact of CAS Harmonization started being phased in withthe goal of better aligning the CAS cost and ERISA funding requirements being fully achieved in 2017.
For more information on how these factors could impact earnings, financial position, cash flow and stockholders’ equity,see “Critical Accounting Policies – Postretirement Benefit Plans” in Management’s Discussion and Analysis of FinancialConditions and Results of Operations and “Note 10 – Postretirement Plans” of our consolidated financial statements.
If we fail to manage acquisitions, divestitures, and other transactions successfully, our financial results, business, andfuture prospects could be harmed.
In pursuing our business strategy, we routinely conduct discussions, evaluate targets, and enter into agreementsregarding possible acquisitions, divestitures, ventures, and equity investments. We seek to identify acquisition or investmentopportunities that will expand or complement our existing products and services, or customer base, at attractive valuations.We often compete with others for the same opportunities. To be successful, we must conduct due diligence to identifyvaluation issues and potential loss contingencies, negotiate transaction terms, complete and close complex transactions,integrate acquired companies and employees, and realize anticipated operating synergies efficiently and effectively.
15
Acquisition, divestiture, venture, and investment transactions often require substantial management resources and have thepotential to divert our attention from our existing business. Unidentified pre-closing liabilities could affect our futurefinancial results.
Ventures or equity investments operate under shared control with other parties. Under the equity method of accountingfor nonconsolidated ventures and investments, we recognize our share of the operating profit of these ventures in our resultsof operations. Our operating results may be affected by the performance of businesses over which we do not exercise control.The most significant impact of our equity investments is in our Space Systems business segment where approximately 29%of its 2013 operating profit was derived from its share of earnings from equity method investees.
Our business could be negatively affected by cyber or other security threats or other disruptions.
As a U.S. defense contractor, we face cyber threats, insider threats, threats to the physical security of our facilities andemployees, and terrorist acts, as well as the potential for business disruptions associated with information technologyfailures, natural disasters, or public health crises.
We routinely experience cyber security threats, threats to our information technology infrastructure and unauthorizedattempts to gain access to our company sensitive information, as do our customers, suppliers, subcontractors and venturepartners. We may experience similar security threats at customer sites that we operate and manage as a contractualrequirement.
Prior cyber attacks directed at us have not had a material impact on our financial results, and we believe our threatdetection and mitigation processes and procedures are adequate. The threats we face vary from attacks common to mostindustries to more advanced and persistent, highly organized adversaries who target us because we protect national securityinformation. If we are unable to protect sensitive information, our customers or governmental authorities could question theadequacy of our threat mitigation and detection processes and procedures. Due to the evolving nature of these securitythreats, however, the impact of any future incident cannot be predicted.
Although we work cooperatively with our customers, suppliers, subcontractors, venture partners, and acquisitions toseek to minimize the impact of cyber threats, other security threats or business disruptions, we must rely on the safeguardsput in place by these entities, which may affect the security of our information. These entities have varying levels of cybersecurity expertise and safeguards and their relationships with government contractors, such as Lockheed Martin, mayincrease the likelihood that they are targeted by the same cyber threats we face.
The costs related to cyber or other security threats or disruptions may not be fully insured or indemnified by othermeans. Additionally, some cyber technologies we develop, particularly those related to homeland security, may raisepotential liabilities related to intellectual property and civil liberties, including privacy concerns, which may not be fullyinsured or indemnified by other means. Occurrence of any of these events could adversely affect our internal operations, theservices we provide to our customers, our future financial results, our reputation or our stock price; or such events couldresult in the loss of competitive advantages derived from our research and development efforts or other intellectual property,early obsolescence of our products and services, or contractual penalties.
Environmental costs could affect our future earnings as well as the affordability of our products and services.
Our operations are subject to and affected by a variety of federal, state, local, and foreign environmental protection lawsand regulations. We are involved in environmental responses at some of our facilities and former facilities, and at third-partysites not owned by us where we have been designated a potentially responsible party by the U.S. Environmental ProtectionAgency or by a state agency. In addition, we could be affected by future regulations imposed in response to concerns overclimate change, other aspects of the environment, or natural resources. We have an ongoing comprehensive program toreduce the effects of our operations on the environment.
We manage various government-owned facilities on behalf of the government. At such facilities, environmentalcompliance and remediation costs historically have been the responsibility of the government, and we have relied, andcontinue to rely with respect to past practices, upon government funding to pay such costs. Although the government remainsresponsible for capital and operating costs associated with environmental compliance, responsibility for fines and penaltiesassociated with environmental noncompliance typically are borne by either the government or the contractor, depending onthe contract and the relevant facts. Some environmental laws include criminal provisions. An environmental law convictioncould affect our ability to be awarded future, or perform existing, U.S. Government contracts.
16
We have incurred and will continue to incur liabilities under various federal, state, local, and foreign statutes forenvironmental protection and remediation. The extent of our financial exposure cannot in all cases be reasonably estimated atthis time. Among the variables management must assess in evaluating costs associated with these cases and remediation sitesgenerally are the status of site assessment, extent of the contamination, impacts on natural resources, changing cost estimates,evolution of technologies used to remediate the site, and continually evolving governmental environmental standards andcost allowability issues. For information regarding these matters, including current estimates of the amounts that we believeare required for remediation or cleanup to the extent probable and estimable, see “Critical Accounting Policies –Environmental Matters” in Management’s Discussion and Analysis of Financial Condition and Results of Operations and“Note 13 – Legal Proceedings, Commitments, and Contingencies” of our consolidated financial statements.
We are involved in a number of legal proceedings. We cannot predict the outcome of litigation and othercontingencies with certainty.
Our business may be adversely affected by the outcome of legal proceedings and other contingencies that cannot bepredicted with certainty. As required by GAAP, we estimate loss contingencies and establish reserves based on ourassessment of contingencies where liability is deemed probable and reasonably estimable in light of the facts andcircumstances known to us at a particular point in time. Subsequent developments in legal proceedings may affect ourassessment and estimates of the loss contingency recorded as a liability or as a reserve against assets in our financialstatements. For a description of our current legal proceedings, see Item 3 – Legal Proceedings and “Note 13 – LegalProceedings, Commitments, and Contingencies” of our consolidated financial statements.
In order to be successful, we must attract and retain key employees and manage leadership transitions effectively.
Our business has a continuing need to attract and retain large numbers of skilled personnel, including personnel holdingsecurity clearances, to meet contract schedules, support the growth of the enterprise, and to replace individuals who haveretired or departed for other reasons. To the extent that the demand for skilled personnel exceeds supply, we could experiencehigher labor, recruiting, or training costs in order to attract and retain such employees, or could experience difficulties inperforming under our contracts if our needs for such employees were unmet. We increasingly compete with commercialtechnology companies outside of the aerospace and defense industry for qualified technical and scientific positions as thenumber of qualified domestic engineers is decreasing. To the extent that these companies grow faster than our industry, orface fewer cost and product pricing constraints, they may be able to offer higher compensation to job candidates or ourexisting employees. To the extent that we lose experienced personnel through wage competition, normal attrition (includingretirement), or specific actions such as workforce reductions, we must successfully manage the transfer of critical knowledgefrom those individuals. This will become increasingly important as our workforce demographic shifts toward a higherpopulation that is nearing retirement. Additionally, we may face issues arising from our efforts to increase the efficiency ofour operations and improve the affordability of our products and services, including difficulties associated with moving orconsolidating operations, reducing the size of the workforce, attracting and retaining key personnel, and from compliancewith our legal obligations, including under Federal labor law and any applicable collective bargaining agreements. We alsomust manage leadership development and succession planning throughout our business and have processes in place formanagement transition and the transfer of knowledge. To the extent that we are unable to attract, develop, and retainleadership talent successfully, we could experience business disruptions and impair our ability to achieve business objectives.
Historically, where employees are covered by collective bargaining agreements with various unions, we have beensuccessful in negotiating renewals to expiring agreements without any material disruption of operating activities. This doesnot assure, however, that we will be successful in our efforts to negotiate renewals of our existing collective bargainingagreements when they expire. If we were unsuccessful in those efforts, there is the potential that we could incur unanticipateddelays or expenses in the programs affected by any resulting work stoppages.
Our estimates and projections may prove to be inaccurate.
The accounting for some of our most significant activities is based on judgments and estimates, which are complex andsubject to many variables. For example, accounting for sales using the percentage-of-completion method requires that weassess risks and make assumptions regarding schedule, cost, technical, and performance issues for each of our thousands ofcontracts, many of which are long-term in nature. Another example is the $10.3 billion of goodwill assets recorded on ourBalance Sheet as of December 31, 2013 from previous acquisitions that were made over time, which represent greater than25% of our total assets, and are subject to annual impairment testing and more frequent testing upon the occurrence of certainevents or significant changes in circumstances that indicate goodwill may be impaired. If we experience changes or factorsarise that negatively affect the expected cash flows of a reporting unit, we may be required to write off all or a portion of the
17
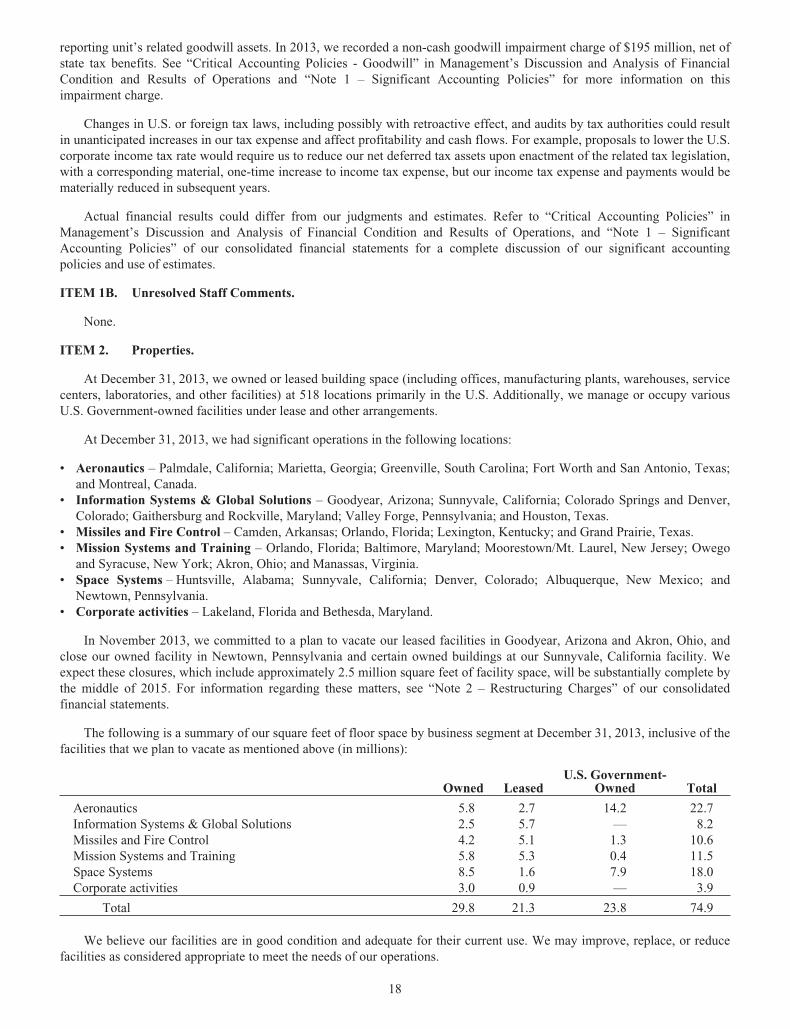
reporting unit’s related goodwill assets. In 2013, we recorded a non-cash goodwill impairment charge of $195 million, net ofstate tax benefits. See “Critical Accounting Policies - Goodwill” in Management’s Discussion and Analysis of FinancialCondition and Results of Operations and “Note 1 – Significant Accounting Policies” for more information on thisimpairment charge.
Changes in U.S. or foreign tax laws, including possibly with retroactive effect, and audits by tax authorities could resultin unanticipated increases in our tax expense and affect profitability and cash flows. For example, proposals to lower the U.S.corporate income tax rate would require us to reduce our net deferred tax assets upon enactment of the related tax legislation,with a corresponding material, one-time increase to income tax expense, but our income tax expense and payments would bematerially reduced in subsequent years.
Actual financial results could differ from our judgments and estimates. Refer to “Critical Accounting Policies” inManagement’s Discussion and Analysis of Financial Condition and Results of Operations, and “Note 1 – SignificantAccounting Policies” of our consolidated financial statements for a complete discussion of our significant accountingpolicies and use of estimates.
ITEM 1B. Unresolved Staff Comments.
None.
ITEM 2. Properties.
At December 31, 2013, we owned or leased building space (including offices, manufacturing plants, warehouses, servicecenters, laboratories, and other facilities) at 518 locations primarily in the U.S. Additionally, we manage or occupy variousU.S. Government-owned facilities under lease and other arrangements.
At December 31, 2013, we had significant operations in the following locations:
• Aeronautics – Palmdale, California; Marietta, Georgia; Greenville, South Carolina; Fort Worth and San Antonio, Texas;and Montreal, Canada.
• Information Systems & Global Solutions – Goodyear, Arizona; Sunnyvale, California; Colorado Springs and Denver,Colorado; Gaithersburg and Rockville, Maryland; Valley Forge, Pennsylvania; and Houston, Texas.
• Missiles and Fire Control – Camden, Arkansas; Orlando, Florida; Lexington, Kentucky; and Grand Prairie, Texas.• Mission Systems and Training – Orlando, Florida; Baltimore, Maryland; Moorestown/Mt. Laurel, New Jersey; Owego
and Syracuse, New York; Akron, Ohio; and Manassas, Virginia.• Space Systems – Huntsville, Alabama; Sunnyvale, California; Denver, Colorado; Albuquerque, New Mexico; and
Newtown, Pennsylvania.• Corporate activities – Lakeland, Florida and Bethesda, Maryland.
In November 2013, we committed to a plan to vacate our leased facilities in Goodyear, Arizona and Akron, Ohio, andclose our owned facility in Newtown, Pennsylvania and certain owned buildings at our Sunnyvale, California facility. Weexpect these closures, which include approximately 2.5 million square feet of facility space, will be substantially complete bythe middle of 2015. For information regarding these matters, see “Note 2 – Restructuring Charges” of our consolidatedfinancial statements.
The following is a summary of our square feet of floor space by business segment at December 31, 2013, inclusive of thefacilities that we plan to vacate as mentioned above (in millions):
Owned LeasedU.S. Government-
Owned Total
Aeronautics 5.8 2.7 14.2 22.7Information Systems & Global Solutions 2.5 5.7 — 8.2Missiles and Fire Control 4.2 5.1 1.3 10.6Mission Systems and Training 5.8 5.3 0.4 11.5Space Systems 8.5 1.6 7.9 18.0Corporate activities 3.0 0.9 — 3.9
Total 29.8 21.3 23.8 74.9
We believe our facilities are in good condition and adequate for their current use. We may improve, replace, or reducefacilities as considered appropriate to meet the needs of our operations.
18
ITEM 3. Legal Proceedings.
We are a party to or have property subject to litigation and other proceedings that arise in the ordinary course of ourbusiness, including matters arising under provisions relating to the protection of the environment, and are subject tocontingencies related to certain businesses we previously owned. These types of matters could result in fines, penalties,compensatory or treble damages or non-monetary relief. We believe the probability is remote that the outcome of thesematters will have a material adverse effect on the Corporation as a whole, notwithstanding that the unfavorable resolution ofany matter may have a material effect on our net earnings in any particular interim reporting period. We cannot predict theoutcome of legal or other proceedings with certainty. These matters include the proceedings summarized in “Note 13 – LegalProceedings, Commitments, and Contingencies” of our consolidated financial statements.
We are subject to federal, state, local and foreign requirements for protection of the environment, including those fordischarge of hazardous materials and remediation of contaminated sites. As a result, we are a party to or have our propertysubject to various lawsuits or proceedings involving environmental protection matters. Due in part to their complexity andpervasiveness, such requirements have resulted in us being involved with related legal proceedings, claims, and remediationobligations. The extent of our financial exposure cannot in all cases be reasonably estimated at this time. For informationregarding these matters, including current estimates of the amounts that we believe are required for remediation or clean-upto the extent estimable, see “Critical Accounting Policies – Environmental Matters” in Management’s Discussion andAnalysis of Financial Condition and Results of Operations, and “Note 13 – Legal Proceedings, Commitments, andContingencies” of our consolidated financial statements.
As a U.S. Government contractor, we are subject to various audits and investigations by the U.S. Government todetermine whether our operations are being conducted in accordance with applicable regulatory requirements. U.S.Government investigations of us, whether relating to government contracts or conducted for other reasons, could result inadministrative, civil, or criminal liabilities, including repayments, fines, or penalties being imposed upon us, or could lead tosuspension, proposed debarment, debarment from eligibility for future U.S. Government contracting, or suspension of exportprivileges. Suspension or debarment could have a material adverse effect on us because of our dependence on contracts withthe U.S. Government. U.S. Government investigations often take years to complete and many result in no adverse actionagainst us. We also provide products and services to customers outside of the U.S., which are subject to U.S. and foreignlaws and regulations and foreign procurement policies and practices. Our compliance with local regulations or applicableU.S. Government regulations may also be audited or investigated.
ITEM 4. Mine Safety Disclosures.
Not applicable.
ITEM 4(a). Executive Officers of the Registrant.
Our executive officers as of February 14, 2014 are listed below, with their ages on that date, positions and officescurrently held, and principal occupation and business experience during at least the last five years. There were no familyrelationships among any of our executive officers and directors. All officers serve at the discretion of the Board of Directors.
Richard F. Ambrose (age 55), Executive Vice President – Space Systems
Mr. Ambrose has served as Executive Vice President of Space Systems since April 2013. He previously served as VicePresident and Deputy, Space Systems from July 2012 to March 2013; President, Information Systems & Global Solutions -Security from January 2011 to June 2012; and Vice President and General Manager, Space Systems - Surveillance andNavigations Systems from January 2008 to December 2010.
Sondra L. Barbour (age 51), Executive Vice President – Information Systems & Global Solutions
Ms. Barbour has served as Executive Vice President of Information Systems & Global Solutions since April 2013. Shepreviously served as Senior Vice President and Chief Information Officer from January 2012 to March 2013, and VicePresident and Chief Information Officer from February 2008 to January 2012.
19
Dale P. Bennett (age 57), Executive Vice President – Mission Systems and Training
Mr. Bennett has served as Executive Vice President of Mission Systems and Training since December 2012. Hepreviously served as President, Mission Systems & Sensors from August 2011 to December 2012; President, Global Trainingand Logistics from June 2010 to July 2011; and President, Simulation, Training & Support from July 2005 to May 2010.
Orlando P. Carvalho (age 55), Executive Vice President – Aeronautics
Mr. Carvalho has served as Executive Vice President of Aeronautics since March 2013. He previously served asExecutive Vice President and General Manager, F-35 Program from March 2012 to March 2013; Vice President and Deputy,F-35 Program from August 2011 to March 2012; President, Mission Systems & Sensors from January 2010 to July 2011; andVice President and General Manager, Surface Systems Ballistic Missile Defense Programs from January 2006 to January2010.
Patrick M. Dewar (age 53), Executive Vice President – Lockheed Martin International
Mr. Dewar has served as Executive Vice President of Lockheed Martin International since July 2013. He previouslyserved as Senior Vice President, Corporate Strategy and Business Development from October 2010 to June 2013; and VicePresident, Corporate International Business Development from January 2009 to September 2010.
Richard H. Edwards (age 57), Executive Vice President – Missiles and Fire Control
Mr. Edwards has served as Executive Vice President of Missiles and Fire Control since December 2012. He previouslyserved as Executive Vice President, Program and Technology Integration, Missiles and Fire Control from June 2012 toDecember 2012; and Vice President, Tactical Missiles and Combat Maneuver Systems from July 2005 to June 2012.
Christopher J. Gregoire (age 45), Vice President, Controller, and Chief Accounting Officer
Mr. Gregoire has served as Vice President, Controller, and Chief Accounting Officer since March 2010. He previouslywas employed by Sprint Nextel Corporation from August 2006 to May 2009, most recently as Principal Accounting Officerand Assistant Controller, and was a partner at Deloitte & Touche LLP from September 2003 to July 2006.
Marillyn A. Hewson (age 60), Chairman, President and Chief Executive Officer
Ms. Hewson has served as Chairman, President and Chief Executive Officer since January 2014. She previously servedas Chief Executive Officer and President from January 2013 to December 2013; President and Chief Operating Officer fromNovember 2012 to December 2012; Executive Vice President of Electronic Systems from January 2010 to December 2012;and President, Systems Integration – Owego from September 2008 to December 2009.
Maryanne R. Lavan (age 54), Senior Vice President, General Counsel and Corporate Secretary
Ms. Lavan has served as Senior Vice President and General Counsel since June 2010 and Corporate Secretary sinceSeptember 2010. She previously served as Vice President, Internal Audit from February 2007 to June 2010.
Kenneth R. Possenriede (age 54), Vice President and Treasurer
Mr. Possenriede has served as Vice President and Treasurer since July 2011. He previously served as Vice President,Finance and Business Operations of Electronic Systems from July 2008 to June 2011.
Bruce L. Tanner (age 54), Executive Vice President and Chief Financial Officer
Mr. Tanner has served as Executive Vice President and Chief Financial Officer since September 2007.
20
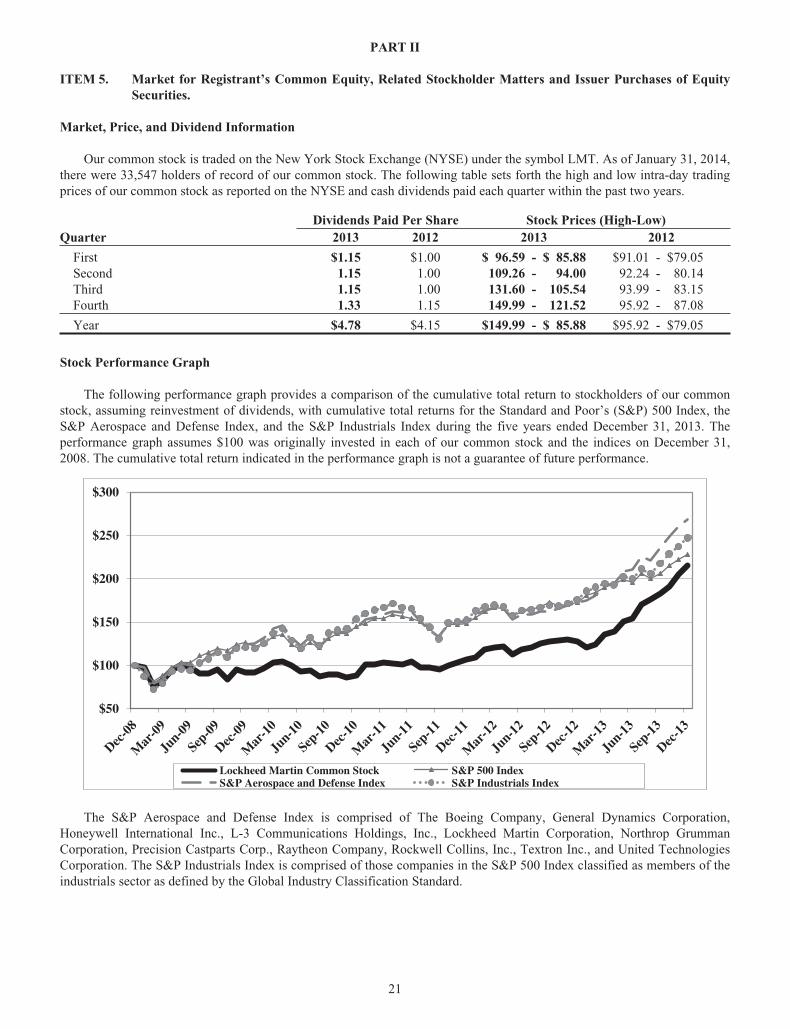
PART II
ITEM 5. Market for Registrant’s Common Equity, Related Stockholder Matters and Issuer Purchases of EquitySecurities.
Market, Price, and Dividend Information
Our common stock is traded on the New York Stock Exchange (NYSE) under the symbol LMT. As of January 31, 2014,there were 33,547 holders of record of our common stock. The following table sets forth the high and low intra-day tradingprices of our common stock as reported on the NYSE and cash dividends paid each quarter within the past two years.
QuarterDividends Paid Per Share Stock Prices (High-Low)
2013 2012 2013 2012
First $1.15 $1.00 $ 96.59 - $ 85.88 $91.01 - $79.05Second 1.15 1.00 109.26 - 94.00 92.24 - 80.14Third 1.15 1.00 131.60 - 105.54 93.99 - 83.15Fourth 1.33 1.15 149.99 - 121.52 95.92 - 87.08
Year $4.78 $4.15 $149.99 - $ 85.88 $95.92 - $79.05
Stock Performance Graph
The following performance graph provides a comparison of the cumulative total return to stockholders of our commonstock, assuming reinvestment of dividends, with cumulative total returns for the Standard and Poor’s (S&P) 500 Index, theS&P Aerospace and Defense Index, and the S&P Industrials Index during the five years ended December 31, 2013. Theperformance graph assumes $100 was originally invested in each of our common stock and the indices on December 31,2008. The cumulative total return indicated in the performance graph is not a guarantee of future performance.
$300
$250
$200
$150
$100
$50
Dec-0
8
Mar
-09
Jun-0
9
Sep-0
9
Dec-0
9
Mar
-10
Jun-1
0
Sep-1
0
Dec-1
0
Mar
-11
Jun-1
1
Sep-1
1
Dec-1
1
Mar
-12
Jun-1
2
Sep-1
2
Dec-1
2
Mar
-13
Jun-1
3
Sep-1
3
Dec-1
3
Lockheed Martin Common Stock S&P 500 IndexS&P Aerospace and Defense Index S&P Industrials Index
The S&P Aerospace and Defense Index is comprised of The Boeing Company, General Dynamics Corporation,Honeywell International Inc., L-3 Communications Holdings, Inc., Lockheed Martin Corporation, Northrop GrummanCorporation, Precision Castparts Corp., Raytheon Company, Rockwell Collins, Inc., Textron Inc., and United TechnologiesCorporation. The S&P Industrials Index is comprised of those companies in the S&P 500 Index classified as members of theindustrials sector as defined by the Global Industry Classification Standard.
21
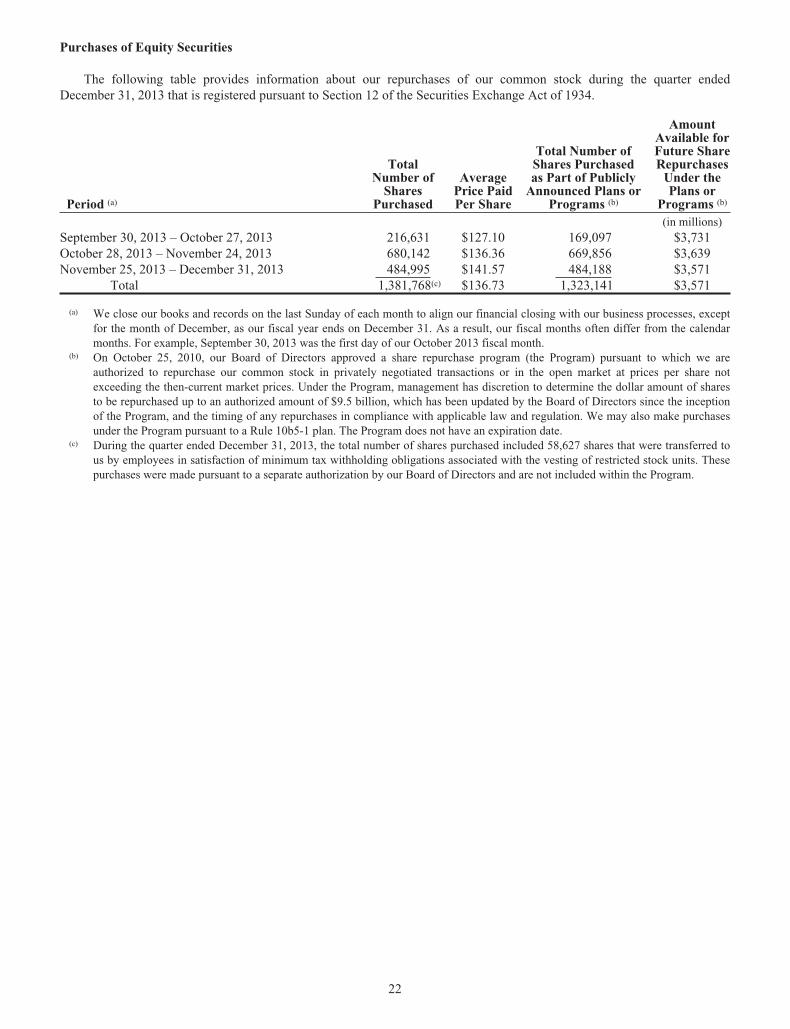
Purchases of Equity Securities
The following table provides information about our repurchases of our common stock during the quarter endedDecember 31, 2013 that is registered pursuant to Section 12 of the Securities Exchange Act of 1934.
Period (a)
TotalNumber of
SharesPurchased
AveragePrice PaidPer Share
Total Number ofShares Purchasedas Part of Publicly
Announced Plans orPrograms (b)
AmountAvailable forFuture ShareRepurchases
Under thePlans or
Programs (b)
(in millions)September 30, 2013 – October 27, 2013 216,631 $127.10 169,097 $3,731October 28, 2013 – November 24, 2013 680,142 $136.36 669,856 $3,639November 25, 2013 – December 31, 2013 484,995 $141.57 484,188 $3,571
Total 1,381,768(c) $136.73 1,323,141 $3,571
(a) We close our books and records on the last Sunday of each month to align our financial closing with our business processes, exceptfor the month of December, as our fiscal year ends on December 31. As a result, our fiscal months often differ from the calendarmonths. For example, September 30, 2013 was the first day of our October 2013 fiscal month.
(b) On October 25, 2010, our Board of Directors approved a share repurchase program (the Program) pursuant to which we areauthorized to repurchase our common stock in privately negotiated transactions or in the open market at prices per share notexceeding the then-current market prices. Under the Program, management has discretion to determine the dollar amount of sharesto be repurchased up to an authorized amount of $9.5 billion, which has been updated by the Board of Directors since the inceptionof the Program, and the timing of any repurchases in compliance with applicable law and regulation. We may also make purchasesunder the Program pursuant to a Rule 10b5-1 plan. The Program does not have an expiration date.
(c) During the quarter ended December 31, 2013, the total number of shares purchased included 58,627 shares that were transferred tous by employees in satisfaction of minimum tax withholding obligations associated with the vesting of restricted stock units. Thesepurchases were made pursuant to a separate authorization by our Board of Directors and are not included within the Program.
22
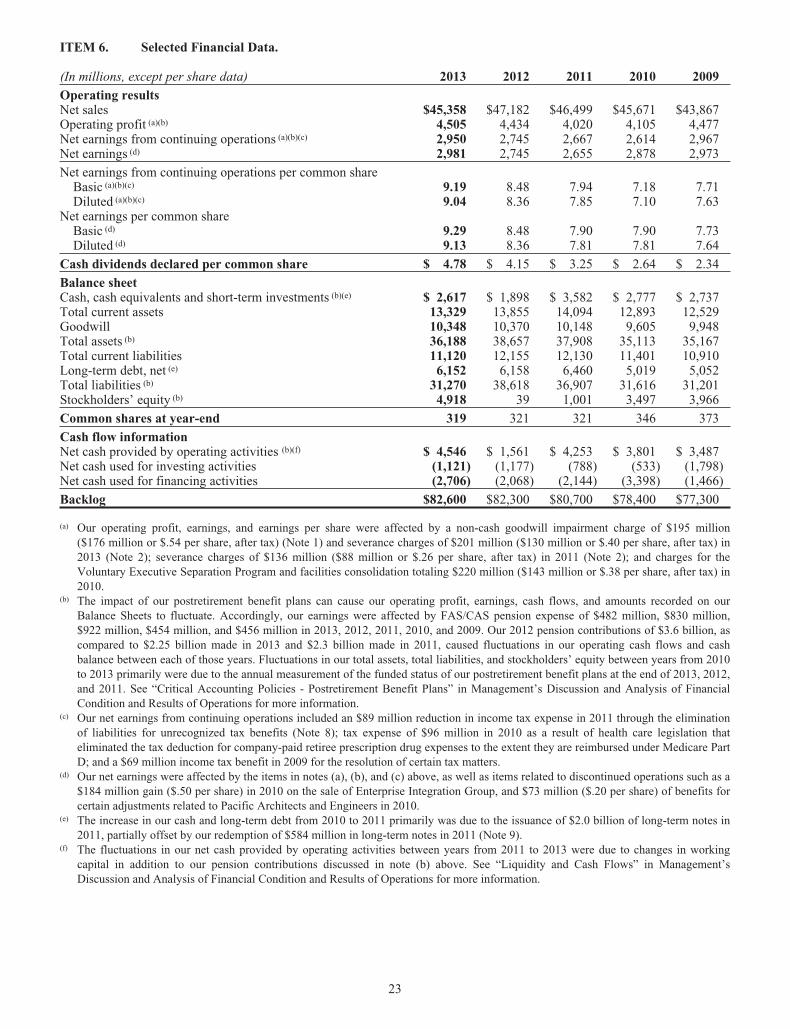
ITEM 6. Selected Financial Data.
(In millions, except per share data) 2013 2012 2011 2010 2009
Operating resultsNet sales $45,358 $47,182 $46,499 $45,671 $43,867Operating profit (a)(b) 4,505 4,434 4,020 4,105 4,477Net earnings from continuing operations (a)(b)(c) 2,950 2,745 2,667 2,614 2,967Net earnings (d) 2,981 2,745 2,655 2,878 2,973
Net earnings from continuing operations per common shareBasic (a)(b)(c) 9.19 8.48 7.94 7.18 7.71Diluted (a)(b)(c) 9.04 8.36 7.85 7.10 7.63
Net earnings per common shareBasic (d) 9.29 8.48 7.90 7.90 7.73Diluted (d) 9.13 8.36 7.81 7.81 7.64
Cash dividends declared per common share $ 4.78 $ 4.15 $ 3.25 $ 2.64 $ 2.34
Balance sheetCash, cash equivalents and short-term investments (b)(e) $ 2,617 $ 1,898 $ 3,582 $ 2,777 $ 2,737Total current assets 13,329 13,855 14,094 12,893 12,529Goodwill 10,348 10,370 10,148 9,605 9,948Total assets (b) 36,188 38,657 37,908 35,113 35,167Total current liabilities 11,120 12,155 12,130 11,401 10,910Long-term debt, net (e) 6,152 6,158 6,460 5,019 5,052Total liabilities (b) 31,270 38,618 36,907 31,616 31,201Stockholders’ equity (b) 4,918 39 1,001 3,497 3,966
Common shares at year-end 319 321 321 346 373
Cash flow informationNet cash provided by operating activities (b)(f) $ 4,546 $ 1,561 $ 4,253 $ 3,801 $ 3,487Net cash used for investing activities (1,121) (1,177) (788) (533) (1,798)Net cash used for financing activities (2,706) (2,068) (2,144) (3,398) (1,466)
Backlog $82,600 $82,300 $80,700 $78,400 $77,300
(a) Our operating profit, earnings, and earnings per share were affected by a non-cash goodwill impairment charge of $195 million($176 million or $.54 per share, after tax) (Note 1) and severance charges of $201 million ($130 million or $.40 per share, after tax) in2013 (Note 2); severance charges of $136 million ($88 million or $.26 per share, after tax) in 2011 (Note 2); and charges for theVoluntary Executive Separation Program and facilities consolidation totaling $220 million ($143 million or $.38 per share, after tax) in2010.
(b) The impact of our postretirement benefit plans can cause our operating profit, earnings, cash flows, and amounts recorded on ourBalance Sheets to fluctuate. Accordingly, our earnings were affected by FAS/CAS pension expense of $482 million, $830 million,$922 million, $454 million, and $456 million in 2013, 2012, 2011, 2010, and 2009. Our 2012 pension contributions of $3.6 billion, ascompared to $2.25 billion made in 2013 and $2.3 billion made in 2011, caused fluctuations in our operating cash flows and cashbalance between each of those years. Fluctuations in our total assets, total liabilities, and stockholders’ equity between years from 2010to 2013 primarily were due to the annual measurement of the funded status of our postretirement benefit plans at the end of 2013, 2012,and 2011. See “Critical Accounting Policies - Postretirement Benefit Plans” in Management’s Discussion and Analysis of FinancialCondition and Results of Operations for more information.
(c) Our net earnings from continuing operations included an $89 million reduction in income tax expense in 2011 through the eliminationof liabilities for unrecognized tax benefits (Note 8); tax expense of $96 million in 2010 as a result of health care legislation thateliminated the tax deduction for company-paid retiree prescription drug expenses to the extent they are reimbursed under Medicare PartD; and a $69 million income tax benefit in 2009 for the resolution of certain tax matters.
(d) Our net earnings were affected by the items in notes (a), (b), and (c) above, as well as items related to discontinued operations such as a$184 million gain ($.50 per share) in 2010 on the sale of Enterprise Integration Group, and $73 million ($.20 per share) of benefits forcertain adjustments related to Pacific Architects and Engineers in 2010.
(e) The increase in our cash and long-term debt from 2010 to 2011 primarily was due to the issuance of $2.0 billion of long-term notes in2011, partially offset by our redemption of $584 million in long-term notes in 2011 (Note 9).
(f) The fluctuations in our net cash provided by operating activities between years from 2011 to 2013 were due to changes in workingcapital in addition to our pension contributions discussed in note (b) above. See “Liquidity and Cash Flows” in Management’sDiscussion and Analysis of Financial Condition and Results of Operations for more information.
23
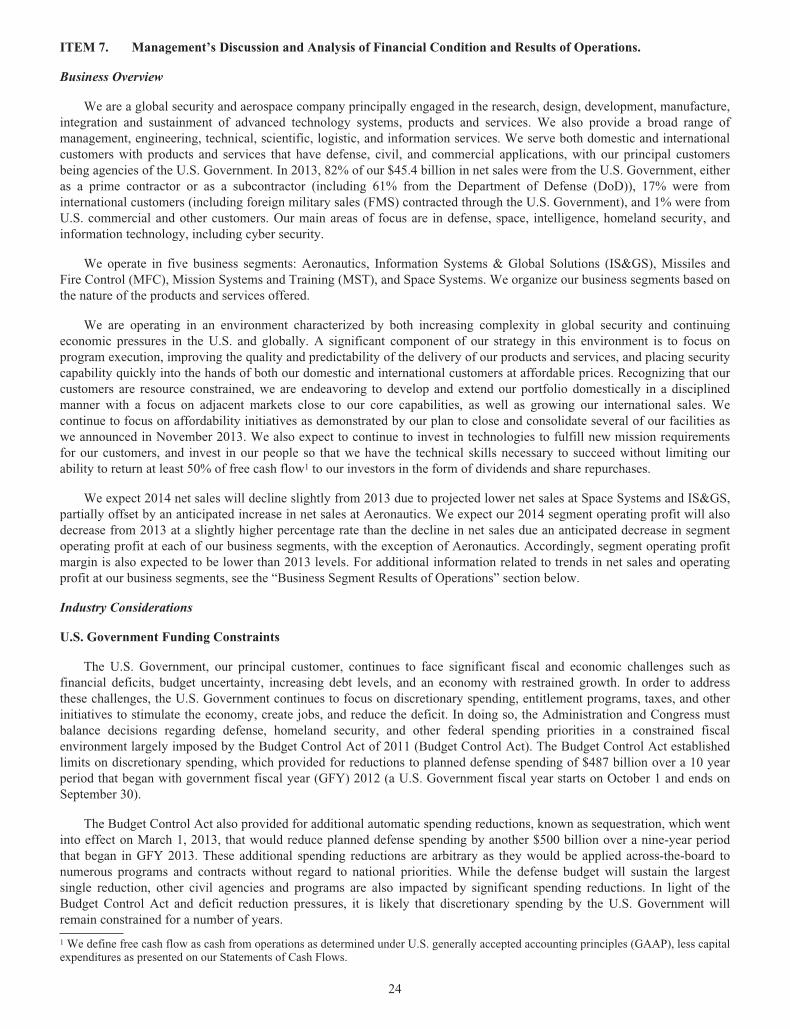
ITEM 7. Management’s Discussion and Analysis of Financial Condition and Results of Operations.
Business Overview
We are a global security and aerospace company principally engaged in the research, design, development, manufacture,integration and sustainment of advanced technology systems, products and services. We also provide a broad range ofmanagement, engineering, technical, scientific, logistic, and information services. We serve both domestic and internationalcustomers with products and services that have defense, civil, and commercial applications, with our principal customersbeing agencies of the U.S. Government. In 2013, 82% of our $45.4 billion in net sales were from the U.S. Government, eitheras a prime contractor or as a subcontractor (including 61% from the Department of Defense (DoD)), 17% were frominternational customers (including foreign military sales (FMS) contracted through the U.S. Government), and 1% were fromU.S. commercial and other customers. Our main areas of focus are in defense, space, intelligence, homeland security, andinformation technology, including cyber security.
We operate in five business segments: Aeronautics, Information Systems & Global Solutions (IS&GS), Missiles andFire Control (MFC), Mission Systems and Training (MST), and Space Systems. We organize our business segments based onthe nature of the products and services offered.
We are operating in an environment characterized by both increasing complexity in global security and continuingeconomic pressures in the U.S. and globally. A significant component of our strategy in this environment is to focus onprogram execution, improving the quality and predictability of the delivery of our products and services, and placing securitycapability quickly into the hands of both our domestic and international customers at affordable prices. Recognizing that ourcustomers are resource constrained, we are endeavoring to develop and extend our portfolio domestically in a disciplinedmanner with a focus on adjacent markets close to our core capabilities, as well as growing our international sales. Wecontinue to focus on affordability initiatives as demonstrated by our plan to close and consolidate several of our facilities aswe announced in November 2013. We also expect to continue to invest in technologies to fulfill new mission requirementsfor our customers, and invest in our people so that we have the technical skills necessary to succeed without limiting ourability to return at least 50% of free cash flow1 to our investors in the form of dividends and share repurchases.
We expect 2014 net sales will decline slightly from 2013 due to projected lower net sales at Space Systems and IS&GS,partially offset by an anticipated increase in net sales at Aeronautics. We expect our 2014 segment operating profit will alsodecrease from 2013 at a slightly higher percentage rate than the decline in net sales due an anticipated decrease in segmentoperating profit at each of our business segments, with the exception of Aeronautics. Accordingly, segment operating profitmargin is also expected to be lower than 2013 levels. For additional information related to trends in net sales and operatingprofit at our business segments, see the “Business Segment Results of Operations” section below.
Industry Considerations
U.S. Government Funding Constraints
The U.S. Government, our principal customer, continues to face significant fiscal and economic challenges such asfinancial deficits, budget uncertainty, increasing debt levels, and an economy with restrained growth. In order to addressthese challenges, the U.S. Government continues to focus on discretionary spending, entitlement programs, taxes, and otherinitiatives to stimulate the economy, create jobs, and reduce the deficit. In doing so, the Administration and Congress mustbalance decisions regarding defense, homeland security, and other federal spending priorities in a constrained fiscalenvironment largely imposed by the Budget Control Act of 2011 (Budget Control Act). The Budget Control Act establishedlimits on discretionary spending, which provided for reductions to planned defense spending of $487 billion over a 10 yearperiod that began with government fiscal year (GFY) 2012 (a U.S. Government fiscal year starts on October 1 and ends onSeptember 30).
The Budget Control Act also provided for additional automatic spending reductions, known as sequestration, which wentinto effect on March 1, 2013, that would reduce planned defense spending by another $500 billion over a nine-year periodthat began in GFY 2013. These additional spending reductions are arbitrary as they would be applied across-the-board tonumerous programs and contracts without regard to national priorities. While the defense budget will sustain the largestsingle reduction, other civil agencies and programs are also impacted by significant spending reductions. In light of theBudget Control Act and deficit reduction pressures, it is likely that discretionary spending by the U.S. Government willremain constrained for a number of years.
1 We define free cash flow as cash from operations as determined under U.S. generally accepted accounting principles (GAAP), less capitalexpenditures as presented on our Statements of Cash Flows.
24
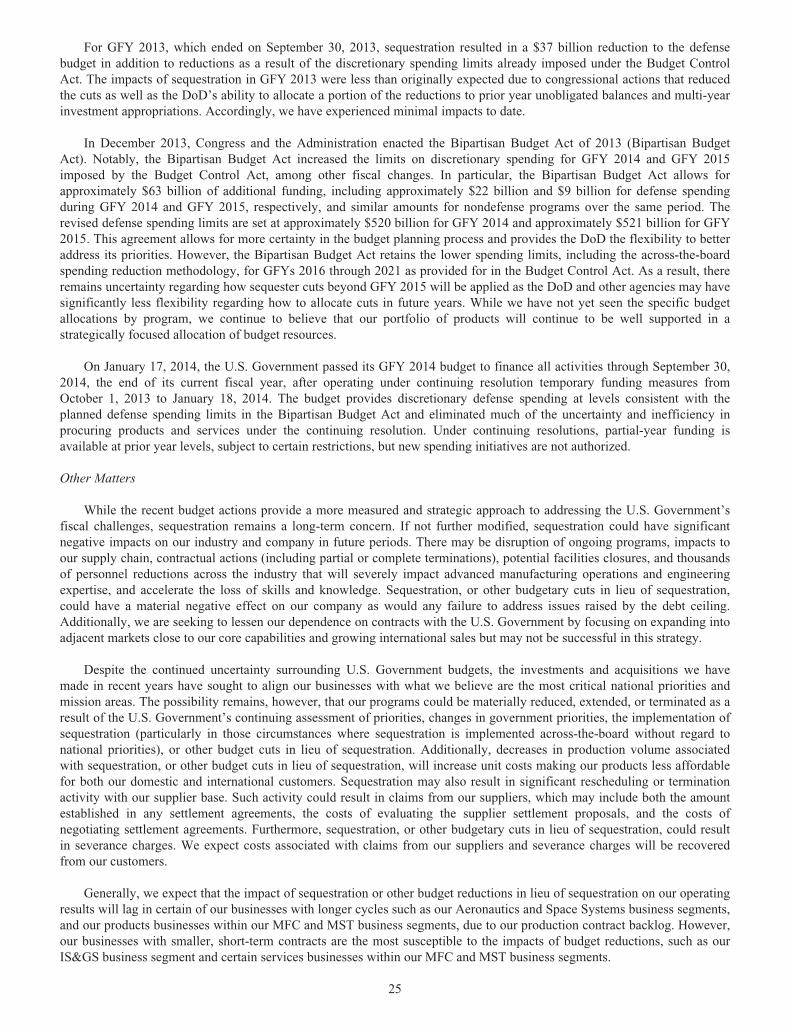
For GFY 2013, which ended on September 30, 2013, sequestration resulted in a $37 billion reduction to the defensebudget in addition to reductions as a result of the discretionary spending limits already imposed under the Budget ControlAct. The impacts of sequestration in GFY 2013 were less than originally expected due to congressional actions that reducedthe cuts as well as the DoD’s ability to allocate a portion of the reductions to prior year unobligated balances and multi-yearinvestment appropriations. Accordingly, we have experienced minimal impacts to date.
In December 2013, Congress and the Administration enacted the Bipartisan Budget Act of 2013 (Bipartisan BudgetAct). Notably, the Bipartisan Budget Act increased the limits on discretionary spending for GFY 2014 and GFY 2015imposed by the Budget Control Act, among other fiscal changes. In particular, the Bipartisan Budget Act allows forapproximately $63 billion of additional funding, including approximately $22 billion and $9 billion for defense spendingduring GFY 2014 and GFY 2015, respectively, and similar amounts for nondefense programs over the same period. Therevised defense spending limits are set at approximately $520 billion for GFY 2014 and approximately $521 billion for GFY2015. This agreement allows for more certainty in the budget planning process and provides the DoD the flexibility to betteraddress its priorities. However, the Bipartisan Budget Act retains the lower spending limits, including the across-the-boardspending reduction methodology, for GFYs 2016 through 2021 as provided for in the Budget Control Act. As a result, thereremains uncertainty regarding how sequester cuts beyond GFY 2015 will be applied as the DoD and other agencies may havesignificantly less flexibility regarding how to allocate cuts in future years. While we have not yet seen the specific budgetallocations by program, we continue to believe that our portfolio of products will continue to be well supported in astrategically focused allocation of budget resources.
On January 17, 2014, the U.S. Government passed its GFY 2014 budget to finance all activities through September 30,2014, the end of its current fiscal year, after operating under continuing resolution temporary funding measures fromOctober 1, 2013 to January 18, 2014. The budget provides discretionary defense spending at levels consistent with theplanned defense spending limits in the Bipartisan Budget Act and eliminated much of the uncertainty and inefficiency inprocuring products and services under the continuing resolution. Under continuing resolutions, partial-year funding isavailable at prior year levels, subject to certain restrictions, but new spending initiatives are not authorized.
Other Matters
While the recent budget actions provide a more measured and strategic approach to addressing the U.S. Government’sfiscal challenges, sequestration remains a long-term concern. If not further modified, sequestration could have significantnegative impacts on our industry and company in future periods. There may be disruption of ongoing programs, impacts toour supply chain, contractual actions (including partial or complete terminations), potential facilities closures, and thousandsof personnel reductions across the industry that will severely impact advanced manufacturing operations and engineeringexpertise, and accelerate the loss of skills and knowledge. Sequestration, or other budgetary cuts in lieu of sequestration,could have a material negative effect on our company as would any failure to address issues raised by the debt ceiling.Additionally, we are seeking to lessen our dependence on contracts with the U.S. Government by focusing on expanding intoadjacent markets close to our core capabilities and growing international sales but may not be successful in this strategy.
Despite the continued uncertainty surrounding U.S. Government budgets, the investments and acquisitions we havemade in recent years have sought to align our businesses with what we believe are the most critical national priorities andmission areas. The possibility remains, however, that our programs could be materially reduced, extended, or terminated as aresult of the U.S. Government’s continuing assessment of priorities, changes in government priorities, the implementation ofsequestration (particularly in those circumstances where sequestration is implemented across-the-board without regard tonational priorities), or other budget cuts in lieu of sequestration. Additionally, decreases in production volume associatedwith sequestration, or other budget cuts in lieu of sequestration, will increase unit costs making our products less affordablefor both our domestic and international customers. Sequestration may also result in significant rescheduling or terminationactivity with our supplier base. Such activity could result in claims from our suppliers, which may include both the amountestablished in any settlement agreements, the costs of evaluating the supplier settlement proposals, and the costs ofnegotiating settlement agreements. Furthermore, sequestration, or other budgetary cuts in lieu of sequestration, could resultin severance charges. We expect costs associated with claims from our suppliers and severance charges will be recoveredfrom our customers.
Generally, we expect that the impact of sequestration or other budget reductions in lieu of sequestration on our operatingresults will lag in certain of our businesses with longer cycles such as our Aeronautics and Space Systems business segments,and our products businesses within our MFC and MST business segments, due to our production contract backlog. However,our businesses with smaller, short-term contracts are the most susceptible to the impacts of budget reductions, such as ourIS&GS business segment and certain services businesses within our MFC and MST business segments.
25
Other Business Considerations
International Business
A key component of our strategic plan is to grow our international sales. To accomplish this growth, we continue tofocus on expanding our in-country presence and strengthening our relationships internationally through partnerships andlocal production joint technology offices. For example, in 2013 we acquired Amor Group, a United Kingdom-basedcompany, and we opened a new in-country office in Saudi Arabia that will enable development of partnerships to createproducts and enhance our offerings in technology, aerospace, and security sectors. We conduct business with internationalcustomers primarily through our Aeronautics, MFC, and MST business segments.
In our Aeronautics business segment, there remains strong international interest in the F-35 program. The F-35 programincludes commitments from eight international partner countries and two international customers; as well as expressions ofinterest from other countries. The U.S. Government and the eight partner countries continue to work together on the design,testing, production, and sustainment of the F-35. The international role on the program is growing as we opened the finalassembly and checkout facility in Italy and began international pilot and maintainer training in 2013. We delivered three F-35aircraft to international partners in 2013, including two aircraft to the Netherlands and one aircraft to the United Kingdom.The number of F-35 aircraft for international customers in recent low-rate initial production (LRIP) contracts continues toincrease, with the LRIP 6 and 7 contracts including new aircraft awards for Australia, Italy, Norway, and the UnitedKingdom.
Other areas of international expansion at our Aeronautics business segment include the F-16 and C-130J programs. Theaward from Iraq in 2013 for 18 additional F-16 aircraft extends production through the middle of 2017. Also, we deliveredthe first C-130J Super Hercules aircraft to both the Republic of Tunisia and to Israel in 2013. The delivery to Tunisia marksthe first to an African country.
Our MFC business segment produces the Patriot Advanced Capability-3 (PAC-3) and Terminal High Altitude AreaDefense (THAAD) air and missile defense systems, which continue to generate significant international interest. The PAC-3is an advanced missile defense system designed to intercept incoming airborne threats. During 2013, we received an award toprovide PAC-3 missile defense equipment to Kuwait. Other international customers include Japan, Germany, theNetherlands, Taiwan, and the United Arab Emirates (UAE). In 2013, we also finalized the multi-billion dollar award for theTHAAD missile defense system from the UAE, which is the first international customer for this system. Other countries inthe Middle East and the Asia-Pacific region have also expressed interest in our air and missile defense systems.
In our MST business segment, we continue to experience international interest in the Aegis Ballistic Missile DefenseSystem. We perform activities in the development, production, ship integration and test, and lifetime support for ships ofinternational customers such as Canada, Japan, Spain, Korea, and Australia. In 2013, we received an award from Japan toupgrade processors and other equipment on their ballistic missile defense ships. The Littoral Combat Ship (LCS) is anothersignificant program generating interest from potential international customers.
Status of the F-35 Program
The F-35 program consists of a development contract and multiple production contracts. The development contract isbeing performed concurrent with the production contracts. Concurrent performance of development and production contractsis used for complex programs to test aircraft, shorten the time to field systems, and achieve overall cost savings. We expectthe development portion of the F-35 program will be substantially complete in 2017, with less significant efforts continuinginto 2019. Production of the aircraft is expected to continue for many years given the U.S. Government’s current inventoryobjective of 2,443 aircraft for the Air Force, Marine Corps, and Navy; commitments from our eight international partners andtwo international customers; as well as expressions of interest from other countries.
On the development contract, the U.S. Government continues to complete various operational tests, including ship trials,mission system evaluations, and weapons testing, with the aircraft surpassing 10,000 flight hours. In 2013, we reduced theprofit booking rate on the development contract after revising our estimate of fees that we expect to earn on the contract aswell as our estimates of the remaining costs to complete the development contract. These revisions collectively reducedprofit by $85 million during 2013, which reflect the inception-to-date impact of the change in the profit booking rate.
Progress continues to be made on the production of aircraft. In 2013, the F-35 program reached a significant milestoneas we completed the assembly of the 100th aircraft. During 2013, we delivered 35 aircraft to our domestic and internationalpartners, resulting in total deliveries of 73 production aircraft as of December 31, 2013. We have 93 production aircraft inbacklog as of December 31, 2013, including orders from our international partners.
26
Given the size and complexity of the F-35 program, we anticipate that there will be continual reviews related to aircraftperformance, program schedule, cost, and requirements as part of the DoD, Congressional, and international partners’oversight and budgeting processes. Current program challenges include, but are not limited to, supplier and partnerperformance, software development, level of cost associated with lifecycle operations and sustainment, receiving funding forproduction contracts on a timely basis, executing future flight tests, and findings resulting from testing.
Portfolio Shaping Activities
We continuously strive to strengthen our portfolio of products and services to meet the current and future needs of ourcustomers. We accomplish this in part by our independent research and development activities, and through acquisition,divestiture, and internal realignment activities. Internal realignments are designed to more fully leverage existing capabilitiesand enhance development and delivery of products and services.
We selectively pursue the acquisition of businesses and investments at attractive valuations that will expand orcomplement our current portfolio and allow access to new customers or technologies. We have made a number of nicheacquisitions of businesses and investments in affiliates during the past several years. We also may explore the divestiture ofbusinesses. In pursuing our business strategy, we routinely conduct discussions, evaluate targets, and enter into agreementsregarding possible acquisitions, divestitures, ventures, and equity investments.
Acquisitions
We paid $269 million and $259 million in 2013 and 2012 for acquisition activities, primarily related to the acquisition ofbusinesses. In 2013, we acquired Amor Group, a United Kingdom-based company specializing in information technology,civil government services, and the energy market. This acquisition is aligned with our strategy to grow international sales andhas been included in our IS&GS business segment. In 2012, we acquired Chandler/May, Inc. (Chandler/May), CDL SystemsLtd. (CDL), and Procerus Technologies, L.C. (Procerus). These companies specialize in the design, development,manufacturing, control, and support of advanced unmanned systems, which expand our offerings in support of ourcustomers’ increased emphasis on advanced unmanned systems and are consistent with our strategy to maintain a portfolio ofadvanced technology options. These companies are part of our MST business segment where they have been integrated intoour portfolio of unmanned systems and technologies to align their product and service offerings to the U.S. Army.
In 2011, we paid $624 million for acquisition activities, primarily related to the acquisitions of QTC Holdings Inc.(QTC) and Sim-Industries B.V. (Sim-Industries). QTC provides outsourced medical evaluation services to the U.S.Government and has been included within our IS&GS business segment. Sim-Industries designs, develops, and manufacturesfull-motion and fixed-based civil aviation flight simulators for a wide range of airline customers and independent pilottraining centers worldwide and is part of our MST business segment. These companies complement our core capabilities andalign with our strategy to expand into closely related markets and expand our customer base. For additional information, see“Note 14 – Acquisitions and Divestitures” of our consolidated financial statements.
Divestitures
In pursuing our business strategies, we have also divested certain businesses over the past three years. Recentdivestitures consisted of Savi Technology, Inc. (Savi) in 2012 and Pacific Architects and Engineers, Inc. (PAE) in 2011. Foradditional information, see “Note 14 – Acquisitions and Divestitures” of our consolidated financial statements.
27
Consolidated Results of Operations
Since our operating cycle is long-term and involves many types of contracts for the design, development, andmanufacturing of products and related activities with varying delivery schedules, the results of operations of a particularyear, or year-to-year comparisons of recorded sales and profits, may not be indicative of future operating results. Thefollowing discussions of comparative results among years should be viewed in this context. All per share amounts cited inthese discussions are presented on a “per diluted share” basis, unless otherwise noted. Our consolidated results of operationswere as follows (in millions, except per share data):
2013 2012 2011
Operating resultsNet sales $ 45,358 $ 47,182 $ 46,499Cost of sales (41,171) (42,986) (42,755)Other income, net 318 238 276
Operating profit 4,505 4,434 4,020Interest expense (350) (383) (354)Other non-operating income (expense), net — 21 (35)Income tax expense (1,205) (1,327) (964)
Net earnings from continuing operations 2,950 2,745 2,667Net earnings (loss) from discontinued operations 31 — (12)
Net earnings $ 2,981 $ 2,745 $ 2,655
Diluted earnings (loss) per common shareContinuing operations $ 9.04 $ 8.36 $ 7.85Discontinued operations .09 — (.04)
Total $ 9.13 $ 8.36 $ 7.81
Amounts reported in other income, net (primarily our share of earnings or losses from equity method investees) on ourStatements of Earnings are included in the segment operating profit and segment operating margins of our “BusinessSegment Results of Operations” but are excluded from the consolidated net sales and cost of sales tables below.
Net Sales
Products sales are predominantly generated in our Aeronautics, MFC, MST, and Space Systems business segments, andmost of our services sales are generated in our IS&GS and MFC business segments. Our consolidated net sales were asfollows (in millions):
2013 2012 2011
Net salesProducts $35,691 $37,817 $36,925Services 9,667 9,365 9,574
Total net sales $45,358 $47,182 $46,499
Substantially all of our contracts are accounted for using the percentage-of-completion method of accounting. Under thepercentage-of-completion method, we record net sales on contracts based upon our progress towards completion on aparticular contract, as well as our estimate of the profit to be earned at completion. The following discussion of materialchanges in our consolidated net sales should be read in tandem with the following discussion of changes in our consolidatedcost of sales and our “Business Segment Results of Operations” section because, due to the nature of percentage-of-completion accounting, changes in our sales are typically accompanied by a corresponding change in our cost of sales.
Products Sales
Our products sales represent about 80% of our net sales for both 2013 and 2012. Products sales decreased $2.1 billion, or6%, in 2013 compared to 2012 primarily due to lower volume and deliveries. Products sales decreased about $915 million atAeronautics primarily due to fewer aircraft deliveries (primarily F-16 and C-130) and lower volume and risk retirements onF-22 due to completion of aircraft deliveries in 2012, partially offset by increased volume and risk retirements on F-35production contracts and increased aircraft deliveries on the C-5 program; about $750 million at IS&GS for various programsdue to lower volume (such as Next Generation Identification (NGI) and En Route Automation Modernization (ERAM)
28
programs); about $440 million at MST due to fewer deliveries (primarily Persistent Threat Detection Systems (PTDS) asfinal surveillance system deliveries occurred during the second quarter of 2012) and lower volume (primarily integratedwarfare systems and sensors programs); and about $405 million at Space Systems due to lower volume (primarilycommercial satellites and the Orion Multi-Purpose Crew Vehicle (Orion) program) partially offset by increased volume(primarily various government satellite programs). The decreases were partially offset by higher products sales of about$380 million at MFC due to increased volume and risk retirements (primarily THAAD and deliveries of PAC-3).
Our products sales represent about 80% of our net sales for both 2012 and 2011. Products sales increased $892 million,or 2%, in 2012 compared to 2011 primarily due to higher volume and deliveries, as well as higher risk retirements on certainprograms. Products sales increased about $555 million at Aeronautics due to increased volume and risk retirements on F-35production contracts and deliveries (primarily F-16 and C-5), partially offset by decreased volume and risk retirements(primarily F-22); about $510 million at MST due to increased deliveries (primarily PTDS) and increased volume (primarilyLCS); about $225 million at Space Systems due to increased volume (primarily commercial satellites and Orion); and about$100 million at MFC due to increased volume (primarily THAAD and PAC-3). These increases partially were offset bylower products sales of about $495 million at IS&GS due to the substantial completion of certain programs (such as JointTactical Radio System (JTRS) and U.K. Census).
Services Sales
Our services sales represent about 20% of our net sales for 2013 and 2012. Services sales increased $302 million, or 3%,in 2013 compared to 2012. Services sales increased about $270 million at IS&GS primarily due to the start-up of certainprograms (such as the Defense Information Systems Agency – Global Information Grid Services Management-Operations(DISA GSM-O) and the National Science Foundation Antarctic Support); and about $85 million at Aeronautics primarily dueto increased sustainment activities (primarily F-16). The increases were partially offset by lower services sales of about$80 million at MFC for various technical services programs due to lower volume, partially offset by various fire controlprograms (primarily Special Operations Forces Contractor Logistics Support Services (SOF CLSS)) due to higher volume.Services sales for 2013 were comparable to 2012 at both MST and Space Systems.
Our services sales represent about 20% of our net sales for 2012 and 2011. Services sales decreased $209 million, or 2%,in 2012 compared to 2011. Services sales decreased about $105 million at MFC primarily due to lower volume and riskretirements on various technical services programs. Services sales decreased about $60 million at MST primarily due tolower volume on various training services programs. Services sales decreased about $40 million at IS&GS primarily due tothe substantial completion of the Outsourcing Desktop Initiative for NASA (ODIN) during 2011 and lower volume on theHanford Mission Support (Hanford) contract, partially offset by higher net sales from QTC, which was acquired in the fourthquarter of 2011.
Cost of Sales
Cost of sales, for both products and services, consist of materials, labor, and subcontracting costs, as well as anallocation of indirect costs (overhead and general and administrative). For each of our contracts, we monitor the nature andamount of costs at the contract level, which form the basis for estimating our total costs at the completion of the contract. Ourconsolidated cost of sales were as follows (in millions):
2013 2012 2011
Cost of salesCost of products sales $31,346 $33,495 $32,968
% of products sales 87.8% 88.6% 89.3%Cost of services sales 8,588 8,383 8,514
% of services sales 88.8% 89.5% 88.9%Goodwill impairment charge 195 — —Severance charges 201 48 136Other unallocated costs 841 1,060 1,137
Total cost of sales $41,171 $42,986 $42,755
Due to the nature of percentage-of-completion accounting, changes in our cost of products and services sales aretypically accompanied by changes in our net sales. The following discussion of material changes in our consolidated cost ofproducts and services sales should be read in tandem with the preceding discussion of changes in our consolidated net salesand with our “Business Segment Results of Operations” section. We have not identified any developing trends in cost ofproducts and services sales that would have a material impact on our future operations.
29
Cost of Products Sales
Cost of products sales decreased $2.1 billion, or 6%, in 2013 compared to 2012 primarily due to lower volume anddeliveries. Cost of products sales decreased about $770 million at Aeronautics due to fewer aircraft deliveries (primarily F-16and C-130) and lower volume (primarily F-22), partially offset by increased volume for F-35 production contracts, increasedaircraft deliveries and the impact of reducing the profit booking rate in the third quarter of 2013 for the C-5 program andlower risk retirements on various programs (primarily C-130); about $685 million at IS&GS for various programs primarilydue to decreased volume; about $570 million at MST primarily due to fewer deliveries and net increased risk retirements forthe PTDS program and various integrated warfare systems and sensors programs and for the favorable resolution of certaincontract cost matters (including the terminated presidential helicopter program); and about $315 million at Space Systemsdue to lower volume (primarily commercial satellites and Orion). The decreases were partially offset by higher cost ofproducts sales of about $190 million at MFC due to increased volume (primarily THAAD and deliveries of PAC-3), partiallyoffset by various other programs due increased risk retirements (primarily fire control programs). The 0.8% decrease in thepercentage of cost of products sales relative to products sales in 2013 compared to 2012 primarily was due to higher riskretirements (primarily at MFC and MST) and the favorable resolution of contractual matters at MST.
Cost of products sales increased $527 million, or 2%, in 2012 compared to 2011 primarily due to higher volume anddeliveries. Cost of products sales increased about $520 million at Aeronautics due to increased volume (primarily F-35production contracts) and increased deliveries (primarily F-16 and C-5); about $485 million at MST due to increaseddeliveries (primarily PTDS) and volume (primarily LCS), partially offset by reserves of about $55 million for contract costmatters on certain contracts recorded in the fourth quarter of 2011 (including the terminated presidential helicopter program);and about $180 million at Space Systems due to increased volume (primarily commercial satellites programs, Orion andvarious strategic and defensive missile programs). The increases were partially offset by lower cost of products sales of about$530 million at IS&GS primarily due to the substantial completion of various programs during 2011 and lower volume onvarious other programs; and about $70 million at MFC due to higher risk retirements (primarily tactical missile and firecontrol programs) and the favorable resolution of contractual matters, partially offset by increased deliveries (PAC-3) andvolume (THAAD). The 0.7% decrease in the percentage of cost of products sales relative to products sales in 2012 comparedto 2011 primarily was due to higher risk retirements (primarily at MFC) as well as the favorable resolution of contractualmatters at MFC and higher risk retirements and lower reserves on ship and aviation system programs at MST.
Cost of Services Sales
Our cost of services sales increased $205 million, or 2%, in 2013 compared to 2012. Most of our cost of services salesare in the IS&GS and MFC business segments. The increase in cost of services sales was primarily attributable to higher costof services sales at our IS&GS and Aeronautics business segments partially offset by lower cost of services sales at our MFCbusiness segment. Cost of services sales increased about $245 million at IS&GS primarily due to the start-up of variousprograms. Cost of services sales increased about $40 million at Aeronautics primarily due to increased sustainment activities(primarily F-16). Cost of services sales decreased about $75 million at MFC primarily due to lower volume of varioustechnical services programs, partially offset by higher volume from various fire control programs (primarily SOF CLSS).The 0.7% decrease in the percentage of cost of services sales relative to services sales in 2013 compared to 2012 wasprimarily due to higher risk retirements on sustainment contracts at Aeronautics.
Our cost of services sales decreased $131 million, or 2%, in 2012 compared to 2011. The decrease in cost of servicessales primarily was attributable to lower cost of services sales at our MFC and MST business segments, partially offset byhigher cost of services sales at our IS&GS business segment. Cost of services sales decreased approximately $105 million atMFC primarily due to lower volume on various technical services programs. Cost of services sales decreased approximately$90 million at MST primarily due to lower volume on various training services programs. Cost of services sales increasedapproximately $80 million at IS&GS primarily due to higher net sales from QTC, which was acquired in the fourth quarter of2011, and various other services programs partially offset by lower costs from the substantial completion of ODIN in 2011and lower volume on the Hanford contract. The 0.6% increase in the percentage of cost of services sales relative to servicessales in 2012 compared to 2011 was primarily due to risk retirements on the ODIN and Hanford contracts in 2011.
Goodwill Impairment Charge
In the fourth quarter of 2013, we recorded a non-cash goodwill impairment charge of $195 million, net of state taxbenefits, which reduced our net earnings by $176 million ($.54 per share). The charge related to the Technical Servicesreporting unit within our MFC business segment and was due to the continuing impact of defense budget reductions andrelated competitive pressures on the Technical Services business, which typically has smaller customer contracts of a shorterduration. For additional information, see the “Critical Accounting Policies – Goodwill” section below and“Note 1 –Significant Accounting Policies” of our consolidated financial statements.
30
Restructuring Charges
2013 Actions
During 2013, we recorded charges related to certain severance actions totaling $201 million, net of state tax benefits, ofwhich $83 million, $37 million, and $81 million related to our IS&GS, MST, and Space Systems business segments. Thesecharges reduced our net earnings by $130 million ($.40 per share) and primarily related to a plan we committed to inNovember 2013 to close and consolidate certain facilities and reduce our total workforce by approximately 4,000 positionswithin our IS&GS, MST, and Space Systems business segments. These charges also include $30 million related to certainseverance actions at our IS&GS business segment that occurred in the first quarter of 2013, which were subsequently paidin 2013.
The November 2013 plan resulted from a strategic review of these businesses’ facility capacity and future workloadprojections and is intended to better align our organization and cost structure and improve the affordability of our productsand services given the continued decline in U.S. Government spending as well as the rapidly changing competitive andeconomic landscape. Upon separation, terminated employees will receive lump-sum severance payments primarily based onyears of service. During 2013, we paid approximately $15 million in severance payments associated with these actions, withthe remainder expected to be paid through the middle of 2015.
In addition to the severance charges described above, we expect to incur accelerated and incremental costs (e.g.,accelerated depreciation expense related to long-lived assets at the sites to be closed, relocation of equipment and otheremployee related costs) of approximately $15 million, $50 million, and $135 million at our IS&GS, MST, and SpaceSystems business segments related to the facility closures and consolidations. The accelerated and incremental costs will beexpensed as incurred in the respective business segment’s results of operations through their completion in 2015. We expectto recover a substantial amount of the restructuring charges through the pricing of our products and services to the U.S.Government and other customers in future periods, with the impact included in the respective business segment’s results ofoperations. Of the total accelerated and incremental costs to be incurred mentioned above, we expect $25 million, net ofrecoveries, at MST and $55 million, net of recoveries, at Space Systems will be incurred in 2014. Also, we expect therestructuring charges will reduce our 2014 cash flow from operations by approximately $150 million, mostly due to expectedseverance payments in 2014.
2012 and 2011 Actions
During 2012, we recorded charges related to certain severance actions totaling $48 million, net of state tax benefits, ofwhich $25 million related to our Aeronautics business segment and $23 million related to the reorganization of our formerElectronic Systems business segment. These charges reduced our net earnings by $31 million ($.09 per share) and consistedof severance costs associated with the elimination of certain positions through either voluntary or involuntary actions. Theseseverance actions resulted from cost reduction initiatives to better align our organization with changing economic conditions.Upon separation, terminated employees received lump-sum severance payments primarily based on years of service, all ofwhich were paid in 2013.
During 2011, we recorded charges related to certain severance actions totaling $136 million, net of state tax benefits, ofwhich $49 million, $48 million, and $39 million related to our Aeronautics, Space Systems, and our IS&GS businesssegments and Corporate Headquarters. These charges reduced our net earnings by $88 million ($.26 per share) and consistedof severance costs associated with the elimination of certain positions through either voluntary or involuntary actions. Theseseverance actions resulted from a strategic review of these businesses and our Corporate Headquarters and are intended tobetter align our organization and cost structure with changing economic conditions. The workforce reductions at the businesssegments also reflected changes in program lifecycles, where several of our major programs were either transitioning out ofdevelopment and into production or were ending. Upon separation, terminated employees received lump-sum severancepayments based on years of service. During 2011, we made approximately half of the severance payments associated withthese 2011 severance actions, and paid the remaining amounts in 2012.
Other Unallocated Costs
Other unallocated costs principally include FAS/CAS pension expense, stock-based compensation, and other corporatecosts. These costs are not allocated to the business segments and, therefore, are excluded from the costs of products andservices sales (see “Note 4 – Information on Business Segments” of our consolidated financial statements for a description ofthese items). The decreases of $219 million and $77 million in other unallocated costs from 2012 to 2013 and 2011 to 2012
31
were primarily attributable to the decrease in FAS/CAS pension expense, partially offset by fluctuations in other costsassociated with various corporate items, none of which were individually significant. We expect FAS/CAS pension incomeof $345 million in 2014 as further discussed in the “Critical Accounting Policies - Postretirement Benefit Plans” sectionbelow.
Other Income, Net
Other income, net for 2013 was $318 million, compared to $238 million in 2012 and $276 million in 2011. The changesbetween years primarily were due to fluctuations in equity earnings in investees in our Space Systems business segment, asdiscussed in the “Business Segment Results of Operations” section below.
Interest Expense
Interest expense for 2013 was $350 million, compared to $383 million in 2012 and $354 million in 2011. The decreasefrom 2012 to 2013 was primarily attributable to lower interest rates on our outstanding debt from the December 2012 debtexchange (Note 9). The increase from 2011 to 2012 was primarily due to increased interest expense from the $2.0 billionissuance of long-term debt in September 2011, partially offset by the redemption of $500 million in certain long-term notesin October 2011 (Note 9).
Other Non-Operating Income (Expense), Net
Other non-operating income, net decreased $21 million from 2012 to 2013 primarily due to a gain from the sale of aninvestment in 2012. Other non-operating income (expense), net was $21 million in 2012 and $(35) million in 2011, with thechange between years primarily due to premiums of $48 million on early extinguishments of debt that occurred in 2011(Note 9).
Income Tax Expense
Our effective income tax rate from continuing operations was 29.0% for 2013, 32.6% for 2012, and 26.5% for 2011. Therates generally benefit from tax deductions for U.S. manufacturing activities and tax deductions for dividends paid to ourdefined contribution plans with an employee stock ownership plan feature.
The U.S. manufacturing deduction benefit for 2013 and 2011 reduced our effective tax rate by approximately twopercentage points as compared to 2012. These fluctuations between years occurred because our tax-deductible discretionarypension contributions of $2.5 billion in 2012, which reduced U.S. manufacturing deduction benefits by $59 million ($.18 pershare), were significantly higher than in 2013 or 2011.
Our effective income tax rate for 2013 was reduced by approximately two percentage points because of U.S. researchand development (R&D) tax credits. On January 2, 2013, the President signed into law the American Taxpayer Relief Act of2012, which retroactively reinstated the R&D tax credit for two years, from January 1, 2012 through December 31, 2013. Asthe effects of tax law changes are recognized in the period in which new legislation is enacted, $37 million ($.11 per share)of tax benefit attributable to 2012 was recorded during 2013, in addition to $39 million ($.12 per share) of tax benefitattributable to 2013. Since we recorded two years of R&D tax credit in 2013, we expect our effective tax rate to increase in2014 whether or not Congress reenacts the R&D tax credit for 2014.
Our effective tax rate for 2013 was increased by approximately one percentage point due to the non-cash goodwillimpairment charge recorded in the fourth quarter of 2013 (Note 1), as only a portion of the charge will qualify for a taxdeduction.
Our effective income tax rate for 2011 was reduced by approximately two and one-half percentage points because inApril 2011 the U.S. Congressional Joint Committee on Taxation completed its review of the Internal Revenue Service (IRS)Appeals Division’s resolution of certain adjustments related to our tax years 2003 through 2008. As a result, we recognizedadditional tax benefits and reduced our income tax expense for 2011 by $89 million ($.26 per share). Our effective incometax rate for 2011 also was reduced by approximately one percentage point due to R&D tax credits.
Future changes in tax law could significantly impact the provision for income taxes, the amount of taxes payable, andthe deferred tax asset and liability balances. Recent proposals to lower the U.S. corporate income tax rate would require us toreduce our net deferred tax assets upon enactment of the related tax legislation, with a corresponding material, one-time
32
increase to income tax expense, but our income tax expense and payments would be materially reduced in subsequent years.Our net deferred tax assets as of December 31, 2013 and 2012 were $3.9 billion and $6.1 billion, based on a 35% Federalstatutory income tax rate, and primarily relate to our postretirement benefit plans. If the Federal statutory income tax rate hadbeen lowered to 25% at December 31, 2013, our net deferred tax assets would have been reduced by $1.1 billion, and wewould have recorded a corresponding, one time increase in income tax expense of $1.1 billion. The amount of net deferredtax assets will change periodically based on several factors, including the annual measurement of our postretirement benefitplan obligations and actual cash contributions to our postretirement benefit plans.
Net Earnings from Continuing Operations
We reported net earnings from continuing operations of $2.95 billion ($9.04 per share) in 2013, $2.75 billion ($8.36 pershare) in 2012, and $2.67 billion ($7.85 per share) in 2011. Both net earnings from continuing operations and earnings pershare were affected by the factors discussed above.
Net Earnings (Loss) from Discontinued Operations
Net earnings from discontinued operations for 2013 included a benefit of $31 million resulting from the resolution ofcertain tax matters related to a business previously sold. Discontinued operations for 2011 included the operating results andother adjustments of Savi, a logistics business sold in 2012 that was in our former Electronic Systems business segment, andPAE, a business sold in 2011 that was formerly within our IS&GS business segment. Net loss from discontinued operationswas $12 million ($.04 per share) in 2011, and included a deferred tax asset of $66 million that we expected to realize on thesale of Savi because our tax basis was higher than our book basis. This tax benefit was largely offset by operating losses andother adjustments. For more information, see “Note 14 – Acquisitions and Divestitures” of our consolidated financialstatements.
Business Segment Results of Operations
We operate in five business segments: Aeronautics, IS&GS, MFC, MST, and Space Systems. We organize our businesssegments based on the nature of the products and services offered.
Net sales of our business segments exclude intersegment sales, as these activities are eliminated in consolidation.Intercompany transactions are generally negotiated under terms and conditions that share many similar characteristics (e.g.,contract structures, funding profiles, target cost values, contract progress reports) with our third-party contracts, primarilywith the U.S. Government.
Operating profit of our business segments includes our share of earnings or losses from equity method investees becausethe operating activities of the equity method investees are closely aligned with the operations of those business segments.Operating profit of our business segments excludes the FAS/CAS pension adjustment described below; expense for stock-based compensation; the effects of items not considered part of management’s evaluation of segment operating performance,such as charges related to goodwill impairment (Note 1) and significant severance actions (Note 2); gains or losses fromdivestitures (Note 14); the effects of certain legal settlements; corporate costs not allocated to our business segments; andother miscellaneous corporate activities. These items are included in the reconciling item “Unallocated expenses, net”between operating profit from our business segments and our consolidated operating profit.
The results of operations of our business segments include pension expense only as determined and funded inaccordance with U.S. Government Cost Accounting Standards (CAS). The FAS/CAS pension adjustment represents thedifference between pension expense calculated in accordance with GAAP and pension costs calculated and funded inaccordance with CAS. CAS governs the extent to which pension costs can be allocated to and recovered on U.S. Governmentcontracts. The CAS cost is recovered through the pricing of our products and services on U.S. Government contracts and,therefore, is recognized in each of our business segments’ net sales and cost of sales.
33
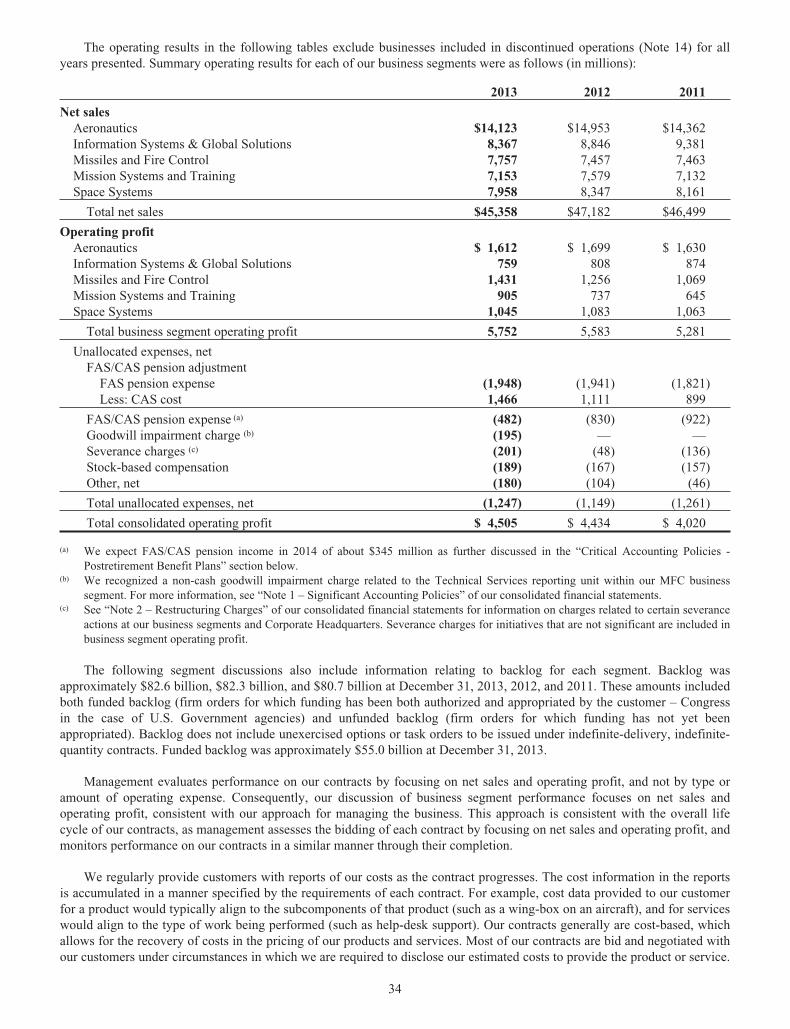
The operating results in the following tables exclude businesses included in discontinued operations (Note 14) for allyears presented. Summary operating results for each of our business segments were as follows (in millions):
2013 2012 2011
Net salesAeronautics $14,123 $14,953 $14,362Information Systems & Global Solutions 8,367 8,846 9,381Missiles and Fire Control 7,757 7,457 7,463Mission Systems and Training 7,153 7,579 7,132Space Systems 7,958 8,347 8,161
Total net sales $45,358 $47,182 $46,499
Operating profitAeronautics $ 1,612 $ 1,699 $ 1,630Information Systems & Global Solutions 759 808 874Missiles and Fire Control 1,431 1,256 1,069Mission Systems and Training 905 737 645Space Systems 1,045 1,083 1,063
Total business segment operating profit 5,752 5,583 5,281
Unallocated expenses, netFAS/CAS pension adjustment
FAS pension expense (1,948) (1,941) (1,821)Less: CAS cost 1,466 1,111 899
FAS/CAS pension expense (a) (482) (830) (922)Goodwill impairment charge (b) (195) — —Severance charges (c) (201) (48) (136)Stock-based compensation (189) (167) (157)Other, net (180) (104) (46)
Total unallocated expenses, net (1,247) (1,149) (1,261)
Total consolidated operating profit $ 4,505 $ 4,434 $ 4,020
(a) We expect FAS/CAS pension income in 2014 of about $345 million as further discussed in the “Critical Accounting Policies -Postretirement Benefit Plans” section below.
(b) We recognized a non-cash goodwill impairment charge related to the Technical Services reporting unit within our MFC businesssegment. For more information, see “Note 1 – Significant Accounting Policies” of our consolidated financial statements.
(c) See “Note 2 – Restructuring Charges” of our consolidated financial statements for information on charges related to certain severanceactions at our business segments and Corporate Headquarters. Severance charges for initiatives that are not significant are included inbusiness segment operating profit.
The following segment discussions also include information relating to backlog for each segment. Backlog wasapproximately $82.6 billion, $82.3 billion, and $80.7 billion at December 31, 2013, 2012, and 2011. These amounts includedboth funded backlog (firm orders for which funding has been both authorized and appropriated by the customer – Congressin the case of U.S. Government agencies) and unfunded backlog (firm orders for which funding has not yet beenappropriated). Backlog does not include unexercised options or task orders to be issued under indefinite-delivery, indefinite-quantity contracts. Funded backlog was approximately $55.0 billion at December 31, 2013.
Management evaluates performance on our contracts by focusing on net sales and operating profit, and not by type oramount of operating expense. Consequently, our discussion of business segment performance focuses on net sales andoperating profit, consistent with our approach for managing the business. This approach is consistent with the overall lifecycle of our contracts, as management assesses the bidding of each contract by focusing on net sales and operating profit, andmonitors performance on our contracts in a similar manner through their completion.
We regularly provide customers with reports of our costs as the contract progresses. The cost information in the reportsis accumulated in a manner specified by the requirements of each contract. For example, cost data provided to our customerfor a product would typically align to the subcomponents of that product (such as a wing-box on an aircraft), and for serviceswould align to the type of work being performed (such as help-desk support). Our contracts generally are cost-based, whichallows for the recovery of costs in the pricing of our products and services. Most of our contracts are bid and negotiated withour customers under circumstances in which we are required to disclose our estimated costs to provide the product or service.
34
This approach for negotiating contracts with our U.S. Government customers generally allows for the recovery of our costs.We also may enter into long-term supply contracts for certain materials or components to coincide with the productionschedule of certain products and to ensure their availability at known unit prices.
Many of our contracts span several years and include highly complex technical requirements. At the outset of a contract,we identify and monitor risks to the achievement of the technical, schedule, and cost aspects of the contract, and assess theeffects of those risks on our estimates of total costs to complete the contract. The estimates consider the technicalrequirements (e.g., a newly-developed product versus a mature product), the schedule and associated tasks (e.g., the numberand type of milestone events), and costs (e.g., material, labor, subcontractor and overhead). The initial profit booking rate ofeach contract considers risks surrounding the ability to achieve the technical requirements, schedule, and costs in the initialestimated costs at completion. Profit booking rates may increase during the performance of the contract if we successfullyretire risks surrounding the technical, schedule and cost aspects of the contract. Conversely, our profit booking rates maydecrease if the estimated costs to complete the contract increase. All of the estimates are subject to change during theperformance of the contract and may affect the profit booking rate.
We have a number of programs that are designated as classified by the U.S. Government which cannot be specificallydescribed. The operating results of these classified programs are included in our consolidated and business segment results,and are subjected to the same oversight and internal controls as our other programs.
Our net sales are primarily derived from long-term contracts for products and services provided to the U.S. Governmentas well as FMS contracted through the U.S. Government. We account for these contracts, as well as product contracts withnon-U.S. Government customers, using the percentage-of-completion method of accounting, which represent substantially allof our net sales. We derive our remaining net sales from contracts to provide services to non-U.S. Government customers,which we account for under the services method of accounting.
Under the percentage-of-completion method of accounting, we record sales on contracts based upon our progresstowards completion on a particular contract as well as our estimate of the profit to be earned at completion. Cost-reimbursable contracts provide for the payment of allowable costs plus a fee. For fixed-priced contracts, net sales and cost ofsales are recognized as products are delivered or as costs are incurred. Due to the nature of the percentage-of-completionmethod of accounting, changes in our cost of sales are typically accompanied by a related change in our net sales.
In the discussion of comparative segment results, changes in net sales and operating profit generally are expressed interms of volume. Changes in volume refer to increases or decreases in sales resulting from varying production activity levels,deliveries, or service levels on individual contracts. Volume changes typically include a corresponding change in segmentoperating profit based on the current profit booking rate for a particular contract.
In addition, comparability of our sales, segment operating profit, and segment operating margins may be impacted bychanges in profit booking rates on our contracts accounted for using the percentage-of-completion method of accounting.Increases in the profit booking rates, typically referred to as risk retirements, usually relate to revisions in the total estimatedcosts at completion that reflect improved conditions on a particular contract. Conversely, conditions on a particular contractmay deteriorate resulting in an increase in the estimated costs at completion and a reduction of the profit booking rate.Increases or decreases in profit booking rates are recognized in the current period and reflect the inception-to-date effect ofsuch changes. Segment operating profit and segment operating margins may also be impacted, favorably or unfavorably, byother matters such as the resolution of contractual matters; restructuring charges, except for significant severance actions asmentioned above; cost recoveries on all restructuring charges; reserves for disputes; asset impairments; and insurancerecoveries; among others. Segment operating profit and items such as risk retirements, reductions of profit booking rates, orother matters are presented net of state income taxes.
Our consolidated net adjustments not related to volume, including net profit booking rate adjustments and other matters,increased segment operating profit, net of state income taxes, by approximately $2.1 billion, $1.9 billion, and $1.6 billion for2013, 2012, and 2011. The increase in our consolidated net adjustments for 2013 as compared to 2012 primarily was due toan increase in profit booking rate adjustments at our MST and MFC business segments and, to a lesser extent, the increase inthe favorable resolution of contractual matters for the corporation. The increase in our consolidated net adjustments for 2012as compared to 2011 primarily was due to an increase in profit booking rate adjustments and the favorable resolution ofcontractual matters at our MST and MFC business segments. The consolidated net adjustments for 2013 and 2012 areinclusive of approximately $600 million and $500 million in unfavorable items, which include a significant profit reductionon the F-35 development contract in both years, as well as a significant profit reduction on the C-5 program in 2013, each asdescribed in our Aeronautics business segment’s results of operations discussion below. Unfavorable items in 2012 wereabout $100 million higher than 2011, primarily due to a significant profit reduction on the F-35 development contract in 2012as mentioned above.
35
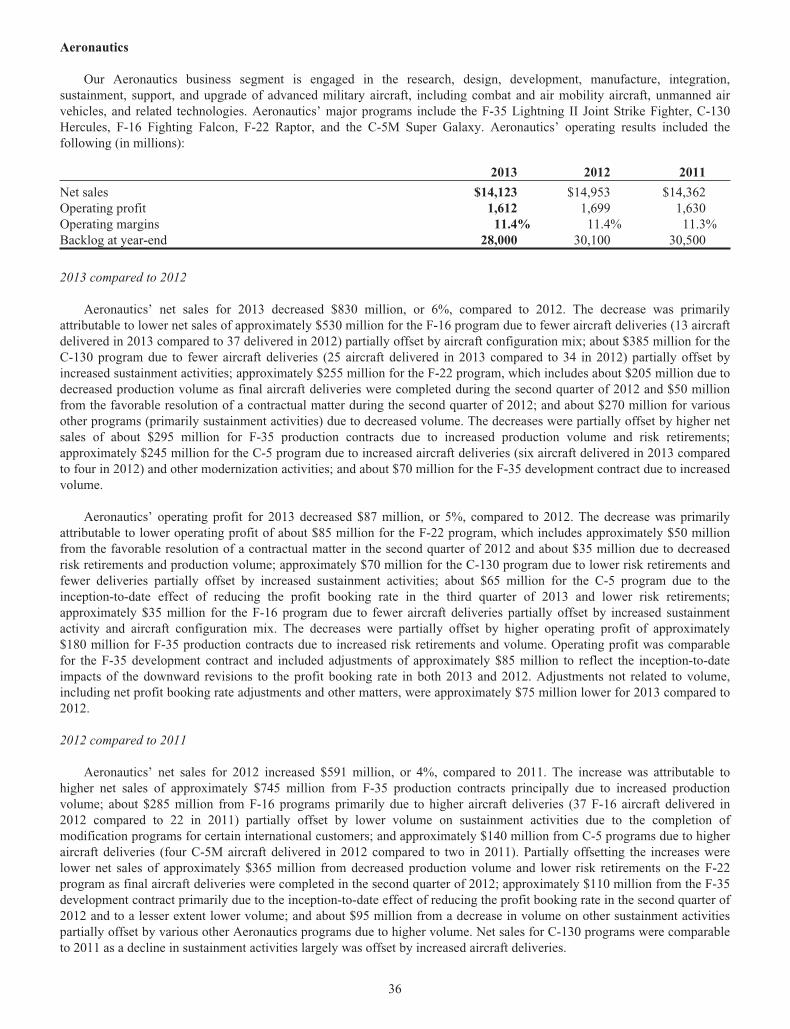
Aeronautics
Our Aeronautics business segment is engaged in the research, design, development, manufacture, integration,sustainment, support, and upgrade of advanced military aircraft, including combat and air mobility aircraft, unmanned airvehicles, and related technologies. Aeronautics’ major programs include the F-35 Lightning II Joint Strike Fighter, C-130Hercules, F-16 Fighting Falcon, F-22 Raptor, and the C-5M Super Galaxy. Aeronautics’ operating results included thefollowing (in millions):
2013 2012 2011
Net sales $14,123 $14,953 $14,362Operating profit 1,612 1,699 1,630Operating margins 11.4% 11.4% 11.3%Backlog at year-end 28,000 30,100 30,500
2013 compared to 2012
Aeronautics’ net sales for 2013 decreased $830 million, or 6%, compared to 2012. The decrease was primarilyattributable to lower net sales of approximately $530 million for the F-16 program due to fewer aircraft deliveries (13 aircraftdelivered in 2013 compared to 37 delivered in 2012) partially offset by aircraft configuration mix; about $385 million for theC-130 program due to fewer aircraft deliveries (25 aircraft delivered in 2013 compared to 34 in 2012) partially offset byincreased sustainment activities; approximately $255 million for the F-22 program, which includes about $205 million due todecreased production volume as final aircraft deliveries were completed during the second quarter of 2012 and $50 millionfrom the favorable resolution of a contractual matter during the second quarter of 2012; and about $270 million for variousother programs (primarily sustainment activities) due to decreased volume. The decreases were partially offset by higher netsales of about $295 million for F-35 production contracts due to increased production volume and risk retirements;approximately $245 million for the C-5 program due to increased aircraft deliveries (six aircraft delivered in 2013 comparedto four in 2012) and other modernization activities; and about $70 million for the F-35 development contract due to increasedvolume.
Aeronautics’ operating profit for 2013 decreased $87 million, or 5%, compared to 2012. The decrease was primarilyattributable to lower operating profit of about $85 million for the F-22 program, which includes approximately $50 millionfrom the favorable resolution of a contractual matter in the second quarter of 2012 and about $35 million due to decreasedrisk retirements and production volume; approximately $70 million for the C-130 program due to lower risk retirements andfewer deliveries partially offset by increased sustainment activities; about $65 million for the C-5 program due to theinception-to-date effect of reducing the profit booking rate in the third quarter of 2013 and lower risk retirements;approximately $35 million for the F-16 program due to fewer aircraft deliveries partially offset by increased sustainmentactivity and aircraft configuration mix. The decreases were partially offset by higher operating profit of approximately$180 million for F-35 production contracts due to increased risk retirements and volume. Operating profit was comparablefor the F-35 development contract and included adjustments of approximately $85 million to reflect the inception-to-dateimpacts of the downward revisions to the profit booking rate in both 2013 and 2012. Adjustments not related to volume,including net profit booking rate adjustments and other matters, were approximately $75 million lower for 2013 compared to2012.
2012 compared to 2011
Aeronautics’ net sales for 2012 increased $591 million, or 4%, compared to 2011. The increase was attributable tohigher net sales of approximately $745 million from F-35 production contracts principally due to increased productionvolume; about $285 million from F-16 programs primarily due to higher aircraft deliveries (37 F-16 aircraft delivered in2012 compared to 22 in 2011) partially offset by lower volume on sustainment activities due to the completion ofmodification programs for certain international customers; and approximately $140 million from C-5 programs due to higheraircraft deliveries (four C-5M aircraft delivered in 2012 compared to two in 2011). Partially offsetting the increases werelower net sales of approximately $365 million from decreased production volume and lower risk retirements on the F-22program as final aircraft deliveries were completed in the second quarter of 2012; approximately $110 million from the F-35development contract primarily due to the inception-to-date effect of reducing the profit booking rate in the second quarter of2012 and to a lesser extent lower volume; and about $95 million from a decrease in volume on other sustainment activitiespartially offset by various other Aeronautics programs due to higher volume. Net sales for C-130 programs were comparableto 2011 as a decline in sustainment activities largely was offset by increased aircraft deliveries.
36
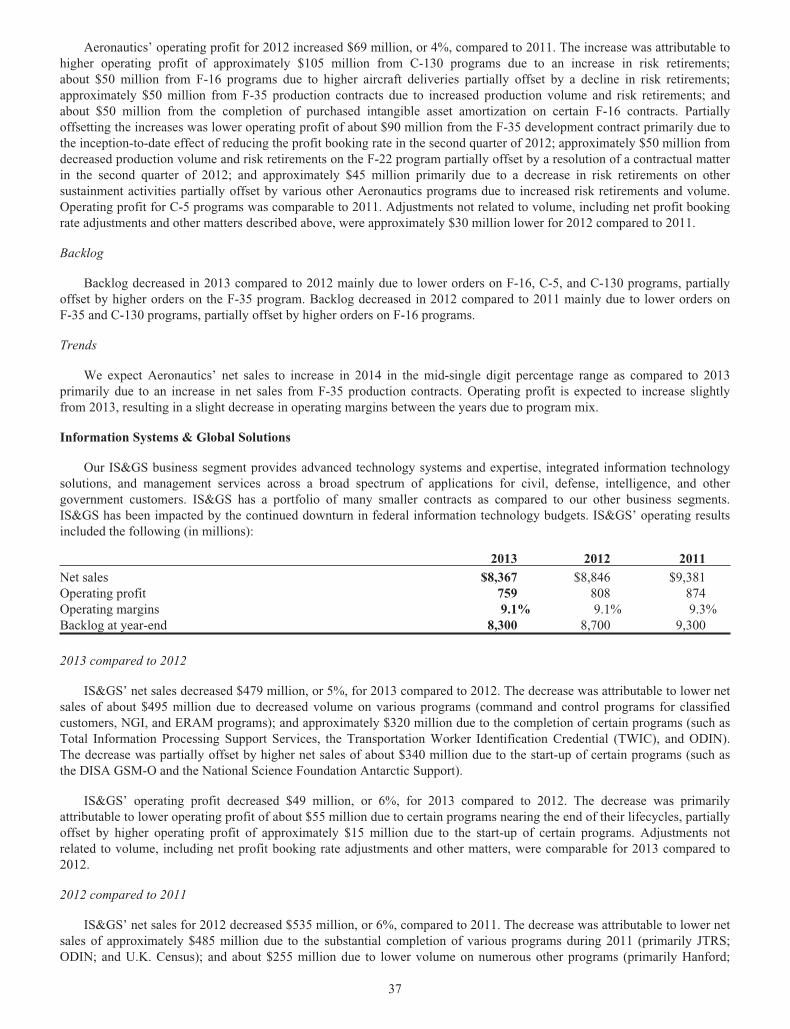
Aeronautics’ operating profit for 2012 increased $69 million, or 4%, compared to 2011. The increase was attributable tohigher operating profit of approximately $105 million from C-130 programs due to an increase in risk retirements;about $50 million from F-16 programs due to higher aircraft deliveries partially offset by a decline in risk retirements;approximately $50 million from F-35 production contracts due to increased production volume and risk retirements; andabout $50 million from the completion of purchased intangible asset amortization on certain F-16 contracts. Partiallyoffsetting the increases was lower operating profit of about $90 million from the F-35 development contract primarily due tothe inception-to-date effect of reducing the profit booking rate in the second quarter of 2012; approximately $50 million fromdecreased production volume and risk retirements on the F-22 program partially offset by a resolution of a contractual matterin the second quarter of 2012; and approximately $45 million primarily due to a decrease in risk retirements on othersustainment activities partially offset by various other Aeronautics programs due to increased risk retirements and volume.Operating profit for C-5 programs was comparable to 2011. Adjustments not related to volume, including net profit bookingrate adjustments and other matters described above, were approximately $30 million lower for 2012 compared to 2011.
Backlog
Backlog decreased in 2013 compared to 2012 mainly due to lower orders on F-16, C-5, and C-130 programs, partiallyoffset by higher orders on the F-35 program. Backlog decreased in 2012 compared to 2011 mainly due to lower orders onF-35 and C-130 programs, partially offset by higher orders on F-16 programs.
Trends
We expect Aeronautics’ net sales to increase in 2014 in the mid-single digit percentage range as compared to 2013primarily due to an increase in net sales from F-35 production contracts. Operating profit is expected to increase slightlyfrom 2013, resulting in a slight decrease in operating margins between the years due to program mix.
Information Systems & Global Solutions
Our IS&GS business segment provides advanced technology systems and expertise, integrated information technologysolutions, and management services across a broad spectrum of applications for civil, defense, intelligence, and othergovernment customers. IS&GS has a portfolio of many smaller contracts as compared to our other business segments.IS&GS has been impacted by the continued downturn in federal information technology budgets. IS&GS’ operating resultsincluded the following (in millions):
2013 2012 2011
Net sales $8,367 $8,846 $9,381Operating profit 759 808 874Operating margins 9.1% 9.1% 9.3%Backlog at year-end 8,300 8,700 9,300
2013 compared to 2012
IS&GS’ net sales decreased $479 million, or 5%, for 2013 compared to 2012. The decrease was attributable to lower netsales of about $495 million due to decreased volume on various programs (command and control programs for classifiedcustomers, NGI, and ERAM programs); and approximately $320 million due to the completion of certain programs (such asTotal Information Processing Support Services, the Transportation Worker Identification Credential (TWIC), and ODIN).The decrease was partially offset by higher net sales of about $340 million due to the start-up of certain programs (such asthe DISA GSM-O and the National Science Foundation Antarctic Support).
IS&GS’ operating profit decreased $49 million, or 6%, for 2013 compared to 2012. The decrease was primarilyattributable to lower operating profit of about $55 million due to certain programs nearing the end of their lifecycles, partiallyoffset by higher operating profit of approximately $15 million due to the start-up of certain programs. Adjustments notrelated to volume, including net profit booking rate adjustments and other matters, were comparable for 2013 compared to2012.
2012 compared to 2011
IS&GS’ net sales for 2012 decreased $535 million, or 6%, compared to 2011. The decrease was attributable to lower netsales of approximately $485 million due to the substantial completion of various programs during 2011 (primarily JTRS;ODIN; and U.K. Census); and about $255 million due to lower volume on numerous other programs (primarily Hanford;
37
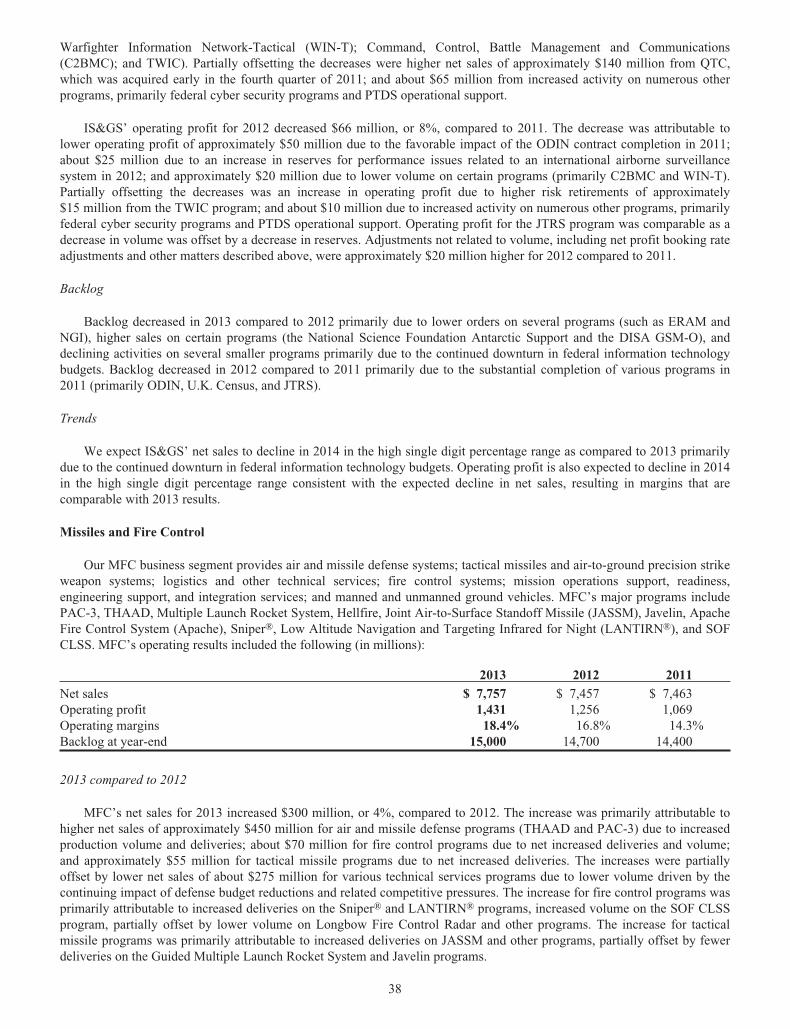
Warfighter Information Network-Tactical (WIN-T); Command, Control, Battle Management and Communications(C2BMC); and TWIC). Partially offsetting the decreases were higher net sales of approximately $140 million from QTC,which was acquired early in the fourth quarter of 2011; and about $65 million from increased activity on numerous otherprograms, primarily federal cyber security programs and PTDS operational support.
IS&GS’ operating profit for 2012 decreased $66 million, or 8%, compared to 2011. The decrease was attributable tolower operating profit of approximately $50 million due to the favorable impact of the ODIN contract completion in 2011;about $25 million due to an increase in reserves for performance issues related to an international airborne surveillancesystem in 2012; and approximately $20 million due to lower volume on certain programs (primarily C2BMC and WIN-T).Partially offsetting the decreases was an increase in operating profit due to higher risk retirements of approximately$15 million from the TWIC program; and about $10 million due to increased activity on numerous other programs, primarilyfederal cyber security programs and PTDS operational support. Operating profit for the JTRS program was comparable as adecrease in volume was offset by a decrease in reserves. Adjustments not related to volume, including net profit booking rateadjustments and other matters described above, were approximately $20 million higher for 2012 compared to 2011.
Backlog
Backlog decreased in 2013 compared to 2012 primarily due to lower orders on several programs (such as ERAM andNGI), higher sales on certain programs (the National Science Foundation Antarctic Support and the DISA GSM-O), anddeclining activities on several smaller programs primarily due to the continued downturn in federal information technologybudgets. Backlog decreased in 2012 compared to 2011 primarily due to the substantial completion of various programs in2011 (primarily ODIN, U.K. Census, and JTRS).
Trends
We expect IS&GS’ net sales to decline in 2014 in the high single digit percentage range as compared to 2013 primarilydue to the continued downturn in federal information technology budgets. Operating profit is also expected to decline in 2014in the high single digit percentage range consistent with the expected decline in net sales, resulting in margins that arecomparable with 2013 results.
Missiles and Fire Control
Our MFC business segment provides air and missile defense systems; tactical missiles and air-to-ground precision strikeweapon systems; logistics and other technical services; fire control systems; mission operations support, readiness,engineering support, and integration services; and manned and unmanned ground vehicles. MFC’s major programs includePAC-3, THAAD, Multiple Launch Rocket System, Hellfire, Joint Air-to-Surface Standoff Missile (JASSM), Javelin, ApacheFire Control System (Apache), Sniper®, Low Altitude Navigation and Targeting Infrared for Night (LANTIRN®), and SOFCLSS. MFC’s operating results included the following (in millions):
2013 2012 2011
Net sales $ 7,757 $ 7,457 $ 7,463Operating profit 1,431 1,256 1,069Operating margins 18.4% 16.8% 14.3%Backlog at year-end 15,000 14,700 14,400
2013 compared to 2012
MFC’s net sales for 2013 increased $300 million, or 4%, compared to 2012. The increase was primarily attributable tohigher net sales of approximately $450 million for air and missile defense programs (THAAD and PAC-3) due to increasedproduction volume and deliveries; about $70 million for fire control programs due to net increased deliveries and volume;and approximately $55 million for tactical missile programs due to net increased deliveries. The increases were partiallyoffset by lower net sales of about $275 million for various technical services programs due to lower volume driven by thecontinuing impact of defense budget reductions and related competitive pressures. The increase for fire control programs wasprimarily attributable to increased deliveries on the Sniper® and LANTIRN® programs, increased volume on the SOF CLSSprogram, partially offset by lower volume on Longbow Fire Control Radar and other programs. The increase for tacticalmissile programs was primarily attributable to increased deliveries on JASSM and other programs, partially offset by fewerdeliveries on the Guided Multiple Launch Rocket System and Javelin programs.
38
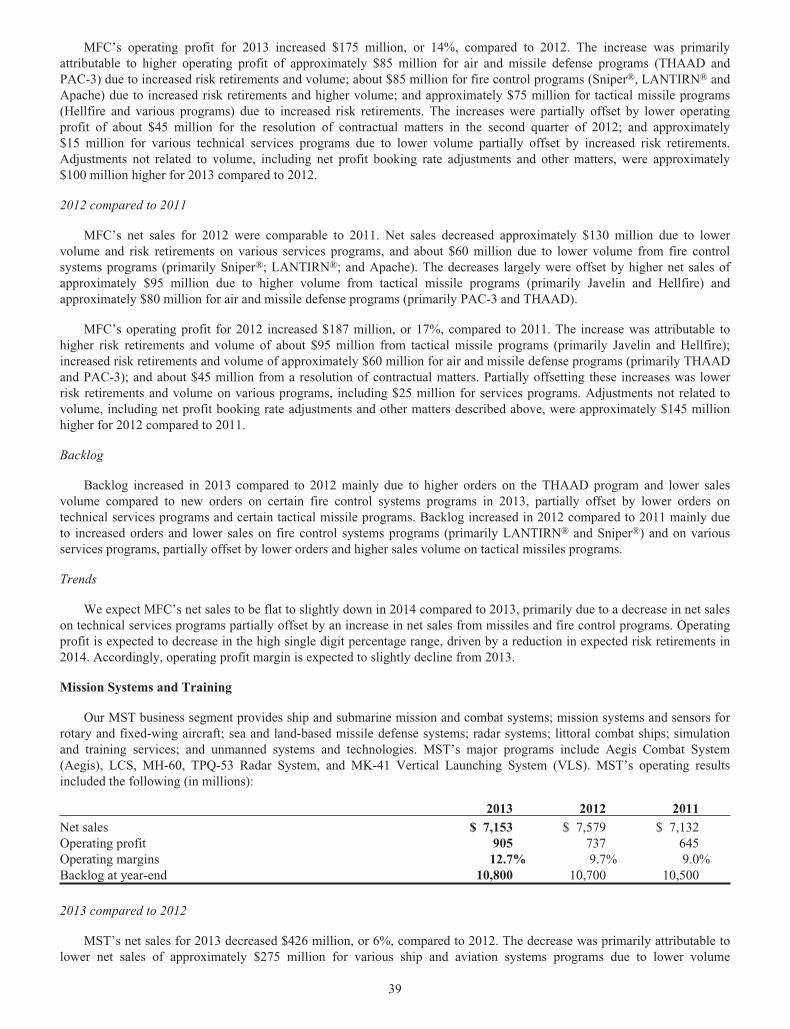
MFC’s operating profit for 2013 increased $175 million, or 14%, compared to 2012. The increase was primarilyattributable to higher operating profit of approximately $85 million for air and missile defense programs (THAAD andPAC-3) due to increased risk retirements and volume; about $85 million for fire control programs (Sniper®, LANTIRN® andApache) due to increased risk retirements and higher volume; and approximately $75 million for tactical missile programs(Hellfire and various programs) due to increased risk retirements. The increases were partially offset by lower operatingprofit of about $45 million for the resolution of contractual matters in the second quarter of 2012; and approximately$15 million for various technical services programs due to lower volume partially offset by increased risk retirements.Adjustments not related to volume, including net profit booking rate adjustments and other matters, were approximately$100 million higher for 2013 compared to 2012.
2012 compared to 2011
MFC’s net sales for 2012 were comparable to 2011. Net sales decreased approximately $130 million due to lowervolume and risk retirements on various services programs, and about $60 million due to lower volume from fire controlsystems programs (primarily Sniper®; LANTIRN®; and Apache). The decreases largely were offset by higher net sales ofapproximately $95 million due to higher volume from tactical missile programs (primarily Javelin and Hellfire) andapproximately $80 million for air and missile defense programs (primarily PAC-3 and THAAD).
MFC’s operating profit for 2012 increased $187 million, or 17%, compared to 2011. The increase was attributable tohigher risk retirements and volume of about $95 million from tactical missile programs (primarily Javelin and Hellfire);increased risk retirements and volume of approximately $60 million for air and missile defense programs (primarily THAADand PAC-3); and about $45 million from a resolution of contractual matters. Partially offsetting these increases was lowerrisk retirements and volume on various programs, including $25 million for services programs. Adjustments not related tovolume, including net profit booking rate adjustments and other matters described above, were approximately $145 millionhigher for 2012 compared to 2011.
Backlog
Backlog increased in 2013 compared to 2012 mainly due to higher orders on the THAAD program and lower salesvolume compared to new orders on certain fire control systems programs in 2013, partially offset by lower orders ontechnical services programs and certain tactical missile programs. Backlog increased in 2012 compared to 2011 mainly dueto increased orders and lower sales on fire control systems programs (primarily LANTIRN® and Sniper®) and on variousservices programs, partially offset by lower orders and higher sales volume on tactical missiles programs.
Trends
We expect MFC’s net sales to be flat to slightly down in 2014 compared to 2013, primarily due to a decrease in net saleson technical services programs partially offset by an increase in net sales from missiles and fire control programs. Operatingprofit is expected to decrease in the high single digit percentage range, driven by a reduction in expected risk retirements in2014. Accordingly, operating profit margin is expected to slightly decline from 2013.
Mission Systems and Training
Our MST business segment provides ship and submarine mission and combat systems; mission systems and sensors forrotary and fixed-wing aircraft; sea and land-based missile defense systems; radar systems; littoral combat ships; simulationand training services; and unmanned systems and technologies. MST’s major programs include Aegis Combat System(Aegis), LCS, MH-60, TPQ-53 Radar System, and MK-41 Vertical Launching System (VLS). MST’s operating resultsincluded the following (in millions):
2013 2012 2011
Net sales $ 7,153 $ 7,579 $ 7,132Operating profit 905 737 645Operating margins 12.7% 9.7% 9.0%Backlog at year-end 10,800 10,700 10,500
2013 compared to 2012
MST’s net sales for 2013 decreased $426 million, or 6%, compared to 2012. The decrease was primarily attributable tolower net sales of approximately $275 million for various ship and aviation systems programs due to lower volume
39
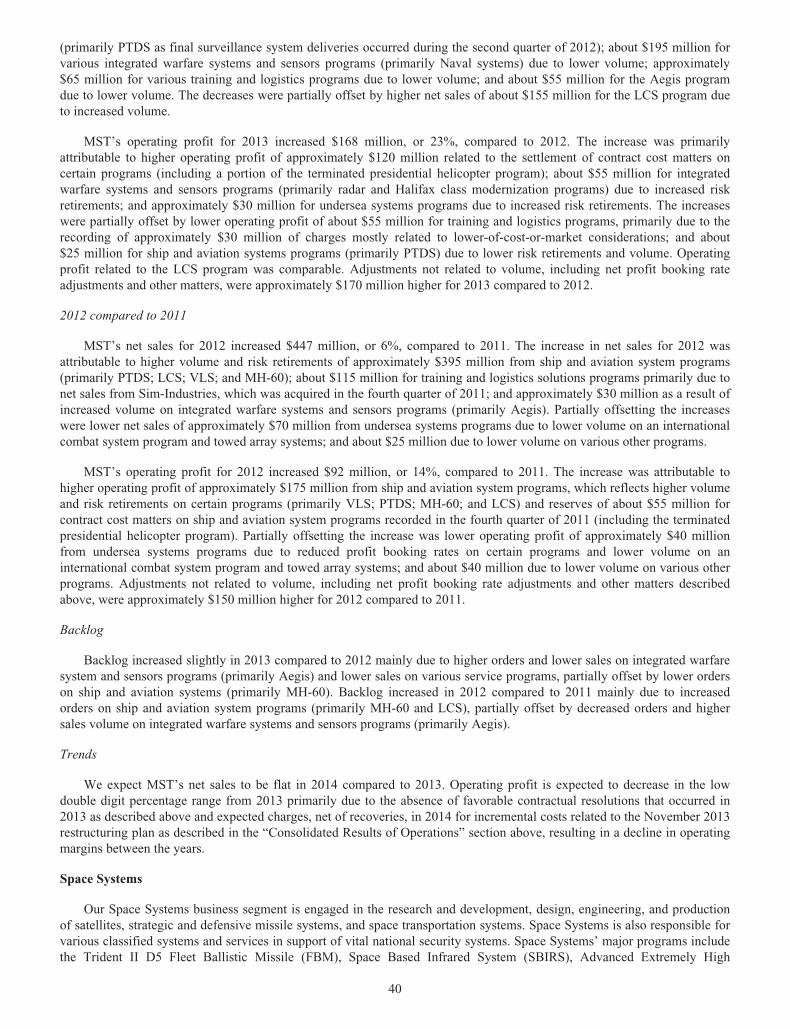
(primarily PTDS as final surveillance system deliveries occurred during the second quarter of 2012); about $195 million forvarious integrated warfare systems and sensors programs (primarily Naval systems) due to lower volume; approximately$65 million for various training and logistics programs due to lower volume; and about $55 million for the Aegis programdue to lower volume. The decreases were partially offset by higher net sales of about $155 million for the LCS program dueto increased volume.
MST’s operating profit for 2013 increased $168 million, or 23%, compared to 2012. The increase was primarilyattributable to higher operating profit of approximately $120 million related to the settlement of contract cost matters oncertain programs (including a portion of the terminated presidential helicopter program); about $55 million for integratedwarfare systems and sensors programs (primarily radar and Halifax class modernization programs) due to increased riskretirements; and approximately $30 million for undersea systems programs due to increased risk retirements. The increaseswere partially offset by lower operating profit of about $55 million for training and logistics programs, primarily due to therecording of approximately $30 million of charges mostly related to lower-of-cost-or-market considerations; and about$25 million for ship and aviation systems programs (primarily PTDS) due to lower risk retirements and volume. Operatingprofit related to the LCS program was comparable. Adjustments not related to volume, including net profit booking rateadjustments and other matters, were approximately $170 million higher for 2013 compared to 2012.
2012 compared to 2011
MST’s net sales for 2012 increased $447 million, or 6%, compared to 2011. The increase in net sales for 2012 wasattributable to higher volume and risk retirements of approximately $395 million from ship and aviation system programs(primarily PTDS; LCS; VLS; and MH-60); about $115 million for training and logistics solutions programs primarily due tonet sales from Sim-Industries, which was acquired in the fourth quarter of 2011; and approximately $30 million as a result ofincreased volume on integrated warfare systems and sensors programs (primarily Aegis). Partially offsetting the increaseswere lower net sales of approximately $70 million from undersea systems programs due to lower volume on an internationalcombat system program and towed array systems; and about $25 million due to lower volume on various other programs.
MST’s operating profit for 2012 increased $92 million, or 14%, compared to 2011. The increase was attributable tohigher operating profit of approximately $175 million from ship and aviation system programs, which reflects higher volumeand risk retirements on certain programs (primarily VLS; PTDS; MH-60; and LCS) and reserves of about $55 million forcontract cost matters on ship and aviation system programs recorded in the fourth quarter of 2011 (including the terminatedpresidential helicopter program). Partially offsetting the increase was lower operating profit of approximately $40 millionfrom undersea systems programs due to reduced profit booking rates on certain programs and lower volume on aninternational combat system program and towed array systems; and about $40 million due to lower volume on various otherprograms. Adjustments not related to volume, including net profit booking rate adjustments and other matters describedabove, were approximately $150 million higher for 2012 compared to 2011.
Backlog
Backlog increased slightly in 2013 compared to 2012 mainly due to higher orders and lower sales on integrated warfaresystem and sensors programs (primarily Aegis) and lower sales on various service programs, partially offset by lower orderson ship and aviation systems (primarily MH-60). Backlog increased in 2012 compared to 2011 mainly due to increasedorders on ship and aviation system programs (primarily MH-60 and LCS), partially offset by decreased orders and highersales volume on integrated warfare systems and sensors programs (primarily Aegis).
Trends
We expect MST’s net sales to be flat in 2014 compared to 2013. Operating profit is expected to decrease in the lowdouble digit percentage range from 2013 primarily due to the absence of favorable contractual resolutions that occurred in2013 as described above and expected charges, net of recoveries, in 2014 for incremental costs related to the November 2013restructuring plan as described in the “Consolidated Results of Operations” section above, resulting in a decline in operatingmargins between the years.
Space Systems
Our Space Systems business segment is engaged in the research and development, design, engineering, and productionof satellites, strategic and defensive missile systems, and space transportation systems. Space Systems is also responsible forvarious classified systems and services in support of vital national security systems. Space Systems’ major programs includethe Trident II D5 Fleet Ballistic Missile (FBM), Space Based Infrared System (SBIRS), Advanced Extremely High
40
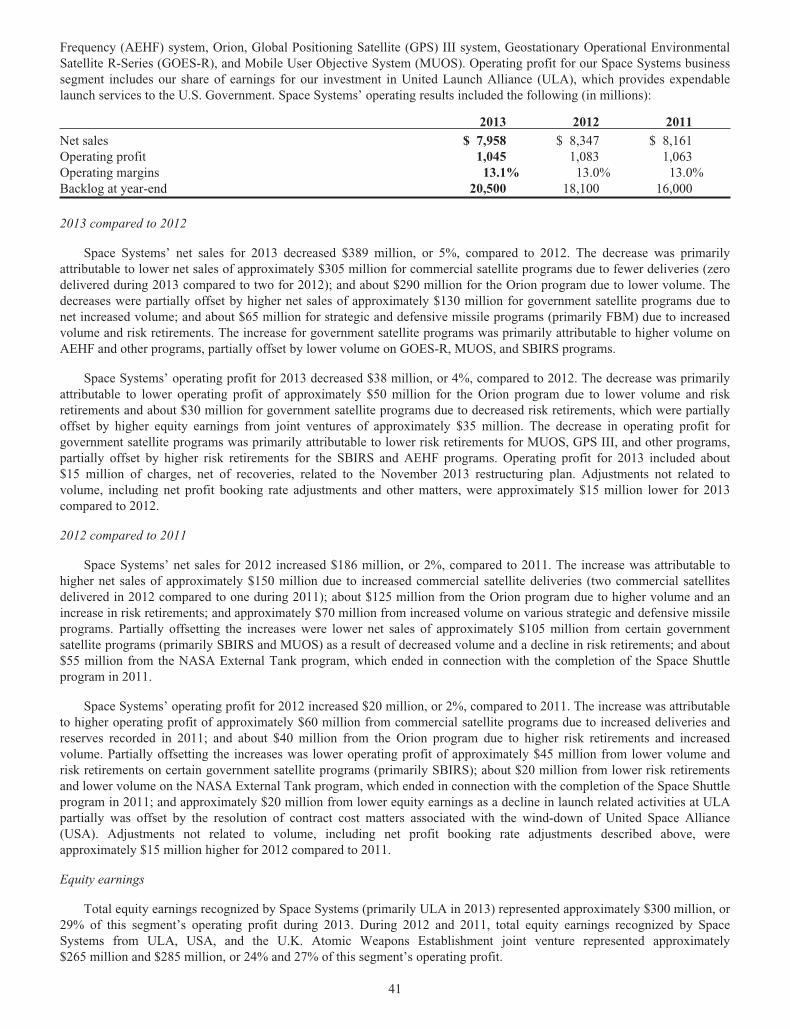
Frequency (AEHF) system, Orion, Global Positioning Satellite (GPS) III system, Geostationary Operational EnvironmentalSatellite R-Series (GOES-R), and Mobile User Objective System (MUOS). Operating profit for our Space Systems businesssegment includes our share of earnings for our investment in United Launch Alliance (ULA), which provides expendablelaunch services to the U.S. Government. Space Systems’ operating results included the following (in millions):
2013 2012 2011
Net sales $ 7,958 $ 8,347 $ 8,161Operating profit 1,045 1,083 1,063Operating margins 13.1% 13.0% 13.0%Backlog at year-end 20,500 18,100 16,000
2013 compared to 2012
Space Systems’ net sales for 2013 decreased $389 million, or 5%, compared to 2012. The decrease was primarilyattributable to lower net sales of approximately $305 million for commercial satellite programs due to fewer deliveries (zerodelivered during 2013 compared to two for 2012); and about $290 million for the Orion program due to lower volume. Thedecreases were partially offset by higher net sales of approximately $130 million for government satellite programs due tonet increased volume; and about $65 million for strategic and defensive missile programs (primarily FBM) due to increasedvolume and risk retirements. The increase for government satellite programs was primarily attributable to higher volume onAEHF and other programs, partially offset by lower volume on GOES-R, MUOS, and SBIRS programs.
Space Systems’ operating profit for 2013 decreased $38 million, or 4%, compared to 2012. The decrease was primarilyattributable to lower operating profit of approximately $50 million for the Orion program due to lower volume and riskretirements and about $30 million for government satellite programs due to decreased risk retirements, which were partiallyoffset by higher equity earnings from joint ventures of approximately $35 million. The decrease in operating profit forgovernment satellite programs was primarily attributable to lower risk retirements for MUOS, GPS III, and other programs,partially offset by higher risk retirements for the SBIRS and AEHF programs. Operating profit for 2013 included about$15 million of charges, net of recoveries, related to the November 2013 restructuring plan. Adjustments not related tovolume, including net profit booking rate adjustments and other matters, were approximately $15 million lower for 2013compared to 2012.
2012 compared to 2011
Space Systems’ net sales for 2012 increased $186 million, or 2%, compared to 2011. The increase was attributable tohigher net sales of approximately $150 million due to increased commercial satellite deliveries (two commercial satellitesdelivered in 2012 compared to one during 2011); about $125 million from the Orion program due to higher volume and anincrease in risk retirements; and approximately $70 million from increased volume on various strategic and defensive missileprograms. Partially offsetting the increases were lower net sales of approximately $105 million from certain governmentsatellite programs (primarily SBIRS and MUOS) as a result of decreased volume and a decline in risk retirements; and about$55 million from the NASA External Tank program, which ended in connection with the completion of the Space Shuttleprogram in 2011.
Space Systems’ operating profit for 2012 increased $20 million, or 2%, compared to 2011. The increase was attributableto higher operating profit of approximately $60 million from commercial satellite programs due to increased deliveries andreserves recorded in 2011; and about $40 million from the Orion program due to higher risk retirements and increasedvolume. Partially offsetting the increases was lower operating profit of approximately $45 million from lower volume andrisk retirements on certain government satellite programs (primarily SBIRS); about $20 million from lower risk retirementsand lower volume on the NASA External Tank program, which ended in connection with the completion of the Space Shuttleprogram in 2011; and approximately $20 million from lower equity earnings as a decline in launch related activities at ULApartially was offset by the resolution of contract cost matters associated with the wind-down of United Space Alliance(USA). Adjustments not related to volume, including net profit booking rate adjustments described above, wereapproximately $15 million higher for 2012 compared to 2011.
Equity earnings
Total equity earnings recognized by Space Systems (primarily ULA in 2013) represented approximately $300 million, or29% of this segment’s operating profit during 2013. During 2012 and 2011, total equity earnings recognized by SpaceSystems from ULA, USA, and the U.K. Atomic Weapons Establishment joint venture represented approximately$265 million and $285 million, or 24% and 27% of this segment’s operating profit.
41
Backlog
Backlog increased in 2013 compared to 2012 mainly due to higher orders on the Orion program, partially offset by lowerorders on government satellite programs (primarily AEHF). Backlog increased in 2012 compared to 2011 mainly due tohigher orders on government satellites activities, partially offset by lower orders on the Orion program.
Trends
We expect Space Systems’ net sales to decline in 2014 in the mid-single digit percentage range as compared to 2013primarily due to a decrease in volume on satellite programs in 2014. Operating profit is expected to decline in the low doubledigit percentage range in 2014 primarily due to lower earnings on satellite programs, expected charges, net of recoveries, in2014 for accelerated depreciation expense and incremental costs related to the November 2013 restructuring plan asdescribed in the “Consolidated Results of Operations” section above, and lower equity earnings. As a result, operatingmargins are expected to decline between the years.
Liquidity and Cash Flows
We have a balanced cash deployment strategy to enhance stockholder value and position ourselves to take advantage ofnew business opportunities when they arise. Consistent with that strategy, we have invested in our business, including capitalexpenditures and independent research and development, returned cash to stockholders through dividends and sharerepurchases, made selective acquisitions of businesses, and managed our debt levels.
We have generated strong operating cash flows, which have been the primary source of funding for our operations, debtservice and repayments, capital expenditures, dividends, share repurchases, acquisitions, and postretirement benefit planfunding. We have accessed the capital markets on limited occasions, as needed or when opportunistic. Our cash balances andcash from operations have historically been sufficient to support our operations and anticipated capital expenditures for theforeseeable future. However, our liquidity and cash flows could be materially impacted in the future if the U.S. Governmentwere to shut down due to impasses over budget and/or debt ceiling negotiations. As discussed in the “Capital Resources”section, we have financing resources available to fund potential cash outflows that are less predictable or more discretionary,should they occur. We also have access to the credit markets, if needed, for liquidity or general corporate purposes,including, but not limited to, our revolving credit facility or the ability to issue commercial paper and letters of credit tosupport customer advance payments and for other trade finance purposes such as guaranteeing our performance on particularcontracts.
Cash received from customers, either from the payment of invoices for work performed or for advances in excess ofcosts incurred, is our primary source of cash. We generally do not begin work on contracts until funding is appropriated bythe customer. Billing timetables and payment terms on our contracts vary based on a number of factors, including thecontract type. We generally bill and collect cash more frequently under cost-reimbursable and time-and-materials contracts,which together represent approximately half of the sales we recorded in 2013, as we are authorized to bill as the costs areincurred or work is performed. A number of our fixed-price contracts may provide for performance-based payments, whichallow us to bill and collect cash as we perform on the contract. The amount of performance-based payments and the relatedmilestones are encompassed in the negotiation of each contract. The timing of such payments may differ from our incurrenceof costs related to our contract performance, thereby affecting our cash flows.
The U.S. Government has indicated that it would consider progress payments as the baseline for negotiating paymentterms on fixed-price contracts, rather than performance-based payments. In contrast to negotiated performance-basedpayment terms, progress payment provisions correspond to a percentage of the amount of costs incurred during theperformance of the contract. While the total amount of cash collected on a contract is the same, performance-based paymentshave had a more favorable impact on the timing of our cash flows. In addition, our cash flows may be affected if the U.S.Government decides to withhold payments on our billings. The amount of withholds was approximately $200 million as ofDecember 31, 2012. We collected substantially all of this amount in 2013 as we resolved certain deficiencies related to U.S.Government audits of our business systems, primarily at our Aeronautics business segment. While the impact of withholdingpayments delays the receipt of cash, the cumulative amount of cash collected during the life of the contract will not vary.
The majority of our capital expenditures for 2013 and those planned for 2014 can be divided into the categories offacilities infrastructure, equipment, and information technology. Expenditures for facilities infrastructure and equipment aregenerally incurred to support new and existing programs across all of our business segments. For example, we have projectsunderway in our Aeronautics business segment for facilities and equipment to support production of the F-35 combat aircraft.
42
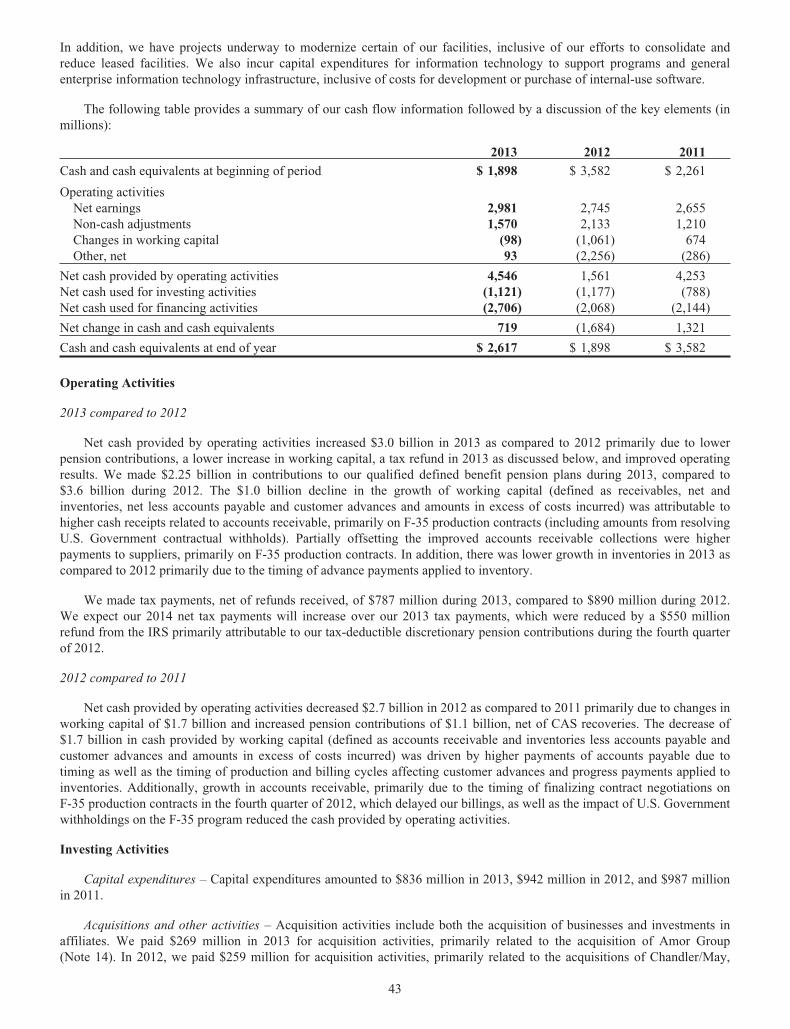
In addition, we have projects underway to modernize certain of our facilities, inclusive of our efforts to consolidate andreduce leased facilities. We also incur capital expenditures for information technology to support programs and generalenterprise information technology infrastructure, inclusive of costs for development or purchase of internal-use software.
The following table provides a summary of our cash flow information followed by a discussion of the key elements (inmillions):
2013 2012 2011
Cash and cash equivalents at beginning of period $ 1,898 $ 3,582 $ 2,261
Operating activitiesNet earnings 2,981 2,745 2,655Non-cash adjustments 1,570 2,133 1,210Changes in working capital (98) (1,061) 674Other, net 93 (2,256) (286)
Net cash provided by operating activities 4,546 1,561 4,253Net cash used for investing activities (1,121) (1,177) (788)Net cash used for financing activities (2,706) (2,068) (2,144)
Net change in cash and cash equivalents 719 (1,684) 1,321
Cash and cash equivalents at end of year $ 2,617 $ 1,898 $ 3,582
Operating Activities
2013 compared to 2012
Net cash provided by operating activities increased $3.0 billion in 2013 as compared to 2012 primarily due to lowerpension contributions, a lower increase in working capital, a tax refund in 2013 as discussed below, and improved operatingresults. We made $2.25 billion in contributions to our qualified defined benefit pension plans during 2013, compared to$3.6 billion during 2012. The $1.0 billion decline in the growth of working capital (defined as receivables, net andinventories, net less accounts payable and customer advances and amounts in excess of costs incurred) was attributable tohigher cash receipts related to accounts receivable, primarily on F-35 production contracts (including amounts from resolvingU.S. Government contractual withholds). Partially offsetting the improved accounts receivable collections were higherpayments to suppliers, primarily on F-35 production contracts. In addition, there was lower growth in inventories in 2013 ascompared to 2012 primarily due to the timing of advance payments applied to inventory.
We made tax payments, net of refunds received, of $787 million during 2013, compared to $890 million during 2012.We expect our 2014 net tax payments will increase over our 2013 tax payments, which were reduced by a $550 millionrefund from the IRS primarily attributable to our tax-deductible discretionary pension contributions during the fourth quarterof 2012.
2012 compared to 2011
Net cash provided by operating activities decreased $2.7 billion in 2012 as compared to 2011 primarily due to changes inworking capital of $1.7 billion and increased pension contributions of $1.1 billion, net of CAS recoveries. The decrease of$1.7 billion in cash provided by working capital (defined as accounts receivable and inventories less accounts payable andcustomer advances and amounts in excess of costs incurred) was driven by higher payments of accounts payable due totiming as well as the timing of production and billing cycles affecting customer advances and progress payments applied toinventories. Additionally, growth in accounts receivable, primarily due to the timing of finalizing contract negotiations onF-35 production contracts in the fourth quarter of 2012, which delayed our billings, as well as the impact of U.S. Governmentwithholdings on the F-35 program reduced the cash provided by operating activities.
Investing Activities
Capital expenditures – Capital expenditures amounted to $836 million in 2013, $942 million in 2012, and $987 millionin 2011.
Acquisitions and other activities – Acquisition activities include both the acquisition of businesses and investments inaffiliates. We paid $269 million in 2013 for acquisition activities, primarily related to the acquisition of Amor Group(Note 14). In 2012, we paid $259 million for acquisition activities, primarily related to the acquisitions of Chandler/May,
43

CDL, and Procerus (Note 14). In 2011, we paid $624 million for acquisition activities, primarily related to the acquisitions ofQTC and Sim-Industries (Note 14). In 2011, we received cash of $510 million from the maturity of short-term investments.
Financing Activities
Dividends and share activity – We paid dividends totaling $1.5 billion ($4.78 per share) in 2013, $1.4 billion ($4.15 pershare) in 2012, and $1.1 billion ($3.25 per share) in 2011. We have increased our quarterly dividend rate in each of the lastthree years, including a 16% increase in the quarterly dividend rate in the fourth quarter of 2013. We declared quarterlydividends of $1.15 per share during each of the first three quarters of 2013 and $1.33 per share for the last quarter; $1.00 pershare during each of the first three quarters of 2012 and $1.15 per share for the last quarter; and $.75 per share during each ofthe first three quarters of 2011 and $1.00 per share for the last quarter.
We paid $1.8 billion, $1.0 billion, and $2.5 billion for repurchases of our common stock during 2013, 2012, and 2011. InSeptember 2013, our Board of Directors approved a $3.0 billion increase to our share repurchase program. We had totalremaining authorization of $3.6 billion for future common share repurchases under our program as of December 31, 2013.
Cash received from the issuance of our common stock in connection with employee stock option exercises during 2013,2012, and 2011 totaled $827 million, $440 million, and $116 million. Those exercises resulted in the issuance of 10.0 millionshares, 6.7 million shares, and 2.3 million shares of our common stock during the respective periods.
Long-term debt – In 2013, we repaid $150 million of long-term notes with a fixed interest rate of 7.38% due to theirscheduled maturities. In 2012, we paid $225 million to complete an exchange of debt (Note 9) to take advantage of the lowinterest rate environment. In 2011, we issued a total of $2.0 billion of long-term notes with fixed coupon rates ranging from2.13% to 4.85%. We used a portion of the proceeds from the long-term notes that were issued in 2011 to redeem all of our$500 million long-term notes due in 2013 with a fixed coupon rate of 4.12%. In 2011, we also repurchased $84 million of ourlong-term notes through open-market purchases and paid premiums of $48 million in connection with the earlyextinguishments of certain long-term notes.
Capital Structure, Resources, and Other
At December 31, 2013, we held cash and cash equivalents of $2.6 billion. As of December 31, 2013, approximately$450 million of our cash and cash equivalents was held outside of the U.S. by foreign subsidiaries. Although those balancesare generally available to fund ordinary business operations without legal or other restrictions, a significant portion is notimmediately available to fund U.S. operations unless repatriated. Our intention is to permanently reinvest earnings from ourforeign subsidiaries. While we do not intend to do so, if this cash was repatriated at the end of 2013, we estimate that about$50 million of U.S. federal income tax would have been due after considering foreign tax credits.
Our outstanding debt, net of unamortized discounts, amounted to $6.2 billion, and mainly is in the form of publicly-issued notes that bear interest at fixed rates. As of December 31, 2013, we were in compliance with all covenants containedin our debt and credit agreements.
At December 31, 2013 and 2012, we had in place with a group of banks a $1.5 billion revolving credit facility thatexpires in August 2016. We may request and the banks may grant, at their discretion, an increase to the credit facility by anadditional amount up to $500 million. There were no borrowings outstanding under the credit facility throughDecember 31, 2013. Borrowings under the credit facility would be unsecured and bear interest at rates based, at our option,on a Eurodollar rate or a Base Rate, as defined in the credit facility. Each bank’s obligation to make loans under the creditfacility is subject to, among other things, our compliance with various representations, warranties and covenants, includingcovenants limiting our ability and certain of our subsidiaries’ ability to encumber assets and a covenant not to exceed amaximum leverage ratio, as defined in the credit facility. The leverage ratio covenant excludes the adjustments recognized instockholders’ equity related to postretirement benefit plans. As of December 31, 2013, we were in compliance with allcovenants contained in the credit facility, as well as in our debt agreements.
We have agreements in place with financial institutions to provide for the issuance of commercial paper. There were nocommercial paper borrowings outstanding during the year ended December 31, 2013. If we were to issue commercial paper,the borrowings would be supported by the credit facility. We also have an effective shelf registration statement on Form S-3on file with the U.S. Securities and Exchange Commission through August 2014 to provide for the issuance of anindeterminate amount of debt securities.
We actively seek to finance our business in a manner that preserves financial flexibility while minimizing borrowingcosts to the extent practicable. We review changes in financial market and economic conditions to manage the types,
44
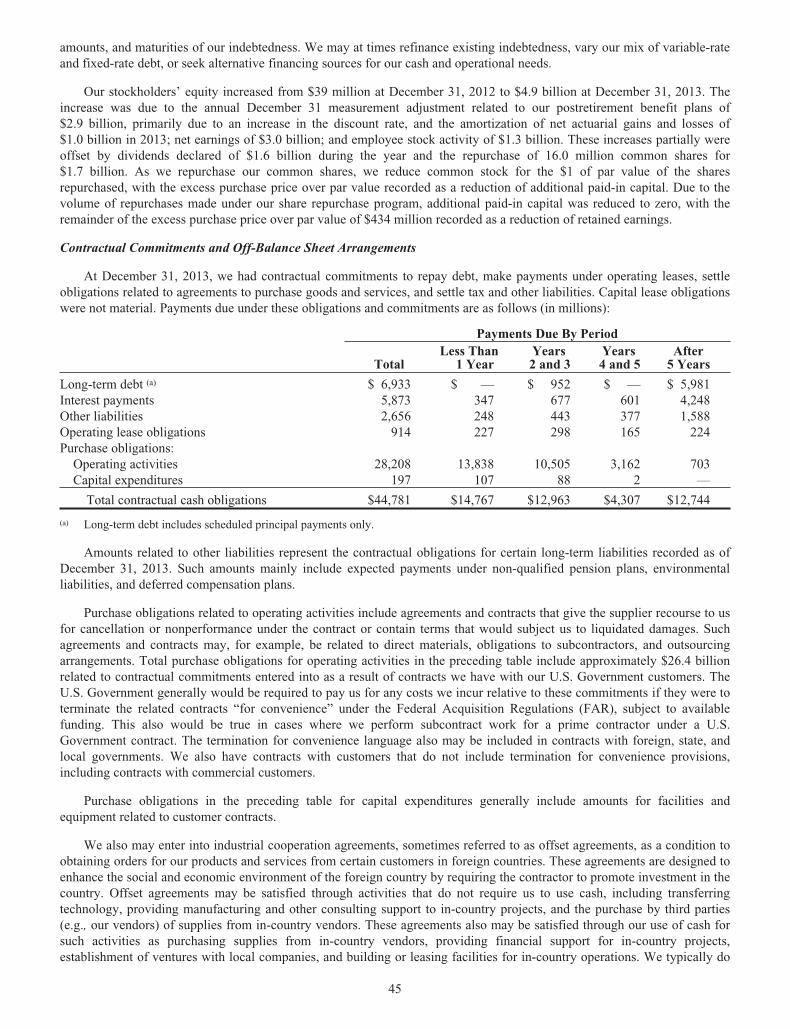
amounts, and maturities of our indebtedness. We may at times refinance existing indebtedness, vary our mix of variable-rateand fixed-rate debt, or seek alternative financing sources for our cash and operational needs.
Our stockholders’ equity increased from $39 million at December 31, 2012 to $4.9 billion at December 31, 2013. Theincrease was due to the annual December 31 measurement adjustment related to our postretirement benefit plans of$2.9 billion, primarily due to an increase in the discount rate, and the amortization of net actuarial gains and losses of$1.0 billion in 2013; net earnings of $3.0 billion; and employee stock activity of $1.3 billion. These increases partially wereoffset by dividends declared of $1.6 billion during the year and the repurchase of 16.0 million common shares for$1.7 billion. As we repurchase our common shares, we reduce common stock for the $1 of par value of the sharesrepurchased, with the excess purchase price over par value recorded as a reduction of additional paid-in capital. Due to thevolume of repurchases made under our share repurchase program, additional paid-in capital was reduced to zero, with theremainder of the excess purchase price over par value of $434 million recorded as a reduction of retained earnings.
Contractual Commitments and Off-Balance Sheet Arrangements
At December 31, 2013, we had contractual commitments to repay debt, make payments under operating leases, settleobligations related to agreements to purchase goods and services, and settle tax and other liabilities. Capital lease obligationswere not material. Payments due under these obligations and commitments are as follows (in millions):
Payments Due By Period
TotalLess Than
1 YearYears2 and 3
Years4 and 5
After5 Years
Long-term debt (a) $ 6,933 $ — $ 952 $ — $ 5,981Interest payments 5,873 347 677 601 4,248Other liabilities 2,656 248 443 377 1,588Operating lease obligations 914 227 298 165 224Purchase obligations:
Operating activities 28,208 13,838 10,505 3,162 703Capital expenditures 197 107 88 2 —
Total contractual cash obligations $44,781 $14,767 $12,963 $4,307 $12,744
(a) Long-term debt includes scheduled principal payments only.
Amounts related to other liabilities represent the contractual obligations for certain long-term liabilities recorded as ofDecember 31, 2013. Such amounts mainly include expected payments under non-qualified pension plans, environmentalliabilities, and deferred compensation plans.
Purchase obligations related to operating activities include agreements and contracts that give the supplier recourse to usfor cancellation or nonperformance under the contract or contain terms that would subject us to liquidated damages. Suchagreements and contracts may, for example, be related to direct materials, obligations to subcontractors, and outsourcingarrangements. Total purchase obligations for operating activities in the preceding table include approximately $26.4 billionrelated to contractual commitments entered into as a result of contracts we have with our U.S. Government customers. TheU.S. Government generally would be required to pay us for any costs we incur relative to these commitments if they were toterminate the related contracts “for convenience” under the Federal Acquisition Regulations (FAR), subject to availablefunding. This also would be true in cases where we perform subcontract work for a prime contractor under a U.S.Government contract. The termination for convenience language also may be included in contracts with foreign, state, andlocal governments. We also have contracts with customers that do not include termination for convenience provisions,including contracts with commercial customers.
Purchase obligations in the preceding table for capital expenditures generally include amounts for facilities andequipment related to customer contracts.
We also may enter into industrial cooperation agreements, sometimes referred to as offset agreements, as a condition toobtaining orders for our products and services from certain customers in foreign countries. These agreements are designed toenhance the social and economic environment of the foreign country by requiring the contractor to promote investment in thecountry. Offset agreements may be satisfied through activities that do not require us to use cash, including transferringtechnology, providing manufacturing and other consulting support to in-country projects, and the purchase by third parties(e.g., our vendors) of supplies from in-country vendors. These agreements also may be satisfied through our use of cash forsuch activities as purchasing supplies from in-country vendors, providing financial support for in-country projects,establishment of ventures with local companies, and building or leasing facilities for in-country operations. We typically do
45
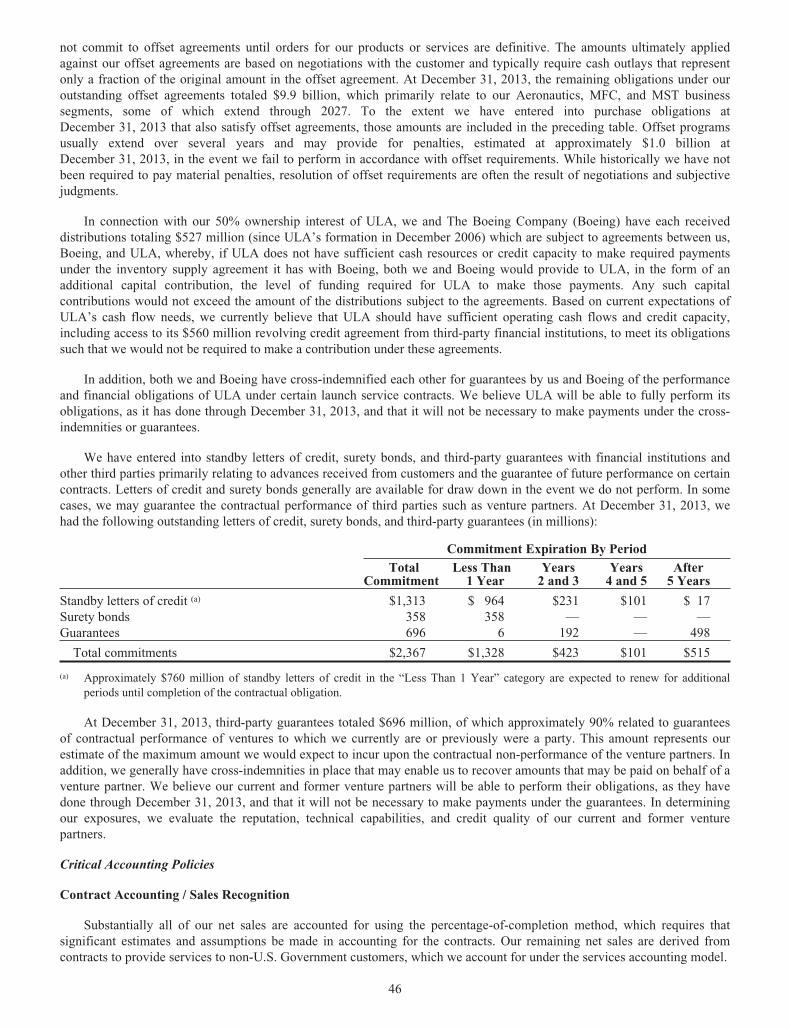
not commit to offset agreements until orders for our products or services are definitive. The amounts ultimately appliedagainst our offset agreements are based on negotiations with the customer and typically require cash outlays that representonly a fraction of the original amount in the offset agreement. At December 31, 2013, the remaining obligations under ouroutstanding offset agreements totaled $9.9 billion, which primarily relate to our Aeronautics, MFC, and MST businesssegments, some of which extend through 2027. To the extent we have entered into purchase obligations atDecember 31, 2013 that also satisfy offset agreements, those amounts are included in the preceding table. Offset programsusually extend over several years and may provide for penalties, estimated at approximately $1.0 billion atDecember 31, 2013, in the event we fail to perform in accordance with offset requirements. While historically we have notbeen required to pay material penalties, resolution of offset requirements are often the result of negotiations and subjectivejudgments.
In connection with our 50% ownership interest of ULA, we and The Boeing Company (Boeing) have each receiveddistributions totaling $527 million (since ULA’s formation in December 2006) which are subject to agreements between us,Boeing, and ULA, whereby, if ULA does not have sufficient cash resources or credit capacity to make required paymentsunder the inventory supply agreement it has with Boeing, both we and Boeing would provide to ULA, in the form of anadditional capital contribution, the level of funding required for ULA to make those payments. Any such capitalcontributions would not exceed the amount of the distributions subject to the agreements. Based on current expectations ofULA’s cash flow needs, we currently believe that ULA should have sufficient operating cash flows and credit capacity,including access to its $560 million revolving credit agreement from third-party financial institutions, to meet its obligationssuch that we would not be required to make a contribution under these agreements.
In addition, both we and Boeing have cross-indemnified each other for guarantees by us and Boeing of the performanceand financial obligations of ULA under certain launch service contracts. We believe ULA will be able to fully perform itsobligations, as it has done through December 31, 2013, and that it will not be necessary to make payments under the cross-indemnities or guarantees.
We have entered into standby letters of credit, surety bonds, and third-party guarantees with financial institutions andother third parties primarily relating to advances received from customers and the guarantee of future performance on certaincontracts. Letters of credit and surety bonds generally are available for draw down in the event we do not perform. In somecases, we may guarantee the contractual performance of third parties such as venture partners. At December 31, 2013, wehad the following outstanding letters of credit, surety bonds, and third-party guarantees (in millions):
Commitment Expiration By Period
TotalCommitment
Less Than1 Year
Years2 and 3
Years4 and 5
After5 Years
Standby letters of credit (a) $1,313 $ 964 $231 $101 $ 17Surety bonds 358 358 — — —Guarantees 696 6 192 — 498
Total commitments $2,367 $1,328 $423 $101 $515
(a) Approximately $760 million of standby letters of credit in the “Less Than 1 Year” category are expected to renew for additionalperiods until completion of the contractual obligation.
At December 31, 2013, third-party guarantees totaled $696 million, of which approximately 90% related to guaranteesof contractual performance of ventures to which we currently are or previously were a party. This amount represents ourestimate of the maximum amount we would expect to incur upon the contractual non-performance of the venture partners. Inaddition, we generally have cross-indemnities in place that may enable us to recover amounts that may be paid on behalf of aventure partner. We believe our current and former venture partners will be able to perform their obligations, as they havedone through December 31, 2013, and that it will not be necessary to make payments under the guarantees. In determiningour exposures, we evaluate the reputation, technical capabilities, and credit quality of our current and former venturepartners.
Critical Accounting Policies
Contract Accounting / Sales Recognition
Substantially all of our net sales are accounted for using the percentage-of-completion method, which requires thatsignificant estimates and assumptions be made in accounting for the contracts. Our remaining net sales are derived fromcontracts to provide services to non-U.S. Government customers, which we account for under the services accounting model.
46
We evaluate new or significantly modified contracts with customers other than the U.S. Government, to the extent thecontracts include multiple elements, to determine if the individual deliverables should be accounted for as separate units ofaccounting. When we determine that accounting for the deliverables as separate units is appropriate, we allocate the contractvalue to the deliverables based on their relative estimated selling prices. The contracts or contract modifications we evaluatefor multiple elements typically are long-term in nature and include the provision of both products and services. Based on thenature of our business, we generally account for components of such contracts using the percentage-of-completionaccounting model or the services accounting model, as appropriate.
We classify net sales as products or services on our Statements of Earnings based on the predominant attributes of theunderlying contract. Most of our long-term contracts are denominated in U.S. dollars, including contracts for sales of militaryproducts and services to international governments contracted through the U.S. Government. We record sales for bothproducts and services under cost-reimbursable, fixed-price, and time-and-materials contracts.
Contract Types
Cost-reimbursable contracts
Cost-reimbursable contracts, which accounted for about 45% of our total net sales in 2013 and 2012 and 50% of our totalnet sales in 2011, provide for the payment of allowable costs incurred during performance of the contract plus a fee, up to aceiling based on the amount that has been funded. We generate revenue under two general types of cost-reimbursablecontracts: cost-plus-award-fee/incentive fee which represent a substantial majority of our cost-reimbursable contracts; andcost-plus-fixed-fee contracts.
Cost-plus-award-fee contracts provide for an award fee that varies within specified limits based on the customer’sassessment of our performance against a predetermined set of criteria, such as targets based on cost, quality, technical, andschedule criteria. Cost-plus-incentive-fee contracts provide for reimbursement of costs plus a fee which is adjusted by aformula based on the relationship of total allowable costs to total target costs (incentive based on cost) or reimbursement ofcosts plus an incentive to exceed stated performance targets (incentive based on performance). The fixed fee in a cost-plus-fixed-fee contract is negotiated at the inception of the contract and that fixed fee does not vary with actual costs.
Fixed-price and other contracts
Under fixed-price contracts, which accounted for about 50% of our total net sales in 2013 and 2012 and 45% of our totalnet sales in 2011, we agree to perform the specified work for a pre-determined price. To the extent our actual costs vary fromthe estimates upon which the price was negotiated, we will generate more or less profit, or could incur a loss. Some fixed-price contracts have a performance-based component under which we may earn incentive payments or incur financialpenalties based on our performance.
Under time-and-materials contracts, which accounted for about 5% of our total net sales in 2013, 2012, and 2011, we arepaid a fixed hourly rate for each direct labor hour expended, and we are reimbursed for allowable material costs andallowable out-of-pocket expenses. To the extent our actual direct labor and associated costs vary in relation to the fixedhourly billing rates provided in the contract, we will generate more or less profit, or could incur a loss.
Percentage-of-Completion Method of Accounting
We record net sales and an estimated profit on a percentage-of-completion basis for cost-reimbursable and fixed-pricecontracts for product and services contracts with the U.S. Government.
The percentage-of-completion method for product contracts depends on the nature of the products provided under thecontract. For example, for contracts that require us to perform a significant level of development effort in comparison to thetotal value of the contract and/or to deliver minimal quantities, sales are recorded using the cost-to-cost method to measureprogress toward completion. Under the cost-to-cost method of accounting, we recognize sales and an estimated profit as costsare incurred based on the proportion that the incurred costs bear to total estimated costs. For contracts that require us toprovide a substantial number of similar items without a significant level of development, we record sales and an estimatedprofit on a percentage-of-completion basis using units-of-delivery as the basis to measure progress toward completing thecontract. For contracts to provide services to the U.S. Government, sales are generally recorded using the cost-to-costmethod.
47
Award and incentive fees, as well as penalties related to contract performance, are considered in estimating sales andprofit rates on contracts accounted for under the percentage-of-completion method. Estimates of award fees are based on pastexperience and anticipated performance. We record incentives or penalties when there is sufficient information to assessanticipated contract performance. Incentive provisions that increase or decrease earnings based solely on a single significantevent are not recognized until the event occurs.
Accounting for contracts using the percentage-of-completion method requires judgment relative to assessing risks,estimating contract sales and costs (including estimating award and incentive fees and penalties related to performance), andmaking assumptions for schedule and technical issues. Due to the number of years it may take to complete many of ourcontracts and the scope and nature of the work required to be performed on those contracts, the estimation of total sales andcosts at completion is complicated and subject to many variables.
Contract costs include material, labor, and subcontracting costs, as well as an allocation of indirect costs. Our estimatesof costs at completion of the contract are based on assumptions we make for variables such as labor productivity andavailability, the complexity of the work to be performed, the availability of materials, the length of time to complete thecontract (to estimate increases in wages and prices for materials), performance by our subcontractors, and the availability andtiming of funding from our customer, among other variables. When estimates of total costs to be incurred on a contractexceed total estimates of sales to be earned, a provision for the entire loss on the contract is recorded in the period in whichthe loss is determined.
Many of our contracts span several years and include highly complex technical requirements. At the outset of a contract,we identify and monitor risks to the achievement of the technical, schedule, and cost aspects of the contract, and assess theeffects of those risks on our estimates of total costs to complete the contract. The estimates consider the technicalrequirements (e.g., a newly-developed product versus a mature product), the schedule and associated tasks (e.g., the numberand type of milestone events), and costs (e.g., material, labor, subcontractor and overhead). The initial profit booking rate ofeach contract considers risks surrounding the ability to achieve the technical requirements, schedule, and costs in the initialestimated costs at completion. Profit booking rates may increase during the performance of the contract if we successfullyretire risks surrounding the technical, schedule and cost aspects of the contract. Conversely, our profit booking rates maydecrease if the estimated costs to complete the contract increase. All of the estimates are subject to change during theperformance of the contract and may affect the profit booking rate.
In addition, comparability of our sales, segment operating profit, and segment operating margins may be impacted bychanges in profit booking rates on our contracts accounted for using the percentage-of-completion method of accounting.Increases in the profit booking rates, typically referred to as risk retirements, usually relate to revisions in the total estimatedcosts at completion that reflect improved conditions on a particular contract. Conversely, conditions on a particular contractmay deteriorate resulting in an increase in the estimated costs at completion and a reduction of the profit booking rate.Increases or decreases in profit booking rates are recognized in the current period and reflect the inception-to-date effect ofsuch changes. Segment operating profit and segment operating margins may also be impacted, favorably or unfavorably, byother matters such as the resolution of contractual matters; restructuring charges, except for significant severance actions asmentioned above; cost recoveries on all restructuring charges; reserves for disputes; asset impairments; and insurancerecoveries; among others. Segment operating profit and items such as risk retirements, reductions of profit booking rates, orother matters are presented net of state income taxes.
Services Method of Accounting
Under a fixed-price service contract, we are paid a predetermined fixed amount for a specified scope of work andgenerally have full responsibility for the costs associated with the contract and the resulting profit or loss. We record netsales under fixed-price service contracts to non-U.S. Government customers on a straight-line basis over the period ofcontract performance, unless evidence suggests that net sales are earned or the obligations are fulfilled in a different pattern.For cost-reimbursable contracts for services to non-U.S. Government customers that provide for award and incentive fees, werecord net sales as services are performed, exclusive of award and incentive fees. Award and incentive fees are recordedwhen they are fixed or determinable, generally at the date the amount is communicated to us by the customer. This approachresults in the recognition of such fees at contractual intervals (typically every six months) throughout the contract and isdependent on the customer’s processes for notification of awards and issuance of formal notifications. Costs for all servicecontracts are expensed as incurred.
48
Other Contract Accounting Considerations
The majority of our sales are driven by pricing based on costs incurred to produce products or perform services undercontracts with the U.S. Government. Cost-based pricing is determined under the FAR. The FAR provides guidance on thetypes of costs that are allowable in establishing prices for goods and services under U.S. Government contracts. For example,costs such as those related to charitable contributions, interest expense, and certain advertising and public relations activitiesare unallowable and, therefore, not recoverable through sales. In addition, we may enter into advance agreements with theU.S. Government that address the subjects of allowability and allocability of costs to contracts for specific matters. Forexample, most of the environmental costs we incur for environmental remediation related to sites operated in prior years areallocated to our current operations as general and administrative costs under FAR provisions and supporting advanceagreements reached with the U.S. Government.
We closely monitor compliance with, and the consistent application of, our critical accounting policies related tocontract accounting. Costs incurred and allocated to contracts are reviewed for compliance with U.S. Government regulationsby our personnel, and are subject to audit by the Defense Contract Audit Agency.
Postretirement Benefit Plans
Overview
Many of our employees are covered by defined benefit pension plans, and we provide certain health care and lifeinsurance benefits to eligible retirees (collectively, postretirement benefit plans – see Note 10). In recent years, we havetaken certain actions to mitigate the effect of our defined benefit pension plans on our financial results, including no longeroffering a defined benefit pension plan to non-union represented employees hired after December 2005. Over the last fewyears, we have negotiated similar changes with various labor organizations such that new union represented employees donot participate in our defined benefit pension plans. We have also made substantial cash contributions over the years to ourdefined benefit pension plans including $2.25 billion in 2013, $3.6 billion in 2012, and $2.3 billion in 2011. Notwithstandingthese actions, the impact of these plans and benefits on our earnings may be volatile in that the amount of expense we recordand the funded status for our postretirement benefit plans may materially change from year to year because those calculationsare sensitive to funding levels as well as changes in several key economic assumptions, including interest rates, rates ofreturn on plan assets, and other actuarial assumptions including participant mortality estimates, expected rates of increase infuture compensation levels, and employee turnover, as well as the timing of cash funding.
We recognize on a plan-by-plan basis the funded status of our postretirement benefit plans under GAAP as either anasset or a liability on our Balance Sheets. There is a corresponding non-cash adjustment to accumulated other comprehensiveloss, net of tax benefits recorded as deferred tax assets, in stockholders’ equity. The GAAP funded status is measured as thedifference between the fair value of the plan’s assets and the benefit obligation of the plan. The GAAP benefit obligationrepresents the present value of the future benefits to be paid to plan participants based on past service. The present value iscalculated using a discount rate that is determined at the end of each year. Historically low interest rates over the last fewyears have significantly increased our benefit obligation. This has contributed to a lower funded status of our defined benefitpension plans as determined by GAAP but has been partially mitigated by a rise in interest rates during 2013.
The funding of our pension plans is determined in accordance with the Employee Retirement Income Security Act of1974 (ERISA), as amended by the Pension Protection Act of 2006 (PPA). Our goal has been to fund the pension plans to alevel of at least 80%, as determined by the PPA. This ERISA funded status is calculated on a different basis than underGAAP. The ERISA liability does not reflect anticipated future pay increases for plan participants as required under GAAPand is currently measured using a higher discount rate than for GAAP, primarily due to The Moving Ahead for Progress inthe 21st Century Act of 2012 (MAP-21) which provides temporary funding relief due to the historically low interest rateenvironment. By way of contrast, under ERISA our plans are about 90% funded at December 31, 2013 and 2012, while forGAAP our defined benefit pension plans are about 78% and 67% funded at December 31, 2013 and 2012. CAS govern theextent to which our pension costs are allocable to and recoverable under contracts with the U.S. Government, including FMS.
Actuarial Assumptions
GAAP requires that the amounts we record related to our plans be computed using actuarial valuations. The primaryyear-end assumptions used to determine the funded status and estimate postretirement benefit plan expense for the followingcalendar year are the discount rate, the expected long-term rate of return on plan assets, employee turnover, and participantmortality estimates for all postretirement benefit plans; the expected rates of increase in future compensation levels for the
49
participants in our defined benefit pension plans; and the health care cost trend rates for our retiree medical plans. Theassumptions we make impact both the calculation of the benefit obligation at the end of the year and the calculation of netpostretirement benefit plan cost in the subsequent year. The difference between the long-term rate of return on plan assetsassumption we select and the actual return on plan assets in any given year affects both the funded status of our benefit plansand the calculation of net postretirement benefit plan cost in subsequent years. When reassessing these assumptions each yearwe consider past and current market conditions and make judgments about future market trends. We also have to considerfactors such as the timing and amounts of expected contributions to the plans and benefit payments to plan participants.
We determined that 4.75% was an appropriate discount rate for calculating our benefit obligations at December 31, 2013related to our defined benefit pension plans, compared to 4.00% at the end of 2012 and 4.75% at the end of 2011. Weselected 4.50% as the discount rate for calculating our benefit obligations at December 31, 2013 related to our retiree medicalplans, compared to 3.75% at the end of 2012 and 4.50% at the end of 2011. We evaluate several data points in order to arriveat an appropriate discount rate, including results from cash flow models, quoted rates from long-term bond indices, andchanges in long-term bond rates over the past year. As part of our evaluation, we calculate the approximate average yields oncorporate bonds rated AA or better that were selected to match our projected postretirement benefit plan cash flows.
We determined that 8.00% was a reasonable estimate for the expected long-term rate of return on plan assets assumptionat December 31, 2013, consistent with the rate used at December 31, 2012 and 2011. The long-term rate of return assumptionrepresents the expected average rate of earnings on the funds invested, or to be invested, to provide for the benefits includedin the plan obligation. This assumption is based on several factors including historical market index returns, the anticipatedlong-term allocation of plan assets, the historical return data for the trust funds, plan expenses, and the potential tooutperform market index returns. The actual return in any specific year likely will differ from the assumption, but theaverage expected return over a long-term future horizon should be approximately equal to the assumption. As a result,changes in this assumption are less frequent than changes in the discount rate.
Our stockholders’ equity has been reduced cumulatively by $9.6 billion from the annual year-end measurements of thefunded status of postretirement benefit plans, net of the December 31, 2013 measurement which increased equity by$2.9 billion primarily as a result of the increase in the discount rate for calculating our benefit obligations. The cumulativenon-cash, after-tax reduction primarily represents net actuarial losses resulting from declines in discount rates from 6.375%at the end of 2007 to 4.75% at the end of 2013 and investment losses incurred during 2008, which will be amortized toexpense over the average future service period of employees expected to receive benefits under the plans of approximately10 years. During 2013, $1.0 billion of these amounts was recognized as a component of postretirement benefit plans expenseand $700 million is expected to be recognized as expense in 2014.
The discount rate and long-term rate of return on plan assets assumptions we select at the end of each year are based onour best estimates and judgment. A change of plus or minus 25 basis points in the 4.75% discount rate assumption atDecember 31, 2013, with all other assumptions held constant, would have decreased or increased the amount of the qualifiedpension benefit obligation we recorded at the end of 2013 by approximately $1.5 billion, which would result in an after-taxincrease or decrease in stockholders’ equity at the end of the year of approximately $1.0 billion. If the 4.75% discount rate atDecember 31, 2013 that was used to compute the expected 2014 expense for our qualified defined benefit pension plans hadbeen 25 basis points higher or lower, with all other assumptions held constant, the amount of expense projected for 2014would be lower or higher by approximately $130 million. If the 8.00% expected long-term rate of return on plan assetsassumption at December 31, 2013 that was used to compute the expected 2014 expense for our qualified defined benefitpension plans had been 25 basis points higher or lower, with all other assumptions held constant, the amount of expenseprojected for 2014 would be lower or higher by approximately $85 million.
Funding Considerations
The PPA became applicable to us and other large U.S. defense contractors beginning in 2011 and had the effect ofaccelerating the required amount of annual pension plan contributions. We made contributions related to our qualifieddefined benefit pension plans of $2.25 billion in 2013, $3.6 billion in 2012, and $2.3 billion in 2011, inclusive of amounts inexcess of our required contributions. Under CAS, amounts funded are recovered over time through the pricing of ourproducts and services on U.S. Government contracts, including FMS, and are recognized in our cost of sales and net sales.We recovered $1.5 billion in 2013, $1.1 billion in 2012 and $899 million in 2011 as CAS costs. Amounts contributed inexcess of the CAS funding requirements are considered to be prepayment credits under the CAS rules. As ofDecember 31, 2013, our prepayment credits were approximately $9.6 billion, inclusive of interest. Pursuant to the CASHarmonization rules, the prepayment balance will increase or decrease based on our actual investment returns on plan assets.
50
The CAS Board published its revised pension accounting rules (CAS Harmonization) with an effective date ofFebruary 27, 2012 to better align the recovery of pension contributions, including prepayment credits, on U.S. Governmentcontracts with the accelerated funding requirements of the PPA. The CAS Harmonization rules increased our CAS costbeginning in 2013. There is a transition period during which the cost impact of the new rules is phased in, with the fullimpact occurring in 2017. We expect the incremental impact of CAS Harmonization will increase successively over years2014 through 2017. Based upon current assumptions which may change, we expect that the increase in 2014 CAS costscaused by CAS Harmonization should be in excess of the pension expense we record under GAAP (FAS pension expense).Accordingly, we expect our FAS/CAS pension adjustment, discussed further in the “Business Segment Results ofOperations” section above, will increase earnings in 2014 as mentioned below rather than decrease earnings as it has the pastfew years.
Trends
Our CAS recoveries are expected to exceed our cash contributions in 2014 and for several years thereafter, as we utilizethe $9.6 billion prepayment credits under the CAS rules. In 2014, we anticipate recovering $1.6 billion as CAS cost on ourcontracts and expect to make contributions of $1.0 billion related to our qualified defined benefit pension plans, which wouldincrease our cash flow from operations. We expect our required contributions to continue to be temporarily lowered in 2014and 2015 as a result of MAP-21.
We expect that our 2014 FAS pension expense will be $1.3 billion, which is less than our 2013 FAS pension expense of$1.9 billion, primarily due to the increase in the discount rate. Also, we expect FAS/CAS pension income in 2014 of about$345 million, as compared to FAS/CAS pension expense of $482 million in 2013, primarily due to the increase in thediscount rate and higher CAS costs due to recoveries. We expect our 2014 earnings per share to be higher than in 2013,primarily due to our expected FAS/CAS pension income in 2014.
Mortality assumptions, as published by the IRS, are used to estimate the life expectancy of plan participants duringwhich they are expected to receive benefit payments. Actuarial studies are currently being conducted that indicate lifeexpectancies are longer and would have the resultant impact of increasing the amount of benefit payments to planparticipants. The pension obligation recognized at December 31, 2013 and the amounts estimated for 2014 pension expense,CAS cost, and funding do not reflect the impact of these actuarial studies as such studies have not yet been finalized. Thenew mortality assumptions, which we expect to adopt at our next measurement date, currently are expected to increase theamount of our pension obligation and decrease our net earnings. We also expect to incorporate the new mortalityassumptions into our annual incremental pension funding requirements pursuant to ERISA no earlier than 2016.
Environmental Matters
We are a party to various agreements, proceedings, and potential proceedings for environmental cleanup issues,including matters at various sites where we have been designated a potentially responsible party (PRP) by the U.S.Environmental Protection Agency (EPA) or by a state agency. At December 31, 2013 and 2012, the total amount of liabilitiesrecorded on our Balance Sheet for environmental matters was $997 million and $950 million. We have recorded receivablestotaling $863 million and $821 million at December 31, 2013 and 2012 for the portion of environmental costs that areprobable of future recovery in pricing of our products and services for agencies of the U.S. Government, as discussed below.The amount that is expected to be allocated to our non-U.S. Government contracts or that is determined to be unallowable forpricing under U.S. Government contracts has been expensed through cost of sales. We project costs and recovery of costsover approximately 20 years.
We enter into agreements (e.g., administrative orders, consent decrees) that document the extent and timing of ourenvironmental remediation obligation. We also are involved in remediation activities at environmental sites where formalagreements either do not exist or do not quantify the extent and timing of our obligation. Environmental cleanup activitiesusually span many years, which makes estimating the costs more judgmental due to, for example, changing remediationtechnologies. To determine the costs related to cleanup sites, we have to assess the extent of contamination, effects on naturalresources, the appropriate technology to be used to accomplish the remediation, and evolving regulatory environmentalstandards.
We perform quarterly reviews of environmental remediation sites and record liabilities and receivables in the period itbecomes probable that a liability has been incurred and the amounts can be reasonably estimated (see the discussion under“Environmental Matters” in “Note 1 – Significant Accounting Policies” and “Note 13 – Legal Proceedings, Commitments,and Contingencies” to our consolidated financial statements). We consider the above factors in our quarterly estimates of thetiming and amount of any future costs that may be required for remediation activities, which results in the calculation of arange of estimates for a particular environmental site. We do not discount the recorded liabilities, as the amount and timing
51
of future cash payments are not fixed or cannot be reliably determined. Given the required level of judgment and estimation,it is likely that materially different amounts could be recorded if different assumptions were used or if circumstances were tochange (e.g., a change in environmental standards or a change in our estimate of the extent of contamination).
California and the U.S. EPA are each evaluating the need to regulate hexavalent chromium in drinking water, distinctfrom the current standards which regulate total chromium. In 2011, California’s health risk agency announced a non-enforceable public health goal for hexavalent chromium which California’s regulatory agency must consider whenpromulgating an enforceable drinking water standard, which it is expected to do by late 2014. The goal calls for levelssignificantly below levels encompassed within the current total chromium standard. In August 2013, California’s regulatoryagency proposed a draft drinking water standard for hexavalent chromium closer to levels encompassed within the currentstandard. We expect that environmental groups will continue to seek a standard closer to the non-enforceable public healthgoal and we cannot predict the outcome of California’s regulatory proceedings. In addition, California is also reevaluating itsexisting drinking water standard with respect to a second contaminant, perchlorate, and the U.S. EPA is also consideringwhether to regulate that contaminant in drinking water. With respect to either contaminant, if substantially lower standardsare adopted, in either California or at the federal level, we expect a material increase in our estimates for environmentalliabilities and the related assets for the portion of the increased costs that are probable of future recovery in the pricing of ourproducts and services for the U.S. Government. The amount that would be allocable to our non-U.S. Government contracts orthat is determined to be unallowable for pricing under U.S. Government contracts would be expensed, which may have amaterial effect on our earnings in any particular interim reporting period.
Under agreements reached with the U.S. Government, most of the amounts we spend for environmental remediation areallocated to our operations as general and administrative costs. Under existing government regulations, these and otherenvironmental expenditures relating to our U.S. Government business, after deducting any recoveries received frominsurance or other PRPs, are allowable in establishing prices of our products and services. As a result, most of theexpenditures we incur are included in our net sales and cost of sales according to U.S. Government agreement or regulation,regardless of the contract form (e.g. cost-reimbursable, fixed-price). We continually evaluate the recoverability of ourenvironmental receivables by assessing, among other factors, U.S. Government regulations, our U.S. Government businessbase and contract mix, and our history of receiving reimbursement of such costs.
As disclosed above, we may record changes in the amount of environmental remediation liabilities as a result of ourquarterly reviews of the status of our environmental remediation sites, which would result in a change to the correspondingenvironmental receivable and a charge to earnings. For example, if we were to determine that the liabilities should beincreased by $100 million, the corresponding receivables would be increased by approximately $87 million, with theremainder recorded as a charge to earnings. This allocation is determined annually, based upon our existing and projectedbusiness activities with the U.S. Government.
We reasonably cannot determine the extent of our financial exposure at all environmental sites with which we areinvolved. There are a number of former operating facilities we are monitoring or investigating for potential futureremediation. In some cases, although a loss may be probable, it is not possible at this time to reasonably estimate the amountof any obligation for remediation activities because of uncertainties (e.g., assessing the extent of the contamination). Duringany particular quarter, such uncertainties may be resolved, allowing us to estimate and recognize the initial liability toremediate a particular former operating site. The amount of the liability could be material. Upon recognition of the liability, aportion will be recognized as a receivable with the remainder charged to earnings.
If we are ultimately found to have liability at those sites where we have been designated a PRP, we expect that the actualcosts of remediation will be shared with other liable PRPs. Generally, PRPs that are ultimately determined to be responsibleparties are strictly liable for site cleanup and usually agree among themselves to share, on an allocated basis, the costs andexpenses for investigation and remediation. Under existing environmental laws, responsible parties are jointly and severallyliable and, therefore, we are potentially liable for the full cost of funding such remediation. In the unlikely event that we wererequired to fund the entire cost of such remediation, the statutory framework provides that we may pursue rights of costrecovery or contribution from the other PRPs. The amounts we record do not reflect the fact that we may recover some of theenvironmental costs we have incurred through insurance or from other PRPs, which we are required to pursue by agreementand U.S. Government regulation.
Goodwill
Our goodwill balances were $10.3 billion and $10.4 billion at December 31, 2013 and 2012. We test goodwill forimpairment at least annually in the fourth quarter and test more frequently upon the occurrence of certain events orsignificant changes in circumstances that indicate goodwill may be impaired. Such events or changes in circumstances may
52
include a significant deterioration in overall economic conditions, changes in the business climate of our industry, a declinein our market capitalization, operating performance indicators, competition, reorganizations of our business, or the disposalof all or a portion of a reporting unit. Our goodwill has been allocated to and is tested for impairment at a level referred to asthe reporting unit, which is our business segment level or a level below the business segment. The level at which we testgoodwill for impairment requires us to determine whether the operations below the business segment constitute a self-sustaining business for which discrete financial information is available and segment management regularly reviews theoperating results.
We initially test goodwill for impairment by comparing the fair value of each reporting unit with its carrying amount,including goodwill. If the fair value of a reporting unit exceeds its carrying amount, goodwill of the reporting unit is notimpaired. If the carrying amount of a reporting unit exceeds its fair value, we compare the implied value of the reportingunit’s goodwill with the carrying amount of its goodwill. The implied value of the reporting unit’s goodwill is calculated bycreating a hypothetical balance sheet as if the reporting unit had just been acquired. This balance sheet contains all assets andliabilities recorded at fair value (including any assumed intangible assets that may not have any corresponding carryingamount in our balance sheet). The implied value of the reporting unit’s goodwill is calculated by subtracting the fair value ofthe net assets from the fair value of the reporting unit. If the carrying amount of the reporting unit’s goodwill exceeds theimplied value of that goodwill, an impairment loss is recognized in an amount equal to that excess.
The carrying amount of each reporting unit includes the assets and liabilities employed in its operations, allocations ofamounts held at the business segment and corporate levels as well as goodwill. The corporate allocations include ourpostretirement benefit plans liabilities, as determined in accordance with CAS, in order to align the basis of the carryingamounts with the determination of the fair values of our reporting units, which are measured using CAS cost. CAS cost isrecovered through the pricing of our products and services on U.S. Government contracts and, therefore, affects the fair valueof each reporting unit. The discount rate used for CAS is currently higher than the discount rate used for GAAP but isexpected to trend downward over the next few years, which would increase the amount of CAS liabilities allocated to eachreporting unit, contributing to a reduction in the carrying amount of each reporting unit.
We estimate the fair value of each reporting unit using a combination of a discounted cash flow (DCF) analysis and market-based valuation methodologies such as comparable public trading values and values observed in market transactions. Determiningfair value requires the exercise of significant judgments, including judgments about the amount and timing of expected future cashflows, discount rates, perpetual growth rates, and relevant comparable company earnings multiples and transaction multiples. Thecash flows employed in the DCF analyses are based on our best estimate of future sales and operating costs, based primarily onexisting firm orders, expected future orders, contracts with suppliers, labor agreements, and general market conditions; changes inworking capital; most recent long-term business plans in place at the time of our testing date; and recent operating performance.The discount rates utilized in the DCF analysis are based on the respective reporting unit’s weighted average cost of capital, whichtakes into account the relative weights of each component of capital structure (equity and debt) and represents the expected cost ofnew capital, adjusted as appropriate to consider the risk inherent in future cash flows of the respective reporting unit.
In the fourth quarter of 2013, we performed our annual goodwill impairment test for each of our reporting units. Theresults of these tests indicated that the estimated fair values of our reporting units exceeded their carrying amounts, with theexception of our Technical Services reporting unit within our MFC business segment. During the fourth quarter of 2013, thecontinuing impact of defense budget reductions and related competitive pressures on the Technical Services business, whichtypically has smaller customer contracts of a shorter duration, adversely impacted the fair value of this reporting unit. As aresult, we compared the implied value of that reporting unit’s goodwill with the carrying amount of its goodwill, and sincethe carrying amount exceeded the implied value, we recorded a non-cash impairment charge of $195 million, net of state taxbenefits, in the fourth quarter of 2013 equal to that differential.
The fair value of each reporting unit was based on our best estimates and judgment, particularly assumptions regardingthe planned defense spending levels of the U.S. Government, our principal customer. If customer budget pressures continue,these circumstances could eventually result in other impairments of goodwill in the future. Our reporting units in our IS&GSbusiness segment and our services businesses at our MFC and MST business segments have smaller customer contracts ofshort duration and are most susceptible to the impacts of budget reductions. Following the goodwill impairment chargedescribed above, we currently do not believe that any of our reporting units are at risk of a goodwill impairment charge in thenear-term, as their fair values are significantly greater than their carrying amounts.
Impairment assessments inherently involve management judgments regarding assumptions about expected future sales,profits, and cash flows and the impact of market conditions on those assumptions. Due to the many variables inherent in theestimation of a reporting unit’s fair value and the relative size of our recorded goodwill, differences in assumptions couldhave a material effect on the estimated fair value of one or more of our reporting units and could result in a goodwillimpairment charge in a future period.
53
ITEM 7A. Quantitative and Qualitative Disclosures about Market Risk.
We maintain active relationships with a broad and diverse group of domestic and international financial institutions. Webelieve that they provide us with sufficient access to the general and trade credit we require to conduct our business. Wecontinue to closely monitor the financial market environment and actively manage counterparty exposure to minimize thepotential impact from adverse developments with any single credit provider while ensuring availability of, and access to,sufficient credit resources.
Our main exposure to market risk relates to interest rates, foreign currency exchange rates, and market prices on certainequity securities. Our financial instruments that are subject to interest rate risk principally include fixed-rate long-term debt.The estimated fair value of our outstanding debt was $7.4 billion at December 31, 2013, and the outstanding principalamount was $7.0 billion, excluding unamortized discounts of $882 million. A 10% change in the level of interest rates wouldnot have a material impact on the fair value of our outstanding debt at December 31, 2013.
We use derivative instruments principally to reduce our exposure to market risks from changes in foreign currencyexchange rates and interest rates. We do not enter into or hold derivative instruments for speculative trading purposes. Wetransact business globally and are subject to risks associated with changing foreign currency exchange rates. We enter intoforeign currency hedges such as forward and option contracts that change in value as foreign currency exchange rateschange. Our most significant foreign currency exposures relate to the British Pound Sterling and the Canadian Dollar. Thesecontracts hedge forecasted foreign currency transactions in order to mitigate fluctuations in our earnings and cash flowsassociated with changes in foreign currency exchange rates. We designate foreign currency hedges as cash flow hedges. Wealso are exposed to the impact of interest rate changes primarily through our borrowing activities. For fixed rate borrowings,we may use variable interest rate swaps, effectively converting fixed rate borrowings to variable rate borrowings indexed toLIBOR in order to reduce the amount of interest paid. These swaps are designated as fair value hedges. For variable rateborrowings, we may use fixed interest rate swaps, effectively converting variable rate borrowings to fixed rate borrowings inorder to mitigate the impact of interest rate changes on earnings. These swaps are designated as cash flow hedges. We mayalso enter into derivative instruments that are not designated as hedges and do not qualify for hedge accounting, which areintended to mitigate certain economic exposures.
The classification of gains and losses resulting from changes in the fair values of derivatives is dependent on ourintended use of the derivative and its resulting designation. Adjustments to reflect changes in fair values of derivativesattributable to the effective portion of hedges are either reflected in earnings and largely offset by corresponding adjustmentsto the hedged items, or reflected net of income taxes in accumulated other comprehensive loss until the hedged transaction isrecognized in earnings. Changes in the fair value of the derivatives that are attributable to the ineffective portion of thehedges, or of derivatives that are not considered to be highly effective hedges, if any, are immediately recognized in earnings.The aggregate notional amount of our outstanding foreign currency hedges at December 31, 2013 and 2012 was $1.0 billionand $1.3 billion. The aggregate notional amount of our outstanding interest rate swaps at December 31, 2013 and 2012 was$1.2 billion and $503 million. At December 31, 2013 and 2012, the net fair value of our derivative instruments was notmaterial (Note 15). A 10% appreciation or devaluation of the hedged currency as compared to the level of foreign exchangerates for currencies under contract at December 31, 2013 would not have a material impact on the aggregate net fair value ofsuch contracts or our consolidated financial statements.
We evaluate the credit quality of potential counterparties to derivative transactions and only enter into agreements withthose deemed to have acceptable credit risk at the time the agreements are executed. Our foreign currency exchange hedgeportfolio is diversified across several banks. We periodically monitor changes to counterparty credit quality as well as ourconcentration of credit exposure to individual counterparties. We do not hold or issue derivative financial instruments fortrading or speculative purposes.
We maintain a separate trust that includes investments to fund certain of our non-qualified deferred compensation plans.As of December 31, 2013, investments in the trust totaled $1.0 billion and are reflected at fair value on our Balance Sheet inother noncurrent assets. The trust holds investments in marketable equity securities and fixed-income securities that areexposed to price changes and changes in interest rates. A portion of the liabilities associated with the deferred compensationplans supported by the trust is also impacted by changes in the market price of our common stock and certain market indices.Changes in the value of the liabilities have the effect of partially offsetting the impact of changes in the value of the trust.Both the change in the fair value of the trust and the change in the value of the liabilities are recognized on our Statements ofEarnings in other unallocated costs, and were not material for the year ended December 31, 2013.
54
ITEM 8. Financial Statements and Supplementary Data.
Report of Ernst & Young LLP,Independent Registered Public Accounting Firm,on the Audited Consolidated Financial Statements
Board of Directors and StockholdersLockheed Martin Corporation
We have audited the accompanying consolidated balance sheets of Lockheed Martin Corporation as of December 31,2013 and 2012, and the related consolidated statements of earnings, comprehensive income, stockholders’ equity, and cashflows for each of the three years in the period ended December 31, 2013. These financial statements are the responsibility ofthe Corporation’s management. Our responsibility is to express an opinion on these financial statements based on our audits.
We conducted our audits in accordance with the standards of the Public Company Accounting Oversight Board (UnitedStates). Those standards require that we plan and perform the audit to obtain reasonable assurance about whether thefinancial statements are free of material misstatement. An audit includes examining, on a test basis, evidence supporting theamounts and disclosures in the financial statements. An audit also includes assessing the accounting principles used andsignificant estimates made by management, as well as evaluating the overall financial statement presentation. We believe thatour audits provide a reasonable basis for our opinion.
In our opinion, the financial statements referred to above present fairly, in all material respects, the consolidatedfinancial position of Lockheed Martin Corporation at December 31, 2013 and 2012, and the consolidated results of itsoperations and its cash flows for each of the three years in the period ended December 31, 2013, in conformity with U.S.generally accepted accounting principles.
We also have audited, in accordance with the standards of the Public Company Accounting Oversight Board (UnitedStates), Lockheed Martin Corporation’s internal control over financial reporting as of December 31, 2013, based on criteriaestablished in Internal Control–Integrated Framework issued by the Committee of Sponsoring Organizations of theTreadway Commission (1992 framework) and our report dated February 14, 2014 expressed an unqualified opinion thereon.
McLean, VirginiaFebruary 14, 2014
55
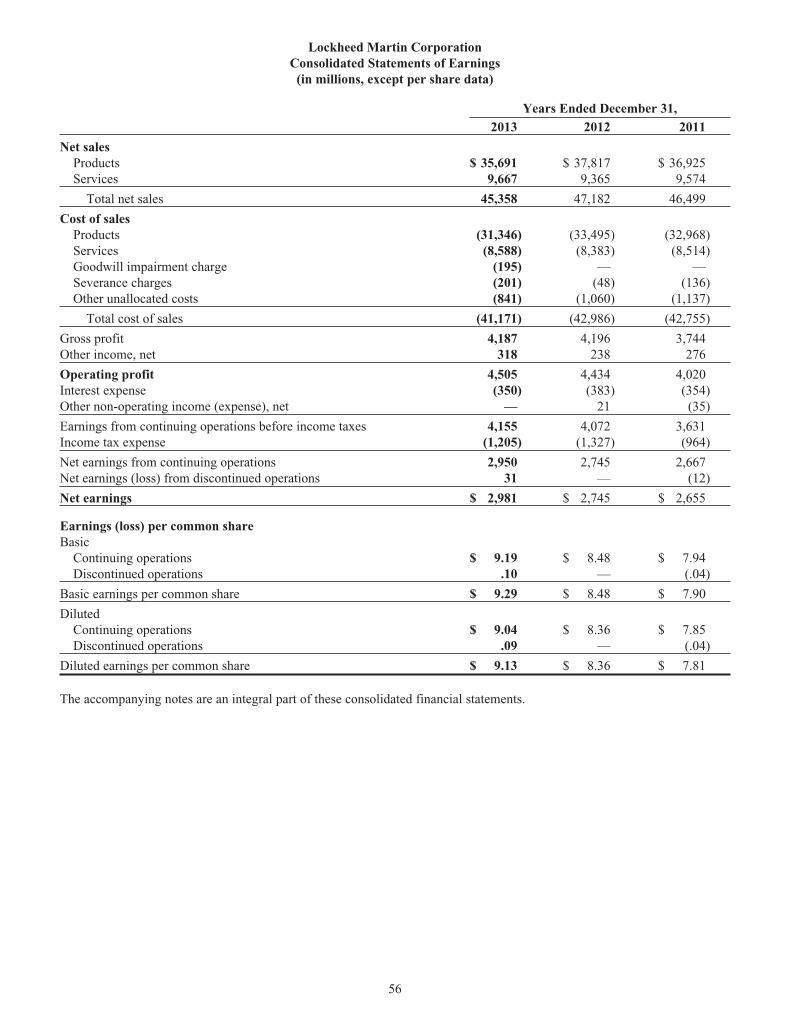
Lockheed Martin CorporationConsolidated Statements of Earnings
(in millions, except per share data)
Years Ended December 31,
2013 2012 2011
Net salesProducts $ 35,691 $ 37,817 $ 36,925Services 9,667 9,365 9,574
Total net sales 45,358 47,182 46,499
Cost of salesProducts (31,346) (33,495) (32,968)Services (8,588) (8,383) (8,514)Goodwill impairment charge (195) — —Severance charges (201) (48) (136)Other unallocated costs (841) (1,060) (1,137)
Total cost of sales (41,171) (42,986) (42,755)
Gross profit 4,187 4,196 3,744Other income, net 318 238 276
Operating profit 4,505 4,434 4,020Interest expense (350) (383) (354)Other non-operating income (expense), net — 21 (35)
Earnings from continuing operations before income taxes 4,155 4,072 3,631Income tax expense (1,205) (1,327) (964)
Net earnings from continuing operations 2,950 2,745 2,667Net earnings (loss) from discontinued operations 31 — (12)
Net earnings $ 2,981 $ 2,745 $ 2,655
Earnings (loss) per common shareBasic
Continuing operations $ 9.19 $ 8.48 $ 7.94Discontinued operations .10 — (.04)
Basic earnings per common share $ 9.29 $ 8.48 $ 7.90
DilutedContinuing operations $ 9.04 $ 8.36 $ 7.85Discontinued operations .09 — (.04)
Diluted earnings per common share $ 9.13 $ 8.36 $ 7.81
The accompanying notes are an integral part of these consolidated financial statements.
56
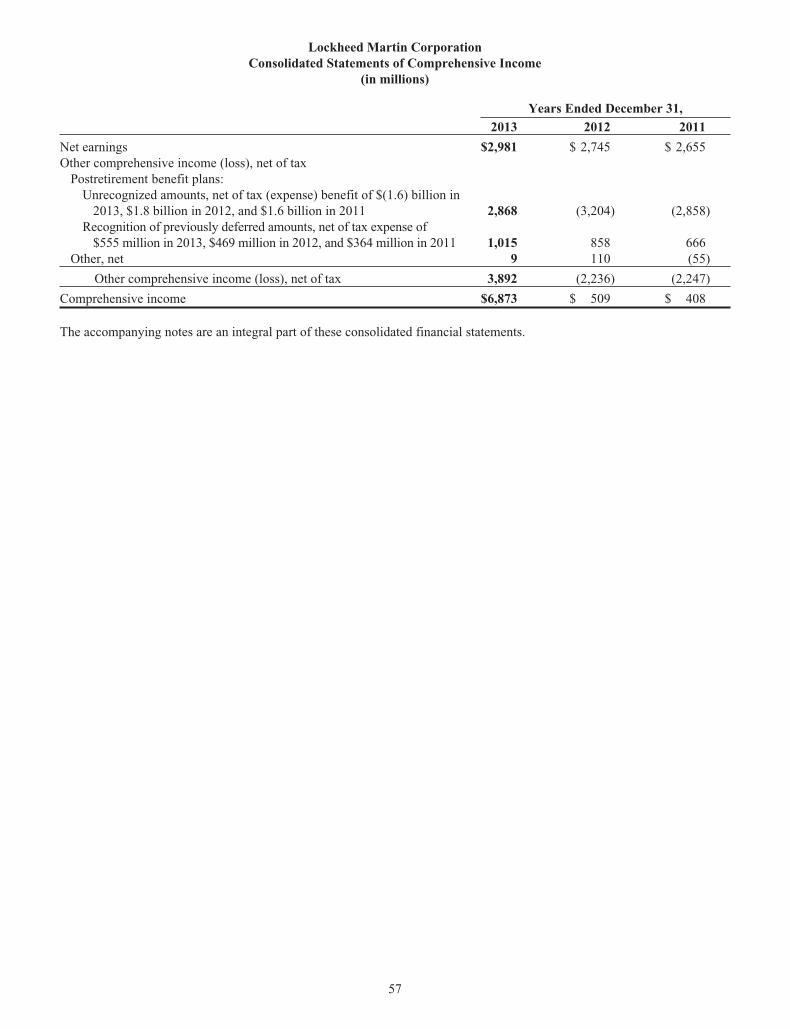
Lockheed Martin CorporationConsolidated Statements of Comprehensive Income
(in millions)
Years Ended December 31,
2013 2012 2011
Net earnings $2,981 $ 2,745 $ 2,655Other comprehensive income (loss), net of tax
Postretirement benefit plans:Unrecognized amounts, net of tax (expense) benefit of $(1.6) billion in
2013, $1.8 billion in 2012, and $1.6 billion in 2011 2,868 (3,204) (2,858)Recognition of previously deferred amounts, net of tax expense of
$555 million in 2013, $469 million in 2012, and $364 million in 2011 1,015 858 666Other, net 9 110 (55)
Other comprehensive income (loss), net of tax 3,892 (2,236) (2,247)
Comprehensive income $6,873 $ 509 $ 408
The accompanying notes are an integral part of these consolidated financial statements.
57
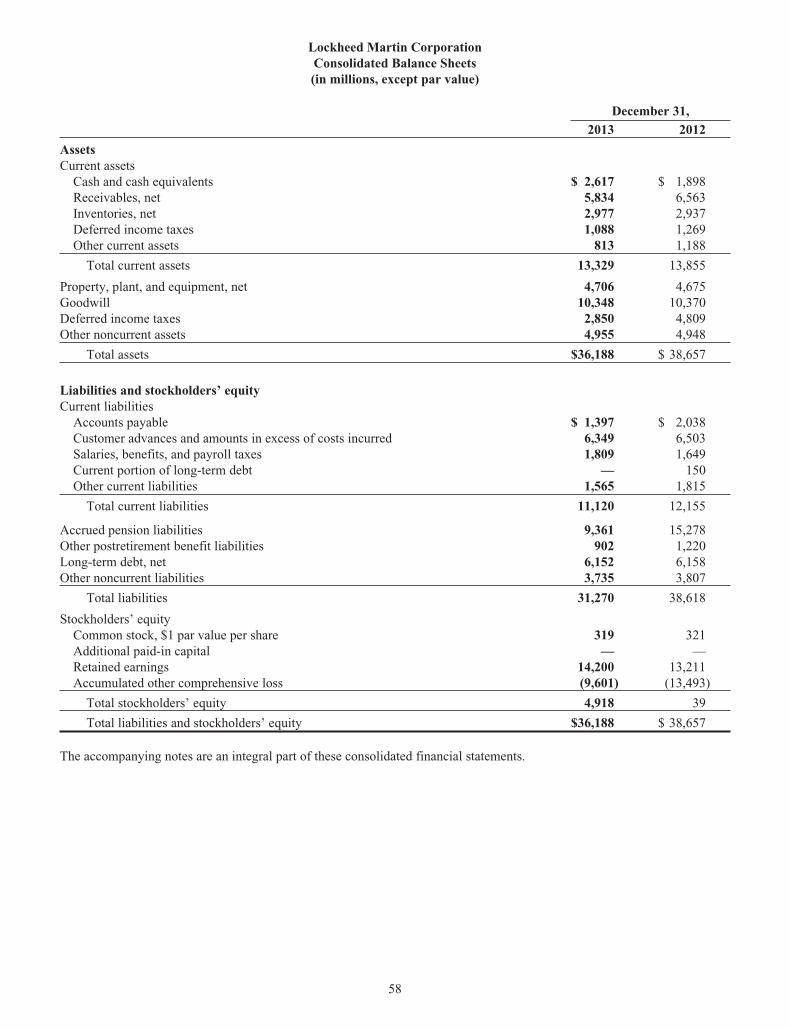
Lockheed Martin CorporationConsolidated Balance Sheets(in millions, except par value)
December 31,
2013 2012
AssetsCurrent assets
Cash and cash equivalents $ 2,617 $ 1,898Receivables, net 5,834 6,563Inventories, net 2,977 2,937Deferred income taxes 1,088 1,269Other current assets 813 1,188
Total current assets 13,329 13,855
Property, plant, and equipment, net 4,706 4,675Goodwill 10,348 10,370Deferred income taxes 2,850 4,809Other noncurrent assets 4,955 4,948
Total assets $36,188 $ 38,657
Liabilities and stockholders’ equityCurrent liabilities
Accounts payable $ 1,397 $ 2,038Customer advances and amounts in excess of costs incurred 6,349 6,503Salaries, benefits, and payroll taxes 1,809 1,649Current portion of long-term debt — 150Other current liabilities 1,565 1,815
Total current liabilities 11,120 12,155
Accrued pension liabilities 9,361 15,278Other postretirement benefit liabilities 902 1,220Long-term debt, net 6,152 6,158Other noncurrent liabilities 3,735 3,807
Total liabilities 31,270 38,618
Stockholders’ equityCommon stock, $1 par value per share 319 321Additional paid-in capital — —Retained earnings 14,200 13,211Accumulated other comprehensive loss (9,601) (13,493)
Total stockholders’ equity 4,918 39
Total liabilities and stockholders’ equity $36,188 $ 38,657
The accompanying notes are an integral part of these consolidated financial statements.
58
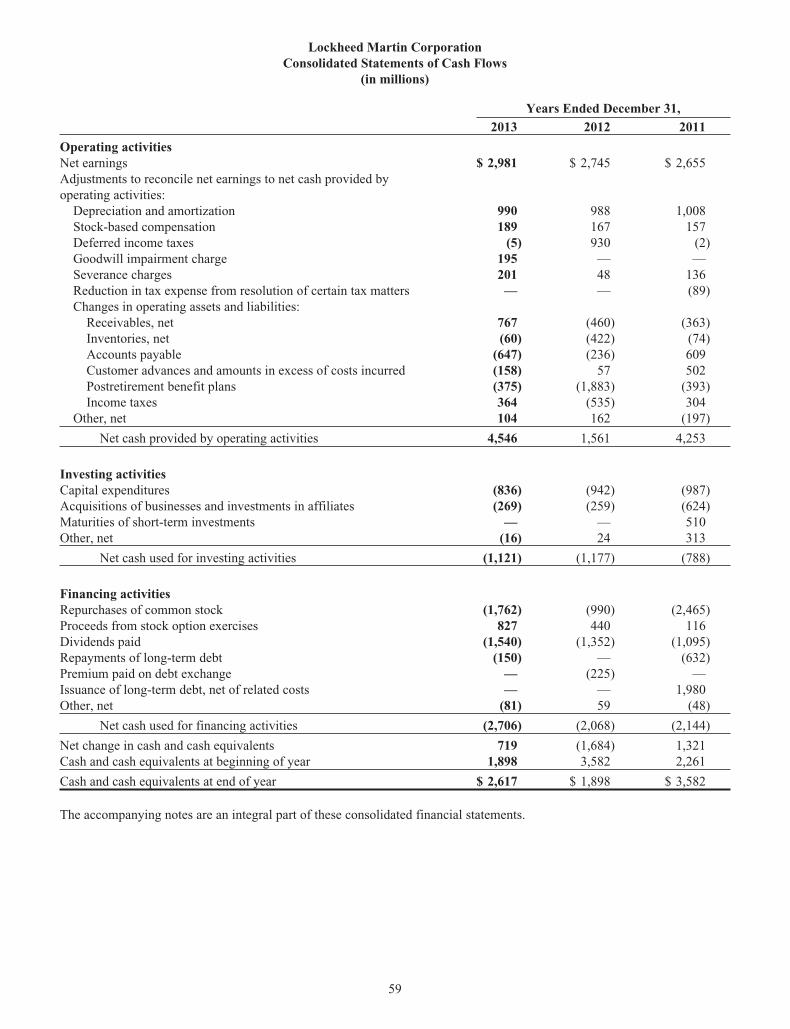
Lockheed Martin CorporationConsolidated Statements of Cash Flows
(in millions)
Years Ended December 31,
2013 2012 2011
Operating activitiesNet earnings $ 2,981 $ 2,745 $ 2,655Adjustments to reconcile net earnings to net cash provided byoperating activities:
Depreciation and amortization 990 988 1,008Stock-based compensation 189 167 157Deferred income taxes (5) 930 (2)Goodwill impairment charge 195 — —Severance charges 201 48 136Reduction in tax expense from resolution of certain tax matters — — (89)Changes in operating assets and liabilities:
Receivables, net 767 (460) (363)Inventories, net (60) (422) (74)Accounts payable (647) (236) 609Customer advances and amounts in excess of costs incurred (158) 57 502Postretirement benefit plans (375) (1,883) (393)Income taxes 364 (535) 304
Other, net 104 162 (197)
Net cash provided by operating activities 4,546 1,561 4,253
Investing activitiesCapital expenditures (836) (942) (987)Acquisitions of businesses and investments in affiliates (269) (259) (624)Maturities of short-term investments — — 510Other, net (16) 24 313
Net cash used for investing activities (1,121) (1,177) (788)
Financing activitiesRepurchases of common stock (1,762) (990) (2,465)Proceeds from stock option exercises 827 440 116Dividends paid (1,540) (1,352) (1,095)Repayments of long-term debt (150) — (632)Premium paid on debt exchange — (225) —Issuance of long-term debt, net of related costs — — 1,980Other, net (81) 59 (48)
Net cash used for financing activities (2,706) (2,068) (2,144)
Net change in cash and cash equivalents 719 (1,684) 1,321Cash and cash equivalents at beginning of year 1,898 3,582 2,261
Cash and cash equivalents at end of year $ 2,617 $ 1,898 $ 3,582
The accompanying notes are an integral part of these consolidated financial statements.
59
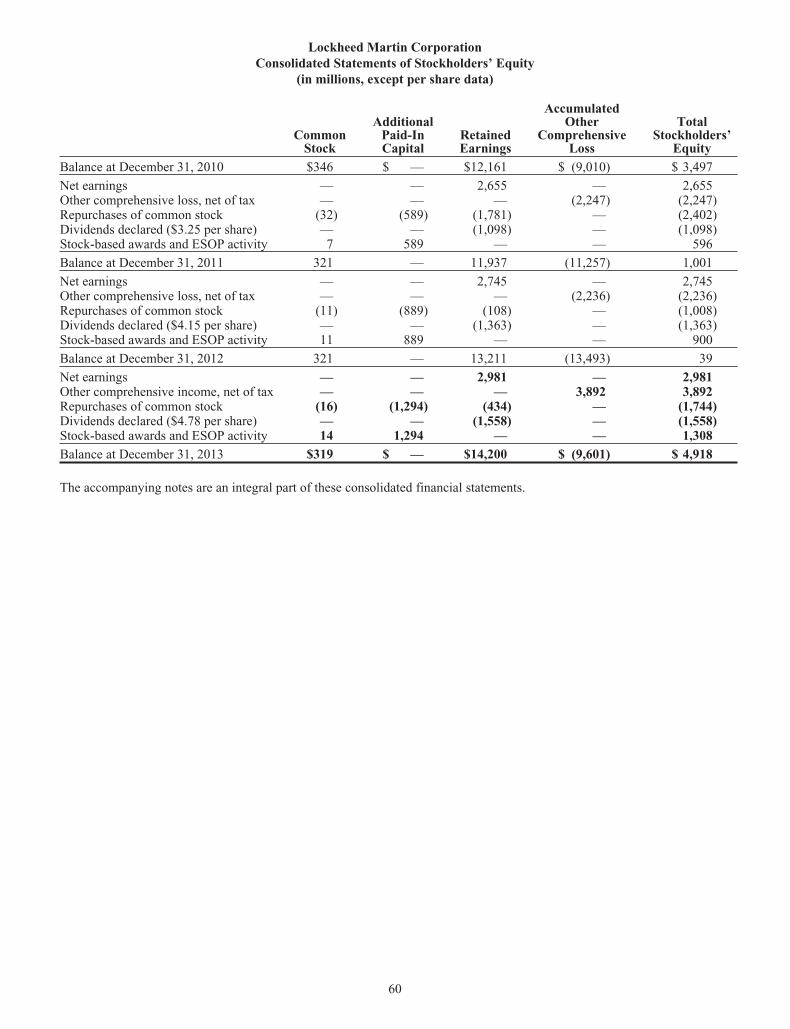
Lockheed Martin CorporationConsolidated Statements of Stockholders’ Equity
(in millions, except per share data)
CommonStock
AdditionalPaid-InCapital
RetainedEarnings
AccumulatedOther
ComprehensiveLoss
TotalStockholders’
Equity
Balance at December 31, 2010 $346 $ — $12,161 $ (9,010) $ 3,497
Net earnings — — 2,655 — 2,655Other comprehensive loss, net of tax — — — (2,247) (2,247)Repurchases of common stock (32) (589) (1,781) — (2,402)Dividends declared ($3.25 per share) — — (1,098) — (1,098)Stock-based awards and ESOP activity 7 589 — — 596
Balance at December 31, 2011 321 — 11,937 (11,257) 1,001
Net earnings — — 2,745 — 2,745Other comprehensive loss, net of tax — — — (2,236) (2,236)Repurchases of common stock (11) (889) (108) — (1,008)Dividends declared ($4.15 per share) — — (1,363) — (1,363)Stock-based awards and ESOP activity 11 889 — — 900
Balance at December 31, 2012 321 — 13,211 (13,493) 39
Net earnings — — 2,981 — 2,981Other comprehensive income, net of tax — — — 3,892 3,892Repurchases of common stock (16) (1,294) (434) — (1,744)Dividends declared ($4.78 per share) — — (1,558) — (1,558)Stock-based awards and ESOP activity 14 1,294 — — 1,308
Balance at December 31, 2013 $319 $ — $14,200 $ (9,601) $ 4,918
The accompanying notes are an integral part of these consolidated financial statements.
60
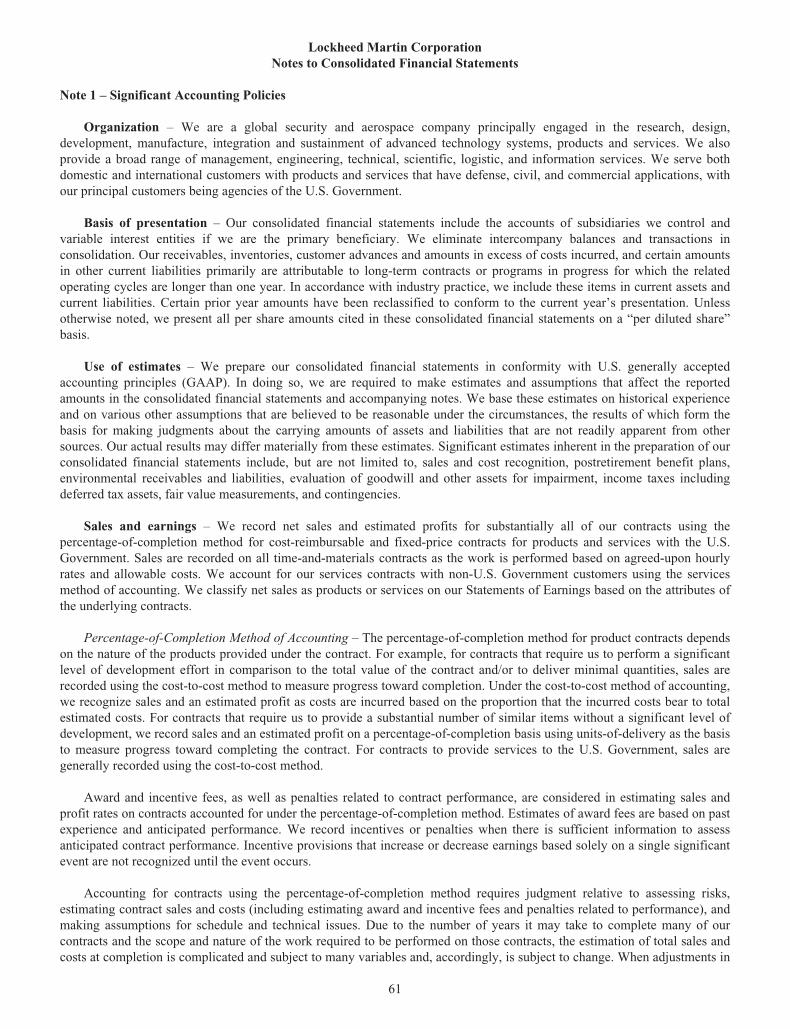
Lockheed Martin CorporationNotes to Consolidated Financial Statements
Note 1 – Significant Accounting Policies
Organization – We are a global security and aerospace company principally engaged in the research, design,development, manufacture, integration and sustainment of advanced technology systems, products and services. We alsoprovide a broad range of management, engineering, technical, scientific, logistic, and information services. We serve bothdomestic and international customers with products and services that have defense, civil, and commercial applications, withour principal customers being agencies of the U.S. Government.
Basis of presentation – Our consolidated financial statements include the accounts of subsidiaries we control andvariable interest entities if we are the primary beneficiary. We eliminate intercompany balances and transactions inconsolidation. Our receivables, inventories, customer advances and amounts in excess of costs incurred, and certain amountsin other current liabilities primarily are attributable to long-term contracts or programs in progress for which the relatedoperating cycles are longer than one year. In accordance with industry practice, we include these items in current assets andcurrent liabilities. Certain prior year amounts have been reclassified to conform to the current year’s presentation. Unlessotherwise noted, we present all per share amounts cited in these consolidated financial statements on a “per diluted share”basis.
Use of estimates – We prepare our consolidated financial statements in conformity with U.S. generally acceptedaccounting principles (GAAP). In doing so, we are required to make estimates and assumptions that affect the reportedamounts in the consolidated financial statements and accompanying notes. We base these estimates on historical experienceand on various other assumptions that are believed to be reasonable under the circumstances, the results of which form thebasis for making judgments about the carrying amounts of assets and liabilities that are not readily apparent from othersources. Our actual results may differ materially from these estimates. Significant estimates inherent in the preparation of ourconsolidated financial statements include, but are not limited to, sales and cost recognition, postretirement benefit plans,environmental receivables and liabilities, evaluation of goodwill and other assets for impairment, income taxes includingdeferred tax assets, fair value measurements, and contingencies.
Sales and earnings – We record net sales and estimated profits for substantially all of our contracts using thepercentage-of-completion method for cost-reimbursable and fixed-price contracts for products and services with the U.S.Government. Sales are recorded on all time-and-materials contracts as the work is performed based on agreed-upon hourlyrates and allowable costs. We account for our services contracts with non-U.S. Government customers using the servicesmethod of accounting. We classify net sales as products or services on our Statements of Earnings based on the attributes ofthe underlying contracts.
Percentage-of-Completion Method of Accounting – The percentage-of-completion method for product contracts dependson the nature of the products provided under the contract. For example, for contracts that require us to perform a significantlevel of development effort in comparison to the total value of the contract and/or to deliver minimal quantities, sales arerecorded using the cost-to-cost method to measure progress toward completion. Under the cost-to-cost method of accounting,we recognize sales and an estimated profit as costs are incurred based on the proportion that the incurred costs bear to totalestimated costs. For contracts that require us to provide a substantial number of similar items without a significant level ofdevelopment, we record sales and an estimated profit on a percentage-of-completion basis using units-of-delivery as the basisto measure progress toward completing the contract. For contracts to provide services to the U.S. Government, sales aregenerally recorded using the cost-to-cost method.
Award and incentive fees, as well as penalties related to contract performance, are considered in estimating sales andprofit rates on contracts accounted for under the percentage-of-completion method. Estimates of award fees are based on pastexperience and anticipated performance. We record incentives or penalties when there is sufficient information to assessanticipated contract performance. Incentive provisions that increase or decrease earnings based solely on a single significantevent are not recognized until the event occurs.
Accounting for contracts using the percentage-of-completion method requires judgment relative to assessing risks,estimating contract sales and costs (including estimating award and incentive fees and penalties related to performance), andmaking assumptions for schedule and technical issues. Due to the number of years it may take to complete many of ourcontracts and the scope and nature of the work required to be performed on those contracts, the estimation of total sales andcosts at completion is complicated and subject to many variables and, accordingly, is subject to change. When adjustments in
61
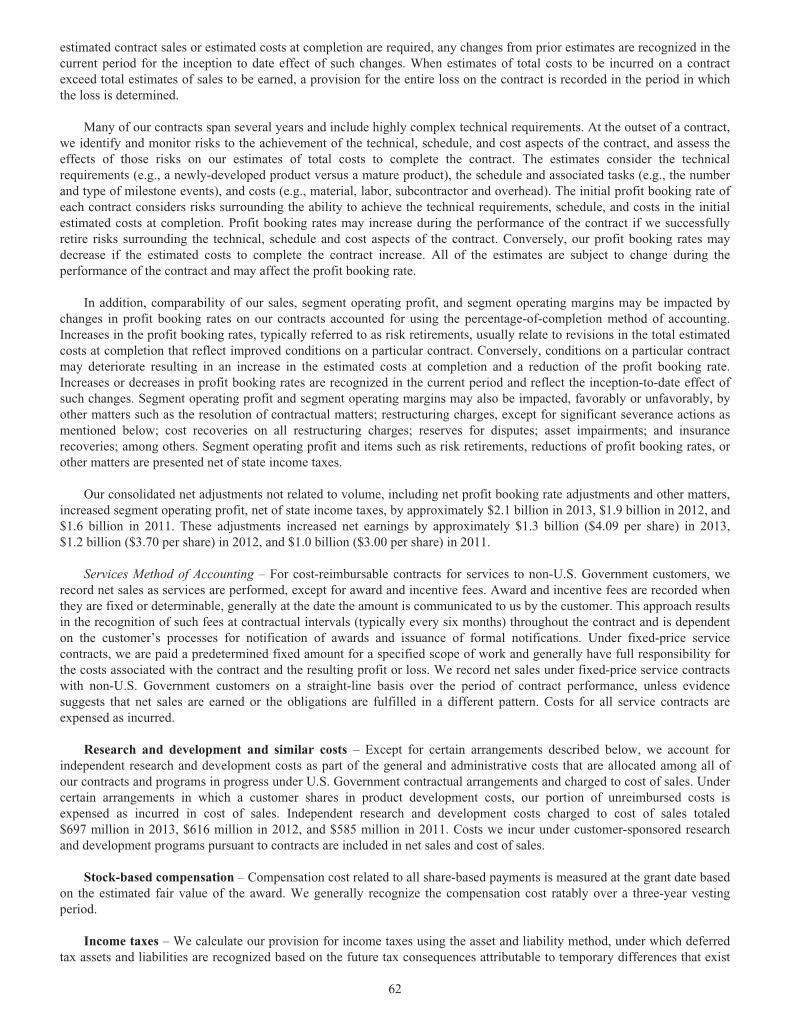
estimated contract sales or estimated costs at completion are required, any changes from prior estimates are recognized in thecurrent period for the inception to date effect of such changes. When estimates of total costs to be incurred on a contractexceed total estimates of sales to be earned, a provision for the entire loss on the contract is recorded in the period in whichthe loss is determined.
Many of our contracts span several years and include highly complex technical requirements. At the outset of a contract,we identify and monitor risks to the achievement of the technical, schedule, and cost aspects of the contract, and assess theeffects of those risks on our estimates of total costs to complete the contract. The estimates consider the technicalrequirements (e.g., a newly-developed product versus a mature product), the schedule and associated tasks (e.g., the numberand type of milestone events), and costs (e.g., material, labor, subcontractor and overhead). The initial profit booking rate ofeach contract considers risks surrounding the ability to achieve the technical requirements, schedule, and costs in the initialestimated costs at completion. Profit booking rates may increase during the performance of the contract if we successfullyretire risks surrounding the technical, schedule and cost aspects of the contract. Conversely, our profit booking rates maydecrease if the estimated costs to complete the contract increase. All of the estimates are subject to change during theperformance of the contract and may affect the profit booking rate.
In addition, comparability of our sales, segment operating profit, and segment operating margins may be impacted bychanges in profit booking rates on our contracts accounted for using the percentage-of-completion method of accounting.Increases in the profit booking rates, typically referred to as risk retirements, usually relate to revisions in the total estimatedcosts at completion that reflect improved conditions on a particular contract. Conversely, conditions on a particular contractmay deteriorate resulting in an increase in the estimated costs at completion and a reduction of the profit booking rate.Increases or decreases in profit booking rates are recognized in the current period and reflect the inception-to-date effect ofsuch changes. Segment operating profit and segment operating margins may also be impacted, favorably or unfavorably, byother matters such as the resolution of contractual matters; restructuring charges, except for significant severance actions asmentioned below; cost recoveries on all restructuring charges; reserves for disputes; asset impairments; and insurancerecoveries; among others. Segment operating profit and items such as risk retirements, reductions of profit booking rates, orother matters are presented net of state income taxes.
Our consolidated net adjustments not related to volume, including net profit booking rate adjustments and other matters,increased segment operating profit, net of state income taxes, by approximately $2.1 billion in 2013, $1.9 billion in 2012, and$1.6 billion in 2011. These adjustments increased net earnings by approximately $1.3 billion ($4.09 per share) in 2013,$1.2 billion ($3.70 per share) in 2012, and $1.0 billion ($3.00 per share) in 2011.
Services Method of Accounting – For cost-reimbursable contracts for services to non-U.S. Government customers, werecord net sales as services are performed, except for award and incentive fees. Award and incentive fees are recorded whenthey are fixed or determinable, generally at the date the amount is communicated to us by the customer. This approach resultsin the recognition of such fees at contractual intervals (typically every six months) throughout the contract and is dependenton the customer’s processes for notification of awards and issuance of formal notifications. Under fixed-price servicecontracts, we are paid a predetermined fixed amount for a specified scope of work and generally have full responsibility forthe costs associated with the contract and the resulting profit or loss. We record net sales under fixed-price service contractswith non-U.S. Government customers on a straight-line basis over the period of contract performance, unless evidencesuggests that net sales are earned or the obligations are fulfilled in a different pattern. Costs for all service contracts areexpensed as incurred.
Research and development and similar costs – Except for certain arrangements described below, we account forindependent research and development costs as part of the general and administrative costs that are allocated among all ofour contracts and programs in progress under U.S. Government contractual arrangements and charged to cost of sales. Undercertain arrangements in which a customer shares in product development costs, our portion of unreimbursed costs isexpensed as incurred in cost of sales. Independent research and development costs charged to cost of sales totaled$697 million in 2013, $616 million in 2012, and $585 million in 2011. Costs we incur under customer-sponsored researchand development programs pursuant to contracts are included in net sales and cost of sales.
Stock-based compensation – Compensation cost related to all share-based payments is measured at the grant date basedon the estimated fair value of the award. We generally recognize the compensation cost ratably over a three-year vestingperiod.
Income taxes – We calculate our provision for income taxes using the asset and liability method, under which deferredtax assets and liabilities are recognized based on the future tax consequences attributable to temporary differences that exist
62
between the financial statement carrying amount of assets and liabilities and their respective tax bases, as well as fromoperating loss and tax credit carry-forwards. We measure deferred tax assets and liabilities using enacted tax rates that willapply in the years in which we expect the temporary differences to be recovered or paid.
We periodically assess our tax filing exposures related to periods that are open to examination. Based on the latestavailable information, we evaluate our tax positions to determine whether the position will more likely than not be sustainedupon examination by the Internal Revenue Service (IRS). If we cannot reach a more-likely-than-not determination, no benefitis recorded. If we determine that the tax position is more likely than not to be sustained, we record the largest amount ofbenefit that is more likely than not to be realized when the tax position is settled. We record interest and penalties related toincome taxes as a component of income tax expense on our Statements of Earnings. Interest and penalties were not material.
Cash and cash equivalents – Cash equivalents include highly liquid instruments with original maturities of 90 days orless.
Receivables – Receivables include amounts billed and currently due from customers, and unbilled costs and accruedprofits primarily related to sales on long-term contracts that have been recognized but not yet billed to customers. Pursuant tocontract provisions, agencies of the U.S. Government and certain other customers have title to, or a security interest in, assetsrelated to such contracts as a result of advances, performance-based payments, and progress payments. We reflect thoseadvances and payments as an offset to the related receivables balance for contracts that we account for on a percentage-of-completion basis using the cost-to-cost method to measure progress towards completion.
Inventories – We record inventories at the lower of cost or estimated net realizable value. Costs on long-term contractsand programs in progress represent recoverable costs incurred for production or contract-specific facilities and equipment,allocable operating overhead, advances to suppliers and, in the case of contracts with the U.S. Government and substantiallyall other governments, research and development and general and administrative expenses. Pursuant to contract provisions,agencies of the U.S. Government and certain other customers have title to, or a security interest in, inventories related to suchcontracts as a result of advances, performance-based payments, and progress payments. We reflect those advances andpayments as an offset against the related inventory balances for contracts that we account for on a percentage-of-completionbasis using units-of-delivery as the basis to measure progress toward completing the contract. We determine the costs ofother product and supply inventories by the first-in first-out or average cost methods.
Property, plant, and equipment – We record property, plant, and equipment at cost. We provide for depreciation andamortization on plant and equipment generally using accelerated methods during the first half of the estimated useful lives ofthe assets, and the straight-line method thereafter. The estimated useful lives of our plant and equipment generally rangefrom 10 to 40 years for buildings and five to 15 years for machinery and equipment. No depreciation expense is recorded onconstruction in progress until such assets are placed into operation. Depreciation expense related to plant and equipment was$714 million in 2013, $715 million in 2012, and $712 million in 2011.
We review the carrying amounts of long-lived assets for impairment if events or changes in the facts and circumstancesindicate that their carrying amounts may not be recoverable. We assess impairment by comparing the estimated undiscountedfuture cash flows of the related asset grouping to its carrying amount. If an asset is determined to be impaired, we recognizean impairment charge in the current period for the difference between the fair value of the asset and its carrying amount.
Capitalized software – We capitalize certain costs associated with the development or purchase of internal-use software.The amounts capitalized are included in other noncurrent assets on our Balance Sheets and are amortized on a straight-line basisover the estimated useful life of the resulting software, which ranges from two to six years. As of December 31, 2013 and 2012,capitalized software totaled $653 million and $809 million, net of accumulated amortization of $1.6 billion and $1.5 billion. Noamortization expense is recorded until the software is ready for its intended use. Amortization expense related to capitalizedsoftware was $228 million in 2013, $217 million in 2012, and $211 million in 2011.
Goodwill – We test goodwill for impairment at least annually in the fourth quarter and test more frequently upon theoccurrence of certain events or significant changes in circumstances that indicate goodwill may be impaired. Such events orchanges in circumstances may include a significant deterioration in overall economic conditions, changes in the businessclimate of our industry, a decline in our market capitalization, operating performance indicators, competition, reorganizationsof our business, or the disposal of all or a portion of a reporting unit. Our goodwill has been allocated to and is tested forimpairment at a level referred to as the reporting unit, which is our business segment level or a level below the businesssegment. The level at which we test goodwill for impairment requires us to determine whether the operations below thebusiness segment constitute a self-sustaining business for which discrete financial information is available and segmentmanagement regularly reviews the operating results.
63
We initially test goodwill for impairment by comparing the fair value of each reporting unit with its carrying amount,including goodwill. If the fair value of a reporting unit exceeds its carrying amount, goodwill of the reporting unit is notimpaired. If the carrying amount of a reporting unit exceeds its fair value, we compare the implied value of the reportingunit’s goodwill with the carrying amount of its goodwill. The implied value of the reporting unit’s goodwill is calculated bycreating a hypothetical balance sheet as if the reporting unit had just been acquired. This balance sheet contains all assets andliabilities recorded at fair value (including any assumed intangible assets that may not have any corresponding carryingamount in our balance sheet). The implied value of the reporting unit’s goodwill is calculated by subtracting the fair value ofthe net assets from the fair value of the reporting unit. If the carrying amount of the reporting unit’s goodwill exceeds theimplied value of that goodwill, an impairment loss is recognized in an amount equal to that excess.
We estimate the fair value of each reporting unit using a combination of a discounted cash flow (DCF) analysis andmarket-based valuation methodologies such as comparable public trading values and values observed in market transactions.Determining fair value requires the exercise of significant judgments, including judgments about the amount and timing ofexpected future cash flows, discount rates, perpetual growth rates, and relevant comparable company earnings multiples andtransaction multiples. The cash flows employed in the DCF analyses are based on our best estimate of future sales andoperating costs, based primarily on existing firm orders, expected future orders, contracts with suppliers, labor agreements,and general market conditions; changes in working capital; most recent long-term business plans in place at the time of ourtesting date; and recent operating performance. The discount rates utilized in the DCF analysis are based on the respectivereporting unit’s weighted average cost of capital, which takes into account the relative weights of each component of capitalstructure (equity and debt) and represents the expected cost of new capital, adjusted as appropriate to consider the riskinherent in future cash flows of the respective reporting unit.
In the fourth quarter of 2013, we performed our annual goodwill impairment test for each of our reporting units. Theresults of these tests indicated that the estimated fair values of our reporting units exceeded their carrying amounts, with theexception of our Technical Services reporting unit within our Missiles and Fire Control (MFC) business segment. During thefourth quarter of 2013, the continuing impact of defense budget reductions and related competitive pressures on theTechnical Services business, which typically has smaller customer contracts of a shorter duration, adversely impacted the fairvalue of this reporting unit. As a result, we compared the implied value of that reporting unit’s goodwill with the carryingamount of its goodwill, and since the carrying amount exceeded the implied value, we recorded a non-cash impairmentcharge of $195 million, net of state tax benefits, in the fourth quarter of 2013 equal to that differential. This charge reducedour net earnings by $176 million ($.54 per share).
Customer advances and amounts in excess of cost incurred – We receive advances, performance-based payments,and progress payments from customers that may exceed costs incurred on certain contracts, including contracts with agenciesof the U.S. Government. We classify such advances, other than those reflected as a reduction of receivables or inventories asdiscussed above, as current liabilities.
Postretirement benefit plans – Many of our employees are covered by defined benefit pension plans, and we providecertain health care and life insurance benefits to eligible retirees (collectively, postretirement benefit plans). GAAP requiresthat the amounts we record related to our postretirement benefit plans be computed, based on service to date, using actuarialvaluations that are based in part on certain key economic assumptions we make, including the discount rate, the expectedlong-term rate of return on plan assets, and other actuarial assumptions including participant mortality estimates, theexpected rates of increase in future compensation levels, health care cost trend rates, and employee turnover, each asappropriate based on the nature of the plans. We recognize on a plan-by-plan basis the funded status of our postretirementbenefit plans under GAAP as either an asset recorded within other noncurrent assets or a liability recorded within noncurrentliabilities on our Balance Sheets. There is a corresponding non-cash adjustment to accumulated other comprehensive loss, netof tax benefits recorded as deferred tax assets, in stockholders’ equity. The GAAP funded status is measured as the differencebetween the fair value of the plan’s assets and the benefit obligation of the plan. The funded status under the EmployeeRetirement Income Security Act of 1974 (ERISA), as amended by the Pension Protection Act of 2006 (PPA), is calculated ona different basis than under GAAP.
Environmental matters – We record a liability for environmental matters when it is probable that a liability has beenincurred and the amount can be reasonably estimated. The amount of liability recorded is based on our estimate of the coststo be incurred for remediation at a particular site. We do not discount the recorded liabilities, as the amount and timing offuture cash payments are not fixed or cannot be reliably determined. Our environmental liabilities are recorded on ourBalance Sheets within other liabilities, both current and noncurrent. We expect to include a substantial portion ofenvironmental costs in our net sales and cost of sales in future periods pursuant to U.S. Government agreement or regulation.At the time a liability is recorded for future environmental costs, we record a receivable for estimated future recoveryconsidered probable through the pricing of products and services to agencies of the U.S. Government, regardless of the
64
contract form (e.g., cost-reimbursable, fixed-price). We continuously evaluate the recoverability of our environmentalreceivables by assessing, among other factors, U.S. Government regulations, our U.S. Government business base andcontract mix, and our history of receiving reimbursement of such costs. We include the portion of those environmental costsexpected to be allocated to our non-U.S. Government contracts, or that is determined to be unallowable for pricing underU.S. Government contracts, in our cost of sales at the time the liability is established. Our environmental receivables arerecorded on our Balance Sheets within other assets, both current and noncurrent. We project costs and recovery of costs overapproximately 20 years.
Investments in marketable securities – Investments in marketable securities consist of debt and equity securities andare classified as trading securities. As of December 31, 2013 and 2012, the fair value of our trading securities totaled$1.0 billion and $874 million and was included in other noncurrent assets on our Balance Sheets. Our trading securities areheld in a separate trust, which includes investments to fund our deferred compensation plan liabilities. Net gains on tradingsecurities in 2013, 2012, and 2011 were $64 million, $67 million, and $40 million. Gains and losses on these investments areincluded in other unallocated costs within cost of sales on our Statements of Earnings in order to align the classification ofchanges in the market value of investments held for the plan with changes in the value of the corresponding plan liabilities.
Equity method investments – Investments where we have the ability to exercise significant influence, but do notcontrol, are accounted for under the equity method of accounting and are included in other noncurrent assets on our BalanceSheets. Significant influence typically exists if we have a 20% to 50% ownership interest in the investee. Under this methodof accounting, our share of the net earnings or losses of the investee is included in operating profit in other income, net onour Statements of Earnings since the activities of the investee are closely aligned with the operations of the business segmentholding the investment. We evaluate our equity method investments for impairment whenever events or changes incircumstances indicate that the carrying amounts of such investments may be impaired. If a decline in the value of an equitymethod investment is determined to be other than temporary, a loss is recorded in earnings in the current period. As ofDecember 31, 2013 and 2012, our equity method investments totaled $914 million and $749 million, which primarily arecomposed of our Space Systems business segment’s investment in United Launch Alliance (ULA), as further described inNote 13, and our Aeronautics business segment’s investment in the Advanced Military Maintenance, Repair and OverhaulCenter venture. Our share of net earnings related to our equity method investees was $321 million in 2013, $277 million in2012, and $332 million in 2011, of which approximately $300 million, $265 million, and $285 million related to our SpaceSystems business segment.
Derivative financial instruments – We use derivative instruments principally to reduce our exposure to market risks fromchanges in foreign currency exchange rates and interest rates. We do not enter into or hold derivative instruments for speculativetrading purposes. We transact business globally and are subject to risks associated with changing foreign currency exchangerates. We enter into foreign currency hedges such as forward and option contracts that change in value as foreign currencyexchange rates change. These contracts hedge forecasted foreign currency transactions in order to mitigate fluctuations in ourearnings and cash flows associated with changes in foreign currency exchange rates. We designate foreign currency hedges ascash flow hedges. We also are exposed to the impact of interest rate changes primarily through our borrowing activities. Forfixed rate borrowings, we may use variable interest rate swaps, effectively converting fixed rate borrowings to variable rateborrowings in order to reduce the amount of interest paid. These swaps are designated as fair value hedges. For variable rateborrowings, we may use fixed interest rate swaps, effectively converting variable rate borrowings to fixed rate borrowings inorder to mitigate the impact of interest rate changes on earnings. These swaps are designated as cash flow hedges. We may alsoenter into derivative instruments that are not designated as hedges and do not qualify for hedge accounting, which are intendedto mitigate certain economic exposures.
We record derivatives at their fair value. The classification of gains and losses resulting from changes in the fair values ofderivatives is dependent on our intended use of the derivative and its resulting designation. Adjustments to reflect changes in fairvalues of derivatives attributable to the effective portion of hedges are either reflected in earnings and largely offset bycorresponding adjustments to the hedged items, or reflected net of income taxes in accumulated other comprehensive loss until thehedged transaction is recognized in earnings. Changes in the fair value of the derivatives that are attributable to the ineffectiveportion of the hedges, or of derivatives that are not considered to be highly effective hedges, if any, are immediately recognized inearnings. The aggregate notional amount of our outstanding foreign currency hedges at December 31, 2013 and 2012 was$1.0 billion and $1.3 billion. The aggregate notional amount of our outstanding interest rate swaps at December 31, 2013 and 2012was $1.2 billion and $503 million. Derivative instruments did not have a material impact on net earnings and comprehensiveincome during 2013, 2012, and 2011. Substantially all of our derivatives are designated for hedge accounting. See Note 15 for moreinformation on the fair value measurements related to our derivative instruments.
65
Note 2 – Restructuring Charges
2013 Actions
During 2013, we recorded charges related to certain severance actions totaling $201 million, net of state tax benefits, ofwhich $83 million, $37 million, and $81 million related to our Information Systems & Global Solutions (IS&GS), MissionSystems and Training (MST), and Space Systems business segments. These charges reduced our net earnings by$130 million ($.40 per share) and primarily related to a plan we committed to in November 2013 to close and consolidatecertain facilities and reduce our total workforce by approximately 4,000 positions within our IS&GS, MST, and SpaceSystems business segments. These charges also include $30 million related to certain severance actions at our IS&GSbusiness segment that occurred in the first quarter of 2013, which were subsequently paid in 2013.
The November 2013 plan resulted from a strategic review of these businesses’ facility capacity and future workloadprojections and is intended to better align our organization and cost structure and improve the affordability of our productsand services given the continued decline in U.S. Government spending as well as the rapidly changing competitive andeconomic landscape. Upon separation, terminated employees will receive lump-sum severance payments primarily based onyears of service. During 2013, we paid approximately $15 million in severance payments associated with these actions, withthe remainder expected to be paid through the middle of 2015.
In addition to the severance charges described above, we expect to incur accelerated and incremental costs (e.g.,accelerated depreciation expense related to long-lived assets at the sites to be closed, relocation of equipment and otheremployee related costs) of approximately $15 million, $50 million, and $135 million at our IS&GS, MST, and SpaceSystems business segments related to the facility closures and consolidations. The accelerated and incremental costs will beexpensed as incurred in the respective business segment’s results of operations through their completion in 2015. We expectto recover a substantial amount of the restructuring charges through the pricing of our products and services to the U.S.Government and other customers in future periods, with the impact included in the respective business segment’s results ofoperations.
2012 and 2011 Actions
During 2012, we recorded charges related to certain severance actions totaling $48 million, net of state tax benefits, ofwhich $25 million related to our Aeronautics business segment and $23 million related to the reorganization of our formerElectronic Systems business segment. These charges reduced our net earnings by $31 million ($.09 per share) and consistedof severance costs associated with the elimination of certain positions through either voluntary or involuntary actions. Theseseverance actions resulted from cost reduction initiatives to better align our organization with changing economic conditions.Upon separation, terminated employees received lump-sum severance payments primarily based on years of service, all ofwhich were paid in 2013.
During 2011, we recorded charges related to certain severance actions totaling $136 million, net of state tax benefits, ofwhich $49 million, $48 million, and $39 million related to our Aeronautics, Space Systems, and our IS&GS businesssegments and Corporate Headquarters. These charges reduced our net earnings by $88 million ($.26 per share) and consistedof severance costs associated with the elimination of certain positions through either voluntary or involuntary actions. Theseseverance actions resulted from a strategic review of these businesses and our Corporate Headquarters and are intended tobetter align our organization and cost structure with changing economic conditions. The workforce reductions at the businesssegments also reflected changes in program lifecycles, where several of our major programs were either transitioning out ofdevelopment and into production or were ending. Upon separation, terminated employees received lump-sum severancepayments based on years of service. During 2011, we made approximately half of the severance payments associated withthese 2011 severance actions, and paid the remaining amounts in 2012.
Note 3 – Earnings Per Share
The weighted average number of shares outstanding used to compute earnings per common share were as follows(in millions):
2013 2012 2011
Weighted average common shares outstanding for basic computations 320.9 323.7 335.9Weighted average dilutive effect of equity awards 5.6 4.7 4.0
Weighted average common shares outstanding for diluted computations 326.5 328.4 339.9
66
We compute basic and diluted earnings per common share by dividing net earnings by the respective weighted averagenumber of common shares outstanding for the periods presented. Our calculation of diluted earnings per common share alsoincludes the dilutive effects for the assumed exercise of outstanding stock options and vesting of outstanding restricted stockunits based on the treasury stock method.
The computation of diluted earnings per common share excluded 2.4 million, 8.0 million, and 13.4 million stock optionsfor the years ended December 31, 2013, 2012, and 2011 because their inclusion would have been anti-dilutive, primarily dueto their exercise prices exceeding the average market prices of our common stock during the respective periods.
Note 4 – Information on Business Segments
We operate in five business segments: Aeronautics, IS&GS, MFC, MST, and Space Systems. We organize our businesssegments based on the nature of the products and services offered. The following is a brief description of the activities of ourbusiness segments:
• Aeronautics – Engaged in the research, design, development, manufacture, integration, sustainment, support, and upgradeof advanced military aircraft, including combat and air mobility aircraft, unmanned air vehicles, and related technologies.
• Information Systems & Global Solutions – Provides advanced technology systems and expertise, integrated informationtechnology solutions, and management services across a broad spectrum of applications for civil, defense, intelligence,and other government customers.
• Missiles and Fire Control – Provides air and missile defense systems; tactical missiles and air-to-ground precision strikeweapon systems; logistics and other technical services; fire control systems; mission operations support, readiness,engineering support, and integration services; and manned and unmanned ground vehicles.
• Mission Systems and Training – Provides ship and submarine mission and combat systems; mission systems and sensorsfor rotary and fixed-wing aircraft; sea and land-based missile defense systems; radar systems; the Littoral Combat Ship;simulation and training services; and unmanned systems and technologies.
• Space Systems – Engaged in the research and development, design, engineering, and production of satellites, strategicand defensive missile systems, and space transportation systems. Space Systems is also responsible for various classifiedsystems and services in support of vital national security systems. Operating profit for our Space Systems businesssegment includes our share of earnings for our investment in ULA, which provides expendable launch services to the U.S.Government.
The financial information in the following tables includes the results of businesses we have acquired during the pastthree years (Note 14) from their respective dates of acquisition. The business segment operating results in the followingtables exclude businesses included in discontinued operations (Note 14) for all years presented.
Net sales of our business segments exclude intersegment sales, as these activities are eliminated in consolidation.Intercompany transactions are generally negotiated under terms and conditions that share many similar characteristics (e.g.,contract structures, funding profiles, target cost values, contract progress reports) with our third-party contracts, primarilywith the U.S. Government.
Operating profit of our business segments includes our share of earnings or losses from equity method investees becausethe operating activities of the equity method investees are closely aligned with the operations of those business segments.Operating profit of our business segments excludes the FAS/CAS pension adjustment described below; expense for stock-based compensation; the effects of items not considered part of management’s evaluation of segment operating performance,such as charges related to goodwill impairment (Note 1) and significant severance actions (Note 2); gains or losses fromdivestitures (Note 14); the effects of certain legal settlements; corporate costs not allocated to our business segments; andother miscellaneous corporate activities. These items are included in the reconciling item “Unallocated expenses, net”between operating profit from our business segments and our consolidated operating profit.
The results of operations of our business segments include pension expense only as determined and funded inaccordance with U.S. Government Cost Accounting Standards (CAS). The FAS/CAS pension adjustment represents thedifference between pension expense calculated in accordance with GAAP and pension costs calculated and funded inaccordance with CAS. CAS governs the extent to which pension costs can be allocated to and recovered on U.S. Governmentcontracts. The CAS cost is recovered through the pricing of our products and services on U.S. Government contracts and,therefore, is recognized in each of our business segments’ net sales and cost of sales.
67
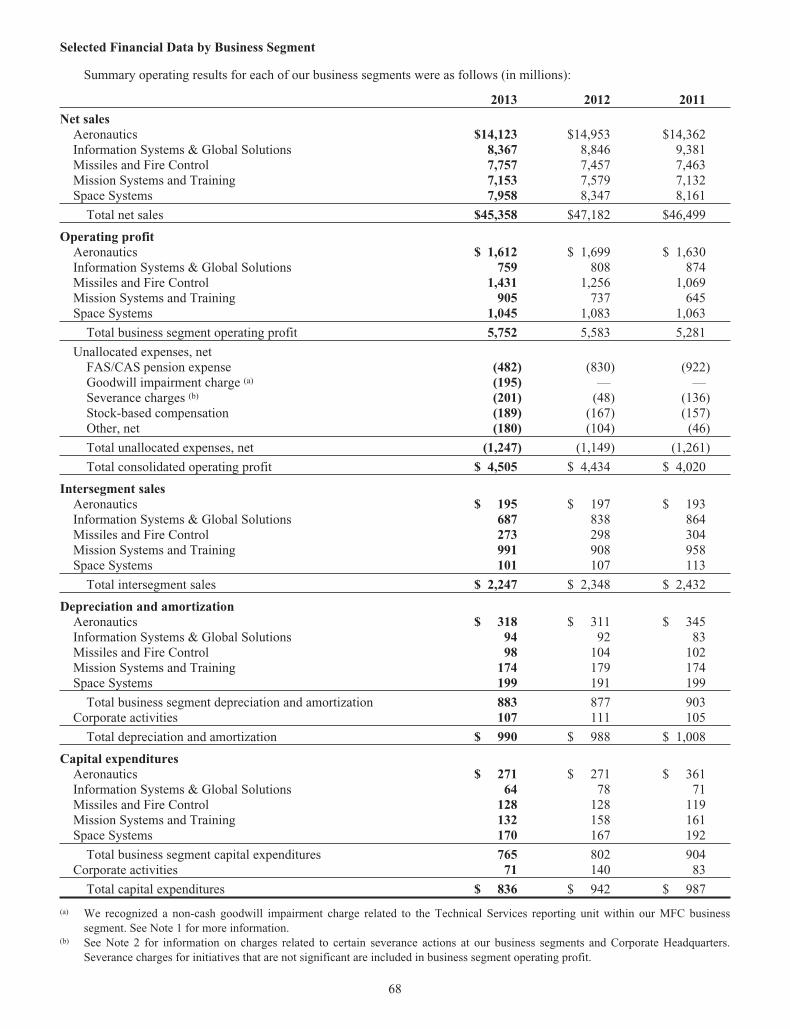
Selected Financial Data by Business Segment
Summary operating results for each of our business segments were as follows (in millions):
2013 2012 2011
Net salesAeronautics $14,123 $14,953 $14,362Information Systems & Global Solutions 8,367 8,846 9,381Missiles and Fire Control 7,757 7,457 7,463Mission Systems and Training 7,153 7,579 7,132Space Systems 7,958 8,347 8,161
Total net sales $45,358 $47,182 $46,499
Operating profitAeronautics $ 1,612 $ 1,699 $ 1,630Information Systems & Global Solutions 759 808 874Missiles and Fire Control 1,431 1,256 1,069Mission Systems and Training 905 737 645Space Systems 1,045 1,083 1,063
Total business segment operating profit 5,752 5,583 5,281
Unallocated expenses, netFAS/CAS pension expense (482) (830) (922)Goodwill impairment charge (a) (195) — —Severance charges (b) (201) (48) (136)Stock-based compensation (189) (167) (157)Other, net (180) (104) (46)
Total unallocated expenses, net (1,247) (1,149) (1,261)
Total consolidated operating profit $ 4,505 $ 4,434 $ 4,020
Intersegment salesAeronautics $ 195 $ 197 $ 193Information Systems & Global Solutions 687 838 864Missiles and Fire Control 273 298 304Mission Systems and Training 991 908 958Space Systems 101 107 113
Total intersegment sales $ 2,247 $ 2,348 $ 2,432
Depreciation and amortizationAeronautics $ 318 $ 311 $ 345Information Systems & Global Solutions 94 92 83Missiles and Fire Control 98 104 102Mission Systems and Training 174 179 174Space Systems 199 191 199
Total business segment depreciation and amortization 883 877 903Corporate activities 107 111 105
Total depreciation and amortization $ 990 $ 988 $ 1,008
Capital expendituresAeronautics $ 271 $ 271 $ 361Information Systems & Global Solutions 64 78 71Missiles and Fire Control 128 128 119Mission Systems and Training 132 158 161Space Systems 170 167 192
Total business segment capital expenditures 765 802 904Corporate activities 71 140 83
Total capital expenditures $ 836 $ 942 $ 987
(a) We recognized a non-cash goodwill impairment charge related to the Technical Services reporting unit within our MFC businesssegment. See Note 1 for more information.
(b) See Note 2 for information on charges related to certain severance actions at our business segments and Corporate Headquarters.Severance charges for initiatives that are not significant are included in business segment operating profit.
68
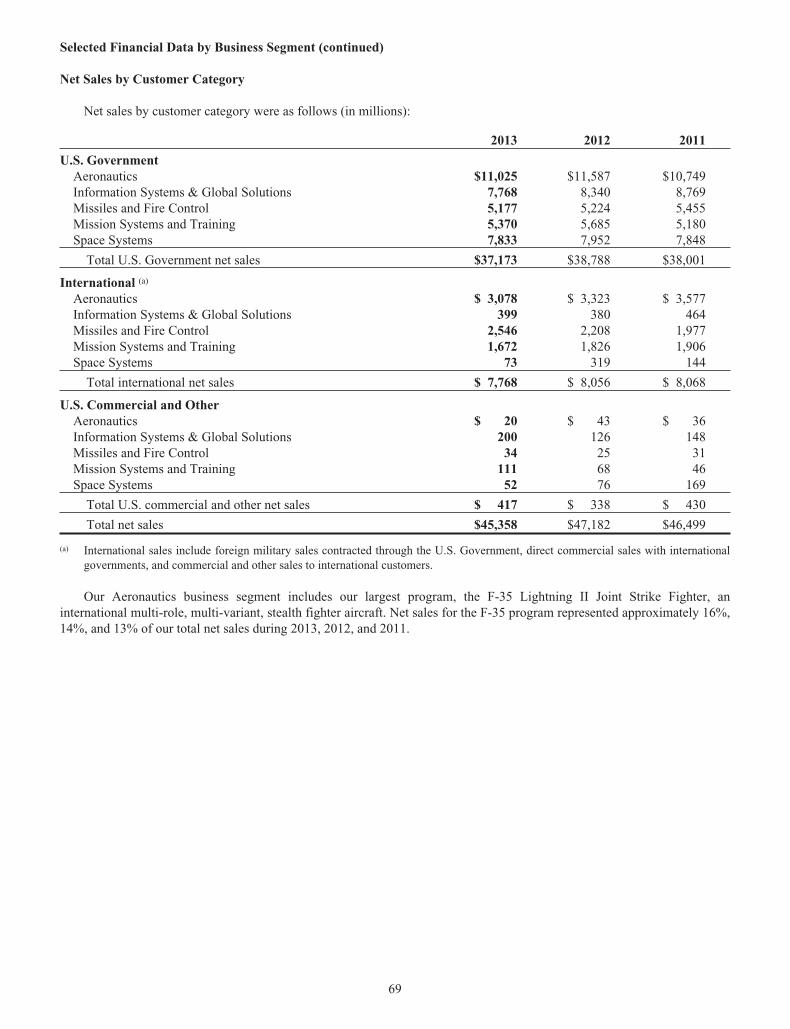
Selected Financial Data by Business Segment (continued)
Net Sales by Customer Category
Net sales by customer category were as follows (in millions):
2013 2012 2011
U.S. GovernmentAeronautics $11,025 $11,587 $10,749Information Systems & Global Solutions 7,768 8,340 8,769Missiles and Fire Control 5,177 5,224 5,455Mission Systems and Training 5,370 5,685 5,180Space Systems 7,833 7,952 7,848
Total U.S. Government net sales $37,173 $38,788 $38,001
International (a)
Aeronautics $ 3,078 $ 3,323 $ 3,577Information Systems & Global Solutions 399 380 464Missiles and Fire Control 2,546 2,208 1,977Mission Systems and Training 1,672 1,826 1,906Space Systems 73 319 144
Total international net sales $ 7,768 $ 8,056 $ 8,068
U.S. Commercial and OtherAeronautics $ 20 $ 43 $ 36Information Systems & Global Solutions 200 126 148Missiles and Fire Control 34 25 31Mission Systems and Training 111 68 46Space Systems 52 76 169
Total U.S. commercial and other net sales $ 417 $ 338 $ 430
Total net sales $45,358 $47,182 $46,499
(a) International sales include foreign military sales contracted through the U.S. Government, direct commercial sales with internationalgovernments, and commercial and other sales to international customers.
Our Aeronautics business segment includes our largest program, the F-35 Lightning II Joint Strike Fighter, aninternational multi-role, multi-variant, stealth fighter aircraft. Net sales for the F-35 program represented approximately 16%,14%, and 13% of our total net sales during 2013, 2012, and 2011.
69
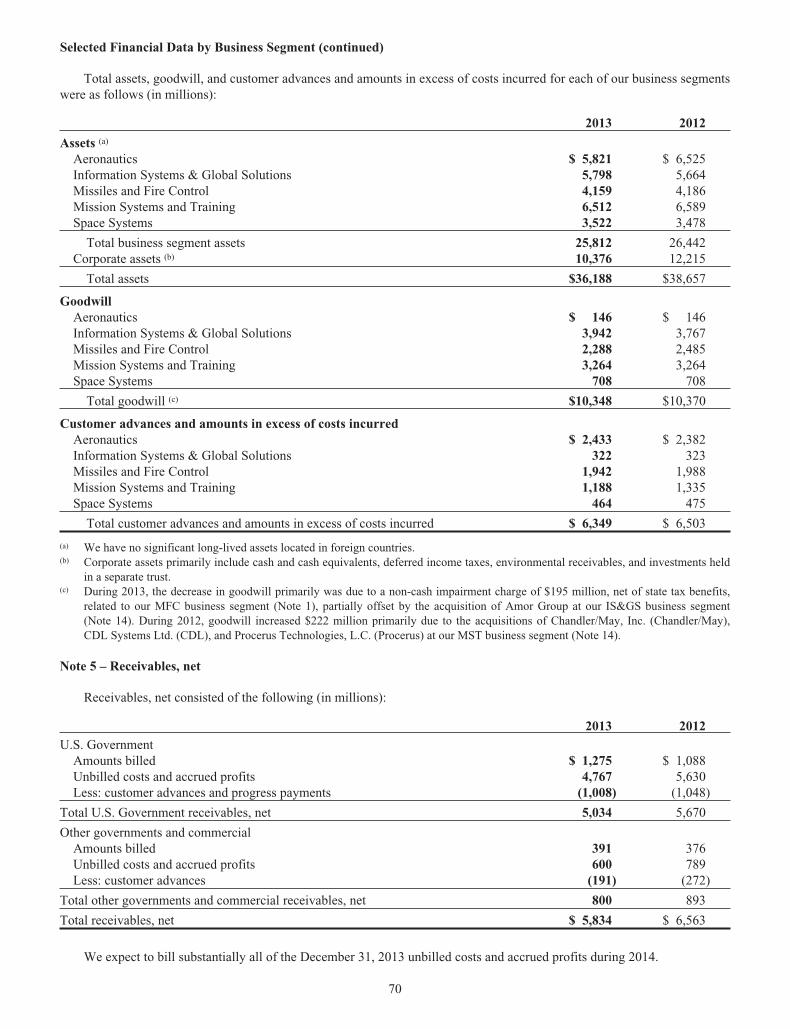
Selected Financial Data by Business Segment (continued)
Total assets, goodwill, and customer advances and amounts in excess of costs incurred for each of our business segmentswere as follows (in millions):
2013 2012
Assets (a)
Aeronautics $ 5,821 $ 6,525Information Systems & Global Solutions 5,798 5,664Missiles and Fire Control 4,159 4,186Mission Systems and Training 6,512 6,589Space Systems 3,522 3,478
Total business segment assets 25,812 26,442Corporate assets (b) 10,376 12,215
Total assets $36,188 $38,657
GoodwillAeronautics $ 146 $ 146Information Systems & Global Solutions 3,942 3,767Missiles and Fire Control 2,288 2,485Mission Systems and Training 3,264 3,264Space Systems 708 708
Total goodwill (c) $10,348 $10,370
Customer advances and amounts in excess of costs incurredAeronautics $ 2,433 $ 2,382Information Systems & Global Solutions 322 323Missiles and Fire Control 1,942 1,988Mission Systems and Training 1,188 1,335Space Systems 464 475
Total customer advances and amounts in excess of costs incurred $ 6,349 $ 6,503
(a) We have no significant long-lived assets located in foreign countries.(b) Corporate assets primarily include cash and cash equivalents, deferred income taxes, environmental receivables, and investments held
in a separate trust.(c) During 2013, the decrease in goodwill primarily was due to a non-cash impairment charge of $195 million, net of state tax benefits,
related to our MFC business segment (Note 1), partially offset by the acquisition of Amor Group at our IS&GS business segment(Note 14). During 2012, goodwill increased $222 million primarily due to the acquisitions of Chandler/May, Inc. (Chandler/May),CDL Systems Ltd. (CDL), and Procerus Technologies, L.C. (Procerus) at our MST business segment (Note 14).
Note 5 – Receivables, net
Receivables, net consisted of the following (in millions):
2013 2012
U.S. GovernmentAmounts billed $ 1,275 $ 1,088Unbilled costs and accrued profits 4,767 5,630Less: customer advances and progress payments (1,008) (1,048)
Total U.S. Government receivables, net 5,034 5,670
Other governments and commercialAmounts billed 391 376Unbilled costs and accrued profits 600 789Less: customer advances (191) (272)
Total other governments and commercial receivables, net 800 893
Total receivables, net $ 5,834 $ 6,563
We expect to bill substantially all of the December 31, 2013 unbilled costs and accrued profits during 2014.
70
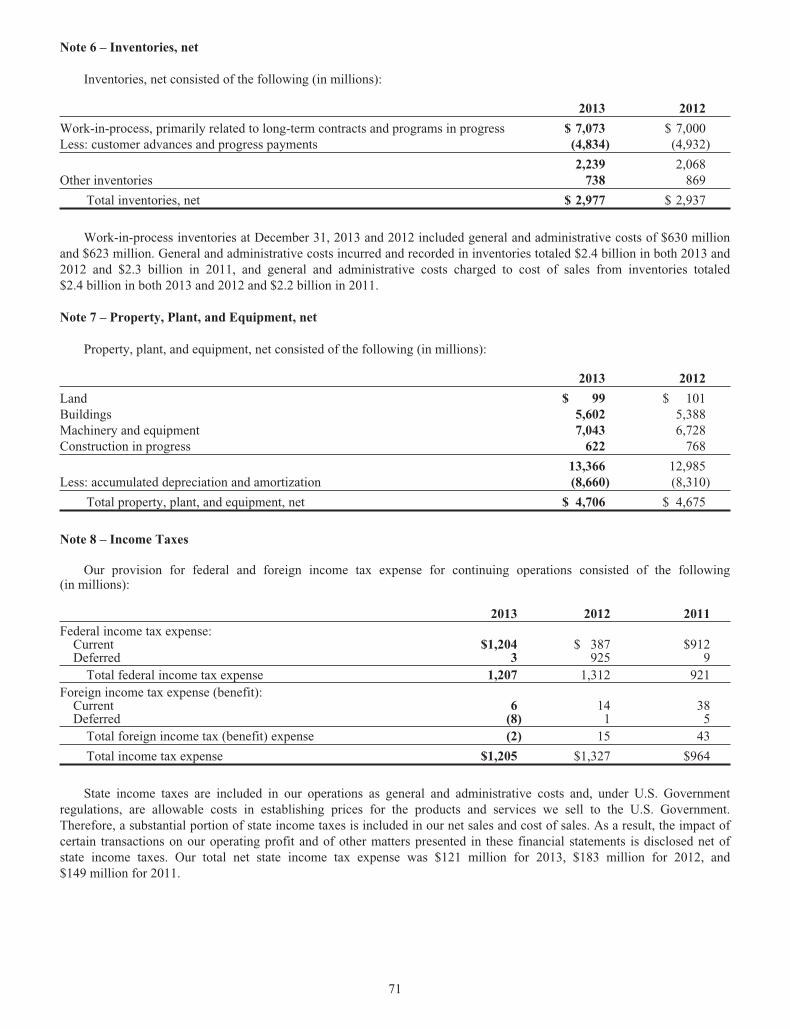
Note 6 – Inventories, net
Inventories, net consisted of the following (in millions):
2013 2012
Work-in-process, primarily related to long-term contracts and programs in progress $ 7,073 $ 7,000Less: customer advances and progress payments (4,834) (4,932)
2,239 2,068Other inventories 738 869
Total inventories, net $ 2,977 $ 2,937
Work-in-process inventories at December 31, 2013 and 2012 included general and administrative costs of $630 millionand $623 million. General and administrative costs incurred and recorded in inventories totaled $2.4 billion in both 2013 and2012 and $2.3 billion in 2011, and general and administrative costs charged to cost of sales from inventories totaled$2.4 billion in both 2013 and 2012 and $2.2 billion in 2011.
Note 7 – Property, Plant, and Equipment, net
Property, plant, and equipment, net consisted of the following (in millions):
2013 2012
Land $ 99 $ 101Buildings 5,602 5,388Machinery and equipment 7,043 6,728Construction in progress 622 768
13,366 12,985Less: accumulated depreciation and amortization (8,660) (8,310)
Total property, plant, and equipment, net $ 4,706 $ 4,675
Note 8 – Income Taxes
Our provision for federal and foreign income tax expense for continuing operations consisted of the following(in millions):
2013 2012 2011Federal income tax expense:
Current $1,204 $ 387 $912Deferred 3 925 9
Total federal income tax expense 1,207 1,312 921Foreign income tax expense (benefit):
Current 6 14 38Deferred (8) 1 5
Total foreign income tax (benefit) expense (2) 15 43
Total income tax expense $1,205 $1,327 $964
State income taxes are included in our operations as general and administrative costs and, under U.S. Governmentregulations, are allowable costs in establishing prices for the products and services we sell to the U.S. Government.Therefore, a substantial portion of state income taxes is included in our net sales and cost of sales. As a result, the impact ofcertain transactions on our operating profit and of other matters presented in these financial statements is disclosed net ofstate income taxes. Our total net state income tax expense was $121 million for 2013, $183 million for 2012, and$149 million for 2011.
71
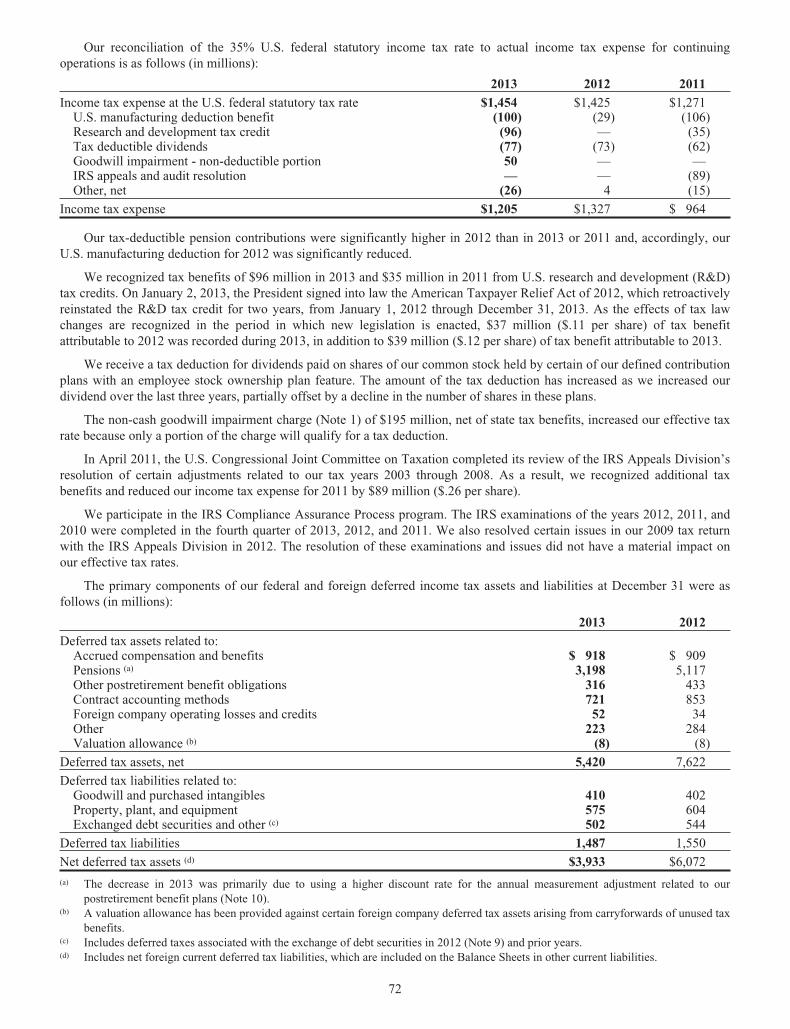
Our reconciliation of the 35% U.S. federal statutory income tax rate to actual income tax expense for continuingoperations is as follows (in millions):
2013 2012 2011
Income tax expense at the U.S. federal statutory tax rate $1,454 $1,425 $1,271U.S. manufacturing deduction benefit (100) (29) (106)Research and development tax credit (96) — (35)Tax deductible dividends (77) (73) (62)Goodwill impairment - non-deductible portion 50 — —IRS appeals and audit resolution — — (89)Other, net (26) 4 (15)
Income tax expense $1,205 $1,327 $ 964
Our tax-deductible pension contributions were significantly higher in 2012 than in 2013 or 2011 and, accordingly, ourU.S. manufacturing deduction for 2012 was significantly reduced.
We recognized tax benefits of $96 million in 2013 and $35 million in 2011 from U.S. research and development (R&D)tax credits. On January 2, 2013, the President signed into law the American Taxpayer Relief Act of 2012, which retroactivelyreinstated the R&D tax credit for two years, from January 1, 2012 through December 31, 2013. As the effects of tax lawchanges are recognized in the period in which new legislation is enacted, $37 million ($.11 per share) of tax benefitattributable to 2012 was recorded during 2013, in addition to $39 million ($.12 per share) of tax benefit attributable to 2013.
We receive a tax deduction for dividends paid on shares of our common stock held by certain of our defined contributionplans with an employee stock ownership plan feature. The amount of the tax deduction has increased as we increased ourdividend over the last three years, partially offset by a decline in the number of shares in these plans.
The non-cash goodwill impairment charge (Note 1) of $195 million, net of state tax benefits, increased our effective taxrate because only a portion of the charge will qualify for a tax deduction.
In April 2011, the U.S. Congressional Joint Committee on Taxation completed its review of the IRS Appeals Division’sresolution of certain adjustments related to our tax years 2003 through 2008. As a result, we recognized additional taxbenefits and reduced our income tax expense for 2011 by $89 million ($.26 per share).
We participate in the IRS Compliance Assurance Process program. The IRS examinations of the years 2012, 2011, and2010 were completed in the fourth quarter of 2013, 2012, and 2011. We also resolved certain issues in our 2009 tax returnwith the IRS Appeals Division in 2012. The resolution of these examinations and issues did not have a material impact onour effective tax rates.
The primary components of our federal and foreign deferred income tax assets and liabilities at December 31 were asfollows (in millions):
2013 2012
Deferred tax assets related to:Accrued compensation and benefits $ 918 $ 909Pensions (a) 3,198 5,117Other postretirement benefit obligations 316 433Contract accounting methods 721 853Foreign company operating losses and credits 52 34Other 223 284Valuation allowance (b) (8) (8)
Deferred tax assets, net 5,420 7,622
Deferred tax liabilities related to:Goodwill and purchased intangibles 410 402Property, plant, and equipment 575 604Exchanged debt securities and other (c) 502 544
Deferred tax liabilities 1,487 1,550
Net deferred tax assets (d) $3,933 $6,072
(a) The decrease in 2013 was primarily due to using a higher discount rate for the annual measurement adjustment related to ourpostretirement benefit plans (Note 10).
(b) A valuation allowance has been provided against certain foreign company deferred tax assets arising from carryforwards of unused taxbenefits.
(c) Includes deferred taxes associated with the exchange of debt securities in 2012 (Note 9) and prior years.(d) Includes net foreign current deferred tax liabilities, which are included on the Balance Sheets in other current liabilities.
72
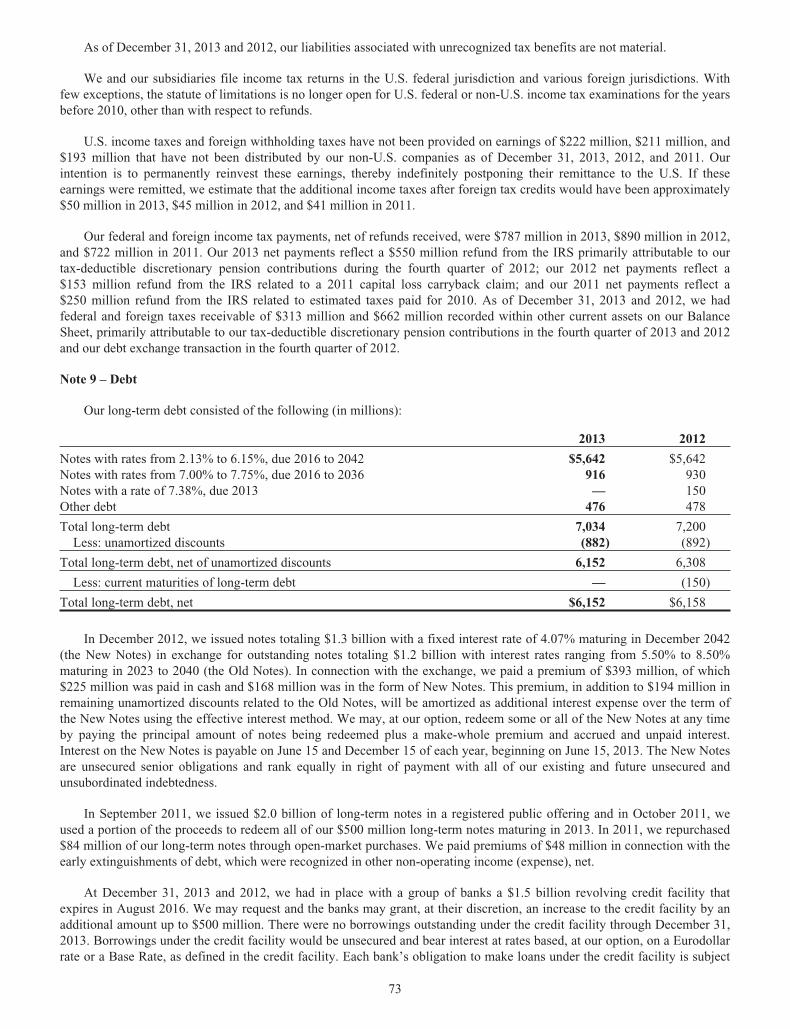
As of December 31, 2013 and 2012, our liabilities associated with unrecognized tax benefits are not material.
We and our subsidiaries file income tax returns in the U.S. federal jurisdiction and various foreign jurisdictions. Withfew exceptions, the statute of limitations is no longer open for U.S. federal or non-U.S. income tax examinations for the yearsbefore 2010, other than with respect to refunds.
U.S. income taxes and foreign withholding taxes have not been provided on earnings of $222 million, $211 million, and$193 million that have not been distributed by our non-U.S. companies as of December 31, 2013, 2012, and 2011. Ourintention is to permanently reinvest these earnings, thereby indefinitely postponing their remittance to the U.S. If theseearnings were remitted, we estimate that the additional income taxes after foreign tax credits would have been approximately$50 million in 2013, $45 million in 2012, and $41 million in 2011.
Our federal and foreign income tax payments, net of refunds received, were $787 million in 2013, $890 million in 2012,and $722 million in 2011. Our 2013 net payments reflect a $550 million refund from the IRS primarily attributable to ourtax-deductible discretionary pension contributions during the fourth quarter of 2012; our 2012 net payments reflect a$153 million refund from the IRS related to a 2011 capital loss carryback claim; and our 2011 net payments reflect a$250 million refund from the IRS related to estimated taxes paid for 2010. As of December 31, 2013 and 2012, we hadfederal and foreign taxes receivable of $313 million and $662 million recorded within other current assets on our BalanceSheet, primarily attributable to our tax-deductible discretionary pension contributions in the fourth quarter of 2013 and 2012and our debt exchange transaction in the fourth quarter of 2012.
Note 9 – Debt
Our long-term debt consisted of the following (in millions):
2013 2012
Notes with rates from 2.13% to 6.15%, due 2016 to 2042 $5,642 $5,642Notes with rates from 7.00% to 7.75%, due 2016 to 2036 916 930Notes with a rate of 7.38%, due 2013 — 150Other debt 476 478
Total long-term debt 7,034 7,200Less: unamortized discounts (882) (892)
Total long-term debt, net of unamortized discounts 6,152 6,308
Less: current maturities of long-term debt — (150)
Total long-term debt, net $6,152 $6,158
In December 2012, we issued notes totaling $1.3 billion with a fixed interest rate of 4.07% maturing in December 2042(the New Notes) in exchange for outstanding notes totaling $1.2 billion with interest rates ranging from 5.50% to 8.50%maturing in 2023 to 2040 (the Old Notes). In connection with the exchange, we paid a premium of $393 million, of which$225 million was paid in cash and $168 million was in the form of New Notes. This premium, in addition to $194 million inremaining unamortized discounts related to the Old Notes, will be amortized as additional interest expense over the term ofthe New Notes using the effective interest method. We may, at our option, redeem some or all of the New Notes at any timeby paying the principal amount of notes being redeemed plus a make-whole premium and accrued and unpaid interest.Interest on the New Notes is payable on June 15 and December 15 of each year, beginning on June 15, 2013. The New Notesare unsecured senior obligations and rank equally in right of payment with all of our existing and future unsecured andunsubordinated indebtedness.
In September 2011, we issued $2.0 billion of long-term notes in a registered public offering and in October 2011, weused a portion of the proceeds to redeem all of our $500 million long-term notes maturing in 2013. In 2011, we repurchased$84 million of our long-term notes through open-market purchases. We paid premiums of $48 million in connection with theearly extinguishments of debt, which were recognized in other non-operating income (expense), net.
At December 31, 2013 and 2012, we had in place with a group of banks a $1.5 billion revolving credit facility thatexpires in August 2016. We may request and the banks may grant, at their discretion, an increase to the credit facility by anadditional amount up to $500 million. There were no borrowings outstanding under the credit facility through December 31,2013. Borrowings under the credit facility would be unsecured and bear interest at rates based, at our option, on a Eurodollarrate or a Base Rate, as defined in the credit facility. Each bank’s obligation to make loans under the credit facility is subject
73
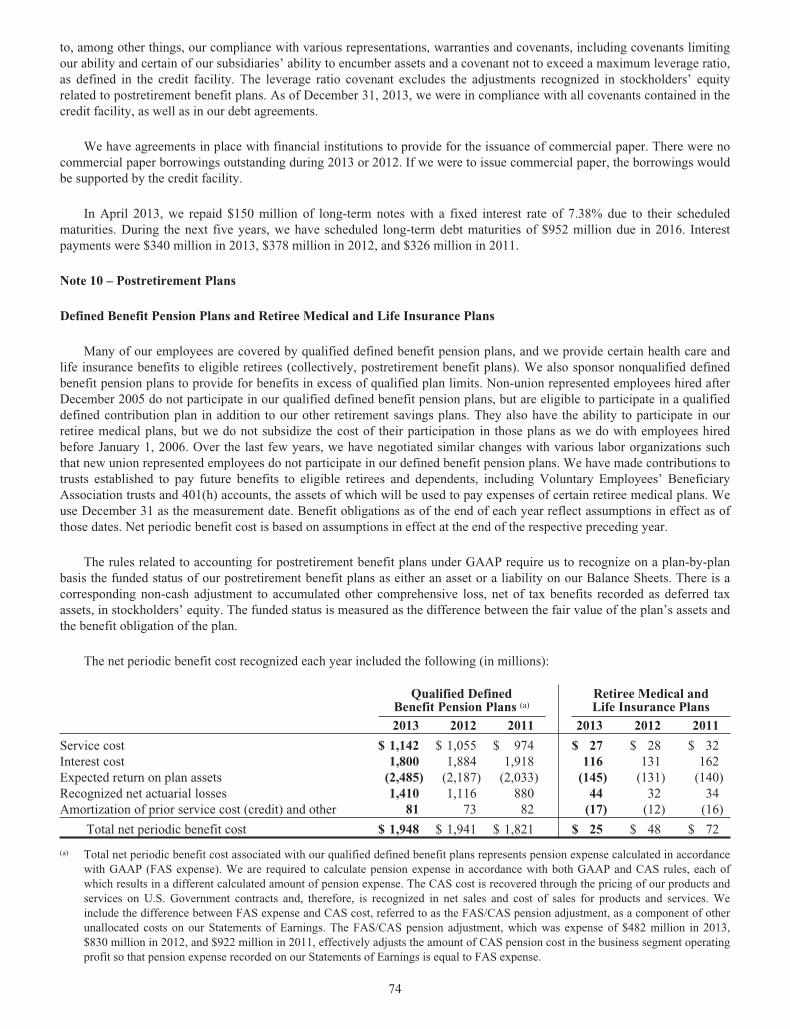
to, among other things, our compliance with various representations, warranties and covenants, including covenants limitingour ability and certain of our subsidiaries’ ability to encumber assets and a covenant not to exceed a maximum leverage ratio,as defined in the credit facility. The leverage ratio covenant excludes the adjustments recognized in stockholders’ equityrelated to postretirement benefit plans. As of December 31, 2013, we were in compliance with all covenants contained in thecredit facility, as well as in our debt agreements.
We have agreements in place with financial institutions to provide for the issuance of commercial paper. There were nocommercial paper borrowings outstanding during 2013 or 2012. If we were to issue commercial paper, the borrowings wouldbe supported by the credit facility.
In April 2013, we repaid $150 million of long-term notes with a fixed interest rate of 7.38% due to their scheduledmaturities. During the next five years, we have scheduled long-term debt maturities of $952 million due in 2016. Interestpayments were $340 million in 2013, $378 million in 2012, and $326 million in 2011.
Note 10 – Postretirement Plans
Defined Benefit Pension Plans and Retiree Medical and Life Insurance Plans
Many of our employees are covered by qualified defined benefit pension plans, and we provide certain health care andlife insurance benefits to eligible retirees (collectively, postretirement benefit plans). We also sponsor nonqualified definedbenefit pension plans to provide for benefits in excess of qualified plan limits. Non-union represented employees hired afterDecember 2005 do not participate in our qualified defined benefit pension plans, but are eligible to participate in a qualifieddefined contribution plan in addition to our other retirement savings plans. They also have the ability to participate in ourretiree medical plans, but we do not subsidize the cost of their participation in those plans as we do with employees hiredbefore January 1, 2006. Over the last few years, we have negotiated similar changes with various labor organizations suchthat new union represented employees do not participate in our defined benefit pension plans. We have made contributions totrusts established to pay future benefits to eligible retirees and dependents, including Voluntary Employees’ BeneficiaryAssociation trusts and 401(h) accounts, the assets of which will be used to pay expenses of certain retiree medical plans. Weuse December 31 as the measurement date. Benefit obligations as of the end of each year reflect assumptions in effect as ofthose dates. Net periodic benefit cost is based on assumptions in effect at the end of the respective preceding year.
The rules related to accounting for postretirement benefit plans under GAAP require us to recognize on a plan-by-planbasis the funded status of our postretirement benefit plans as either an asset or a liability on our Balance Sheets. There is acorresponding non-cash adjustment to accumulated other comprehensive loss, net of tax benefits recorded as deferred taxassets, in stockholders’ equity. The funded status is measured as the difference between the fair value of the plan’s assets andthe benefit obligation of the plan.
The net periodic benefit cost recognized each year included the following (in millions):
Qualified DefinedBenefit Pension Plans (a)
Retiree Medical andLife Insurance Plans
2013 2012 2011 2013 2012 2011
Service cost $ 1,142 $ 1,055 $ 974 $ 27 $ 28 $ 32Interest cost 1,800 1,884 1,918 116 131 162Expected return on plan assets (2,485) (2,187) (2,033) (145) (131) (140)Recognized net actuarial losses 1,410 1,116 880 44 32 34Amortization of prior service cost (credit) and other 81 73 82 (17) (12) (16)
Total net periodic benefit cost $ 1,948 $ 1,941 $ 1,821 $ 25 $ 48 $ 72
(a) Total net periodic benefit cost associated with our qualified defined benefit plans represents pension expense calculated in accordancewith GAAP (FAS expense). We are required to calculate pension expense in accordance with both GAAP and CAS rules, each ofwhich results in a different calculated amount of pension expense. The CAS cost is recovered through the pricing of our products andservices on U.S. Government contracts and, therefore, is recognized in net sales and cost of sales for products and services. Weinclude the difference between FAS expense and CAS cost, referred to as the FAS/CAS pension adjustment, as a component of otherunallocated costs on our Statements of Earnings. The FAS/CAS pension adjustment, which was expense of $482 million in 2013,$830 million in 2012, and $922 million in 2011, effectively adjusts the amount of CAS pension cost in the business segment operatingprofit so that pension expense recorded on our Statements of Earnings is equal to FAS expense.
74
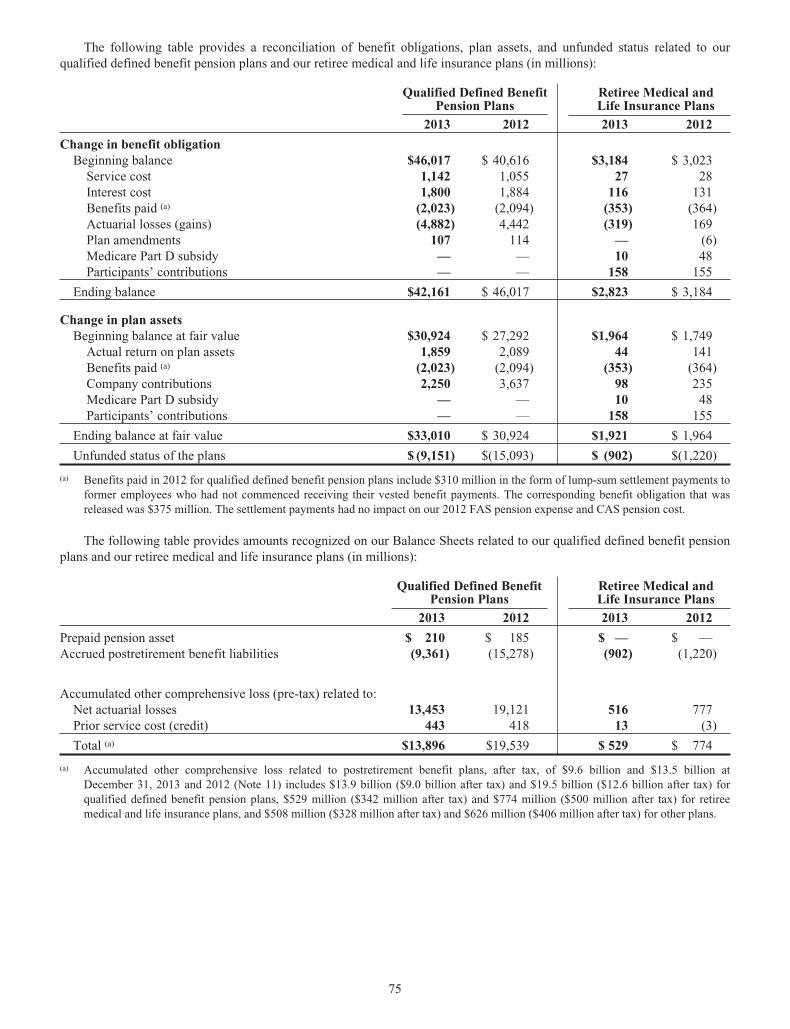
The following table provides a reconciliation of benefit obligations, plan assets, and unfunded status related to ourqualified defined benefit pension plans and our retiree medical and life insurance plans (in millions):
Qualified Defined BenefitPension Plans
Retiree Medical andLife Insurance Plans
2013 2012 2013 2012
Change in benefit obligationBeginning balance $46,017 $ 40,616 $3,184 $ 3,023
Service cost 1,142 1,055 27 28Interest cost 1,800 1,884 116 131Benefits paid (a) (2,023) (2,094) (353) (364)Actuarial losses (gains) (4,882) 4,442 (319) 169Plan amendments 107 114 — (6)Medicare Part D subsidy — — 10 48Participants’ contributions — — 158 155
Ending balance $42,161 $ 46,017 $2,823 $ 3,184
Change in plan assetsBeginning balance at fair value $30,924 $ 27,292 $1,964 $ 1,749
Actual return on plan assets 1,859 2,089 44 141Benefits paid (a) (2,023) (2,094) (353) (364)Company contributions 2,250 3,637 98 235Medicare Part D subsidy — — 10 48Participants’ contributions — — 158 155
Ending balance at fair value $33,010 $ 30,924 $1,921 $ 1,964
Unfunded status of the plans $ (9,151) $(15,093) $ (902) $(1,220)
(a) Benefits paid in 2012 for qualified defined benefit pension plans include $310 million in the form of lump-sum settlement payments toformer employees who had not commenced receiving their vested benefit payments. The corresponding benefit obligation that wasreleased was $375 million. The settlement payments had no impact on our 2012 FAS pension expense and CAS pension cost.
The following table provides amounts recognized on our Balance Sheets related to our qualified defined benefit pensionplans and our retiree medical and life insurance plans (in millions):
Qualified Defined BenefitPension Plans
Retiree Medical andLife Insurance Plans
2013 2012 2013 2012
Prepaid pension asset $ 210 $ 185 $ — $ —Accrued postretirement benefit liabilities (9,361) (15,278) (902) (1,220)
Accumulated other comprehensive loss (pre-tax) related to:Net actuarial losses 13,453 19,121 516 777Prior service cost (credit) 443 418 13 (3)
Total (a) $13,896 $19,539 $ 529 $ 774
(a) Accumulated other comprehensive loss related to postretirement benefit plans, after tax, of $9.6 billion and $13.5 billion atDecember 31, 2013 and 2012 (Note 11) includes $13.9 billion ($9.0 billion after tax) and $19.5 billion ($12.6 billion after tax) forqualified defined benefit pension plans, $529 million ($342 million after tax) and $774 million ($500 million after tax) for retireemedical and life insurance plans, and $508 million ($328 million after tax) and $626 million ($406 million after tax) for other plans.
75
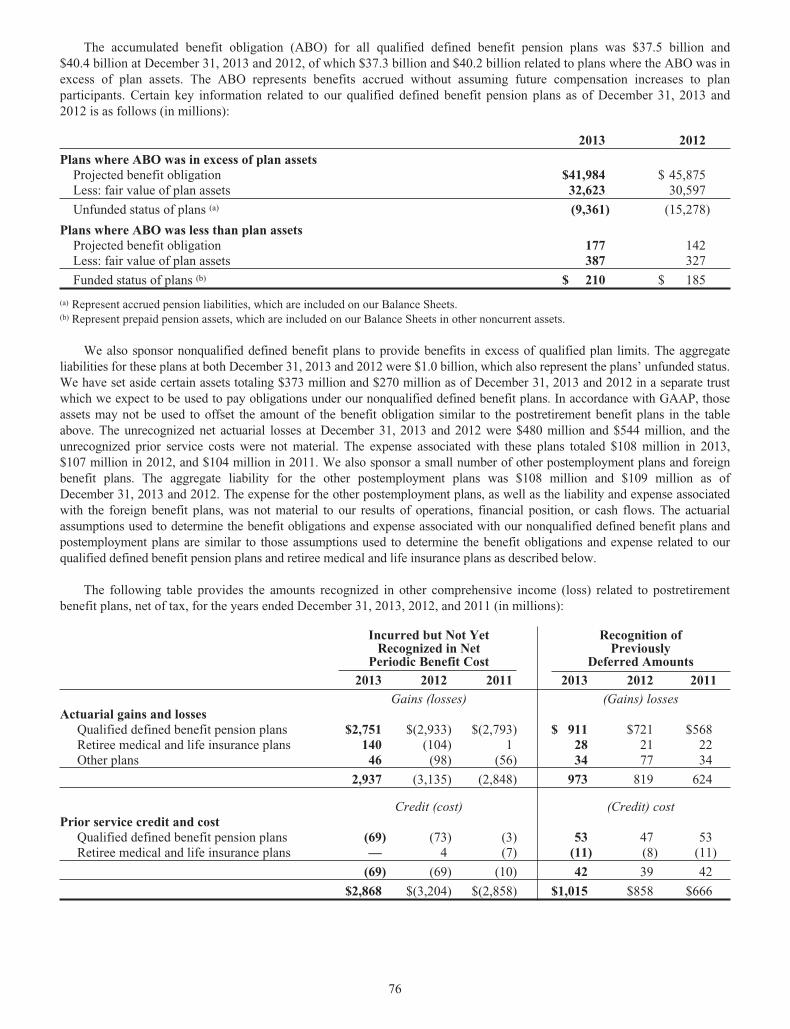
The accumulated benefit obligation (ABO) for all qualified defined benefit pension plans was $37.5 billion and$40.4 billion at December 31, 2013 and 2012, of which $37.3 billion and $40.2 billion related to plans where the ABO was inexcess of plan assets. The ABO represents benefits accrued without assuming future compensation increases to planparticipants. Certain key information related to our qualified defined benefit pension plans as of December 31, 2013 and2012 is as follows (in millions):
2013 2012
Plans where ABO was in excess of plan assetsProjected benefit obligation $41,984 $ 45,875Less: fair value of plan assets 32,623 30,597
Unfunded status of plans (a) (9,361) (15,278)
Plans where ABO was less than plan assetsProjected benefit obligation 177 142Less: fair value of plan assets 387 327
Funded status of plans (b) $ 210 $ 185
(a) Represent accrued pension liabilities, which are included on our Balance Sheets.(b) Represent prepaid pension assets, which are included on our Balance Sheets in other noncurrent assets.
We also sponsor nonqualified defined benefit plans to provide benefits in excess of qualified plan limits. The aggregateliabilities for these plans at both December 31, 2013 and 2012 were $1.0 billion, which also represent the plans’ unfunded status.We have set aside certain assets totaling $373 million and $270 million as of December 31, 2013 and 2012 in a separate trustwhich we expect to be used to pay obligations under our nonqualified defined benefit plans. In accordance with GAAP, thoseassets may not be used to offset the amount of the benefit obligation similar to the postretirement benefit plans in the tableabove. The unrecognized net actuarial losses at December 31, 2013 and 2012 were $480 million and $544 million, and theunrecognized prior service costs were not material. The expense associated with these plans totaled $108 million in 2013,$107 million in 2012, and $104 million in 2011. We also sponsor a small number of other postemployment plans and foreignbenefit plans. The aggregate liability for the other postemployment plans was $108 million and $109 million as ofDecember 31, 2013 and 2012. The expense for the other postemployment plans, as well as the liability and expense associatedwith the foreign benefit plans, was not material to our results of operations, financial position, or cash flows. The actuarialassumptions used to determine the benefit obligations and expense associated with our nonqualified defined benefit plans andpostemployment plans are similar to those assumptions used to determine the benefit obligations and expense related to ourqualified defined benefit pension plans and retiree medical and life insurance plans as described below.
The following table provides the amounts recognized in other comprehensive income (loss) related to postretirementbenefit plans, net of tax, for the years ended December 31, 2013, 2012, and 2011 (in millions):
Incurred but Not YetRecognized in Net
Periodic Benefit Cost
Recognition ofPreviously
Deferred Amounts
2013 2012 2011 2013 2012 2011
Gains (losses) (Gains) lossesActuarial gains and losses
Qualified defined benefit pension plans $2,751 $(2,933) $(2,793) $ 911 $721 $568Retiree medical and life insurance plans 140 (104) 1 28 21 22Other plans 46 (98) (56) 34 77 34
2,937 (3,135) (2,848) 973 819 624
Credit (cost) (Credit) costPrior service credit and cost
Qualified defined benefit pension plans (69) (73) (3) 53 47 53Retiree medical and life insurance plans — 4 (7) (11) (8) (11)
(69) (69) (10) 42 39 42
$2,868 $(3,204) $(2,858) $1,015 $858 $666
76
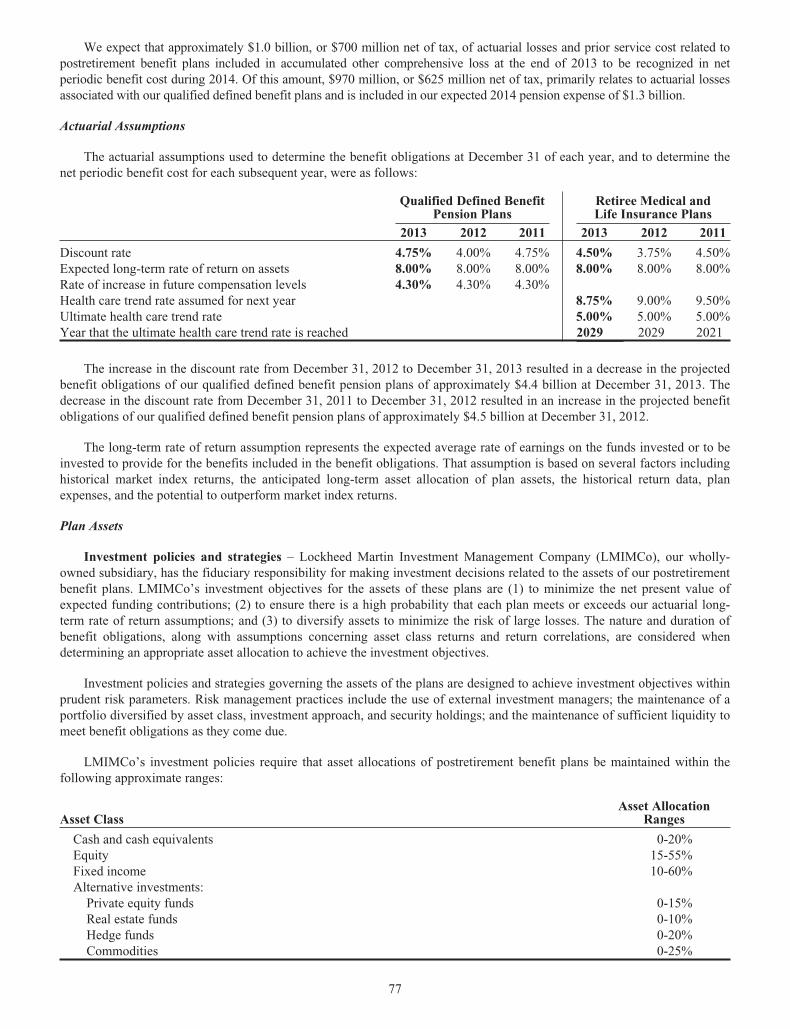
We expect that approximately $1.0 billion, or $700 million net of tax, of actuarial losses and prior service cost related topostretirement benefit plans included in accumulated other comprehensive loss at the end of 2013 to be recognized in netperiodic benefit cost during 2014. Of this amount, $970 million, or $625 million net of tax, primarily relates to actuarial lossesassociated with our qualified defined benefit plans and is included in our expected 2014 pension expense of $1.3 billion.
Actuarial Assumptions
The actuarial assumptions used to determine the benefit obligations at December 31 of each year, and to determine thenet periodic benefit cost for each subsequent year, were as follows:
Qualified Defined BenefitPension Plans
Retiree Medical andLife Insurance Plans
2013 2012 2011 2013 2012 2011
Discount rate 4.75% 4.00% 4.75% 4.50% 3.75% 4.50%Expected long-term rate of return on assets 8.00% 8.00% 8.00% 8.00% 8.00% 8.00%Rate of increase in future compensation levels 4.30% 4.30% 4.30%Health care trend rate assumed for next year 8.75% 9.00% 9.50%Ultimate health care trend rate 5.00% 5.00% 5.00%Year that the ultimate health care trend rate is reached 2029 2029 2021
The increase in the discount rate from December 31, 2012 to December 31, 2013 resulted in a decrease in the projectedbenefit obligations of our qualified defined benefit pension plans of approximately $4.4 billion at December 31, 2013. Thedecrease in the discount rate from December 31, 2011 to December 31, 2012 resulted in an increase in the projected benefitobligations of our qualified defined benefit pension plans of approximately $4.5 billion at December 31, 2012.
The long-term rate of return assumption represents the expected average rate of earnings on the funds invested or to beinvested to provide for the benefits included in the benefit obligations. That assumption is based on several factors includinghistorical market index returns, the anticipated long-term asset allocation of plan assets, the historical return data, planexpenses, and the potential to outperform market index returns.
Plan Assets
Investment policies and strategies – Lockheed Martin Investment Management Company (LMIMCo), our wholly-owned subsidiary, has the fiduciary responsibility for making investment decisions related to the assets of our postretirementbenefit plans. LMIMCo’s investment objectives for the assets of these plans are (1) to minimize the net present value ofexpected funding contributions; (2) to ensure there is a high probability that each plan meets or exceeds our actuarial long-term rate of return assumptions; and (3) to diversify assets to minimize the risk of large losses. The nature and duration ofbenefit obligations, along with assumptions concerning asset class returns and return correlations, are considered whendetermining an appropriate asset allocation to achieve the investment objectives.
Investment policies and strategies governing the assets of the plans are designed to achieve investment objectives withinprudent risk parameters. Risk management practices include the use of external investment managers; the maintenance of aportfolio diversified by asset class, investment approach, and security holdings; and the maintenance of sufficient liquidity tomeet benefit obligations as they come due.
LMIMCo’s investment policies require that asset allocations of postretirement benefit plans be maintained within thefollowing approximate ranges:
Asset ClassAsset Allocation
Ranges
Cash and cash equivalents 0-20%Equity 15-55%Fixed income 10-60%Alternative investments:
Private equity funds 0-15%Real estate funds 0-10%Hedge funds 0-20%Commodities 0-25%
77
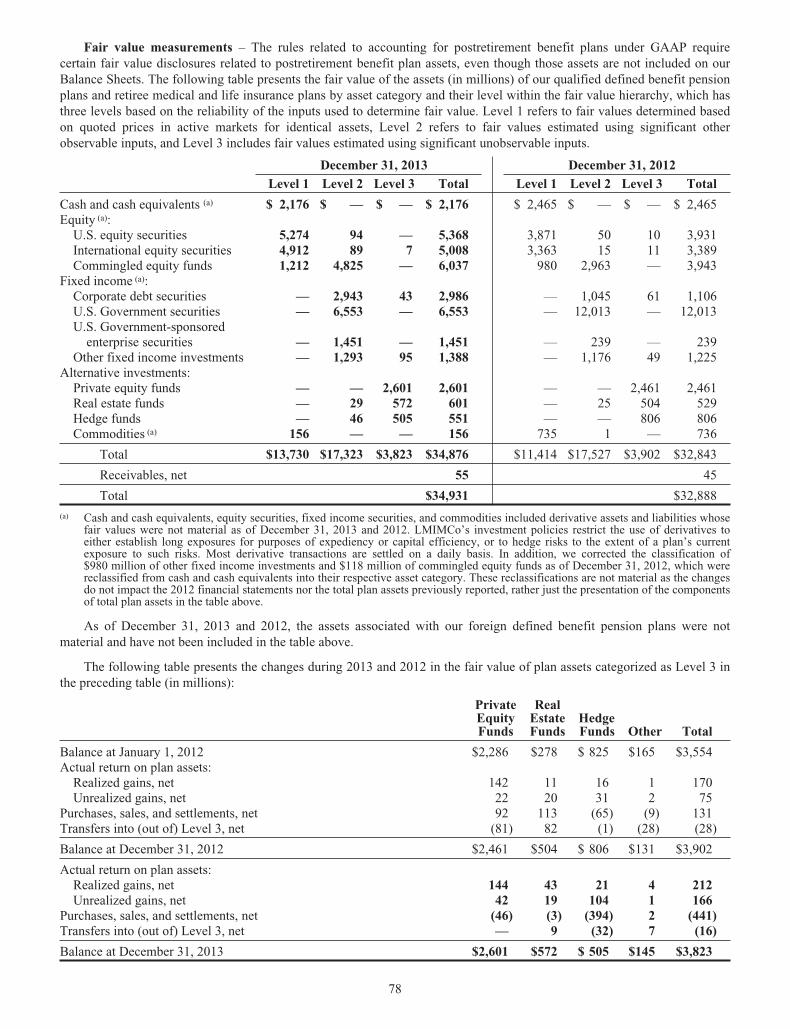
Fair value measurements – The rules related to accounting for postretirement benefit plans under GAAP requirecertain fair value disclosures related to postretirement benefit plan assets, even though those assets are not included on ourBalance Sheets. The following table presents the fair value of the assets (in millions) of our qualified defined benefit pensionplans and retiree medical and life insurance plans by asset category and their level within the fair value hierarchy, which hasthree levels based on the reliability of the inputs used to determine fair value. Level 1 refers to fair values determined basedon quoted prices in active markets for identical assets, Level 2 refers to fair values estimated using significant otherobservable inputs, and Level 3 includes fair values estimated using significant unobservable inputs.
December 31, 2013 December 31, 2012
Level 1 Level 2 Level 3 Total Level 1 Level 2 Level 3 Total
Cash and cash equivalents (a) $ 2,176 $ — $ — $ 2,176 $ 2,465 $ — $ — $ 2,465Equity (a):
U.S. equity securities 5,274 94 — 5,368 3,871 50 10 3,931International equity securities 4,912 89 7 5,008 3,363 15 11 3,389Commingled equity funds 1,212 4,825 — 6,037 980 2,963 — 3,943
Fixed income (a):Corporate debt securities — 2,943 43 2,986 — 1,045 61 1,106U.S. Government securities — 6,553 — 6,553 — 12,013 — 12,013U.S. Government-sponsored
enterprise securities — 1,451 — 1,451 — 239 — 239Other fixed income investments — 1,293 95 1,388 — 1,176 49 1,225
Alternative investments:Private equity funds — — 2,601 2,601 — — 2,461 2,461Real estate funds — 29 572 601 — 25 504 529Hedge funds — 46 505 551 — — 806 806Commodities (a) 156 — — 156 735 1 — 736
Total $13,730 $17,323 $3,823 $34,876 $11,414 $17,527 $3,902 $32,843
Receivables, net 55 45
Total $34,931 $32,888
(a) Cash and cash equivalents, equity securities, fixed income securities, and commodities included derivative assets and liabilities whosefair values were not material as of December 31, 2013 and 2012. LMIMCo’s investment policies restrict the use of derivatives toeither establish long exposures for purposes of expediency or capital efficiency, or to hedge risks to the extent of a plan’s currentexposure to such risks. Most derivative transactions are settled on a daily basis. In addition, we corrected the classification of$980 million of other fixed income investments and $118 million of commingled equity funds as of December 31, 2012, which werereclassified from cash and cash equivalents into their respective asset category. These reclassifications are not material as the changesdo not impact the 2012 financial statements nor the total plan assets previously reported, rather just the presentation of the componentsof total plan assets in the table above.
As of December 31, 2013 and 2012, the assets associated with our foreign defined benefit pension plans were notmaterial and have not been included in the table above.
The following table presents the changes during 2013 and 2012 in the fair value of plan assets categorized as Level 3 inthe preceding table (in millions):
PrivateEquityFunds
RealEstateFunds
HedgeFunds Other Total
Balance at January 1, 2012 $2,286 $278 $ 825 $165 $3,554Actual return on plan assets:
Realized gains, net 142 11 16 1 170Unrealized gains, net 22 20 31 2 75
Purchases, sales, and settlements, net 92 113 (65) (9) 131Transfers into (out of) Level 3, net (81) 82 (1) (28) (28)
Balance at December 31, 2012 $2,461 $504 $ 806 $131 $3,902
Actual return on plan assets:Realized gains, net 144 43 21 4 212Unrealized gains, net 42 19 104 1 166
Purchases, sales, and settlements, net (46) (3) (394) 2 (441)Transfers into (out of) Level 3, net — 9 (32) 7 (16)
Balance at December 31, 2013 $2,601 $572 $ 505 $145 $3,823
78
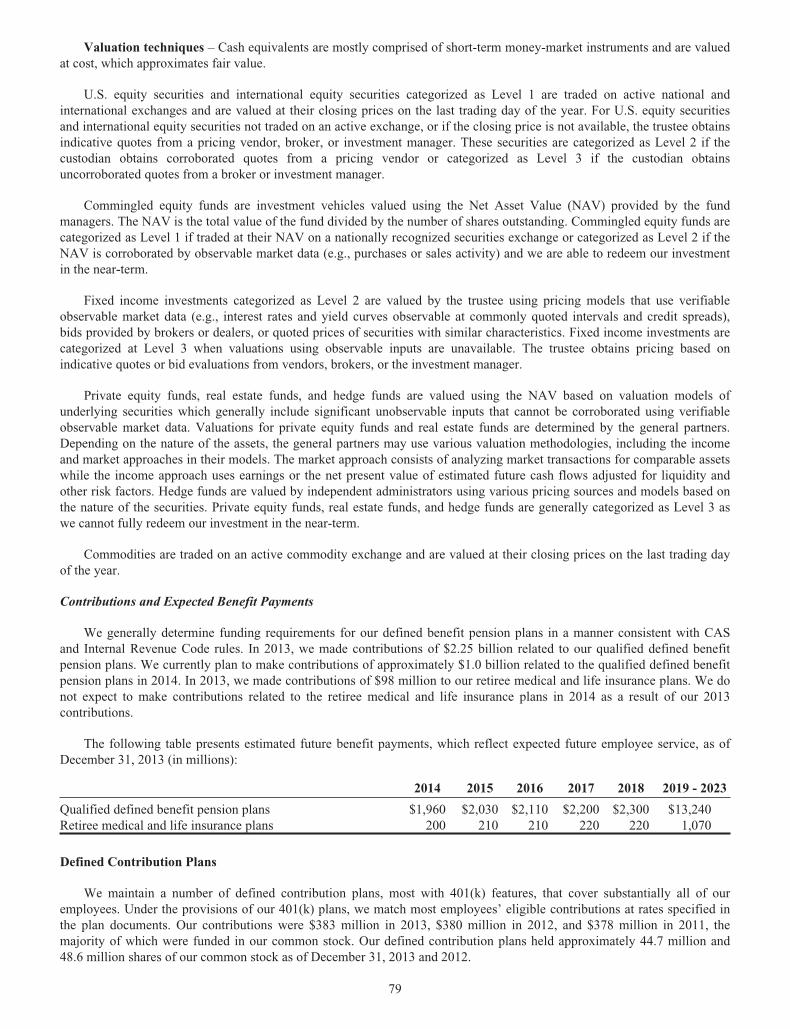
Valuation techniques – Cash equivalents are mostly comprised of short-term money-market instruments and are valuedat cost, which approximates fair value.
U.S. equity securities and international equity securities categorized as Level 1 are traded on active national andinternational exchanges and are valued at their closing prices on the last trading day of the year. For U.S. equity securitiesand international equity securities not traded on an active exchange, or if the closing price is not available, the trustee obtainsindicative quotes from a pricing vendor, broker, or investment manager. These securities are categorized as Level 2 if thecustodian obtains corroborated quotes from a pricing vendor or categorized as Level 3 if the custodian obtainsuncorroborated quotes from a broker or investment manager.
Commingled equity funds are investment vehicles valued using the Net Asset Value (NAV) provided by the fundmanagers. The NAV is the total value of the fund divided by the number of shares outstanding. Commingled equity funds arecategorized as Level 1 if traded at their NAV on a nationally recognized securities exchange or categorized as Level 2 if theNAV is corroborated by observable market data (e.g., purchases or sales activity) and we are able to redeem our investmentin the near-term.
Fixed income investments categorized as Level 2 are valued by the trustee using pricing models that use verifiableobservable market data (e.g., interest rates and yield curves observable at commonly quoted intervals and credit spreads),bids provided by brokers or dealers, or quoted prices of securities with similar characteristics. Fixed income investments arecategorized at Level 3 when valuations using observable inputs are unavailable. The trustee obtains pricing based onindicative quotes or bid evaluations from vendors, brokers, or the investment manager.
Private equity funds, real estate funds, and hedge funds are valued using the NAV based on valuation models ofunderlying securities which generally include significant unobservable inputs that cannot be corroborated using verifiableobservable market data. Valuations for private equity funds and real estate funds are determined by the general partners.Depending on the nature of the assets, the general partners may use various valuation methodologies, including the incomeand market approaches in their models. The market approach consists of analyzing market transactions for comparable assetswhile the income approach uses earnings or the net present value of estimated future cash flows adjusted for liquidity andother risk factors. Hedge funds are valued by independent administrators using various pricing sources and models based onthe nature of the securities. Private equity funds, real estate funds, and hedge funds are generally categorized as Level 3 aswe cannot fully redeem our investment in the near-term.
Commodities are traded on an active commodity exchange and are valued at their closing prices on the last trading dayof the year.
Contributions and Expected Benefit Payments
We generally determine funding requirements for our defined benefit pension plans in a manner consistent with CASand Internal Revenue Code rules. In 2013, we made contributions of $2.25 billion related to our qualified defined benefitpension plans. We currently plan to make contributions of approximately $1.0 billion related to the qualified defined benefitpension plans in 2014. In 2013, we made contributions of $98 million to our retiree medical and life insurance plans. We donot expect to make contributions related to the retiree medical and life insurance plans in 2014 as a result of our 2013contributions.
The following table presents estimated future benefit payments, which reflect expected future employee service, as ofDecember 31, 2013 (in millions):
2014 2015 2016 2017 2018 2019 - 2023
Qualified defined benefit pension plans $1,960 $2,030 $2,110 $2,200 $2,300 $13,240Retiree medical and life insurance plans 200 210 210 220 220 1,070
Defined Contribution Plans
We maintain a number of defined contribution plans, most with 401(k) features, that cover substantially all of ouremployees. Under the provisions of our 401(k) plans, we match most employees’ eligible contributions at rates specified inthe plan documents. Our contributions were $383 million in 2013, $380 million in 2012, and $378 million in 2011, themajority of which were funded in our common stock. Our defined contribution plans held approximately 44.7 million and48.6 million shares of our common stock as of December 31, 2013 and 2012.
79
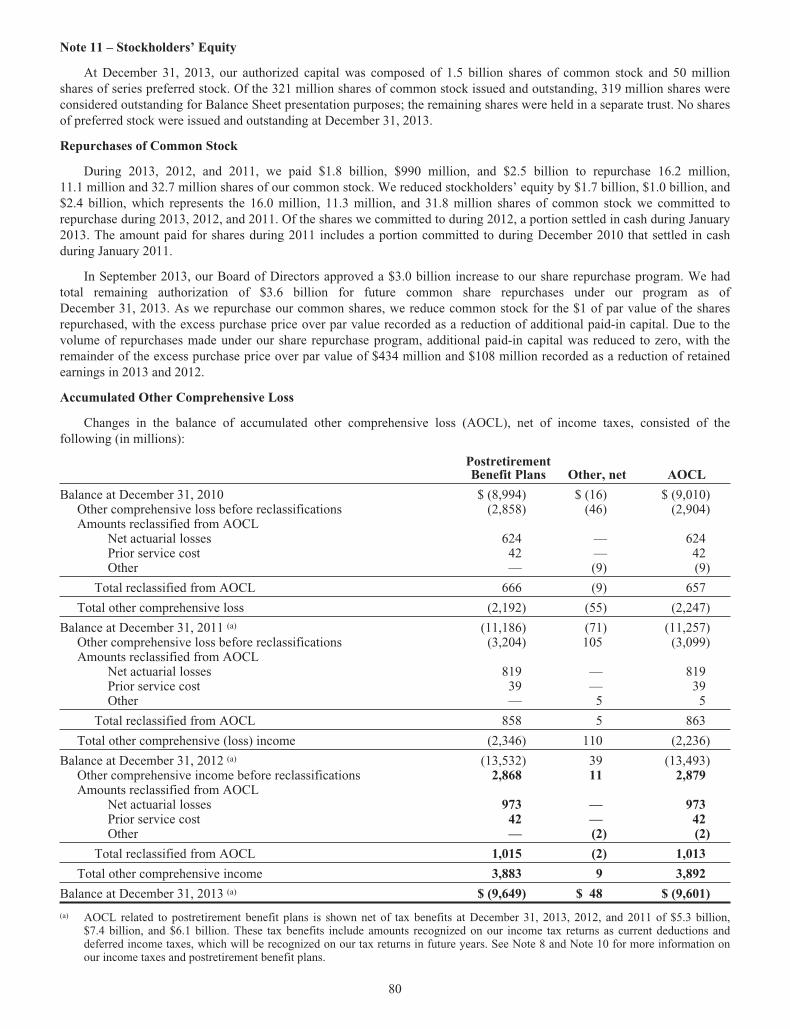
Note 11 – Stockholders’ Equity
At December 31, 2013, our authorized capital was composed of 1.5 billion shares of common stock and 50 millionshares of series preferred stock. Of the 321 million shares of common stock issued and outstanding, 319 million shares wereconsidered outstanding for Balance Sheet presentation purposes; the remaining shares were held in a separate trust. No sharesof preferred stock were issued and outstanding at December 31, 2013.
Repurchases of Common Stock
During 2013, 2012, and 2011, we paid $1.8 billion, $990 million, and $2.5 billion to repurchase 16.2 million,11.1 million and 32.7 million shares of our common stock. We reduced stockholders’ equity by $1.7 billion, $1.0 billion, and$2.4 billion, which represents the 16.0 million, 11.3 million, and 31.8 million shares of common stock we committed torepurchase during 2013, 2012, and 2011. Of the shares we committed to during 2012, a portion settled in cash during January2013. The amount paid for shares during 2011 includes a portion committed to during December 2010 that settled in cashduring January 2011.
In September 2013, our Board of Directors approved a $3.0 billion increase to our share repurchase program. We hadtotal remaining authorization of $3.6 billion for future common share repurchases under our program as ofDecember 31, 2013. As we repurchase our common shares, we reduce common stock for the $1 of par value of the sharesrepurchased, with the excess purchase price over par value recorded as a reduction of additional paid-in capital. Due to thevolume of repurchases made under our share repurchase program, additional paid-in capital was reduced to zero, with theremainder of the excess purchase price over par value of $434 million and $108 million recorded as a reduction of retainedearnings in 2013 and 2012.
Accumulated Other Comprehensive Loss
Changes in the balance of accumulated other comprehensive loss (AOCL), net of income taxes, consisted of thefollowing (in millions):
PostretirementBenefit Plans Other, net AOCL
Balance at December 31, 2010 $ (8,994) $ (16) $ (9,010)Other comprehensive loss before reclassifications (2,858) (46) (2,904)Amounts reclassified from AOCL
Net actuarial losses 624 — 624Prior service cost 42 — 42Other — (9) (9)
Total reclassified from AOCL 666 (9) 657
Total other comprehensive loss (2,192) (55) (2,247)
Balance at December 31, 2011 (a) (11,186) (71) (11,257)Other comprehensive loss before reclassifications (3,204) 105 (3,099)Amounts reclassified from AOCL
Net actuarial losses 819 — 819Prior service cost 39 — 39Other — 5 5
Total reclassified from AOCL 858 5 863
Total other comprehensive (loss) income (2,346) 110 (2,236)
Balance at December 31, 2012 (a) (13,532) 39 (13,493)Other comprehensive income before reclassifications 2,868 11 2,879Amounts reclassified from AOCL
Net actuarial losses 973 — 973Prior service cost 42 — 42Other — (2) (2)
Total reclassified from AOCL 1,015 (2) 1,013
Total other comprehensive income 3,883 9 3,892
Balance at December 31, 2013 (a) $ (9,649) $ 48 $ (9,601)
(a) AOCL related to postretirement benefit plans is shown net of tax benefits at December 31, 2013, 2012, and 2011 of $5.3 billion,$7.4 billion, and $6.1 billion. These tax benefits include amounts recognized on our income tax returns as current deductions anddeferred income taxes, which will be recognized on our tax returns in future years. See Note 8 and Note 10 for more information onour income taxes and postretirement benefit plans.
80
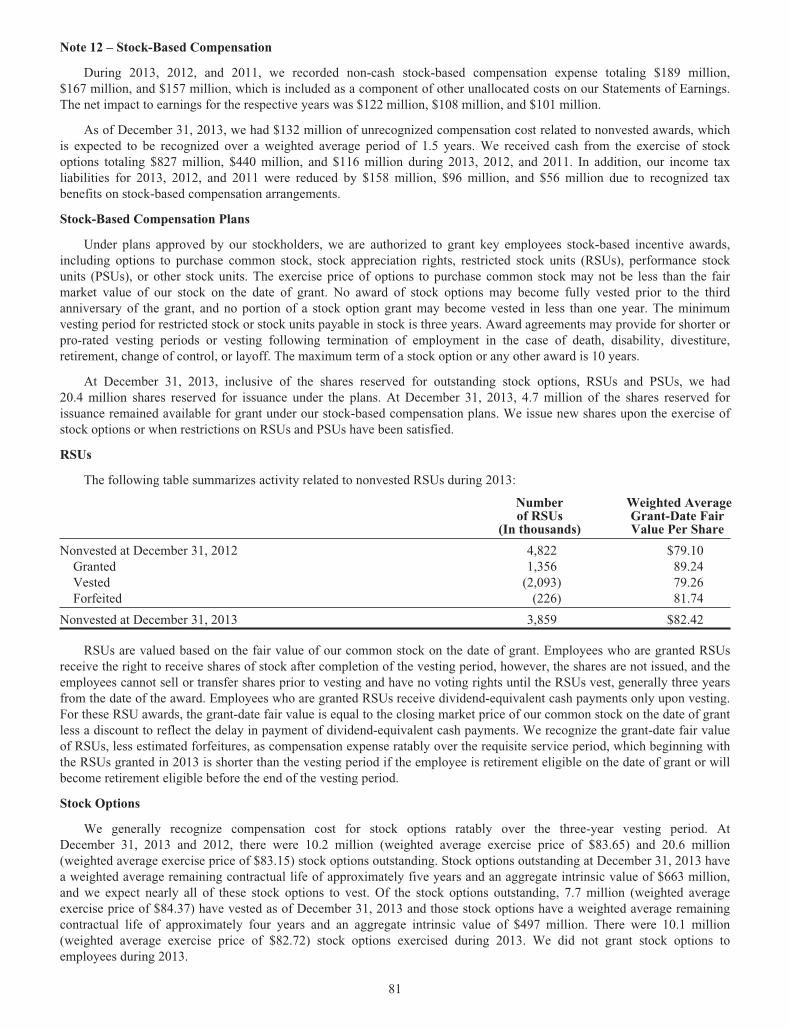
Note 12 – Stock-Based Compensation
During 2013, 2012, and 2011, we recorded non-cash stock-based compensation expense totaling $189 million,$167 million, and $157 million, which is included as a component of other unallocated costs on our Statements of Earnings.The net impact to earnings for the respective years was $122 million, $108 million, and $101 million.
As of December 31, 2013, we had $132 million of unrecognized compensation cost related to nonvested awards, whichis expected to be recognized over a weighted average period of 1.5 years. We received cash from the exercise of stockoptions totaling $827 million, $440 million, and $116 million during 2013, 2012, and 2011. In addition, our income taxliabilities for 2013, 2012, and 2011 were reduced by $158 million, $96 million, and $56 million due to recognized taxbenefits on stock-based compensation arrangements.
Stock-Based Compensation Plans
Under plans approved by our stockholders, we are authorized to grant key employees stock-based incentive awards,including options to purchase common stock, stock appreciation rights, restricted stock units (RSUs), performance stockunits (PSUs), or other stock units. The exercise price of options to purchase common stock may not be less than the fairmarket value of our stock on the date of grant. No award of stock options may become fully vested prior to the thirdanniversary of the grant, and no portion of a stock option grant may become vested in less than one year. The minimumvesting period for restricted stock or stock units payable in stock is three years. Award agreements may provide for shorter orpro-rated vesting periods or vesting following termination of employment in the case of death, disability, divestiture,retirement, change of control, or layoff. The maximum term of a stock option or any other award is 10 years.
At December 31, 2013, inclusive of the shares reserved for outstanding stock options, RSUs and PSUs, we had20.4 million shares reserved for issuance under the plans. At December 31, 2013, 4.7 million of the shares reserved forissuance remained available for grant under our stock-based compensation plans. We issue new shares upon the exercise ofstock options or when restrictions on RSUs and PSUs have been satisfied.
RSUs
The following table summarizes activity related to nonvested RSUs during 2013:
Numberof RSUs
(In thousands)
Weighted AverageGrant-Date FairValue Per Share
Nonvested at December 31, 2012 4,822 $79.10Granted 1,356 89.24Vested (2,093) 79.26Forfeited (226) 81.74
Nonvested at December 31, 2013 3,859 $82.42
RSUs are valued based on the fair value of our common stock on the date of grant. Employees who are granted RSUsreceive the right to receive shares of stock after completion of the vesting period, however, the shares are not issued, and theemployees cannot sell or transfer shares prior to vesting and have no voting rights until the RSUs vest, generally three yearsfrom the date of the award. Employees who are granted RSUs receive dividend-equivalent cash payments only upon vesting.For these RSU awards, the grant-date fair value is equal to the closing market price of our common stock on the date of grantless a discount to reflect the delay in payment of dividend-equivalent cash payments. We recognize the grant-date fair valueof RSUs, less estimated forfeitures, as compensation expense ratably over the requisite service period, which beginning withthe RSUs granted in 2013 is shorter than the vesting period if the employee is retirement eligible on the date of grant or willbecome retirement eligible before the end of the vesting period.
Stock Options
We generally recognize compensation cost for stock options ratably over the three-year vesting period. AtDecember 31, 2013 and 2012, there were 10.2 million (weighted average exercise price of $83.65) and 20.6 million(weighted average exercise price of $83.15) stock options outstanding. Stock options outstanding at December 31, 2013 havea weighted average remaining contractual life of approximately five years and an aggregate intrinsic value of $663 million,and we expect nearly all of these stock options to vest. Of the stock options outstanding, 7.7 million (weighted averageexercise price of $84.37) have vested as of December 31, 2013 and those stock options have a weighted average remainingcontractual life of approximately four years and an aggregate intrinsic value of $497 million. There were 10.1 million(weighted average exercise price of $82.72) stock options exercised during 2013. We did not grant stock options toemployees during 2013.
81
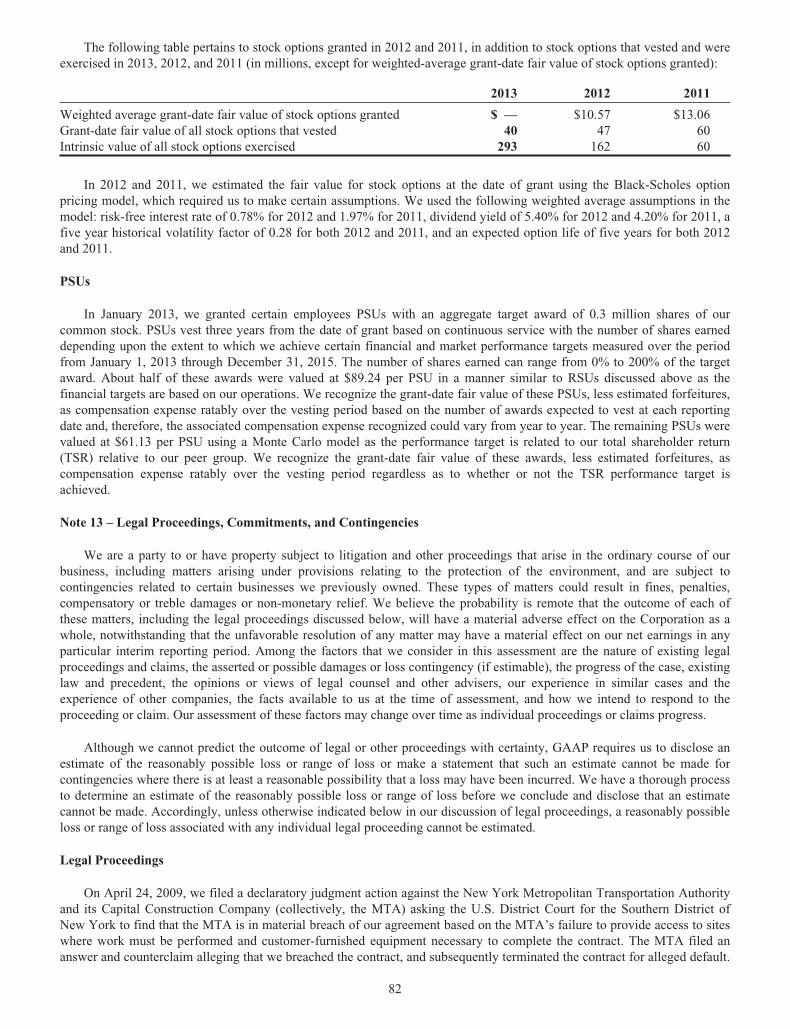
The following table pertains to stock options granted in 2012 and 2011, in addition to stock options that vested and wereexercised in 2013, 2012, and 2011 (in millions, except for weighted-average grant-date fair value of stock options granted):
2013 2012 2011
Weighted average grant-date fair value of stock options granted $ — $10.57 $13.06Grant-date fair value of all stock options that vested 40 47 60Intrinsic value of all stock options exercised 293 162 60
In 2012 and 2011, we estimated the fair value for stock options at the date of grant using the Black-Scholes optionpricing model, which required us to make certain assumptions. We used the following weighted average assumptions in themodel: risk-free interest rate of 0.78% for 2012 and 1.97% for 2011, dividend yield of 5.40% for 2012 and 4.20% for 2011, afive year historical volatility factor of 0.28 for both 2012 and 2011, and an expected option life of five years for both 2012and 2011.
PSUs
In January 2013, we granted certain employees PSUs with an aggregate target award of 0.3 million shares of ourcommon stock. PSUs vest three years from the date of grant based on continuous service with the number of shares earneddepending upon the extent to which we achieve certain financial and market performance targets measured over the periodfrom January 1, 2013 through December 31, 2015. The number of shares earned can range from 0% to 200% of the targetaward. About half of these awards were valued at $89.24 per PSU in a manner similar to RSUs discussed above as thefinancial targets are based on our operations. We recognize the grant-date fair value of these PSUs, less estimated forfeitures,as compensation expense ratably over the vesting period based on the number of awards expected to vest at each reportingdate and, therefore, the associated compensation expense recognized could vary from year to year. The remaining PSUs werevalued at $61.13 per PSU using a Monte Carlo model as the performance target is related to our total shareholder return(TSR) relative to our peer group. We recognize the grant-date fair value of these awards, less estimated forfeitures, ascompensation expense ratably over the vesting period regardless as to whether or not the TSR performance target isachieved.
Note 13 – Legal Proceedings, Commitments, and Contingencies
We are a party to or have property subject to litigation and other proceedings that arise in the ordinary course of ourbusiness, including matters arising under provisions relating to the protection of the environment, and are subject tocontingencies related to certain businesses we previously owned. These types of matters could result in fines, penalties,compensatory or treble damages or non-monetary relief. We believe the probability is remote that the outcome of each ofthese matters, including the legal proceedings discussed below, will have a material adverse effect on the Corporation as awhole, notwithstanding that the unfavorable resolution of any matter may have a material effect on our net earnings in anyparticular interim reporting period. Among the factors that we consider in this assessment are the nature of existing legalproceedings and claims, the asserted or possible damages or loss contingency (if estimable), the progress of the case, existinglaw and precedent, the opinions or views of legal counsel and other advisers, our experience in similar cases and theexperience of other companies, the facts available to us at the time of assessment, and how we intend to respond to theproceeding or claim. Our assessment of these factors may change over time as individual proceedings or claims progress.
Although we cannot predict the outcome of legal or other proceedings with certainty, GAAP requires us to disclose anestimate of the reasonably possible loss or range of loss or make a statement that such an estimate cannot be made forcontingencies where there is at least a reasonable possibility that a loss may have been incurred. We have a thorough processto determine an estimate of the reasonably possible loss or range of loss before we conclude and disclose that an estimatecannot be made. Accordingly, unless otherwise indicated below in our discussion of legal proceedings, a reasonably possibleloss or range of loss associated with any individual legal proceeding cannot be estimated.
Legal Proceedings
On April 24, 2009, we filed a declaratory judgment action against the New York Metropolitan Transportation Authorityand its Capital Construction Company (collectively, the MTA) asking the U.S. District Court for the Southern District ofNew York to find that the MTA is in material breach of our agreement based on the MTA’s failure to provide access to siteswhere work must be performed and customer-furnished equipment necessary to complete the contract. The MTA filed ananswer and counterclaim alleging that we breached the contract, and subsequently terminated the contract for alleged default.
82
The primary damages sought by the MTA are the cost to complete the contract and potential re-procurement costs. While weare unable to estimate the cost of another contractor to complete the contract and the costs of re-procurement, we note thatour contract with the MTA had a total value of $323 million, of which $241 million was paid to us. We dispute the MTA’sallegations and are defending against them. Additionally, following an investigation, our sureties on a performance bondrelated to this matter, who were represented by independent counsel, concluded that the MTA’s termination of the contractwas improper. Finally, our declaratory judgment action was later amended to include claims for monetary damages againstthe MTA. A bench trial of this matter is scheduled to begin on April 28, 2014.
On August 28, 2003, the U.S. Department of Justice (DOJ) filed complaints in partial intervention in two lawsuits filedunder the qui tam provisions of the Civil False Claims Act in the U.S. District Court for the Western District of Kentucky,United States ex rel. Natural Resources Defense Council, et al., v. Lockheed Martin Corporation, et al., and United States exrel. John D. Tillson v. Lockheed Martin Energy Systems, Inc., et al. The DOJ alleges that we committed violations of theResource Conservation and Recovery Act at the Paducah Gaseous Diffusion Plant by not properly handling, storing, andtransporting hazardous waste and that we violated the False Claims Act by misleading Department of Energy officials andstate regulators about the nature and extent of environmental noncompliance at the plant. The complaint does not allege aspecific calculation of damages. On April 16, 2013, the parties attended a settlement conference ordered by the magistratejudge. The conference focused on the parties’ sharply differing views of the merits of the case and did not significantlycontribute to our understanding of the damages sought. Accordingly, we cannot estimate the reasonably possible loss, orrange of loss, which could be incurred if the plaintiffs were to prevail in the allegations, but believe that we have substantialdefenses. We dispute the allegations and are defending against them.
Environmental Matters
We are involved in environmental proceedings and potential proceedings relating to soil and groundwatercontamination, disposal of hazardous waste, and other environmental matters at several of our current or former facilities, orat third-party sites where we have been designated as a potentially responsible party (PRP). A substantial portion ofenvironmental costs will be included in our net sales and cost of sales in future periods pursuant to U.S. Governmentregulations. At the time a liability is recorded for future environmental costs, we record a receivable for estimated futurerecovery considered probable through the pricing of products and services to agencies of the U.S. Government, regardless ofthe contract form (e.g., cost-reimbursable, fixed-price). We continuously evaluate the recoverability of our environmentalreceivables by assessing, among other factors, U.S. Government regulations, our U.S. Government business base andcontract mix, and our history of receiving reimbursement of such costs. We include the portion of those environmental costsexpected to be allocated to our non-U.S. Government contracts, or that is determined to be unallowable for pricing underU.S. Government contracts, in our cost of sales at the time the liability is established.
At December 31, 2013 and 2012, the aggregate amount of liabilities recorded relative to environmental matters was$997 million and $950 million, most of which are recorded in other noncurrent liabilities on our Balance Sheets. We haverecorded receivables totaling $863 million and $821 million at December 31, 2013 and 2012, most of which are recorded inother noncurrent assets on our Balance Sheets, for the estimated future recovery of these costs, as we consider the recoveryprobable based on the factors previously mentioned. We project costs and recovery of costs over approximately 20 years.
Environmental cleanup activities usually span several years, which make estimating liabilities a matter of judgmentbecause of uncertainties with respect to assessing the extent of the contamination as well as such factors as changingremediation technologies and continually evolving regulatory environmental standards. There are a number of formeroperating facilities that we are monitoring or investigating for potential future remediation. We perform quarterly reviews ofthe status of our environmental remediation sites and the related liabilities and receivables. Additionally, in our quarterlyreviews, we consider these and other factors in estimating the timing and amount of any future costs that may be required forremediation activities and record a liability when it is probable that a loss has occurred and the loss can be reasonablyestimated. The amount of liability recorded is based on our estimate of the costs to be incurred for remediation at a particularsite. We do not discount the recorded liabilities, as the amount and timing of future cash payments are not fixed or cannot bereliably determined.
We reasonably cannot determine the extent of our financial exposure in all cases as, although a loss may be probable orreasonably possible, in some cases it is not possible at this time to estimate the loss or reasonably possible loss or range ofloss. We also are pursuing claims for recovery of costs incurred or contribution to site cleanup costs against other PRPs,including the U.S. Government.
California and the U.S. Environmental Protection Agency (U.S. EPA) are each evaluating the need to regulate hexavalentchromium in drinking water, distinct from the current standards which regulate total chromium. In 2011, California’s health risk
83
agency announced a non-enforceable public health goal for hexavalent chromium which California’s regulatory agency mustconsider when promulgating an enforceable drinking water standard, which it is expected to do by late 2014. The goal calls forlevels significantly below levels encompassed within the current total chromium standard. In August 2013, California’sregulatory agency proposed a draft drinking water standard for hexavalent chromium closer to levels encompassed within thecurrent standard. We expect that environmental groups will continue to seek a standard closer to the non-enforceable publichealth goal and we cannot predict the outcome of California’s regulatory proceedings. In addition, California is also reevaluatingits existing drinking water standard with respect to a second contaminant, perchlorate, and the U.S. EPA is also consideringwhether to regulate that contaminant in drinking water. With respect to either contaminant, if substantially lower standards areadopted, in either California or at the federal level, we expect a material increase in our estimates for environmental liabilitiesand the related assets for the portion of the increased costs that are probable of future recovery in the pricing of our products andservices for the U.S. Government. The amount that would be allocable to our non-U.S. Government contracts or that isdetermined to be unallowable for pricing under U.S. Government contracts would be expensed, which may have a materialeffect on our earnings in any particular interim reporting period.
We are conducting remediation activities under various consent decrees and orders relating to soil, groundwater,sediment, or surface water contamination at certain sites of former or current operations. Under an agreement related to ourBurbank and Glendale, California, sites, the U.S. Government reimburses us an amount equal to approximately 50% ofexpenditures for certain remediation activities in its capacity as a PRP under the Comprehensive Environmental Response,Compensation and Liability Act (CERCLA).
Operating Leases
We rent certain equipment and facilities under operating leases. Certain major plant facilities and equipment arefurnished by the U.S. Government under short-term or cancelable arrangements. Our total rental expense under operatingleases was $315 million, $302 million, and $347 million for 2013, 2012, and 2011. Future minimum lease commitments atDecember 31, 2013 for long-term non-cancelable operating leases were $914 million ($227 million in 2014, $166 millionin 2015, $132 million in 2016, $96 million in 2017, $69 million in 2018, and $224 million in later years).
Letters of Credit, Surety Bonds, and Third-Party Guarantees
We have entered into standby letters of credit, surety bonds, and third-party guarantees with financial institutions andother third parties primarily relating to advances received from customers and the guarantee of future performance on certaincontracts. Letters of credit and surety bonds generally are available for draw down in the event we do not perform. In somecases, we may guarantee the contractual performance of third parties such as venture partners. We had total outstandingletters of credit, surety bonds, and third-party guarantees aggregating $2.4 billion and $2.2 billion at December 31, 2013 and2012.
At December 31, 2013 and 2012, third-party guarantees totaled $696 million and $816 million, of which approximately90% and 85% related to guarantees of contractual performance of ventures to which we currently are or previously were aparty. This amount represents our estimate of the maximum amount we would expect to incur upon the contractual non-performance of the venture partners. In addition, we generally have cross-indemnities in place that may enable us to recoveramounts that may be paid on behalf of a venture partner. We believe our current and former venture partners will be able toperform their obligations, as they have done through December 31, 2013, and that it will not be necessary to make paymentsunder the guarantees. In determining our exposures, we evaluate the reputation, technical capabilities, and credit quality ofour current and former venture partners.
United Launch Alliance
In connection with our 50% ownership interest of ULA, we and The Boeing Company (Boeing) have each receiveddistributions totaling $527 million (since ULA’s formation in December 2006) which are subject to agreements between us,Boeing, and ULA, whereby, if ULA does not have sufficient cash resources or credit capacity to make required paymentsunder the inventory supply agreement it has with Boeing, both we and Boeing would provide to ULA, in the form of anadditional capital contribution, the level of funding required for ULA to make those payments. Any such capitalcontributions would not exceed the amount of the distributions subject to the agreements. Based on current expectations ofULA’s cash flow needs, we currently believe that ULA should have sufficient operating cash flows and credit capacity,including access to its $560 million revolving credit agreement from third-party financial institutions, to meet its obligationssuch that we would not be required to make a contribution under these agreements.
84
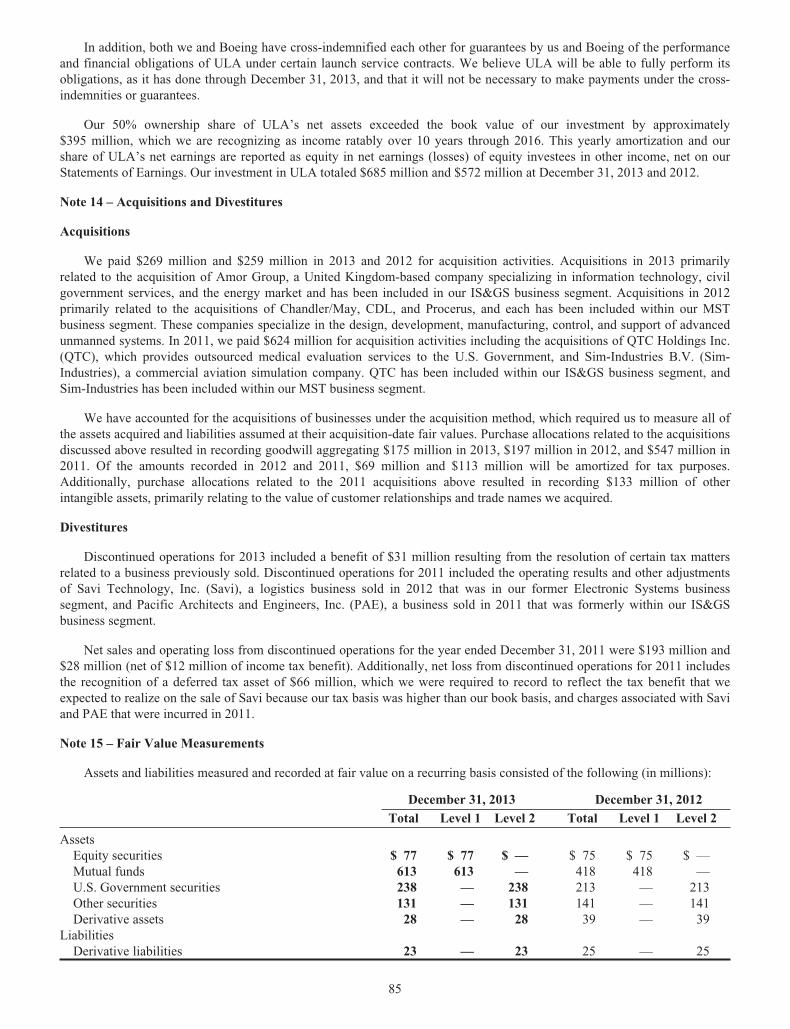
In addition, both we and Boeing have cross-indemnified each other for guarantees by us and Boeing of the performanceand financial obligations of ULA under certain launch service contracts. We believe ULA will be able to fully perform itsobligations, as it has done through December 31, 2013, and that it will not be necessary to make payments under the cross-indemnities or guarantees.
Our 50% ownership share of ULA’s net assets exceeded the book value of our investment by approximately$395 million, which we are recognizing as income ratably over 10 years through 2016. This yearly amortization and ourshare of ULA’s net earnings are reported as equity in net earnings (losses) of equity investees in other income, net on ourStatements of Earnings. Our investment in ULA totaled $685 million and $572 million at December 31, 2013 and 2012.
Note 14 – Acquisitions and Divestitures
Acquisitions
We paid $269 million and $259 million in 2013 and 2012 for acquisition activities. Acquisitions in 2013 primarilyrelated to the acquisition of Amor Group, a United Kingdom-based company specializing in information technology, civilgovernment services, and the energy market and has been included in our IS&GS business segment. Acquisitions in 2012primarily related to the acquisitions of Chandler/May, CDL, and Procerus, and each has been included within our MSTbusiness segment. These companies specialize in the design, development, manufacturing, control, and support of advancedunmanned systems. In 2011, we paid $624 million for acquisition activities including the acquisitions of QTC Holdings Inc.(QTC), which provides outsourced medical evaluation services to the U.S. Government, and Sim-Industries B.V. (Sim-Industries), a commercial aviation simulation company. QTC has been included within our IS&GS business segment, andSim-Industries has been included within our MST business segment.
We have accounted for the acquisitions of businesses under the acquisition method, which required us to measure all ofthe assets acquired and liabilities assumed at their acquisition-date fair values. Purchase allocations related to the acquisitionsdiscussed above resulted in recording goodwill aggregating $175 million in 2013, $197 million in 2012, and $547 million in2011. Of the amounts recorded in 2012 and 2011, $69 million and $113 million will be amortized for tax purposes.Additionally, purchase allocations related to the 2011 acquisitions above resulted in recording $133 million of otherintangible assets, primarily relating to the value of customer relationships and trade names we acquired.
Divestitures
Discontinued operations for 2013 included a benefit of $31 million resulting from the resolution of certain tax mattersrelated to a business previously sold. Discontinued operations for 2011 included the operating results and other adjustmentsof Savi Technology, Inc. (Savi), a logistics business sold in 2012 that was in our former Electronic Systems businesssegment, and Pacific Architects and Engineers, Inc. (PAE), a business sold in 2011 that was formerly within our IS&GSbusiness segment.
Net sales and operating loss from discontinued operations for the year ended December 31, 2011 were $193 million and$28 million (net of $12 million of income tax benefit). Additionally, net loss from discontinued operations for 2011 includesthe recognition of a deferred tax asset of $66 million, which we were required to record to reflect the tax benefit that weexpected to realize on the sale of Savi because our tax basis was higher than our book basis, and charges associated with Saviand PAE that were incurred in 2011.
Note 15 – Fair Value Measurements
Assets and liabilities measured and recorded at fair value on a recurring basis consisted of the following (in millions):
December 31, 2013 December 31, 2012
Total Level 1 Level 2 Total Level 1 Level 2
AssetsEquity securities $ 77 $ 77 $ — $ 75 $ 75 $ —Mutual funds 613 613 — 418 418 —U.S. Government securities 238 — 238 213 — 213Other securities 131 — 131 141 — 141Derivative assets 28 — 28 39 — 39
LiabilitiesDerivative liabilities 23 — 23 25 — 25
85
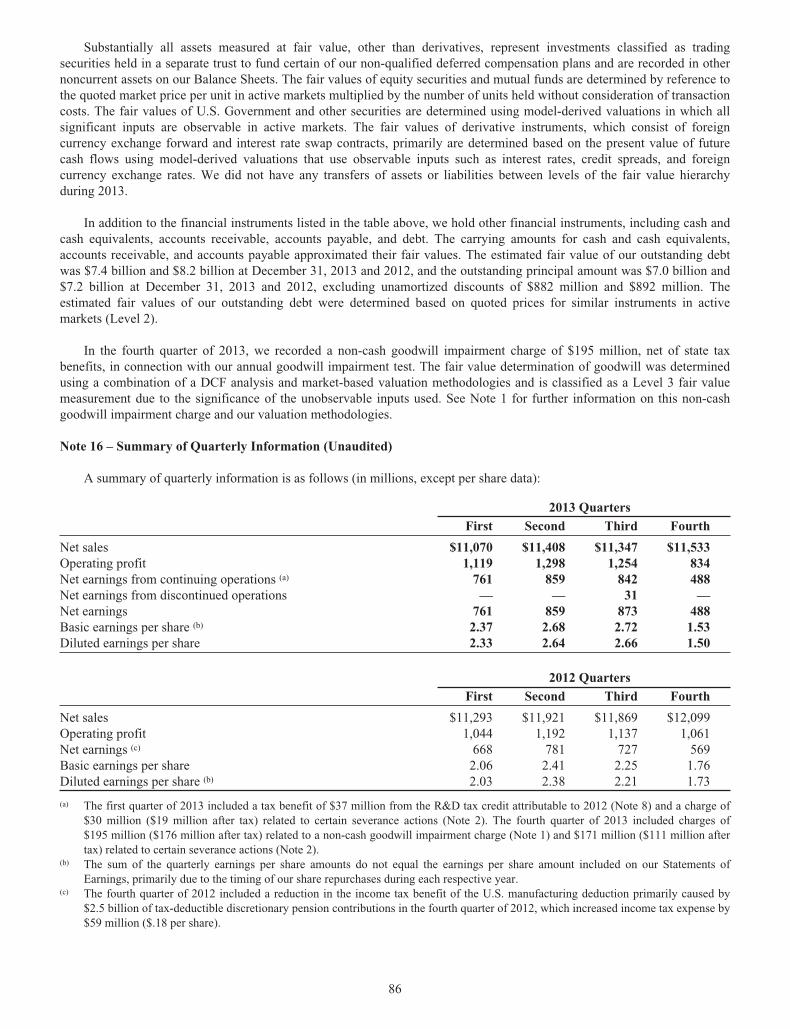
Substantially all assets measured at fair value, other than derivatives, represent investments classified as tradingsecurities held in a separate trust to fund certain of our non-qualified deferred compensation plans and are recorded in othernoncurrent assets on our Balance Sheets. The fair values of equity securities and mutual funds are determined by reference tothe quoted market price per unit in active markets multiplied by the number of units held without consideration of transactioncosts. The fair values of U.S. Government and other securities are determined using model-derived valuations in which allsignificant inputs are observable in active markets. The fair values of derivative instruments, which consist of foreigncurrency exchange forward and interest rate swap contracts, primarily are determined based on the present value of futurecash flows using model-derived valuations that use observable inputs such as interest rates, credit spreads, and foreigncurrency exchange rates. We did not have any transfers of assets or liabilities between levels of the fair value hierarchyduring 2013.
In addition to the financial instruments listed in the table above, we hold other financial instruments, including cash andcash equivalents, accounts receivable, accounts payable, and debt. The carrying amounts for cash and cash equivalents,accounts receivable, and accounts payable approximated their fair values. The estimated fair value of our outstanding debtwas $7.4 billion and $8.2 billion at December 31, 2013 and 2012, and the outstanding principal amount was $7.0 billion and$7.2 billion at December 31, 2013 and 2012, excluding unamortized discounts of $882 million and $892 million. Theestimated fair values of our outstanding debt were determined based on quoted prices for similar instruments in activemarkets (Level 2).
In the fourth quarter of 2013, we recorded a non-cash goodwill impairment charge of $195 million, net of state taxbenefits, in connection with our annual goodwill impairment test. The fair value determination of goodwill was determinedusing a combination of a DCF analysis and market-based valuation methodologies and is classified as a Level 3 fair valuemeasurement due to the significance of the unobservable inputs used. See Note 1 for further information on this non-cashgoodwill impairment charge and our valuation methodologies.
Note 16 – Summary of Quarterly Information (Unaudited)
A summary of quarterly information is as follows (in millions, except per share data):
2013 Quarters
First Second Third Fourth
Net sales $11,070 $11,408 $11,347 $11,533Operating profit 1,119 1,298 1,254 834Net earnings from continuing operations (a) 761 859 842 488Net earnings from discontinued operations — — 31 —Net earnings 761 859 873 488Basic earnings per share (b) 2.37 2.68 2.72 1.53Diluted earnings per share 2.33 2.64 2.66 1.50
2012 Quarters
First Second Third Fourth
Net sales $11,293 $11,921 $11,869 $12,099Operating profit 1,044 1,192 1,137 1,061Net earnings (c) 668 781 727 569Basic earnings per share 2.06 2.41 2.25 1.76Diluted earnings per share (b) 2.03 2.38 2.21 1.73
(a) The first quarter of 2013 included a tax benefit of $37 million from the R&D tax credit attributable to 2012 (Note 8) and a charge of$30 million ($19 million after tax) related to certain severance actions (Note 2). The fourth quarter of 2013 included charges of$195 million ($176 million after tax) related to a non-cash goodwill impairment charge (Note 1) and $171 million ($111 million aftertax) related to certain severance actions (Note 2).
(b) The sum of the quarterly earnings per share amounts do not equal the earnings per share amount included on our Statements ofEarnings, primarily due to the timing of our share repurchases during each respective year.
(c) The fourth quarter of 2012 included a reduction in the income tax benefit of the U.S. manufacturing deduction primarily caused by$2.5 billion of tax-deductible discretionary pension contributions in the fourth quarter of 2012, which increased income tax expense by$59 million ($.18 per share).
86
ITEM 9. Changes in and Disagreements with Accountants on Accounting and Financial Disclosure.
None.
ITEM 9A. Controls and Procedures.
Evaluation of Disclosure Controls and Procedures
We performed an evaluation of the effectiveness of our disclosure controls and procedures as of December 31, 2013.The evaluation was performed with the participation of senior management of each business segment and key Corporatefunctions, under the supervision of the Chief Executive Officer (CEO) and Chief Financial Officer (CFO). Based on thisevaluation, the CEO and CFO concluded that our disclosure controls and procedures were operating and effective as ofDecember 31, 2013.
Management’s Report on Internal Control Over Financial Reporting
Our management is responsible for establishing and maintaining adequate internal control over financial reporting. Ourinternal control system was designed to provide reasonable assurance to our management and board of directors regardingthe reliability of financial reporting and the preparation of financial statements for external purposes.
Our management conducted an assessment of the effectiveness of our internal control over financial reporting as ofDecember 31, 2013. This assessment was based on the criteria set forth by the Committee of Sponsoring Organizations of theTreadway Commission in Internal Control–Integrated Framework (1992 framework). Based on this assessment,management has concluded that, as of December 31, 2013, our internal control over financial reporting was effective.
Our independent registered public accounting firm has issued a report on the effectiveness of our internal control overfinancial reporting, which is below.
Changes in Internal Control Over Financial Reporting
There were no changes in our internal control over financial reporting during the most recently completed fiscal quarterthat materially affected, or are reasonably likely to materially affect, our internal control over financial reporting.
87
Report of Ernst & Young LLP,Independent Registered Public Accounting Firm,
Regarding Internal Control Over Financial Reporting
Board of Directors and StockholdersLockheed Martin Corporation
We have audited Lockheed Martin Corporation’s internal control over financial reporting as of December 31, 2013,based on criteria established in Internal Control–Integrated Framework issued by the Committee of SponsoringOrganizations of the Treadway Commission (1992 framework) (the COSO criteria). Lockheed Martin Corporation’smanagement is responsible for maintaining effective internal control over financial reporting, and for its assessment of theeffectiveness of internal control over financial reporting included in the accompanying Management’s Report on InternalControl Over Financial Reporting. Our responsibility is to express an opinion on the Corporation’s internal control overfinancial reporting based on our audit.
We conducted our audit in accordance with the standards of the Public Company Accounting Oversight Board (UnitedStates). Those standards require that we plan and perform the audit to obtain reasonable assurance about whether effectiveinternal control over financial reporting was maintained in all material respects. Our audit included obtaining anunderstanding of internal control over financial reporting, assessing the risk that a material weakness exists, testing andevaluating the design and operating effectiveness of internal control based on the assessed risk, and performing such otherprocedures as we considered necessary in the circumstances. We believe that our audit provides a reasonable basis for ouropinion.
A company’s internal control over financial reporting is a process designed to provide reasonable assurance regardingthe reliability of financial reporting and the preparation of financial statements for external purposes in accordance withgenerally accepted accounting principles. A company’s internal control over financial reporting includes those policies andprocedures that (1) pertain to the maintenance of records that, in reasonable detail, accurately and fairly reflect thetransactions and dispositions of the assets of the company; (2) provide reasonable assurance that transactions are recorded asnecessary to permit preparation of financial statements in accordance with generally accepted accounting principles, and thatreceipts and expenditures of the company are being made only in accordance with authorizations of management anddirectors of the company; and (3) provide reasonable assurance regarding prevention or timely detection of unauthorizedacquisition, use, or disposition of the company’s assets that could have a material effect on the financial statements.
Because of its inherent limitations, internal control over financial reporting may not prevent or detect misstatements.Also, projections of any evaluation of effectiveness to future periods are subject to the risk that controls may becomeinadequate because of changes in conditions, or that the degree of compliance with the policies or procedures maydeteriorate.
In our opinion, Lockheed Martin Corporation maintained, in all material respects, effective internal control overfinancial reporting as of December 31, 2013, based on the COSO criteria.
We also have audited, in accordance with the standards of the Public Company Accounting Oversight Board (UnitedStates), the consolidated balance sheets of Lockheed Martin Corporation as of December 31, 2013 and 2012, and the relatedconsolidated statements of earnings, comprehensive income, stockholders’ equity, and cash flows for each of the three yearsin the period ended December 31, 2013 of Lockheed Martin Corporation and our report dated February 14, 2014 expressedan unqualified opinion thereon.
McLean, VirginiaFebruary 14, 2014
ITEM 9B. Other Information.
None.
88
PART III
ITEM 10. Directors, Executive Officers and Corporate Governance.
The information concerning directors required by Item 401 of Regulation S-K is included under the caption“Proposal 1 - Election of Directors” in our definitive Proxy Statement to be filed pursuant to Regulation 14A (the 2014 ProxyStatement), and that information is incorporated by reference in this Form 10-K. Information concerning executive officersrequired by Item 401 of Regulation S-K is located under Part I, Item 4(a) of this Form 10-K. The information required byItem 405 of Regulation S-K is included under the caption “Section 16(a) Beneficial Ownership Reporting Compliance” in the2014 Proxy Statement, and that information is incorporated by reference in this Form 10-K. The information required byItems 407(c)(3), (d)(4) and (d)(5) of Regulation S-K is included under the captions “Committees of the Board of Directors –Membership on Board Committees” and “Committees of the Board of Directors – Audit Committee Report” in the 2014Proxy Statement, and that information is incorporated by reference in this Form 10-K.
We have had a written code of ethics in place since our formation in 1995. Setting the Standard, our Code of Ethics andBusiness Conduct, applies to all our employees, including our principal executive officer, principal financial officer, andprincipal accounting officer and controller, and to members of our Board of Directors. A copy of our Code of Ethics andBusiness Conduct is available on our investor relations website: www.lockheedmartin.com/investor. Printed copies of ourCode of Ethics and Business Conduct may be obtained, without charge, by contacting Investor Relations, Lockheed MartinCorporation, 6801 Rockledge Drive, Bethesda, Maryland 20817. We are required to disclose any change to, or waiver from,our Code of Ethics and Business Conduct for our Chief Executive Officer and senior financial officers. We use our websiteto disseminate this disclosure as permitted by applicable SEC rules.
ITEM 11. Executive Compensation.
The information required by Item 402 of Regulation S-K is included in the text and tables under the captions “ExecutiveCompensation” and “Director Compensation” in the 2014 Proxy Statement and that information is incorporated by referencein this Form 10-K. The information required by Items 407(e)(4) and (e)(5) of Regulation S-K is included under the captions“Executive Compensation – Compensation Committee Interlocks and Insider Participation” and “Executive Compensation –Compensation Committee Report” in the 2014 Proxy Statement, and that information is furnished by incorporation byreference in this Form 10-K.
ITEM 12. Security Ownership of Certain Beneficial Owners and Management and Related Stockholder Matters.
The information required by this Item 12 is included under the heading “Security Ownership of Management and CertainBeneficial Owners” in the 2014 Proxy Statement, and that information is incorporated by reference in this Form 10-K. Theinformation required by this Item 12 related to our equity compensation plans that authorize the issuance of shares ofLockheed Martin Corporation common stock to employees and directors is included under the heading “ExecutiveCompensation – Equity Compensation Plan Information” in the 2014 Proxy Statement, and that information is incorporatedby reference in this Form 10-K.
ITEM 13. Certain Relationships and Related Transactions, and Director Independence.
The information required by this Item 13 is included under the captions “Corporate Governance – Related PersonTransaction Policy,” “Corporate Governance – Certain Relationships and Related Person Transactions of Directors,Executive Officers, and 5 Percent Stockholders,” and “Corporate Governance – Director Independence” in the 2014 ProxyStatement, and that information is incorporated by reference in this Form 10-K.
ITEM 14. Principal Accountant Fees and Services.
The information required by this Item 14 is included under the caption “Proposal 2 – Ratification of Appointment ofIndependent Auditors” in the 2014 Proxy Statement, and that information is incorporated by reference in this Form 10-K.
89
PART IV
ITEM 15. Exhibits and Financial Statement Schedules.
List of financial statements filed as part of this Form 10-K
The following financial statements of Lockheed Martin Corporation and consolidated subsidiaries are included in Item 8of this Form 10-K at the page numbers referenced below:
Page
Consolidated Statements of Earnings – Years ended December 31, 2013, 2012, and 2011 . . . . . . . . . . . . . . . . . . . 56
Consolidated Statements of Comprehensive Income – Years ended December 31, 2013, 2012, and 2011 . . . . . . . 57
Consolidated Balance Sheets – At December 31, 2013 and 2012 . . . . . . . . . . . . . . . . . . . . . . . . . . . . . . . . . . . . . . . 58
Consolidated Statements of Cash Flows – Years ended December 31, 2013, 2012, and 2011 . . . . . . . . . . . . . . . . . 59
Consolidated Statements of Stockholders’ Equity – Years ended December 31, 2013, 2012, and 2011 . . . . . . . . . 60
Notes to Consolidated Financial Statements . . . . . . . . . . . . . . . . . . . . . . . . . . . . . . . . . . . . . . . . . . . . . . . . . . . . . . . 61
The report of Lockheed Martin Corporation’s independent registered public accounting firm with respect to the above-referenced financial statements and their report on internal control over financial reporting appear on pages 55 and 88 of thisForm 10-K. Their consent appears as Exhibit 23 of this Form 10-K.
List of financial statement schedules filed as part of this Form 10-K
All schedules have been omitted because they are not applicable, not required, or the information has been otherwisesupplied in the financial statements or notes to the financial statements.
Exhibits
3.1 Charter of Lockheed Martin Corporation, as amended by Articles of Amendment dated April 23, 2009(incorporated by reference to Exhibit 3.1 to Lockheed Martin Corporation’s Annual Report on Form 10-K forthe year ended December 31, 2010).
3.2 Bylaws of Lockheed Martin Corporation, as amended effective January 24, 2013 (incorporated by reference toExhibit 3.1 to Lockheed Martin Corporation’s Current Report on Form 8-K filed with the SEC onJanuary 28, 2013).
4.1 Indenture, dated May 16, 1996, among Lockheed Martin Corporation, Lockheed Martin Tactical Systems, Inc.and First Trust of Illinois, National Association as Trustee (incorporated by reference to Exhibit 4.A toLockheed Martin Corporation’s Current Report on Form 8-K filed with the SEC on May 20, 1996).
4.2 Indenture, dated as of August 30, 2006, between Lockheed Martin Corporation and The Bank of New York(incorporated by reference to Exhibit 99.1 to Lockheed Martin Corporation’s Current Report on Form 8-K filedwith the SEC on August 31, 2006).
4.3 Indenture, dated as of March 11, 2008, between Lockheed Martin Corporation and The Bank of New York(incorporated by reference to Exhibit 4.1 to Lockheed Martin Corporation’s Current Report on Form 8-K filedwith the SEC on March 12, 2008).
4.4 Indenture, dated as of May 25, 2010, between Lockheed Martin Corporation and U.S. Bank National Association(incorporated by reference to Exhibit 99.1 to Lockheed Martin Corporation’s Current Report on Form 8-K filedwith the SEC on May 25, 2010).
4.5 Indenture, dated as of September 6, 2011, between Lockheed Martin Corporation and U.S. Bank NationalAssociation (incorporated by reference to Exhibit 4.1 to Lockheed Martin Corporation’s Current Report on Form8-K filed with the SEC on September 7, 2011).
4.6 Indenture, dated as of December 14, 2012, between Lockheed Martin Corporation and U.S. Bank NationalAssociation (incorporated by reference to Exhibit 99.1 to Lockheed Martin Corporation’s Current Report onForm 8-K filed with the SEC on December 17, 2012).
90
See also Exhibits 3.1 and 3.2.
No instruments defining the rights of holders of long-term debt that is not registered are filed because the totalamount of securities authorized under any such instrument does not exceed 10% of the total assets of LockheedMartin Corporation on a consolidated basis. Lockheed Martin Corporation agrees to furnish a copy of suchinstruments to the SEC upon request.
10.1 Lockheed Martin Corporation Directors Deferred Stock Plan, as amended (incorporated by reference to Exhibit10.4 to Lockheed Martin Corporation’s Quarterly Report on Form 10-Q for the quarter endedSeptember 30, 2002).
10.2 Lockheed Martin Corporation Directors Deferred Compensation Plan, as amended (incorporated by reference toExhibit 10.2 to Lockheed Martin Corporation’s Annual Report on Form 10-K for the year endedDecember 31, 2008).
10.3 Resolutions relating to Lockheed Martin Corporation Financial Counseling Program and personal liability andaccidental death and dismemberment benefits for officers and company presidents, (incorporated by reference toExhibit 10(g) to Lockheed Martin Corporation’s Annual Report on Form 10-K for the year endedDecember 31, 1997).
10.4 Martin Marietta Corporation Postretirement Death Benefit Plan for Senior Executives, as amended (incorporatedby reference to Exhibit 10.9 to Lockheed Martin Corporation’s Registration Statement on Form S-4(File No. 033-57645) filed with the SEC on February 9, 1995), and as further amended September 26, 1996(incorporated by reference to Exhibit 10 (ooo) to Lockheed Martin Corporation’s Annual Report on Form 10-Kfor the year ended December 31, 1996).
10.5 Martin Marietta Corporation Amended Omnibus Securities Award Plan, as amended (incorporated by referenceto Exhibit 10.13 to Lockheed Martin Corporation’s Registration Statement on Form S-4 (File No. 033-57645)filed with the SEC on February 9, 1995).
10.6 Martin Marietta Corporation Directors’ Life Insurance Program (incorporated by reference to Exhibit 10.17 toLockheed Martin Corporation’s Registration Statement on Form S-4 (File No. 033-57645) filed with the SEC onFebruary 9, 1995).
10.7 Lockheed Martin Supplementary Pension Plan for Employees of Transferred GE Operations, as amended(incorporated by reference to Exhibit 10.7 to Lockheed Martin Corporation’s Annual Report on Form 10-K forthe year ended December 31, 2010).
10.8 Supplemental Retirement Benefit Plan for Certain Transferred Employees of Lockheed Martin Corporation, asamended (incorporated by reference to Exhibit 10.8 to Lockheed Martin Corporation’s Annual Report onForm 10-K for the year ended December 31, 2010).
10.9 Lockheed Martin Corporation Supplemental Savings Plan, as amended (incorporated by reference to Exhibit10.9 to Lockheed Martin Corporation’s Annual Report on Form 10-K for the year ended December 31, 2012).
10.10 Amendment to Terms of Outstanding Stock Option Relating to Exercise Period for Employees of DivestedBusiness (incorporated by reference to Exhibit 10 (dd) to Lockheed Martin Corporation’s Annual Report onForm 10-K for the year ended December 31, 1999).
10.11 Lockheed Martin Corporation Postretirement Death Benefit Plan for Elected Officers, as amended (incorporatedby reference to Exhibit 99.1 to Lockheed Martin Corporation’s Current Report on Form 8-K filed with the SECon July 3, 2007).
10.12 Deferred Performance Payment Plan of Lockheed Martin Corporation Space & Strategic Missiles Sector(incorporated by reference to Exhibit 10 (ooo) to Lockheed Martin Corporation’s Annual Report on Form 10-Kfor the year ended December 31, 1997).
10.13 Lockheed Martin Corporation Directors Equity Plan, as amended (incorporated by reference to Exhibit 10.1 toLockheed Martin Corporation’s Current Report on Form 8-K filed with the SEC on November 2, 2006).
10.14 Lockheed Martin Corporation Deferred Management Incentive Compensation Plan, as amended (incorporatedby reference to Exhibit 10.14 to Lockheed Martin Corporation’s Annual Report on Form 10-K for the year endedDecember 31, 2012).
10.15 Lockheed Martin Corporation 2006 Management Incentive Compensation Plan (Performance Based), asamended (incorporated by reference to Exhibit 10.2 to Lockheed Martin Corporation’s Current Report onForm 8-K filed with the SEC on January 28, 2013).
91
10.16 Deferred Management Incentive Compensation Plan of Lockheed Corporation and its, subsidiaries (incorporatedby reference to Exhibit 10.3 to Lockheed Martin Corporation’s Quarterly Report on Form 10-Q for the quarterended June 30, 2001).
10.17 Lockheed Martin Corporation Amended and Restated 2003 Incentive Performance Award Plan (incorporated byreference to Exhibit 10.17 to Lockheed Martin Corporation’s Annual Report on Form 10-K for the year endedDecember 31, 2008).
10.18 Five-Year Credit Agreement, dated as of August 26, 2011, among Lockheed Martin Corporation and the bankslisted therein (incorporated by reference to Exhibit 10.1 to Lockheed Martin Corporation’s Current Report onForm 8-K filed with the SEC on September 1, 2011).
10.19 Lockheed Martin Supplemental Retirement Plan, as amended (incorporated by reference to Exhibit 10.20 toLockheed Martin Corporation’s Annual Report on Form 10-K for the year ended December 31, 2010).
10.20 Joint Venture Master Agreement, dated as of May 2, 2005, by and among Lockheed Martin Corporation, TheBoeing Company and United Launch Alliance, L.L.C. (incorporated by reference to Exhibit 10.2 to LockheedMartin Corporation’s Quarterly Report on Form 10-Q for the quarter ended June 30, 2005).
10.21 Lockheed Martin Corporation Nonqualified Capital Accumulation Plan, as amended (incorporated by referenceto Exhibit 10.21 to Lockheed Martin Corporation’s Annual Report on Form 10-K for the year endedDecember 31, 2012).
10.22 Lockheed Martin Corporation Executive Severance Plan, prior to November 1, 2013, known as the LockheedMartin Corporation Severance Benefit Plan for Certain Management Employees.
10.23 Lockheed Martin Corporation 2009 Directors Equity Plan (incorporated by reference to Appendix E to LockheedMartin Corporation’s Definitive Proxy Statement on schedule 14A filed with the SEC on March 14, 2008).
10.24 Form of Indemnification Agreement (incorporated by reference to Exhibit 10.34 to Lockheed MartinCorporation’s Annual Report on Form 10-K for the year ended December 31, 2009).
10.25 Lockheed Martin Corporation Special Termination Plan for Certain Management Employees (incorporated byreference to Exhibit 10 to Lockheed Martin Corporation’s Quarterly Report on Form 10-Q for the quarter endedJune 27, 2010).
10.26 Form of Stock Option Award Agreement under the Lockheed Martin Corporation 2003 Incentive PerformanceAward Plan (incorporated by reference to Exhibit 10.3 to Lockheed Martin Corporation’s Quarterly Report onForm 10-Q for the quarter ended September 30, 2004).
10.27 Form of Restricted Stock Award Agreement under the Lockheed Martin Corporation 2003 IncentivePerformance Award Plan (incorporated by reference to Exhibit 10.4 to Lockheed Martin Corporation’s QuarterlyReport on Form 10-Q for the quarter ended September 30, 2004).
10.28 Form of Lockheed Martin Corporation Long-Term Incentive Performance Award Agreement (2006-2008performance periods) under the Lockheed Martin Corporation 2003 Incentive Performance Award Plan(incorporated by reference to Exhibit 99.4 of Lockheed Martin Corporation’s Current Report on Form 8-K filedwith the SEC on February 2, 2006).
10.29 Form of the Lockheed Martin Corporation Long-Term Incentive Performance Award Agreement (2007-2009Performance Period) under the Lockheed Martin Corporation 2003 Incentive Performance Award Plan(incorporated by reference to Exhibit 10.30 of Lockheed Martin Corporation’s Annual Report on Form 10-K forthe year ended December 31, 2006).
10.30 Forms of Long-Term Incentive Performance Award Agreements (2008-2010 performance period), Forms ofStock Option Award Agreements and Forms of Restricted Stock Unit Award Agreements under the LockheedMartin Corporation 2003 Incentive Performance Award Plan (incorporated by reference to Exhibit 10.39 toLockheed Martin Corporation’s Annual Report on Form 10-K for the year ended December 31, 2007).
10.31 Forms of Long-Term Incentive Performance Award Agreements (2009-2011 performance period), Forms ofStock Option Award Agreements and Forms of Restricted Stock Unit Award Agreements under the LockheedMartin Corporation 2003 Incentive Performance Award Plan (incorporated by reference to Exhibit 10.32 toLockheed Martin Corporation’s Annual Report on Form 10-K for the year ended December 31, 2008).
10.32 Forms of Long-Term Incentive Performance Award Agreements (2010-2012 performance period), Forms ofStock Option Award Agreements and Forms of Restricted Stock Unit Award Agreements under the LockheedMartin Corporation 2003 Incentive Performance Award Plan (incorporated by reference to Exhibit 10.33 toLockheed Martin Corporation’s Annual Report on Form 10-K for the year ended December 31, 2009).
92
10.33 Form of Stock Option Award Agreement under the Lockheed Martin Corporation 2003 Incentive PerformanceAward Plan (incorporated by reference to Exhibit 99.2 of Lockheed Martin Corporation’s Current Report onForm 8-K filed with the SEC on February 3, 2011).
10.34 Form of Restricted Stock Unit Award Agreement under the Lockheed Martin Corporation 2003 IncentivePerformance Award Plan (incorporated by reference to Exhibit 99.3 of Lockheed Martin Corporation’s CurrentReport on Form 8-K filed with the SEC on February 3, 2011).
10.35 LTIP award agreement forms as approved on February 24, 2011 (incorporated by reference to Exhibit 99.1 toLockheed Martin Corporation’s Current Report on Form 8-K filed with the SEC on February 25, 2011).
10.36 Amendment to Stock Option Award Agreement (Grant Date: January 31, 2011) (incorporated by reference toExhibit 10.1 to Lockheed Martin Corporation’s Quarterly Report on Form 10-Q for the quarter endedJune 26, 2011).
10.37 Post-Retirement Consulting Agreement (incorporated by reference to Exhibit 10.2 to Lockheed MartinCorporation’s Quarterly Report on Form 10-Q for the quarter ended June 26, 2011).
10.38 Form of Restricted Stock Unit Award Agreement, Form of Performance Stock Unit Award Agreement (2013-2015 performance period), and Form of Long-Term Incentive Performance Award Agreement (2013-2015performance period) under the Lockheed Martin Corporation 2011 Incentive Performance Award Plan(incorporated by reference to Exhibits 10.3, 10.4 and 10.5, respectively, to Lockheed Martin Corporation’sCurrent Report on Form 8-K filed with the SEC on January 28, 2013).
10.39 Lockheed Martin Corporation 2011 Incentive Performance Award Plan, as amended (incorporated by referenceto Exhibit 10.2 to Lockheed Martin Corporation’s Current Report on Form 8-K filed with the SEC onJanuary 28, 2014).
10.40 Forms of Long-Term Incentive Performance Award Agreements (2012-2014 performance period), Forms ofStock Option Award Agreements and Forms of Restricted Stock Unit Award Agreements under the LockheedMartin Corporation 2011 Incentive Performance Award Plan (incorporated by reference to Exhibit 10.39 ofLockheed Martin Corporation’s Annual Report on Form 10-K for the year ended December 31, 2011).
10.41 Retirement Transition Agreement and Consulting Agreement with Ralph D. Heath, dated January 26, 2012(incorporated by reference to Exhibit 10.40 to Lockheed Martin Corporation’s Annual Report on Form 10-K for theyear ended December 31, 2011).
10.42 Separation Letter Agreement, dated as of November 9, 2012, between Christopher E. Kubasik and theCorporation (incorporated by reference to Exhibit 10.1 to Lockheed Martin Corporation’s Current Report onForm 8-K filed with the SEC on November 9, 2012).
10.43 Transition Agreement between Lockheed Martin Corporation and Robert J. Stevens (incorporated by referenceto Exhibit 99.2 to Lockheed Martin Corporation’s Current Report on Form 8-K filed with the SEC onNovember 27, 2012).
10.44 Retirement Transition Agreement between Lockheed Martin Corporation and Ms. Joanne M. Maguire, datedFebruary 7, 2013, and executed by Ms. Maguire on February 8, 2013 (incorporated by reference to Exhibit 10.1of Lockheed Martin Corporation’s Current Report on Form 8-K filed with the SEC on February 12, 2013).
10.45 Retirement Transition Agreement between Lockheed Martin Corporation and Ms. Linda R. Gooden, datedFebruary 7, 2013, and executed by Ms. Gooden on February 8, 2013 (incorporated by reference to Exhibit 10.2of Lockheed Martin Corporation’s Current Report on Form 8-K filed with the SEC on February 12, 2013).
10.46 Lockheed Martin Corporation 2006 Management Incentive Compensation Plan (Performance Based), asamended (incorporated by reference to Exhibit 10.1 to Lockheed Martin Corporation’s Current Report onForm 8-K filed with the SEC on January 28, 2014).
10.47 Form of Restricted Stock Unit Award Agreement, Form of Long-Term Incentive Performance AwardAgreement (2014-2016 performance period), and Form of Performance Stock Unit Award Agreement (2014-2016 performance period) under the Lockheed Martin Corporation 2011 Incentive Performance Award Plan(incorporated by reference to Exhibits 10.3, 10.4 and 10.5, respectively, to Lockheed Martin Corporation’sCurrent Report on Form 8-K filed with the SEC on January 28, 2014).
12 Computation of ratio of earnings to fixed charges.
21 Subsidiaries of Lockheed Martin Corporation.
93
23 Consent of Ernst & Young LLP, Independent Registered Public Accounting Firm.
24 Powers of Attorney.
31.1 Certification of Marillyn A. Hewson pursuant to Section 302 of the Sarbanes-Oxley Act of 2002.
31.2 Certification of Bruce L. Tanner pursuant to Section 302 of the Sarbanes-Oxley Act of 2002.
32 Certification of Marillyn A. Hewson and Bruce L. Tanner Pursuant to 18 U.S.C. Section 1350, as adoptedpursuant to Section 906 of the Sarbanes-Oxley Act of 2002.
101.INS XBRL Instance Document
101.SCH XBRL Taxonomy Extension Schema Document
101.CAL XBRL Taxonomy Extension Calculation Linkbase Document
101.DEF XBRL Taxonomy Extension Definition Linkbase Document
101.LAB XBRL Taxonomy Extension Label Linkbase Document
101.PRE XBRL Taxonomy Extension Presentation Linkbase Document
* Exhibits 10.1 through 10.17 and 10.21 through 10.47 constitute management contracts or compensatory plans orarrangements.
94

SIGNATURES
Pursuant to the requirements of Section 13 or 15(d) of the Securities Exchange Act of 1934, the registrant has dulycaused this report to be signed on its behalf by the undersigned, thereunto duly authorized.
Lockheed Martin Corporation(Registrant)
Date: February 14, 2014 By:
Christopher J. GregoireVice President, Controller, and ChiefAccounting Officer
Pursuant to the requirements of the Securities Exchange Act of 1934, this report has been signed below by the followingpersons on behalf of the registrant and in the capacities and on the dates indicated.
Signatures Titles Date
Marillyn A. Hewson
Chairman, President and Chief ExecutiveOfficer (Principal Executive Officer)
February 14, 2014
Bruce L. Tanner
Executive Vice President and Chief FinancialOfficer (Principal Financial Officer)
February 14, 2014
Christopher J. Gregoire
Vice President, Controller, and ChiefAccounting Officer (Principal AccountingOfficer)
February 14, 2014
*Nolan D. Archibald
Director February 14, 2014
*Rosalind G. Brewer
Director February 14, 2014
*David B. Burritt
Director February 14, 2014
*James O. Ellis, Jr.
Director February 14, 2014
*Thomas J. Falk
Director February 14, 2014
*Gwendolyn S. King
Director February 14, 2014
*James M. Loy
Director February 14, 2014
*Douglas H. McCorkindale
Director February 14, 2014
*Joseph W. Ralston
Director February 14, 2014
*Anne Stevens
Director February 14, 2014
*By Maryanne R. Lavan pursuant to a Power of Attorney executed by the Directors listed above, which has been filedwith this Annual Report on Form 10-K.
Date: February 14, 2014 By:
Maryanne R. LavanAttorney-in-fact
95

[THIS PAGE INTENTIONALLY LEFT BLANK]
Exhibit 31.1
CERTIFICATION OF MARILLYN A. HEWSON PURSUANT TOSECTION 302 OF THE SARBANES-OXLEY ACT OF 2002
I, Marillyn A. Hewson, certify that:
1. I have reviewed this Annual Report on Form 10-K of Lockheed Martin Corporation;
2. Based on my knowledge, this report does not contain any untrue statement of a material fact or omit to state a materialfact necessary to make the statements made, in light of the circumstances under which such statements were made, notmisleading with respect to the period covered by this report;
3. Based on my knowledge, the financial statements, and other financial information included in this report, fairly presentin all material respects the financial condition, results of operations, and cash flows of the registrant as of, and for, theperiods presented in this report;
4. The registrant’s other certifying officer and I are responsible for establishing and maintaining disclosure controls andprocedures (as defined in Exchange Act Rules 13a-15(e) and 15d-15(e)) and internal control over financial reporting(as defined in Exchange Act Rules 13a-15(f) and 15d-15(f)) for the registrant and have:
(a) Designed such disclosure controls and procedures, or caused such disclosure controls and procedures to bedesigned under our supervision, to ensure that material information relating to the registrant, including itsconsolidated subsidiaries, is made known to us by others within those entities, particularly during the period inwhich this report is being prepared;
(b) Designed such internal control over financial reporting, or caused such internal control over financial reporting tobe designed under our supervision, to provide reasonable assurance regarding the reliability of financial reportingand the preparation of financial statements for external purposes in accordance with generally acceptedaccounting principles;
(c) Evaluated the effectiveness of the registrant’s disclosure controls and procedures, and presented in this report ourconclusions about the effectiveness of the disclosure controls and procedures, as of the end of the period coveredby this report based on such evaluation; and
(d) Disclosed in this report any change in the registrant’s internal control over financial reporting that occurredduring the registrant’s most recent fiscal quarter (the registrant’s fourth fiscal quarter in the case of an annualreport) that has materially affected, or is reasonably likely to materially affect, the registrant’s internal controlover financial reporting;
5. The registrant’s other certifying officer and I have disclosed, based on our most recent evaluation of internal controlover financial reporting, to the registrant’s auditors and the audit committee of the registrant’s board of directors (orpersons performing the equivalent functions):
(a) All significant deficiencies and material weaknesses in the design or operation of internal control over financialreporting which are reasonably likely to adversely affect the registrant’s ability to record, process, summarize,and report financial information; and
(b) Any fraud, whether or not material, that involves management or other employees who have a significant role inthe registrant’s internal control over financial reporting.
Marillyn A. HewsonChief Executive Officer
Date: February 14, 2014
Exhibit 31.2
CERTIFICATION OF BRUCE L. TANNER PURSUANT TOSECTION 302 OF THE SARBANES-OXLEY ACT OF 2002
I, Bruce L. Tanner, certify that:
1. I have reviewed this Annual Report on Form 10-K of Lockheed Martin Corporation;
2. Based on my knowledge, this report does not contain any untrue statement of a material fact or omit to state a materialfact necessary to make the statements made, in light of the circumstances under which such statements were made, notmisleading with respect to the period covered by this report;
3. Based on my knowledge, the financial statements, and other financial information included in this report, fairly presentin all material respects the financial condition, results of operations, and cash flows of the registrant as of, and for, theperiods presented in this report;
4. The registrant’s other certifying officer and I are responsible for establishing and maintaining disclosure controls andprocedures (as defined in Exchange Act Rules 13a-15(e) and 15d-15(e)) and internal control over financial reporting(as defined in Exchange Act Rules 13a-15(f) and 15d-15(f)) for the registrant and have:
(a) Designed such disclosure controls and procedures, or caused such disclosure controls and procedures to bedesigned under our supervision, to ensure that material information relating to the registrant, including itsconsolidated subsidiaries, is made known to us by others within those entities, particularly during the period inwhich this report is being prepared;
(b) Designed such internal control over financial reporting, or caused such internal control over financial reporting tobe designed under our supervision, to provide reasonable assurance regarding the reliability of financial reportingand the preparation of financial statements for external purposes in accordance with generally acceptedaccounting principles;
(c) Evaluated the effectiveness of the registrant’s disclosure controls and procedures, and presented in this report ourconclusions about the effectiveness of the disclosure controls and procedures, as of the end of the period coveredby this report based on such evaluation; and
(d) Disclosed in this report any change in the registrant’s internal control over financial reporting that occurredduring the registrant’s most recent fiscal quarter (the registrant’s fourth fiscal quarter in the case of an annualreport) that has materially affected, or is reasonably likely to materially affect, the registrant’s internal controlover financial reporting;
5. The registrant’s other certifying officer and I have disclosed, based on our most recent evaluation of internal controlover financial reporting, to the registrant’s auditors and the audit committee of the registrant’s board of directors (orpersons performing the equivalent functions):
(a) All significant deficiencies and material weaknesses in the design or operation of internal control over financialreporting which are reasonably likely to adversely affect the registrant’s ability to record, process, summarize,and report financial information; and
(b) Any fraud, whether or not material, that involves management or other employees who have a significant role inthe registrant’s internal control over financial reporting.
Bruce L. TannerChief Financial Officer
Date: February 14, 2014
Exhibit 32
CERTIFICATION OF MARILLYN A. HEWSON AND BRUCE L. TANNER PURSUANT TO 18 U.S.C.SECTION 1350, AS ADOPTED PURSUANT TO SECTION 906 OF THE SARBANES-OXLEY ACT OF 2002
In connection with the Annual Report of Lockheed Martin Corporation (the “Corporation”) on Form 10-K for theperiod ended December 31, 2013, as filed with the U.S. Securities and Exchange Commission on the date hereof (the“Report”), I, Marillyn A. Hewson, Chief Executive Officer of the Corporation, and I, Bruce L. Tanner, Chief FinancialOfficer of the Corporation, each certify, pursuant to 18 U.S.C. Section 1350, as adopted pursuant to Section 906 of theSarbanes-Oxley Act of 2002, that to my knowledge:
(1) The Report fully complies with the requirements of Section 13(a) or 15(d) of the Securities Exchange Act of1934; and
(2) The information contained in the Report fairly presents, in all material respects, the financial condition andresults of operations of the Corporation.
Marillyn A. HewsonChief Executive Officer
Bruce L. TannerChief Financial Officer
Date: February 14, 2014

[THIS PAGE INTENTIONALLY LEFT BLANK]
GENERAL INFORMATION
As of December 31, 2013, there were approximately 33,550 holders of record of Lockheed Martin common stock and320,549,871 shares outstanding.
TRANSFER AGENT & REGISTRARComputershare Trust Company, N.A.Shareholder ServicesP.O. Box 30170College Station, TX 77842-3170Telephone: 1-877-498-8861TDD for the hearing impaired: 1-800-952-9245Internet: http://www.computershare.com/investor
DIVIDEND REINVESTMENT PLANLockheed Martin Direct Invest, our direct stock purchase and dividend reinvestment plan, provides new investorsand current stockholders with a convenient, cost-effective way to purchase Lockheed Martin common stock,increase holdings and manage the investment. For more information about Lockheed Martin Direct Invest, contactour transfer agent, Computershare Trust Company, N.A. at 1-877-498-8861, or to view plan materials online andenroll electronically, go to: www.computershare.com/investor
INDEPENDENT AUDITORSErnst & Young LLP8484 Westpark DriveMcLean, VA 22102
COMMON STOCKStock symbol: LMTListed: New York Stock Exchange (NYSE)
2013 FORM 10-KOur 2013 Form 10-K is included in this Annual Report in its entirety with the exception of certain exhibits. All ofthe exhibits may be obtained on our Investor Relations homepage at www.lockheedmartin.com/investor or byaccessing our SEC filings. In addition, stockholders may obtain a paper copy of any exhibit or a copy of theForm 10-K by writing to:
Jerome F. Kircher III — Vice President, Investor RelationsLockheed Martin CorporationInvestor Relations Department MP 2796801 Rockledge Drive, Bethesda, MD 20817
The CEO/CFO certifications required to be filed with the SEC pursuant to Section 302 and furnished to the SECpursuant to Section 906 of the Sarbanes-Oxley Act are included as Exhibits 31.1, 31.2, and 32 to our 2013Form 10-K and are included in this Annual Report. In addition, an annual CEO certification regarding compliancewith the NYSE’s Corporate Governance listing standards was submitted by our CEO and President to the NYSEon May 13, 2013.
Financial results, stock quotes, dividend news as well as other Lockheed Martin information are available bycalling the toll-free number: 1-800-568-9758. A directory of available information will be read to the caller andcertain of the information can also be received by mail, fax or E-mail. You may also reach Shareholder Servicesfor account information or Investor Relations for additional information on Lockheed Martin via the toll-freenumber: 1-877-498-8861.

Lockheed Martin Corporation6801 Rockledge DriveBethesda, MD 20817www.lockheedmartin.com
Lockheed Martin Corporation6801 Rockledge DriveBethesda, MD 20817www.lockheedmartin.com
100%
50%
The cover and insert of this report are printed on Rolland Enviro100 Print, which contains 100% post-consumer fibre, is manufactured in Canada using renewable biogas energy and is certified EcoLogo, Processed Chlorine Free and FSC® Recycled.
The Form 10-K included in this report is printed on Rolland Opaque50, which contains 50% post-consumer fibre, is manufactured in Canada using renewable biogas energy and is certified EcoLogo and FSC® Mix.
Related Documents