A POTENTIAL FIX FOR THE LEAKY STEM PIPLINE: THE DEVELOPMENT AND VALIDATION OF THE SCIID SCALE A Dissertation by MARY ELIZABETH LOCKHART Submitted to the Office of Graduate and Professional Studies of Texas A&M University in partial fulfillment of the requirements for the degree of DOCTOR OF PHILOSOPHY Chair of Committee, Oi-Man Kwok Co-Chair of Committee, Myeongsun Yoon Committee Members, Eunkyeng Baek Fuhui Tong Lei-Shih Chen Head of Department, Fuhui Tong May 2021 Major Subject: Educational Psychology Copyright 2021 Mary Elizabeth Lockhart

Welcome message from author
This document is posted to help you gain knowledge. Please leave a comment to let me know what you think about it! Share it to your friends and learn new things together.
Transcript
A POTENTIAL FIX FOR THE LEAKY STEM PIPLINE: THE DEVELOPMENT
AND VALIDATION OF THE SCIID SCALE
A Dissertation
by
MARY ELIZABETH LOCKHART
Submitted to the Office of Graduate and Professional Studies of Texas A&M University
in partial fulfillment of the requirements for the degree of
DOCTOR OF PHILOSOPHY
Chair of Committee, Oi-Man Kwok Co-Chair of Committee, Myeongsun Yoon Committee Members, Eunkyeng Baek Fuhui Tong Lei-Shih Chen Head of Department, Fuhui Tong
May 2021
Major Subject: Educational Psychology
Copyright 2021 Mary Elizabeth Lockhart
ii
ABSTRACT
Science, technology, engineering, and mathematics (STEM) influence almost
every aspect of our daily lives. However, despite the high demand for STEM
occupational talent, the STEM pipeline continues leaking, with less than one-sixth of
high school students pursuing STEM majors and only 50% of entering STEM majors
matriculating into STEM fields. Science identity has been identified as the most
powerful predictor of high school students pursuing an undergraduate STEM major.
Yet, the construct remains largely ill-defined and unexplored. The purpose of this study
was to develop the SciID Scale, a valid and reliable new instrument that measures a high
school student’s science identity. Subject experts and a small group of high school
students provided content validation for the scale. Exploratory factor analysis was used
which revealed an optimal two-factor solution, reflecting the traditional two-dimensions
of identity theory: Exploration and Commitment. Structural equation modeling,
regression analysis and contingency tables were used to confirm the convergent and
divergent validity of the instrument with external variables. Lastly, a latent class
analysis provided further validation of the scale as it yielded an optimal four-class
solution that reflected traditional identity theory statuses of: Achieved, Foreclosed,
Moratorium, and Diffused. These validation measures combined with the good
reliability scores of each factor yielded the SciID Scale a valid and reliable instrument
specifically designed for high school students.

iii
DEDICATION
To Yesu.
iv
ACKNOWLEDGEMENTS
I would like to thank Dr. Kwok whose patience, encouragement, and belief in me
have enabled this study and pushed me to continually strive to excel. My family and I
are grateful for everything you have done for us. I would also like to thank Dr. Yoon
whose IRT class was the most enjoyable class I have ever taken. Thank you for
introducing me to this world of analysis. Further thanks to Dr. Baek, Dr. Tong, and Dr.
Chen for your time and dedication to this research and to me as a student.
I would like to thank my parents, Kim and Gary Childs, for always believing in
me and supporting me. Dad, thank you for your servant-heart, for your quiet spirit, and
your willingness to drive long-distances to keep baby Luke so I could attend class. You
will never know how much that meant. Mom, thank you for always being my
cheerleader and being in my corner even when I didn’t deserve it.
To my husband, thank you for your patience and support. Bret, thank you for
being my partner in life. Thank you for your commitment to hold my hand through the
good and bad that this life brings. Thank you for the countless hours you have spent
watching the children, working two jobs, and truly giving of yourself so that we could
finish this degree. It has not gone unnoticed. We are in it together, whatever “it” is.
To my children Eli, Joshua, Luke, our little one in Heaven, and any others that
might bless my life, thank you for helping me continue to learn about the most important
job I will ever have – being Mama. My love for each of you is beyond what words can
even begin to express. I pray that nothing in this life, no success, no accomplishment,

v
nor any worldly gain will ever satisfy you until you fall into the arms of Jesus. I promise,
nothing compares.
Most of all, thank you to my Lord and Savior, Jesus Christ. You are my one
constant in life. Thank you for your unfailing love. Thank you for your constant pursuit
of my whole heart. I can never repay you for what you have done. No gift would ever
be enough. May every ounce of this be for you and your glory.
vi
CONTRIBUTORS AND FUNDING SOURCES
Contributors
This work was supervised by a dissertation committee consisting of Professor
Kwok [advisor/chair], Associate Professor Yoon [co-chair], Assistant Professor Baek
and Professor Tong of the Department of Educational Psychology and Associate
Professor Chen of the Department of Health and Kinesiology.
Funding Sources
This work, including graduate study support, was made possible in part by the
Texas A&M Triads for Transformation (T3) grants under Grant Number 1622. Its
contents are solely the responsibility of the authors and do not necessarily represent the
official views of Texas A&M University.
vii
TABLE OF CONTENTS
Page
ABSTRACT .......................................................................................................................ii
DEDICATION ................................................................................................................. iii
ACKNOWLEDGEMENTS .............................................................................................. iv
CONTRIBUTORS AND FUNDING SOURCES ............................................................. vi
TABLE OF CONTENTS .................................................................................................vii
LIST OF FIGURES ........................................................................................................... ix
LIST OF TABLES ............................................................................................................. x
CHAPTER I INTRODUCTION ........................................................................................ 1
CHAPTER II LITERATURE REVIEW ............................................................................ 5
Identity ........................................................................................................................... 5 Academic Identity .......................................................................................................... 9 Science Identity ............................................................................................................ 14
Methods .................................................................................................................... 15 Results ...................................................................................................................... 18 Discussion ................................................................................................................ 22
CHAPTER III METHODS .............................................................................................. 27
Process 1: Identify Purpose(s)/Define Construct and Theory ...................................... 27 Process 2: Test Specifications ...................................................................................... 31 Process 3: Item Development ....................................................................................... 32 Process 4: Pilot Study ................................................................................................... 35 Process 5: Reliability and Validity Studies .................................................................. 36
SciID Scale ............................................................................................................... 36 STEM CIS ................................................................................................................ 38 Science Achievement ............................................................................................... 39 Science Self-Concept ............................................................................................... 40 Academic Identity .................................................................................................... 42
Process 6: Technical Report ......................................................................................... 43
viii
CHAPTER IV RESULTS ................................................................................................ 45
Expert Panel ................................................................................................................. 45 Focus Group ................................................................................................................. 45 Pilot Study .................................................................................................................... 46 Reliability and Validity Studies ................................................................................... 57
CHAPTER V CONCLUSION ......................................................................................... 67
Discussion .................................................................................................................... 67 Implications for Future Research ................................................................................. 68 Limitations ................................................................................................................... 69 Concluding Remarks .................................................................................................... 70
REFERENCES ................................................................................................................. 72
APPENDIX A TABLE OF REVIEWED STUDIES ....................................................... 87
APPENDIX B CORRELATION MATRIX OF 31 ORIGINAL ITEMS ........................ 94
APPENDIX C SCIID SCALE ......................................................................................... 95
ix
LIST OF FIGURES
Page
Figure 1 Flowchart of Article Selection Process ............................................................. 18
Figure 2 Potential Models of Science Identity ................................................................ 30
Figure 3 SEM Illustrating Evaluation of Equivalency for Science Self-Concept and Science Identity .............................................................................................. 42
Figure 4 Academic Identity CFA (all paths significant a=.05) ....................................... 43
Figure 5 Scree Plot of 31 Items ....................................................................................... 48
Figure 6 Scree Plot of 23 Items ....................................................................................... 50
Figure 7 Bifactor Model .................................................................................................. 54
Figure 8 Scree Plot of Final Model with 16 Items .......................................................... 57
Figure 9 SEM of Science Identity with Science Achievement and STEM Career Interest (all paths significant a =.05) .............................................................. 59
Figure 10 Unconstrained SEM with Standardized Coefficients Used for Testing Divergent Validity of Science Identity and Science Self-Concept ................... 60
Figure 11 Graphical Representation of 4-Class Solution with Related Z-Score Converted Means .............................................................................................. 64
x
LIST OF TABLES
Page Table 1 Inclusion and Exclusion Criterion ...................................................................... 16
Table 2 Potential Dimensionality of Science Identity ..................................................... 31
Table 3 Descriptive Statistics .......................................................................................... 47
Table 4 Geomin Factor Correlations ............................................................................... 51
Table 5 Bi-Geomin Rotated Factor Loadings ................................................................. 52
Table 6 Bi-Geomin Factor Correlations .......................................................................... 53
Table 7 Science Identity LCA Results ............................................................................ 63
Table 8 Descriptive Statistics of 4-Class Solution .......................................................... 63
Table 9 Demographic Statistics of the 4-Classes ............................................................ 65
Table 10 AIM and SciID Scale Classifications ............................................................... 66
1
CHAPTER I
INTRODUCTION
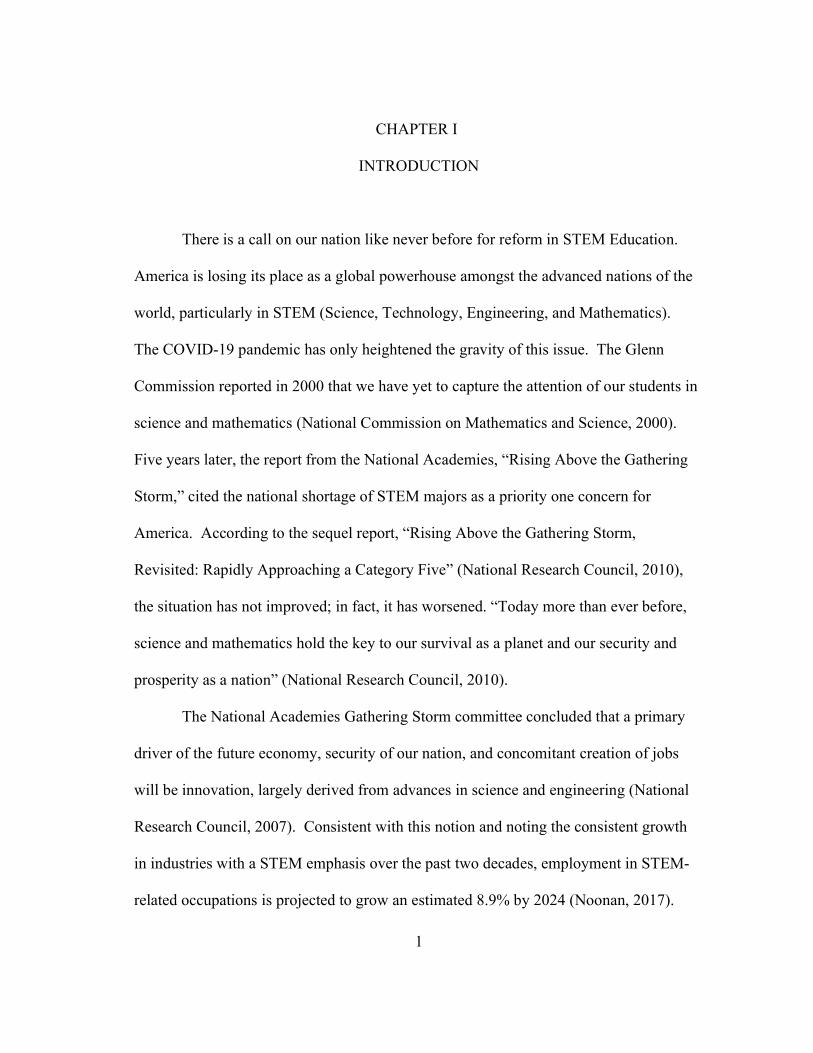
There is a call on our nation like never before for reform in STEM Education.
America is losing its place as a global powerhouse amongst the advanced nations of the
world, particularly in STEM (Science, Technology, Engineering, and Mathematics).
The COVID-19 pandemic has only heightened the gravity of this issue. The Glenn
Commission reported in 2000 that we have yet to capture the attention of our students in
science and mathematics (National Commission on Mathematics and Science, 2000).
Five years later, the report from the National Academies, “Rising Above the Gathering
Storm,” cited the national shortage of STEM majors as a priority one concern for
America. According to the sequel report, “Rising Above the Gathering Storm,
Revisited: Rapidly Approaching a Category Five” (National Research Council, 2010),
the situation has not improved; in fact, it has worsened. “Today more than ever before,
science and mathematics hold the key to our survival as a planet and our security and
prosperity as a nation” (National Research Council, 2010).
The National Academies Gathering Storm committee concluded that a primary
driver of the future economy, security of our nation, and concomitant creation of jobs
will be innovation, largely derived from advances in science and engineering (National
Research Council, 2007). Consistent with this notion and noting the consistent growth
in industries with a STEM emphasis over the past two decades, employment in STEM-
related occupations is projected to grow an estimated 8.9% by 2024 (Noonan, 2017).
2
However, despite the high demand for STEM occupational talent, the STEM pipeline
continues to leak, with less than one-sixth of high school students pursuing a STEM
major and only 50% of entering STEM majors matriculating into STEM fields (US
Department of Education, 2015). Based on these figures, one can already foresee a
substantial future shortage in the STEM workforce. The need to plug the leaky STEM
pipeline is urgent.
Researchers and educators have labored intensely over the past twenty years to
devise and implement curricular and programmatic changes within the traditional US
educational system that would increase student interest and achievement in STEM.
Growth has been seen. However, gender, racial/ethnic, and social class disparities exist
in many science degrees and fields within the United States; girls, African Americans,
Latinos, rural students, and students from lower socioeconomic (SES) backgrounds are
less likely to pursue science classes, degrees, and careers (Alegria and Branch, 2015;
Hill et al., 2018; National Science Board, 2016; Penner, 2015). Extending participation
in science is important to increase innovation and reduce social inequality (Beede et al.
2011; Holdren 2011).
Part of the methodology employed as of late in measuring the effectiveness of
STEM interventions designed to increase STEM persistence has been geared towards
documenting changes in students’ science identities. Several studies have found that
identification with context relevant identities such as “student” or “scientist” actually
provides a better prediction of academic performance and persistence than either racial
or ethnic identity (Bonous-Hammarth, 2000; Eccles & Barber, 1999; Osborne & Walker,
3
2006; Chemers et al., 2011). As noted in Hazari et al. (2018), science identity-based
frameworks have proven fruitful in studying science persistence as several studies have
shown that science identity influences science persistence (Aschbacher, Li, & Roth,
2010; Basu, 2008; Carlone & Johnson, 2007; Calabrese Barton & Yang, 2000; Chinn,
2002; Cleaves, 2005; Gilmartin, Denson, Li, Bryant, & Aschbacher, 2007; Olitsky,
2007; Shanahan, 2009). A recent analysis by Chang and colleagues (2020) applied the
machine learning approach to a large-scale national data set of high school students. The
study revealed that the students’ “science identity” was the single-best predictor of their
pursuit of STEM majors.
The notion of science identity being the greatest predictor of STEM persistence
holds extreme consequences for the future. If STEM educational interventions
effectively target the cultivation of students’ science identities, an increase in
matriculation into STEM majors and careers should subsequently result. The research
questions addressed in this study are:
1. How has science identity been defined and operationalized?
2. How is the theory behind the operationalization of the science identity
construct rooted in identity and academic identity theory?
3. What are the psychometric properties of these instruments?
4. What is the factor structure of science identity?
5. Is the newly developed SciID Scale a valid and reliable instrument?
This study consists of two primary portions that address these research questions.
Questions 1, 2 and 3 are largely answered through the investigation into the literature
4
regarding science identity and instruments that have been employed to measure this
construct. This investigation was initiated by broadly exploring the theoretical
background of science identity which includes both identity theory and academic
identity theory. The second portion of the study refers to the precise development and
validation of the SciID Scale – a new instrument developed to accurately measure a high
school student’s science identity. This portion of the study addresses research questions
4 and 5.
5
CHAPTER II
LITERATURE REVIEW
Identity
Defining identity is no simple task. For decades, identity has been defined and
interpreted in a myriad of ways (Beijaard, Meijer, & Verloop, 2004; Dugas et. al., 2018;
Fitzmaurice, 2013). In psychology, personal identity is typically defined as a cognitive
self-structure. It is through this cognitive self-structure that people seek to answer the
question ‘Who am I?’ (Erikson, 1959; Marcia, 1980; McLean & Syed, 2014; Schwartz,
Luyckx, & Vignoles, 2011). Though it is usually believed that the most drastic
developments in identity formation occur during adolescence in which the individual
experiences intense times of identity crisis, researchers commonly agree that there exists
a lifelong nature to the identity formation process (Erickson, 1959, 1963, 1968;
Fitzmaurice, 2013). Identity has been described as a learning trajectory with the goal of
integrating past experiences and future expectations with present experiences. Thus, it is
a process of forming, comprehending and reevaluating one’s values and experiences
through practice and over time (Beijaard, Verloop, & Vermunt, 2000; Dugas et. al.,
2018).
According to Erikson (1959, 1963, 1968) as described by Was et al. (2009), late
adolescence and early adulthood yield a time of crisis when individuals begin making
independent choices regarding their values, beliefs, and goals by engaging in different
options. The decisions that are made during this time result in commitments within a
6
particular identity domain. The processes that are involved in establishing an identity
and an identity status affect how an individual will cope with adversity, interact with
others, and make decisions about vocational paths and other important life options (Was
et al., 2009).
The basis of most research regarding identity was initiated by Erikson. Erickson
(1968) believed that this primary task of adolescence derives itself as the young person
begins to cope with social and developmental demands while seeking to provide
meaning to their life choices and commitments (Bosma and Kunnen 2008; Hewlett
2013; Jensen 2011; McLean and Syed 2014; Schwartz et al. 2011; Was et al., 2009).
According to Erikson (1959), this process of identity formation may result in either a
mature identity synthesis or simply lead to role confusion or crisis. Adolescents must
make important decisions in multiple identity domains, such as in their education and
within their interpersonal relationships (Albarello, Crocetti, & Rubini, 2017; Branje et al.
2014; McLean et al. 2016).
Marcia (1966), is largely credited with operationalizing Erikson’s theory
regarding identity. Marcia postulated a theory that identity formation is based on two
successive identity processes, Exploration and Commitment (Piotrowski, 2018). The
period of Exploration generally refers to an individual experiencing a time of active
questioning and consideration of various alternatives before making firm decisions
regarding their values, beliefs and/or goals that they will ultimately pursue. The period
of Commitment refers to an individual making a relatively firm decision within a
7
particular identity domain and engaging in meaningful activities that are a direct
expression of the implementation of that decision (Crocetti, Rubini & Meeus, 2008).
Marcia crossed these two identity processes with regards to their level of their
presence or absence in an individual and developed a series of four identity statuses
(Crocetti et. al, 2012). The Achieved status is characterized by individuals having made
a commitment within a specific identity domain. This follows a period of active
exploration. The Foreclosed status is defined for those who have made a commitment,
but with little to no previous exploration. The Moratorium status defines those who are
actively exploring various alternatives. These individuals have not made a commitment
yet. Lastly, the Diffused status includes individuals who have not engaged in an actual
exploration process of different alternatives, nor made a commitment (Crocetti et. al.,
2012; Crocetti, Rubinin & Meeus, 2008; Marcia, 1966; Meeus et. al., 2011;
Rahiminezhad et. al., 2011; Was et al., 2009). These statuses have been applied to
various identity domains through the years and studied in regards to their relation to
individuals attaining or not attaining an achieved status in that domain. The advantage
of Marcia’s research is that individuals can be measured and assigned to a particular
identity status that definitively represents their level of achievement/non-achievement
within the Commitment/Exploration identity process of a particular identity domain
(Meeus et. al., 2011).
More recently, a group of researchers defined a third identity process called
Reconsideration of Commitment. The Meeus-Crocetti Model focuses on the
management of commitments. It postulates that three dimensions, instead of Marcia’s
8
two dimensions, underly the identity formation process. In this model, the Commitment
and Exploration (termed In-Depth Exploration) dimensions remain somewhat consistent
to Marcia’s definitions. However, the Meeus-Crocetti Model introduces a new
dimension deemed Reconsideration of Commitment. This dimension refers to an
individual’s willingness to abandon their present commitments and search for new
commitments. Oftentimes this occurs when present commitments no longer satisfy an
individual and, thus, they begin comparing their present commitments with attainable
alternatives. This model is based upon the assumption that these three identity formation
processes are in continuous “interplay” as individuals form an identity (Albarello,
Crocetti, & Rubini, 2017; Crocetti et al., 2013; Meeus et. al., 2011; Mercer et al., 2012).
Congruent with Marcia’s two-dimensions of the identity formation process, the
three-dimension Meeus-Crocetti Model can be applied to assign individuals to specific
identity status categories. These categories differ slightly from Marcia’s. Crocetti et al.
(2008) used cluster analysis to extract five statuses from continuous measures of
commitment. These statuses include: Achievement, Foreclosure, Moratorium,
Diffusion and a new status of Searching Moratorium. Searching Moratorium represents
a combination of high commitment, high in-depth exploration, and very high
reconsideration of commitment (Crocetti et. al., 2008; Meeus et. al., 2011). This status
did not exist previously due to the introduction of the new phase, Reconsideration of
Commitment. Individuals, particularly adolescents, who fall into the Reconsideration of
Commitment status display intense commitments and explore these commitments
extensively. However, these adolescents also exhibit an active pursuit of consideration
9
of alternative commitments (Crocetti et al., 2008; Meeus et al. 2011). The focus of this
three-dimensional model is primarily on the process of managing commitments and
focuses less on the Exploration (Exploration In-Breadth) process of identity formation.
Some other main measures have been developed and are commonly used to
assess identity formation. A few of these include the Dimensions of Identity
Development Scale (DIDS; Luyckx et al., 2006, 2008) and the Identity Style Inventory
(ISI; Berzonsky, 1990). These measures are not discussed here as they have not been
used as recently nor extensively in the evaluation of academic identity.
Academic Identity
It is important to note that many studies have proposed that an adolescent can be
classified under different identity statuses depending upon which identity domain is
being examined (Archer, 1993). There have been numerous studies that support the
proposition that academic identity should be distinguished from a more general identity
(Was et. al., 2009). Notably, it is during adolescence that two critical domains of
educational/academic identity and interpersonal identity are extremely important
(Albarello, Crocetti, & Rubini, 2017; McLean et al., 2014). For the academic domain,
adolescents make important choices while they investigate their talents, interests and
potential in an area of study and are, thus, preparing themselves for their future career
(Albarello, Crocetti, & Rubini, 2017; Marcia, 1980). Within the interpersonal domain,
adolescents begin defining their personal way of relating and being in a relationship with
others (Albarello, Crocetti, & Rubini, 2017). Crocetti et al. (2008) developed the
Utrecht-Management of Identity Commitments Scale (U-MICS). This scale is
10
comprised of 26 items. Thirteen of these items refer to an adolescent’s academic identity
and the other 13 items refer to an adolescent’s interpersonal identity. These two
domains can be summed together for an overall “identity score” and determines an
individual’s identity status (Mercer et al., 2017). This measure has been widely
validated and used amongst various ethnic, gender, and age groups (Crocetti et al., 2008;
Meeus et al., 2010; Meeus et al., 2011; Mercer et al., 2017; Piotrowski, 2018). Some
relevant results from use of this measure suggest educational identity is a relatively more
“closed” domain than interpersonal identity. This is believed to be due to external
constraints that limit a student’s range of opportunities for academic identity change
(Albarello, Crocetti, & Rubini, 2017). However, interpersonal identity can be
considered an “open” domain (in which adolescents have relatively more alternatives to
explore) so they can more easily engage in commitment and reconsideration processes
(Albarello, Crocetti, & Rubini, 2017; Klimstra et al. 2010). Evidence has pointed to a
multi-faceted nature of identity development in adolescence, being both an individual
and a social process.
Was and Isaacson (2008) first proposed this notion of an academic identity.
They deemed it as constituting a “special” portion of Erickson’s (1959) “ego identity.”
They support the notion that it is a distinctive component of an individual’s identity
development (Was & Isaacson, 2008). Was and Isaacson (2008) built upon Marcia’s
(1966) definition of the identity process formation and established identity statuses.
They postulated four academic identity statuses in congruence with Marcia’s statuses:
Achieved, Foreclosed, Moratorium and Diffused. Specifically, an Achieved academic
11
identity status signifies an adolescent’s commitment to a set or series of academic values
that are formed after a period of exploration. The Foreclosed academic identity status
defines an adolescent whose commitment to their academic values is derived from
influential people in their lives, but they have not yet personalized or explored this. The
Moratorium academic identity status defines a period of time for which the adolescent is
experiencing academic uncertainty and is attempting to draw conclusions regarding their
academic goals and values. Lastly, the Diffused academic identity status refers to an
adolescent who experiences failure in exploration and commitment (Was & Isaacson,
2008; Was et al., 2009). The Academic Identity Status Measure (AIM) was, thus,
developed by Was and colleagues on the premise of these four statuses (Was et al.,
2009). AIM contains four subscales, each designed to measure an academic identity
status, and each consisting of ten items (Was & Isaacson, 2012). It was normed with a
sample of American collegiate students and has been validated in North America and
parts of Africa for use mainly with college students, but also some with secondary
students (Ireri et al., 2015).
Another measure developed by Rahiminezhad et al. (2011) also applied Marcia’s
(1966) paradigm of ego identity status to develop a 16-item academic identity scale
deemed the Academic Identity Status Scale (AISS). This four-factor model was deemed
an acceptable and reliable instrument for assessing Iranian students’ status in academic
identity (Rahiminezhad et al., 2011). This instrument is not as widely validated,
accepted nor used as Was and Isaacson’s (2008).
12
Saxton et al. (2014) formed a committee and began preparations to form a
common measurement system for STEM education. Within this measurement system,
the committee deemed it important to develop a common measure of academic identity
as this is part of a student being prepared to succeed in STEM college majors and
careers. They believed that academic identity for a student who is capable in STEM is
conceptualized as a fundamental transformation that students need to undergo in order to
be prepared for STEM majors and careers. According to Saxton et al. (2014), the team
based their measurement instrument upon the body of literature on academic motivation
and self-perceptions presented in Wigfield et al.’s (2006) article on development of
achievement motivation. They then chose four markers of academic identity that
encompass a student’s deep belief regarding themselves and their potential to enjoy and
succeed in STEM courses and eventually STEM careers (Saxton et al., 2014). These
four components included: (1) a sense of belonging in STEM; (2) perceived competence
in STEM; (3) autonomy/ownership; and (4) purpose of STEM (Saxton et al., 2014). It
should be noted that, as cited in Saxton et al. (2014) these four facets of academic
identity have been shown through Wigfield et al.’s (2006) study to be strong predictors
of students’ motivation, engagement, learning, and success in school. Though these
components certainly related heavily to academic motivation and self-perceptions, they
lack in alignment with the theoretical perspectives regarding identity, identity formation,
academic identity, academic identity formation and academic identity measurement that
have previously been discussed. No mention of Erickson nor Marcia, two founders of
13
identity theory, is made in their research. This is an interesting approach to measuring
academic identity, but is lacking in an historical theoretical perspective.
Several studies have undertaken a longitudinal and/or predictive approach to
exploring the link between student academic identity and related variables, especially the
variable of academic achievement. The AIM has been the primary measurement
instrument used in these studies. Also, the majority of these studies have taken place
with university students. In a study conducted by Was et al. (2009) regarding the
presumed link between academic achievement and academic identity, results showed
that the most important variable in the academic identity subscale in predicting academic
achievement, is academic identity diffuse. They also found that boys were more often
classified as diffused than girls were. The study documented that boys were also
assigned a Foreclosed academic identity more than girls. Reasons for this are unknown
but proposed to be due to girls attempting to explore newer and more untraditional roles
than boys (Was et al., 2009).
Furthermore, in more studies with both American and Iranian undergraduate
students, the Achieved academic identity status had the strongest predictive value on
academic achievement when compared to others statuses (Fearon, 2012; Was et al.,
2009; Was & Isaacson, 2008). It was also found that the diffused and foreclosed
academic identity statuses had negative predictive values on academic achievement
(Hejazi, Levasani & Amani, 2012). Also, the moratorium academic identity status
showed a significant, positive, predictive value for academic achievement as well
(Fearon, 2012). In another study conducted amongst secondary Kenyan students by Ireri
14
et al. (2015), researchers found that the achieved academic identity status had the
greatest and the only significant predictive value on students’ academic achievement.
The reason for this discrepancy in findings of the Kenyan study compared to the
American and Iranian study is unknown. Possible considerations are the differences in
ethnicity and/or the differences in age groups studied.
Science Identity
While identity has been extensively studied over the past 70 years and academic
identity has peaked researcher’s interest over the last decade, research regarding science
identity is scarce. Qualitative studies regarding science identity initiated around 20 years
ago (Brickhouse, Lowery, & Shultz, 2000; Brickhouse & Potter, 2001; Eisenhart &
Finkel, 1998; Hughes, 2001; Tan & Calabrese Barton, 2007). A commonly held
definition of science identity is built around Gee’s (2000) attempt to define identity
generally as the “kind of person” one is recognized as “being” in any given context,
either by oneself or with others. Gee was a linguist who attempted to provide a bridge
from the study of identity to education. Carlone and Johnson (2007) employed a
grounded theory approach that led the team to develop three interrelated “dimensions” of
science identity: Competence, Performance, and Recognition (Carlone & Johnson,
2007). The work completed by Gee (2000) and Carlone and Johnson (2007) are
commonly referenced in research regarding science identity.
The task at hand, however, is to accurately measure the construct of science
identity. Thus, three questions emerge in reviewing existing instruments used to
measure students’ science identity:
15
1. How has science identity been defined and operationalized?
2. How is the theory behind the operationalization of the science identity construct
rooted in identity and academic identity theory?
3. What are the psychometric properties of these instruments?
Methods
This part of the study instituted a systematic review process of science identity
literature as outlined by Moher et al. (2009). To effectively and comprehensively
identify and analyze instruments developed to measure science identity, a four-step
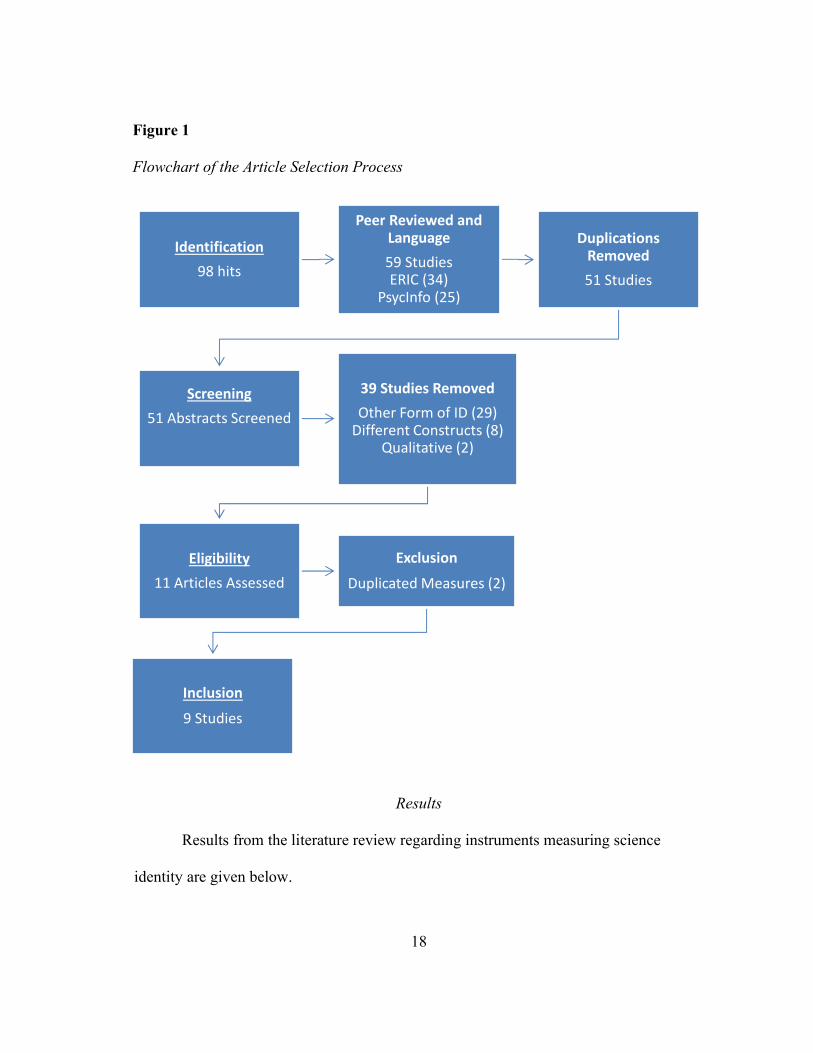
process was conducted: Identification, Screening, Eligibility, and Inclusion.
Identification
Exclusion and inclusion criterion are listed in Table 1. Given that the majority of
the instruments developed to measure science identity springboard from Gee’s (2000)
description of science identity, it was decided to begin the search in the year 2000. From
here it was decided that the studies should be peer-reviewed, quantitative studies. This
eliminated all qualitative studies. Furthermore, the instruments should focus on students
and explicitly measure students’ science identity. Thus, any studies that focused on
student “science motivation” or “science interest”, for example, and deemed this
equivalent to “science identity” without just cause were excluded. Also excluded were
instruments that focused on teacher science identity. No restrictions were placed on how
science identity was defined or operationalized. Lastly, a list of equivalent terms for
“instrument” were generated and then searched. These included: scale, measure, test,
assessment, questionnaire, and inventory.
16
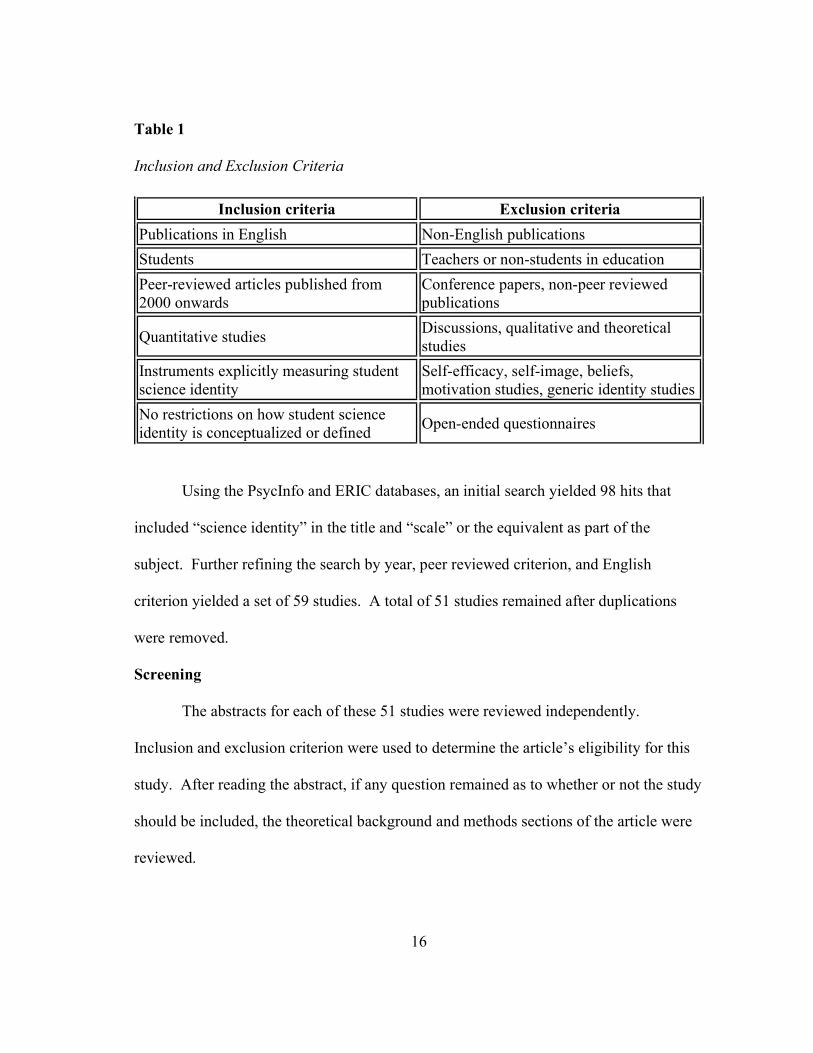
Table 1 Inclusion and Exclusion Criteria
Using the PsycInfo and ERIC databases, an initial search yielded 98 hits that
included “science identity” in the title and “scale” or the equivalent as part of the
subject. Further refining the search by year, peer reviewed criterion, and English
criterion yielded a set of 59 studies. A total of 51 studies remained after duplications
were removed.
Screening
The abstracts for each of these 51 studies were reviewed independently.
Inclusion and exclusion criterion were used to determine the article’s eligibility for this
study. After reading the abstract, if any question remained as to whether or not the study
should be included, the theoretical background and methods sections of the article were
reviewed.
Inclusion criteria Exclusion criteria
Publications in English Non-English publications
Students Teachers or non-students in education
Peer-reviewed articles published from 2000 onwards
Conference papers, non-peer reviewed publications
Quantitative studies Discussions, qualitative and theoretical studies
Instruments explicitly measuring student science identity
Self-efficacy, self-image, beliefs, motivation studies, generic identity studies
No restrictions on how student science identity is conceptualized or defined
Open-ended questionnaires
17
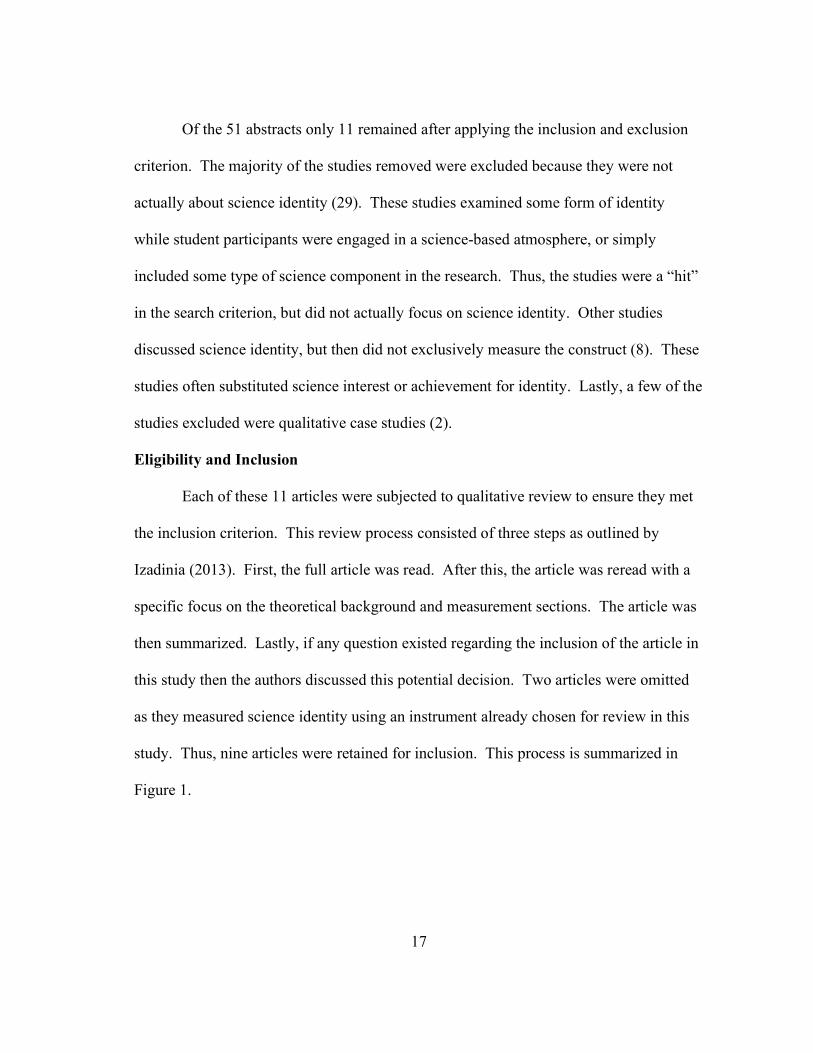
Of the 51 abstracts only 11 remained after applying the inclusion and exclusion
criterion. The majority of the studies removed were excluded because they were not
actually about science identity (29). These studies examined some form of identity
while student participants were engaged in a science-based atmosphere, or simply
included some type of science component in the research. Thus, the studies were a “hit”
in the search criterion, but did not actually focus on science identity. Other studies
discussed science identity, but then did not exclusively measure the construct (8). These
studies often substituted science interest or achievement for identity. Lastly, a few of the
studies excluded were qualitative case studies (2).
Eligibility and Inclusion
Each of these 11 articles were subjected to qualitative review to ensure they met
the inclusion criterion. This review process consisted of three steps as outlined by
Izadinia (2013). First, the full article was read. After this, the article was reread with a
specific focus on the theoretical background and measurement sections. The article was
then summarized. Lastly, if any question existed regarding the inclusion of the article in
this study then the authors discussed this potential decision. Two articles were omitted
as they measured science identity using an instrument already chosen for review in this
study. Thus, nine articles were retained for inclusion. This process is summarized in
Figure 1.
18
Results
Results from the literature review regarding instruments measuring science
identity are given below.
Identification
98 hits
Peer Reviewed and Language
59 StudiesERIC (34)
PsycInfo (25)
Duplications Removed
51 Studies
Screening
51 Abstracts Screened
39 Studies Removed
Other Form of ID (29)Different Constructs (8)
Qualitative (2)
Eligibility
11 Articles Assessed
Exclusion
Duplicated Measures (2)
Inclusion
9 Studies
Figure 1 Flowchart of the Article Selection Process
19
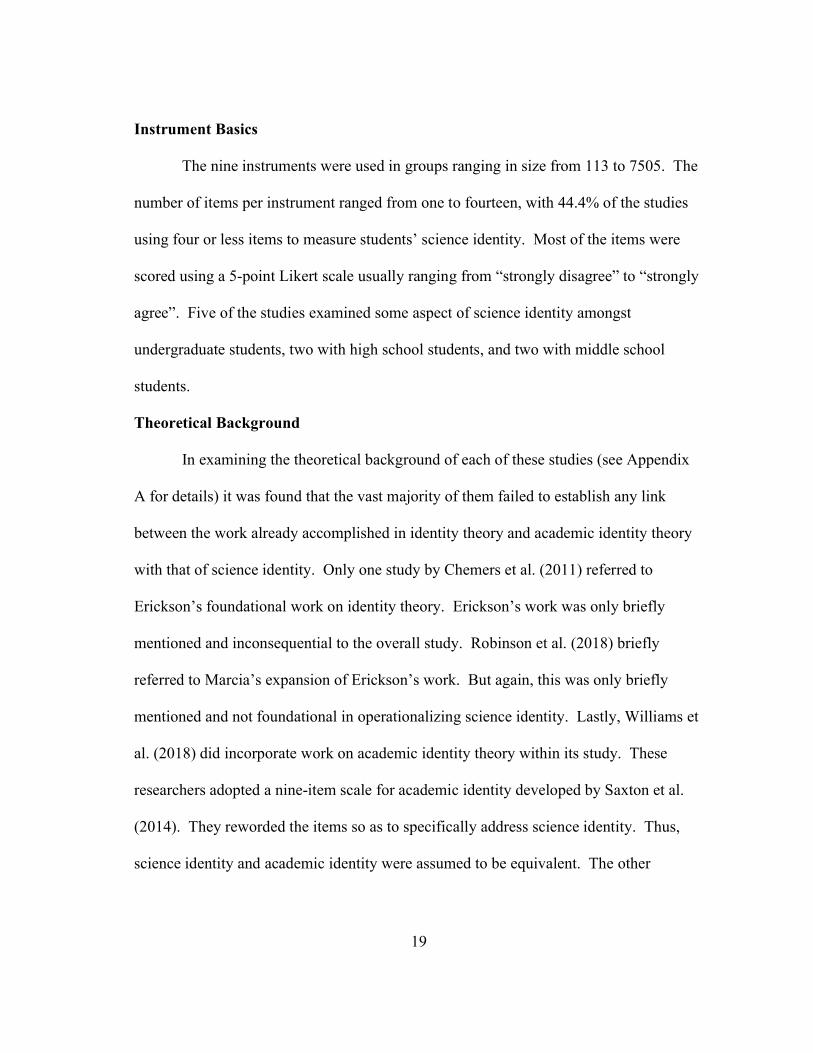
Instrument Basics
The nine instruments were used in groups ranging in size from 113 to 7505. The
number of items per instrument ranged from one to fourteen, with 44.4% of the studies
using four or less items to measure students’ science identity. Most of the items were
scored using a 5-point Likert scale usually ranging from “strongly disagree” to “strongly
agree”. Five of the studies examined some aspect of science identity amongst
undergraduate students, two with high school students, and two with middle school
students.
Theoretical Background
In examining the theoretical background of each of these studies (see Appendix
A for details) it was found that the vast majority of them failed to establish any link
between the work already accomplished in identity theory and academic identity theory
with that of science identity. Only one study by Chemers et al. (2011) referred to
Erickson’s foundational work on identity theory. Erickson’s work was only briefly
mentioned and inconsequential to the overall study. Robinson et al. (2018) briefly
referred to Marcia’s expansion of Erickson’s work. But again, this was only briefly
mentioned and not foundational in operationalizing science identity. Lastly, Williams et
al. (2018) did incorporate work on academic identity theory within its study. These
researchers adopted a nine-item scale for academic identity developed by Saxton et al.
(2014). They reworded the items so as to specifically address science identity. Thus,
science identity and academic identity were assumed to be equivalent. The other
20
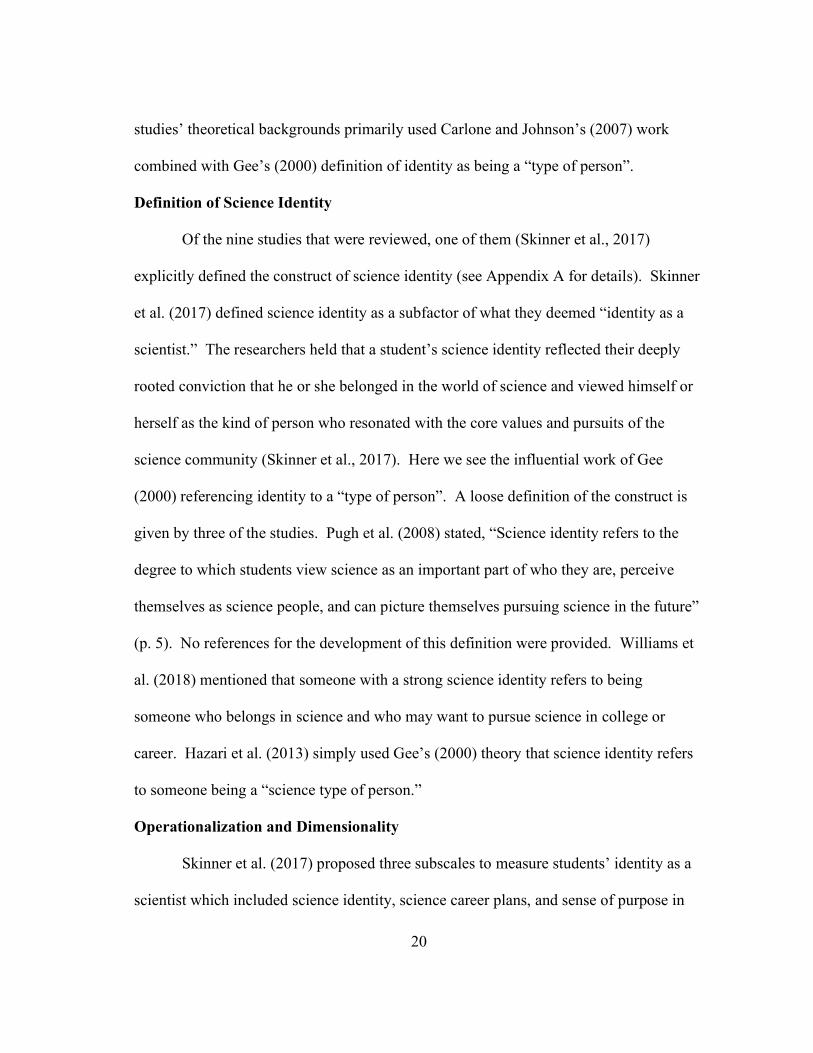
studies’ theoretical backgrounds primarily used Carlone and Johnson’s (2007) work
combined with Gee’s (2000) definition of identity as being a “type of person”.
Definition of Science Identity
Of the nine studies that were reviewed, one of them (Skinner et al., 2017)
explicitly defined the construct of science identity (see Appendix A for details). Skinner
et al. (2017) defined science identity as a subfactor of what they deemed “identity as a
scientist.” The researchers held that a student’s science identity reflected their deeply
rooted conviction that he or she belonged in the world of science and viewed himself or
herself as the kind of person who resonated with the core values and pursuits of the
science community (Skinner et al., 2017). Here we see the influential work of Gee
(2000) referencing identity to a “type of person”. A loose definition of the construct is
given by three of the studies. Pugh et al. (2008) stated, “Science identity refers to the
degree to which students view science as an important part of who they are, perceive
themselves as science people, and can picture themselves pursuing science in the future”
(p. 5). No references for the development of this definition were provided. Williams et
al. (2018) mentioned that someone with a strong science identity refers to being
someone who belongs in science and who may want to pursue science in college or
career. Hazari et al. (2013) simply used Gee’s (2000) theory that science identity refers
to someone being a “science type of person.”
Operationalization and Dimensionality
Skinner et al. (2017) proposed three subscales to measure students’ identity as a
scientist which included science identity, science career plans, and sense of purpose in
21
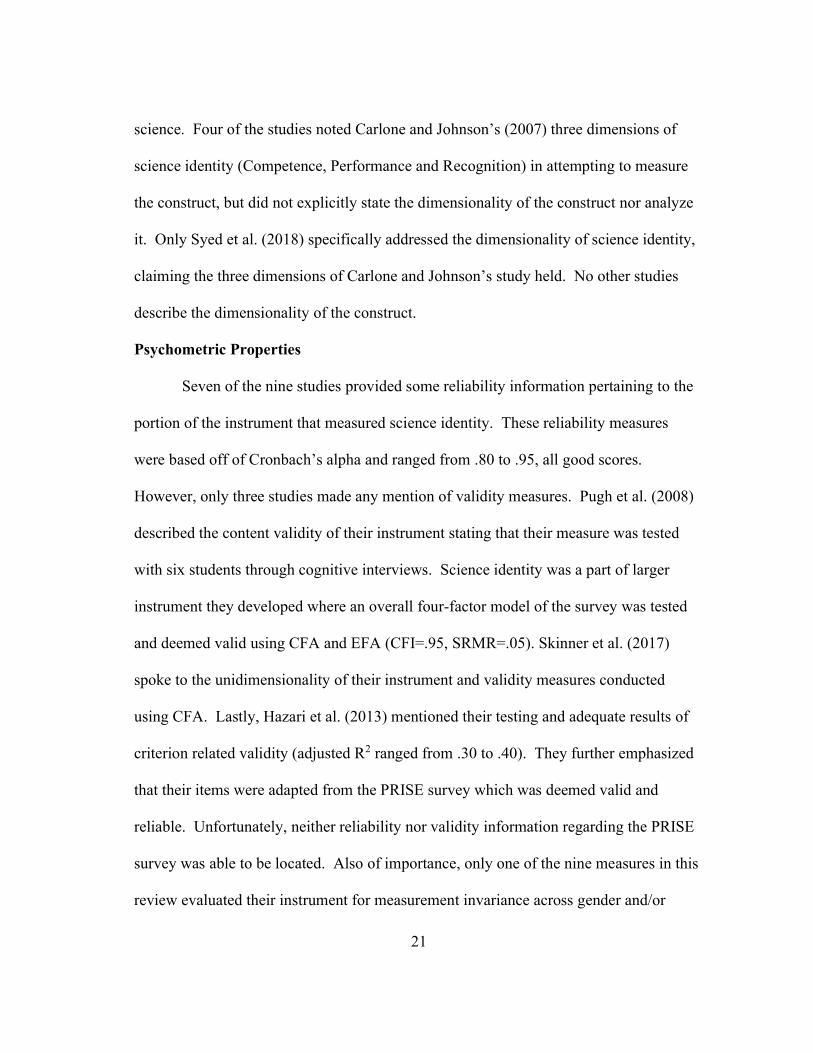
science. Four of the studies noted Carlone and Johnson’s (2007) three dimensions of
science identity (Competence, Performance and Recognition) in attempting to measure
the construct, but did not explicitly state the dimensionality of the construct nor analyze
it. Only Syed et al. (2018) specifically addressed the dimensionality of science identity,
claiming the three dimensions of Carlone and Johnson’s study held. No other studies
describe the dimensionality of the construct.
Psychometric Properties
Seven of the nine studies provided some reliability information pertaining to the
portion of the instrument that measured science identity. These reliability measures
were based off of Cronbach’s alpha and ranged from .80 to .95, all good scores.
However, only three studies made any mention of validity measures. Pugh et al. (2008)
described the content validity of their instrument stating that their measure was tested
with six students through cognitive interviews. Science identity was a part of larger
instrument they developed where an overall four-factor model of the survey was tested
and deemed valid using CFA and EFA (CFI=.95, SRMR=.05). Skinner et al. (2017)
spoke to the unidimensionality of their instrument and validity measures conducted
using CFA. Lastly, Hazari et al. (2013) mentioned their testing and adequate results of
criterion related validity (adjusted R2 ranged from .30 to .40). They further emphasized
that their items were adapted from the PRISE survey which was deemed valid and
reliable. Unfortunately, neither reliability nor validity information regarding the PRISE
survey was able to be located. Also of importance, only one of the nine measures in this
review evaluated their instrument for measurement invariance across gender and/or
22
ethnicity. Robinson et al.’s (2018) instrument showed strict measurement invariance
across these demographics.
Discussion
To the best of our knowledge, this review is the first to provide an overview of
studies that sought to quantitatively measure the construct of science identity. In this
section, we discuss the findings that emerged in response to our three research questions:
1. How has science identity been defined and operationalized?
2. How is the theory behind the operationalization of the science identity construct
rooted in identity and academic identity theory?
3. What are the psychometric properties of these instruments?
In looking to answer the first question, it is noteworthy that none of the nine
studies actually focused on defining nor operationalizing science identity. For each
instrument reviewed, science identity was merely used as a component of a larger
research investigation. The construct, including its definition and operationalization,
was not the sole focus of any of the studies. Only one study by Skinner et al. (2017)
explicitly defined science identity. Within this definition resonates Gee’s (2000) work in
connecting “identity” to the educational environment as being a “type of person.” Gee
derived an entirely new form of theory on identity that is absent of established identity
theory work conducted by Erickson and Marcia. One particular question that arises
when examining Gee’s theory is how his definition of identity referring to a “type of
person” differs from one’s self-concept. This should be noted and explored in studies
utilizing this particular definition of identity.
23
Furthermore, asking a student if they see themself as a “science kind of person”
is somewhat broad and ill-defined; it lacks in depth of knowledge on what constitutes
science identity and the process of its formation. How does a student interpret the word
“science”? Will they interpret science simply in reference to the science course they are
currently taking? Or, will they interpret science in a broader scope that spans all of the
different scientific disciplines? To a student, does being a science person reference
being a scientist in a lab, or does it also reference being an engineer, software developer,
physician, geophysicist, meteorologist, etc.? It seems necessary that to measure
students’ science identity, one must first have a solid definition of science identity that is
easily and explicitly communicated to, and understood by, the population of interest.
Furthermore, having only one of the nine studies describe the dimensionality of
the construct is also concerning. The study by Syed et al. (2018) used Carlone and
Johnson’s (2007) grounded theory of science identity that proposed three dimensions to
the construct. Yet, Carlone and Johnson’s theory, though noteworthy, also utilized
Gee’s (2000) theory that referred to being a science “kind of person”. It was not rooted
in established identity theory where the dimensionality and actual status has already
been thoroughly investigated. Additionally, only two of the studies reported any validity
information that incorporated the findings from CFA or EFA. Again, this factoid points
to the lack of evidence that this science identity has been accurately and quantitatively
defined or operationalized.
In examining the theoretical backgrounds of these nine studies, it was found that
they were absent in examining or utilizing the foundation of identity theory that was
24
established by Erickson and Marcia, or that has been built upon in more recent decades.
No mention of identity status or academic identity status was made. Gee’s (2000) theory
was foundational for most of the studies. As stated before, Gee took an entirely different
approach to defining identity that did not cite the use of already established theory and
has not been clearly distinguished from self-concept. Thus, no existing measure
evaluated in this study is rooted in established theory regarding identity and/or academic
identity.
The psychometric properties of the instruments provided by the studies included
in this research were lacking. Though the reliability of the instruments was addressed in
seven of the nine instruments and overall found to be good with measures greater than
.80, validity information regarding measures of science identity within the instruments
was scarce. Again, it should be noted that science identity was not the sole focus of any
of these studies. It was simply a variable amongst other variables being measured.
Implications for Future Research
Our findings pose several facets for future research regarding science identity.
Noting the lack of instruments that measure this construct combined with the lack of
validity information and lack of consistency between instruments, it appears that solid
research in this area is needed. To the best of our knowledge, no quantitative study has
been conducted that focuses solely on defining and operationalizing the construct of
science identity. Thus, studies seeking to explicitly define science identity and/or science
identity formation, explore its dimensionality, and conduct factor analyses of the
construct are needed.
25
Researchers seeking to define and operationalize the construct of science identity
rooted in established identity and/or academic identity theory will produce
groundbreaking results. This area of research is vastly unexplored. Further, attempting
to measure the “process” of science identity development within students as defined by
identity theory is unexplored. Given the rich body of identity theory that exists and the
potentially drastic impact measuring science identity and its development process could
have on STEM educational interventions, this is an area begging to be tapped.
Other researchers seeking to utilize Gee’s (2000) work also have areas of study
regarding science identity that are open. Again, creating a sound measure that explores
the dimensionality of the construct under Gee’s framework is needed. Also,
distinguishing science identity from science self-concept under Gee’s definition is also
an area worthy of investigation. Furthermore, refining and testing the instrument to
ensure the inclusion of items that are well defined and easily understood across the
desired population is of importance and will enhance the overall validity of the measure.
Assessing the measurement invariance of new or existing science identity
instruments is a worthy endeavor. As mentioned previously, there is a profuse gender
and ethnic gap within the STEM disciplines. Thus, researchers must take extra caution
in ensuring that instruments created to assess anything STEM related amongst students
displays measurement invariance across these groups.
Limitations
Our findings should be interpreted under their limitations. There is a risk that we
mistakenly overlooked studies or failed to acknowledge their relevance. This could have
26
happened with studies that did not meet the inclusion or exclusion criteria, or it might
have been due to search engines’ unique algorithms and ranking strategies. Though
precautions were taken to try to ensure neither of these happened, we acknowledge that
there is a chance for this occurrence.
Conclusions
In this review, we aimed to identify the manner in which science identity and/or
science identity formation has been defined and operationalized, investigate the
theoretical backgrounds leading to those definitions, and evaluate the psychometric
properties of the instruments that were available for measuring science identity. Our
review of these instruments revealed an ill-defined nature to the construct that has been
loosely operationalized and not grounded in traditional identity theory. Moreover, the
validity of most of the instruments was questionable as information regarding this
criterion was absent and/or lacking from most reviewed studies. The sound, quantitative
measurement of science identity in students is vastly unexplored.
27
CHAPTER III
METHODS
The remainder of the study focuses on the developmental process and validation
of a new instrument to measure high school students’ science identity, the SciID Scale.
Through this process, research questions 4 and 5 are addressed.
Crocker and Algina (2008) proposed a ten-step guideline for the instrument
development process that has been restructured into six processes (Baek, 2017):
Process 1: Identify Purpose(s)/Define Construct and Theory,
Process 2: Test Specifications,
Process 3: Item Development,
Process 4: Pilot Test,
Process 5: Reliability and Validity Studies, and
Process 6: Technical Report.
Process 1: Identify Purpose(s)/Define Construct and Theory
This project included a two-part literature review to aid in defining of the
construct of science identity and its underlying theory.
The first part of the literature review included an investigation into the theory
underlying the constructs of identity, academic identity, and science identity. It seemed
disjointed to investigate science identity and related measurement instruments without
first researching the overarching construct of identity and its formation. From this, the
construct of academic identity was then reviewed for its relation to identity theory and
28
its distinction from science identity. Lastly, all devised theory regarding the construct of
science identity was investigated.
After reviewing the underlying theory regarding identity, identity formation,
academic identity, and science identity, a second literature review was conducted that
included a systematic review of science identity instruments. These results were
discussed previously.
In short, science identity formation should mimic the formation of the
underlying personal identity as applied to a specific domain. Thus, the science identity
formation consists of two primary dimensions: Exploration and Commitment. The
SciID Scale was developed to accurately measure a high school student’s standing on
these two latent variables.
Exploration (or Crisis) was defined by Marcia (1966) as being a “period of
engagement in choosing amongst meaningful alternatives” (p. 551). Thus, the
Exploration dimension for the SciID Scale measured the degree to which the student has
undergone a period of investigation and choosing amongst meaningful alternatives to
science. Since “meaningful alternatives to science” is a broad base that can include
different school subjects, hobby interests, collegiate interests and career interests, this
scale was more general in nature.
Marcia (1966) further defined Commitment as being “the degree of personal
investment the individual exhibits” (p. 551). Thus, the SciID Scale measured a student’s
Commitment to science based on the degree of personal investment to science that they
exhibited. This scale was specific in nature to science.
29
It follows that a student’s science identity is the measure to which that student
has experienced a time of exploration of meaningful alternatives to science and has
decisively chosen to commit themselves to science. It is through an individual’s
standing of high or low on these two dimensions that they should be able to be classified
into one of four science identity statuses: Achieved, Foreclosed, Moratorium, or
Diffused. This classification will be critical for further study of science identity
formation and cultivation within students.
An important distinction was made between the constructs of academic identity
and science identity. Was science identity a subset of academic identity; thus, being
capable of being accurately measured by a sound academic identity instrument or
capable of predicting academic identity with precision? Consider the following two
models provided in Figure 2:
30
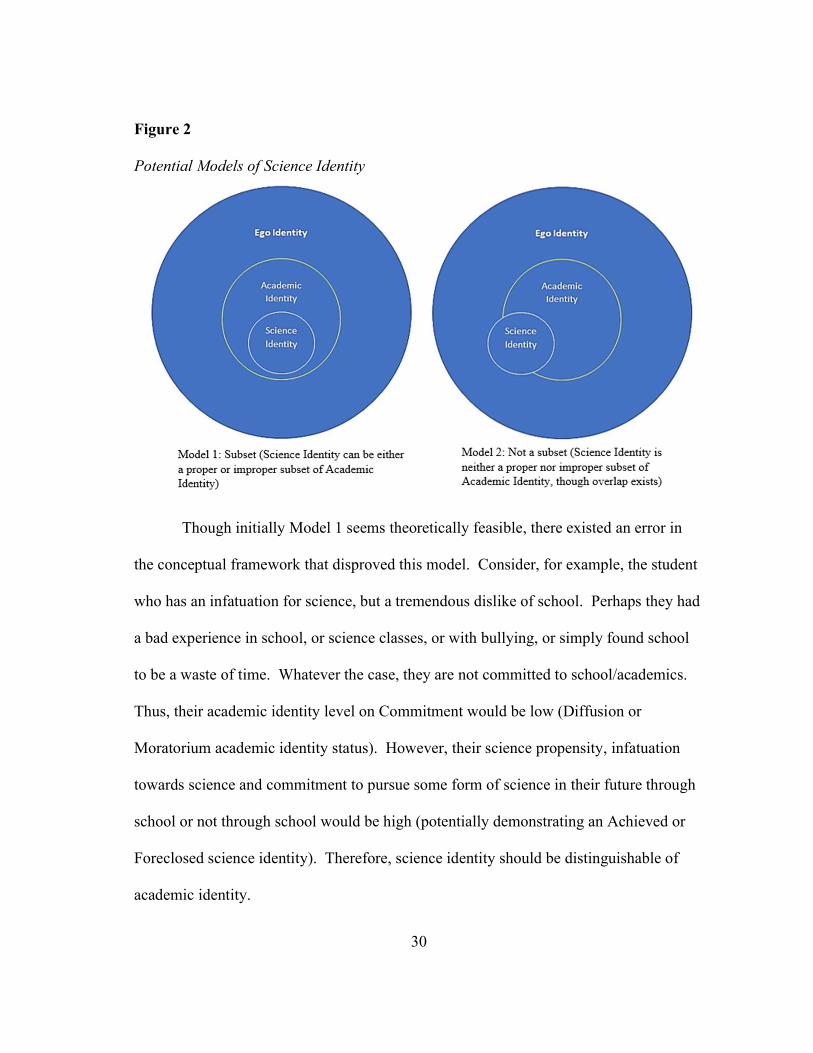
Figure 2 Potential Models of Science Identity
Though initially Model 1 seems theoretically feasible, there existed an error in
the conceptual framework that disproved this model. Consider, for example, the student
who has an infatuation for science, but a tremendous dislike of school. Perhaps they had
a bad experience in school, or science classes, or with bullying, or simply found school
to be a waste of time. Whatever the case, they are not committed to school/academics.
Thus, their academic identity level on Commitment would be low (Diffusion or
Moratorium academic identity status). However, their science propensity, infatuation
towards science and commitment to pursue some form of science in their future through
school or not through school would be high (potentially demonstrating an Achieved or
Foreclosed science identity). Therefore, science identity should be distinguishable of
academic identity.
31
Process 2: Test Specifications
Through the combination of an examination of the literature regarding identity
theory and the grounded theory research in science identity provided by Carlone and
Johnson (2007), it was determined that science identity formation was likely a two-
dimensional construct. However, the Commitment dimension could, potentially, be
represented through a bifactor structure as outlined below in Table 2.
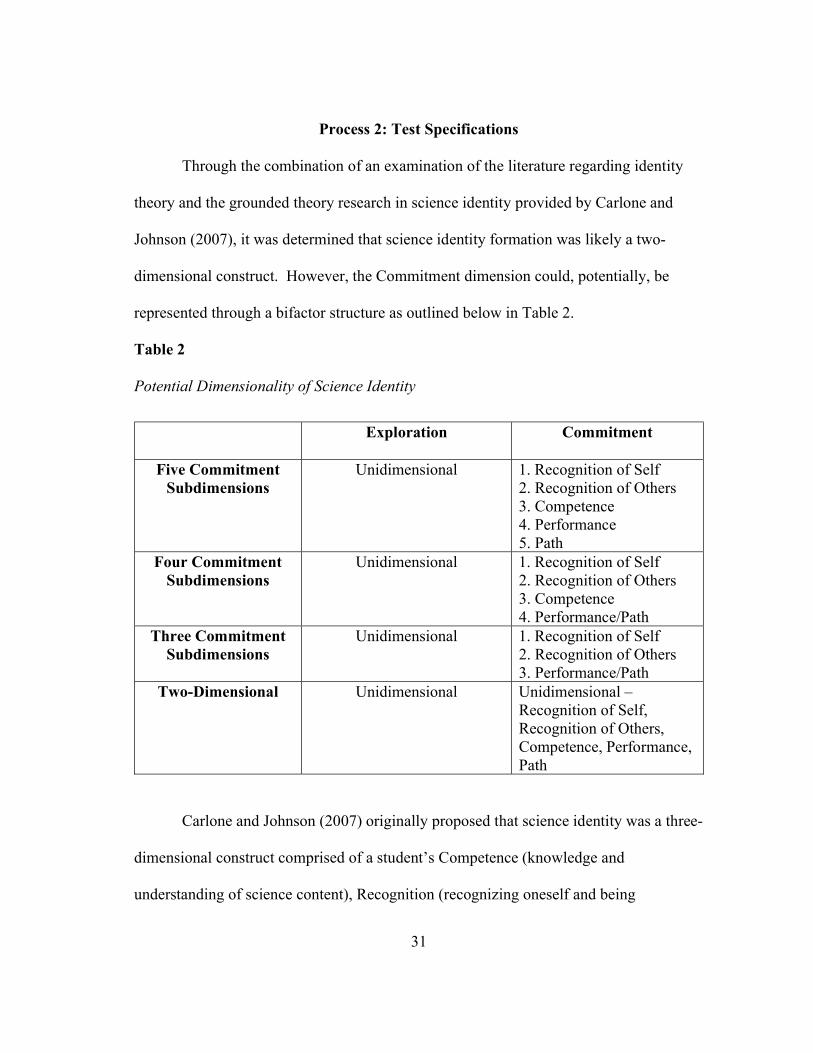
Table 2 Potential Dimensionality of Science Identity
Carlone and Johnson (2007) originally proposed that science identity was a three-
dimensional construct comprised of a student’s Competence (knowledge and
understanding of science content), Recognition (recognizing oneself and being
Exploration Commitment
Five Commitment Subdimensions
Unidimensional 1. Recognition of Self 2. Recognition of Others 3. Competence 4. Performance 5. Path
Four Commitment Subdimensions
Unidimensional 1. Recognition of Self 2. Recognition of Others 3. Competence 4. Performance/Path
Three Commitment Subdimensions
Unidimensional 1. Recognition of Self 2. Recognition of Others 3. Performance/Path
Two-Dimensional Unidimensional Unidimensional – Recognition of Self, Recognition of Others, Competence, Performance, Path
32
recognized by others as a “science person”), and Performance (social performances of
relevant scientific knowledge). They later discovered that the Recognition component of
the science identity was most important and diverged into two dimensions: Recognition
of Self as being a science person and Recognition by Others as being a science person.
These Recognition dimensions were believed to be critical for the development of a
strong science identity for women in the sciences. As this concept was investigated, it
was discovered that Carlone and Johnson’s grounded theory of science identity largely
represented a student’s Commitment to science but neglected to reflect them having
experienced a period of Exploration. Thus, it is conceivable that the Commitment
dimension of the SciID Scale could itself include between three and four subdimensions
based upon Carlone and Johnson’s (2007) theory. Furthermore, a high school student
who is committed to science should have a path or plan for their future in science. Thus,
a potential fifth subdimension for Commitment could exist. This path or plan a student
has for their future could likely overlap with their performances. Thus, these
subdimensions could be combined. These potential five subdimensions could be
classified individually, but could also be examined as a whole; thus, a bifactor model
would be of consideration for investigation here.
Process 3: Item Development
Given that no true measure of science identity existed that was foundationally
based upon identity theory, an entirely original item bank was developed to accurately
reflect the dimensions of Exploration and Commitment. The SciID Scale was measured
on a 5-point Likert scale ranging from “Strongly Disagree” (1) to “Strongly Agree” (5).
33
A series of 14 items was initially developed to represent a student’s standing on
the Exploration dimension. These items included questions about a student’s level of
exploration of activities and subjects in high school, to their exploration of college
majors (or certificates) and even careers. Each question was developed based upon the
definition of Exploration as provided by Marcia (1966) and reflected a student having
undergone a period of engagement in searching out meaningful alternatives to science.
The Commitment Scale originally included 20 questions. These questions were
developed to represent the five aspects of Competence (20%), Self-Recognition (30%),
Others-Recognition (15%), Performance (20%) and Path (15%). Each question reflected
a student’s degree of personal investment exhibited to science through the framework of
the subdimensions.
An expert panel was convened that included three members: A STEM
Curriculum Specialist (Ph.D.), a Master-Science High School Teacher (M.S.), and a
High School Science Teacher/Science Department Head (B.S.). A fourth expert
unexpectedly had to withdraw from the study. Consent was gathered from each panel
member to participate in the study. Members were allowed to exit at any point.
Members who completed the study were provided with a $100 gift card for their work.
Panel members were asked to discuss the definitions of Exploration and Commitment
provided by Marcia (1966). They were then asked to describe in detail a student who
was committed to science. From this, discussions were held regarding the potential
underlying framework of the Commitment scale and further development/refinement of
potential subdimensions. Panel members were asked to rank order the top three and
34
bottom three questions per each of the Exploration and Commitment scales that most
accurately or inaccurately reflected the definition of those scales. Items were thoroughly
discussed and deliberated. Item rankings were discussed.
After the conclusion of the expert panel discussion, revisions were made to the
SciID Scale. Following this, a group of eight high school students was convened to
serve as a focus group. District approval, parental consent and student assent were
collected before the group was convened. Students were selected based upon the
recommendation of a teacher. They were invited to participate in the focus group but
given the option not to participate. They were provided with a $50 gift card if they
chose to participate. All eight students chose to participate. Of the students, 25% were
minority, 37.5% would be first-generation college students, 87.5% were advanced
students, 75% were juniors, 12.5% were sophomores, and 12.5% were seniors. Juniors
were largely the target of this focus group as the preliminary High School Longitudinal
Study of 2009 (HSLS:09) data which provided the framework for this study was based
upon juniors. Advanced students were largely selected for the focus group as it was
believed that these students would be more likely to demonstrate a stronger science
identity and could assist in the further development/refinement of the construct.
Students were asked to engage in a descriptive analysis of each item, as they described
what was understandable and relatable to the majority of high school students and what
was not. Students were also asked to rank items as to their representation of the
construct and relatability to high school students. Item refinement and development
continued from this.
35
Process 4: Pilot Study
Caldwell ISD is a rural school district in southeast Texas. Approximately 38%
of its students are “at risk” with 57% of the student body being economically
disadvantaged. With approximately 49% Caucasian, 38% Hispanic, and 10% African
American, Caldwell ISD boasts almost equivalent majority-minority proportions.
Due to the rise of Covid-19 concerns, all pilot study measures were performed
via electronic means. With the help of Caldwell High School administerial staff, all
Caldwell High School students (n≈450) were provided an opportunity to participate in
the online SciID Scale survey. An email advertising the survey and the study along with
a link to the survey was drafted and distributed to all high school students through the
administerial staff. A “Remind” text was also sent to all students providing them the
URL for the survey. The beginning of the survey included an advertisement video,
opportunity for a virtual meeting with project personnel, parental consent forms, student
assent forms and signature blocks. To proceed to the actual SciID Scale, all of the above
had to be successfully completed. Students were allowed to withdraw from the study at
any time simply by exiting the survey. Students who successfully completed the survey
(answered all questions appropriately) were provided with a $10 e-gift card for their
participation. A total of 303 students connected to the survey URL, with only 169 of
these students completing more than 33% of the survey. Of the 134 students who did
not complete more than 33% of the survey, the majority of them completed less than 5%
of the survey. Thus, these students exited the survey before consent/assent signatures
were attained. After cleaning the data, n=156 usable surveys were retained with only
36
one survey having any missing data. Of the retained students, the following
demographics were represented:
63% female
58% Caucasian
46% economically disadvantaged
38% potential first-generation college students
54% Pre AP/AP
24% in 9th grade
24% in 10th grade
26% in 11th grade, and
26% in 12th grade.
Due to the novelty of the Covid-19 situation, the survey remained open for one-
month; allowing ample opportunity for participation. Students were blocked from
ballot-stuffing, but were allowed a seven-day period of time to return to their saved
survey to complete it. Student progress was recorded.
Process 5: Reliability and Validity Studies
SciID Scale
Items were initially reviewed based upon descriptive statistics. Individual items
demonstrating extreme low or high averages were considered for removal or revision
along with items demonstrating excessive non-normality (±6 for skewness and ±2 for
kurtosis). Stata 16 was used for evaluation of descriptive statistics, correlational studies,
regression analyses and chi-square contingency analyses. Mplus 8.4 was used for all
37
exploratory, confirmatory, path and latent class analyses. Maximum Likelihood Robust
(MLR) estimation method was used for appropriate analyses due to the slight non-
normality of a few items, small sample size and the handling of one survey with minimal
missing data.
Exploratory factor analysis (EFA) was implemented to investigate the internal
structure of the SciID scale. Though research regarding identity and academic identity
pointed to a two-dimensional construct, no true research regarding the exploration of the
dimensionality of science identity had been conducted. Thus, it was important to
explore the factor structure of the construct, including an exploration of a potential
bifactor structure for the Commitment scale.
Acknowledging the likely covariance between the Exploration and Commitment
dimensions, the Geomin oblique rotation method, the default rotation method for Mplus,
was used. A Scree Plot was examined for initial consideration of factor retention. The
significance of each item to each factor was investigated. The Chi-Square Test for
modal fit, RMSEA, SRMR and CFI global indicators were evaluated. Respective values
less than .08 for RMSEA and SRMR and greater than .90 for CFI indicate an adequate
model fit (Hu & Bentler, 1999). The optimal solution for a 2-dimensional
Commitment/Exploration construct model was compared to the optimal solution of an
overall 2-dimensional Exploration/Commitment model with a bifactor structure for the
Commitment dimension. Structural Equation Modeling (SEM) was used for model
validation with external measures. The Chi-Square Test for modal fit, RMSEA, SRMR
38
and CFI global indicators were evaluated. Furthermore, the significance of each
individual path was tested at the a=.05 significance level.
The variance between the Exploration and Commitment dimensions for the 2-
factor model was constrained to be one and then tested for model fit and compared to the
unconstrained model. This tested the discriminant validity of whether these are indeed
two different factors or not. The reliability of each dimension of the SciID Scale was
calculated using Cronbach’s alpha.
For a further check of the validity of the SciID Scale, a latent class analysis was
conducted. From prior research regarding identity theory, it was found that four latent
classes emerged due to an individual’s classification of high or low on the Exploration
and Commitment scales. Thus, a four-class solution for the SciID Scale was also
expected. Class solutions were examined based upon AIC, BIC, SABIC, VLMR test,
ALMR test, BLRT values, class size and entropy. Since BLRT has shown to be more
accurate than VLMR in identifying the optimal number of classes, it was given more
attention (Nylund et al., 2007). Since the sample size was small, results were not
expected to be optimal. However, the data was expected to demonstrate strong potential
for an optimal four-class solution.
STEM-CIS
The STEM-Career Interest Survey (STEM-CIS) was used to measure changes in
students’ interest in STEM subjects and careers (Kier et al., 2014). It was based upon
the social cognitive career theory with subscales in science, technology, engineering, and
mathematics. Rated on a 5-point Likert scale, the 44-item survey was tested with over
39
1,000 students who primarily resided in rural, high-poverty districts in the southeastern
USA. Confirmatory factor analyses indicated that the STEM-CIS was a strong, single
factor instrument and also had four strong, discipline-specific subscales, which allow for
the science, technology, engineering, and mathematics subscales to be administered
separately or together. The science subscale was used for convergent validity purposes
with the Commitment dimension of the SciID Scale. A composite score was produced
based upon the 11 items. Measurement error was accounted for by regressing the
composite score on the underlying latent factor, Science Career Interest, where the error
variance was fixed to the product of the observed score variance (.56) and one minus the
sample reliability (1 - .8713). A strong, positive relationship was expected between the
Science Career Interest Latent Factor and the Commitment factor of the SciID Scale.
Science Achievement
Research regarding academic identity has noted significant correlations between
academic identity status and academic achievement. Moreover, there has existed a
predictive nature of the different academic identity statuses on academic achievement
that have been well documented (Fearon, 2012; Was et al., 2009; Was & Isaacson, 2008;
Hejazi, Levasani & Amani, 2012; Klimstra et al., 2012; Lounsbury et al., 2005). Though
science identity was not conjectured to be a subset (rather proper or improper) of
academic identity, there was believed to be a portion of it that was relatable to academic
identity. It seemed sensible to conjecture that a student’s science identity status, or even
more simply their level of science Commitment, was correlated to their science
achievement and/or predictive of their science achievement. Thus, students’ science
40
achievement was measured as a weighted variable based upon students’ academic
success in science and the rigor of the science courses they pursued. The variable was
measured on an 11-point scale where scores of 0-9 represented their average science
grades (9:95+, 8:90-94,7:85-89, and so on) and a 2-point increase was given to those in
advanced science courses. Thus, a score of 11 represented a student averaging marks of
95+ in advanced science courses. Science Commitment was expected to be a positive,
significant predictor of science achievement.
Science Self-Concept
Researchers, at times, have suggested the equivalency and, thus, interchangeable
nature of the constructs of self-concept and identity (Archer, 1993; Was et al., 2009).
Self-concept refers to one’s view of themself while identity refers to the degree of
Exploration and Commitment an individual has experienced within particular identity
domains. Gee’s (2000) conjecture of identity applied to educational domains as being a
“kind of person” aided this confusion. Gee’s definition diverged from traditional
identity theory. Moreover, several studies that alluded to science identity based their
operationalization of science identity on Gee’s theory and constituted this construct as
being a student’s view of themself as a “science kind of person” (Hill et al., 2018;
Skinner et al., 2017; National Center for Education Statistics, 2015). In reviewing this
operationalization, it was determined that this science self-concept reflected a student’s
“recognition of themselves” as being a science person. Thus, it constituted a portion of
their Commitment to science and mimics Carlone and Johnson’s (2007) self-recognition
dimension of science identity. Differences were expected to exist, however, between a
41
student’s Commitment to science and their science self-concept. Their Commitment to
science should be quite more extensive. Thus, the discriminant validity between these
two constructs was analyzed as outlined in Figure 3. This was evaluated by first
including the variable “I view myself as a science kind of person” in the Commitment
dimension of the SciID Scale. Paths between this variable and student Science Career
Interest (𝛽 ) and student Science Achievement (𝛽 ) were freely estimated and then
constrained to be equal to the corresponding paths from student Commitment to student
Science Career Interest (𝛽∗) and student Science Achievement (𝛽∗). Using the Satorra-
Bentler correction, a Chi-Square Difference Test was performed to determine if indeed
being a “science kind of person” was equivalent to being Committed to science.
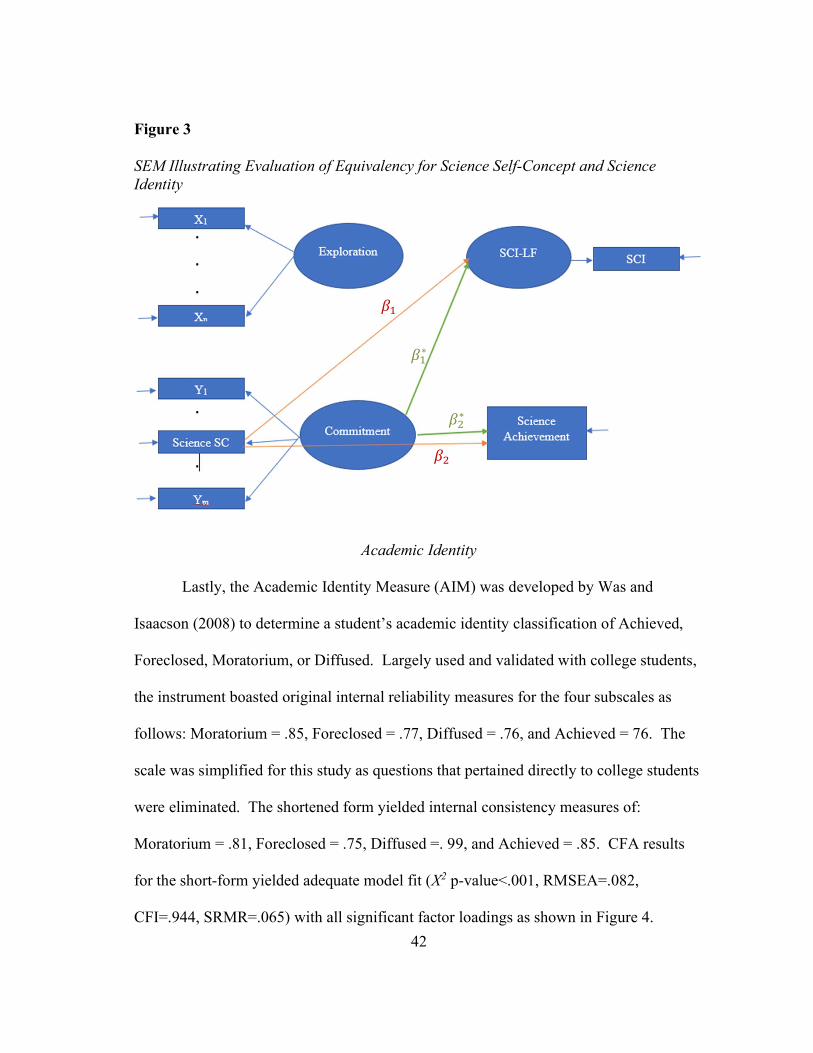
42
Figure 3 SEM Illustrating Evaluation of Equivalency for Science Self-Concept and Science Identity
Academic Identity
Lastly, the Academic Identity Measure (AIM) was developed by Was and
Isaacson (2008) to determine a student’s academic identity classification of Achieved,
Foreclosed, Moratorium, or Diffused. Largely used and validated with college students,
the instrument boasted original internal reliability measures for the four subscales as
follows: Moratorium = .85, Foreclosed = .77, Diffused = .76, and Achieved = 76. The
scale was simplified for this study as questions that pertained directly to college students
were eliminated. The shortened form yielded internal consistency measures of:
Moratorium = .81, Foreclosed = .75, Diffused =. 99, and Achieved = .85. CFA results
for the short-form yielded adequate model fit (X2 p-value<.001, RMSEA=.082,
CFI=.944, SRMR=.065) with all significant factor loadings as shown in Figure 4.
𝛽
𝛽∗
𝛽
𝛽∗
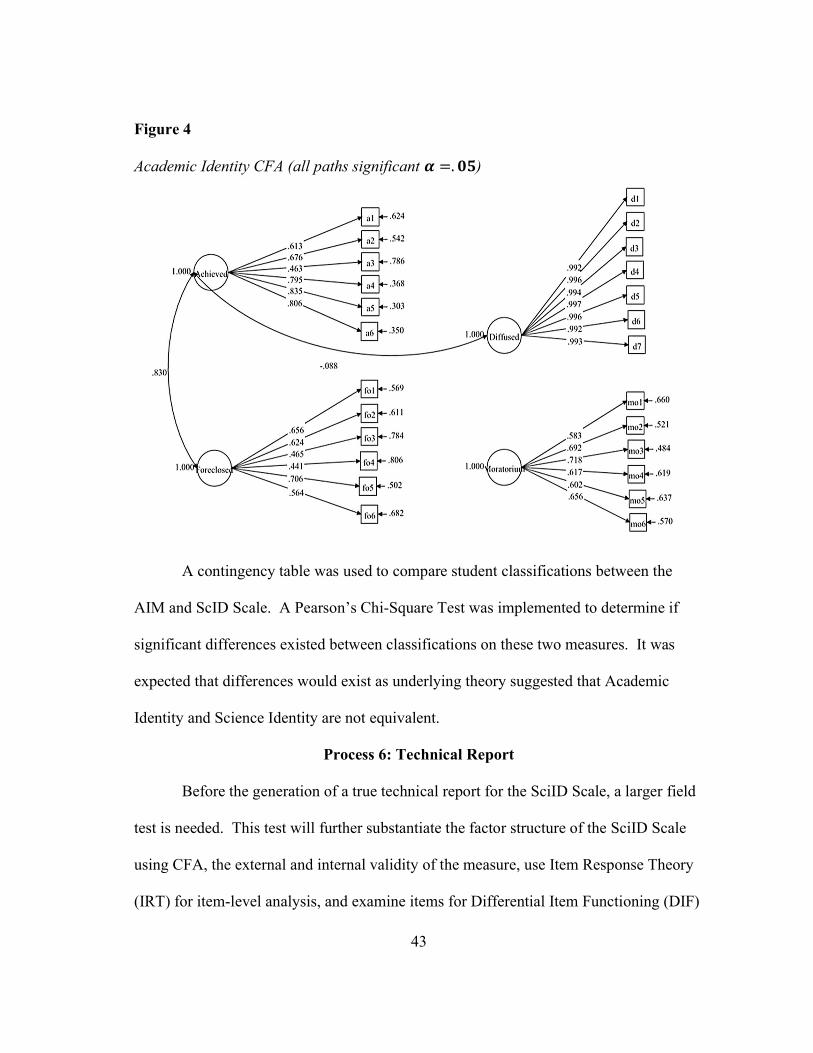
43
Figure 4 Academic Identity CFA (all paths significant 𝜶 =. 𝟎𝟓)
A contingency table was used to compare student classifications between the
AIM and ScID Scale. A Pearson’s Chi-Square Test was implemented to determine if
significant differences existed between classifications on these two measures. It was
expected that differences would exist as underlying theory suggested that Academic
Identity and Science Identity are not equivalent.
Process 6: Technical Report
Before the generation of a true technical report for the SciID Scale, a larger field
test is needed. This test will further substantiate the factor structure of the SciID Scale
using CFA, the external and internal validity of the measure, use Item Response Theory
(IRT) for item-level analysis, and examine items for Differential Item Functioning (DIF)

44
corresponding to measurement invariance on the item-level of the overall instrument.
This will be part of a future study.
45
CHAPTER IV
RESULTS
Expert Panel
An original set of 34 items was initially developed (14 for Exploration and 20
items for Commitment). Expert Panel members were asked to characterize a student
who was “committed” to science. They were then asked to group these characteristics.
After this, Experts compared their groupings to those developed by the research team
which included Carlone and Johnson’s theory (2007). From this, came the five potential
groupings of Recognition of Self, Recognition of Others, Competence, Performance and
Path. It was believed that each of these reflected an aspect of a high school student’s
Commitment to science.
The 34 items were then reviewed. Three of the Exploration questions and five of
the Commitment questions were refined in an effort to clarify their specific meaning.
An additional three items were comprised for the Commitment scale to represent a
student’s interest in current events and real-life uses of science as it was believed that
this was an important component to their level of Commitment. One item was
recommended for deletion but was retained for the focus group.
Focus Group
Focus group members convened to take the extensive survey which included
external measures used for validation purposes. Completion time averaged 16 minutes.
Student behavior was monitored during the survey so as to identify problematic
46
questions. The eight high school students who formed the Focus Group recommended
the deletion of three items on the SciID Scale due to wording problems. One of these
items had also been recommended for deletion by the Expert Panel. Each of these three
items was deleted. Further revisions of wording were made to several questions so as to
more accurately reflect a high school student’s interpretation of those questions.
After the conclusion of the Expert Panel and Focus Group, 14 Exploration items
and 20 Commitment items resulted, including three new Commitment items and 10 total
revised items. These were used for the pilot study.
Pilot Study
Descriptive statistics were analyzed for each of the 34 questions on the 156
retained surveys. Three Exploration items were immediately removed due to excessive
non-normality resulting from high means and low variability, insinuating low
discrimination of the items. Descriptive statistics of the remaining 31 items are provided
in Table 3.
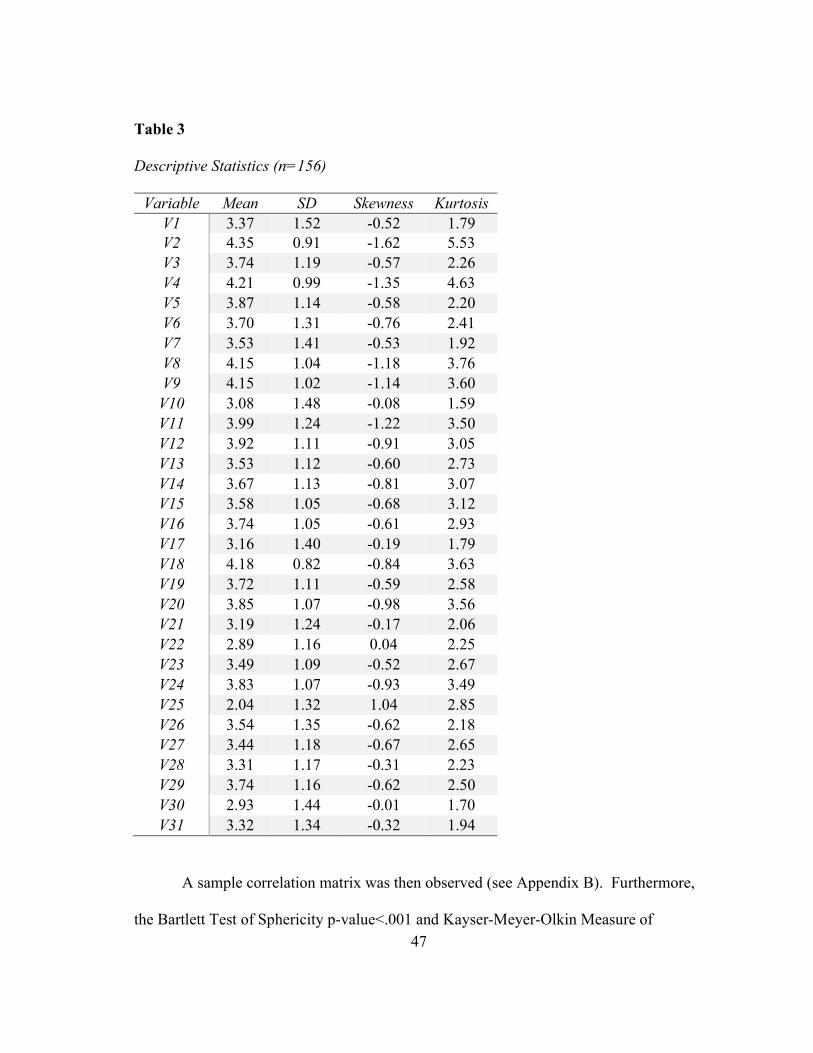
47
Table 3 Descriptive Statistics (n=156)
Variable Mean SD Skewness Kurtosis V1 3.37 1.52 -0.52 1.79 V2 4.35 0.91 -1.62 5.53 V3 3.74 1.19 -0.57 2.26 V4 4.21 0.99 -1.35 4.63 V5 3.87 1.14 -0.58 2.20 V6 3.70 1.31 -0.76 2.41 V7 3.53 1.41 -0.53 1.92 V8 4.15 1.04 -1.18 3.76 V9 4.15 1.02 -1.14 3.60
V10 3.08 1.48 -0.08 1.59 V11 3.99 1.24 -1.22 3.50 V12 3.92 1.11 -0.91 3.05 V13 3.53 1.12 -0.60 2.73 V14 3.67 1.13 -0.81 3.07 V15 3.58 1.05 -0.68 3.12 V16 3.74 1.05 -0.61 2.93 V17 3.16 1.40 -0.19 1.79 V18 4.18 0.82 -0.84 3.63 V19 3.72 1.11 -0.59 2.58 V20 3.85 1.07 -0.98 3.56 V21 3.19 1.24 -0.17 2.06 V22 2.89 1.16 0.04 2.25 V23 3.49 1.09 -0.52 2.67 V24 3.83 1.07 -0.93 3.49 V25 2.04 1.32 1.04 2.85 V26 3.54 1.35 -0.62 2.18 V27 3.44 1.18 -0.67 2.65 V28 3.31 1.17 -0.31 2.23 V29 3.74 1.16 -0.62 2.50 V30 2.93 1.44 -0.01 1.70 V31 3.32 1.34 -0.32 1.94
A sample correlation matrix was then observed (see Appendix B). Furthermore,
the Bartlett Test of Sphericity p-value<.001 and Kayser-Meyer-Olkin Measure of
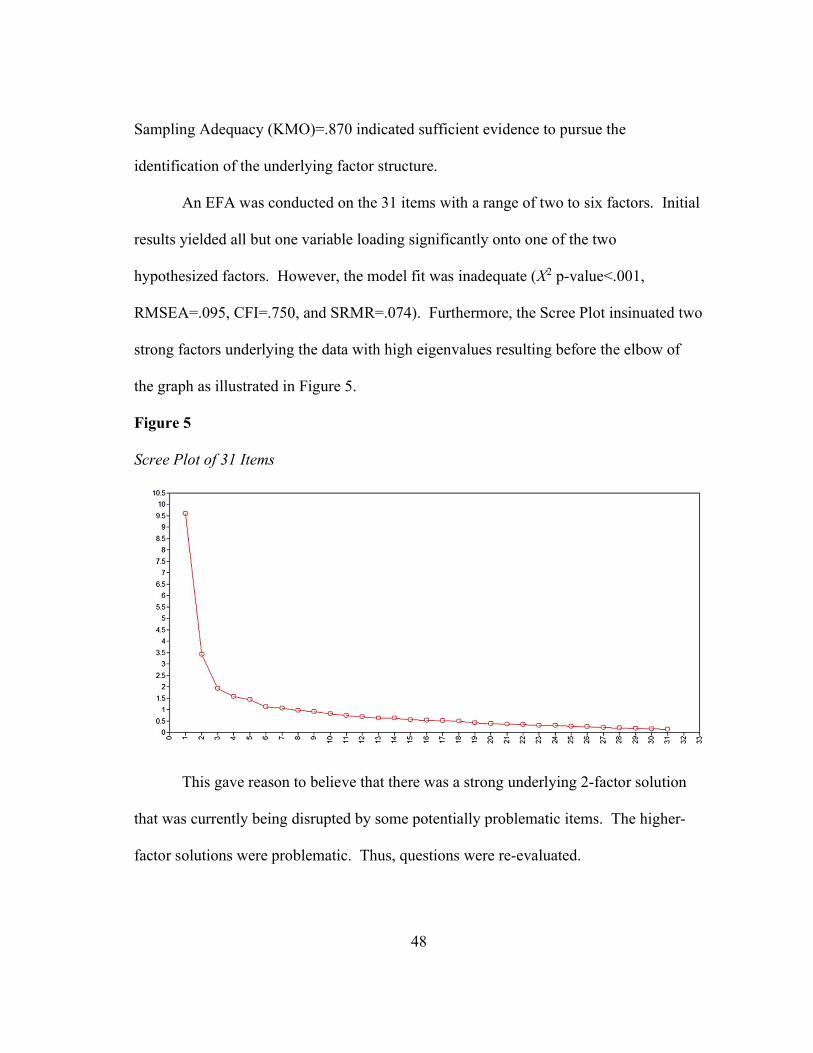
48
Sampling Adequacy (KMO)=.870 indicated sufficient evidence to pursue the
identification of the underlying factor structure.
An EFA was conducted on the 31 items with a range of two to six factors. Initial
results yielded all but one variable loading significantly onto one of the two
hypothesized factors. However, the model fit was inadequate (X2 p-value<.001,
RMSEA=.095, CFI=.750, and SRMR=.074). Furthermore, the Scree Plot insinuated two
strong factors underlying the data with high eigenvalues resulting before the elbow of
the graph as illustrated in Figure 5.
Figure 5 Scree Plot of 31 Items
This gave reason to believe that there was a strong underlying 2-factor solution
that was currently being disrupted by some potentially problematic items. The higher-
factor solutions were problematic. Thus, questions were re-evaluated.
49
Upon re-examination of items, it was discovered that three of the Exploration
items were written in present-tense (ex. “I don't like to spend time thinking about my
future.”) while the remaining eight items were written in past tense (ex. “I have thought
about what major (or certificate) I want to pursue in college.”). This was deemed
problematic. Thus, these three items along with the item that had an insignificant
loading were removed. A total of seven items remained for evaluation of Exploration.
For the evaluation of Commitment, four items were initially deemed as problematic due
to poor fit and significant cross-loadings. These items were deleted.
A new EFA varying from one to six factors was conducted using the seven
Exploration items and 16 Commitment items. Initial results yielded Bartlett’s Test of
Sphericity p-value<.001 and KMO=.883, indicating sufficient results to pursue the
identification of the underlying factor structure. Results were again mixed, but pointed
to a strong 2-factor solution underlying the model. The Scree Plot given in Figure 6
showed these two factors as being stronger than the others and occurring before the
elbow of the graph.
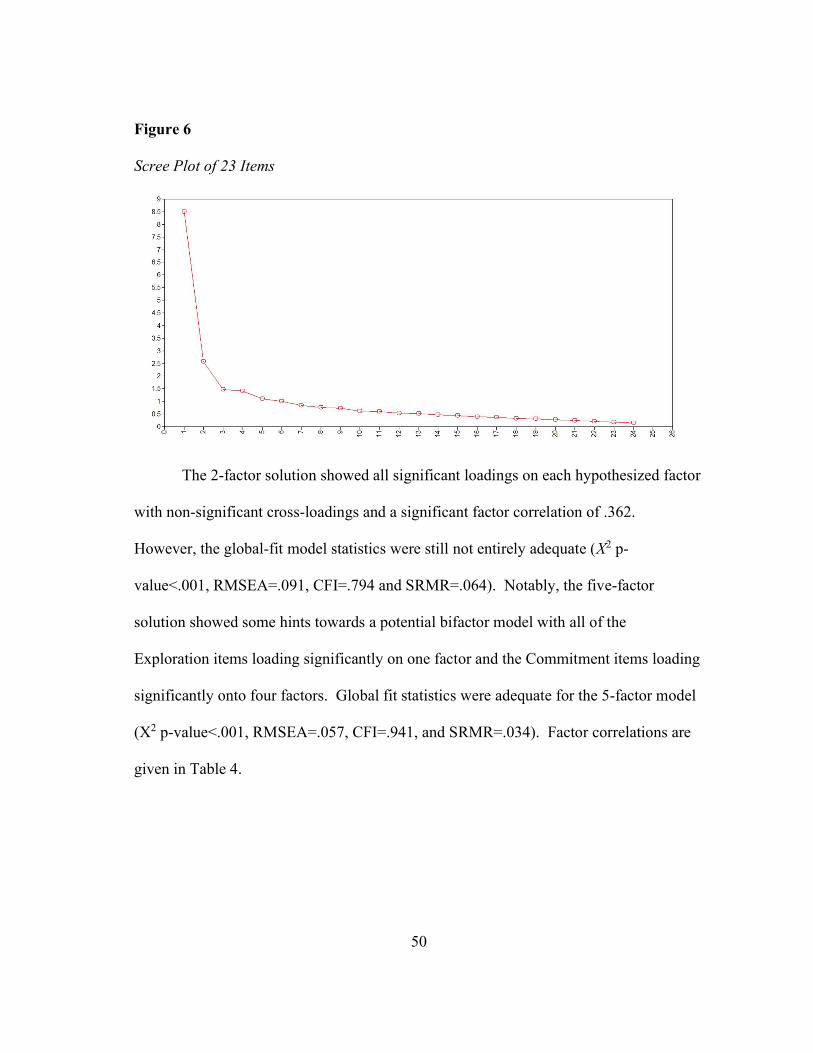
50
Figure 6 Scree Plot of 23 Items
The 2-factor solution showed all significant loadings on each hypothesized factor
with non-significant cross-loadings and a significant factor correlation of .362.
However, the global-fit model statistics were still not entirely adequate (X2 p-
value<.001, RMSEA=.091, CFI=.794 and SRMR=.064). Notably, the five-factor
solution showed some hints towards a potential bifactor model with all of the
Exploration items loading significantly on one factor and the Commitment items loading
significantly onto four factors. Global fit statistics were adequate for the 5-factor model
(X2 p-value<.001, RMSEA=.057, CFI=.941, and SRMR=.034). Factor correlations are
given in Table 4.
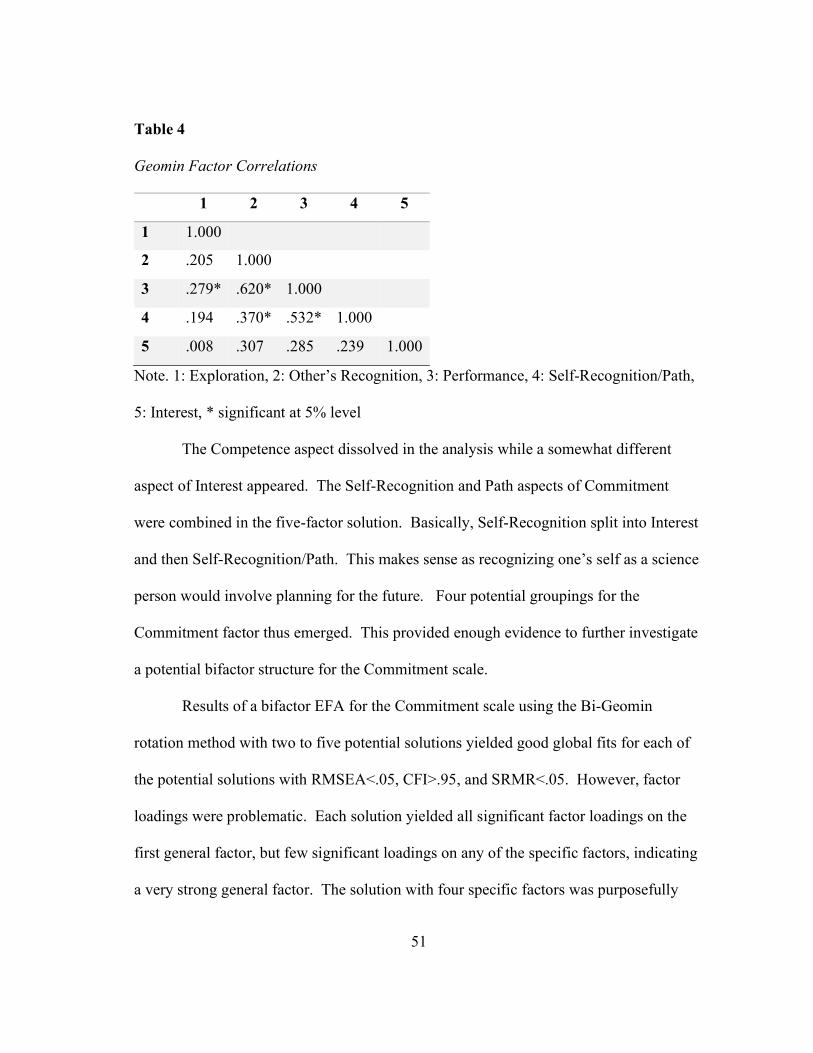
51
Table 4 Geomin Factor Correlations
1 2 3 4 5
1 1.000
2 .205 1.000
3 .279* .620* 1.000
4 .194 .370* .532* 1.000
5 .008 .307 .285 .239 1.000
Note. 1: Exploration, 2: Other’s Recognition, 3: Performance, 4: Self-Recognition/Path,
5: Interest, * significant at 5% level
The Competence aspect dissolved in the analysis while a somewhat different
aspect of Interest appeared. The Self-Recognition and Path aspects of Commitment
were combined in the five-factor solution. Basically, Self-Recognition split into Interest
and then Self-Recognition/Path. This makes sense as recognizing one’s self as a science
person would involve planning for the future. Four potential groupings for the
Commitment factor thus emerged. This provided enough evidence to further investigate
a potential bifactor structure for the Commitment scale.
Results of a bifactor EFA for the Commitment scale using the Bi-Geomin
rotation method with two to five potential solutions yielded good global fits for each of
the potential solutions with RMSEA<.05, CFI>.95, and SRMR<.05. However, factor
loadings were problematic. Each solution yielded all significant factor loadings on the
first general factor, but few significant loadings on any of the specific factors, indicating
a very strong general factor. The solution with four specific factors was purposefully
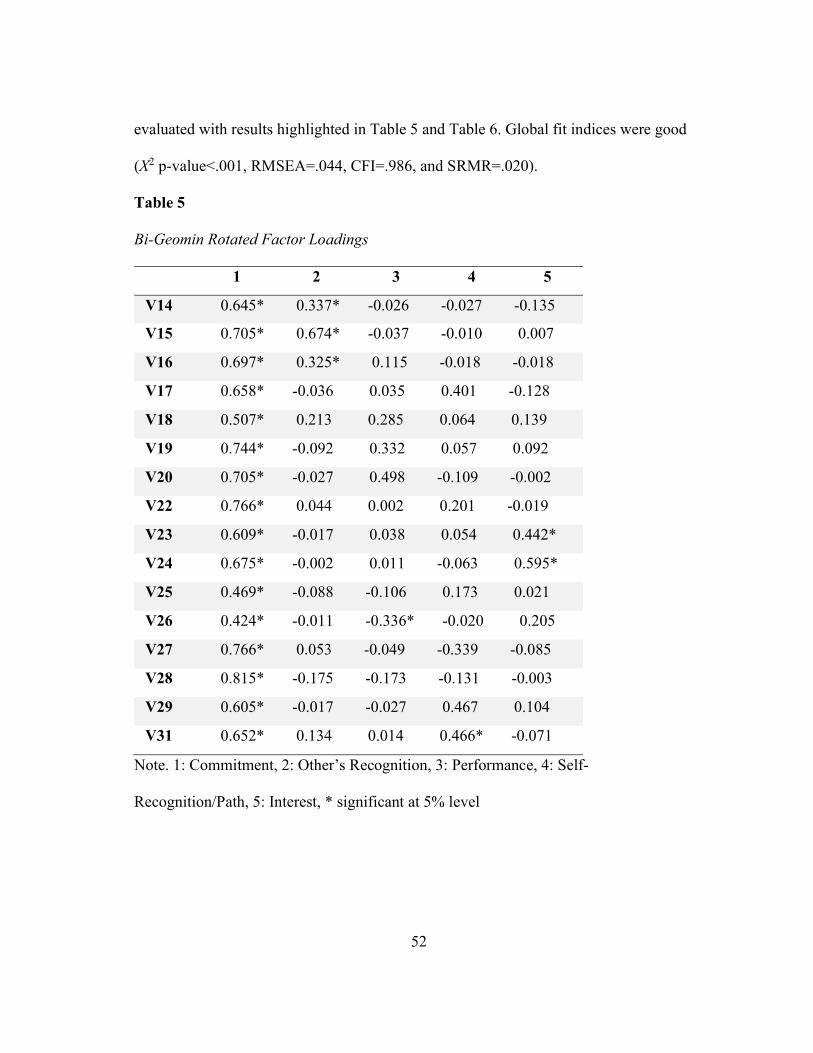
52
evaluated with results highlighted in Table 5 and Table 6. Global fit indices were good
(X2 p-value<.001, RMSEA=.044, CFI=.986, and SRMR=.020).
Table 5 Bi-Geomin Rotated Factor Loadings 1 2 3 4 5
V14 0.645* 0.337* -0.026 -0.027 -0.135
V15 0.705* 0.674* -0.037 -0.010 0.007
V16 0.697* 0.325* 0.115 -0.018 -0.018
V17 0.658* -0.036 0.035 0.401 -0.128
V18 0.507* 0.213 0.285 0.064 0.139
V19 0.744* -0.092 0.332 0.057 0.092
V20 0.705* -0.027 0.498 -0.109 -0.002
V22 0.766* 0.044 0.002 0.201 -0.019
V23 0.609* -0.017 0.038 0.054 0.442*
V24 0.675* -0.002 0.011 -0.063 0.595*
V25 0.469* -0.088 -0.106 0.173 0.021
V26 0.424* -0.011 -0.336* -0.020 0.205
V27 0.766* 0.053 -0.049 -0.339 -0.085
V28 0.815* -0.175 -0.173 -0.131 -0.003
V29 0.605* -0.017 -0.027 0.467 0.104
V31 0.652* 0.134 0.014 0.466* -0.071
Note. 1: Commitment, 2: Other’s Recognition, 3: Performance, 4: Self-
Recognition/Path, 5: Interest, * significant at 5% level
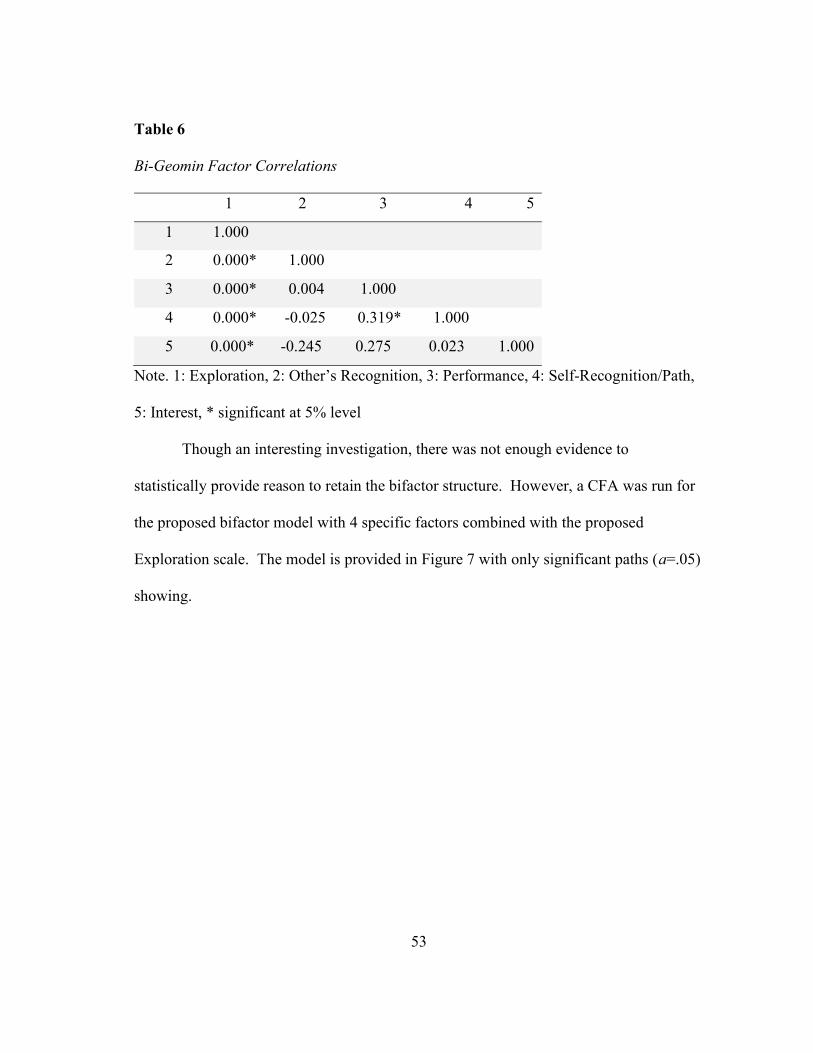
53
Table 6 Bi-Geomin Factor Correlations 1 2 3 4 5
1 1.000
2 0.000* 1.000
3 0.000* 0.004 1.000
4 0.000* -0.025 0.319* 1.000
5 0.000* -0.245 0.275 0.023 1.000
Note. 1: Exploration, 2: Other’s Recognition, 3: Performance, 4: Self-Recognition/Path,
5: Interest, * significant at 5% level
Though an interesting investigation, there was not enough evidence to
statistically provide reason to retain the bifactor structure. However, a CFA was run for
the proposed bifactor model with 4 specific factors combined with the proposed
Exploration scale. The model is provided in Figure 7 with only significant paths (a=.05)
showing.
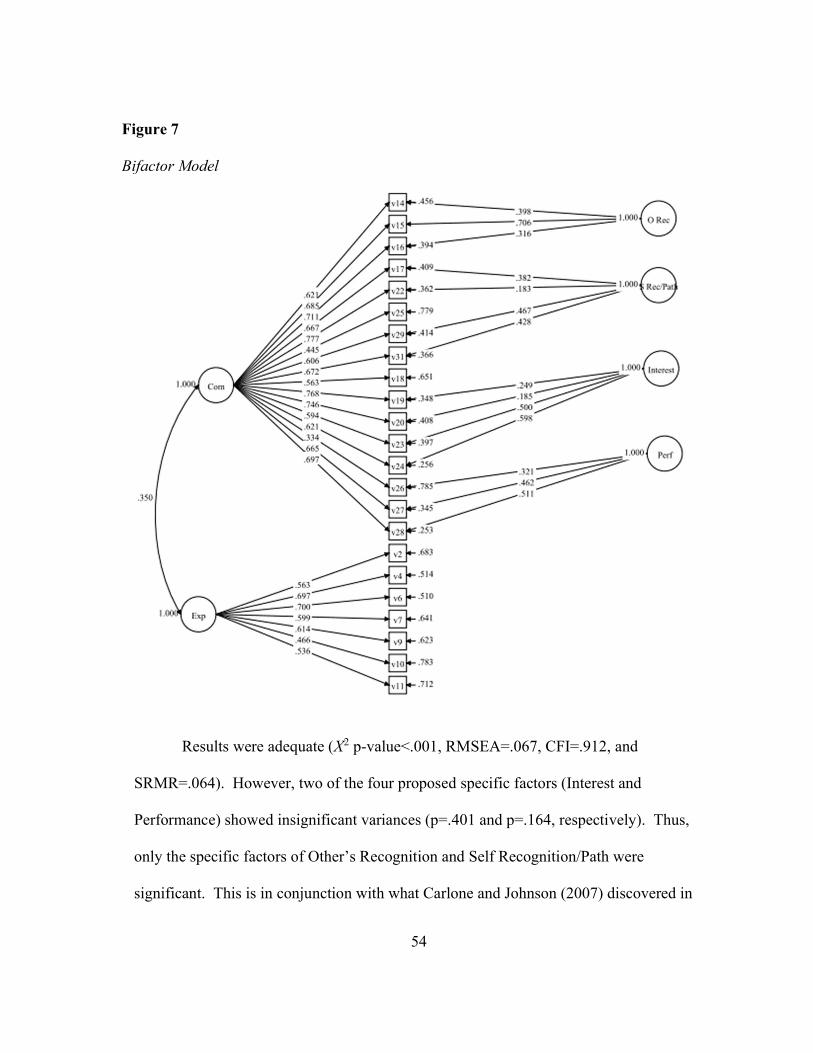
54
Results were adequate (X2 p-value<.001, RMSEA=.067, CFI=.912, and
SRMR=.064). However, two of the four proposed specific factors (Interest and
Performance) showed insignificant variances (p=.401 and p=.164, respectively). Thus,
only the specific factors of Other’s Recognition and Self Recognition/Path were
significant. This is in conjunction with what Carlone and Johnson (2007) discovered in
Figure 7 Bifactor Model
55
stating that the components of Self-Recognition and Other’s Recognition were the most
critical for the development of a strong science identity, particularly in women.
Modification indices deemed V27 (“I can explain science concepts in a way that my
friends understand.”) potentially problematic as it was suggested for cross-loading onto
the Other’s Recognition and Self-Recognition/Path specific factors (MI=18.215 and
MI=11.880, respectively), along with having a correlated residual with V28
(MI=11.604). This variable should be further investigated.
Statistical evidence and theoretical reason still pointed to an optimal, strong, 2-
factor solution that was perhaps being somewhat compromised due to the inclusion of
some poorly worded items or mimicking questions. Thus, the bifactor model with the
four specific factors was not retained for this study. However, it should be kept in
consideration for a follow-up study when confirming factor structure with a larger
sample.
Upon re-examination of the 16 Commitment items, it was discovered that one of
the items was subjective in nature and yielded poor discrimination (ex. “I work hard in
my science class.”). Several other items had similar meanings to one another (ex. “I
enjoy learning about current events that involve science.” “I like seeing how science is
used in the real world.”). For these, it was decided to retain only one of the items. The
decision on which item to retain was based upon mean, variance, interpretability and
ranking by Expert Panel and Focus Group members. This led to the deletion of five
items. Expert Panel and Focus Group members previously had noted an item (“I like to
participate in conversations/discussions that involve science topics.”) as being
56
potentially problematic as it might not accurately reflect a high school student’s
commitment to science. Their belief was that some high school students who were
scientifically-oriented were also shy. Since other items remained that reflected that
particular aspect of science Commitment, this item was also deleted. After this
evaluation, a total of nine items remained for the Commitment dimension, with at least
one item representing each of the five originally hypothesized aspects of Commitment.
A new EFA was conducted with the revised scale ranging from one to three
factors. The Bartlett’s Test of Sphericity p-value<.001 and KMO=.883 indicated strong
evidence to pursue investigation of the underlying factor structure. The related Scree
Plot is provided in Figure 8. The 2-factor model showed superior fit with all significant
factor loadings for each item on their hypothesized factor and a significant factor
correlation of .395. Global fit indices were adequate (X2 p-value<.001, RMSEA=.062,
CFI=.928, and SRMR=.048). Furthermore, the X2 Difference Test yielded evidence in
support of the 2-factor model compared to the 3-factor model with X2 p-value=.0767.
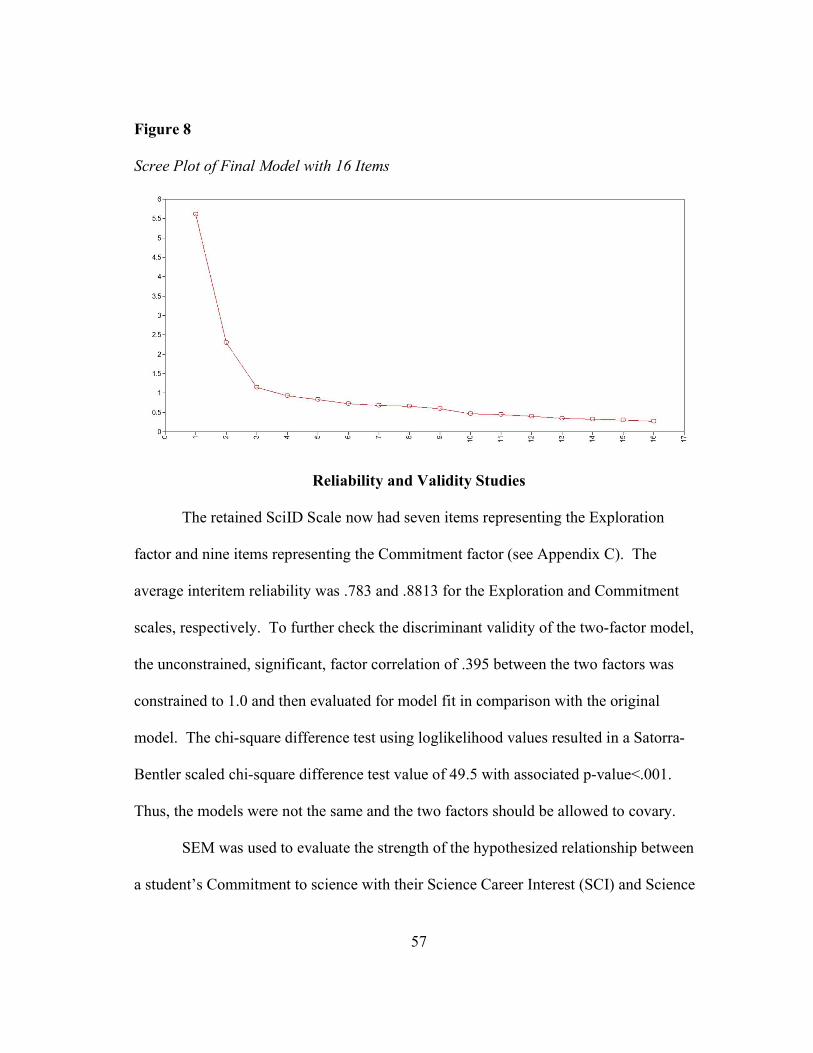
57
Figure 8 Scree Plot of Final Model with 16 Items
Reliability and Validity Studies
The retained SciID Scale now had seven items representing the Exploration
factor and nine items representing the Commitment factor (see Appendix C). The
average interitem reliability was .783 and .8813 for the Exploration and Commitment
scales, respectively. To further check the discriminant validity of the two-factor model,
the unconstrained, significant, factor correlation of .395 between the two factors was
constrained to 1.0 and then evaluated for model fit in comparison with the original
model. The chi-square difference test using loglikelihood values resulted in a Satorra-
Bentler scaled chi-square difference test value of 49.5 with associated p-value<.001.
Thus, the models were not the same and the two factors should be allowed to covary.
SEM was used to evaluate the strength of the hypothesized relationship between
a student’s Commitment to science with their Science Career Interest (SCI) and Science
58
Achievement (Sci Ach). The model used SEM to confirm the relationships between a
student’s Commitment to science and their SCI and Sci Ach.
First, all standardized factor loadings per SciID variables on their appropriate
factor were significant (p<.001). Furthermore, all variables’ R2 values were significant
with p<.01 for the Exploration factor and p<.001 for the Commitment factor suggesting
that each observed variable has a significant amount of its variance explained by its
related latent factor. The model confirming the relationship between science
Commitment, SCI and Sci Ach with standardized results is highlighted in Figure 9 with
all paths significant (α=.05) and adequate global fit statistics (X2 p-value<.001,
RMSEA=.058, CFI=.929, and SRMR=.058).
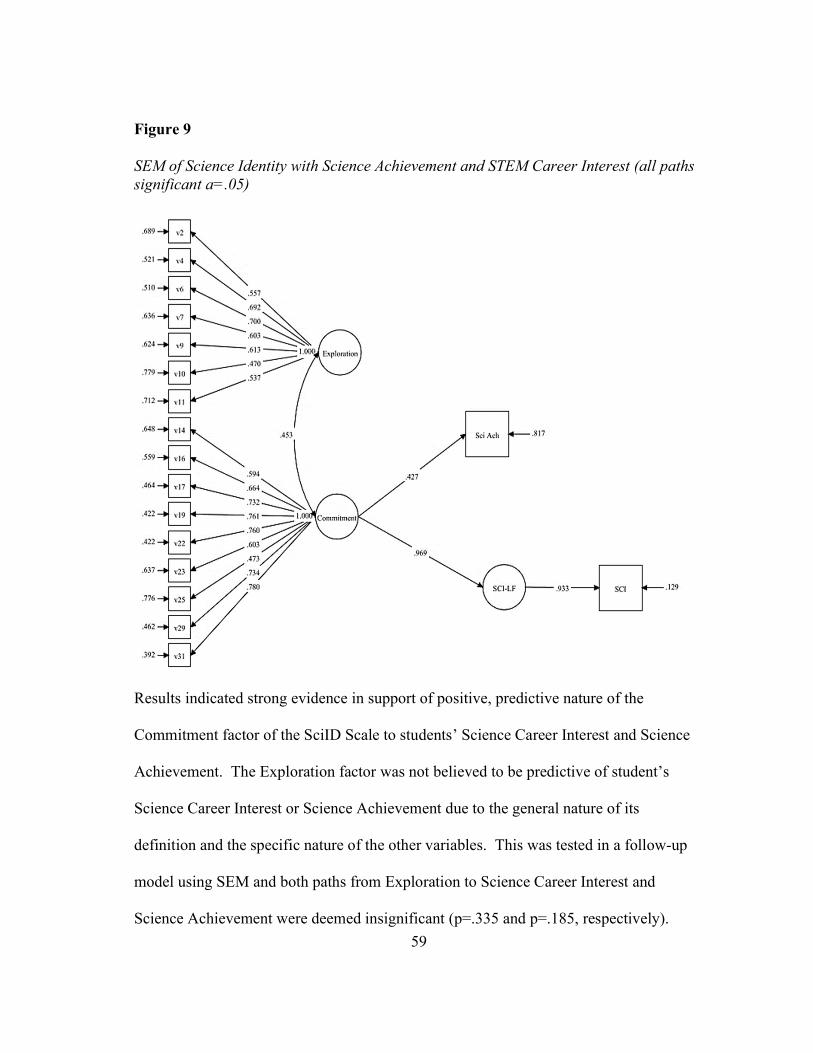
59
Results indicated strong evidence in support of positive, predictive nature of the
Commitment factor of the SciID Scale to students’ Science Career Interest and Science
Achievement. The Exploration factor was not believed to be predictive of student’s
Science Career Interest or Science Achievement due to the general nature of its
definition and the specific nature of the other variables. This was tested in a follow-up
model using SEM and both paths from Exploration to Science Career Interest and
Science Achievement were deemed insignificant (p=.335 and p=.185, respectively).
Figure 9 SEM of Science Identity with Science Achievement and STEM Career Interest (all paths significant a=.05)
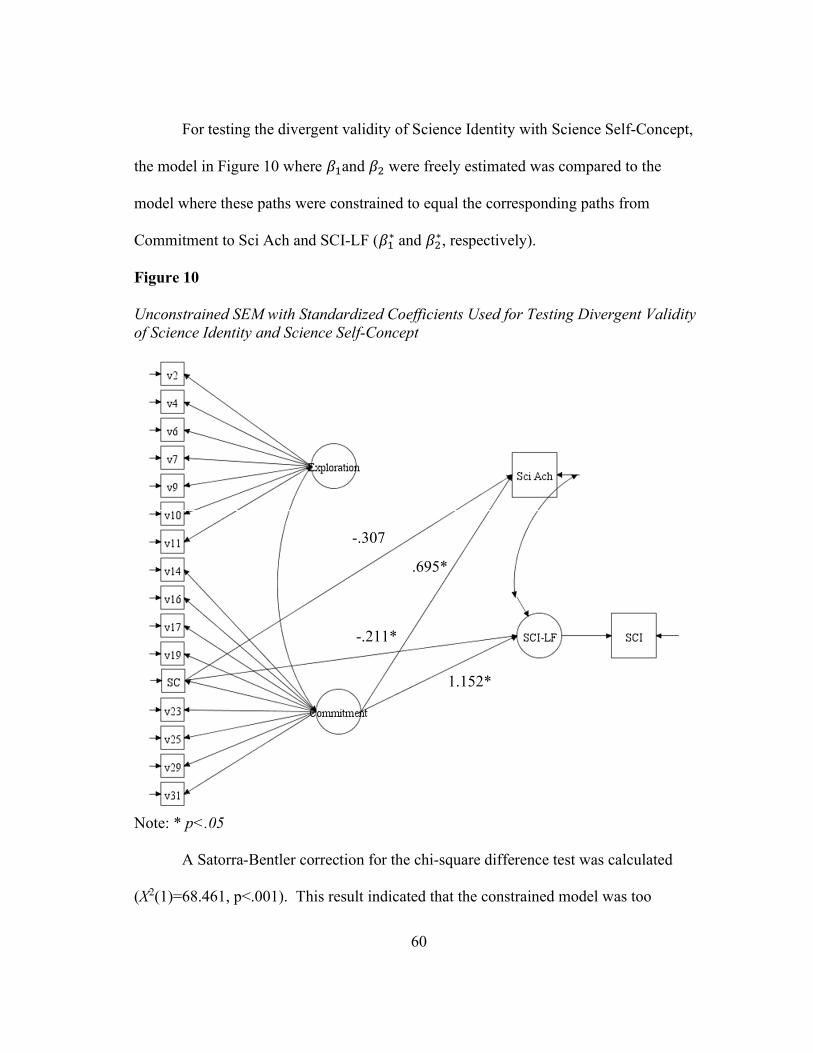
60
For testing the divergent validity of Science Identity with Science Self-Concept,
the model in Figure 10 where 𝛽 and 𝛽 were freely estimated was compared to the
model where these paths were constrained to equal the corresponding paths from
Commitment to Sci Ach and SCI-LF (𝛽∗ and 𝛽∗, respectively).
Figure 10 Unconstrained SEM with Standardized Coefficients Used for Testing Divergent Validity of Science Identity and Science Self-Concept
Note: * p<.05
A Satorra-Bentler correction for the chi-square difference test was calculated
(X2(1)=68.461, p<.001). This result indicated that the constrained model was too
-.211*
-.307
.695*
1.152*
61
constricting for the data. Thus, a student’s science self-concept was not equivalent to
their science Commitment and, hence, their science identity. Furthermore, a baseline
model constraining the paths from Commitment to Sci Ach and SCI-LF (𝛽∗ and 𝛽∗,
respectively) to zero was estimated and R2 values for Sci Ach and SCI-LF were
observed (R2=.060, p=.151 and R2=.495, p<.001, respectively). Next, the R2 values for
Sci Ach and SCI-LF for the unconstrained model provided in Figure 10 were observed
(R2= .238 and R2=.985, respectively) with both being significant (p<.01). This led to R2
changes of .178 for Sci Ach and .49 for SCI-LF between the baseline model and the
unconstrained model, insinuating a substantial more amount of the variance of these two
factors was explained by the Commitment factor than by Science Self-Concept itself.
Indeed, a student’s science identity was a significantly better predictor of both their
science achievement and their science career interest.
Furthermore, a follow-up path analysis was conducted to test Chang et al.’s
(2019) findings that a student’s science identity and calculus plans in high school were
substantial predictors of their pursuit of STEM majors. Calculus plans were indeed a
significant predictor of STEM career interest, with a significant path value of .136
(p=.004). In conjunction with Chang et al. (2019), the model substantiated that a
student’s Commitment to science (p<.001) and plans to take Calculus in high school
(p=.004) were significant predictors of their interest in science careers, with Total R2
value of .888 (p<.001). Gender and minority status were included in a further analysis.
Neither were found to be significant predictors of science career interest (p=.265 and
p=.069, respectively). These results warrant further investigation.
62
A latent class analysis was conducted based upon the level of Exploration and
Commitment a student demonstrated. Exploration and Commitment scores were
transformed into z-scores and then used for the analysis. Results are given in Table 7.
Evidence in conjunction with theory suggested the four-class solution was representative
of the data.
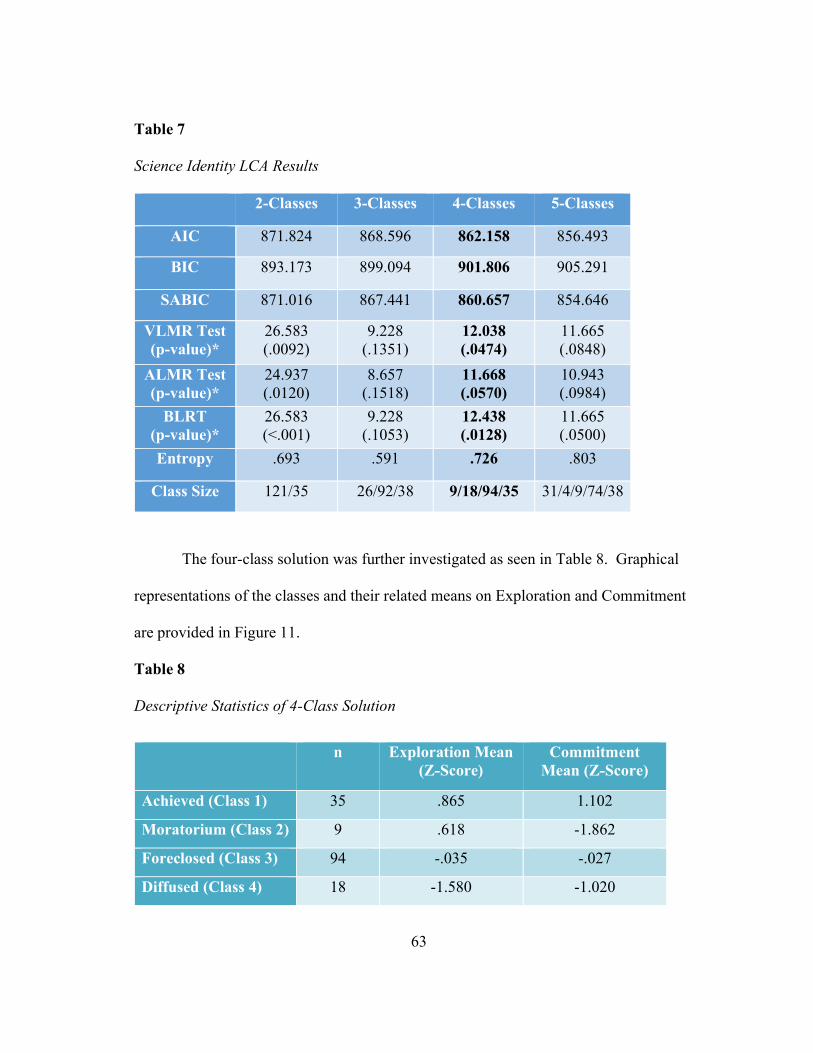
63
Table 7 Science Identity LCA Results 2-Classes 3-Classes 4-Classes 5-Classes
AIC 871.824 868.596 862.158 856.493
BIC 893.173 899.094 901.806 905.291
SABIC 871.016 867.441 860.657 854.646
VLMR Test (p-value)*
26.583 (.0092)
9.228 (.1351)
12.038 (.0474)
11.665 (.0848)
ALMR Test (p-value)*
24.937 (.0120)
8.657 (.1518)
11.668 (.0570)
10.943 (.0984)
BLRT (p-value)*
26.583 (<.001)
9.228 (.1053)
12.438 (.0128)
11.665 (.0500)
Entropy .693 .591 .726 .803
Class Size 121/35 26/92/38 9/18/94/35 31/4/9/74/38
The four-class solution was further investigated as seen in Table 8. Graphical
representations of the classes and their related means on Exploration and Commitment
are provided in Figure 11.
Table 8 Descriptive Statistics of 4-Class Solution
n Exploration Mean (Z-Score)
Commitment Mean (Z-Score)
Achieved (Class 1) 35 .865 1.102
Moratorium (Class 2) 9 .618 -1.862
Foreclosed (Class 3) 94 -.035 -.027
Diffused (Class 4) 18 -1.580 -1.020
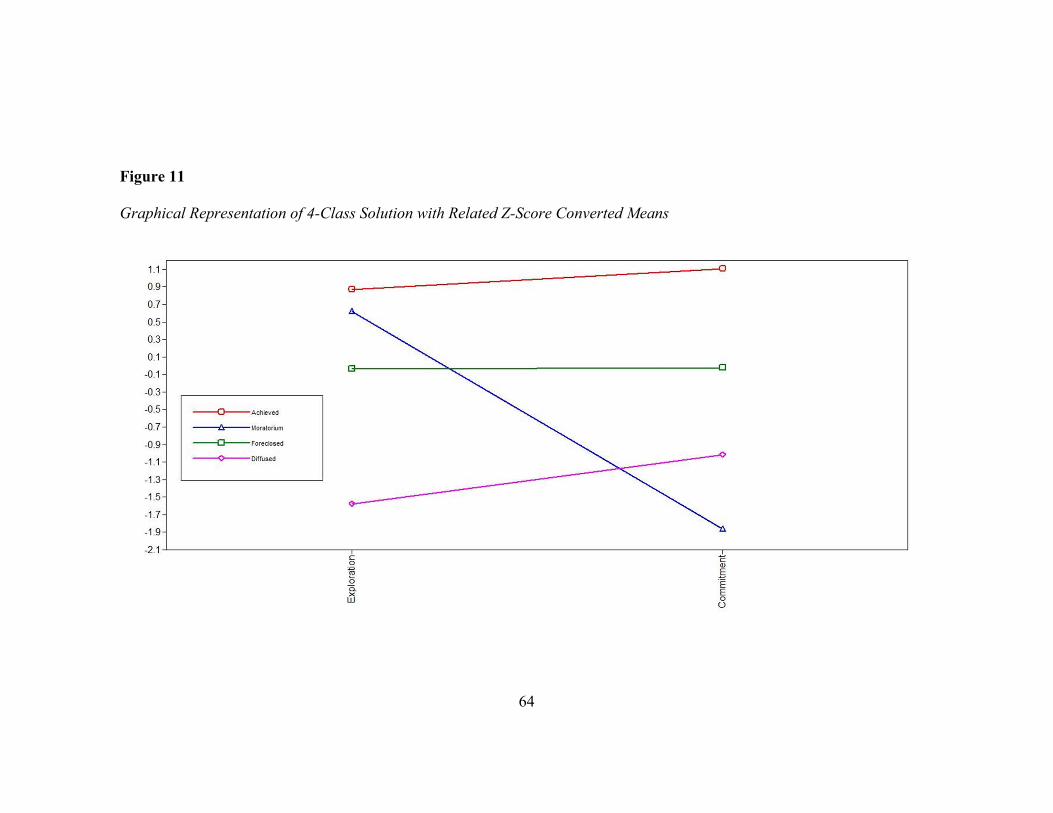
64
Figure 11 Graphical Representation of 4-Class Solution with Related Z-Score Converted Means
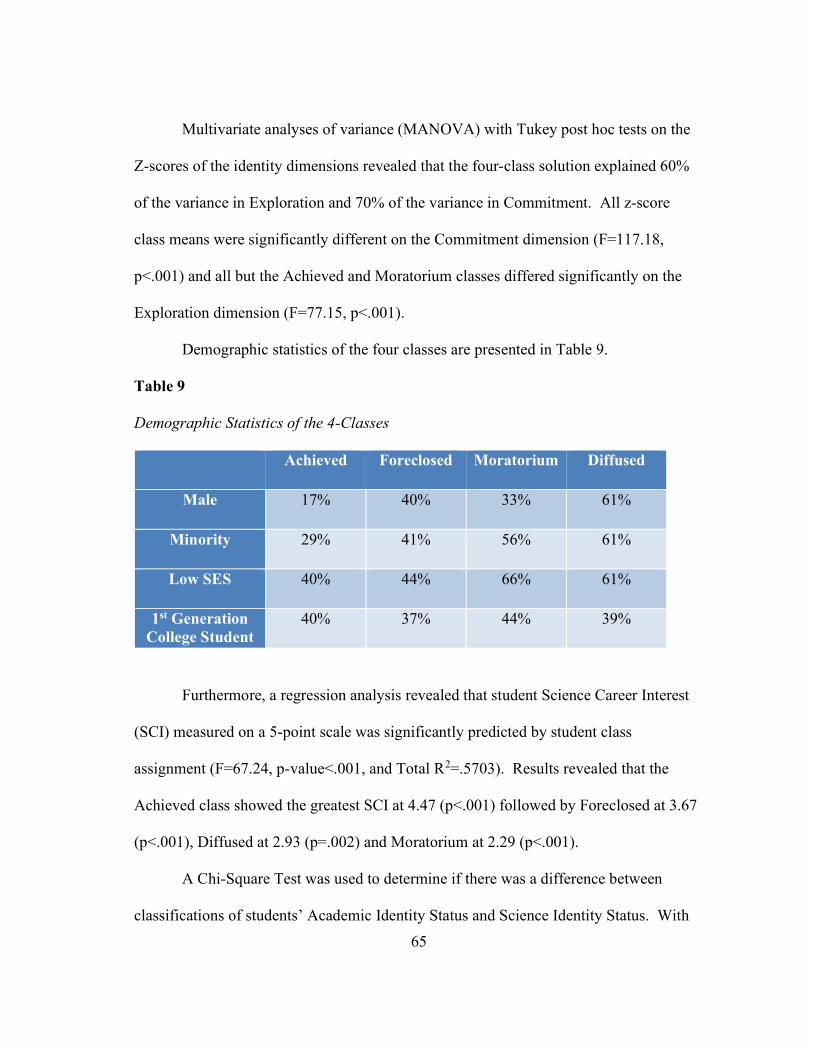
65
Multivariate analyses of variance (MANOVA) with Tukey post hoc tests on the
Z-scores of the identity dimensions revealed that the four-class solution explained 60%
of the variance in Exploration and 70% of the variance in Commitment. All z-score
class means were significantly different on the Commitment dimension (F=117.18,
p<.001) and all but the Achieved and Moratorium classes differed significantly on the
Exploration dimension (F=77.15, p<.001).
Demographic statistics of the four classes are presented in Table 9.
Table 9 Demographic Statistics of the 4-Classes
Achieved Foreclosed Moratorium Diffused
Male 17% 40% 33% 61%
Minority 29% 41% 56% 61%
Low SES 40% 44% 66% 61%
1st Generation College Student
40% 37% 44% 39%
Furthermore, a regression analysis revealed that student Science Career Interest
(SCI) measured on a 5-point scale was significantly predicted by student class
assignment (F=67.24, p-value<.001, and Total R2=.5703). Results revealed that the
Achieved class showed the greatest SCI at 4.47 (p<.001) followed by Foreclosed at 3.67
(p<.001), Diffused at 2.93 (p=.002) and Moratorium at 2.29 (p<.001).
A Chi-Square Test was used to determine if there was a difference between
classifications of students’ Academic Identity Status and Science Identity Status. With
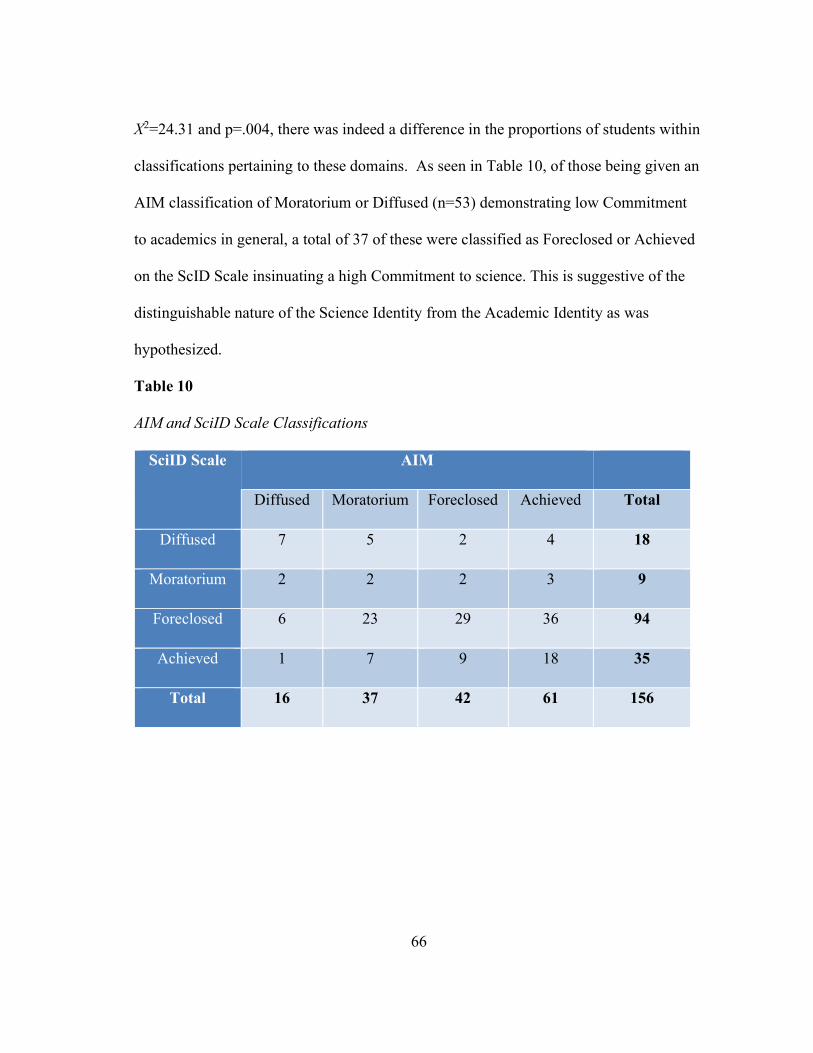
66
X2=24.31 and p=.004, there was indeed a difference in the proportions of students within
classifications pertaining to these domains. As seen in Table 10, of those being given an
AIM classification of Moratorium or Diffused (n=53) demonstrating low Commitment
to academics in general, a total of 37 of these were classified as Foreclosed or Achieved
on the ScID Scale insinuating a high Commitment to science. This is suggestive of the
distinguishable nature of the Science Identity from the Academic Identity as was
hypothesized.
Table 10 AIM and SciID Scale Classifications
SciID Scale AIM
Diffused Moratorium Foreclosed Achieved Total
Diffused 7 5 2 4 18
Moratorium 2 2 2 3 9
Foreclosed 6 23 29 36 94
Achieved 1 7 9 18 35
Total 16 37 42 61 156
67
CHAPTER V
CONCLUSION
Discussion
The purpose of this study was to develop and validate a sound instrument that
accurately measures a high school student’s science identity. In an effort to fulfill this
purpose, the following research questions were addressed:
4. What is the factor structure of science identity?
5. Is the newly developed SciID Scale a valid and reliable instrument?
Rooted in traditional identity theory, science identity was believed to be a two-
dimensional construct; thus, reflecting the interplay of Exploration and Commitment.
Though some research produced by Crocetti et al. (2008) attempted to broaden the
dimensionality of traditional identity theory, this research was not found to be an
accurate representation of the construct. The development of the “new” third dimension
of Reconsideration of Commitment/Exploration in Breadth more accurately reflects
Marcia’s (1966) original dimension of Exploration. Crocetti et al.’s (2008) Exploration
in Depth dimension is indeed the dimension that diverges from traditional identity
theory. This Exploration in Depth dimension is believed to be captured by a
theoretically sound Commitment dimension, as it reflects a student’s level of
performance/path. Thus, this managing of commitments theory produced by Crocetti et
al. (2008), though interesting, was not used for this study.
68
Through a series of factor analyses and scale revisions, this hypothesis was
confirmed. The two-factor model fit the data well and demonstrated a discriminant,
though covaried, nature of the two factors. Furthermore, a 4-class solution was extracted
from the data to reflect the traditional identity statuses of Achieved, Foreclosed,
Moratorium, and Diffused.
Through path analyses, the SciID Scale showed convergent validity with
students’ STEM career interest and science achievement. Furthermore, the HSLS
findings were also confirmed that highlighted a student’s science identity and calculus
plans in high school as being significant predictors of their pursuit of a STEM career.
Moreover, divergent validity was shown between academic identity and science identity
through the diverging of student status assignment on the two constructs.
With good internal consistency measures of the Exploration and Commitment
scales and the substantiation of convergent and divergent validity of the SciID Scale, it is
believed that the SciID Scale is indeed a valid and reliable instrument.
Implications for Future Research
The findings from this study pose several implications for future research
regarding science identity. The emergence of the four-class solution is perhaps the most
vital aspect to this research. A larger field-test of the instrument is needed where the
four-class solution can be thoroughly investigated. Assuming this optimal solution
reemerges, this opens-up a tremendous amount of research capabilities regarding science
identity. The accurate classification of students within science identity status allows for
a thorough investigation into:
69
• What events have led students into these statuses?
• How do these statuses differ in relation to external variables?
• Do the five aspects of Commitment differ depending upon classification?
• What is the stability of these classifications over time?
• What predictive relationship do these statuses have with STEM career pursuit?
• Do women and minorities constitute greater proportions of certain classes?
These are just a few of the questions available for future research.
Limitations
An important limitation of this study that must be addressed is the time at which
the pilot study was conducted. The pilot study occurred during the beginning of the
COVID-19 pandemic. Thus, it must be taken into consideration that some questions on
the Commitment portion of the scale might have received heightened responses due to
the centrality of the pandemic. For instance, the item “I enjoy learning about current
events that involve science.” might reflect a higher average student response than what
would have occurred if the survey was administered before the pandemic began.
However, it is difficult to know how the pandemic will shape our world for the future.
Thus, this question and others that are similar need to be monitored over-time to gain a
more accurate view of actual student response.
Continuing with the impact of the pandemic, all pilot study measures were
conducted via electronic means. This could also introduce some bias into the study as
there were certainly students who were unable to connect to the survey. Though
attempts were made to have students of all ethnic and racial backgrounds, all SES levels,
70
and all academic achievement levels complete the survey, certainly this was not entirely
feasible. A much larger study is needed that can help to reduce some of the potential
bias introduced into this research due to its electronic nature.
Another limitation of this study was the unexpected removal of three questions
from the Exploration scale due to verb-tense. The discrepancy in verb-tense was simply
missed by the research team and Expert Panel. Though this scale was deemed valid and
reliable, the inclusion of an additional two or three quality items would likely increase
the scale’s discrimination and reliability. Increasing the discriminative nature of this
scale should aid in the distinguishability of means between the Achieved and
Moratorium classes, and further separate them from the Foreclosed class as well. This
would likely decrease the relatively high percentage of students being classified as
Foreclosed. This should be accomplished and tested in a larger field-test.
Lastly, this study was conducted with a rural school district and cannot be
generalized across all districts. A larger study with a more diverse sample would be
beneficial.
Concluding Remarks
The call for reform in STEM education remains an urgent call. The novelty of
the COVID-19 pandemic has made this call dire. Before the pandemic, employment in
STEM-related occupations was projected to grow an estimated 8.9% by 2024 (Noonan,
2017). One can only conjecture what those numbers will be now. Alarmingly, however,
the STEM pipeline remains unstable. Given that a high school student’s “science
identity” is the single-best predictor of their pursuit of a STEM degree, it is imperative
71
that a valid, reliable and measurement invariant instrument is created that accurately
assesses this construct. Though a larger field-test is needed in the future, preliminary
EFA findings along with other convergent and divergent evidence indicates that the
SciID Scale is a valid and reliable instrument that does indeed accurately measure a high
school student’s standing on this construct. The soundness of this instrument will enable
policy makers and practitioners to design more effective intervention programs aimed at
cultivating high school students’ science identity. The culmination of this effort will
serve to increase the future STEM workforce and reduce the leak in the STEM pipeline.
72
REFERENCES
A common measurement system for K-12 STEM education: Adopting an educational
evaluation methodology that elevates theoretical foundations and systems
thinking, Studies in Educational Evaluation, 40, 18-35.
Albarello, F., Crocetti, E., & Rubini, M. (2017). I and us: A longitudinal study on the
Interplay of personal and social identity in adolescence. Journal of Youth
Adolescence, 47, 689-702. doi: 10.1007/s10964-017-0791-4
Alegria, S. N. & Branch, E. H. (2015). Causes and consequences of inequality in the
STEM: Diversity and its discontents. International Journal of Gender, Science
and Technology, 7(3), 321–42.
Archer, L., DeWitt, J., Osborne, J., Dillon, J., Willis, B. & Wong, B. (2012). ‘Balancing
acts’: Elementary school girls’ negotiations of femininity, achievement, and
science. Science Education, 96(6), 967–89.
Archer, L., DeWitt, J., Osborne, J., Dillon, J., Willis, B., & Wong, B. (2010). ‘Doing’
science versus ‘Being’ a scientist: Examining 10/11-year-old school children’s
constructions of science through the lens of identity. Science Education, 94(4),
617–39.
Baek, E. (2017). Instrument Development Process [Lecture Notes].
Bakker, J. T. A., Denessen, E., Bosman, A. M. T., Kriger, E. M., & Bouts, L. (2007).
Sociometric status and self-image of children with specific and general learning
73
disabilities in Dutch general and special education classes. Learning Disability
Quarterly, 30(1), 47-62.
Beede, D., Julian, T. A., Langdon, D., & Doms, M. E. (2011). Women in STEM: A
gender gap to innovation. ESA Issue Brief 04(11). U.S. Department of
Commerce.
Beijaard, D., Meijer, P. C., & Verloop, N. (2004). Reconsidering research on teachers’
professional identity. Teaching and Teacher Education, 20(2), 107–128.
doi:10.1016/j.tate.2003.07.001
Beijaard, D., Verloop, N., & Vermunt, J. D. (2000). Teachers’ perceptions of
professional identity: An exploratory study from a personal knowledge
perspective. Teaching and Teacher Education, 16(7), 749–764.
doi:10.1016/j.tate.2003.07.001
Bennett, J. & Hogarth, S. (2009). Would you want to talk to a scientist at a party? High
school students’ attitudes to school science and to science. International Journal
of Science Education, 31(14), 1975–98.
Berzonsky, M. D. (1990). Self-construction over the life-span: A process perspective on
identity formation. Advances in Personal Construct Psychology, 1, 155–186.
Bonous-Hammarth, M. (2000). Pathways to success: Affirming opportunities for
science, mathematics, and engineering majors. Journal of Negro Education, 69,
92–111.
74
Bosma, H. A., & Kunnen, E. S. (2008). Identity-in-context is not yet identity
development-in-context. Journal of Adolescence, 31, 281–289.
https://doi.org/10.1016/j.adolescence.2008.03.001
Branje, S., Laninga-Wijnen, L., Yu, R., & Meeus, W. (2014). Associations among
school and friendship identity in adolescence and romantic relationships and
work in emerging adulthood. Emerging Adulthood, 2, 6 –16.
https://doi.org/10.1177/ 2167696813515851
Brickhouse, N.W., & Potter, J.T. (2001). Young women’s scientific identity formation in
an urban context. Journal of Research in Science Teaching, 38, 965–980.
Brickhouse, N.W., Lowery, P., & Schultz, K. (2000). What kind of a girl does science?
The construction of school science identities. Journal of Research in Science
Teaching, 37, 441–458.
Brown, T. A. (2015). Confirmatory Factor Analysis for Applied Research (2nd Ed.).
New York, NY: Guilford.
Carlone, H. B., & Johnson, A. (2007). Understanding the science experiences of
successful women of color: Science identity as an analytic lens. Journal of
Research in Science Teaching, 44(8), 1187–1218.
Carlone, H. B., Scott, C. M., & Lowder, C. (2014). Becoming (less) scientific: A
longitudinal study of students’ identity work from elementary to middle school
science. Journal of Research in Science Teaching, 51(7), 836–69.
75
Chang, N., Lin, S., Kwok, O., & Saw, G. A (2020, April). Machine learning approach to
predicting STEM college major choice. Paper to be presented at the annual
meeting of the American Educational Research Association, San Francisco, CA.
Chemers M. M., Zurbriggen E. L., Syed M., Goza B. K., Bearman S. (2011). The role of
efficacy and identity in science career commitment among underrepresented
minority students. Journal of Sociological Issues, 67, 469–491.
Cribbs, J. D., Hazari, Z., Sonnert, G., & Sadler, P. M. (2015). Establishing an
explanatory model for mathematics identity. Child Development, 86(4), 1048–62.
Crocetti, E., Rubini, M., & Meeus, W. (2008). Capturing the dynamics of identity
formation in various ethnic groups: Development and validation of a three-
dimensional model. Journal of Adolescence, 31, 207–222.
https://doi.org/10.1016/j.adolescence.2007.09.002
Crocetti, E., Scrignaro, M., Sica, L. S., & Magrin, M. E. (2012). Correlates of identity
configurations: Three studies with adolescent and emerging adult cohorts.
Journal of Youth and Adolescence, 41, 732–748. https://doi.org/10.1007/s10964-
011-9702-2
Crocetti, E., Sica, L. S., Schwartz, S. J., Serafini, T., & Meeus, W. (2013). Identity
styles, dimensions, statuses, and functions: Making connections among identity
conceptualizations. European Review of Applied Psychology, 63, 1–13. http://
dx.doi.org/10.1016/j.erap.2012.09.001
Crocker, L. M., & Algina, J. (2008). Introduction to classical and modern test theory.
Mason, Ohio: Cengage Learning.
76
Diamond, J., St. John, M., Cleary, B., & Librero, D. (1987). The exploratorium’s
explainer program: The long-term impacts on teenagers of teaching science to the
public. Science Education, 71(5), 643–56.
Dugas, D., Summers, K. H., Harris, L. N., & Stich A. E. (2018). Shrinking budgets,
growing demands: Neoliberalism and academic identity tension at regional
public universities. AERA Open, 4(1), 1-14. doi: 10.1177/2332858418757736
Eccles, J. S., & Barber, B. L. (1999). Student council, volunteering, basketball, marching
band: What kind of extracurricular involvement matters? Journal of Adolescent
Research, 14, 10–43.
Eisenhart, M., & Finkel, E. (1998). Women’s Science: Learning and Succeeding from
the Margins. Chicago: University of Chicago Press.
Erikson, E. H. (1959). Identity and the life cycle. New York, NY: Norton.
Erikson, E. H. (1963). Childhood and Society (2nd ed.). New York: Norton.
Erikson, E. H. (1968). Identity, Youth, and Crisis. New York: Norton.
Erickson, E. H. (1980). Identity and the Life Cycle (2nd ed.). New York: Norton.
Fayer, S., Lacey, A., & Watson, A. (2017). STEM occupations: Past, present, and
future. Washington, DC: U.S. Bureau of Labor Statistics. Retrieved from
https://www.bls.gov/spotlight/2017/science-technology-engineering-and-
mathematics-stem-occupations-past-present-and-future/home.htm
Fearon D. D. (2012). Identity Correlates of Academic Achievement: How Influential are
Self, Academic and Ethnic Identity Statuses among College Students. Baylor
University.
77
Fitzmaurice, M. (2013). Constructing professional identity as a new academic: A moral
endeavor. Studies in Higher Education, 38(4), 613–622.
doi:10.1080/03075079.2011.594501
Fraser, J., Shane-Simpson, C., & Asbell-Clarke, J. (2014). Youth science identity,
science learning, and gaming experiences. Computers in Human Behavior, 41,
523–532. https://doi-org.srv-proxy2.library.tamu.edu/10.1016/j.chb.2014.09.048
Gee, J. P. (2000). Identity as an analytic lens for research in education. Review of
Research in Education, 25, 99–125.
Hazari, Z., Sadler, P.M., & Sonnert, G. (2013). The science identity of college students:
Exploring the intersection of gender, race, and ethnicity. Journal of College
Science Teaching, 42, 82–91.
Hazari, Z., Sonner, T. G., Sadler, P. M., & Shanahan, M. C. (2010). Connecting high
school physics experiences, outcome expectations, physics identity, and physics
career choice: A gender study. Journal of Research in Science Teaching, 47,
978–1003.
Hazari, Z., Wulff, P., Petersen, S., Neumann, K. (2018). Engaging young women in
physics: An intervention to support young women’s physics identity
development. Physical Review Physics Education Research, 14(2).
Hejazi, E., Lavasani, M. G., Amani, H., & Was, C. A. (2012). Academic identity status,
goal orientation, and academic achievement among high school students. Journal
of Research in Education, 22, 291-320.
78
Hewlett, B. L. (2013). Adolescent identity: Evolutionary, cultural and developmental
perspectives. New York, NY: Routledge.
Hill, P. W., McQuillan, J., Spiegal, A. N., & Diamond, J. (2018). Discovery orientation,
cognitive schemas, and disparities in science identity in early adolescence.
Sociological Perspective, 60(1), 99-125.
Holdren, J. P. (2011). Policy for science, technology, & innovation in the Obama
administration: A mid-course update. Annual Meeting of the American
Association for the Advancement of Science, 18.
Hu, L.-t., & Bentler, P. M. (1999). Cutoff criteria for fit indexes in covariance structure
analysis: Conventional criteria versus new alternatives. Structural Equation
Modeling, 6, 1-55.
Hughes, G. (2001). Exploring the availability of student scientist identities within
curriculum discourse: An anti-essentialist approach to gender-inclusive science.
Gender and Education, 13, 275–290.
Ireri, A. M., Wawire, C. K., Mugambi, D. K., & Mwangi, C. M. (2015). Academic
identity status measure: Psychometric properties when used among secondary
school students in Kenya. International Journal of School and Cognitive
Psychology, 2(4).
Izadinia, M. (2013). A review of research on student teachers' professional identity.
British Educational Research Journal, 39, 694–713.
79
Jensen, L. A. (2011). Bridging cultural and developmental approaches to psychology:
New syntheses in theory, research, and policy. New York, NY: Oxford
University Press.
Kier, M. W., Blanchard, M. R., Osborne, J. W. et al. (2014). The Development of the
STEM career interest survey (STEM-CIS). Research in Science Education, 44,
461–481.
Klimstra, T. A., Luyckx, K., Germeijis, V., Meeus, W., & Gossens, L. (2012).
Personality traits and educational identity formation in late adolescence:
Longitudinal associations and academic progress. Journal of Youth and
Adolescence, 41, 346-361.
Klimstra, T. A., Luyckx, K., Hale, III, W. W., Frijns, W., Van Lier, P. A. C., & Meeus,
W. (2010). Short-term fluctuations in identity: Introducing a micro-level
approach to identity formation. Journal of Personality and Social Psychology,
99, 191–202. https://doi. org/10.1037/a0019584
Langdon, D., McKittrick, G., Beede, D., Khan, B., & Doms, M. (2011). STEM: Good
jobs now and for the future. ESA Issue Brief, 3(11). U.S. Department of
Commerce. Retrieved from http://eric.ed.gov/?id=ED522129
Leary, M. (2005). Sociometer theory and the pursuit of relational value: Getting to the
root of self-esteem. European Review of Social Psychology, 16, 75-111.
Lounsbury, J. W., Huffstettler, B. C., Leong, F. T., & Gibson, L. W. (2005). Sense of
identity and collegiate academic achievement. Journal of College Student
Development, 46, 501-514.
80
Luyckx, K., Goossens, L., Soenens, B., & Beyers, W. (2006). Unpacking commitment
and exploration – Preliminary validation of an integrative model of late
adolescent identity formation. Journal of Adolescence, 29, 361–378.
Luyckx, K., Schwartz, S., Berzonsky, M., Soenens, B., Vansteenkiste, M., Smits, I., et
al. (2008). Capturing ruminative exploration: Extending the four-dimensional
model of identity formation in late adolescence. Journal of Research on
Personality, 42, 58–82.
Marcia, J. E. (1966). Development and validation of ego-identity status. Journal of
Personality and Social Psychology, 3(5), 551–558.
https://doi.org/10.1037/h0023281
Marcia, J. E. (1980). Identity in adolescence. Handbook of adolescent psychology. 159–
187.
McLean, K. C. & Syed, M. (2014). The Oxford Handbook of Identity Development. New
York, NY: Oxford University Press.
McLean, K. C., Syed, M., & Shucard, H. (2016). Bringing identity content to the fore:
Links to identity development processes. Emerging Adulthood, 4, 356–364.
https://doi.org/10.1177/ 2167696815626820
Meeus, W. (2011). The study of adolescent identity formation 2000–2010: A review of
longitudinal research. Journal of Research on Adolescence, 21, 75 –94.
https://doi.org/10.1111/j. 1532-7795.2010.00716.x.
Meeus, W., Van de Schoot, R., Keijsers, L., Schwartz, S. J., & Branje, S. (2010). On the
progression and stability of adolescent identity formation: A five-wave
81
longitudinal study in early-to-middle and middle-to-late adolescence. Child
Development, 81, 1565–1581. http://dx.doi.org/10 .1111/j.1467-
8624.2010.01492.x
Mercer, N., Branje, S. Crocetti, E., Lier, P. V., & Meeus, W. (2017). Linking
delinquency and personal identity formation across adolescence: Examining
between-and within-person associations. Developmental Psychology, 53(11).
2182-2194.
Moher, D., Liberati, A., Tetzlaff, J., Altman, D. G., & The Prisma Group (2009).
Preferred reporting items for systematic reviews and meta-analyses: The
PRISMA Statement. PLoSMedicine, 6, e1000097.
https://doi.org/10.1371/journal.pmed1000097
Muthén, L. K., & Muthén, B. O. (1998-2019). Mplus user’s guide. 8th ed. Los Angeles,
CA: Muthen & Muthen.
National Center for Education Statistics. (2015). High School Longitudinal Study of
2009 (HSLS: 09) - User Manuals. Retrieved from
https://nces.ed.gov/surveys/hsls09/usermanuals.asp
National Commission on Mathematics and Science. (2000). Before it’s too Late: A
Report to the Nation. Washington, DC: The National Academies Press.
National Research Council. (2007). Rising Above the Gathering Storm. Washington,
DC: The National Academies Press.
82
National Research Council. (2010). Rising Above the Gathering Storm, Revisited:
Rapidly Approaching Category 5. Washington, DC: The National Academies
Press.
National Science Board. (2016). Science and Engineering Indicators 2016. Arlington,
VA: National Science Foundation. Retrieved from
https://www.nsf.gov/statistics/2016/nsb20161/#/
Noonan, R. (2017). STEM Jobs: 2017 update. Washington, DC: US Department of
Commerce, Economics and Statistics Administration. Retrieved from
https://www.commerce.gov/sites/default/files/migrated/reports/stem-jobs-2017-
update.pdf
Nylund, K. L., Asparouhov, T., & Muthen, B. O. (2007). Deciding on the number of
classes in latent class analysis and growth mixture modeling: A monte carlo
simulation study. Structural Equation Modeling,14(4), 535–569.
Osborne, J. W., & Walker, C. (2006). Stereotype threat, identification with academics,
and withdrawal from school: Why the most successful students of colour might
be most likely to withdraw. Educational Psychology, 26, 563–577.
Pajares, F. & Urdan, T. C. (2006). Self-efficacy Beliefs of Adolescents. Charlotte, NC:
Information Age Publishers Incorporated.
Penner, A. M. (2015). Gender inequality in science. Science, 347(6219), 234–35.
Piotrowski, K. (2018). Adaptation of the Utrecht-Management of Identity Commitments
Scale (U-MICS) to the measurement of the parental identity domain.
Scandinavian Journal of Psychology, 59, 157–166.
83
Pop, E. I., Negru-Subtirica, O., Crocetti, E., Opri, A., & Meeus, W. (2015). On the
interplay between academic achievement and educational identity: A longitudinal
study. Journal of Adolescence, 47, 135-144.
Pugh, K. J., Linnenbrink-Garcia, L., Koskey, K. L. K., Stewart, V. C., & Manzey, C.
(2010). Motivation, learning, and transformative experience: A study of deep
engagement in science. Science Education, 94(1), 1–28.
Rahiminezhada, A., Farahania, H., Amanib, H., Yazdani varzanehb, M. J., Haddadic, P.,
& Zarpour, S. (2011). Developing Academic Identity Statues Scale (AISS) and
studying its construct validity on Iranian students. Procedia Social and
Behavioral Sciences, 15, 738–742.
Robinson, K. A., Perez, T., Nuttall, A. K., Roseth, C. J., & Linnenbrink-Garcia, L.
(2018). From science student to scientist: Predictors and outcomes of
heterogeneous science identity trajectories in college. Developmental
Psychology, 54(10), 1977-1992.
Saxton, E., Burns, R., Holveck, S., Kelley, S., Prince, D., Rigelman, N., & Skinner, E.
A. (2014). A common measurement system for K-12 STEM education: Adopting
an educational evaluation methodology that elevates theoretical foundations and
systems thinking, Studies in Educational Evaluation, 40, 18-35.
Schwartz, S. J., Luyckx, K., & Vignoles, V. L. (2011). Handbook of identity theory and
research. New York: Springer. https://doi.org/10.1177/0894318411409427
84
Science and Engineering Indicators Digest. (2014). U.S. R&D: Federal portfolio.
Retrieved from
https://www.nsf.gov/statistics/seind14/index.cfm/digest/portfolio.htm#5
Siegel, M. A. & Ranney, M. A. (2003). Developing the Changes in Attitude about the
Relevance of Science (CARS) questionnaire and assessing two high school
science classes. Journal of Research in Science Teaching, 40(8), 757–75.
Skinner, E., Saxton, E., Currie, C., & Shusterman, G. (2017). A motivational account of
the undergraduate experience in science: Brief measures of students’ self-system
appraisals, engagement in coursework, and identity as a scientist. International
Journal of Science Education, 39(17). 2433-2459. doi:
10.1080/09500693.2017.1387946
Syed, M., Zurbriggen, E. L., Chemers, M. M., Goza, B. K., Bearman, S., Crosby, F. J.,
Shaw, J. M., Hunter, L., & Morgan, E. M. (2018). The role of self-efficacy and
identity in mediating the effects of STEM support experiences. Analyses of
Social Issues and Public Policy, 0(0), 1-43.
Tan, E., & Calabrese Barton, A. (2007). Unpacking science for all through the lens of
identities-in-practice: The stories of Amelia and Ginny. The Chicago Springer
Forum, Science Education in an Age of Globalization. Chicago, IL.
Trujillio, G. & Tanner, K. D. (2014). Considering the role of affect in learning:
Monitoring students’ self-efficacy, sense of belonging, and science identity.
CBE—Life Sciences Education, 13, 6-15.
85
U.S. Department of Education. (2015). Science, technology, engineering, and math:
Education for global leadership. Retrieved from https://www.ed.gov/stem
Was, C. A., & Isaacson, R. M. (2008). The development of a measure of academic
identity status. Journal of Research in Education, 18, 94-105.
Was, C. A., Al-Harthy, I., Stack-Oden, M., & Isaacson, R. M. (2009). Academic identity
status and the achievement goal orientation. Electronic Journal of Research in
Educational Psychology, 7(2), 627-652.
West, S. G., Finch, J. F., & Curran, P. J. (1995). Structural equation models with
nonnormal variables: Problems and remedies. In R. H. Hoyle (Ed.), Structural
equation modeling: Concepts, issues, and applications (pp. 56-75). Thousand
Oaks, CA: Sage.
Widaman, K. F., & Reise, S. P. (1997). Exploring the measurement invariance of
psychological instruments: Applications in the substance use domain. In K. J.
Bryant, M. Windle, & S. G. West (Eds.), The science of prevention:
Methodological advances from alcohol and substance abuse research (pp. 281-
324). Washington, DC, US: American Psychological Association.
http://dx.doi.org/10.1037/10222-009
Wigfield, A., Eccles, J. S., Schiefele, U., Roeser, R., & Davis-Kean, P. (2006).
Development of achievement motivation. In W. Damon (Series Ed.) & N.
Eisenberg (Volume Ed.), Handbook of child psychology, 6th ed. Vol. 3. Social,
emotional, and personality development (933–1002). New York: John Wiley.
86
Williams, D. R., Brule, H., Kelley, S. S., & Skinner, E. A. (2018). Science in the
Learning Gardens (SciLG): A study of students’ motivation, achievement, and
science identity in low-income middle schools. International Journal of STEM
Education, 5(8). https://doi.org/10.1186/s40594-018-0104-9
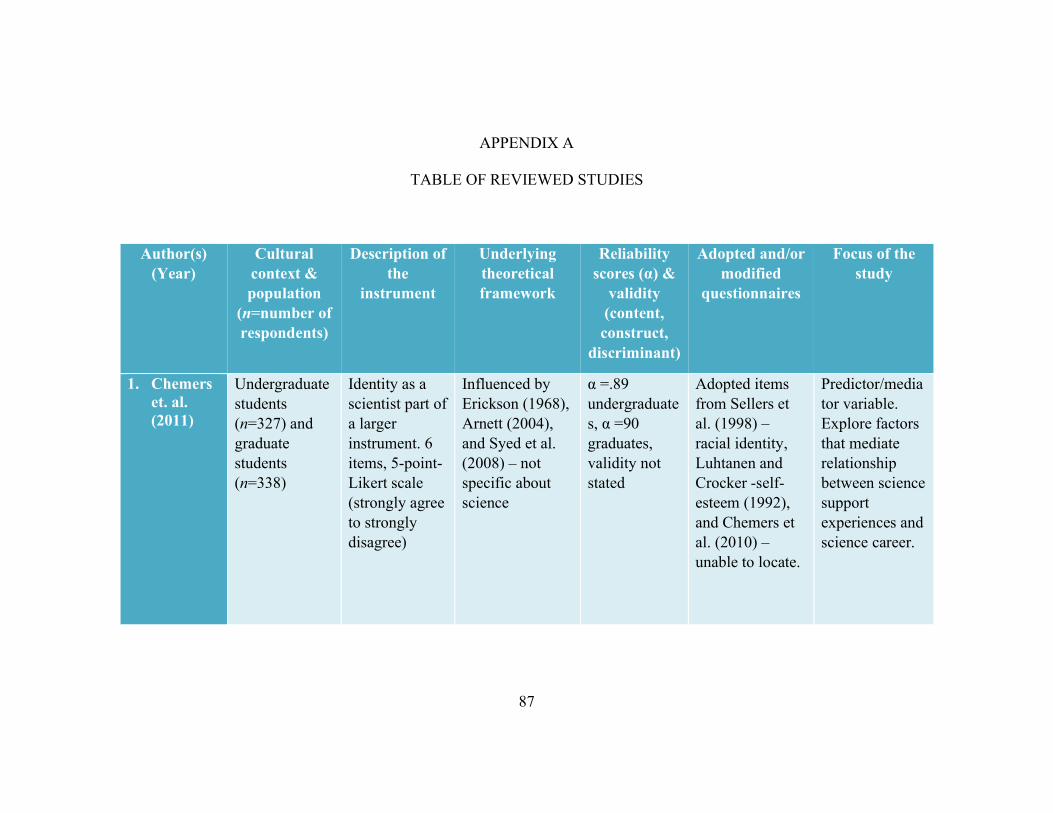
87
APPENDIX A
TABLE OF REVIEWED STUDIES
Author(s) (Year)
Cultural context & population
(n=number of respondents)
Description of the
instrument
Underlying theoretical framework
Reliability scores (α) &
validity (content, construct,
discriminant)
Adopted and/or modified
questionnaires
Focus of the study
1. Chemers et. al. (2011)
Undergraduate students (n=327) and graduate students (n=338)
Identity as a scientist part of a larger instrument. 6 items, 5-point-Likert scale (strongly agree to strongly disagree)
Influenced by Erickson (1968), Arnett (2004), and Syed et al. (2008) – not specific about science
α =.89 undergraduates, α =90 graduates, validity not stated
Adopted items from Sellers et al. (1998) – racial identity, Luhtanen and Crocker -self-esteem (1992), and Chemers et al. (2010) – unable to locate.
Predictor/mediator variable. Explore factors that mediate relationship between science support experiences and science career.
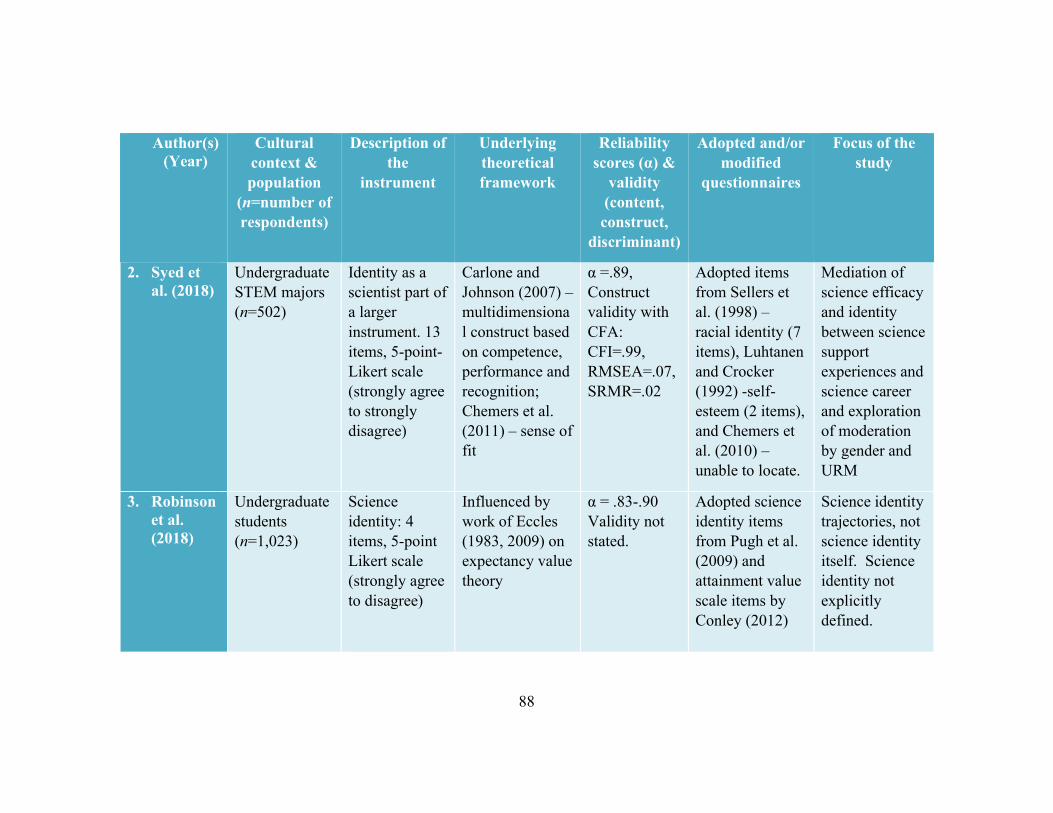
88
Author(s) (Year)
Cultural context & population
(n=number of respondents)
Description of the
instrument
Underlying theoretical framework
Reliability scores (α) &
validity (content, construct,
discriminant)
Adopted and/or modified
questionnaires
Focus of the study
2. Syed et al. (2018)
Undergraduate STEM majors (n=502)
Identity as a scientist part of a larger instrument. 13 items, 5-point-Likert scale (strongly agree to strongly disagree)
Carlone and Johnson (2007) – multidimensional construct based on competence, performance and recognition; Chemers et al. (2011) – sense of fit
α =.89, Construct validity with CFA: CFI=.99, RMSEA=.07, SRMR=.02
Adopted items from Sellers et al. (1998) – racial identity (7 items), Luhtanen and Crocker (1992) -self-esteem (2 items), and Chemers et al. (2010) – unable to locate.
Mediation of science efficacy and identity between science support experiences and science career and exploration of moderation by gender and URM
3. Robinson et al. (2018)
Undergraduate students (n=1,023)
Science identity: 4 items, 5-point Likert scale (strongly agree to disagree)
Influenced by work of Eccles (1983, 2009) on expectancy value theory
α = .83-.90 Validity not stated.
Adopted science identity items from Pugh et al. (2009) and attainment value scale items by Conley (2012)
Science identity trajectories, not science identity itself. Science identity not explicitly defined.
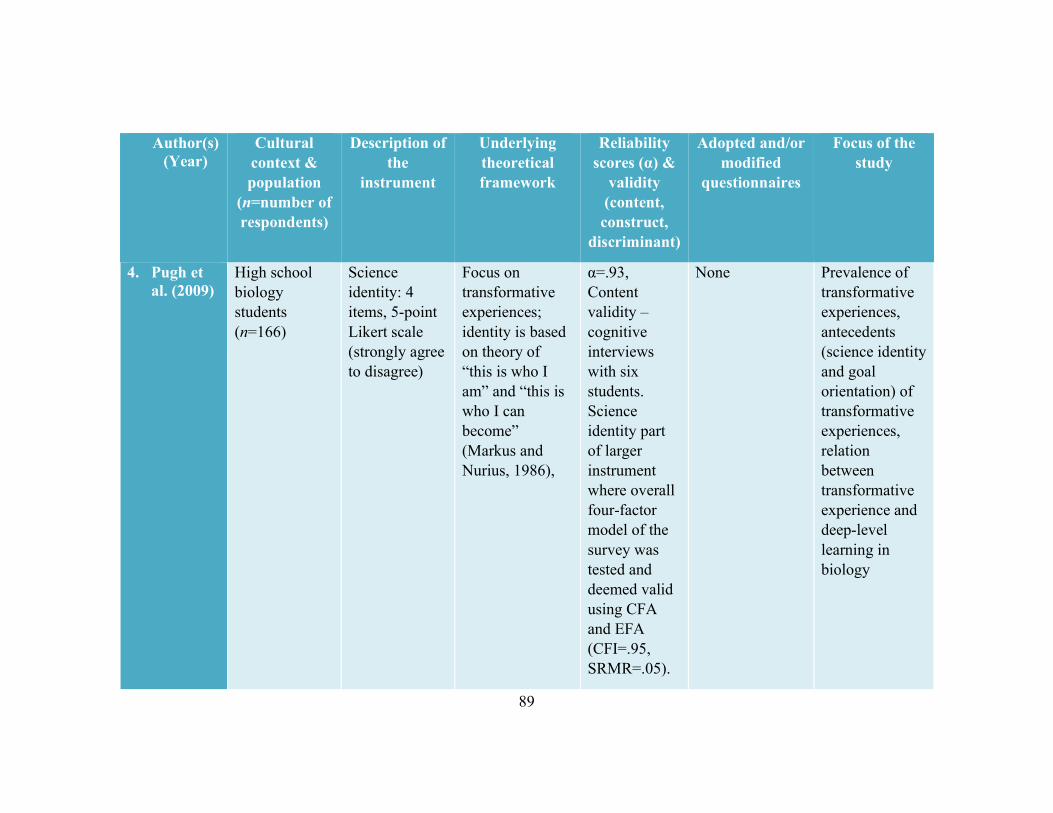
89
Author(s) (Year)
Cultural context & population
(n=number of respondents)
Description of the
instrument
Underlying theoretical framework
Reliability scores (α) &
validity (content, construct,
discriminant)
Adopted and/or modified
questionnaires
Focus of the study
4. Pugh et al. (2009)
High school biology students (n=166)
Science identity: 4 items, 5-point Likert scale (strongly agree to disagree)
Focus on transformative experiences; identity is based on theory of “this is who I am” and “this is who I can become” (Markus and Nurius, 1986),
α=.93, Content validity –cognitive interviews with six students. Science identity part of larger instrument where overall four-factor model of the survey was tested and deemed valid using CFA and EFA (CFI=.95, SRMR=.05).
None Prevalence of transformative experiences, antecedents (science identity and goal orientation) of transformative experiences, relation between transformative experience and deep-level learning in biology
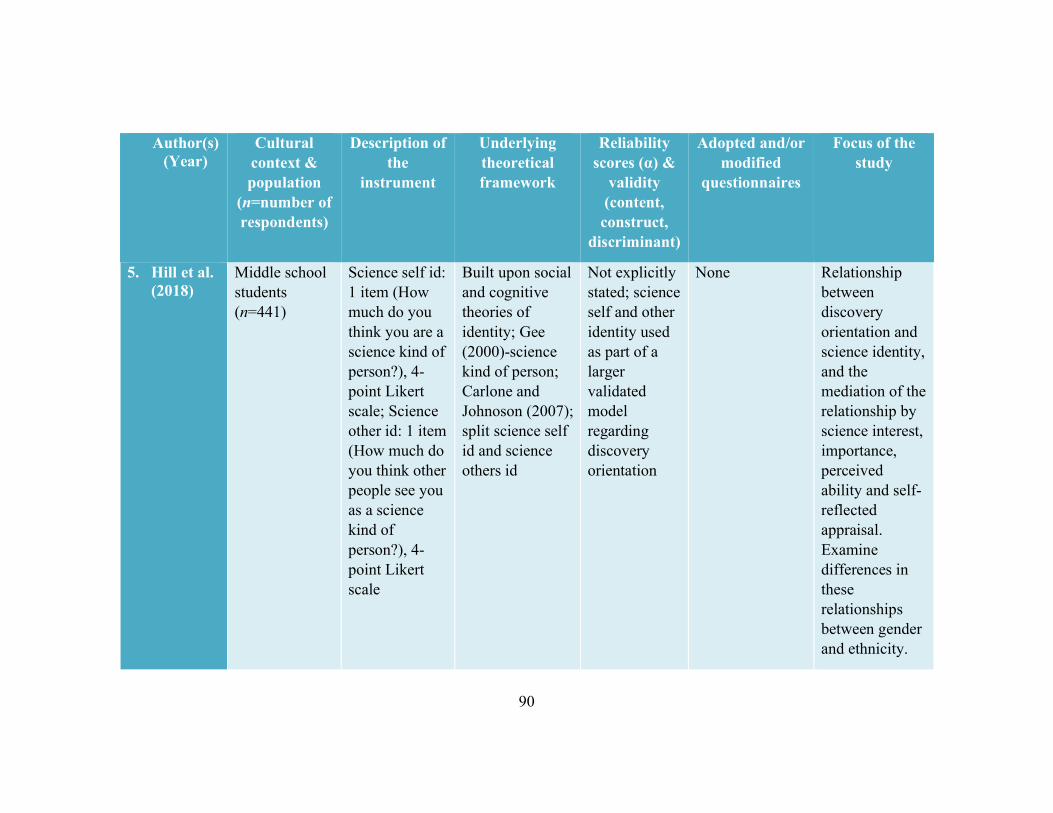
90
Author(s) (Year)
Cultural context & population
(n=number of respondents)
Description of the
instrument
Underlying theoretical framework
Reliability scores (α) &
validity (content, construct,
discriminant)
Adopted and/or modified
questionnaires
Focus of the study
5. Hill et al. (2018)
Middle school students (n=441)
Science self id: 1 item (How much do you think you are a science kind of person?), 4-point Likert scale; Science other id: 1 item (How much do you think other people see you as a science kind of person?), 4-point Likert scale
Built upon social and cognitive theories of identity; Gee (2000)-science kind of person; Carlone and Johnoson (2007); split science self id and science others id
Not explicitly stated; science self and other identity used as part of a larger validated model regarding discovery orientation
None Relationship between discovery orientation and science identity, and the mediation of the relationship by science interest, importance, perceived ability and self-reflected appraisal. Examine differences in these relationships between gender and ethnicity.
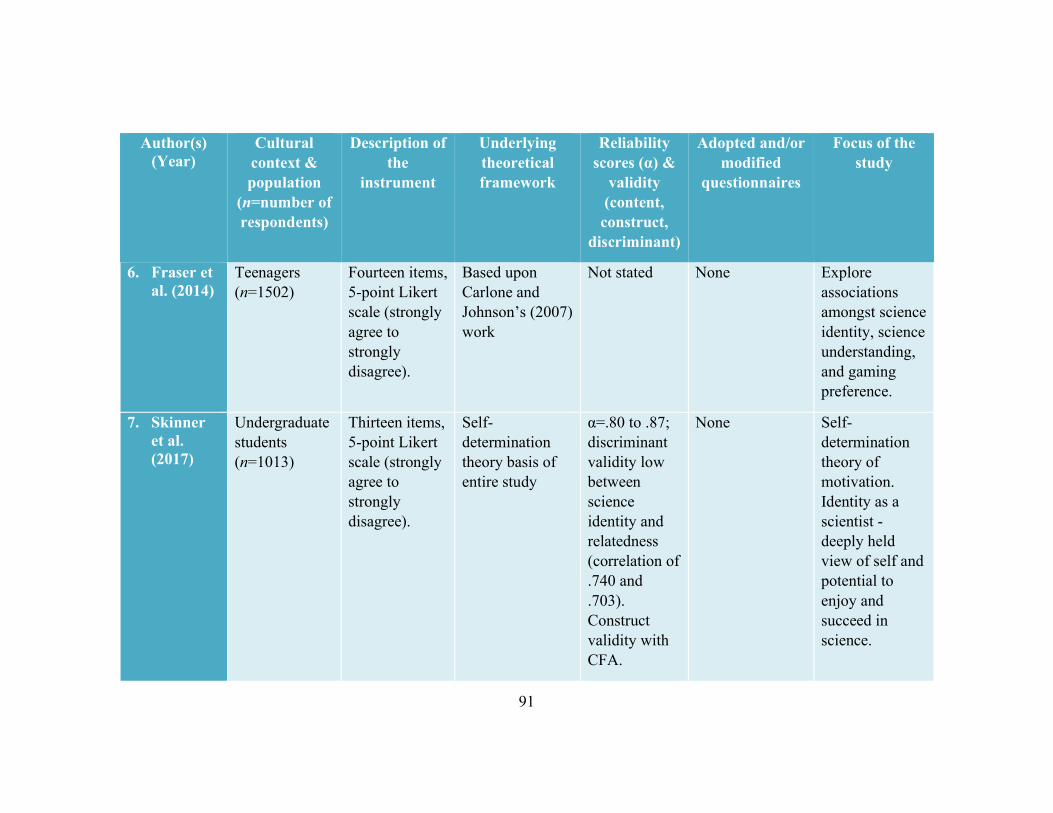
91
Author(s) (Year)
Cultural context & population
(n=number of respondents)
Description of the
instrument
Underlying theoretical framework
Reliability scores (α) &
validity (content, construct,
discriminant)
Adopted and/or modified
questionnaires
Focus of the study
6. Fraser et al. (2014)
Teenagers (n=1502)
Fourteen items, 5-point Likert scale (strongly agree to strongly disagree).
Based upon Carlone and Johnson’s (2007) work
Not stated None Explore associations amongst science identity, science understanding, and gaming preference.
7. Skinner et al. (2017)
Undergraduate students (n=1013)
Thirteen items, 5-point Likert scale (strongly agree to strongly disagree).
Self-determination theory basis of entire study
α=.80 to .87; discriminant validity low between science identity and relatedness (correlation of .740 and .703). Construct validity with CFA.
None Self-determination theory of motivation. Identity as a scientist - deeply held view of self and potential to enjoy and succeed in science.
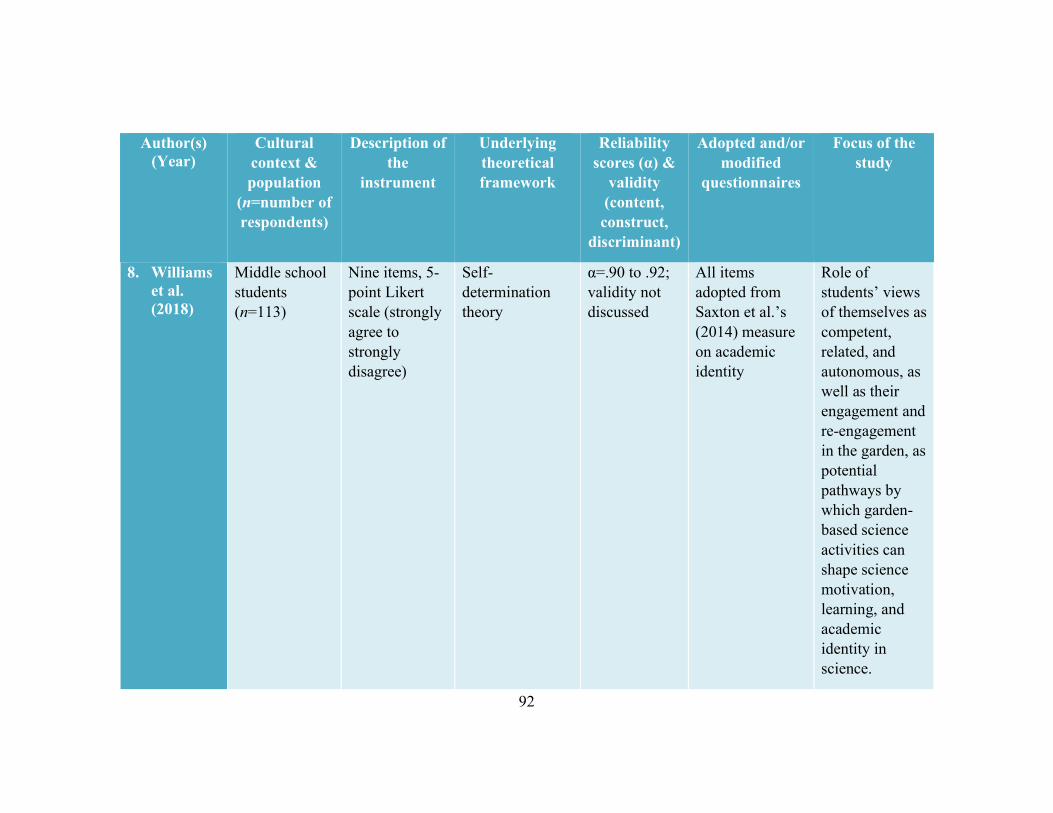
92
Author(s) (Year)
Cultural context & population
(n=number of respondents)
Description of the
instrument
Underlying theoretical framework
Reliability scores (α) &
validity (content, construct,
discriminant)
Adopted and/or modified
questionnaires
Focus of the study
8. Williams et al. (2018)
Middle school students (n=113)
Nine items, 5-point Likert scale (strongly agree to strongly disagree)
Self-determination theory
α=.90 to .92; validity not discussed
All items adopted from Saxton et al.’s (2014) measure on academic identity
Role of students’ views of themselves as competent, related, and autonomous, as well as their engagement and re-engagement in the garden, as potential pathways by which garden-based science activities can shape science motivation, learning, and academic identity in science.
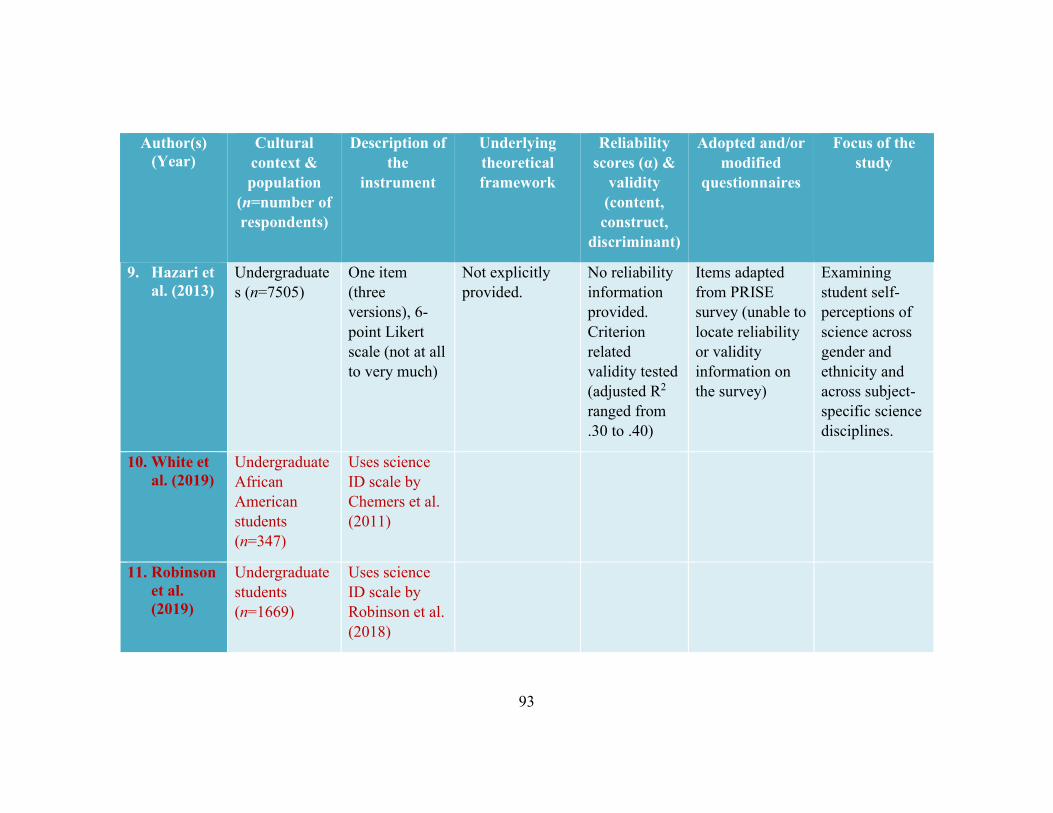
93
Author(s) (Year)
Cultural context & population
(n=number of respondents)
Description of the
instrument
Underlying theoretical framework
Reliability scores (α) &
validity (content, construct,
discriminant)
Adopted and/or modified
questionnaires
Focus of the study
9. Hazari et al. (2013)
Undergraduates (n=7505)
One item (three versions), 6-point Likert scale (not at all to very much)
Not explicitly provided.
No reliability information provided. Criterion related validity tested (adjusted R2 ranged from .30 to .40)
Items adapted from PRISE survey (unable to locate reliability or validity information on the survey)
Examining student self-perceptions of science across gender and ethnicity and across subject-specific science disciplines.
10. White et al. (2019)
Undergraduate African American students (n=347)
Uses science ID scale by Chemers et al. (2011)
11. Robinson et al. (2019)
Undergraduate students (n=1669)
Uses science ID scale by Robinson et al. (2018)
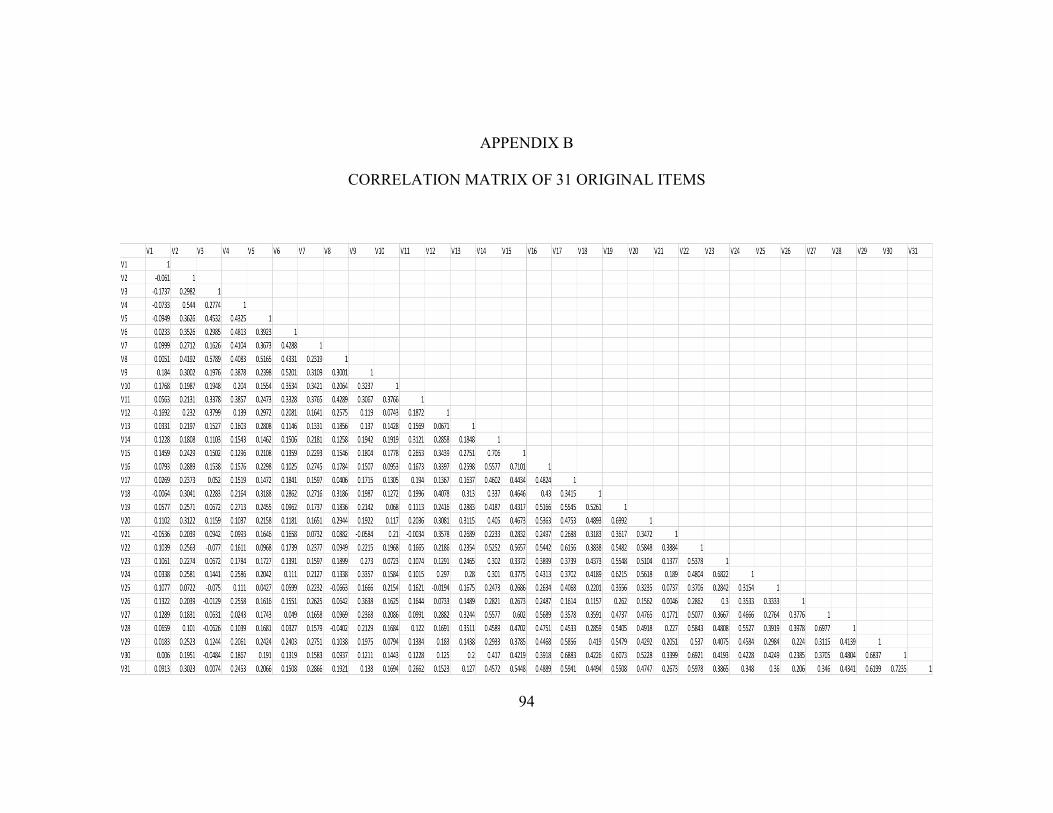
94
APPENDIX B
CORRELATION MATRIX OF 31 ORIGINAL ITEMS
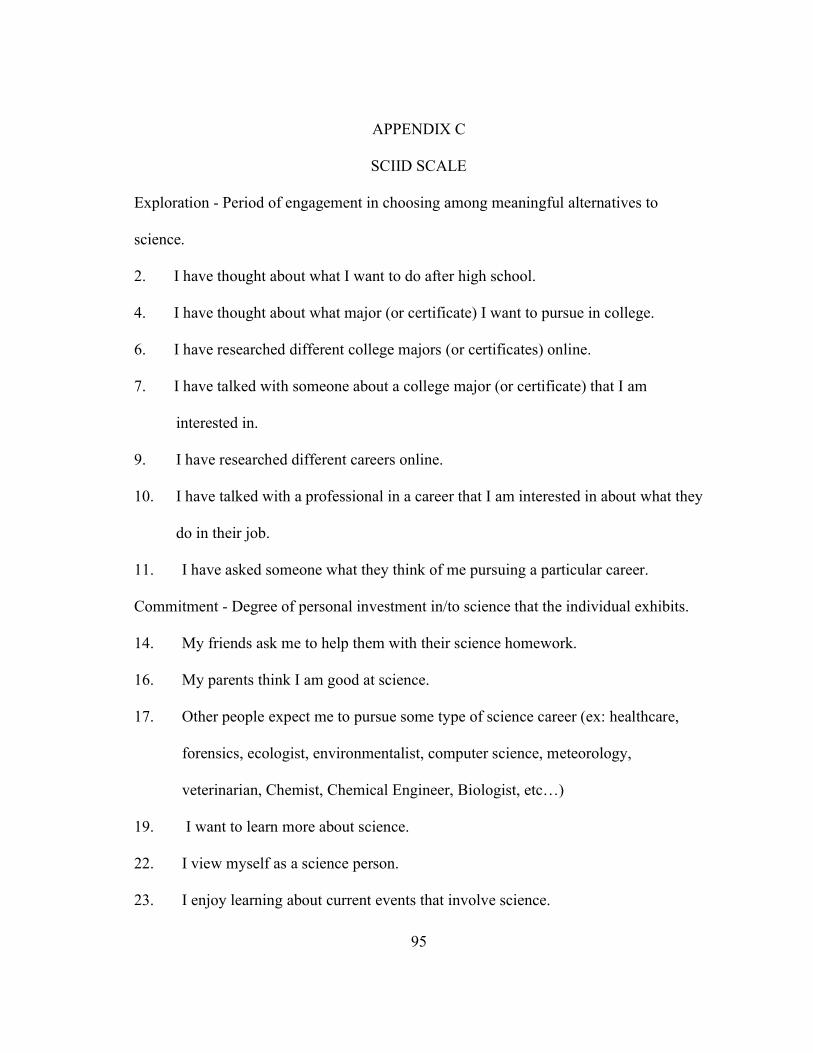
95
APPENDIX C
SCIID SCALE
Exploration - Period of engagement in choosing among meaningful alternatives to
science.
2. I have thought about what I want to do after high school.
4. I have thought about what major (or certificate) I want to pursue in college.
6. I have researched different college majors (or certificates) online.
7. I have talked with someone about a college major (or certificate) that I am
interested in.
9. I have researched different careers online.
10. I have talked with a professional in a career that I am interested in about what they
do in their job.
11. I have asked someone what they think of me pursuing a particular career.
Commitment - Degree of personal investment in/to science that the individual exhibits.
14. My friends ask me to help them with their science homework.
16. My parents think I am good at science.
17. Other people expect me to pursue some type of science career (ex: healthcare,
forensics, ecologist, environmentalist, computer science, meteorology,
veterinarian, Chemist, Chemical Engineer, Biologist, etc…)
19. I want to learn more about science.
22. I view myself as a science person.
23. I enjoy learning about current events that involve science.

96
25. I am involved in an extra-curricular science activity.
29. I will use some form of science in my future career.
31. Science will be a part of my future after high school.
Related Documents