Subscriber access provided by UNIVERSITE BORDEAUX 1 Inorganic Chemistry is published by the American Chemical Society. 1155 Sixteenth Street N.W., Washington, DC 20036 Article Local Coordination of Fe in Layered LiCo Al O Oxides Determined by High-Frequency Electron Paramagnetic Resonance Spectroscopy R. Stoyanova, A.-L. Barra, E. Zhecheva, R. Alca#ntara, G. Ortiz, and J.-L. Tirado Inorg. Chem., Article ASAP • DOI: 10.1021/ic802228e • Publication Date (Web): 13 April 2009 Downloaded from http://pubs.acs.org on April 15, 2009 More About This Article Additional resources and features associated with this article are available within the HTML version: • Supporting Information • Access to high resolution figures • Links to articles and content related to this article • Copyright permission to reproduce figures and/or text from this article

Welcome message from author
This document is posted to help you gain knowledge. Please leave a comment to let me know what you think about it! Share it to your friends and learn new things together.
Transcript

Subscriber access provided by UNIVERSITE BORDEAUX 1
Inorganic Chemistry is published by the American Chemical Society. 1155 SixteenthStreet N.W., Washington, DC 20036
Article
Local Coordination of Fe3+
in Layered LiCo1#y
Aly
O2
Oxides Determined byHigh-Frequency Electron Paramagnetic Resonance Spectroscopy
R. Stoyanova, A.-L. Barra, E. Zhecheva, R. Alca#ntara, G. Ortiz, and J.-L. TiradoInorg. Chem., Article ASAP • DOI: 10.1021/ic802228e • Publication Date (Web): 13 April 2009
Downloaded from http://pubs.acs.org on April 15, 2009
More About This Article
Additional resources and features associated with this article are available within the HTML version:
• Supporting Information• Access to high resolution figures• Links to articles and content related to this article• Copyright permission to reproduce figures and/or text from this article

Local Coordination of Fe3+ in Layered LiCo1-yAlyO2 Oxides Determined by High-
Frequency Electron Paramagnetic Resonance Spectroscopy
R. Stoyanova,*,† A.-L. Barra,‡ E. Zhecheva,† R. Alc�antara,§ G. Ortiz,§ and J.-L. Tirado§
†Institute of General and Inorganic Chemistry, Bulgarian Academy of Sciences, 1113 Sofia, Bulgaria,‡Grenoble High Magnetic Field Laboratory, CNRS, 38042 Grenoble Cedex 9, France, and §Laboratorio deQu�imica Inorg�anica, Facultad de Ciencias, Universidad de C�ordoba, 14071 C�ordoba, Spain
Received November 20, 2008
The local coordination of Fe3+ spin probes in trigonal LiAlyCo1-yO2 was studied using high-frequency electronparamagnetic resonance spectroscopy. This technique allows the determination of Fe3+ ions in respect to axial andrhombic zero-field splitting parameters (ZFS). After the progressive replacement of Co by Al, the axial D parameter ofFe3+ increases from +0.0548 to +0.2802 cm-1. On the same order, the rhombic E parameter decreases. Structuralinformation about the Fe3+ site in layered LiAlyCo1-yO2 oxides was based on modeling of the magnitude of the ZFSparameters by means of the Newman superposition model. It was found that the first metal coordination sphereincluding Co3+ and Al3+ ions gave rise to differentiation of the Fe3+ dopants in respect to local trigonal and rhombicdistortion. The maximum trigonal distortion for the FeO6 octahedron was achieved when Fe3+ spin probes weresurrounded by Al only, while the Co environment yields a rhombic distortion of the FeO6 octahedron.
Introduction
Lithium cobaltates, LiCoO2, with a layered structure,belong to the first generation of cathodematerials for lithiumion batteries, since they are able to de-intercalate and inter-calate lithium reversibly at a potential higher than 4 V.1,2
The reversible electrochemical extraction of Li+ fromLiO2 layers takes place concomitantly with the reversibleoxidation of Co3+ to Co4+ in CoO2 layers.3,4 One of theways tomanipulate the electrochemical properties of LiCoO2
is by the partial replacement of Co3+ with isovalent ions.4,5
Among several isovalent ions, the most attractive ones are
Al3+ andFe3+ ions, since they are cheaper and less toxic.5-12
While Fe3+ ions together with Co3+ ions participate in theelectrochemical reaction, Al3+ dopants remain electroche-mically inactive. However, a smooth increase in the potentialwhere Li is extracted has been found when Al substitutes forCo.5-7 The effect of Al3+ on the electronic structure of Co3+
ions has also been demonstrated by means of 27Al magicangle spinning (MAS) NMR spectroscopy.13 On the basis ofthe chemical shift of 27Al, it has been found that every Alnucleus located in the first coordinationmetal sphere leads tothe strengthening of the crystal field of Co3+ ions.13 For Fe-substituted LiCoO2, a novel structural feature has beenestablished by 57Fe M
::ossbauer spectroscopy.8,9,11,12,14 After
partial replacement of the Co3+ with Fe3+ (0 < x < 0.2),Fe3+ ions having a smaller isomer shift (0.24-0.19 mm s-1)appear. These ions have been assigned toFe3+ ions located inpseudotetrahedral sites in LiO2 layers or in square-pyramidalsites (in CoO2 layers) formed with the participation of anoxygen vacancy.12,14 The effect of Fe dopants on the struc-ture and electrochemical properties of LiCoO2 is still unclear.As a very sensitive technique, electron paramagnetic re-
sonance (EPR) spectroscopy is especially suitable for the
*To whom correspondence should be addressed. Phone: +359 029793915. Fax: +359 02 8705024. E-mail: [email protected].
(1) Winter, M.; Besenhard, J.; Spahr,M.; Novak, P.Adv.Mater. 1998, 10,725–763.
(2) Whittingham, M. S. Chem. Rev. 2004, 104, 4271–4301.(3) Ohzuku, T.; Ueda, A.; Nagayama, M.; Iwakoshi, Y.; Komori, H.
Electrochim. Acta 1993, 38, 1159–1167.(4) Alcantara, R.; Lavela, P.; Tirado, J.-L.; Zhecheva, E.; Stoyanova,R. J.
Solid State Electrochem. 1999, 3, 121–134.(5) Ceder, G.; Chiang, Y.-M.; Sadoway, D. R.; Aydinol, M. K.; Jang,
Y.-I.; Huang, B. Nature (London) 1998, 392.(6) Alc�antara, R.; Lavela, P.; Rela~no, P. L.; Tirado, J. L.; Zhecheva, E.;
Stoyanova, R. Inorg. Chem. 1998, 37, 264–269.(7) Yoon, W.-S.; Lee, K.-K.; Kim, K.-B. J. Electrochem. Soc. 2000, 147,
2023–2028.(8) Alc�antara, R.; Jumas, J. C.; Lavela, P.; Olivier-Fourcade, J.;
P�erez-Vicente, C.; Tirado, J. L. J. Power Sources 1999, 81-82, 547–553.(9) Tabuchi, M.; Ado, K.; Kobayashi, H.; Sakaebe, H.; Kageyama, H.;
Masquelier, C.; Yonemura, M.; Hirano, A.; Kanno, R. J. Mater. Chem.1999, 9, 199.
(10) Holzapfel, M.; Schreiner, R.; Ott, A. Electrochim. Acta 2001, 46,1063–1070.
(11) McLaren, V. L.; West, A. R.; Tabuchi, M.; Nakashima, A.;Takahara, H.; Kobayashi, H.; Sakaebe, H.; Kageyama, H.; Hirano, A.;Takeda, Y. J. Electrochem. Soc. 2004, 151, A672–A681.
(12) Aldon, L.; Olivier-Fourcade, J.; Jumas, J.-C.; Holzapfel, M.; Darie,C.; Strobel, P. J. Power Sources 2005, 146, 259–263.
(13) Gaudin, E.; Taulelle, F.; Stoyanova, R.; Zhecheva, E.; Alcantara, R.;Lavela, P.; Tirado, J. L. J. Phys. Chem. B 2001, 105, 8081–8087.
(14) M�en�etrier, M.; Shao-Horn, Y.; Wattiaux, A.; Fourn�es, L.; Delmas,C. Chem. Mater. 2005, 17, 4653–4659.
Inorg. Chem. XXXX, XXX, 000–000DOI:10.1021/ic802228e
© XXXX American Chemical Society pubs.acs.org/IC
A
determination of the immediate environment of transitionmetal ions. For example, the effect of mixed Co/Al neighborson both the symmetry and the strength of the crystal field oftransitionmetal ions has been demonstrated by analyzing theEPR spectra of low-spin Ni3+ ions used as spin probes inlayered LiAlyCo1-yO2 and LiGayCo1-yO2.
15,16 A localtetragonal distortion of Ni3+ ions is observed when theyare located in amixed Co6-yAly environment.15 The strengthof the crystal field for Ni3+ increases gradually, and theextent of the tetragonal distortion shows a tendency toincrease along the progressive replacement of Co by Al. 15
Here, we extend our study concerning the effect of metalneighbors on the symmetry and the strength of the crystalfield of transition metal ions in layered LiAlyCo1-yO2
oxides by using Fe3+ as spin probes. An important piece ofinformation coming from the analysis of EPR spectra ofFe3+ ions is the splitting of the six magnetic sublevels of theground stateS=5/2 level into zero-magnetic field (zero-fieldsplitting, ZFS).17-19 This splitting is parametrized by a termin the phenomenological spin-Hamiltonian that is biquadra-tic in the electron spin:
H ¼ βSgB þD½S2z -SðS þ 1Þ=3 þ ðE=DÞðS2
x -S2y Þ ð1Þ
where β is the Bohr magneton and B is the applied magneticfield. The parameters that are highly sensitive toward thelocal environment are the axial and rhombic ZFS parameters(D and E, respectively). Going from axial to rhombic sym-metry, the E-to-D ratio varies from 0 to 1/3. Depending onthemagnitude of theD parameter in regard to themicrowavequantum, the EPR response of the system can be divided intotwo different cases:18 (i) low-field approximation where Dvalues are smaller than hν and (ii) high-field approximationwith D . hν. The first case is usually met with the conven-tional X-band EPR experiments (hν ≈ 0.3 cm-1), as a resultof which the determination of ZFS parameters is not un-ambiguous. For accurate determination of the ZFS para-meters, the use of microwave frequencies exceeding the finestructure interactions is needed.19
Due to the lack of orbital angularmomentum for the Fe3+
ground state (6S5/2), the g matrix has usually very smallanisotropy, while the origin of the ZFS parameters is com-plex. Several mechanisms comprising the direct dipole-dipole interaction of unpaired electrons and the spin-orbitcoupling of excited states into the ground state contribute tothe ZFS. 20,21 Among them, it is accepted that spin-orbitcoupling is dominant forFe3+ complexes. 20,21 For structuralmodeling of the local environment, it has been shown that theZFS parameters can be calculated in the framework of thesemiempirical Newman superposition model (NSM). 22,23
According to this model, ZFS parameters are regarded by asuperposition of individual contributions of separate neigh-
boring ligands. The assumption is that the contribution ofligands is restricted toward the nearest neighbors, and theinteraction between the ligands is ignored. The NSM expres-sion for the zero-field splitting parameters is as follows:
bq2 ¼ 3b-2 ðRoÞ
Xi
Ro
Ri
� �tk
Kq2 ðΘi,φiÞ ð2Þ
where b2q represents the fine-structure parameters, which are
related to the experimentally available axial and rhombicZFS: D = b2
o and E = 1/3b22.23,24 Here, Ri is the distance
between the ith ligand and the paramagnetic ion, Θi and ji
are the polar and axial angles, and K2q denotes the coordina-
tion factor that, for a trigonal symmetry, is expressed byK2o = 1/2(3 cos
2 Θ - 1) and K22 = 3/2sin
2 Θ cos 2j.23-25 Thepower-law exponent tk and single ligand contribution b2(R0)are specific for a particular ion-ligand system. As a semi-empirical model, the superposition model has shown to bequite successful in explaining the crystal field splitting.The aim of this study is to determine the local coordination
of Fe3+ spin probes in layeredLiAlyCo1-yO2 oxides by usinghigh-frequency EPR (HF-EPR). Solid solutions betweenLiCoO2 and LiAlO2 were prepared by the citrate precursormethod. On the basis of 27Al NMR, it has been shown thatthis method is suitable for the preparation of LiAlyCo1-yO2
oxides in which Co and Al are statistically distributed withinthe layers.13 Structural information about the Fe3+ site inlayered LiCo1-yAlyO2 oxides was based on modeling themagnitude of the ZFS parameter in terms of the Newmansuperposition model. For the determination of the ZFSparameter, HF-EPR spectroscopy was undertaken.
Experimental Section
Samples of LiAlyCo1-yO2 with 0e ye 0.8 were preparedby the citrate precursor method, as described elsewhere.13
Thismethod consists of the thermal decomposition of freeze-dried Li-Co-Al-citrate complexes and permits the obtain-ment of pure LiAlyCo1-yO2 solid solutions. Lithium-co-balt-aluminum-citric acid compositions were obtained bydissolving Li2CO3, CoCO3, and Al(NO3)3 3 9H2O in aqueoussolutions of citric acid (0.1M) at 80 �C.The ratio between thecomponents was as follows: Li/(Co + Al)/Cit = 1:1:1 andAl/(Co + Al) = 0, 0.1, 0.5, and 0.8. In this solution, ironnitrate of a low concentration level was added (Fe/(Fe+Co+ Al) = 0.005). After complexation, the solution obtainedwas cooled down to room temperature, then frozen instantlywith liquid nitrogen and dried in a vacuum (20-30 mbars)at -20 �C with an Alpha-Crist Freeze-Dryer. After drying,the solid residues were decomposed at 450 �C with a heatingrate of 1�/min andwere further heated at 800 �C for 24 h. Forthe sake of comparison, a commercial LiCoO2 (Aldrich, Lot#20804PR) containinge 0.002% Fe was used.Themetal content of the samples was determined by atom-
ic absorption analysis. The mean oxidation state of cobaltwas determined by iodometric titration.X-ray structural analysiswasmadeusing aBrukerAdvance
8 diffractometer with Cu KR radiation. Step-scan recordingsfor structure refinement by the Rietveld method were carriedout using 0.03� 2θ steps of 10 s duration. The computerprogram FULLPROF was used in the calculations.26 Inagreement with previous structural characterization,13 the
(15) Stoyanova, R.; Zhecheva, E.; Alc�antara, R.; Tirado, J. L. J. Phys.Chem. B 2004, 108, 4053–4057.
(16) Zhecheva, E.; Stoyanova, R.; Alc�antara, R.; Tirado, J. L. J. Phys.Chem. B 2003, 107, 4290–4295.
(17) Hagen, W. R. Coord. Chem. Rev. 1999, 192, 209–229.(18) Anderson, K. K.; Schmidt, P. P.; Ketterle, B.; Strand, K.; Palmer, A.;
Lee, S.-K.; Solomon, E. I.; Gr::aslund, A.; Barra, A.-L. J. Biol. Inorg. Chem.
2003, 8, 235–247.(19) Krzystek, J.; Ozarowski, A.; Telser, J. Coord. Chem. Rev. 2006, 250,
2308–2324.(20) Wan-Lu, Y.; Min-Guang, Z. Phys. Rev. B 1988, 37, 9254–9267.(21) Zein, S.;Duboc,C.;Lubitz,W.;Neese,F. Inorg.Chem.2008,47, 134–142.(22) Newman, D. J. Adv. Phys. 1971, 20, 197.(23) Newman, D. J.; Ng, B. Rep. Prog. Phys. 1989, 52, 699.
(24) Rudowich, C.; Madhu, S. J. Phys.: Condens. Matter 1999, 11, 273.(25) Siegel, E.; M
::uller, K. A. Phys. Rev. B 1979, 20, 3587–3596.
(26) Rodr�iguez-Carvajal, J. In Satellite Meeting on Powder Diffraction ofthe XV Congress of the IUCr; International Union of Crystallography:Chester, England, 1990; p 127
Inorg. Chem., Vol. XXX, No. XX, XXXX Stoyanova et al.B

structural model used comprised Li in 3b sites (0 0 0.5),Co1-yAly in 3a sites (0 0 0), and oxygen in 6c sites(0 0 z) for the R3m space group. The Li/(Co + Al) andAl/(Co + Al) ratios were imposed by the chemical composi-tion of the oxides. The Fe dopants (0.5%) are not included inthe refinement procedure due to the close scattering factors ofCo and Fe. The refined structural parameters are as follows:a = 2.8153, c = 14.0495, and z = 0.2592 for LiCoO2;a=2.8128, c=14.0908, and z=0.2595 for LiAl0.1Co0.9O2;a=2.8069, c=14.1736, and z=0.2599 forLiAl0.5Co0.5O2; a=2.8028, c=14.2169, and z=0.2620 for LiAl0.8Co0.2O2. Itis noticeable that the crystal structure parameters of Fe-dopedand undoped LiAlyCo1-yO2 oxides remain the same. For thesake of comparison, the structural parameters for layeredmodification of LiAlO2 (prepared at atmospheric pressure)are a= 2.7993 and c= 14.18.27
EPRmeasurements at 9.23GHz (X-band)were carried outin a ERS 220/Q spectrometer within the temperature range85-410 K. The g factors were established with respect to aMn2+/ZnS standard. The high-frequency EPR spectra wererecorded on a single-pass transmission EPR spectrometerbuilt at the High-Magnetic Field Laboratory, Grenoble,France. The frequencies were changed from 95 to 345 GHzusing Gunn diodes and their multipliers. The detection ofabsorption was performed with a bolometer. The recordingtemperatures were varied from 5 to 300 K using a variable-temperature insert (Oxford Instruments). The simulationsoftware SIMwritten byWeihewas used to extract numericalvalues of spin Hamiltonian parameters from experimentalEPR spectra. 28,29 The program is based on a full-matrixdiagonalization procedure and allows generation of the pow-der pattern EPR spectra of spin systems with any values ofzero-filed splitting parameters relative to the operating fre-quencies. This program also takes into account the Boltzmanpopulation factor in calculating the EPR intensities. TheLorentzian line shape and a line width varying between 5.5and 7.5 mT were used in the fitting procedure.
Results
EPR Spectroscopy of Fe3+ Spin Probes in LayeredLiCoO2. Figure 1 shows the X-band EPR spectra ofFe3+ dopants in layered LiCoO2. As one can see, theEPR signals simultaneously broaden with an increase inthe Fe content, but the EPR patterns remain unchanged.This indicates that the EPR signal comes from Fe3+.The EPR spectrum consists of several resonance lines
spanned over a wide field range. The two sets of lines witheffective g values of 4.9/4.0 and 2.0/1.9 are well distin-guished, while the other sets of lines are with lowerintensities and higher line widths. These powder EPRpatterns imply that a low-field approximation model isfulfilled, that is, the D parameter of Fe3+ has a valuecomparable with the energy of the microwave frequency(hν≈ 0.3 cm-1). The signal splitting at about 160 mT and330 mT points to an increased |E/D| ratio, which isexpected to vary from 1/5 to 1/4. In addition, a singleLorentzian line with g = 2.14 is superimposed onto theEPR signal of Fe3+. This signal has been assigned to alow-spin Ni3+ impurity. Due to the high sensitivity of theEPR spectroscopy in the X region, even small amounts ofparamagneticNi3+ ions replacingCo3+ in the diamagnetic
LiAlyCo1-yO2 can be detected by EPR (less than 0.05%,which is the common impurity content for cobalt saltswithout special purification). 30,6
To determine D and E parameters, the use of highfrequencies is needed. Figure 2 presents the HF-EPRspectrum of Fe3+ spin probes in LiCoO2. As one canexpect, the high-field approximation is fulfilled when theEPR spectrum is registered at 285 GHz (Figure 2). At 100K, the HF-EPR spectrum consists of a central signal withtetragonal symmetry. The values of the g tensor are asfollows: g^ = 1.9921 and g ) = 2.0027. The small aniso-tropy in the g tensor of Fe3+ has been reported for iron-doped LiNbO3 where g ) > g^.
31 In addition, weakersignals that are shifted downfield and upfield, as com-pared to the central tetragonal signal, become visible. Oncooling, the intensity of the central tetragonal signaldecreases at the expense of the outer signals. At 5 K, thetwo intensive outermost signals at 10.0 and 10.4 Tdominate the EPR spectrum. It is noticeable that the
Figure 1. Experimental X-band EPR spectrum of Fe3+ in layeredLiCoO2 containing 0.002% Fe (a), LiFe0.005Co0.995O2 (b), simulatedEPR spectrum of Fe3+ with D = 0.0495 cm-1 and |E/D| = 0.236(c), and experimental EPR spectrum of Ni3+ ions in LiNi0.005Co0.995O2
(d). The asterisk denotes the impurity Ni3+ ions.
Figure 2. Experimental (left) and simulated (right) EPR spectra at 285GHz of Fe3+ in layered LiFe0.005Co0.995O2. The operating temperature is5 K (a), 30 K (b), and 100 K (c). The asterisk denotes the signal due to theimpurity Ni3+ ions.
(27) Poeppelmeier, K. R.; Chiang, C. K.; Kipp, D. O. Inorg. Chem. 1988,27, 4523–4524.
(28) Glerup, J.; Weihe, H. Acta Chem. Scand. 1991, 45, 444.(29) Weihe, H. SIM; Institute of Chemistry, University of Copenhagen:
Copenhagen, Denmark.
(30) Stoyanova, R.; Zhecheva, E.; Alcantara, R.; Lavela, P.; Tirado, J.-L.Solid State Commun. 1997, 102, 457–462.
(31) Keeble, D. J.; Loyo-Menoy, M.; Furukawa, Y.; Kitamura, K. Phys.Rev. B 2005, 71, 224111.
Article Vol. XXX, No. XX, XXXXInorg. Chem., C

outermost signals are broadened as compared to thecentral tetragonal signal.The structured EPR pattern of Fe3+ ions can be under-
stood taking into account theFS interactions for the high-field approximation.18,32 According to these conditions,the central tetragonal signal corresponds to the |-1/2>to |+1/2> transition, while outer lines come from non-central allowed transitions (|(5/2> to |(3/2> and|(3/2> to |(1/2>, respectively). The line positionsdepend on both the magnitude ofD and the E-to-D ratio,while the line intensities reflect the population of (2S+1)states. For the axially symmetric system (E/D=0), thereare three sets of lines shifted from the central line at(4D,(2D, and(D, while for the rhombic system (E/D=1/3),two set of lines at (4D and (2D appear. 32 Inthe intermediate case (0 < E/D < 1/3), the lines aresplit, and the EPR spectrum becomes more complex. 18,32
By increasing the microwave frequency and by loweringthe operating temperature, only the lowest energy level ofthe S multiplet is thermally populated, which simplifiesthe complex EPR spectrum. This is known as the polar-ization effect of HF-EPR spectroscopy: at 285 GHz, thepolarization effect appears below 15 K.18
The frequency and temperature dependence of theposition and intensity of the structured EPR spectrumallows a rough estimation of the magnitudes of theD andE parameters. In addition, the variation in the EPRpatterns indicates that only one type of Fe3+ ion givesrise to the EPR spectrum of LiCoO2. For Fe
3+ in pureLiCoO2, the observed distance between the central lineand the outermost line indicates that theD value has to beabout 55 mT, while the line splitting is consistent with anE-to-D ratio slightly lower than 1/3. The suggested valueof the E-to-D ratio is in agreement with that expectedfrom the X-band EPR spectrum: 1/5 < |E/D| < 1/4.Using these values as initial parameters, the powder EPRspectrum is generated by a simulation programwritten byWeihe.28,29 By comparing the generated EPR spectrumwith the experimental one, the refined D and E para-meters are determined and are shown in Table 1. Thebroadening of the outermost signals as compared to thecentral tetragonal signal is related to aD-strain contribu-tion to the EPR line width. The introduction of the D-strain broadening leads to the improvement of the fittingprocedure: δD = 0.0007 cm-1. As one can see fromTable 1, the D parameter increases with a lowering ofthe operating temperature, while the E-to-D ratio slightlydecreases. Since the E-to-D ratio is higher than 0.2, thesign of D has no physical meaning. However, for thesimulation of the EPR spectra, the positive D value wasused. To check the correctness of experimentally obtainedD andE parameters, Figure 1 displays the simulated EPRspectrum at a lower frequency (9.23GHz, X-band experi-ments). As one can see, there is satisfactory agreementbetween the experimental and simulated EPR spectra.EPR Spectroscopy of Fe3+ Spin Probes in LiAlyCo1-
yO2 Solid Solutions. When Al substitutes for Co in LiAly-Co1-yO2, the EPR spectrum of Fe3+ spin probes under-goes strong changes (Figure 3). By increasing the Alcontent, the central signal is split into several components.
In the same sequence, the number of the upperfield linesincreases and becomes higher as compared to the numberof downfield lines. As in the case of Fe3+ in pure LiCoO2,the intensity of the central signal increases with increasingoperating temperature, while the intensities of the outerlines decrease. In addition, the outermost signals remainbroadened as compared to the central lines. Close inspec-tion of Figure 3 shows that the EPR spectra of Fe3+ inintermediate compositions (containing 10 and 50% Al)can be presented as a convolution of the EPR spectra ofFe3+ in two end compositions: LiCoO2 and LiAl0.8-Co0.2O2.For LiAl0.8Co0.2O2, the two outermost signals (at 9.44
and 11.34T) are significantly shifted as compared to thoseobserved for Fe3+ in pure LiCoO2 (at 10.00 and 10.40 T).The increased distance between the downfield line and thecentral line indicates an increased magnitude of the Dparameter, reaching a maximum of 280 mT. The highernumber of upperfield lines can be simulated if we supposethat the D parameter and the E-to-D ratio take severalvalues. The procedure to extract numerical values of Dand E parameters was the same as in the case of Fe3+ inpure LiCoO2. Figure 4 shows the contribution of eachFe3+ ion (having different ZFS parameters) to the EPRpatterns of Fe-doped LiAl0.8Co0.2O2. The refined D andE parameters of Fe3+ in LiAl0.8Co0.2O2 are also given inTable 1. It appears that the D parameter possessesdiscrete values which are spread from 0.17 to 0.28 cm-1.In all cases, the D values for Fe3+ in LiAl0.8Co0.2O2 aregreater compared to that of Fe3+ in pure LiCoO2
(D = 0.0548 cm-1). The E-to-D ratio varies from0.05 to 0.33 for Fe3+ in LiAl0.8Co0.2O2 oxides. The signof D is determined in the case when the E-to-D ratio islower than 0.2. From the temperature variation of theEPR transitions, it appears that the D parameter ispositive.For intermediate compositions containing 10 and 50%
Al, the outer signals become broader. As in the case ofFe3+ in LiAl0.8Co0.2O2, the fitting of experimental EPRspectra is achieved by invoking Fe3+ species havingdifferent D and E parameters. The refined values areshown in Table 1. By increasing the Al content, themagnitude of D increases together with a decrease in theE-to-D ratio.To check the correctness of the experimentally ob-
tained D and E parameters, EPR experiments at lower
Table 1. g-Tensor and ZFS Parameters for Fe3+-Doped LiAlyCo1-yO2 Host
matrix g1 g2 g3 D, cm-1 E/D
LiAl0.8Co0.2O2 1.9976 1.9984 2.0030 0.2802 0.0781.9973 1.9980 2.0028 0.2362 0.1661.9973 1.9978 2.0026 0.2015 0.2251.9968 1.9968 2.0026 0.1768 0.327
LiAl0.5Co0.5O2 1.9948 1.9956 2.0024 0.2361 0.2011.9951 1.9958 2.0022 0.1941 0.1991.9948 1.9960 2.0028 0.1684 0.0741.9951 1.9958 2.0017 0.0871 0.026
LiAl0.1Co0.9O2 1.9926 1.9933 2.0030 0.0912 0.329LiCoO2 1.9911 1.9922 2.0030 0.0545 0.262LiCoO2 (T = 30K) 1.9911 1.992 2.0030 0.0528 0.250LiCoO2 (T = 100K) 1.9911 1.9922 2.0030 0.0492 0.242Fe3+ in the Co site of LiCoO2
a 0.305Fe3+ in the Li site of LiCoO2
a -0.225aCalculated using the superposition model.
(32) Wood, R.M.; Stucker, D.M.; Jones, L.M.; Bryan Lunch,W.;Misra,S. K.; Freed, J. H. Inorg. Chem. 1999, 38, 5384–5388.
Inorg. Chem., Vol. XXX, No. XX, XXXX Stoyanova et al.D
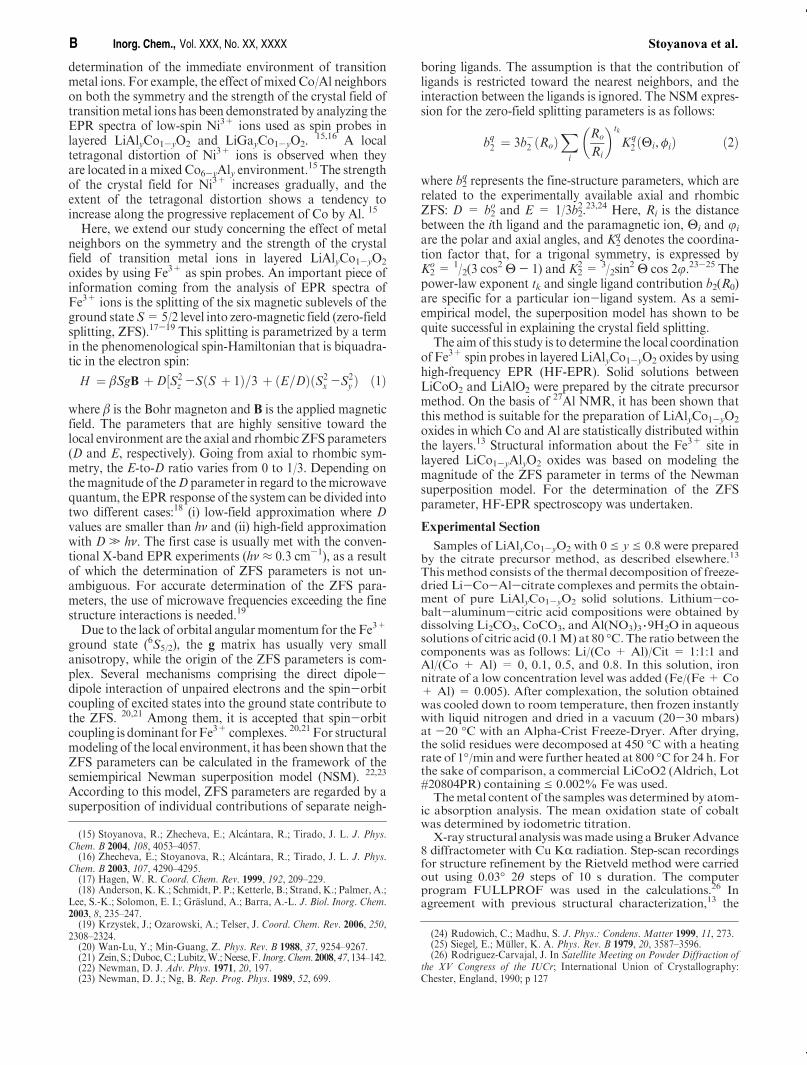
frequencies were undertaken. Figure 3 gives the Fe3+
EPR spectra registered at 95 and 190 GHz. Using the Dand E values determined at 285 GHz, the same figuregives the simulated EPR spectra at these frequencies. Asone can see, there is a satisfactory agreement between theexperimental and simulated EPR spectra. In the X-bandexperiments, the EPR spectra display an intensive signalwith an effective g value at about 6 (Figure 5). This meansthat the signal coming from Fe3+ with a lower E-to-Dratio dominates in the EPR spectra of LiAl0.8Co0.2O2
oxides.
Discussions
The experimentally determined fine-structure parameters(D and E) for the Fe3+ ion allow us to analyze the localcoordination of Fe3+ in LiAlyCo1-yO2 oxides. The crystalstructure of LiAlyCo1-yO2 (space group R3m, R-NaFeO2-type) is composed of a consecutive arrangement of Li+ andAlyCo1-y
3+ ions in the close-packed oxygen arrays, leading to
the formation of discrete lithium and cobalt-aluminumlayers.27,33,34 The metal layers are built of edge-sharingMO6 octahedrawhere the host site symmetry is the trigonallydistorted octahedron (Figure 6). If Fe3+occupies the trigonalhost site, the D parameter can be expressed within theframework of the semiempirical superposition model asfollows:
b02 ¼ 3b-2 ðRoÞ Ro
R
� �t2
ð3 cos2 Θ-1Þ ð3Þ
whereR is the Fe-O bond length and the trigonal distortionangleΘ stands for the angle between the Fe-Obond and the3-fold axis (for the undistorted octahedron, the Θ value is54.74 �). These structural parameters are shematically pre-sented in Figure 6. For the trigonal host site, theE parameter
Figure 3. Experimental (top) and simulated (bottom)EPRspectra at 285, 190, and95GHzofFe3+ in layeredLiFe0.005(AlyCo1-y)0.995O2with y=0.1, 0.5,and 0.8. The operating temperature is 5 K.
(33) Orman, H. J.; Wiseman, P. J. Acta Crystallogr., Sect. C 1984, 4012–14.
(34) Marezio, M.; Remeika, J. P. J. Chem. Phys. 1966, 44, 3143.
Article Vol. XXX, No. XX, XXXXInorg. Chem., E

has to be zero. From this equation, it is clear that theadaptation of adequate intrinsic parameters t2 and b(Ro) isof significance. Taking into account the available literaturedata on Fe3+ in different matrices (such as PbTiO3, SrTiO3,BaTiO3, PbZrO3, LiTaO3, and LiNbO3
25,31,35-39), the in-trinsic parameters of Fe3+ in MgO are successfully adoptedfor the determination of the local Fe3+ environment. Theseparameters are t2=8, b(Ro)=-0.412 cm-1, andRo=2.101A. 25,35 In our analysis, we also used these parameters. For thedetermination of the host AlyCo1-y-O bond length and thehost trigonal angle Θ, the positions of oxygen atoms sur-rounding Li and AlyCo1-y ions in the layers were taken fromthe Rietveld refinement of powder XRD patterns of LiAly-Co1-yO2.Table 1 gives the calculated values of the D parameter for
Fe3+ supposing that Fe3+ occupies a Li or Co1-yAly site.The important finding is that the sign of D is changed fromnegative to positive when Fe3+ ions aremoved from the Li tothe Co1-yAly site, that is, from a trigonally elongatedoctahedron to a trigonally compressed octahedron. Thisfeature is supported by experimental data on Fe3+ dopantsin several matrices. For example, Fe3+ dopants in a CdCl2matrix adopting a trigonally compressed local environment(R=2.404 A and θ=59.02) possess a positiveD parameter(+0.1697 cm-1),40 while Fe3+ centers located in a trigonallyelongated octahedron (2.039e Re 2.075 A and 53.566eΘe 53.867�) in germanate garnets Ca3M2Ge3O12 (M = Al,Ga, Sc, In, Lu) exhibits a negativeD parameter (varying from-0.0405 to-0.0367 cm-1).41Analysis of theHF-EPRspectraof Fe3+ in layered LiAlyCo1-yO2 oxides shows that the Dparameter has a positive sign. Thismeans that Fe3+ occupiesa trigonally compressed site, which is available in the Aly-Co1-yO2 layers.Fromeq3, it is clear that themagnitude of theD parameter
will increase with the increasing extent of trigonal distortionof the FeO6 octahedron and with the lowering of the Fe-Obond length. For Al-containing oxides, the host Co0.2Al0.8O6
octahedron is more distorted and the mean Co0.2Al0.8-Obond length is shorter as compared to the Co-host site: R=1.91 A andΘ= 57.93 for Co0.2Al0.8O6 and R= 1.93 A andΘ = 57.35 for CoO6. As a result, the D value of Fe3+ inLiAlyCo1-yO2 has to be higher than that of Fe3+ in Coanalogues. This suggestion is consistent with the observationthat theDmagnitude increaseswith theAl content.However,a comparison shows that the experimentally obtained Dvalues are lower in regard to that calculated if Fe3+ sub-stitutes isomorphically for Co3+ or Al3+/Co3+ ions intransition metal layers of LiCoO2 or LiAl0.8Co0.2O2, respec-tively. This discrepancy indicates a local structural distortionaroundFe3+ ions located in the transitionmetal layers. Fromthe lower D values, it appears that the local structural
Figure 5. Experimental X-band EPR spectrum of Fe3+ in layeredLiFe0.005(AlyCo1-y)0.995O2 oxides with y=0.1, 0.5, and 0.8. The operat-ing temperature is 103 K.
Figure 6. Schematic representations of lithium and cobalt sites inLiCoO2 (blue and red octahedra, respectively). The metal-oxygen bondlength (RM and RM), trigonal distortion angle (ΘLi andΘM), and C3 axisare also shown.
Figure 4. Experimental EPR spectrum of Fe3+ in layered LiFe0.005(Al0.8Co0.2)0.995O2 and simulated EPR spectra for Fe3+ withD = 0.2802 cm-1 and E/D = 0.078 (sim 1), D = 0.2362 cm-1 andE/D = 0.166 (sim 2), D = 0.2015 cm-1 and E/D = 0.225 (sim 3), andD= 0.1768 cm-1 and E/D= 0.327 (sim 4).
(35) Siegel, E.; M::uller, K. A. Phys. Rev. B 1979, 19, 109–120.
(36) Me�stri�c, H.; Eichel, R.-A.; Kloss, T.; Dinse, K.-P.; Laubach, So.;Laubach, St.; Schmidt, P. C.; Sch
::onau, K. A.; Knapp, M.; Ehrenberg, H.
Phys. Rev B 2005, 71, 134109.(37) Me�stri�c, H.; Eichel, R.-A.; Dinse, K.-P.; Ozarowski, A.; van Tol, J.;
Brunel, L. C.; Kungl, H.; Hoffmann, M. J.; Sch::onau, K. A.; Knapp, M.;
Fuess, H. Phys. Rev. B 2006, 73, 184105.(38) Yeom, T. H. J. Phys.: Condens. Matter 2001, 13, 10471–10476.(39) Zhao, M. G.; Chiu, M. Phys. Rev. B 1994, 49, 12556–12558.(40) Cheng, L.; Yu, K. X.; Wei, Z. K. Solid State Commun. 2008, 145
565–570.(41) Zhang, C.-X.; Kuang, X.-Y.; Li, G.-D.; Wang, H. Chem. Phys. Lett.
2007, 441, 143–147.
Inorg. Chem., Vol. XXX, No. XX, XXXX Stoyanova et al.F
distortion comprises the increased Fe-O bond length andreduced extent of the trigonal distortion as compared to thehost site structure. The ionic size mismatch of Co3+, Al3+,and Fe3+ ions can be regarded as a driving force for localstructural distortion: while Co3+ and Al3+ have close ionicsizes (0.525 and 0.53 A), the ionic radius of Fe3+ is signifi-cantly higher (0.645 A). Supporting this suggestion, there isan increase in the mean bond lengths of Co-O, Al-O, andFe-O in layered LiCoO2, LiAlO2, and LiFeO2 analogues:1.930, 1.926, and 2.035 A, respectively.13,42 In the samesequence, the extent of the trigonal distortion decreases:57.35, 57.05, and 56.85, respectively. Since the Co-O andAl-O bond lengths are closer, one may expect that Fe3+
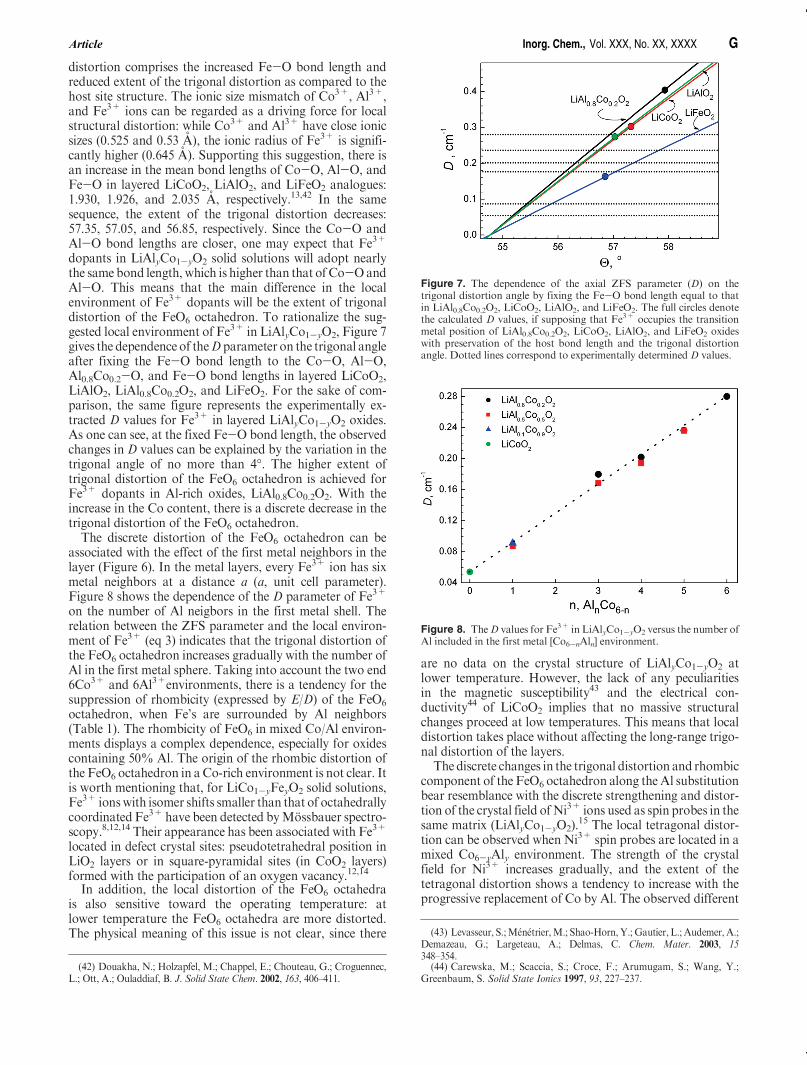
dopants in LiAlyCo1-yO2 solid solutions will adopt nearlythe same bond length, which is higher than that of Co-OandAl-O. This means that the main difference in the localenvironment of Fe3+ dopants will be the extent of trigonaldistortion of the FeO6 octahedron. To rationalize the sug-gested local environment of Fe3+ in LiAlyCo1-yO2, Figure 7gives the dependence of theD parameter on the trigonal angleafter fixing the Fe-O bond length to the Co-O, Al-O,Al0.8Co0.2-O, and Fe-O bond lengths in layered LiCoO2,LiAlO2, LiAl0.8Co0.2O2, and LiFeO2. For the sake of com-parison, the same figure represents the experimentally ex-tracted D values for Fe3+ in layered LiAlyCo1-yO2 oxides.As one can see, at the fixed Fe-O bond length, the observedchanges in D values can be explained by the variation in thetrigonal angle of no more than 4�. The higher extent oftrigonal distortion of the FeO6 octahedron is achieved forFe3+ dopants in Al-rich oxides, LiAl0.8Co0.2O2. With theincrease in the Co content, there is a discrete decrease in thetrigonal distortion of the FeO6 octahedron.The discrete distortion of the FeO6 octahedron can be
associated with the effect of the first metal neighbors in thelayer (Figure 6). In the metal layers, every Fe3+ ion has sixmetal neighbors at a distance a (a, unit cell parameter).Figure 8 shows the dependence of the D parameter of Fe3+
on the number of Al neigbors in the first metal shell. Therelation between the ZFS parameter and the local environ-ment of Fe3+ (eq 3) indicates that the trigonal distortion ofthe FeO6 octahedron increases gradually with the number ofAl in the first metal sphere. Taking into account the two end6Co3+ and 6Al3+environments, there is a tendency for thesuppression of rhombicity (expressed by E/D) of the FeO6
octahedron, when Fe’s are surrounded by Al neighbors(Table 1). The rhombicity of FeO6 in mixed Co/Al environ-ments displays a complex dependence, especially for oxidescontaining 50% Al. The origin of the rhombic distortion ofthe FeO6 octahedron in a Co-rich environment is not clear. Itis worth mentioning that, for LiCo1-yFeyO2 solid solutions,Fe3+ ionswith isomer shifts smaller than that of octahedrallycoordinated Fe3+ have been detected byM
::ossbauer spectro-
scopy.8,12,14 Their appearance has been associated with Fe3+
located in defect crystal sites: pseudotetrahedral position inLiO2 layers or in square-pyramidal sites (in CoO2 layers)formed with the participation of an oxygen vacancy.12,14
In addition, the local distortion of the FeO6 octahedrais also sensitive toward the operating temperature: atlower temperature the FeO6 octahedra are more distorted.The physical meaning of this issue is not clear, since there
are no data on the crystal structure of LiAlyCo1-yO2 atlower temperature. However, the lack of any peculiaritiesin the magnetic susceptibility43 and the electrical con-ductivity44 of LiCoO2 implies that no massive structuralchanges proceed at low temperatures. This means that localdistortion takes place without affecting the long-range trigo-nal distortion of the layers.The discrete changes in the trigonal distortion and rhombic
component of the FeO6 octahedron along the Al substitutionbear resemblance with the discrete strengthening and distor-tion of the crystal field ofNi3+ ions used as spin probes in thesame matrix (LiAlyCo1-yO2).
15 The local tetragonal distor-tion can be observed when Ni3+ spin probes are located in amixed Co6-yAly environment. The strength of the crystalfield for Ni3+ increases gradually, and the extent of thetetragonal distortion shows a tendency to increase with theprogressive replacement of Co by Al. The observed different
Figure 7. The dependence of the axial ZFS parameter (D) on thetrigonal distortion angle by fixing the Fe-O bond length equal to thatin LiAl0.8Co0.2O2, LiCoO2, LiAlO2, and LiFeO2. The full circles denotethe calculated D values, if supposing that Fe3+ occupies the transitionmetal position of LiAl0.8Co0.2O2, LiCoO2, LiAlO2, and LiFeO2 oxideswith preservation of the host bond length and the trigonal distortionangle. Dotted lines correspond to experimentally determined D values.
Figure 8. TheD values for Fe3+ in LiAlyCo1-yO2 versus the number ofAl included in the first metal [Co6-nAln] environment.
(42) Douakha, N.; Holzapfel, M.; Chappel, E.; Chouteau, G.; Croguennec,L.; Ott, A.; Ouladdiaf, B. J. Solid State Chem. 2002, 163, 406–411.
(43) Levasseur, S.;M�en�etrier,M.; Shao-Horn, Y.; Gautier, L.; Audemer, A.;Demazeau, G.; Largeteau, A.; Delmas, C. Chem. Mater. 2003, 15348–354.
(44) Carewska, M.; Scaccia, S.; Croce, F.; Arumugam, S.; Wang, Y.;Greenbaum, S. Solid State Ionics 1997, 93, 227–237.
Article Vol. XXX, No. XX, XXXXInorg. Chem., G
local distortions for Fe3+ and Ni3+ spin probes in layeredLiAlyCo1-yO2 are a consequence of their different electronicstructures: Fe3+ is an orbital singlet with a spin state higherthan 1/2, while the low-spin Ni3+ ion is an orbital doubletwith S= 1/2. In the trigonal layers, the doubly degeneratedground state ofNi3+ is unstable, a result ofwhich being that alocal tetragonal distortion is achieved. It is noticeable that ahigher local distortion takes place when Fe3+ and Ni3+ spinprobes are surrounded byAl3+ ions only. On the other hand,these studies demonstrate the applicability of HF-EPR spec-troscopy to local structural analysis of layeredLiAlyCo1-yO2
oxides.
Conclusions
The multifrequency EPR studies of Fe3+ spin probes inlayered LiAlyCo1-yO2 allow for distinguishing between sev-eral Fe3+ ions in respect to axial and rhombicZFS.Along theprogressive replacement of Co by Al, the axial D parameterincreases, while the rhombic E parameter shows a tendencyto decrease. For all LiAlyCo1-yO2 oxides, theD parameter is
positive, indicating that Fe3+ occupies a trigonally com-pressed octahedron site in AlyCo1-yO2 layers. The first metalcoordination sphere becomes important, and the nature ofthe atoms in their positions causes the local trigonal andrhombic distortion around Fe3+ ions. In a pure Co environ-ment, Fe3+ spin probes exhibit a lower extent of trigonaldistortion, but a high rhombic component. The maximumtrigonal distortion for the FeO6 octahedron was achievedwhen Fe3+ spin probes were surrounded by Al. On the sameorder, the rhombic component decreases.
Acknowledgment. The authors are indebted to theNational Science Fund of Bulgaria (Contract no.Ch1701/2007) for financial support. The high-frequencyEPR measurements carried out at the High MagneticFieldLaboratory inGrenoble, France, were supported bythe European Commission within the sixth frameworkprogramme “Transnational Access - Specific SupportAction” (contract No. RITA-CT-2003-505474) - “Ac-cess to research in very high magnetic field”.
Inorg. Chem., Vol. XXX, No. XX, XXXX Stoyanova et al.H
Related Documents