LNG Bunkering Operations Establish probabilistic safety distances for LNG bunkering operations. Nora Marie Lundevall Arnet Master of Science in Mechanical Engineering Supervisor: Reidar Kristoffersen, EPT Department of Energy and Process Engineering Submission date: April 2014 Norwegian University of Science and Technology

Welcome message from author
This document is posted to help you gain knowledge. Please leave a comment to let me know what you think about it! Share it to your friends and learn new things together.
Transcript
LNG Bunkering OperationsEstablish probabilistic safety distances for
LNG bunkering operations.
Nora Marie Lundevall Arnet
Master of Science in Mechanical Engineering
Supervisor: Reidar Kristoffersen, EPT
Department of Energy and Process Engineering
Submission date: April 2014
Norwegian University of Science and Technology

I
Preface This master thesis is written as a part of the five year Master Degree Program at the Department of Energy and Process Engineering at the Norwegian University of Science and Technology (NTNU). First of all I wish to express my gratitude to my supervisor Reidar Kristoffersen. Over my final year as a student at NTNU he has given me good academic guidance on report matters and great freedom in choosing a topic of interest. The thesis is written in cooperation with DNV GL. Lars Petter Blikom, Segment Director for Natural Gas, DNV GL, has been my industrial supervisor. I would like to thank Mr. Blikom for providing me with assistance on the topic and valuable insight from the industry. His support and encouragement throughout the process has been highly appreciated. I also wish to thank the Rotterdam team at DNV GL Maartje Folbert and Dennis van Meulen and the specialists on natural gas at DNV GL Høvik, Erik Skramstad and Katrine Lie Strøm, for their help on technical matters. Individuals who contributed with insight, relevant material and software guidance include; Sridhar Ketavarpu, Raghunathan Ramani and Geok Hoon Ong (DNV GL). Nora Marie Lundevall Arnet
II
Abstract The environmental and economical advantages of using LNG as marine fuel have been recognized by the industry. In response to increasing demand, construction of LNG bunkering infrastructure is under rapid development. Several ports are preparing to supply LNG, but uncertainties concerning the bunkering process and operational safety still exist. Recently, much work has been done to standardize LNG bunkering solutions, including a launch of an ISO guideline and a Recommended Practice (RP) by DNV. One of the main topics of these documents and of international discussion is operational safety and the establishment of safety zones around the operations. High risk is particularly associated with “vulnerable objects” (i.e. third parties, like ferry passengers) in the vicinity of the bunkering operation. Ferries are currently the main LNG fuel consumer and some ferries have passengers on at all times. Current regulations do not allow passenger presence during bunkering. This limitation reduces the functionality and competitiveness of LNG, and has proved to be problematic for ferry companies. The goal of this thesis is to establish probabilistic safety zones for a generic ship-‐to-‐ship (STS) bunkering case. Threats to vulnerable objects and the associated likelihood, in the event of an LNG leak, is identified. The specific purpose is to determine whether acceptable safety levels for passengers are present onboard a ferry performing LNG bunkering operations. This study will assess the risks involved and calculate safety zones through an established probabilistic approach, known as Quantitative Risk Assessment (QRA) methodology. This method includes frequency and consequence calculations of possible Loss of Containment (LOC) scenarios. The acceptable risk level for third parties per bunkering operation is assessed against the widely used criteria of 10-‐6. Based on the contour results provided by PHASTRisk (the DNV risk analysis software tool), it is clearly demonstrated that passenger safety can be maintained during bunkering operations. This study concludes that there is no unreasoning risk in allowing passenger presence during bunkering. Passenger safety issues should consequently not limit the application of LNG as fuel for ferries.
III
Sammendrag De miljømessige og økonomiske fordelene ved å bruke LNG som marint drivstoff er anerkjent av bransjen. Som svar på økende etterspørsel er bygging av infrastruktur for LNG-‐bunkring under utvikling. Flere havner forbereder seg på å levere LNG, men usikkerhet rundt bunkringsprosessen og driftssikkerheten eksisterer fortsatt. Mye arbeid har i den seneste tid blitt utført for å standardisere løsninger for LNG-‐bunkring, inkludert en lansering av ISO retningslinjer og en Recommended Practice (RP) av DNV. Ett av de viktigste temaene i disse dokumentene, og i internasjonale diskusjoner, er operasjonell sikkerhet og etablering av sikkerhetssoner rundt driften. Ferger er i dag den største forbruker av LNG som drivstoff. Noen ferger har tredjeparter ombord til alle tider, i form av passasjerer, og en høy risiko antas når det gjelder disse sårbare objektene (tredjepartene) i nærheten av bunkringsoperasjonen. Dagens regelverk tillater ikke tilstedeværelse av passasjerer under bunkring . Denne begrensningen reduserer funksjonaliteten og konkurransedyktigheten til LNG, og har vist seg å være problematisk for fergeselskaper . Målet med denne avhandlingen er å etablere probabilistiske sikkerhetssoner for et generisk skip-‐til-‐skip (STS) bunkringsanlegg. Trusler mot sårbare objekter, og deres sannsynlighet for å inntreffe i tilfelle av en LNG-‐lekkasje, er identifisert . Det spesifikke formålet er å avgjøre om akseptable sikkerhetssoner for passasjerene er til stede om bord på en ferge, under utføringen av LNG bunkringsoperasjoner. Dette studiet vil vurdere risikoen og beregne avstander gjennom en etablert probabilistisk tilnærmingsmetode, kjent som ’Quantitative Risk Assessment’ (QRA). Denne metoden inkluderer frekvens og konsekvensanalyse av mulige ’Loss of Containment’ (LOC) (norsk: tap av system integritet) scenarier. Nivået for akseptabel risiko for tredjeparter per bunkrings operasjon er vurdert opp mot det mest brukte kriteriet på 10-‐6. Basert på konturresultatene gitt av PHASTRisk (risikoanalyse-‐software fra DNV), er det tydelig demonstrert at passasjerenes sikkerhet kan opprettholdes under bunkringsoperasjoner. Resultatene i dette studiet konkluderer med at det ikke er noen urimelig risiko forbundet med passasjerers nærvær under bunkring. Passasjerenes sikkerhet bør derfor ikke være en barriere mot bruken av LNG som drivstoff for ferger.
IV
Content 1 Background ............................................................................................................................ 1 1.1 Motivation ....................................................................................................................... 1 1.2 Underlying Hypothesis ..................................................................................................... 2 1.3 Main Goal of Thesis ......................................................................................................... 3 1.4 Scope of Thesis ................................................................................................................ 3
2 Methodology .......................................................................................................................... 4 2.1 Safety Zone ...................................................................................................................... 4 2.1.1 Risk Acceptance Criteria ............................................................................................ 4 2.1.2 Purpose of the Safety Zone ....................................................................................... 5 2.1.3 Site-‐Specific Limitation .............................................................................................. 5 2.1.4 Layers of Defense (LOD) ............................................................................................ 6
2.2 Method ............................................................................................................................ 7 2.2.1 Deterministic Approach ............................................................................................ 7 2.2.2 Probabilistic Approach .............................................................................................. 7
2.3 Risk Management ............................................................................................................ 8 2.3.1 Establishing the Context ........................................................................................... 8 2.3.2 Risk Assessment ........................................................................................................ 9 2.3.3 Risk Treatment .......................................................................................................... 9 2.3.4 Risk Identification ..................................................................................................... 9 2.3.5 Risk Analysis ............................................................................................................ 10 2.3.6 Risk Evaluation ........................................................................................................ 11
2.4 Software Tools ............................................................................................................... 12 2.4.1 Frequency Analysis Tools ............................................................................................ 12 2.4.1.1 Fault Tree ............................................................................................................. 12 2.4.1.2 LEAK ..................................................................................................................... 12
2.4.2 Consequence Modeling Tools ..................................................................................... 13 2.4.2.1 PHAST 6.7 ............................................................................................................. 13 2.4.2.2 PHASTRisk 6.7 (Safeti) .......................................................................................... 13
3 Establishing the context ....................................................................................................... 14 3.1 STS Bunkering System .................................................................................................... 14 3.2 LNG Bunkering Configurations ...................................................................................... 14 3.3 STS Bunkering – Base Case ............................................................................................ 15 3.3.1 Personnel and Individual Involvement .................................................................... 15 3.3.2 System Regulations ................................................................................................. 15 3.3.3 System Limitations .................................................................................................. 16 3.3.4 System Boundaries .................................................................................................. 16 3.3.5 STS Bunkering Procedure ........................................................................................ 17 3.3.6 Operational Data ..................................................................................................... 17 3.3.7 Transfer Properties ................................................................................................. 17 3.3.8 Equipment Dimensions ........................................................................................... 18
3.4 LNG ................................................................................................................................ 19 3.4.1 LNG Characteristics ................................................................................................. 19 3.4.2 LNG Safety Issues .................................................................................................... 19 3.4.3 Outflow Scenarios ................................................................................................... 20
3.5 Nautical Activity ............................................................................................................. 22 3.5.1 Security Zone .......................................................................................................... 22
V
3.6 Weather Conditions ....................................................................................................... 23 3.6.1 Pasquil Stability ....................................................................................................... 23 3.6.2 Wind Rose ............................................................................................................... 23
3.7 Implemented Safeguards .............................................................................................. 25 3.7.1 Automatic Isolation ................................................................................................. 25 3.7.2 Operator Intervention ............................................................................................. 26 3.7.3 Isolation Times ........................................................................................................ 26 3.7.4 Probabilities of Failure ............................................................................................ 27
4 Risk Assessment ................................................................................................................... 28 4.1 Risk Identification .............................................................................................................. 28 4.1.1 Hazard Identification (HAZID) ..................................................................................... 28 4.1.2 Bow-‐Tie Model ........................................................................................................... 28 4.1.3 LNG Leak Causes ......................................................................................................... 29 4.1.3.1 Identification of Loss of Containment Scenarios ................................................. 30
4.1.4 LNG Leak Consequences ............................................................................................. 31 4.2 Risk Analysis ...................................................................................................................... 32 4.2.1 Frequency Analysis ..................................................................................................... 32 4.2.2 Transfer Hose Failure Frequencies ............................................................................. 32 4.2.2.1 Fault Tree ............................................................................................................. 33 4.2.2.2 Transfer Hose Failure Frequency Overview ......................................................... 36 4.2.2.3 Vapor Return ........................................................................................................ 37
4.2.3 Process Equipment Failure Frequency ....................................................................... 38 4.2.3.1 Process Equipment Failure Frequencies Overview .............................................. 43
4.3.4 Tanks Failure Frequencies .......................................................................................... 44 4.2.2 Consequence Modeling .............................................................................................. 45 4.2.2.1 Frequency Limit .................................................................................................... 45 4.2.2.2 Inventory .............................................................................................................. 55 4.2.2.3 Discharge Rate ..................................................................................................... 55 4.2.2.4 Assumptions for PHAST Modeling ....................................................................... 56 4.2.2.5 Raster Image -‐ STS Bunker Configuration ............................................................ 56 4.2.2.6 Assumptions for PHASTRisk Modeling ................................................................. 56 4.2.2.7 PHAST Working Procedure ................................................................................... 57 4.2.2.8 PHASTRisk Working Procedure ............................................................................ 57
4.3 Risk Evaluation .................................................................................................................. 58 4.3.1 PHAST Results ............................................................................................................. 58 4.3.1.1 Vapor Return Line ................................................................................................ 58 4.3.1.2 LNG Line ............................................................................................................... 58 4.3.1.3 Security Zones ...................................................................................................... 60 4.3.1.4 LFL Results ............................................................................................................ 61
4.3.2 PHASTRisk Results ...................................................................................................... 62 4.3.2.1 Total Contour Results for ½LFL ............................................................................ 62 4.3.2.2 Increased Nautical Activity Contour Results ........................................................ 63 4.3.2.3 LFL Contour Results .............................................................................................. 64 4.3.2.4 Process Section Contour Results .......................................................................... 65
4.3.3 Technology Advancements ......................................................................................... 67 4.3.3.1 Gasnor Experiences .............................................................................................. 67
5 Conclusion ............................................................................................................................ 69 6 Treatment of Residual Risk .................................................................................................. 70 6.1 Operating Conditions ..................................................................................................... 70 6.2 Hose Dimensions ........................................................................................................... 71 6.3 Emergency Release Couplers ......................................................................................... 71

VI
6.4 Isolation Times ............................................................................................................... 72 6.5 Release Parameters ....................................................................................................... 72 6.6 Probability of Fire .......................................................................................................... 72
Appendix A – Pasquil Stability Factors .................................................................................... 73 Appendix B – HAZID for STS Bunkering ................................................................................... 74 Appendix C – Risk Ranking Matrix ........................................................................................... 77 Appendix D – DNV RP accident scenarios ............................................................................... 78 Appendix E – Fault Tree Model ............................................................................................... 80 Appendix F – Hose Failure Frequency Calculations ................................................................. 83 Appendix G – PHAST Results (Maximum Dispersion Distances) ............................................. 84 Appendix H – PHASTRisk Result (Software View) .................................................................... 90 Reference List .......................................................................................................................... 91
VII
List of Figures Figure 1: ECA zones (source DNV) ............................................................................................. 2 Figure 2: Risk contours example (source DNV RP) .................................................................... 5 Figure 3: Layers of Defense (LOD) bow tie model (source DNV RP) .......................................... 6 Figure 4: Risk Management Content ......................................................................................... 8 Figure 5: Risk assessment content ............................................................................................ 9 Figure 6: Illustration of two-‐phase release of LNG (source DNV RP) ...................................... 10 Figure 7: STS Bunkering Arrangement .................................................................................... 15 Figure 8: LNG Bunkering Transfer System ............................................................................... 16 Figure 9: Explosion/Flammability Curve .................................................................................. 20 Figure 10: Wind rose example, Sola, Stavanger. ..................................................................... 24 Figure 11: Rule for bunkering arrangement (source DNV) ...................................................... 26 Figure 12: Identified failure mechanisms – LNG leakage causes ............................................ 29 Figure 13: LNG bunkering transfer system process sections .................................................. 30 Figure 14: Fault tree -‐ hose leak from damage/rupture ......................................................... 33 Figure 15: Fault tree -‐ hose leak from disconnection .............................................................. 33 Figure 16: Event Tree of Leak Scenarios .................................................................................. 42 Figure 17: LEAK Failure Frequencies for Process Equipment .................................................. 43 Figure 18: Total LEAK Failure Frequencies for Process Equipment ......................................... 43 Figure 19: Total ½LFL results ................................................................................................... 62 Figure 20: Increased nautical activity for ½LFL contour results .............................................. 63 Figure 21: LFL contour results ................................................................................................. 64 Figure 22: Transfer Hose contour results ................................................................................ 65 Figure 23: Process equipment contour results ....................................................................... 66 Figure 24: Tank contour results .............................................................................................. 66
VIII
List of Abbreviations NG – Natural Gas LNG –Liquefied Natural Gas HFO – Heavy Fuel Oil MDO – Marine Diesel Oil MGO – Marine Gas Oil LOC – Loss of Containment QRA – Quantitative Risk Assessment IMO – International Maritime Organization ISO – International Organization for Standardization RP – Recommended Practice ECA – Emission Control Area STS – Ship-‐to-‐Ship TTS – Truck-‐to-‐Ship PTS – Terminal (Pipeline)-‐to-‐Ship LOD – Layer of Defense AIR – Acceptable Individual Risk LSIR – Location-‐Specific Individual Risk HCRD – Hydrocarbon Release Database HSE – Safety Executive LEL – Lower Explosion Level UEL – Upper Explosion Level LFL – Lower Flammability Level UFL – Upper Flammability Level ½ LFL – half Lower Flammability Level ERC – Emergency Quick Release Connector/Couplers ESD – Emergency Shutdown Systems ERS – Emergency Release Systems ACDS – Advisory Committee on Dangerous Substances SIMOPS – Simultaneous Operations PLC – Programmable Logic Controller LCV – Level Control Valve P&ID – Piping and instrumentation diagram Sorted after order of appearance in the document.
1
1 Background
1.1 Motivation “The LNG industry is the fastest growing segment of the energy industry around the world.” Global oil is growing about 0.9% per annum, global gas at 2%, while Liquefied Natural Gas (LNG) has been growing at a comparatively soaring 4.5%. 1 “Lloyd’s Register believes LNG could account for up to 9% of total bunker fuel demand by 2025.” 2 Small-‐scale distribution and bunkering of LNG has been booming as well.3 LNG was created as an alternative to pipelines for transportation of natural gas (NG) over long distances in a more economical way. LNG is reduced to approximately 1/600th in volume through liquefaction. Transportation and handling of LNG as cargo on both land and sea have been proven for many decades. With new emission regulations the potential applications for LNG is expanding. Among these applications is use of LNG as marine fuel. LNG is particularly attractive for marine vessels traveling set routes in near coast waters such as tugboats, ferries, and support vessels. Heavy Fuel Oil (HFO), Marine Diesel Oil (MDO) and Marine Gas Oil (MGO) are all current conventional bunkering fuels. Ship based fuel is a large part of oil consumption and all these fuels are high on emission rates. Based on a review of existing marine engine technology, reductions in emission from using LNG as a fuel are: CO2 and GHG 20-‐25%, SOx and particulates approximately 100% and NOx 85-‐90%. For further information, see project report section 3.1.4: Natural Gas – The Solution. Around the world new LNG projects, applications and technological advancements are being announced regularly.4 Currently there are 38 LNG fueled ships in operation and 74 confirmed contracts for construction. The reason for this strong increase and interest in LNG as a marine fuel is based on two main factors:
1. The Marine Environmental Protection Committee, part of International Maritime Organization (IMO), is introducing emission controls, constraining the extent of exhaust gas emission. This is forcing the industry to rethink its fueling options and LNG is proving to be a solid alternative.5
2. The availability of NG has increased due to large offshore discoveries and unconventional gas findings in the US (shale gas), creating lower prices on NG compared to conventional fuels. This creates a drive in the industry, as consumers are able to obtain commercial saving against alternative fuels.
In response to increasing demand, construction of LNG bunkering infrastructure is under development.6 Development of a worldwide LNG supply chain based on ship-‐to-‐ship or shore-‐to-‐ship bunkering is of paramount importance for LNG to become a real alternative to heavy fuel oil.7
2
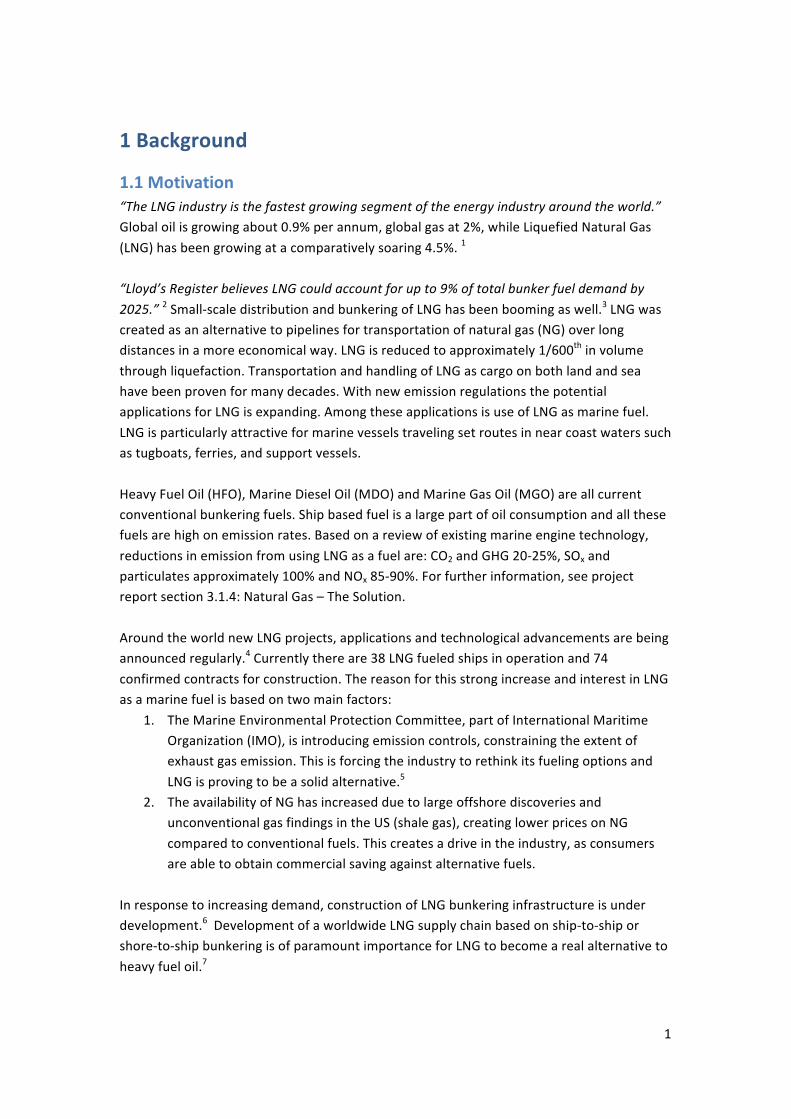
1.2 Underlying Hypothesis The development of LNG bunkering facilities has obtained increased focus in several countries8 and especially those within Emission Control Area (ECA), see figure 1 and project report section 3.2.1 Emission Control. Several ports are preparing to supply LNG, but uncertainties concerning the bunkering process and operational safety still exist. Bunkering with conventional marine fuels or large scale bunkering offshore is at this stage not covering the relevant risk for small scale bunkering in a port.
Figure 1: ECA zones (source DNV)9
LNG is stored at low temperatures and development of a gas cloud in the event of an unexpected release to the surroundings, requires insight to the risks. The risks are analyzed through evaluating frequencies and consequences of leak scenarios. Risk results will provide insight as to what safety distance should be taken into account, given a specific bunker configuration. As such it can be used as an initial screening tool for suitability of bunker locations in the port area. 10 Recently, much work has been done to standardize LNG bunkering solutions, including a launch of an International Organization for Standardization (ISO) guideline11 and a Recommended Practice (RP) by DNV12. One of the main topics of these documents and of international discussion is operational safety and the establishment of safety zones around operations. A direction for establishing safety zones has been provided by the ISO and DNV RP, but thus far no international consensus has been reached on the method and results.13 Consequently, there are differences in practices and precautions on existing operations. What the bunkering procedure currently considers as high risk with respect to third parties in the vicinity of the operation (vulnerable objects), is not yet advised by official guidelines. This is especially problematic for ferries (assumed to be the LNG fuel’s main market), which have passengers on at all times. The functionality and strengths of LNG compared to other fuels will be considerably reduced if vulnerable objects to the bunkering operation (i.e. individuals who are not operational personnel) can’t be present in the area.
3
If passenger presence during bunkering is a real threat it is important to establish this before the construction of a large LNG bunkering infrastructure is commenced. It would be equally unfortunate if the expansion of LNG as a fuel was held back due to perceived safety barriers affecting its application. For successful incorporation of bunkering in ports it is essential that the safety zones allow the bunkering operation to remain practical. The security and safety zones therefore need to be established conclusively for generic applications.
1.3 Main Goal of Thesis The goal of this thesis is to establish probabilistic safety zones for a generic ship-‐to-‐ship (STS) bunkering case. Threats to vulnerable objects and their likelihood of taking place, in the event of an LNG leak, will be identified. Vulnerable objects in our study are to be understood as ferry passengers. The specific purpose is to determine whether acceptable safety zones (for vulnerable objects) is present onboard a ferry performing LNG bunkering operations. So far there are few studies that have systematically assessed LNG bunkering hazards. This study will assess the risks involved and calculate distances through an established probabilistic approach, known as Quantitative Risk Assessment (QRA) methodology. The method includes frequency and consequence calculations of possible Loss of Containment (LOC) scenarios. Both the probabilistic approach and the stages of a QRA analysis will be expressed in chapter 2: Methodology.
1.4 Scope of Thesis The thesis will cover methodology, establish the context, risk analysis and risk treatment. The context will outline the base case considered in the study, including definition of essential parameters and sensitivities. Risk analysis will involve the QRA method, including frequency and consequence calculations, and an evaluation of whether regulatory requirements are met. Risk treatment will provide the concluding remarks to the study. The report is limited by the available description of bunkering technologies, site-‐specific information, and historical data on bunkering processes. Use of the findings would require consideration of system and site-‐specific to the application. This thesis use material from the project report Evaluation of technical challenges and need for standardization for LNG bunkering which was written as an introduction to the topic of LNG bunkering. The project report looked at various systems and methodology for LNG bunkering employed in present operations to define a typical or "best practice" approach today. In this master thesis some of the key elements discussed in the project report will be recapitulated. To a certain extent it will be advantageous but not necessary for the reader to have understanding and knowledge of this report prior to reading this study. The report presents physical hardware, operating procedures and the advantages of using LNG as a bunker fuel.
4
2 Methodology
2.1 Safety Zone “The minimum safety zone shall be defined as the area around the bunkering facilities where the likelihood of flammable mixtures due to LNG or NG releases from the bunkering exceeds 10-‐6 per bunkering operation.”14 The safety zone is the contour of a cumulative frequency of an ignitable gas cloud (using 100% LFL) > 10-‐6 per bunkering. This means that a 10-‐6 risk contour per operation for flash fires mark the safety zone distance and necessary boundaries for an operation. To produce risk contour results, a probabilistic assessment of all release scenarios from all processing equipment in the bunkering installation (hose, piping, tanks, connectors, flanges, valves, etc.) is required.
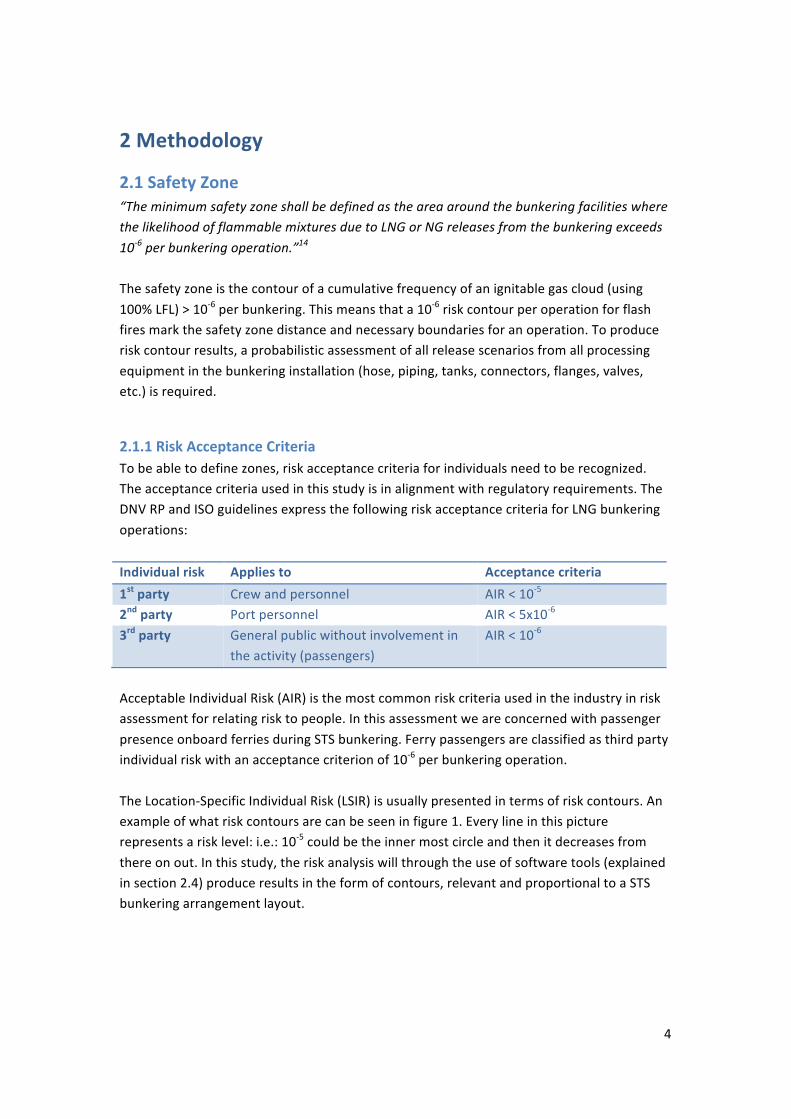
2.1.1 Risk Acceptance Criteria To be able to define zones, risk acceptance criteria for individuals need to be recognized. The acceptance criteria used in this study is in alignment with regulatory requirements. The DNV RP and ISO guidelines express the following risk acceptance criteria for LNG bunkering operations: Individual risk Applies to Acceptance criteria 1st party Crew and personnel AIR < 10-‐5
2nd party Port personnel AIR < 5x10-‐6
3rd party General public without involvement in the activity (passengers)
AIR < 10-‐6
Acceptable Individual Risk (AIR) is the most common risk criteria used in the industry in risk assessment for relating risk to people. In this assessment we are concerned with passenger presence onboard ferries during STS bunkering. Ferry passengers are classified as third party individual risk with an acceptance criterion of 10-‐6 per bunkering operation. The Location-‐Specific Individual Risk (LSIR) is usually presented in terms of risk contours. An example of what risk contours are can be seen in figure 1. Every line in this picture represents a risk level: i.e.: 10-‐5 could be the inner most circle and then it decreases from there on out. In this study, the risk analysis will through the use of software tools (explained in section 2.4) produce results in the form of contours, relevant and proportional to a STS bunkering arrangement layout.
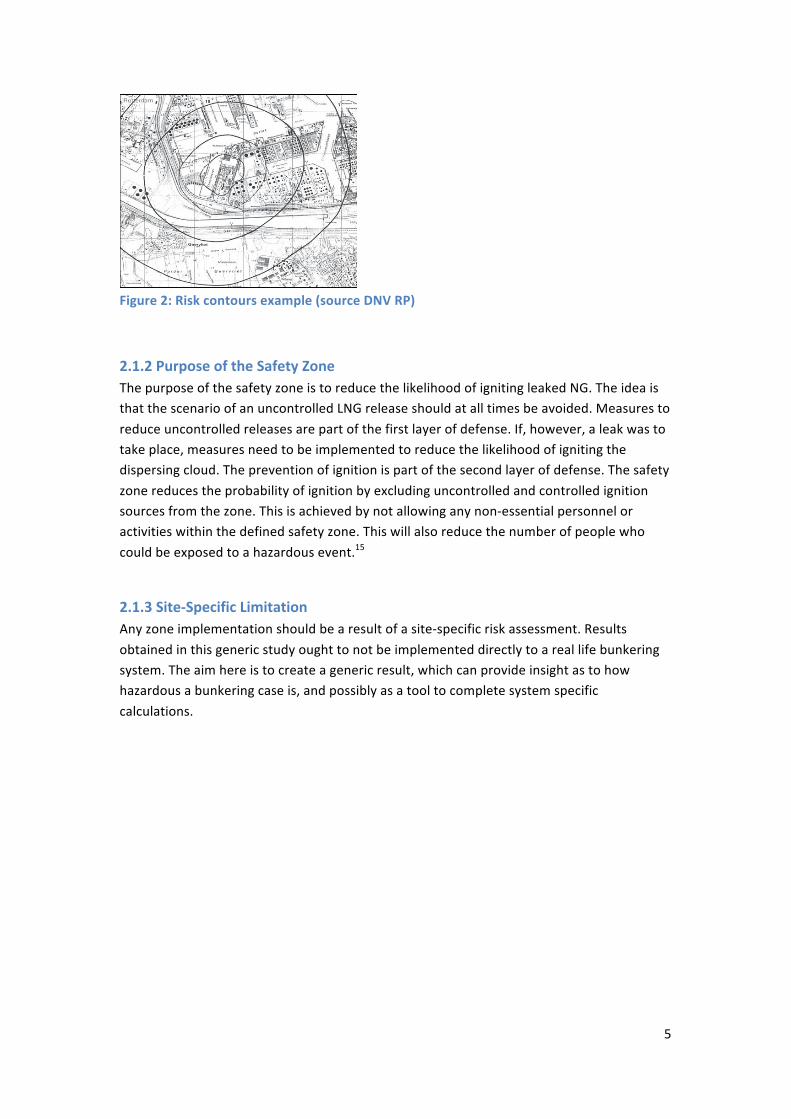
5
Figure 2: Risk contours example (source DNV RP)
2.1.2 Purpose of the Safety Zone The purpose of the safety zone is to reduce the likelihood of igniting leaked NG. The idea is that the scenario of an uncontrolled LNG release should at all times be avoided. Measures to reduce uncontrolled releases are part of the first layer of defense. If, however, a leak was to take place, measures need to be implemented to reduce the likelihood of igniting the dispersing cloud. The prevention of ignition is part of the second layer of defense. The safety zone reduces the probability of ignition by excluding uncontrolled and controlled ignition sources from the zone. This is achieved by not allowing any non-‐essential personnel or activities within the defined safety zone. This will also reduce the number of people who could be exposed to a hazardous event.15
2.1.3 Site-‐Specific Limitation Any zone implementation should be a result of a site-‐specific risk assessment. Results obtained in this generic study ought to not be implemented directly to a real life bunkering system. The aim here is to create a generic result, which can provide insight as to how hazardous a bunkering case is, and possibly as a tool to complete system specific calculations.
6
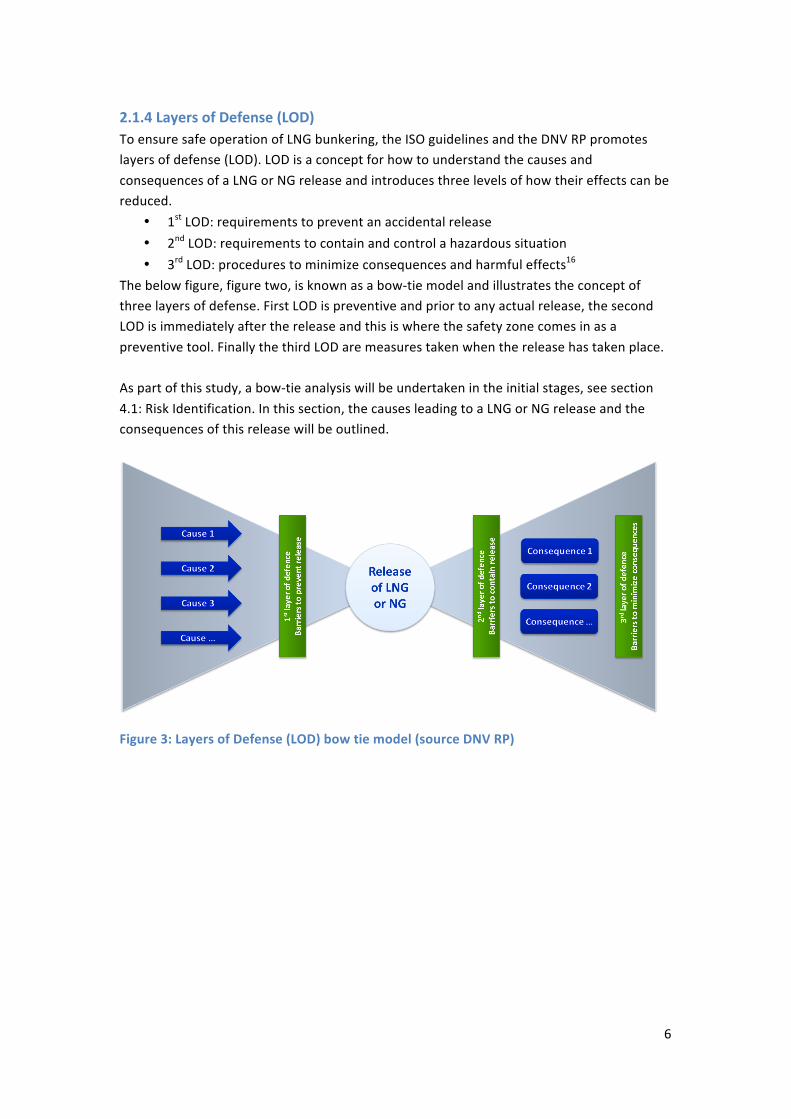
2.1.4 Layers of Defense (LOD) To ensure safe operation of LNG bunkering, the ISO guidelines and the DNV RP promotes layers of defense (LOD). LOD is a concept for how to understand the causes and consequences of a LNG or NG release and introduces three levels of how their effects can be reduced.
• 1st LOD: requirements to prevent an accidental release • 2nd LOD: requirements to contain and control a hazardous situation • 3rd LOD: procedures to minimize consequences and harmful effects16
The below figure, figure two, is known as a bow-‐tie model and illustrates the concept of three layers of defense. First LOD is preventive and prior to any actual release, the second LOD is immediately after the release and this is where the safety zone comes in as a preventive tool. Finally the third LOD are measures taken when the release has taken place. As part of this study, a bow-‐tie analysis will be undertaken in the initial stages, see section 4.1: Risk Identification. In this section, the causes leading to a LNG or NG release and the consequences of this release will be outlined.
Figure 3: Layers of Defense (LOD) bow tie model (source DNV RP)
7
2.2 Method The ISO guidelines propose two approaches to calculate a safety zone for any process: deterministic or probabilistic. This section will give a short introduction to the two approaches and argument for the choice made.
2.2.1 Deterministic Approach A deterministic approach is only applicable for standard bunkering scenarios where all functional requirements in the ISO guidelines are met. The safety zone is in this case determined by a consequence-‐based methodology. The calculations are based on a maximum credible dispersion scenario, and the results include maximum distances from the bunkering activity where the cloud of NG could be flammable. This approach is considered very simple and conservative, and will lead to large safety zones, as no safeguards are included in the analysis.17
2.2.2 Probabilistic Approach The probabilistic method follows a risk-‐based approach, which requires a more complex analysis of the operation. It considers the maximum distance to flammable concentration of each possible release scenario as well as its likelihood (i.e. both qualitative and quantitative aspects of the procedure). The safety zone is defined by the distance at which the frequency of the occurrence of a flammable cloud is equal to one occurrence every million operations (i.e. 10-‐6). The probabilistic approach credit safeguards and consider the likelihood of the various scenarios. Consequently, this method will lead to smaller safety zones. It is therefore typically used for locations with space constraints and where large safety zones cannot be implemented. If passengers are onboard the ferries during bunkering operations, the safety zone needs to be established, but it is also clear that an unreasonably large zone can’t be implemented. The probabilistic approach offers a more rational basis for making informed decisions than an approach based on single, large event scenarios, as in the deterministic. Although more thorough and time consuming, the probabilistic method is chosen.18
2.2.2.1 QRA Method The risk distance is modeled and quantified using Quantitative Risk Assessment (QRA). The QRA method is a recognized approach in calculating risk distances to vulnerable objects in the event of a hazardous substance leakage. The assessment considers consequence estimates and the probabilities for quantity of release, process section of release (i.e. hose, tank or process equipment), operational procedures and probability of ignition as a function of time after the release. Through calculating the potential effect of various scenarios for a specific system and their probability of occurrence, it is able to provide insight on the risk of human life.19
8
The working process of QRA covers: • Hazard identification – what can go wrong? • Consequence modeling – how bad? • Frequency estimation – how often? • Risk assessment – so what? • Risk management – what can be done about it?20
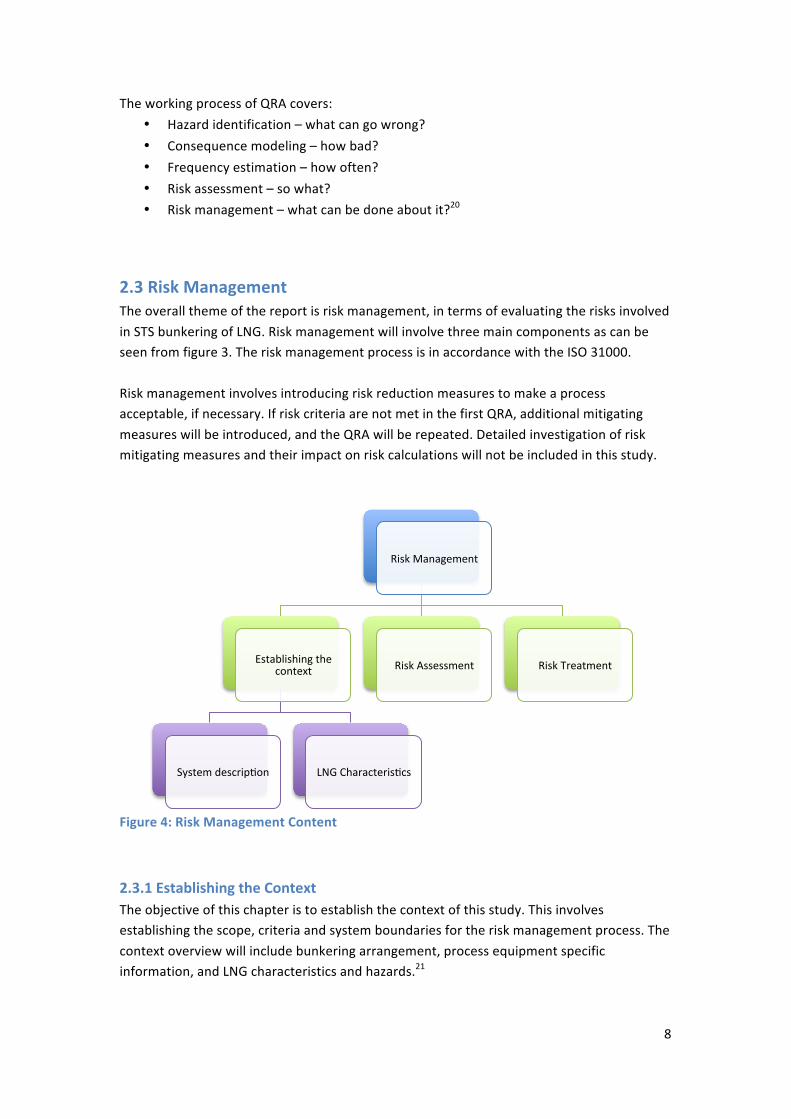
2.3 Risk Management The overall theme of the report is risk management, in terms of evaluating the risks involved in STS bunkering of LNG. Risk management will involve three main components as can be seen from figure 3. The risk management process is in accordance with the ISO 31000. Risk management involves introducing risk reduction measures to make a process acceptable, if necessary. If risk criteria are not met in the first QRA, additional mitigating measures will be introduced, and the QRA will be repeated. Detailed investigation of risk mitigating measures and their impact on risk calculations will not be included in this study.
Figure 4: Risk Management Content
2.3.1 Establishing the Context The objective of this chapter is to establish the context of this study. This involves establishing the scope, criteria and system boundaries for the risk management process. The context overview will include bunkering arrangement, process equipment specific information, and LNG characteristics and hazards.21
Risk Management
Establishing the context
System descripson LNG Characterisscs
Risk Assessment Risk Treatment
9
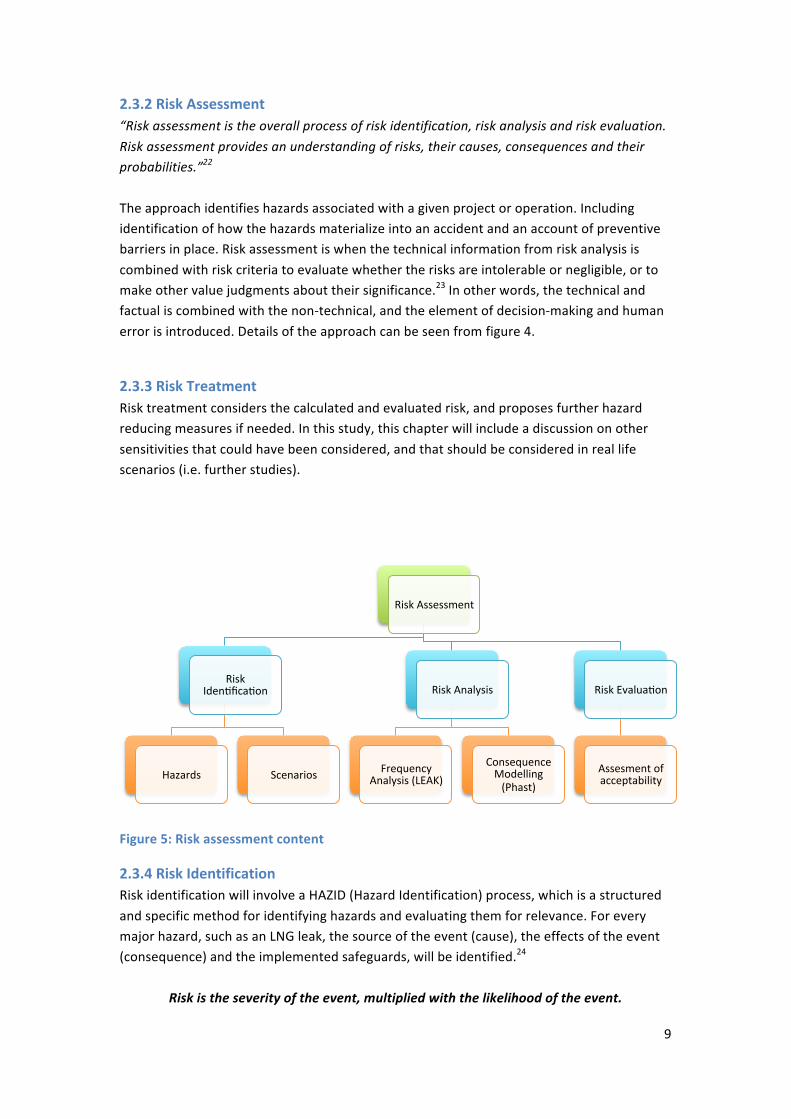
2.3.2 Risk Assessment “Risk assessment is the overall process of risk identification, risk analysis and risk evaluation. Risk assessment provides an understanding of risks, their causes, consequences and their probabilities.”22 The approach identifies hazards associated with a given project or operation. Including identification of how the hazards materialize into an accident and an account of preventive barriers in place. Risk assessment is when the technical information from risk analysis is combined with risk criteria to evaluate whether the risks are intolerable or negligible, or to make other value judgments about their significance.23 In other words, the technical and factual is combined with the non-‐technical, and the element of decision-‐making and human error is introduced. Details of the approach can be seen from figure 4.
2.3.3 Risk Treatment Risk treatment considers the calculated and evaluated risk, and proposes further hazard reducing measures if needed. In this study, this chapter will include a discussion on other sensitivities that could have been considered, and that should be considered in real life scenarios (i.e. further studies).
Figure 5: Risk assessment content
2.3.4 Risk Identification Risk identification will involve a HAZID (Hazard Identification) process, which is a structured and specific method for identifying hazards and evaluating them for relevance. For every major hazard, such as an LNG leak, the source of the event (cause), the effects of the event (consequence) and the implemented safeguards, will be identified.24
Risk is the severity of the event, multiplied with the likelihood of the event.
Risk Assessment
Risk Idensficason
Hazards Scenarios
Risk Analysis
Frequency Analysis (LEAK)
Consequence Modelling (Phast)
Risk Evaluason
Assesment of acceptability
10
2.3.5 Risk Analysis In this section it is important that all assumptions, identified uncertainties, modeling choices and settings of calculation parameters are documented.
2.3.5.1 Frequency Analysis After the hazards of a system or process have been identified, the next step in performing the QRA is to estimate the frequency at which the hazardous events may occur. The selected technique and tools used depend on the availability of historic data and statistics. Available tools and techniques are:
• Analysis of historical data • Fault tree analysis or event tree analysis • Simulations
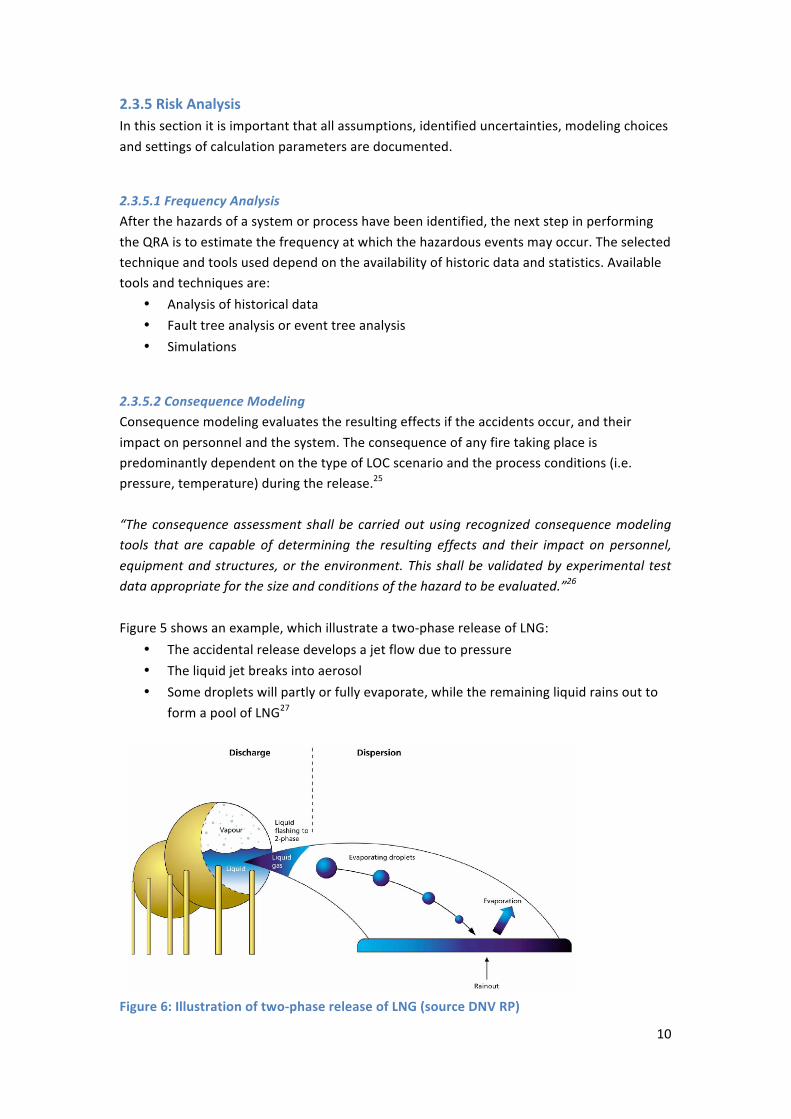
2.3.5.2 Consequence Modeling Consequence modeling evaluates the resulting effects if the accidents occur, and their impact on personnel and the system. The consequence of any fire taking place is predominantly dependent on the type of LOC scenario and the process conditions (i.e. pressure, temperature) during the release.25 “The consequence assessment shall be carried out using recognized consequence modeling tools that are capable of determining the resulting effects and their impact on personnel, equipment and structures, or the environment. This shall be validated by experimental test data appropriate for the size and conditions of the hazard to be evaluated.”26 Figure 5 shows an example, which illustrate a two-‐phase release of LNG:
• The accidental release develops a jet flow due to pressure • The liquid jet breaks into aerosol • Some droplets will partly or fully evaporate, while the remaining liquid rains out to
form a pool of LNG27
Figure 6: Illustration of two-‐phase release of LNG (source DNV RP)
11
The consequence modeling involves the following consecutive steps: 1. Discharge calculations – carried out to set release characteristics for the LNG
(including depressurization to ambient). Scenarios that will be modeled are defined by the LOC scenarios list. Leak scenarios to be considered are both non-‐pressurized and pressurized releases, as defined by the bunker system.
2. Dispersion calculations – carried out to determine the concentrations of gas when the cloud travels in the downwind direction. The chosen tool needs to be able to account for effects of jet, heavy-‐gas and passive dispersion. In the case of a two-‐phase release, rainout may occur and pool formation or spreading and re-‐evaporation shall be modeled accordingly.
3. Fire calculations – carried out to produce the final risk level results. The calculation takes ignition probability into account, combined with discharge and dispersion effects.
4. Explosion calculations – is part of the required calculations if the system is partially or fully within enclosed spaces.
2.3.6 Risk Evaluation The results are presented and the risk of the events to individuals is quantified and evaluated against the risk acceptance criteria.
12
2.4 Software Tools The risk analysis will involve the use of software tools. This section provides a short description of which functions they perform in the calculations. The use and specific examples will be provided in chapter 4: Risk Assessment as part of the risk analysis in this study.
2.4.1 Frequency Analysis Tools
2.4.1.1 Fault Tree Fault tree excel ad-‐in is a DNV software tool, created to easily calculate how initial events combine with and/or gates and create overall event frequencies for a specific process section of the transfer system. For creating the model, events (E) and gates (G) needs to be named and combined accordingly. Initial frequencies to the main events are added by the events. The frequencies of the gates, which also can be known as grouped or main events, will be calculated by the fault tree tool/software.
2.4.1.2 LEAK The DNV software LEAK is used to estimate the leak frequencies. The software uses statistical data from the Hydrocarbon Release Database (HCRD), compiled by the UK Health and Safety Executive (HSE). The database is extensive and covers leak registrations over a 20-‐year period, but is limited to the British Oil and Gas sector and offshore operations. This means that it will not provide failure rates for LNG operations and cryogenic equipment specifically. Any data concerning cryogenic or LNG-‐specific applications is currently limited.28 Frequency estimates are recognized as one of the largest sources of uncertainty in QRA studies. “The main risk drivers on an LNG site are events that are unlikely to be within the direct experience of individual plants and terminals. Establishing the frequencies of such events is difficult, precisely because of their rarity. It requires systematic data collection, for leaks and exposed equipment population, over many plants for many years. Such data collection is time-‐consuming and hence unusual.”29 The relevance of HCRD offshore data is compensated by the weight of statistical data supporting the derived failure rates for specific equipment items, compared to the limited data on LNG and cryogenic facilities. The generic data derived from the HCRD has therefore been applied directly without any modification.
13
2.4.2 Consequence Modeling Tools The consequence modeling tools used in this study is DNV’s software tools called PHAST and PHASTRisk. Together they give a comprehensive overview of possible outcomes and impact potential associated with the release of a hazardous material. Both programs can account for a whole range of factors (sensitivities) that affect the development of a loss of containment scenario for the process industry. The outcomes can undergo a full analysis in a single integrated calculation run by utilizing linked models.30 PHAST undergoes continuous improvements and one of the recent developments in the 6.7 version, includes validation for release of LNG/NG (methane). Until recently this had not been possible, but it has been driven by a need by the industry. This is why studies such as this master thesis are emerging rapidly and are of high importance and interest at the moment.31
2.4.2.1 PHAST 6.7 PHAST provides discharge calculations, which produce release rates and maximum distances. PHAST is a tool for the deterministic approach.
2.4.2.2 PHASTRisk 6.7 (Safeti) PHASTRisk, also known as Safeti, is a QRA software tool used to complete the consequence calculations for a probabilistic approach. PHASTRisk will take PHAST output and add further sensitivities such as weather conditions and the bunkering layout arrangement. PHASTRisk will incorporate visualization tools, which allow the impact ranges to be imposed on location maps (i.e. pictures of the bunkering layout), providing a clear understanding of the results. Using extensive and validated models one can quickly and easily simulate accident scenarios, including the extent of discharge, dispersion, flammable, explosive and toxic effects, for a specific substance. 32
14
3 Establishing the context Overall this section provides a detailed overview of the study and present assumptions made with respect to the chosen base case.
3.1 STS Bunkering System “The definition of LNG bunkering is the small-‐scale transfer of LNG to vessels requiring LNG as a fuel for use within gas or dual fueled engines. LNG bunkering takes place within ports or other sheltered locations.”33 Bunkering should not be considered in the same context as large scale, commercial transfer of cargo between ocean-‐going LNG carriers, with volume transfers typically above 100,000m3.34 To correctly assess and quantify the risks of LNG bunkering it is essential to define the system that will be analyzed. This chapter of the report will present bunkering configurations, describe the selected bunkering configuration for this study, and establish the base case including relevant process parameters and assumptions made.
3.2 LNG Bunkering Configurations The industry differentiates between three types of bunkering configurations.
• Truck-‐to-‐Ship (TTS): micro bunkering, discharging unit is a LNG road tanker with size of approximately 50-‐100m3.
• Ship-‐to-‐Ship transfer (STS): discharging unit is a bunker vessel or barge with size 200-‐10,000m3.
• Terminal (Pipeline)-‐to-‐Ship (PTS): satellite terminal bunkering serves as the discharging unit. Supply sizes are approximately 100-‐10,000m3.
PTS and TTS are the most established bunkering configurations as of today, and they are both classified as onshore supply. STS will also take place while the receiving unit is at dock or in a port environment, but both units involved in the transfer are seaborne and the transfer is therefore classified as offshore. Use of STS makes the bunkering location more flexible than PTS, and it can supply higher volumes than TTS. Developments within this configuration are the most feasible and are therefore essential in making LNG competitive against other marine fuels, especially for larger ships.35 Each configuration has specific risks depending on arrangement and equipment used. The most important equipment difference is whether the system uses hose or loading arm for the transfer.
15
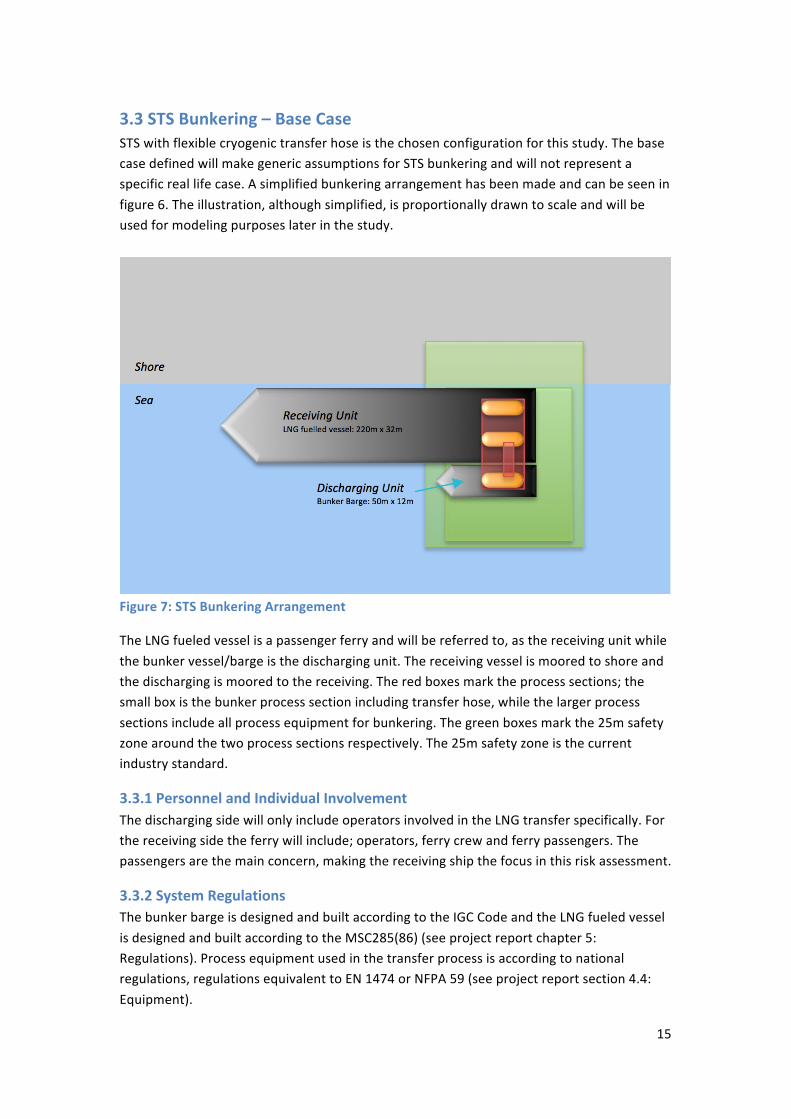
3.3 STS Bunkering – Base Case STS with flexible cryogenic transfer hose is the chosen configuration for this study. The base case defined will make generic assumptions for STS bunkering and will not represent a specific real life case. A simplified bunkering arrangement has been made and can be seen in figure 6. The illustration, although simplified, is proportionally drawn to scale and will be used for modeling purposes later in the study.
Figure 7: STS Bunkering Arrangement
The LNG fueled vessel is a passenger ferry and will be referred to, as the receiving unit while the bunker vessel/barge is the discharging unit. The receiving vessel is moored to shore and the discharging is moored to the receiving. The red boxes mark the process sections; the small box is the bunker process section including transfer hose, while the larger process sections include all process equipment for bunkering. The green boxes mark the 25m safety zone around the two process sections respectively. The 25m safety zone is the current industry standard.
3.3.1 Personnel and Individual Involvement The discharging side will only include operators involved in the LNG transfer specifically. For the receiving side the ferry will include; operators, ferry crew and ferry passengers. The passengers are the main concern, making the receiving ship the focus in this risk assessment.
3.3.2 System Regulations The bunker barge is designed and built according to the IGC Code and the LNG fueled vessel is designed and built according to the MSC285(86) (see project report chapter 5: Regulations). Process equipment used in the transfer process is according to national regulations, regulations equivalent to EN 1474 or NFPA 59 (see project report section 4.4: Equipment).
16
3.3.3 System Limitations Considerable efforts have been made to make reasonable assumptions. In an attempt to not underestimate any of the risks related to LNG bunkering, the ‘conservative best-‐estimate’ has been chosen for areas where case choices were required. Efforts have been made to make the assessment as detailed and realistic as possible. Nonetheless, the report does not cover a specific real life bunkering case. Consequently, parameters have been chosen broadly from representative data aiming at describing a typical existing STS bunkering arrangement. Additionally, as technology advances, future real life bunkering configurations might have different characteristics. Any results presented should therefore be interpreted with care.
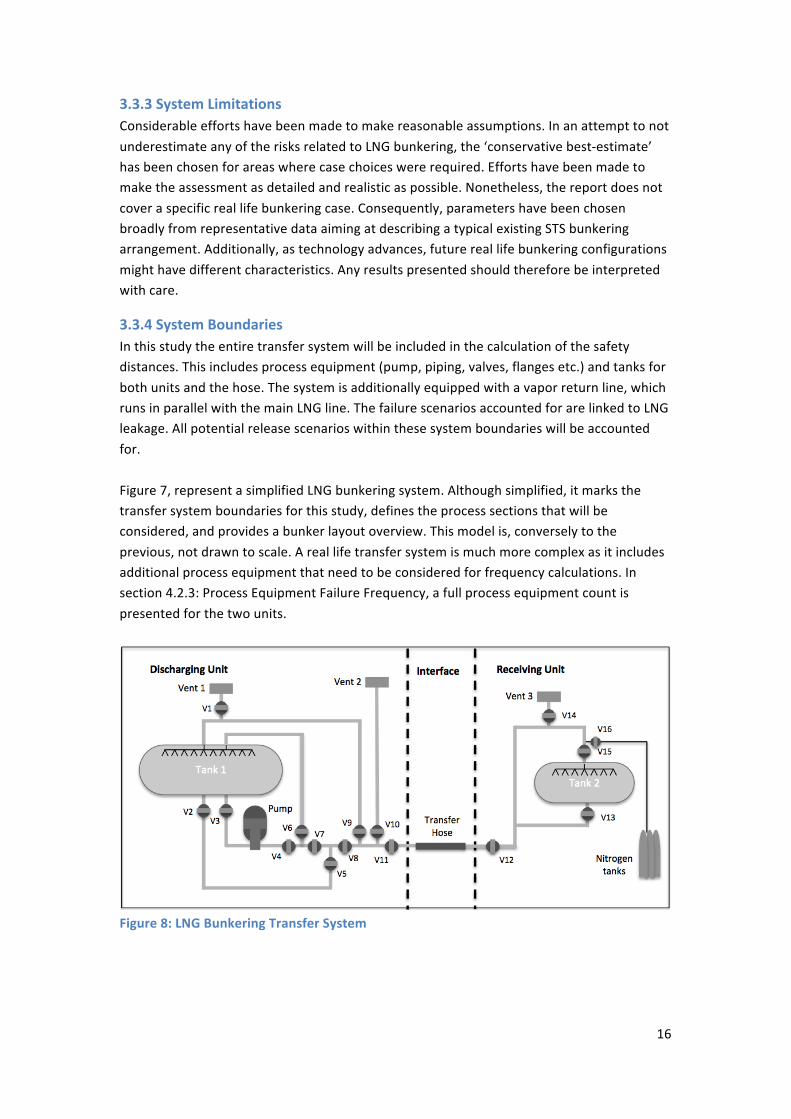
3.3.4 System Boundaries In this study the entire transfer system will be included in the calculation of the safety distances. This includes process equipment (pump, piping, valves, flanges etc.) and tanks for both units and the hose. The system is additionally equipped with a vapor return line, which runs in parallel with the main LNG line. The failure scenarios accounted for are linked to LNG leakage. All potential release scenarios within these system boundaries will be accounted for. Figure 7, represent a simplified LNG bunkering system. Although simplified, it marks the transfer system boundaries for this study, defines the process sections that will be considered, and provides a bunker layout overview. This model is, conversely to the previous, not drawn to scale. A real life transfer system is much more complex as it includes additional process equipment that need to be considered for frequency calculations. In section 4.2.3: Process Equipment Failure Frequency, a full process equipment count is presented for the two units.
Figure 8: LNG Bunkering Transfer System
17
3.3.5 STS Bunkering Procedure A full step-‐by-‐step description of the bunkering procedure is provided in the project report section 4.3: LNG Bunkering Procedure. The main steps in a STS bunkering procedure are:
1. Arrival and mooring 2. Cool down system 3. Grounding and connection of bunker hose 4. Inerting and purging of filling lines 5. Transfer (top and bottom) 6. Stripping, inerting and purging of filling lines 7. Disconnection of bunker hose 8. Unmooring and departure
The main step of interest is step 5, the transfer sequence. This is the part of the procedure where all considered process sections are filled with LNG/NG.
3.3.6 Operational Data Bunkering for vessels of this size is estimated to take about one hour, however, bunkering time often increase as top filling has to be used more than what accounted for, so a conservative assumptions is to consider two hours for bunkering time per operation. All frequencies and scenarios will be considered on a per operation basis.
3.3.7 Transfer Properties The actual bunkering arrangement is not available, and the exact process characteristics vary from case to case. The transfer properties selected are therefore conservative, based on regulatory requirements or values obtained from a representative case. Flow velocity will be set to 10m/s as this is the maximum velocity for the hoses typically used by the industry.36 Bunker barges/vessels of this size have filling capacities from 180-‐3000m3/hour.37 The flow rates will vary from one bunkering activity to another, depending on filling method (top or bottom) and bunker parameters (i.e. temperature and pressure of the liquid). The flow rate will not be evaluated for sensitivities and will therefore be set as a constant parameter, assumed to be 500m3/h for this study. LNG properties
• Methane is the defined material/working fluid, with 5-‐15% (LEL-‐UEL) and ignition temperature of 500°C.
LNG line -‐ process equipment and hose • Operating pressure is set to 10 bar(g). This is the maximum operating pressure for
LNG process equipment according to European design standard EN1472-‐2.38 • Operating temperature is set to -‐162°C to keep the inventory in liquefied state. The
bunker vessel (discharging unit) is assumed to be able to maintain this constant temperature during the transportation to site.
• Density depends on temperature and pressure. Based on the defined process parameters the density is 425kg/m3.
18
Vapor return line (NG) -‐ process equipment and hose • Pressure is set to 2bar(g) as it will be reduced compared to LNG line. • Temperature is set to -‐100°C. The liquid has been warmed and is now in a vapor
state. • Density 4.3kg/m3
Tanks • The pressure in the tanks is set to 2 bar(g). The Swedish Marine Technology Forum,
together with DNV and others, have stated that the barge can operate with a pressure of up to 3 bar(g) at -‐163°C. The typical operating pressure will however be closer to 2 bar(g).39
3.3.8 Equipment Dimensions Hose
• One LNG line and one NG (vapor return line) for the system. • LNG: 6 inch (152mm) diameter • NG (vapor return): 2 inch (51mm) diameter • 10m length (correct length depends on the vessels freeboard changes and
movements40) Piping
• 6 inch diameter (same as hose) • 10m length on discharging and 20m length on receiving. The lengths are based on
assumptions with regards to vessels size (discharging is smaller than receiving). Tanks
• Discharging Unit: 200m3 tank • Receiving Unit: 200m3 x 2 tanks • Tanks are considered in the analysis, as they are considered to be located externally
(i.e. not in a confined space). LNG fuel and storage tanks are often external due to LNG tank size (in case of an LNG fuel conversion). The tanks will often have to be placed in an unenclosed area on the vessel, meaning that the conservative approach is to include tanks.
19
3.4 LNG This section will describe the characteristics and hazards associated with an LNG leakage/release, and define the relevant groups of outflow scenarios.
3.4.1 LNG Characteristics LNG is NG cooled to about -‐162°C (-‐260°F) at atmospheric pressure. It is a condensed mixture of methane (CH4), approximately 85-‐96mol%, and a small percentage of heavier hydrocarbons. LNG is clear, colorless, odorless, non-‐corrosive and non-‐toxic. In liquid form it is approximately 45% the density of water, and as vapor it is approximately 50% density of air and will rise under normal atmospheric conditions. LNG is called a cryogenic liquid-‐ defined as substances that liquefies at a temperature below -‐73°C (-‐100°F) at atmospheric pressure. The process of liquefaction reduces the volume to 1/600th of its original volume, providing efficient storage and transport. 41
3.4.2 LNG Safety Issues In its liquid form, LNG cannot explode and it is not flammable. Hazards arise when LNG returns to its gaseous state through an uncontrolled release. The release can for instance be caused by a tank rupture due to external impact, leaks from flanges in the pipework, or a pipe break etc. The hazards can be divided into two categories:
1. Cryogenic effects from LNG Exposure to a liquid at -‐163°C will cause humans to freeze and steel equipment to become brittle. Brittle steel can break and cause additional secondary failures.
2. Fire and explosion Once the LNG has leaked, it will form a pool of liquid LNG. This pool will start to evaporate and form a cloud of gas, primarily consisting of methane. This gas will start mixing with air (with a 20.9% oxygen ratio), and once it reaches a mixture between 5-‐15% gas, it is ignitable. Outside the critical level, an explosion or fire will not occur. Below the lower explosion level (LEL) there is insufficient amount of methane. Similarly, above the upper explosion level (UEL) there is insufficient amount of oxygen present. The critical flammability and explosion level is a 9% ratio of NG to air, see figure 8. Without an ignition source, the gas will continue to evaporate, disperse at ground level while cold, start to warm and rise to the sky (as methane is lighter than air), and thereafter drift away until the entire liquid pool is gone. LNG evaporates quickly, and disperses, leaving no residue. There is no environmental cleanup needed for LNG spills on water or land. If an ignition source is present, the gas cloud could ignite, but only at the edges where the methane concentration is within the aforementioned range. There will be an initial flash, not very violent, as the gas
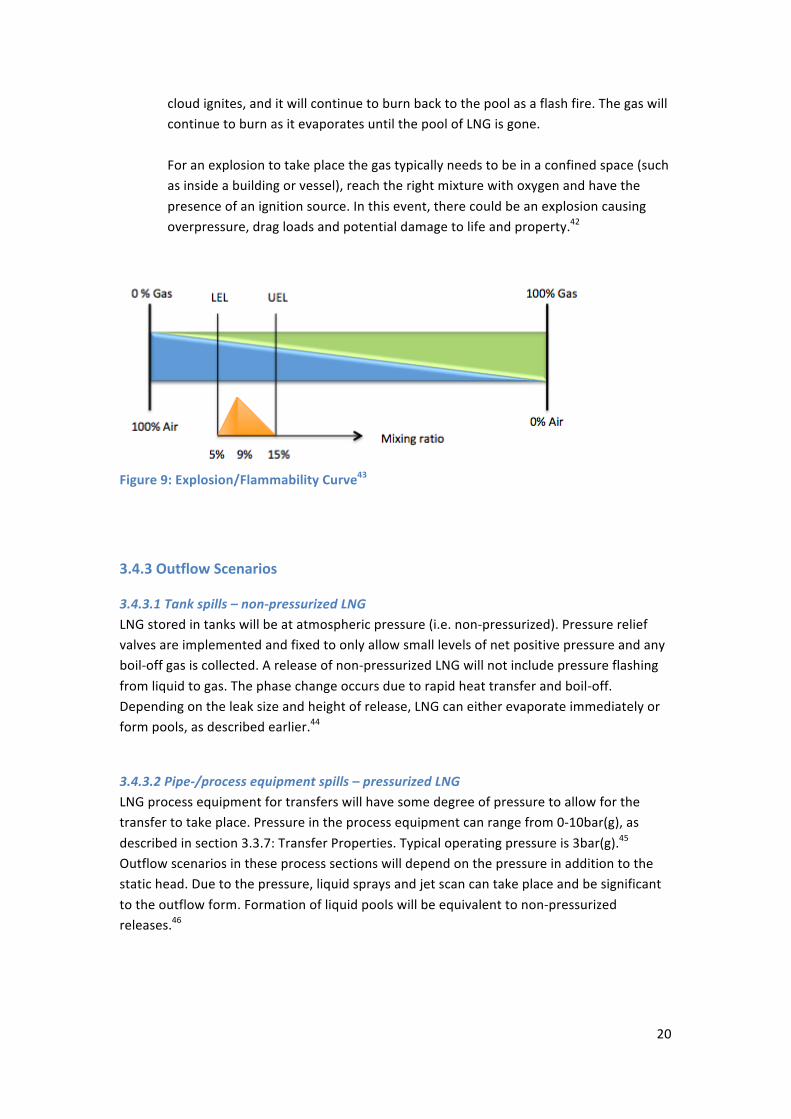
20
cloud ignites, and it will continue to burn back to the pool as a flash fire. The gas will continue to burn as it evaporates until the pool of LNG is gone. For an explosion to take place the gas typically needs to be in a confined space (such as inside a building or vessel), reach the right mixture with oxygen and have the presence of an ignition source. In this event, there could be an explosion causing overpressure, drag loads and potential damage to life and property.42
Figure 9: Explosion/Flammability Curve43
3.4.3 Outflow Scenarios
3.4.3.1 Tank spills – non-‐pressurized LNG LNG stored in tanks will be at atmospheric pressure (i.e. non-‐pressurized). Pressure relief valves are implemented and fixed to only allow small levels of net positive pressure and any boil-‐off gas is collected. A release of non-‐pressurized LNG will not include pressure flashing from liquid to gas. The phase change occurs due to rapid heat transfer and boil-‐off. Depending on the leak size and height of release, LNG can either evaporate immediately or form pools, as described earlier.44
3.4.3.2 Pipe-‐/process equipment spills – pressurized LNG LNG process equipment for transfers will have some degree of pressure to allow for the transfer to take place. Pressure in the process equipment can range from 0-‐10bar(g), as described in section 3.3.7: Transfer Properties. Typical operating pressure is 3bar(g).45 Outflow scenarios in these process sections will depend on the pressure in addition to the static head. Due to the pressure, liquid sprays and jet scan can take place and be significant to the outflow form. Formation of liquid pools will be equivalent to non-‐pressurized releases.46

21
3.4.3.3 Dispersion Due to condensation of atmospheric moisture and the initial very cold temperature of the liquid, the methane and other present heavy hydrocarbons will form a dense gas when evaporating from the pool. These clouds will disperse with the wind and mix with the air. Gravitational effects caused by density relations, atmospheric turbulence (Pasquil stability) and heat transfer with the air creates the blend. Further details on this will be presented under section 3.6: Weather Conditions.47
3.4.3.4 Flash Fire Flash fire is when the methane cloud has caught fire in its cloud edges, where the concentration level of methane is within the LFL-‐UFL range due to dispersion effects. If a cloud catches fire it will “flash back” across all its flammable mass (i.e. mass within the flammable range), followed by burning at the UFL boundary until everything is dispersed and consumed. Pool fires are ignited and formed when the flash fire reaches the evaporating pool of LNG. The fire will burn above the pool in the evaporated gas in combustible gas-‐air concentrations.48 Other types of fires and explosions can also take place after an LNG leak, such as fireball, BLEVE, vapor cloud explosion and jet fire. These types of fires and explosions are however less likely to take place. Explosions will not take place as the entire transfer system for STS is exterior (i.e. not in a confined space), and if fires takes place they will in most cases lead to flash fires. A flash fire is considered to have the maximal hazardous effects on a LOC scenario. Therefore the additional reactions will not be discussed in this section nor included in the analysis.
3.4.3.5 Flammability/Explosion Limits LEL and LFL (same goes for UEL and UFL) is the same unit and are used interchangeably in the industry. This is because the explosion (LEL) and flammability (LFL) ranges are the same. Ignition leading to flash fire (or explosions) can occur as far out (/away from the leak) as the Lower Flammable Limit (LFL). The distance effect shall be calculated using ½LFL (2.5% methane). The fraction of the LFL is included to account for uncertainties in the dispersion and effects of imperfect mixing. This factor will be included in the analysis and modeling.49
22
3.5 Nautical Activity The risks associated with LNG bunkering can be split into risks inherent to the process equipment and risks specific to the bunkering location. Scenarios related to location can in many cases be dominant for the overall risk picture. Consequently it is important to highlight location requirements identified by authorities. A part of the location details is already defined within the definition of bunkering; it should be located within ports or sheltered locations. Additionally we know that both units will be seaborne for STS. With basis in this, the following assumptions are made with respect to the bunkering location and nautical activity:
• The area is overall qualified as very low in terms of nautical activity/traffic density. • Other ships/vessels in immediate presence are berthed while the bunkering takes
place. • Any moving vessel will have a velocity of 5 knots or less (typical port speed limit).
This will ensure limited impact energy in case of collision.50 Location characteristics are often split into onshore or offshore simultaneous operations (SIMOPS). Further details on this will be explained in section 4.2.1: Frequency Analysis.
3.5.1 Security Zone In the DNV RP a security zone is recommended. A security zone is the safety distance to other passing vessels. This zone is established as a first layer of defense in reducing the frequency of LNG LOC scenarios. The purpose of the security zone is to reduce the likelihood of LNG release caused by external impacts. Reduction is achieved by monitoring activities and traffic within the zone. The security zone is not an exclusion zone, which is another well-‐used zone in the industry that marks specific boundaries for all other forms of operation. Distance between the bunkering area to other passing vessels or other simultaneous operations is currently not universally defined, as this distance will depend on bunkering configuration, system and process parameters. The term ‘immediate presence’ is therefore currently used in the RP. The security zone will be discussed based on the findings from the risk assessment. Maximum discharge lengths in the event of a LOC are the key parameters for establishing the zones. This will be discussed further in section 4.3.1.3: Security zones.
23
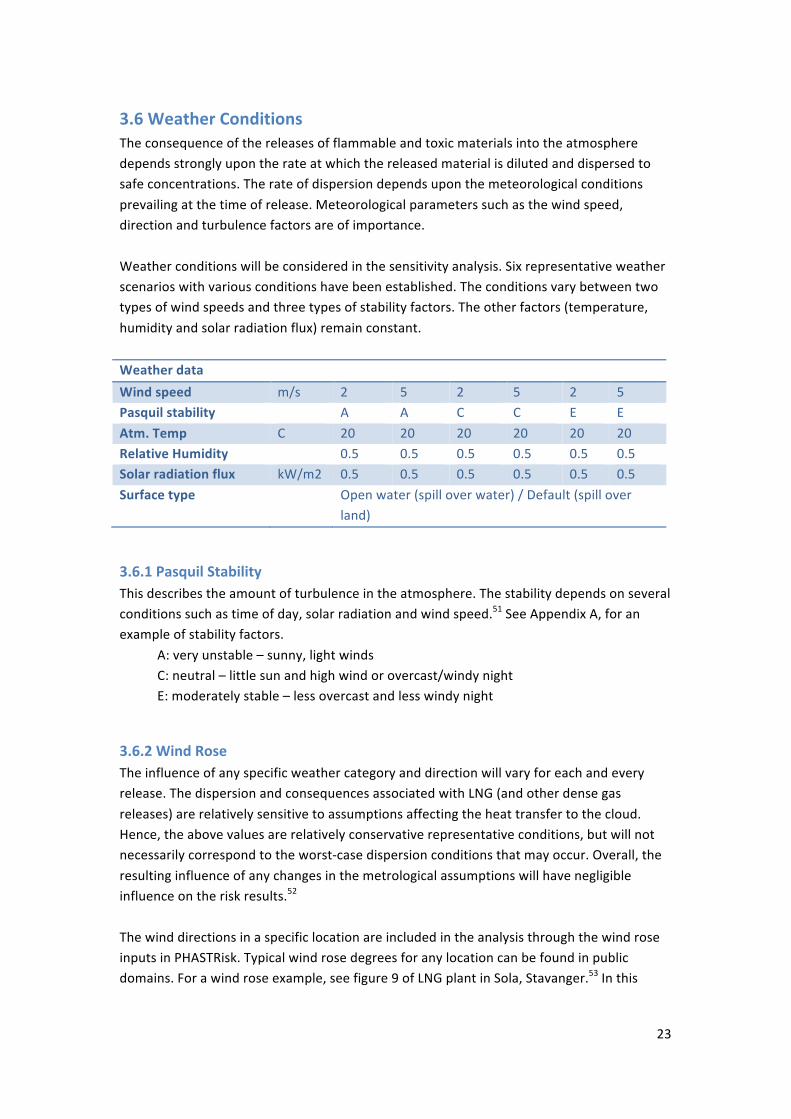
3.6 Weather Conditions The consequence of the releases of flammable and toxic materials into the atmosphere depends strongly upon the rate at which the released material is diluted and dispersed to safe concentrations. The rate of dispersion depends upon the meteorological conditions prevailing at the time of release. Meteorological parameters such as the wind speed, direction and turbulence factors are of importance. Weather conditions will be considered in the sensitivity analysis. Six representative weather scenarios with various conditions have been established. The conditions vary between two types of wind speeds and three types of stability factors. The other factors (temperature, humidity and solar radiation flux) remain constant. Weather data Wind speed m/s 2 5 2 5 2 5 Pasquil stability A A C C E E Atm. Temp C 20 20 20 20 20 20 Relative Humidity 0.5 0.5 0.5 0.5 0.5 0.5 Solar radiation flux kW/m2 0.5 0.5 0.5 0.5 0.5 0.5 Surface type Open water (spill over water) / Default (spill over
land)
3.6.1 Pasquil Stability This describes the amount of turbulence in the atmosphere. The stability depends on several conditions such as time of day, solar radiation and wind speed.51 See Appendix A, for an example of stability factors.
A: very unstable – sunny, light winds C: neutral – little sun and high wind or overcast/windy night E: moderately stable – less overcast and less windy night
3.6.2 Wind Rose The influence of any specific weather category and direction will vary for each and every release. The dispersion and consequences associated with LNG (and other dense gas releases) are relatively sensitive to assumptions affecting the heat transfer to the cloud. Hence, the above values are relatively conservative representative conditions, but will not necessarily correspond to the worst-‐case dispersion conditions that may occur. Overall, the resulting influence of any changes in the metrological assumptions will have negligible influence on the risk results.52 The wind directions in a specific location are included in the analysis through the wind rose inputs in PHASTRisk. Typical wind rose degrees for any location can be found in public domains. For a wind rose example, see figure 9 of LNG plant in Sola, Stavanger.53 In this
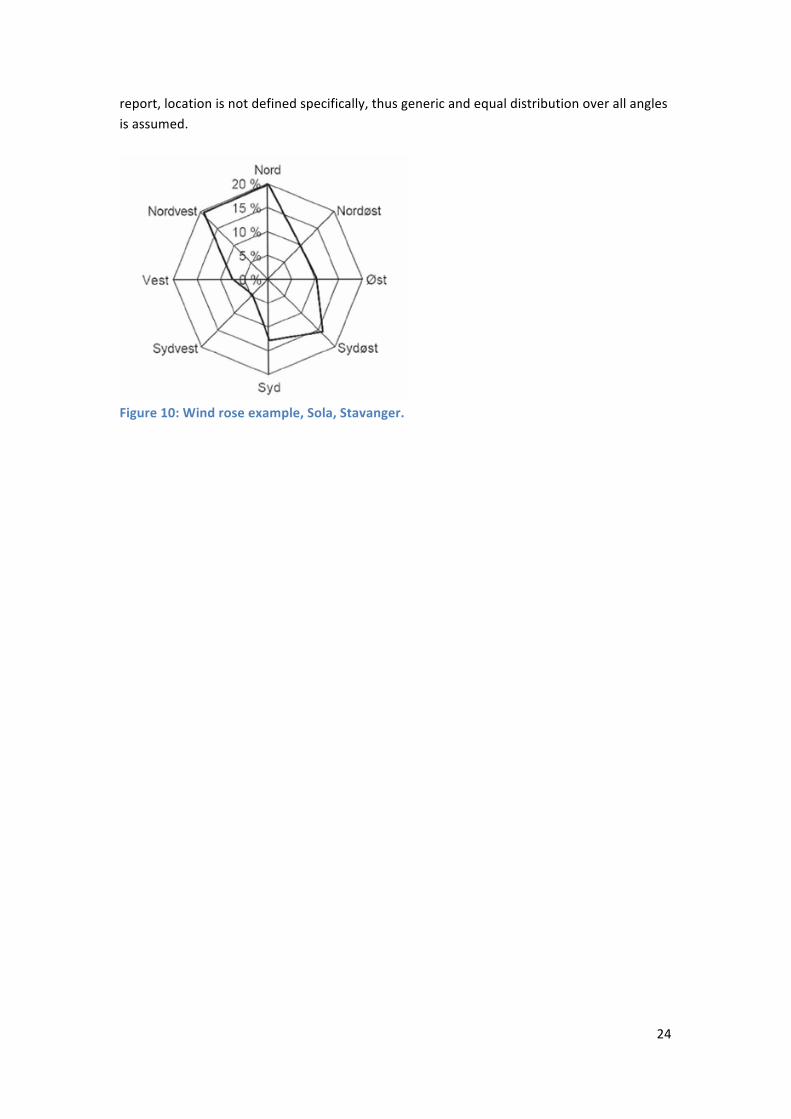
24
report, location is not defined specifically, thus generic and equal distribution over all angles is assumed.
Figure 10: Wind rose example, Sola, Stavanger.
25
3.7 Implemented Safeguards There are various repressive systems (safeguards) present within the establishment. These systems can reduce the outflow duration in the case of a failure scenario, limiting the leak/loss of containment. The outflow duration (time it takes from scenario initiation to stop) is known as isolation time. The present section provides an overview over the repressive systems, defines the relevant isolation time (which will be included in the QRA) and their probabilities of failure.
3.7.1 Automatic Isolation
3.7.1.1 Control and Monitoring Systems Control and Monitoring Systems need to comply with the IMO document MSC 285(86). All installations need to be equipped with control monitoring and safety systems. The most essential monitoring system is gas detection. The process sections that are critical for supervision are sections where unintended release of gas can occur such as around manifolds, double walled pipes and enclosed areas containing pipe work associated with the bunkering operation.54 The control and monitoring system should be directly linked to the Emergency Shutdown System (ESD). The individual shutdown initiators will vary for each installation. Minimum control and monitoring requirements, on both distributing and receiving units, are:
1. Position (open/closed) and high-‐pressure detector in all bunker manifold valves. 2. Operation of any manual emergency stop push button. 3. ‘Out of range’ sensing on the fixed loading arm. 4. Gas detection (above 40% LEL) 5. Fire detection 6. High-‐pressure and high-‐level detectors in receiving LNG tank. 7. High/low-‐pressure and high-‐level detectors in distributing LNG storage tank.
3.7.1.2 Emergency Shutdown System (ESD) ESD is the main component in the automatic blocking. “The primary function of the ESD system is to stop liquid and vapor transfer in the event of an unsafe condition and bring the LNG transfer system to a safe, static condition.”55 In the STS bunkering arrangement, only the discharging unit will have an ESD. This is based on the class rules for bunkering arrangement, which states that it is not mandatory for the receiving unit to have an ESD valve (see figure 10). The conservative assumption is therefore that it is not present.
26
Figure 11: Rule for bunkering arrangement (source DNV)
3.7.1.3 Emergency Release Couplers (ERC) Emergency Release Couplers (ERC) or breakaway couplers are to be fitted on both units, between the flexible cryogenic transfer hose and the flange connection. The ERC is to incorporate integral automatic valves that will close when separated, either by nature of its design or by remote motorized operation. Its function is to prevent release of liquid or vapor to the surroundings through rapid closure. Under excessive tension (i.e. in a rupture event) it serves as a weak link providing automated release to avoid the hose from breaking. It allows for quick connection and disconnection.56 ERC manufacturers report that closure of the outflow area is mechanically driven and takes less than a second to react.57 This immediate response in the ERC makes it a very effective tool for substantially reducing LOC in the case of a threatening scenario.
3.7.2 Operator Intervention A trained operator should be available on site to supervise and intervene in any unsafe situations that might arise, throughout the process. Operator intervention will take place if the automatic system fails.
3.7.3 Isolation Times Isolation times will vary for each scenario and mitigating measure. Keeping the intervention time low is significant in limiting the amount of substance released during LOC. Several bunkering guidelines and past studies provide various reaction times for the system contributing to the overall isolation time. After considering several options depending on effectiveness, and considering that isolation time is a parameter which will improve as technology advances, the following times in seconds are defined58:
27
• Small leak, ESD works: 120s • Medium and large leak, ESD works: 15s (quicker detection) • S, M and L, ESD fails but operator intervenes: 120s (operators are at all times
managing the bunkering process and wearing gas measuring equipment) • S, M and L, ESD and operator fails: 1800s (maximum outflow time)
3.7.4 Probabilities of Failure The mitigating actions need to be defined for their probabilities of failure. Reference sources distinguish between three types of operated valves. The ESD is considered connected to a computerized system and is therefore classified as automatic with a 0.001 probability of failure per operation. Operator interactions have a 0.1 probability to fail.59 In the event of hose disconnection the ERC (break-‐away) system is involved. Probability of failure data has been difficult to obtain, but is considered highly reliable. Nevertheless, for this study a 0.1 probability of failure is assumed.60
28
4 Risk Assessment
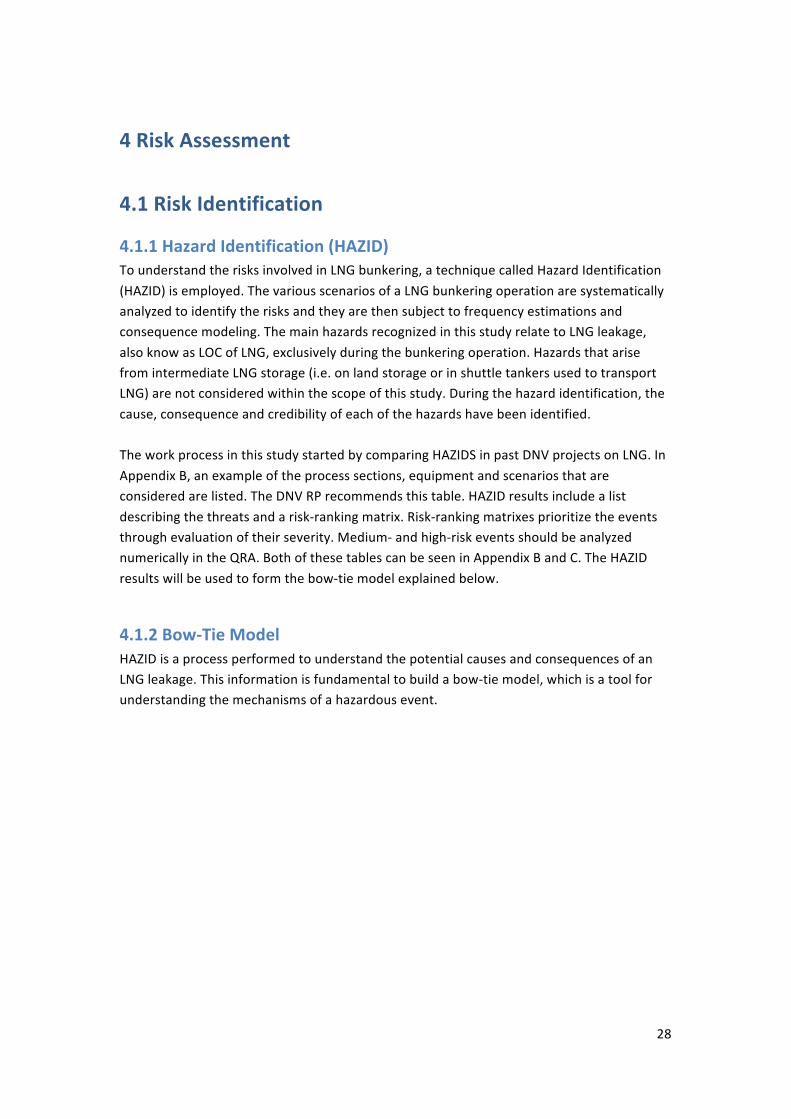
4.1 Risk Identification
4.1.1 Hazard Identification (HAZID) To understand the risks involved in LNG bunkering, a technique called Hazard Identification (HAZID) is employed. The various scenarios of a LNG bunkering operation are systematically analyzed to identify the risks and they are then subject to frequency estimations and consequence modeling. The main hazards recognized in this study relate to LNG leakage, also know as LOC of LNG, exclusively during the bunkering operation. Hazards that arise from intermediate LNG storage (i.e. on land storage or in shuttle tankers used to transport LNG) are not considered within the scope of this study. During the hazard identification, the cause, consequence and credibility of each of the hazards have been identified. The work process in this study started by comparing HAZIDS in past DNV projects on LNG. In Appendix B, an example of the process sections, equipment and scenarios that are considered are listed. The DNV RP recommends this table. HAZID results include a list describing the threats and a risk-‐ranking matrix. Risk-‐ranking matrixes prioritize the events through evaluation of their severity. Medium-‐ and high-‐risk events should be analyzed numerically in the QRA. Both of these tables can be seen in Appendix B and C. The HAZID results will be used to form the bow-‐tie model explained below.
4.1.2 Bow-‐Tie Model HAZID is a process performed to understand the potential causes and consequences of an LNG leakage. This information is fundamental to build a bow-‐tie model, which is a tool for understanding the mechanisms of a hazardous event.
29
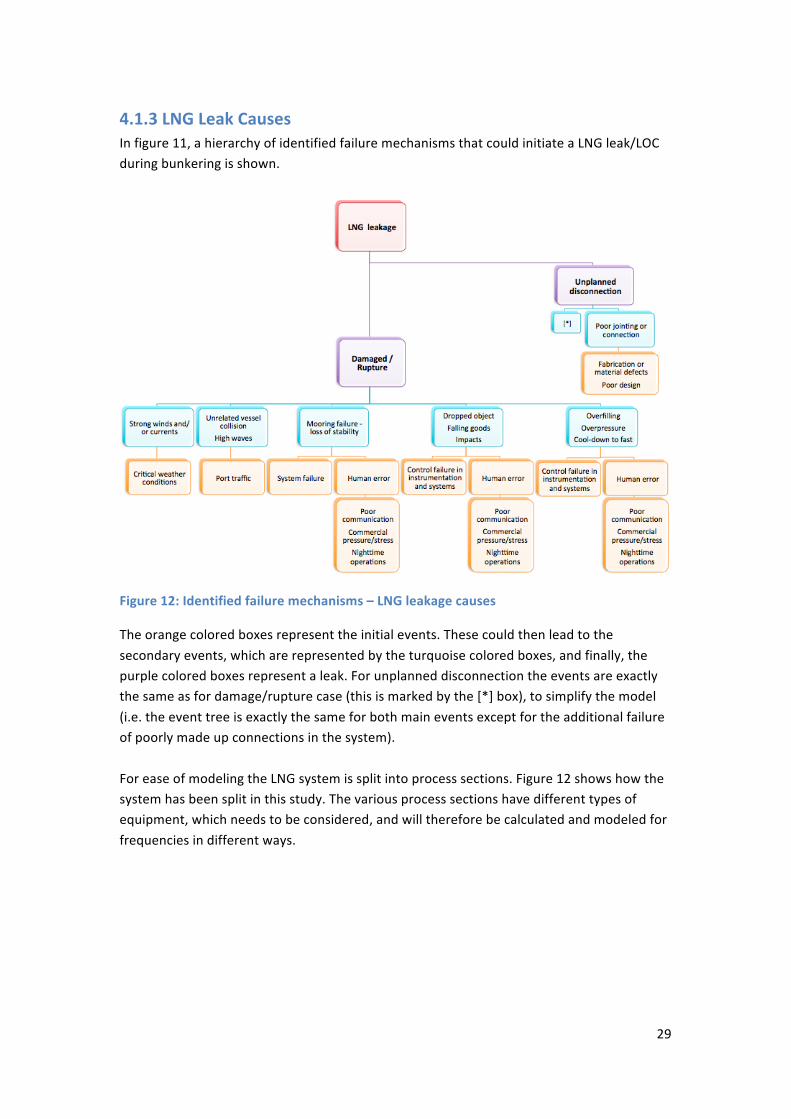
4.1.3 LNG Leak Causes In figure 11, a hierarchy of identified failure mechanisms that could initiate a LNG leak/LOC during bunkering is shown.
Figure 12: Identified failure mechanisms – LNG leakage causes
The orange colored boxes represent the initial events. These could then lead to the secondary events, which are represented by the turquoise colored boxes, and finally, the purple colored boxes represent a leak. For unplanned disconnection the events are exactly the same as for damage/rupture case (this is marked by the [*] box), to simplify the model (i.e. the event tree is exactly the same for both main events except for the additional failure of poorly made up connections in the system). For ease of modeling the LNG system is split into process sections. Figure 12 shows how the system has been split in this study. The various process sections have different types of equipment, which needs to be considered, and will therefore be calculated and modeled for frequencies in different ways.

30
Figure 13: LNG bunkering transfer system process sections
4.1.3.1 Identification of Loss of Containment Scenarios Based on the process section separation, a list of LOC scenarios has been identified.
1. Hose leakage – small 2. Hose leakage – medium 3. Hose leakage – large (FBR) 4. Hose disconnection – ERC works 5. Hose disconnection – ERC fails (FBR) 6. Discharging tank leakage 7. Receiving tank leakage 8. Discharge line (piping, flanges, valves, pump etc.) leakage – small 9. Discharge line leakage – medium 10. Discharge line leakage – large (FBR) 11. Receiving line leakage – small 12. Receiving line leakage – medium 13. Receiving line leakage – large (FBR)
All of these scenarios will be evaluated for emergency shutdown system (ESD) working, ESD failure with operator intervention, and ESD and operator failure.
LNG leakage
Discharging Unit
Process equipment
leak
Damaged /Rupture / Unexpected release
Tank leak
Damaged /Rupture
Interface
Hose leak
Damaged /Rupture
Disconnecson (unplanned)
Receiving Unit
Process equipment
leak
Damaged /Rupture / Unexpected release
Tank leak
Damaged /Rupture
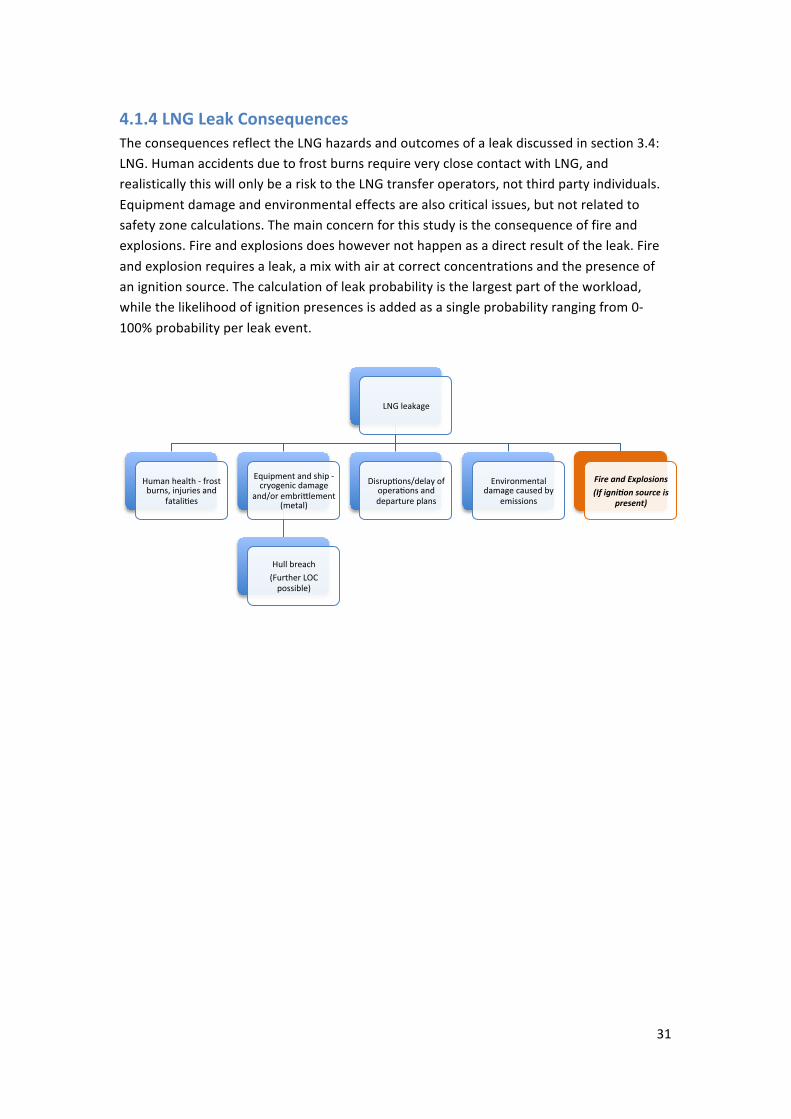
31
4.1.4 LNG Leak Consequences The consequences reflect the LNG hazards and outcomes of a leak discussed in section 3.4: LNG. Human accidents due to frost burns require very close contact with LNG, and realistically this will only be a risk to the LNG transfer operators, not third party individuals. Equipment damage and environmental effects are also critical issues, but not related to safety zone calculations. The main concern for this study is the consequence of fire and explosions. Fire and explosions does however not happen as a direct result of the leak. Fire and explosion requires a leak, a mix with air at correct concentrations and the presence of an ignition source. The calculation of leak probability is the largest part of the workload, while the likelihood of ignition presences is added as a single probability ranging from 0-‐100% probability per leak event.
LNG leakage
Human health -‐ frost burns, injuries and
fatalises
Equipment and ship -‐ cryogenic damage
and/or embrizlement (metal)
Hull breach (Further LOC possible)
Disrupsons/delay of operasons and departure plans
Environmental damage caused by
emissions
Fire and Explosions (If igniWon source is
present)
32
4.2 Risk Analysis
4.2.1 Frequency Analysis The frequency analysis determines the likelihood of a release of hazardous LNG/NG from process equipment for LNG bunkering. The objective of the LEAK frequency analysis is to estimate the frequency of accidental releases originating from the process equipment of the discharging and receiving unit in a ship-‐to-‐ship (STS) LNG bunkering system. The interface between the discharging and receiving units, the cryogenic transfer hose, will be covered separately through fault tree analysis. The frequency analysis combined with the hole size distribution are fundamental for the consequence-‐ and risk estimates.61 The aggregate frequency analysis result will subsequently provide inputs for PHAST and PHASTRisk calculations and modeling. All frequencies will be established on a per bunkering operation basis.
4.2.2 Transfer Hose Failure Frequencies The interface between the two units covers the cryogenic hose and vapor return line. This process section cannot be calculated using LEAK software as there is no data covering hoses and in particular not cryogenic. To produce leak frequencies for the hose, a fault tree is created and events leading to a leakage are considered at a fundamental level. The aim is to create generic failure frequencies for flexible cryogenic transfer hoses. Current standard practice is to use data from Advisory Committee on Dangerous Substances (ACDS) on loading arm frequencies directly. ACDS is considered the most representative data on LNG bunkering systems so far. Loading arms are more complex fixed pipes with multiple swivel systems, and differ significantly from hose based systems in terms of the fault tree. Loading arms will as a consequence include other factors in addition to considering the ACDS. This will be a more conservative approach, and it also shows the procedure in calculating frequencies from initial to main event. This section will present what is considered initial events, which could lead to LNG leakage or LOC taking place and explanations for determining event frequencies. The assumptions made will be summarized. When the relevant events are determined, the “fault tree” (excel add-‐in) will be used to calculate the frequencies for this process section of the transfer system. Based on the HAZID two main types of failures have been identified for the flexible cryogenic transfer hose: an unplanned disconnection (of the breakaway coupling) and damage or rupture of the hose, see figure 12.
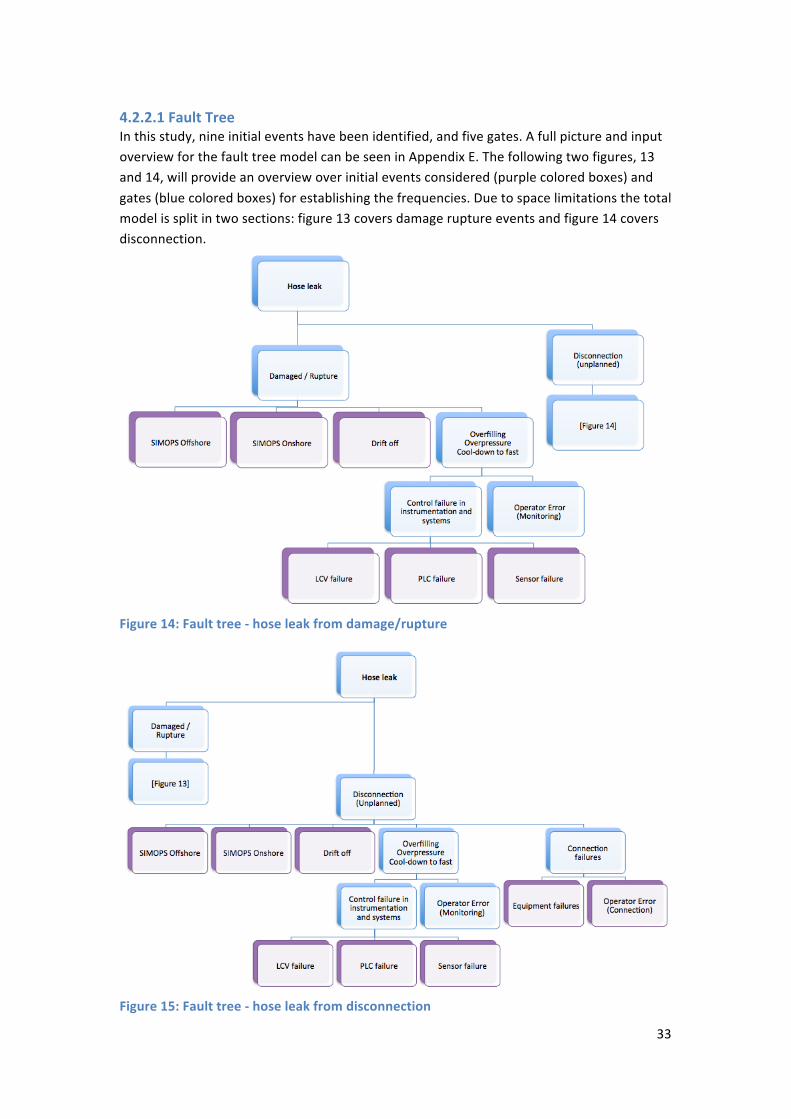
33
4.2.2.1 Fault Tree In this study, nine initial events have been identified, and five gates. A full picture and input overview for the fault tree model can be seen in Appendix E. The following two figures, 13 and 14, will provide an overview over initial events considered (purple colored boxes) and gates (blue colored boxes) for establishing the frequencies. Due to space limitations the total model is split in two sections: figure 13 covers damage rupture events and figure 14 covers disconnection.
Figure 14: Fault tree -‐ hose leak from damage/rupture
Figure 15: Fault tree -‐ hose leak from disconnection
34
4.2.2.1.1 SIMOPS Offshore SIMOPS Offshore are simultaneous operations taking place offshore. This failure event relates to collision risk and frequencies. This type of failure is site-‐specific, meaning that it will vary depending on the port traffic in that specific location. In site-‐specific studies, nautical activity in a port is considered and collision frequencies and their impact energies are calculated specifically. The assessment will further cover the probability of LOC scenarios. Overall, the assessment requires high amounts of port data to be completed. This thesis is generic and not site-‐specific. As such it does not include considerations relevant to a specific site. The selected failure frequency represents collisions as a whole and does not include information on the size and force of the impact, nor the ensuing consequences. The frequency is considered low, and to be conservative it is assumed that all collisions lead to LOC failures for the hose. A low SIMOPS Offshore frequency is reasonable since the bunkering is considered to take place in ports or other sheltered locations, as discussed in section 3.5: Nautical Activity. ACDS loading arm frequency consider collisions as one of its contributors to failure. The frequency consequently used is 2.30E-‐07.62 Leak frequencies presented in ACDS is based on filling of LNG tankers, which typically last for 18-‐24hours. A ferry has a much shorter duration, assumed to last two hours per bunkering operation, in this study. The frequencies are consequently modified according to duration. Statistics must be gathered over several decades to give reliable outcome (sample population). Small-‐scale STS bunkering has only been a technical solution since 2001 (Norwegian ferry Glutra was the first LNG fueled ship), and any data compiled is not considered sufficient. The chosen frequency is conservative considering that collision events have been reduced over time, attributed to introduction of dynamic positioning systems and improved communication systems, electronic charting, navigational techniques and improved procedures. Based on this, any collision frequency chosen based on historical data should be conservative to current expected frequency.
4.2.2.1.2 SIMOPS Onshore SIMOPS Onshore are simultaneous operations taking place onshore and refers to failures such as dropped objects, falling goods and impacts. The LNG fueled vessel (receiving unit) will in the case of small-‐scale LNG bunkering be moored to dock. In the case of limited port time, simultaneous operations such as lifting of goods might take place. If these operations fail, it could have consequences for the LNG process equipment. OGP – Risk Assessment Data Directory, Report No. 434-‐08 Mechanical lifting failures, is used to provide frequencies for SIMOPS Offshore. In part two, summary of recommended data, in the table “Dropped object probabilities for mobile units (per lift)”. The mobile unit’s probability is used instead of the fixed as the receiving ship could experience movement and for STS both units are seaborne. To be conservative in the choice of frequency the total frequency used is 1.4E-‐05. This frequency includes all types of lifting failures for mobile
35
units. It is also assumed that SIMOPS Onshore takes place once for every bunker operation. By assuming this we can apply the frequency directly as a per operation frequency. The assumption to assume SIMOPS every time is very conservative as current LNG bunkering guidelines advice against such operations while bunkering takes place.
4.2.2.1.3 Drift-‐off Drift-‐off failures develop from mooring failure and loss of stability in vessels. This frequency can also be provided by ACDS (as for SIMOPS Offshore). The drift-‐off frequency is consequently 6.70E-‐07 for loading arm failure for larger transfers. This frequency will also be altered to fit the current study.
4.2.2.1.4 Overfilling, Overpressure and Cool-‐down Overfilling and overpressure in the tanks, can lead to failures in the rest of the process equipment. Rapid cool-‐down is a risk to the entire process equipment. These types of events are further divided into two initial events, which include instrumentation and/or system failure or operator error. 4.2.2.2.4.1 Control Failure in Instrumentation and Systems Control failures in instrumentation and systems are divided into three types of failures. Frequency information on these instrumentations is gathered from OREDA, Offshore Reliability Data 5th edition 2009, Volume 1 – Topside Equipment (pages 457, 479 and 497). The failure rates given are per hour of operation. There are 8760 hours in a year, but bunkering only takes place a fraction of these hours.
• PLC (Programmable Logic Controller): 17.37E-‐06 • LCV (Level Control Valve): 2.98E-‐06 • Sensors: 3.53E-‐06
These frequencies will be modified to account for frequency per bunkering operation. 4.2.2.2.4.2 Operator Error (Monitoring) OGP – Risk Assessment Data Directory, Report No. 434-‐05 Human factors, in QRA table 2.7 is used to provide information on the “Human Errors”. Once proper training has been provided, monitoring of the operation for an operator is uncomplicated and repetitive. The receiving unit’s control room, where monitoring takes place, should be stress-‐free when in port. Based on these assumptions, the operator error for monitoring qualifies as human error type 2, with frequency 10E-‐04 per demand. This number is directly used as the operator error per transfer.
4.2.2.1.5 Connection Failures For unplanned disconnection scenarios, connection failure is an additional event, which can take place. Connection failures can be divided between equipment failures and operator error. Both of these failures can be obtained from the ACDS and once again they will be modified to comply with bunkering time.
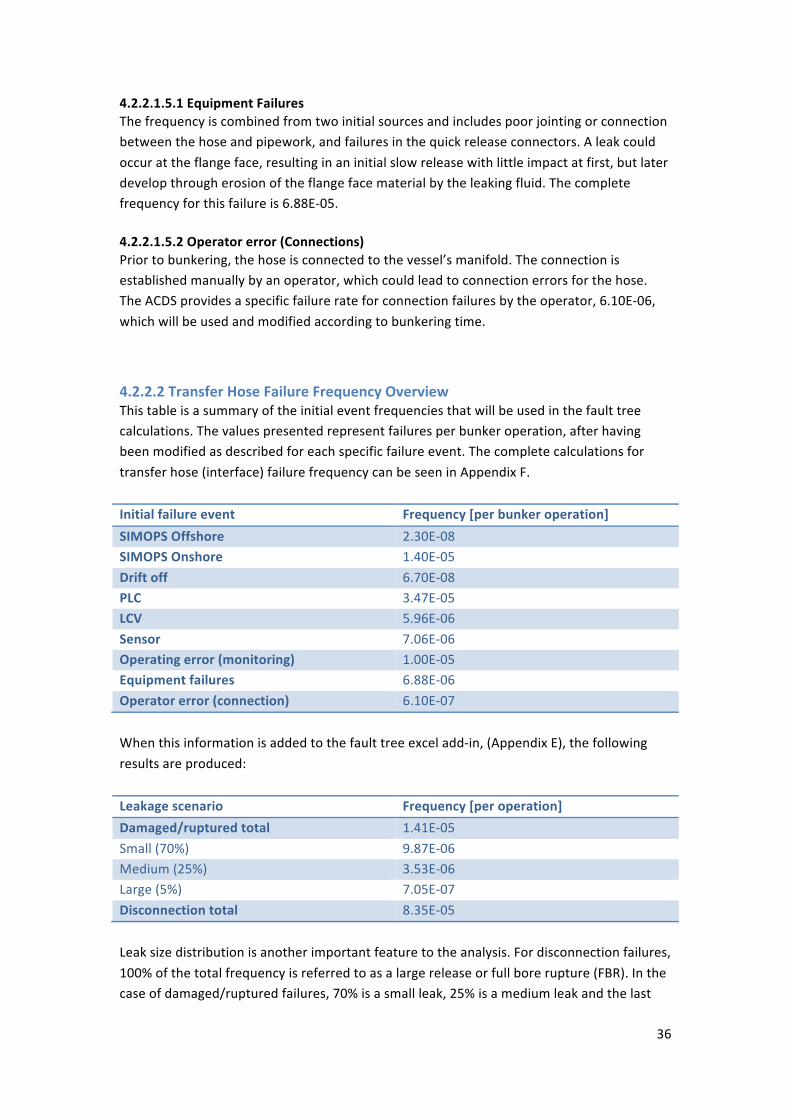
36
4.2.2.1.5.1 Equipment Failures The frequency is combined from two initial sources and includes poor jointing or connection between the hose and pipework, and failures in the quick release connectors. A leak could occur at the flange face, resulting in an initial slow release with little impact at first, but later develop through erosion of the flange face material by the leaking fluid. The complete frequency for this failure is 6.88E-‐05. 4.2.2.1.5.2 Operator error (Connections) Prior to bunkering, the hose is connected to the vessel’s manifold. The connection is established manually by an operator, which could lead to connection errors for the hose. The ACDS provides a specific failure rate for connection failures by the operator, 6.10E-‐06, which will be used and modified according to bunkering time.
4.2.2.2 Transfer Hose Failure Frequency Overview This table is a summary of the initial event frequencies that will be used in the fault tree calculations. The values presented represent failures per bunker operation, after having been modified as described for each specific failure event. The complete calculations for transfer hose (interface) failure frequency can be seen in Appendix F. Initial failure event Frequency [per bunker operation] SIMOPS Offshore 2.30E-‐08 SIMOPS Onshore 1.40E-‐05 Drift off 6.70E-‐08 PLC 3.47E-‐05 LCV 5.96E-‐06 Sensor 7.06E-‐06 Operating error (monitoring) 1.00E-‐05 Equipment failures 6.88E-‐06 Operator error (connection) 6.10E-‐07 When this information is added to the fault tree excel add-‐in, (Appendix E), the following results are produced: Leakage scenario Frequency [per operation] Damaged/ruptured total 1.41E-‐05 Small (70%) 9.87E-‐06 Medium (25%) 3.53E-‐06 Large (5%) 7.05E-‐07 Disconnection total 8.35E-‐05 Leak size distribution is another important feature to the analysis. For disconnection failures, 100% of the total frequency is referred to as a large release or full bore rupture (FBR). In the case of damaged/ruptured failures, 70% is a small leak, 25% is a medium leak and the last
37
5% are large leaks. The Dutch guideline for risk calculations, also known as HARI, is a source open to the public. It estimates that hose leakage leads to rupture in 10% of the cases when hoses are involved. This is however not including LNG transfer hoses with its advanced technologies. DNV GL practice in newer frequency analysis studies estimate that a 5% rupture scenario for large leaks is sufficiently conservative. The categorization of leak event into large (rupture), medium and small sizes is a judgment based on DNV’s estimates of the leak sizes typical for all hose failures, together with comparison against hole size distributions for typical process leaks.
4.2.2.3 Vapor Return The transfer system is equipped with a vapor return line. Source data provided and gathered does not cover the vapor return line explicitly. Vapor return line leaks are generally much less significant than for the LNG line itself. The same frequencies will be used for the vapor return line as for the LNG line for the various process sections. This means that we consider the same failure rates for vapor return line as LNG line. Vapor return line will be parallel to the LNG line for every process section including; discharging line, receiving line and transfer hose.
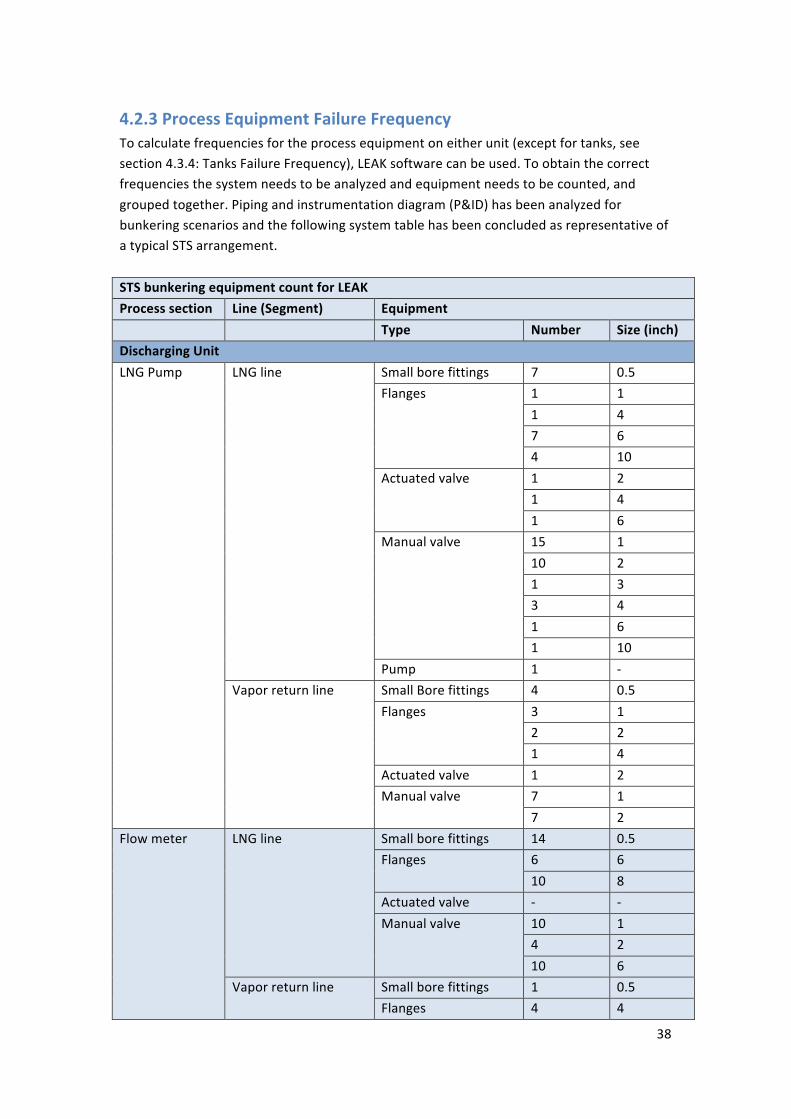
38
4.2.3 Process Equipment Failure Frequency To calculate frequencies for the process equipment on either unit (except for tanks, see section 4.3.4: Tanks Failure Frequency), LEAK software can be used. To obtain the correct frequencies the system needs to be analyzed and equipment needs to be counted, and grouped together. Piping and instrumentation diagram (P&ID) has been analyzed for bunkering scenarios and the following system table has been concluded as representative of a typical STS arrangement. STS bunkering equipment count for LEAK Process section Line (Segment) Equipment Type Number Size (inch) Discharging Unit LNG Pump LNG line Small bore fittings 7 0.5
Flanges 1 1 1 4 7 6 4 10
Actuated valve 1 2 1 4 1 6
Manual valve 15 1 10 2 1 3 3 4 1 6 1 10
Pump 1 -‐ Vapor return line Small Bore fittings 4 0.5
Flanges 3 1 2 2 1 4
Actuated valve 1 2 Manual valve 7 1
7 2 Flow meter LNG line Small bore fittings 14 0.5
Flanges 6 6 10 8
Actuated valve -‐ -‐ Manual valve 10 1
4 2 10 6
Vapor return line Small bore fittings 1 0.5 Flanges 4 4
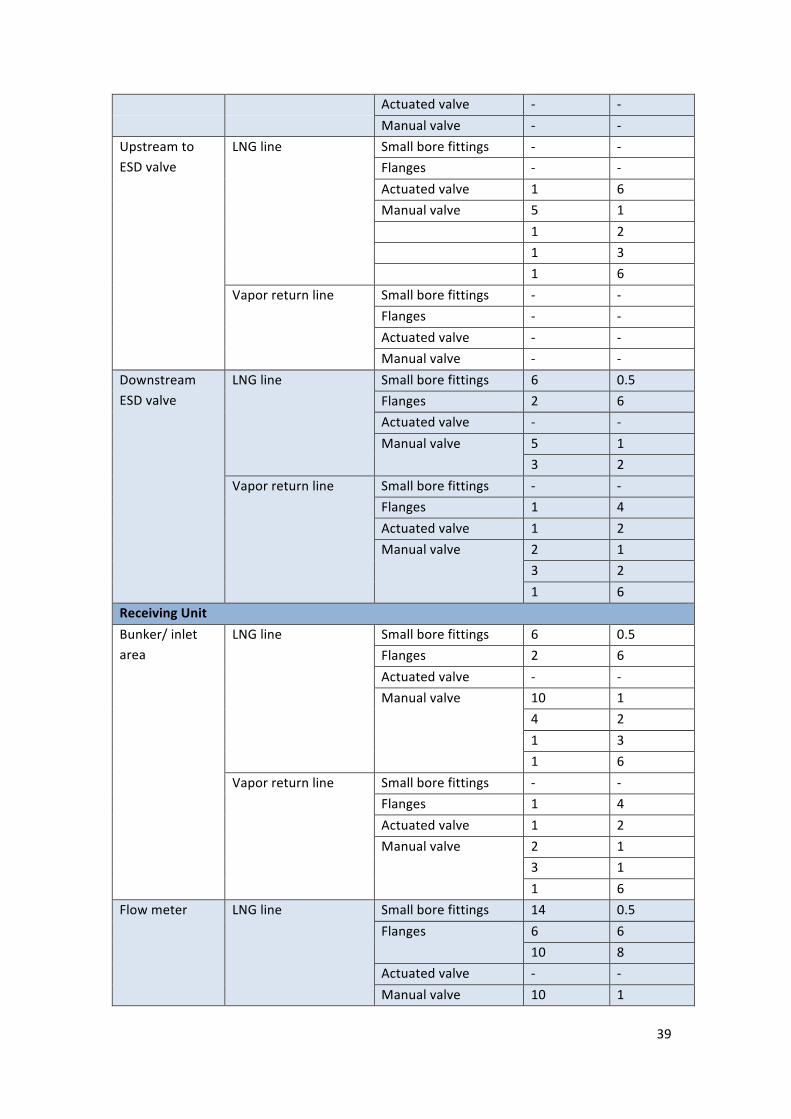
39
Actuated valve -‐ -‐ Manual valve -‐ -‐
Upstream to ESD valve
LNG line Small bore fittings -‐ -‐ Flanges -‐ -‐ Actuated valve 1 6 Manual valve 5 1 1 2 1 3 1 6
Vapor return line Small bore fittings -‐ -‐ Flanges -‐ -‐ Actuated valve -‐ -‐ Manual valve -‐ -‐
Downstream ESD valve
LNG line Small bore fittings 6 0.5 Flanges 2 6 Actuated valve -‐ -‐ Manual valve 5 1
3 2 Vapor return line Small bore fittings -‐ -‐
Flanges 1 4 Actuated valve 1 2 Manual valve 2 1
3 2 1 6
Receiving Unit Bunker/ inlet area
LNG line Small bore fittings 6 0.5 Flanges 2 6 Actuated valve -‐ -‐ Manual valve 10 1
4 2 1 3 1 6
Vapor return line Small bore fittings -‐ -‐ Flanges 1 4 Actuated valve 1 2 Manual valve 2 1
3 1 1 6
Flow meter LNG line Small bore fittings 14 0.5 Flanges 6 6
10 8 Actuated valve -‐ -‐ Manual valve 10 1
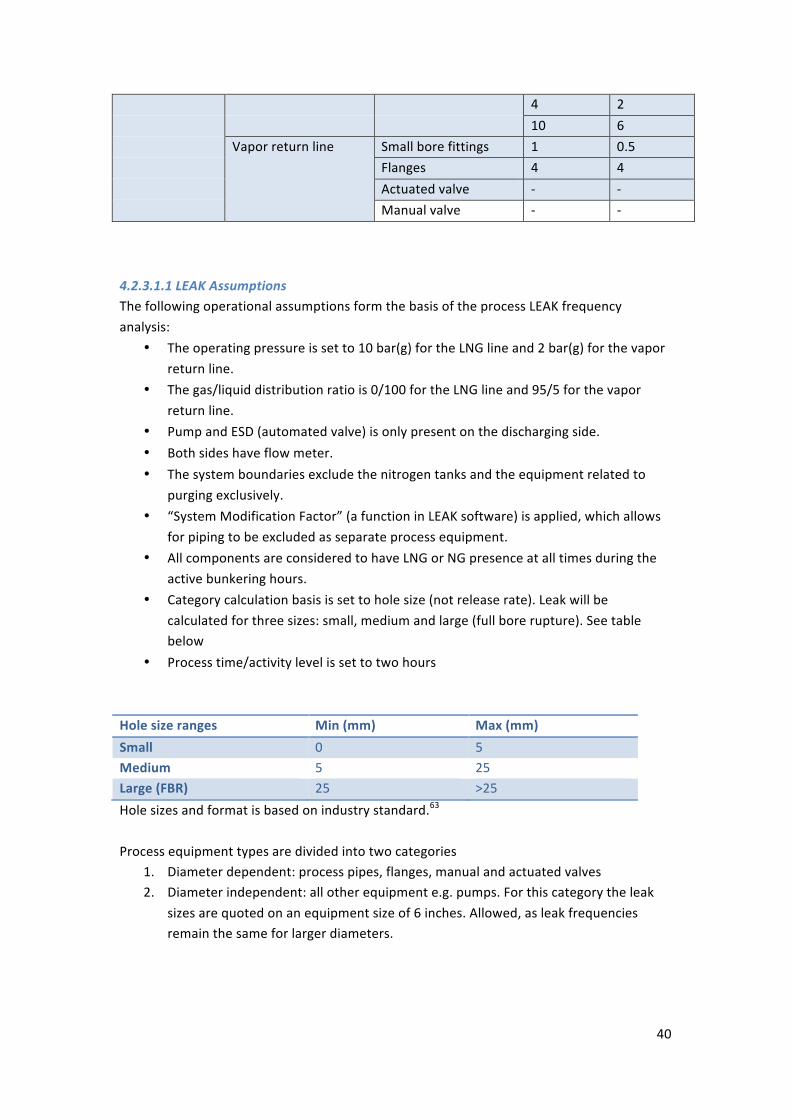
40
4 2 10 6
Vapor return line Small bore fittings 1 0.5 Flanges 4 4 Actuated valve -‐ -‐ Manual valve -‐ -‐
4.2.3.1.1 LEAK Assumptions The following operational assumptions form the basis of the process LEAK frequency analysis:
• The operating pressure is set to 10 bar(g) for the LNG line and 2 bar(g) for the vapor return line.
• The gas/liquid distribution ratio is 0/100 for the LNG line and 95/5 for the vapor return line.
• Pump and ESD (automated valve) is only present on the discharging side. • Both sides have flow meter. • The system boundaries exclude the nitrogen tanks and the equipment related to
purging exclusively. • “System Modification Factor” (a function in LEAK software) is applied, which allows
for piping to be excluded as separate process equipment. • All components are considered to have LNG or NG presence at all times during the
active bunkering hours. • Category calculation basis is set to hole size (not release rate). Leak will be
calculated for three sizes: small, medium and large (full bore rupture). See table below
• Process time/activity level is set to two hours Hole size ranges Min (mm) Max (mm) Small 0 5 Medium 5 25 Large (FBR) 25 >25 Hole sizes and format is based on industry standard.63 Process equipment types are divided into two categories
1. Diameter dependent: process pipes, flanges, manual and actuated valves 2. Diameter independent: all other equipment e.g. pumps. For this category the leak
sizes are quoted on an equipment size of 6 inches. Allowed, as leak frequencies remain the same for larger diameters.
41
4.2.3.1.2 Pipe Line A common aspect of uncertainty in QRA is associated with the frequency of inter-‐unit pipeline releases. Application of process pipework failure data will tend to give overly conservative values with respect to longer inter-‐unit pipe segments. The historical data for process piping from the HCRD is therefore not used for this part of the assessment. Instead, the normal practice is used, which is to apply a factor of 25% to the overall release frequency to account for process piping contribution.64 There is however evidence that the HCRD data gives much higher failure frequencies than what is expected based on historical evidence for LNG facilities. Given the perceived risks associated with LNG it is often the case that fully welded pipelines and connections are employed. This means that in a P&ID, all valves are not necessarily flanged.65 Based on the findings of the statistical analysis, the contribution from piping in the LNG facility is reduced to 10% of that of process piping on a regular Oil & Gas offshore platform. Overall piping contribution to the release frequency is then 2.5%. Topside process equipment contributes to 97.5% of the release frequency and is not the same as inter-‐unit pipework. To account for topside process equipment, 100% is divided by 97.5%. The overall factor applied to the detailed part count to include the piping contribution is 1.026 (i.e. the increase is 2.6%).66
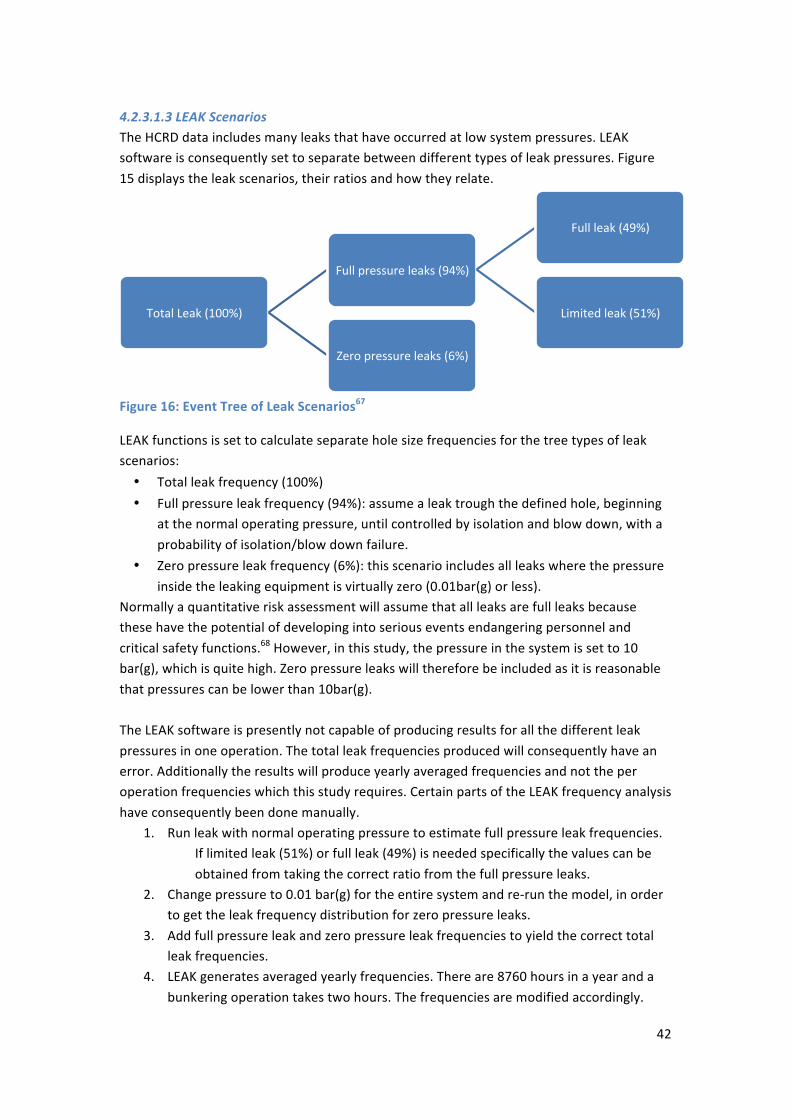
42
4.2.3.1.3 LEAK Scenarios The HCRD data includes many leaks that have occurred at low system pressures. LEAK software is consequently set to separate between different types of leak pressures. Figure 15 displays the leak scenarios, their ratios and how they relate.
Figure 16: Event Tree of Leak Scenarios67
LEAK functions is set to calculate separate hole size frequencies for the tree types of leak scenarios: • Total leak frequency (100%) • Full pressure leak frequency (94%): assume a leak trough the defined hole, beginning
at the normal operating pressure, until controlled by isolation and blow down, with a probability of isolation/blow down failure.
• Zero pressure leak frequency (6%): this scenario includes all leaks where the pressure inside the leaking equipment is virtually zero (0.01bar(g) or less).
Normally a quantitative risk assessment will assume that all leaks are full leaks because these have the potential of developing into serious events endangering personnel and critical safety functions.68 However, in this study, the pressure in the system is set to 10 bar(g), which is quite high. Zero pressure leaks will therefore be included as it is reasonable that pressures can be lower than 10bar(g). The LEAK software is presently not capable of producing results for all the different leak pressures in one operation. The total leak frequencies produced will consequently have an error. Additionally the results will produce yearly averaged frequencies and not the per operation frequencies which this study requires. Certain parts of the LEAK frequency analysis have consequently been done manually.
1. Run leak with normal operating pressure to estimate full pressure leak frequencies. If limited leak (51%) or full leak (49%) is needed specifically the values can be obtained from taking the correct ratio from the full pressure leaks.
2. Change pressure to 0.01 bar(g) for the entire system and re-‐run the model, in order to get the leak frequency distribution for zero pressure leaks.
3. Add full pressure leak and zero pressure leak frequencies to yield the correct total leak frequencies.
4. LEAK generates averaged yearly frequencies. There are 8760 hours in a year and a bunkering operation takes two hours. The frequencies are modified accordingly.
Total Leak (100%)
Full pressure leaks (94%)
Full leak (49%)
Limited leak (51%)
Zero pressure leaks (6%)
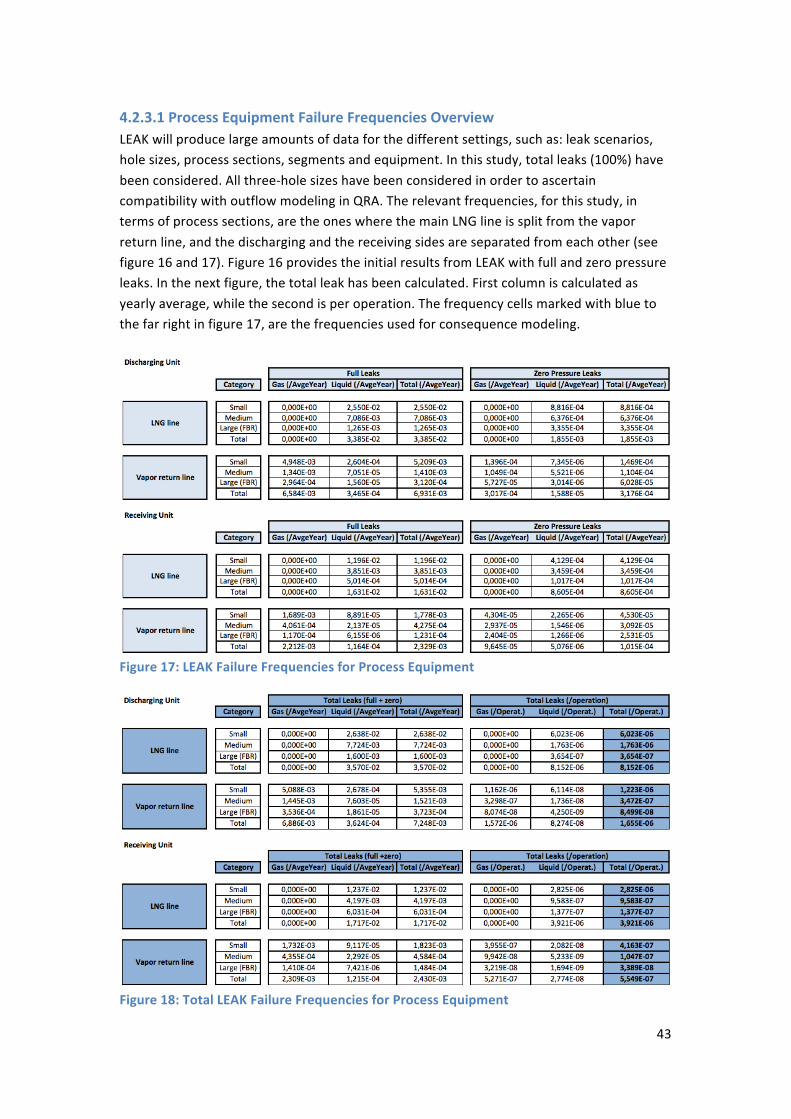
43
4.2.3.1 Process Equipment Failure Frequencies Overview LEAK will produce large amounts of data for the different settings, such as: leak scenarios, hole sizes, process sections, segments and equipment. In this study, total leaks (100%) have been considered. All three-‐hole sizes have been considered in order to ascertain compatibility with outflow modeling in QRA. The relevant frequencies, for this study, in terms of process sections, are the ones where the main LNG line is split from the vapor return line, and the discharging and the receiving sides are separated from each other (see figure 16 and 17). Figure 16 provides the initial results from LEAK with full and zero pressure leaks. In the next figure, the total leak has been calculated. First column is calculated as yearly average, while the second is per operation. The frequency cells marked with blue to the far right in figure 17, are the frequencies used for consequence modeling.
Figure 17: LEAK Failure Frequencies for Process Equipment
Figure 18: Total LEAK Failure Frequencies for Process Equipment
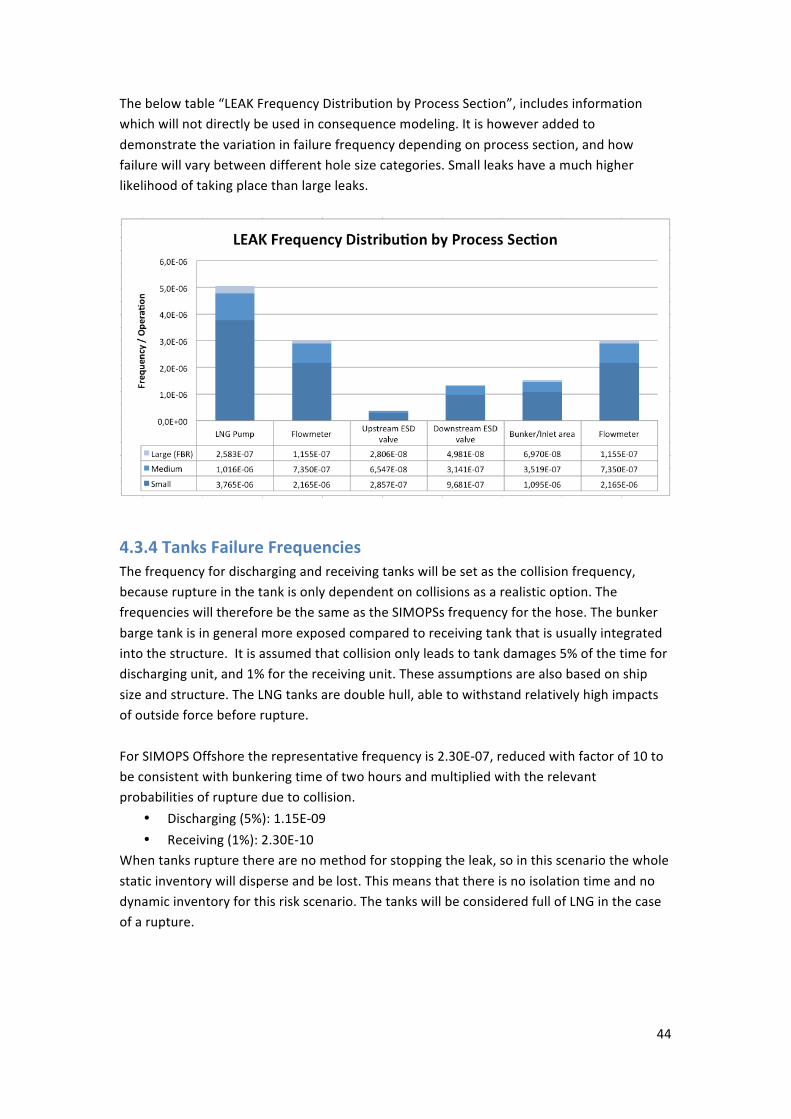
44
The below table “LEAK Frequency Distribution by Process Section”, includes information which will not directly be used in consequence modeling. It is however added to demonstrate the variation in failure frequency depending on process section, and how failure will vary between different hole size categories. Small leaks have a much higher likelihood of taking place than large leaks.
4.3.4 Tanks Failure Frequencies The frequency for discharging and receiving tanks will be set as the collision frequency, because rupture in the tank is only dependent on collisions as a realistic option. The frequencies will therefore be the same as the SIMOPSs frequency for the hose. The bunker barge tank is in general more exposed compared to receiving tank that is usually integrated into the structure. It is assumed that collision only leads to tank damages 5% of the time for discharging unit, and 1% for the receiving unit. These assumptions are also based on ship size and structure. The LNG tanks are double hull, able to withstand relatively high impacts of outside force before rupture. For SIMOPS Offshore the representative frequency is 2.30E-‐07, reduced with factor of 10 to be consistent with bunkering time of two hours and multiplied with the relevant probabilities of rupture due to collision.
• Discharging (5%): 1.15E-‐09 • Receiving (1%): 2.30E-‐10
When tanks rupture there are no method for stopping the leak, so in this scenario the whole static inventory will disperse and be lost. This means that there is no isolation time and no dynamic inventory for this risk scenario. The tanks will be considered full of LNG in the case of a rupture.
45
4.2.2 Consequence Modeling In this section, output is generated which will provide input for concluding the necessary range of safety zones. This section will cover PHAST and PHASTRisk input values (i.e. constant and variable parameters), assumptions made and software working procedure. Input data for PHAST includes frequency and inventory calculation. For calculation purposes, the data will be added in excel. The file is called ‘Consequence Modeling Calculations’. The file is incorporated and its content includes:
• INPUTS: constant parameters, dimensions and weather data. • FREQUENCIES: frequencies for the initial 13 LOC scenarios before split into the sub
scenarios of ESD and ERC failures. • TRANSFER HOSE: two tables; the first table includes input data (frequencies,
isolation time and hole size), and the second table providing with PHAST outputs (release rate and duration) and complete inventory calculations.
• PROCESS EQUIPMENT: split between discharging and receiving line. Includes the same two tables as for transfer hose.
• TANKS: equal information as for transfer hose.
4.2.2.1 Frequency Limit DNV internal guidelines for frequency calculations (G16 LNG guidelines) suggest not including scenarios with frequencies lower than 10-‐8. This is because these scenarios are too small to contribute to the 10-‐6 contour. All the frequencies identified on the ‘FREQUENCIES’ page should be considered but when they undergo the final sub scenario distribution of ESD and ERC failure the frequencies drop considerably. The final scenario frequency considered in PHAST and PHASTRisk modeling will be included in the tables for ‘TRANSFER HOSE’, ‘PROCESS EQUIPMENT’ and ‘TANKS’ respectively. Many of these are well below the limit (i.e. tank frequencies of 10-‐11 and 10-‐12) and could therefore have been excluded. Exclusion takes place in modeling as there is additional work to adding any risk scenario. All scenarios, regardless of low frequency, will be considered in this study to provide results for all process sections of the bunkering system. A total of 65 LOC scenarios are assessed.
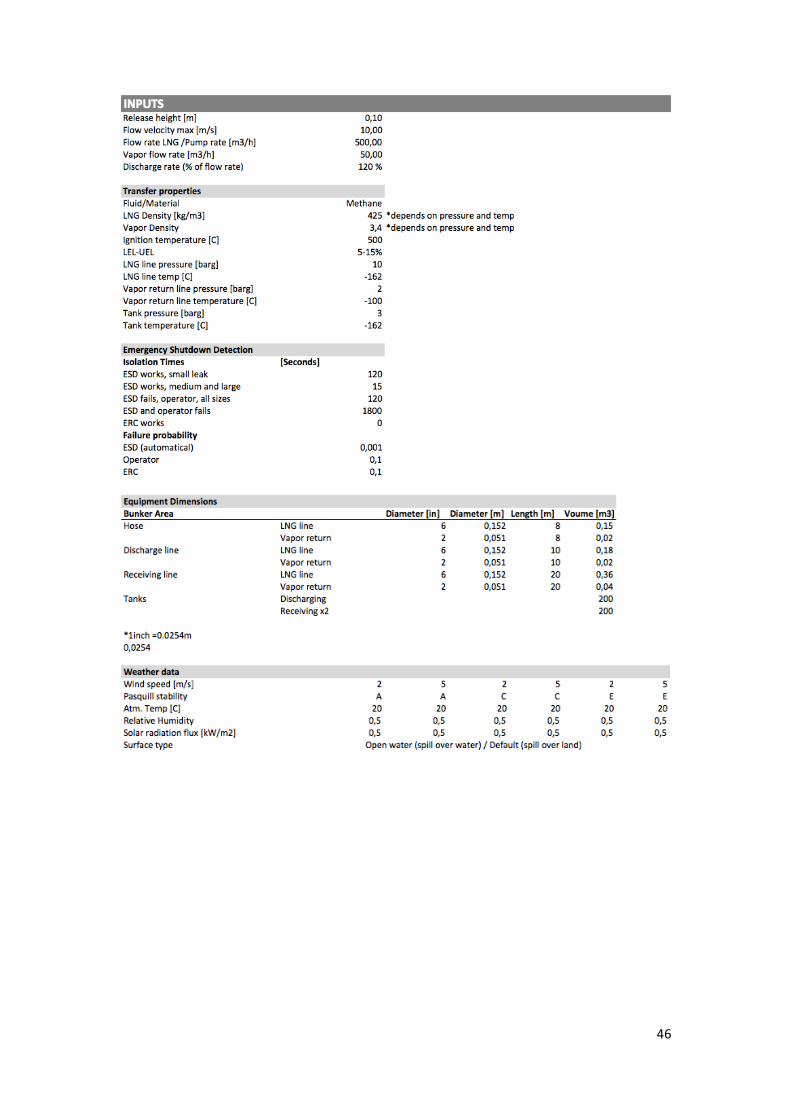
46
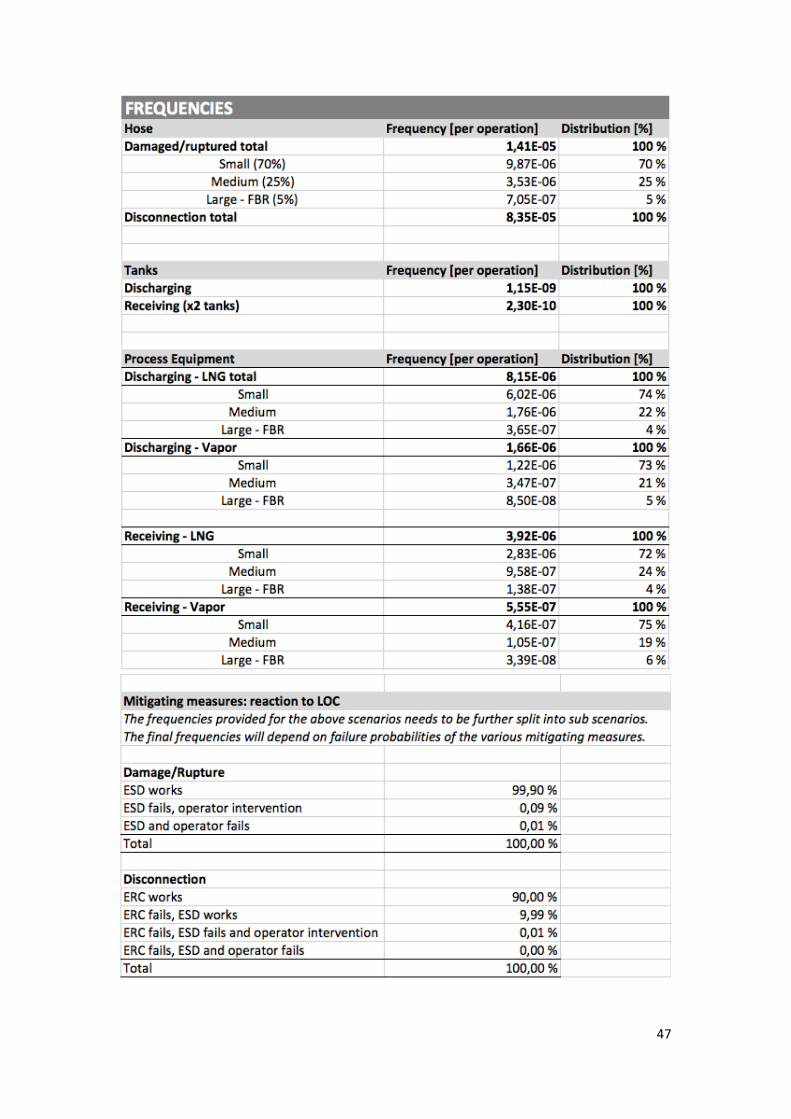
47
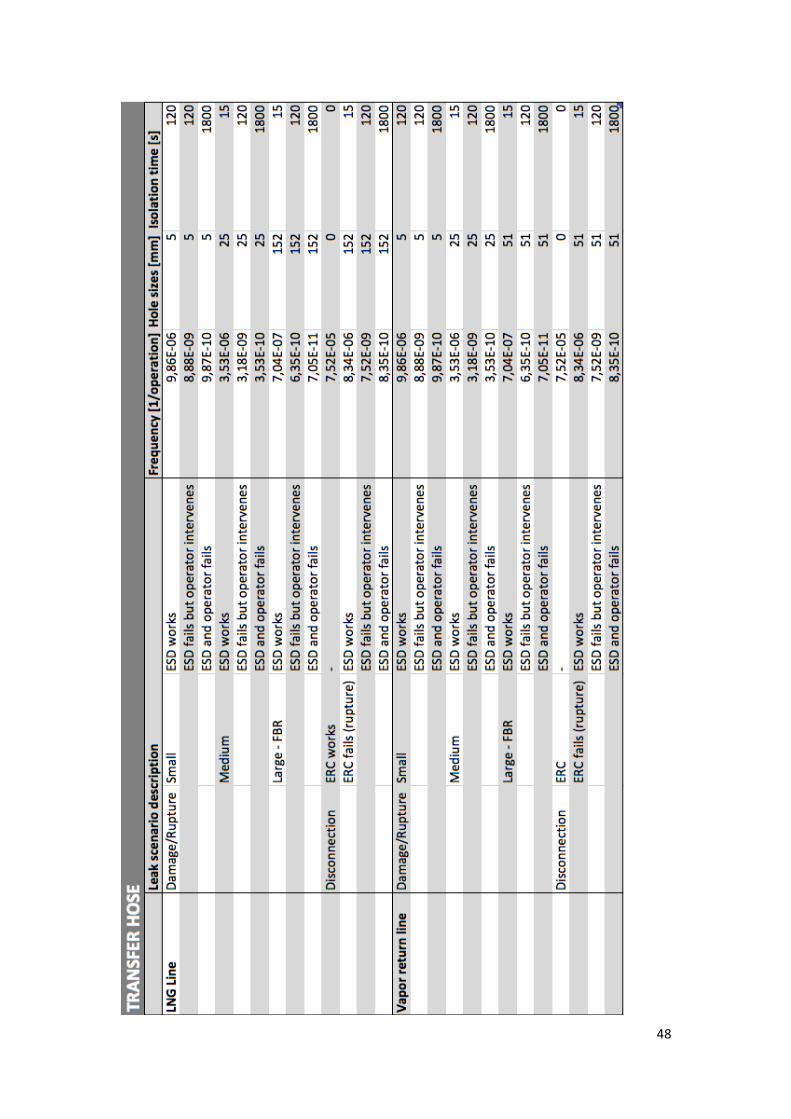
48
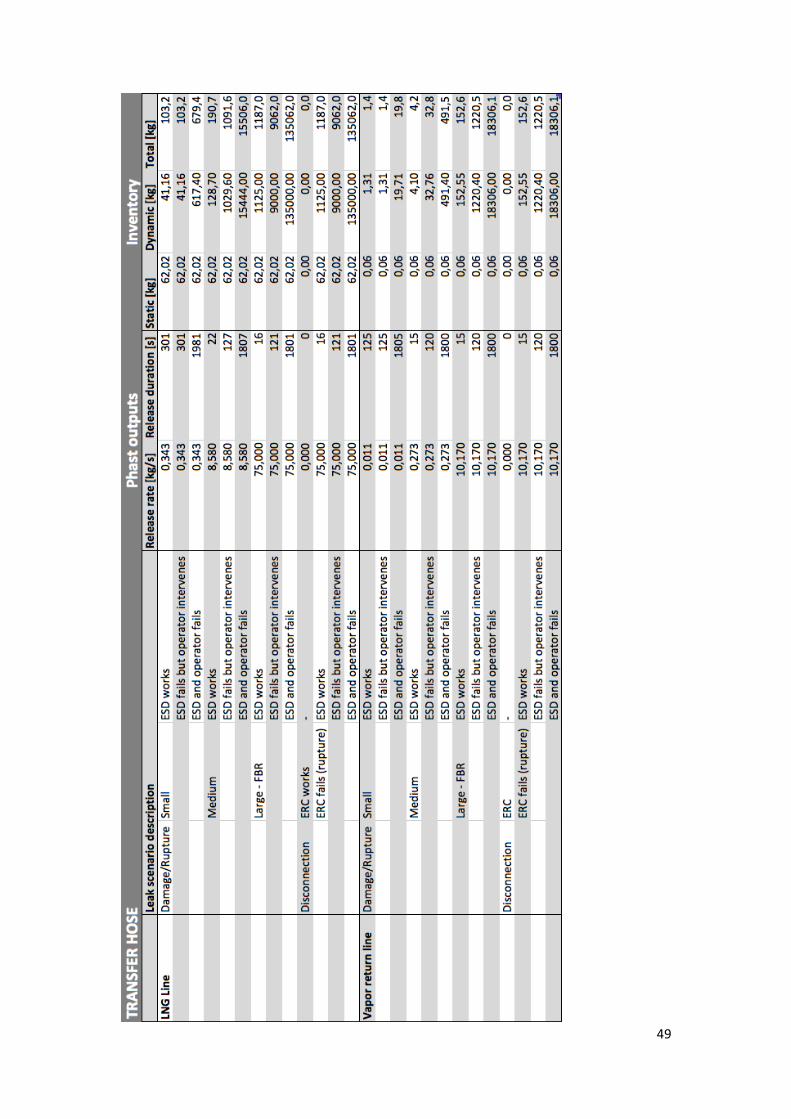
49
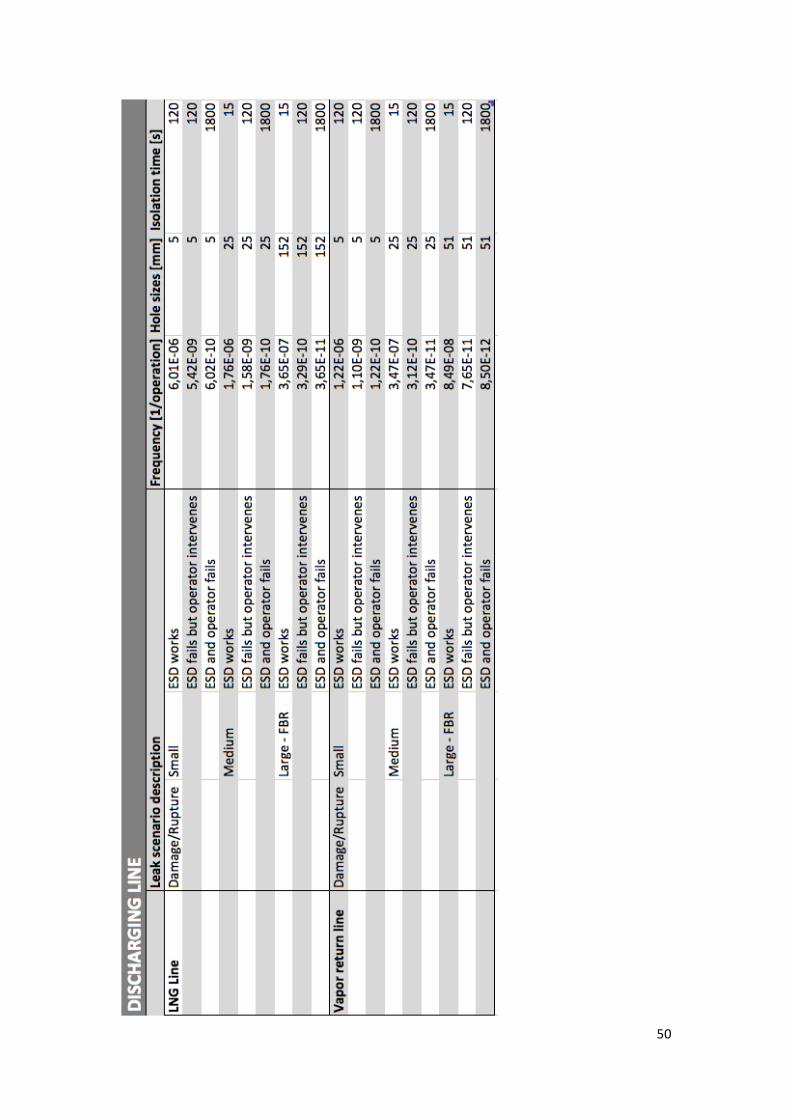
50
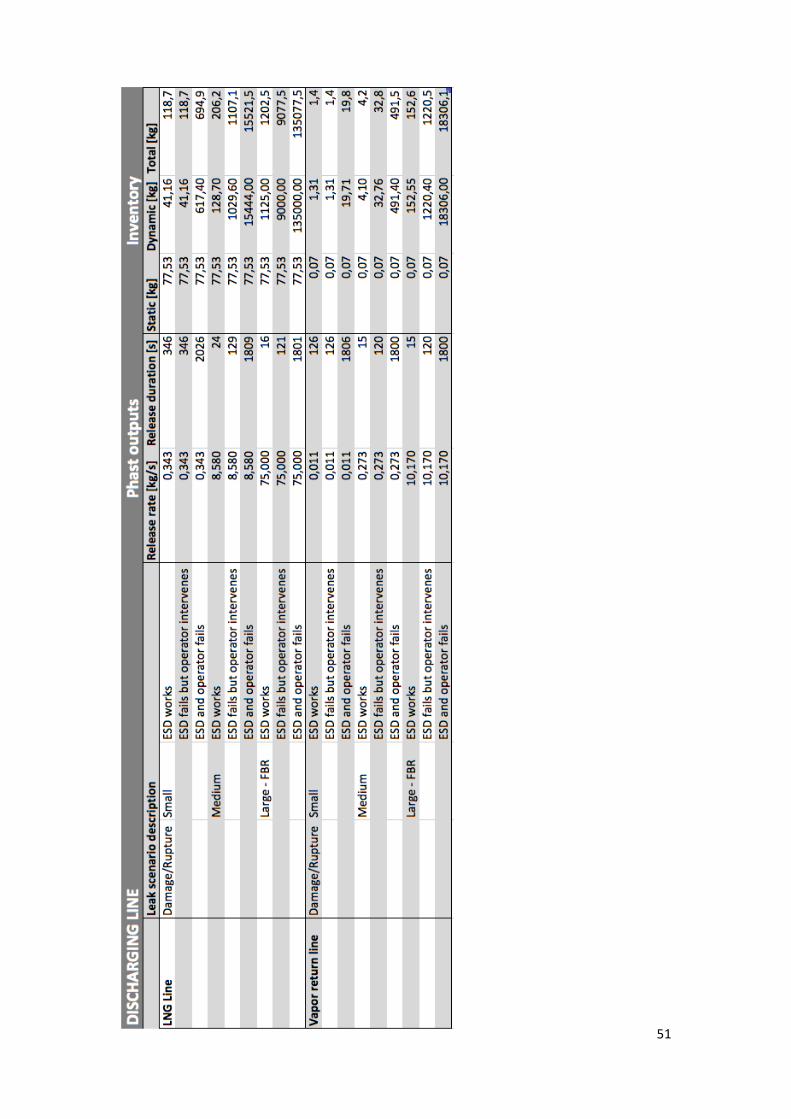
51
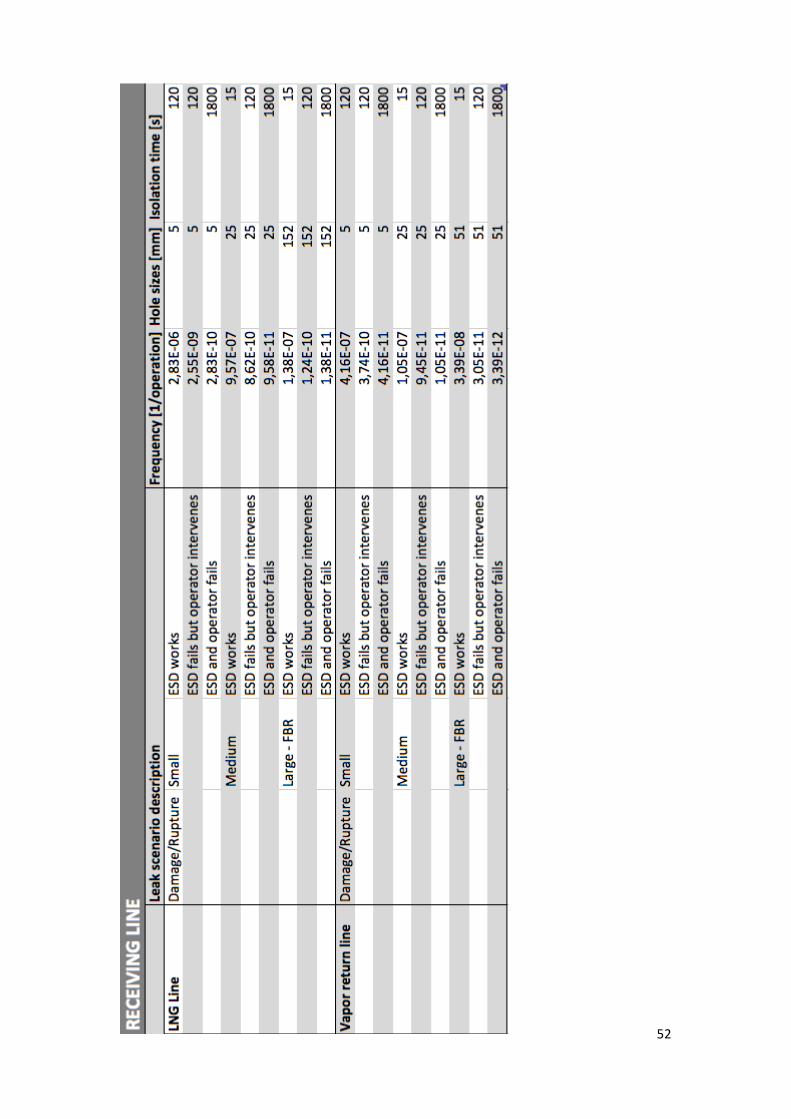
52
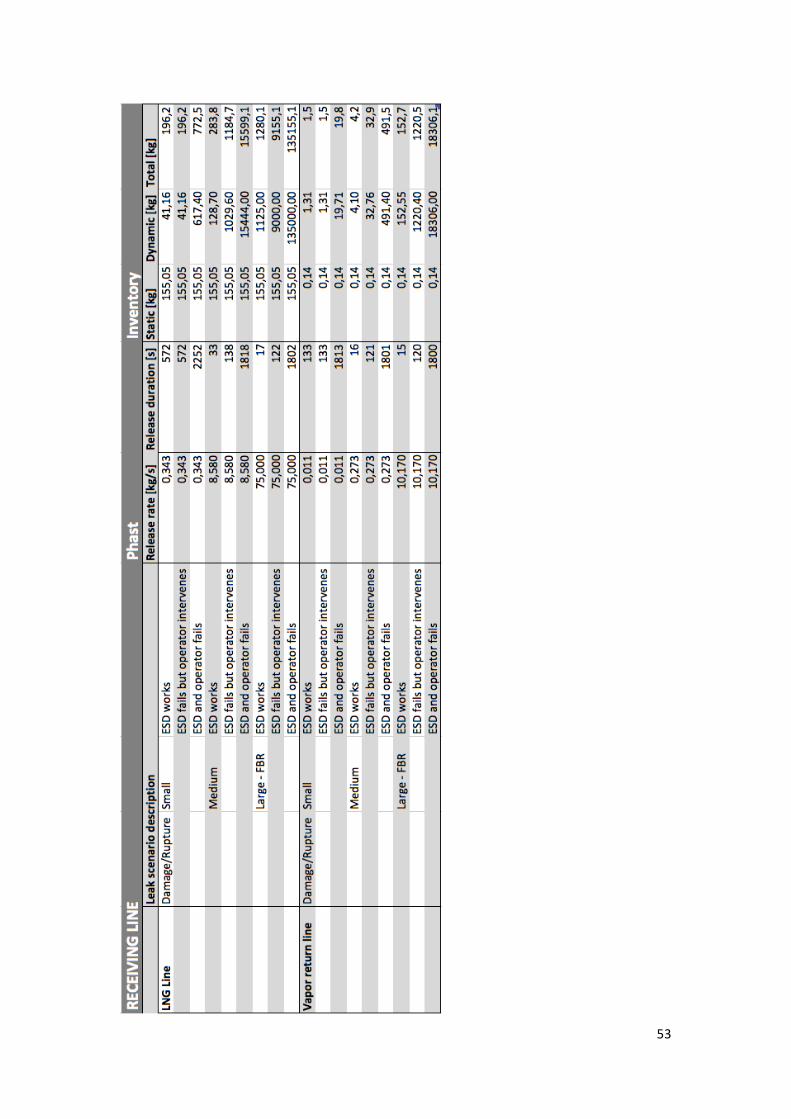
53
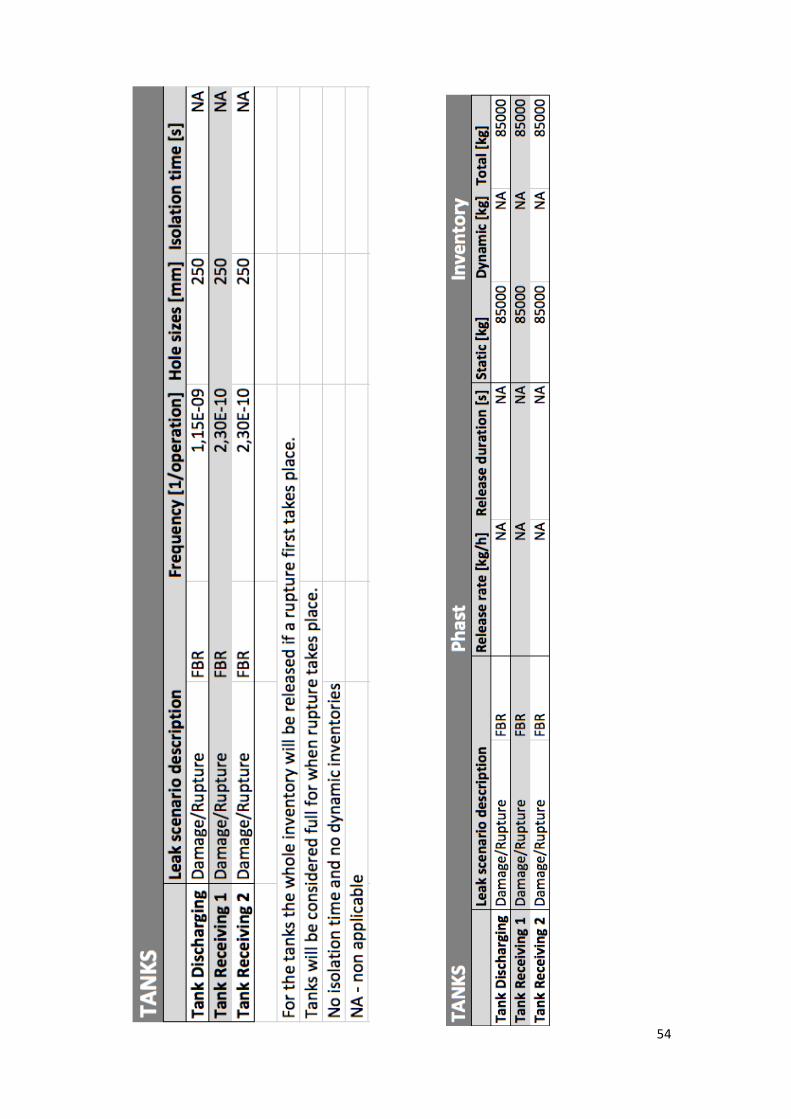
54
55
4.2.2.2 Inventory When it comes to the PHAST inputs, some values are identified and others, like the inventory, need to be calculated. The inventory is the total mass released [kg] in the event of any risk scenario. The inventory consists of static and dynamic inventory.
• Static inventory is the LNG/NG volume that a specific process section can hold. The volume depends on the dimensions of the hose, piping or tank within the defined process section.
• Dynamic inventory is what can be released if the system is not shut down immediately and LNG/NG is still “pushed” through the system. The volume size of the dynamic inventory also depends on dimensions, but it additionally depend on pump rate, pressure, time to stop (isolation time) etc.
For smaller leaks, the inventory is limited by the release rate during the time before ESD plus the content of the hose. For larger leaks, with a release rate higher than the pump flow, the inventory is assumed to be equal to 120% of the pump flow (see discharge rate below) multiplied by the time to ESD plus the hose content.
4.2.2.2.1 Inventory Calculations Static Inventory (SI)
𝑆𝐼 [𝑘𝑔] = 𝑉𝑜𝑙𝑢𝑚𝑒 𝑚! × 𝐷𝑒𝑛𝑠𝑖𝑡𝑦 𝑘𝑔/𝑚! = 𝜋4𝐷!𝐿 × 𝜌
Dynamic Inventory (DI)
𝐷𝐼 𝑘𝑔 = 𝑅𝑒𝑙𝑒𝑎𝑠𝑒 𝑅𝑎𝑡𝑒 𝑘𝑔/𝑠 × 𝐼𝑠𝑜𝑙𝑎𝑡𝑖𝑜𝑛 𝑇𝑖𝑚𝑒 𝑠 = 𝑅𝑅 × 𝐼𝑇 Total inventory (TI)
𝑇𝐼 𝑘𝑔 = 𝑆𝐼 𝑘𝑔 + 𝐷𝐼 𝑘𝑔 Release rate (RR) is a PHAST output. This means that DI and TI will not be fully calculated until the model has had a run through with SI data. RR is dependent on the hole size for damaged/ruptured scenarios, and is dependent on pump rate times the discharge rate for the leak in full bore rupture (FBR) scenario.
4.2.2.3 Discharge Rate The pump discharge rate should be set between 120-‐150% of the nominal pump flow, to account for the sudden pressure loss downstream and the subsequent reaction of a centrifugal pump upstream of the rupture. The lower value can be used if there is a single hose and the loading line is short and across level ground. The latter value is used, if there are several loading arms, the loading line is long and the tanks are elevated. In this base case, there is one hose and relatively short loading lines, and only a slight elevation in the process system. The most realistic and reasonable assumption is therefore estimated to be 120%.
56
4.2.2.4 Assumptions for PHAST Modeling • Parameters not mentioned are set at default value by the software, as used by DNV • Release type: constant rate • Release direction: horizontal • Dispersions parameter: spill will take place on water as surface • Pool vaporization: bund surface is water • Release height: 1m above ground • Calculation parameters: flash fire vulnerability is set to 1, all other set to 0 (i.e.
jet/pool/fire/explosion) • Dispersion height measured as 0.5m form the ground (see section 4.3.1: PHAST
results)
4.2.2.5 Raster Image -‐ STS Bunker Configuration The bunker arrangement and size that will be used for the “raster image” in PHAST will be based on the image provided in chapter 3, figure 6. Passing vessels and other vulnerable object will not be included in the image as these are site-‐specific details. The scope of this report has been to evaluate a generic LNG bunkering arrangement, and not to look at site-‐specific issues. Additionally, the main objective is to evaluate the risks for passengers onboard during bunkering. This means that the relevant consequence contours for this report, relate to how much of the LNG fueled vessel (receiving unit) is within the various risk criteria’s (i.e. 10-‐6 per bunkering operation), and not surrounding elements.
4.2.2.6 Assumptions for PHASTRisk Modeling • Wind rose is set to have equal distribution of winds in all directions. • The software differentiates between day and night time operations, but for this
study we will not differentiate between the two. • The dispersions are measured at 0.5m height from the ground. • Exported (output) data considers: flammable dispersion, for LFL faction, at 0.5m
effect height and at maximum concentration. • Modeling: To calculate the required outcome correctly, the flash fire vulnerability
should be set to 1, and all other vulnerabilities to flammable effects should be set to 0 (jet/pool fire/ explosions etc.) The event tree is modified in such a way that delayed ignitions will only result in flash fires and not explosions.
• Ignition mode is set to default. • Ignition probability is set to 100%. This means that there will always be fire when
there is a leak (highly conservative).
57
4.2.2.7 PHAST Working Procedure 1. Build the system tree according to the scenarios defined in the excel sheets
a. Folder for each process section and the event group scenarios b. Bottom events added as “vessel or pipe source”
2. Add the data for each source a. Material inputs: substance type (methane), temp value, pressure value and
a temporary input for inventory (the correct values will be provided after the first simulation)
b. Scenario inputs: leak type, outdoor (in or out), phase is automatically generates based on temp an pressure, hole diameters (S, M, L)
c. Location inputs: set elevation height 3. Run the model 4. Access the results and gather release rates for all hole sizes, the LNG and vapor
return line (total of six release rates) a. Maximum release rate for large leaks needs to be modified to what is
actually possible based on the inventory and discharge calculations, initial result from PHAST is not correct
b. Based on this information the inventory calculations can be completed 5. Add completed inventory calculations results and correct release rates to the PHAST
software 6. Re-‐run the model to produce correct dispersion values
a. Maximum dispersion values for the main LNG line for 1/2 LFL at 0.5m registration height can be seen in Appendix G
4.2.2.8 PHASTRisk Working Procedure 1. The system tree now needs to be converted to PHASTRisk
a. Make sure the data is transferred properly b. Add the respective frequencies to each scenario (part of the system tree
inputs) 2. Adding the image of the bunkering layout
a. Set the scales, dimensions and origin (also known as failure points, dots on the raster image). This is where the process section failure case scenarios are rooted
b. Register the coordinates for the different process sections: hose, discharging line, receiving line and tanks.
3. Add weather information according to specification. Weather was discussed in section 3.6.
4. Data/parameter changes a. Add metrological data (wind rose) b. Set to flash fire c. Day/night time distributions
5. Run model to obtain contours
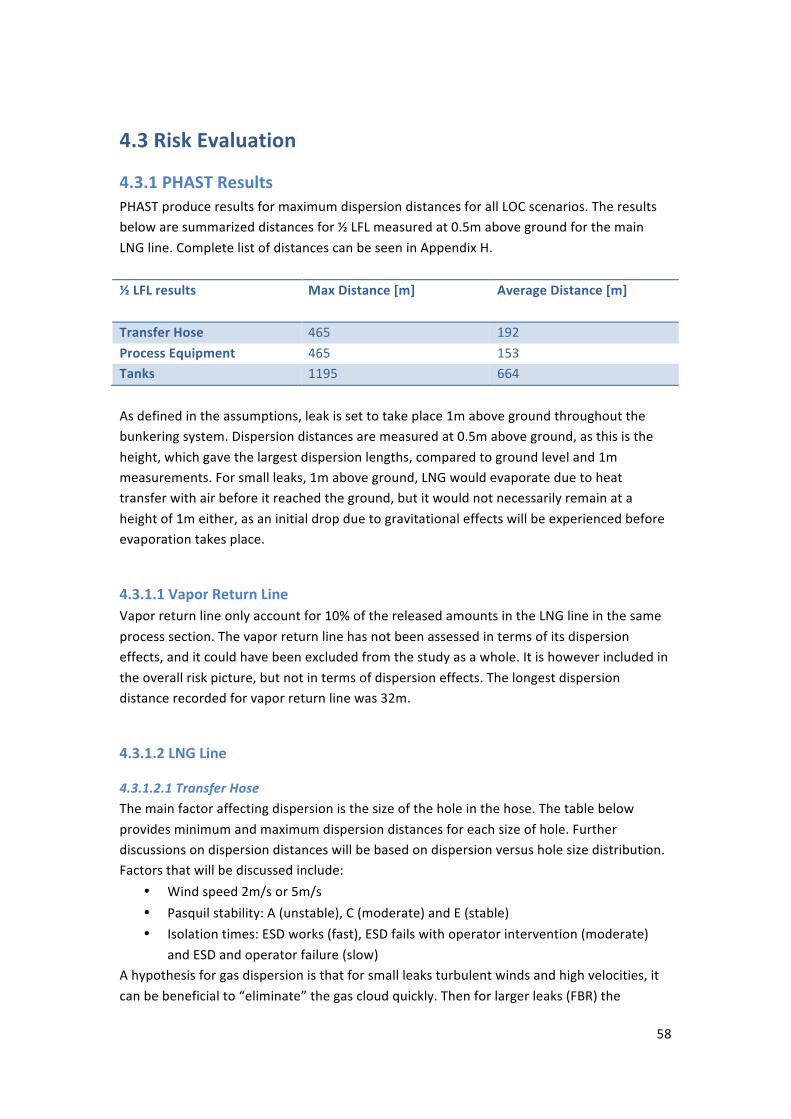
58
4.3 Risk Evaluation
4.3.1 PHAST Results PHAST produce results for maximum dispersion distances for all LOC scenarios. The results below are summarized distances for ½ LFL measured at 0.5m above ground for the main LNG line. Complete list of distances can be seen in Appendix H. ½ LFL results Max Distance [m]
Average Distance [m]
Transfer Hose 465 192 Process Equipment 465 153 Tanks 1195 664 As defined in the assumptions, leak is set to take place 1m above ground throughout the bunkering system. Dispersion distances are measured at 0.5m above ground, as this is the height, which gave the largest dispersion lengths, compared to ground level and 1m measurements. For small leaks, 1m above ground, LNG would evaporate due to heat transfer with air before it reached the ground, but it would not necessarily remain at a height of 1m either, as an initial drop due to gravitational effects will be experienced before evaporation takes place.
4.3.1.1 Vapor Return Line Vapor return line only account for 10% of the released amounts in the LNG line in the same process section. The vapor return line has not been assessed in terms of its dispersion effects, and it could have been excluded from the study as a whole. It is however included in the overall risk picture, but not in terms of dispersion effects. The longest dispersion distance recorded for vapor return line was 32m.
4.3.1.2 LNG Line
4.3.1.2.1 Transfer Hose The main factor affecting dispersion is the size of the hole in the hose. The table below provides minimum and maximum dispersion distances for each size of hole. Further discussions on dispersion distances will be based on dispersion versus hole size distribution. Factors that will be discussed include:
• Wind speed 2m/s or 5m/s • Pasquil stability: A (unstable), C (moderate) and E (stable) • Isolation times: ESD works (fast), ESD fails with operator intervention (moderate)
and ESD and operator failure (slow) A hypothesis for gas dispersion is that for small leaks turbulent winds and high velocities, it can be beneficial to “eliminate” the gas cloud quickly. Then for larger leaks (FBR) the
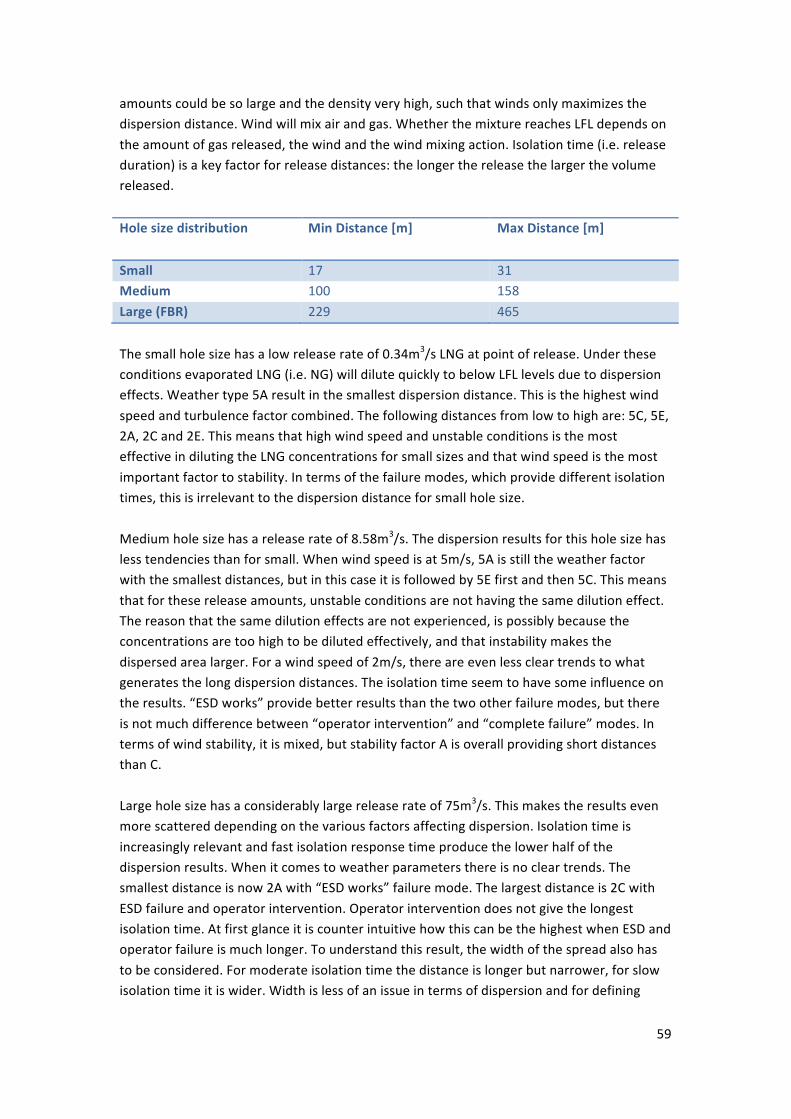
59
amounts could be so large and the density very high, such that winds only maximizes the dispersion distance. Wind will mix air and gas. Whether the mixture reaches LFL depends on the amount of gas released, the wind and the wind mixing action. Isolation time (i.e. release duration) is a key factor for release distances: the longer the release the larger the volume released. Hole size distribution Min Distance [m]
Max Distance [m]
Small 17 31 Medium 100 158 Large (FBR) 229 465 The small hole size has a low release rate of 0.34m3/s LNG at point of release. Under these conditions evaporated LNG (i.e. NG) will dilute quickly to below LFL levels due to dispersion effects. Weather type 5A result in the smallest dispersion distance. This is the highest wind speed and turbulence factor combined. The following distances from low to high are: 5C, 5E, 2A, 2C and 2E. This means that high wind speed and unstable conditions is the most effective in diluting the LNG concentrations for small sizes and that wind speed is the most important factor to stability. In terms of the failure modes, which provide different isolation times, this is irrelevant to the dispersion distance for small hole size. Medium hole size has a release rate of 8.58m3/s. The dispersion results for this hole size has less tendencies than for small. When wind speed is at 5m/s, 5A is still the weather factor with the smallest distances, but in this case it is followed by 5E first and then 5C. This means that for these release amounts, unstable conditions are not having the same dilution effect. The reason that the same dilution effects are not experienced, is possibly because the concentrations are too high to be diluted effectively, and that instability makes the dispersed area larger. For a wind speed of 2m/s, there are even less clear trends to what generates the long dispersion distances. The isolation time seem to have some influence on the results. “ESD works” provide better results than the two other failure modes, but there is not much difference between “operator intervention” and “complete failure” modes. In terms of wind stability, it is mixed, but stability factor A is overall providing short distances than C. Large hole size has a considerably large release rate of 75m3/s. This makes the results even more scattered depending on the various factors affecting dispersion. Isolation time is increasingly relevant and fast isolation response time produce the lower half of the dispersion results. When it comes to weather parameters there is no clear trends. The smallest distance is now 2A with “ESD works” failure mode. The largest distance is 2C with ESD failure and operator intervention. Operator intervention does not give the longest isolation time. At first glance it is counter intuitive how this can be the highest when ESD and operator failure is much longer. To understand this result, the width of the spread also has to be considered. For moderate isolation time the distance is longer but narrower, for slow isolation time it is wider. Width is less of an issue in terms of dispersion and for defining
60
zones, as the distances measured are considered as a radius and not as a distance in a specific direction. Large hole size give the same results for both rupture and disconnection.
4.3.1.2.2 Process Equipment Process equipment has the same hole sizes and release rates. Although there are more modeled scenarios for process equipment; discharging and receiving sides are equal and they both reflect the modeled scenarios for transfer hose rupture. This means that all hole size distributions are the same and is why the maximum release is the same in both cases as indicated in the first table in this section. The only reason why transfer hose has a higher average is because it involves more large leak scenarios, as it considers disconnection failures too. The dispersion results coincide with parts of the hypothesis. Isolation time is relevant but only for larger hole sizes. Weather induced turbulence was important in dispersion of smaller leaks, but provided varying results for larger leaks.
4.3.1.2.3 Tanks Tanks are not considered for isolation times but discussed in terms of weather parameters. Sequence of dispersion lengths (low to high): 5A, 2A, 5C, 2C, 5E and 2E. The dispersion distances are systematic with changes in weather. The released volume is the same in all scenarios, making weather the sensitivity to consider. Unstable weather and high wind speeds provide the shortest dispersion length of 266m. This means that turbulent weathers is more beneficial in a large release scenario, as it dilutes LNG with air quicker to a concentrations below 2.5% methane (½LFL).
4.3.1.3 Security Zones As discussed in section 3.5: Nautical Activity, security zone can be established based on the dispersion results. When assessing the system for dispersion results vapor line is excluded as it produces only a small fraction of the main LNG line dispersion ranges. Additionally, tank rupture is considered very unlikely and safety zones have not been based on tank rupture up to now. Process equipment and transfer hose have equal maximum dispersion results. Their averages differentiate, as transfer hose failures include additional cases of large leak failure scenarios through its disconnection failures. The average is most telling for the typical situations rather than considering the maximum, as it represents an extreme case with dispersion lengths more than twice the average. All scenarios have low likelihood of taking place and especially the large releases, which contribute to the longest dispersion distances. In the port of Rotterdam STS, safety distances for passing ships (security zones) were calculated based on LFL dispersion distances (not ½LFL). The STS case studied in this report had two bunker hoses and the leak scenario considered was simultaneous disconnection of both hoses. The study concluded with assuming 235m safety distance. The STS base case for this study has only one transfer hose, with this in mind the average dispersion distance results for transfers hose leakage would be a good security zone estimate. A definite security
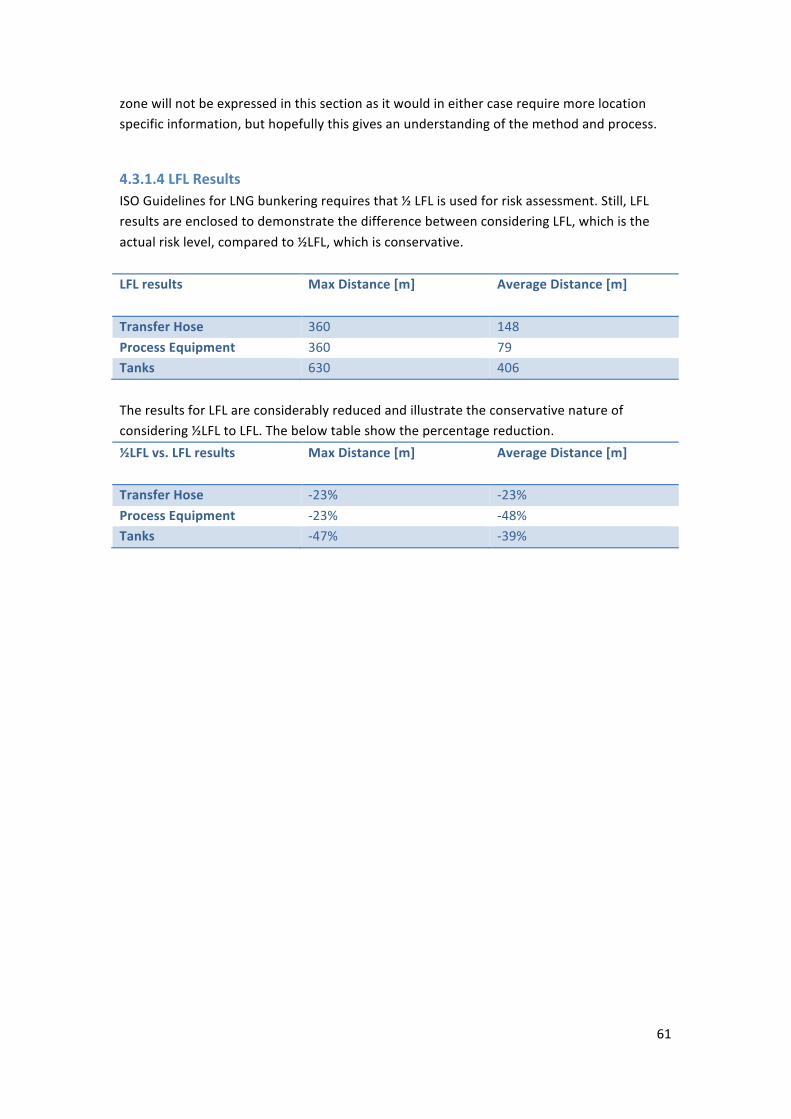
61
zone will not be expressed in this section as it would in either case require more location specific information, but hopefully this gives an understanding of the method and process.
4.3.1.4 LFL Results ISO Guidelines for LNG bunkering requires that ½ LFL is used for risk assessment. Still, LFL results are enclosed to demonstrate the difference between considering LFL, which is the actual risk level, compared to ½LFL, which is conservative. LFL results Max Distance [m]
Average Distance [m]
Transfer Hose 360 148 Process Equipment 360 79 Tanks 630 406 The results for LFL are considerably reduced and illustrate the conservative nature of considering ½LFL to LFL. The below table show the percentage reduction. ½LFL vs. LFL results Max Distance [m]
Average Distance [m]
Transfer Hose -‐23% -‐23% Process Equipment -‐23% -‐48% Tanks -‐47% -‐39%
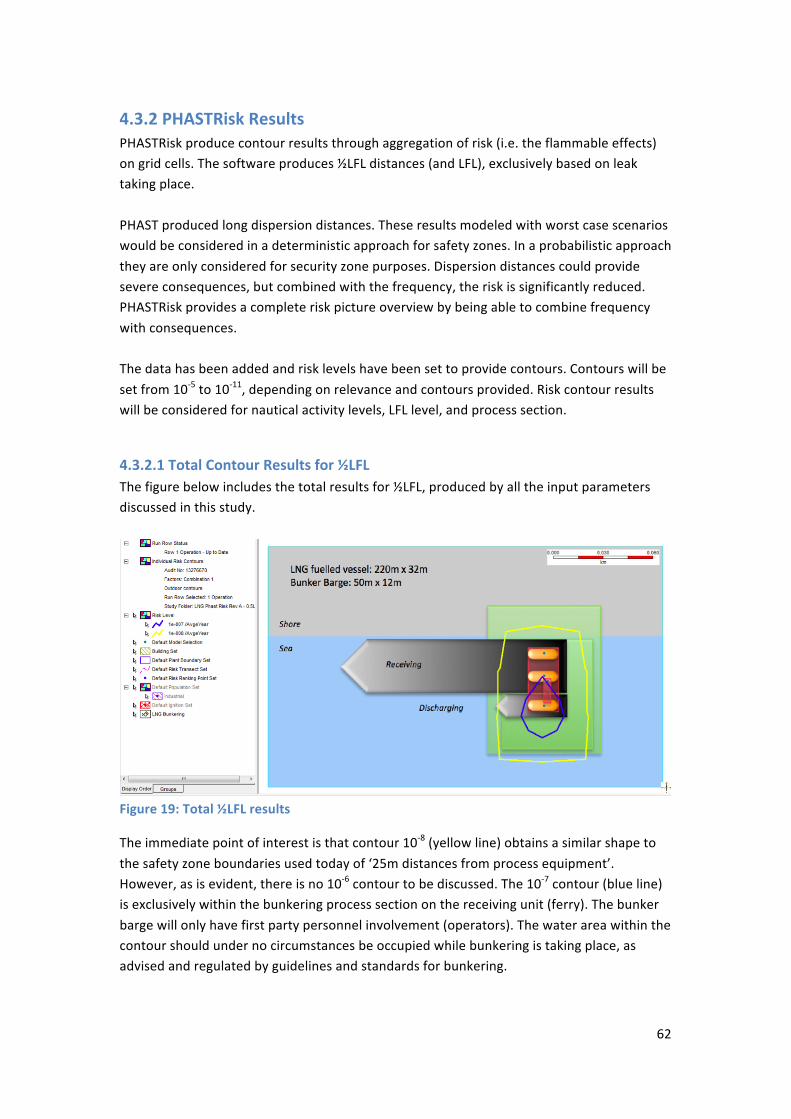
62
4.3.2 PHASTRisk Results PHASTRisk produce contour results through aggregation of risk (i.e. the flammable effects) on grid cells. The software produces ½LFL distances (and LFL), exclusively based on leak taking place. PHAST produced long dispersion distances. These results modeled with worst case scenarios would be considered in a deterministic approach for safety zones. In a probabilistic approach they are only considered for security zone purposes. Dispersion distances could provide severe consequences, but combined with the frequency, the risk is significantly reduced. PHASTRisk provides a complete risk picture overview by being able to combine frequency with consequences. The data has been added and risk levels have been set to provide contours. Contours will be set from 10-‐5 to 10-‐11, depending on relevance and contours provided. Risk contour results will be considered for nautical activity levels, LFL level, and process section.
4.3.2.1 Total Contour Results for ½LFL The figure below includes the total results for ½LFL, produced by all the input parameters discussed in this study.
Figure 19: Total ½LFL results
The immediate point of interest is that contour 10-‐8 (yellow line) obtains a similar shape to the safety zone boundaries used today of ‘25m distances from process equipment’. However, as is evident, there is no 10-‐6 contour to be discussed. The 10-‐7 contour (blue line) is exclusively within the bunkering process section on the receiving unit (ferry). The bunker barge will only have first party personnel involvement (operators). The water area within the contour should under no circumstances be occupied while bunkering is taking place, as advised and regulated by guidelines and standards for bunkering.
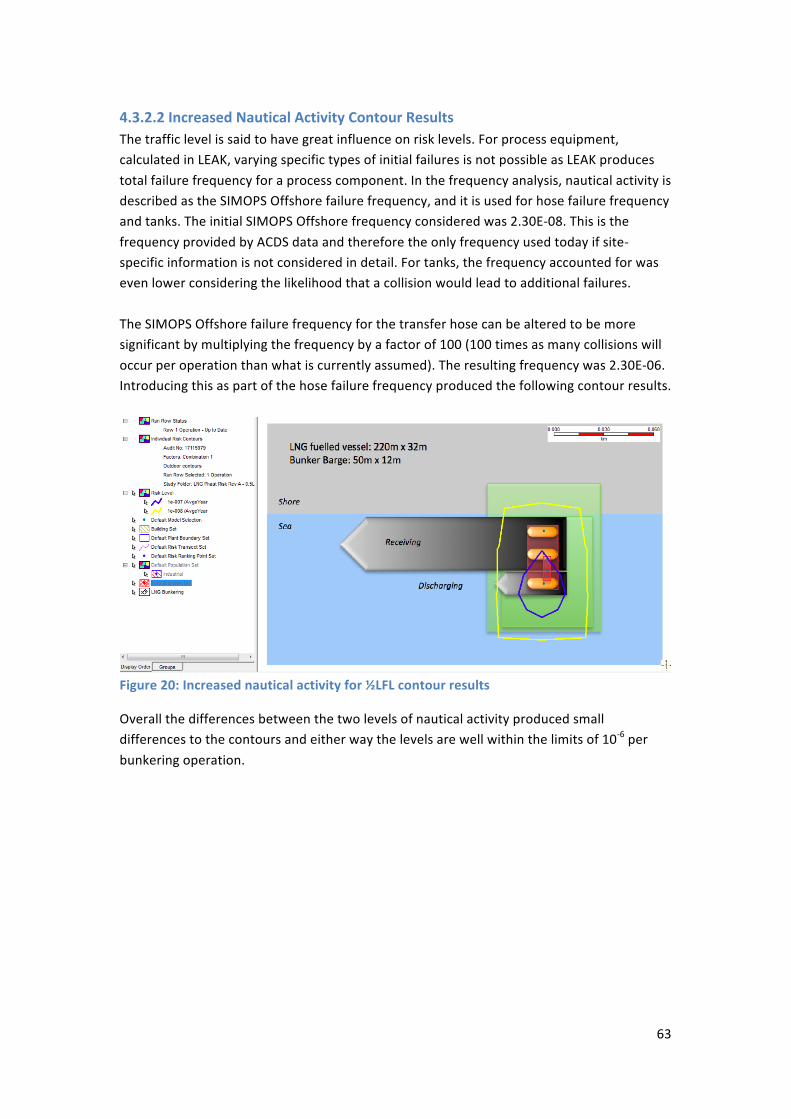
63
4.3.2.2 Increased Nautical Activity Contour Results The traffic level is said to have great influence on risk levels. For process equipment, calculated in LEAK, varying specific types of initial failures is not possible as LEAK produces total failure frequency for a process component. In the frequency analysis, nautical activity is described as the SIMOPS Offshore failure frequency, and it is used for hose failure frequency and tanks. The initial SIMOPS Offshore frequency considered was 2.30E-‐08. This is the frequency provided by ACDS data and therefore the only frequency used today if site-‐specific information is not considered in detail. For tanks, the frequency accounted for was even lower considering the likelihood that a collision would lead to additional failures. The SIMOPS Offshore failure frequency for the transfer hose can be altered to be more significant by multiplying the frequency by a factor of 100 (100 times as many collisions will occur per operation than what is currently assumed). The resulting frequency was 2.30E-‐06. Introducing this as part of the hose failure frequency produced the following contour results.
Figure 20: Increased nautical activity for ½LFL contour results
Overall the differences between the two levels of nautical activity produced small differences to the contours and either way the levels are well within the limits of 10-‐6 per bunkering operation.
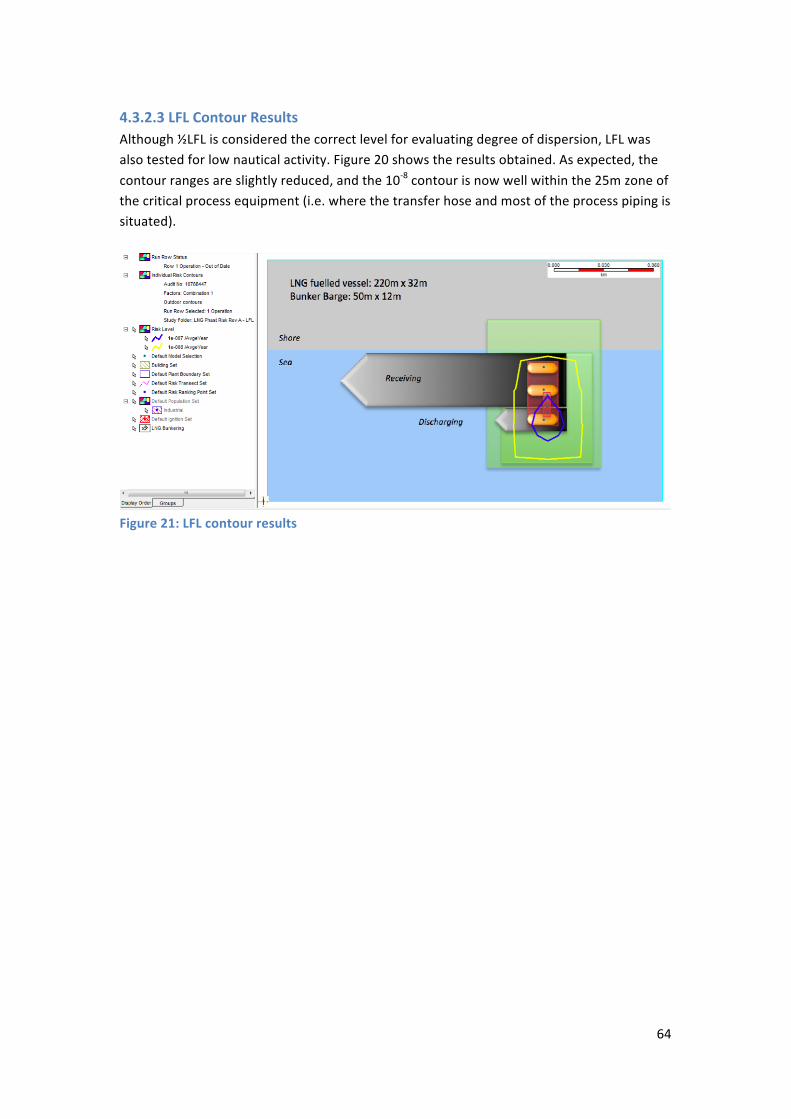
64
4.3.2.3 LFL Contour Results Although ½LFL is considered the correct level for evaluating degree of dispersion, LFL was also tested for low nautical activity. Figure 20 shows the results obtained. As expected, the contour ranges are slightly reduced, and the 10-‐8 contour is now well within the 25m zone of the critical process equipment (i.e. where the transfer hose and most of the process piping is situated).
Figure 21: LFL contour results
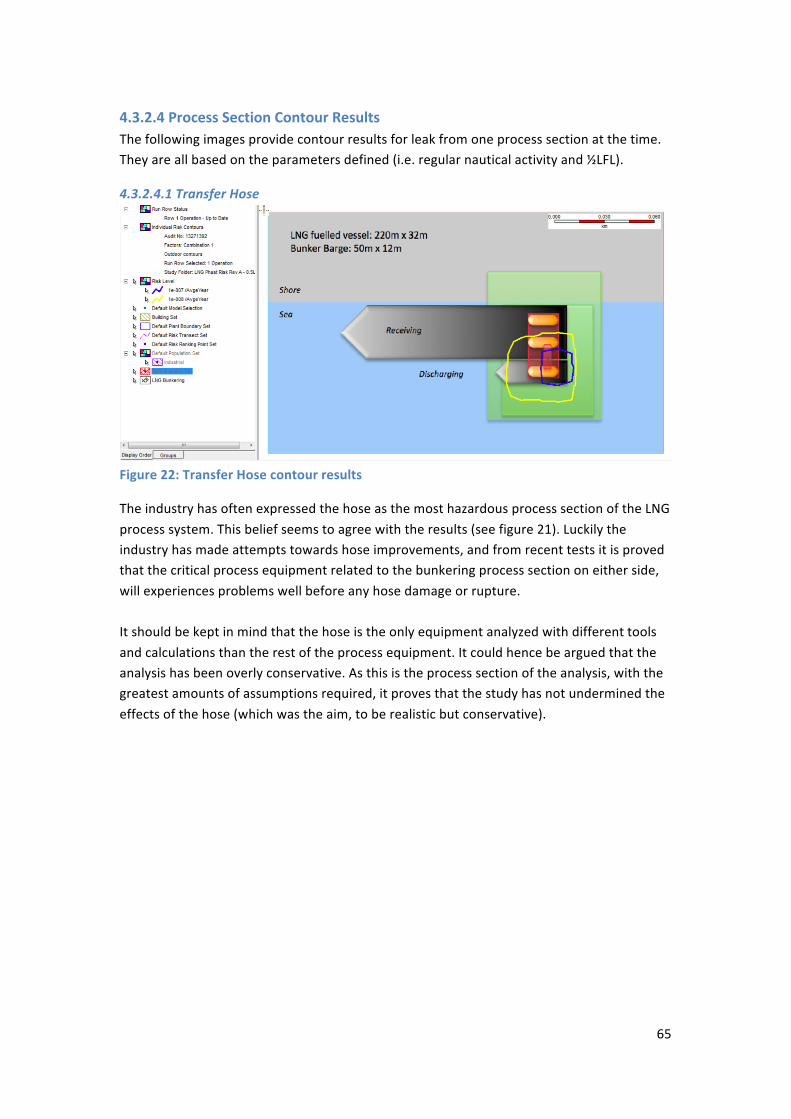
65
4.3.2.4 Process Section Contour Results The following images provide contour results for leak from one process section at the time. They are all based on the parameters defined (i.e. regular nautical activity and ½LFL).
4.3.2.4.1 Transfer Hose
Figure 22: Transfer Hose contour results
The industry has often expressed the hose as the most hazardous process section of the LNG process system. This belief seems to agree with the results (see figure 21). Luckily the industry has made attempts towards hose improvements, and from recent tests it is proved that the critical process equipment related to the bunkering process section on either side, will experiences problems well before any hose damage or rupture. It should be kept in mind that the hose is the only equipment analyzed with different tools and calculations than the rest of the process equipment. It could hence be argued that the analysis has been overly conservative. As this is the process section of the analysis, with the greatest amounts of assumptions required, it proves that the study has not undermined the effects of the hose (which was the aim, to be realistic but conservative).
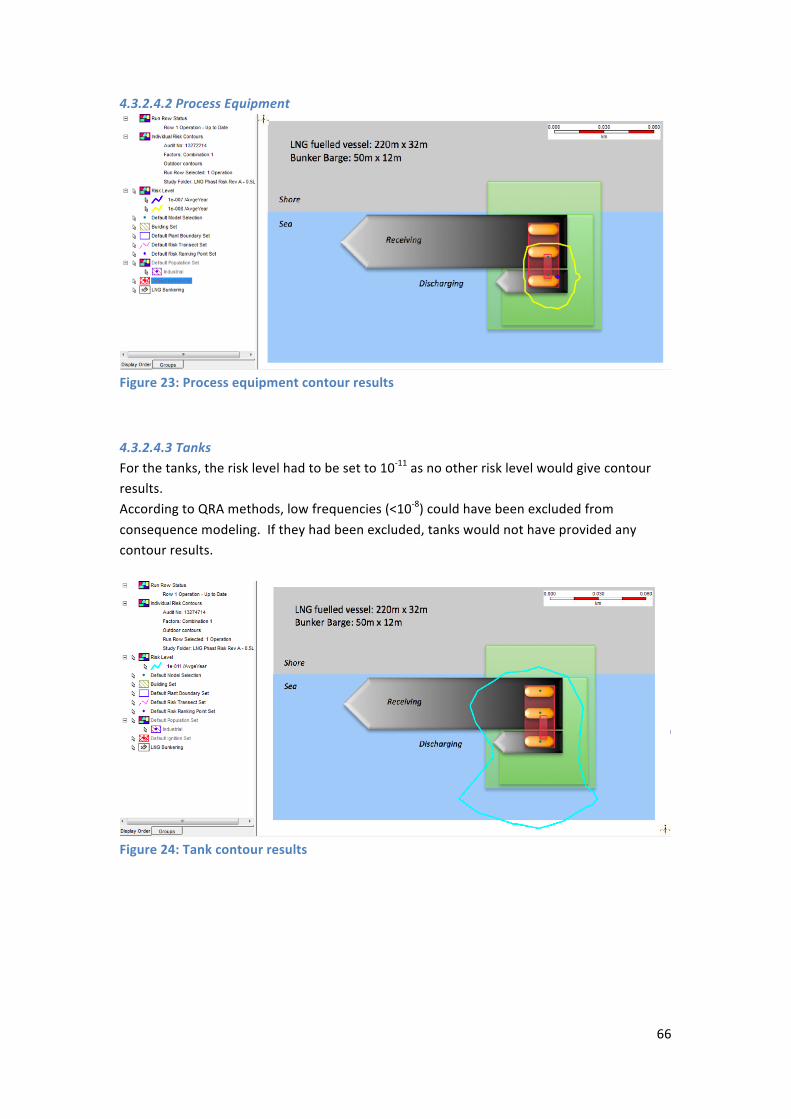
66
4.3.2.4.2 Process Equipment
Figure 23: Process equipment contour results
4.3.2.4.3 Tanks For the tanks, the risk level had to be set to 10-‐11 as no other risk level would give contour results. According to QRA methods, low frequencies (<10-‐8) could have been excluded from consequence modeling. If they had been excluded, tanks would not have provided any contour results.
Figure 24: Tank contour results
67
4.3.3 Technology Advancements System specifics in this study have been conservative and especially when considering that technical advancements will take place in the future. Frequencies used today are based on historical data, which of course also reflects failures in earlier versions of the equipment. Several studies characterize the hose or loading arm as the critical process section in bunkering processes. Naturally, as it is the interface between the two units and it is very exposed compared to the rest of the process equipment. The perceived fears for the bunker hose has caused the industry to focus their efforts on making the most endurable hoses with specific qualities such as strength and flexibility, and the ability to withstand cryogenic temperatures. The structure, material and design chosen are today so advanced that the industry considers the hoses extremely reliable. One of the main strengths of the hose is ERC (breakaway coupling). ERC is so effective, and the hose structure is so much stronger, to the extent that any tension will result in ERC activation rather than rupture. ERC would have to fail, which is actually yet to be seen. A triggered ERC in any event is a “safe” reaction. To demonstrate the high level of security of a cryogenic transfer hose, Gasnor reports on site experiences using cryogenic transfer hoses has been included.
4.3.3.1 Gasnor Experiences Hose failure in flexible loading and unloading hoses69 In the period from May 2003 to December 2010, approximately 42,000 loading, unloading and bunkering operations have been carried out without detection or indication of any hose failures. Hose rupture is often the dimensioning case when accounting for risk assessments related to the location of LNG terminals and in relation to licenses to carry out loading and unloading operations with LNG. On the basis of this Gasnor AS has completed a review of these types of operations. Some of the results are presented here:
• No hose failure recorded • No drip leaks detected • Minor gas leaks / "sweating" from snake recorded. (Total five cases, mainly between
onshore facilities and vessels). • Leaks from the couplings are registered:
o Production Error: spray leak from the hole in the coupling o Drip leakage due to contraction when cooling takes place. By retighten the
connection the leak stopped. o Leakage in the breakaway coupling (twice).

68
Operation and maintenance programmes includes daily inspections of the hose and transmission preparations (purging and inerting). In the study period, Gasnor has replaced approximately 20 hoses due to sweatting. Additionaly some hoses have been replaced due to visual wear and tear, without any indication of leak. The report concluded with; “review shows there is not registered any hose failure due to normal operation. Nor revealed situations where a hose rupture have been imminent. Inspection, maintenance and choice of high quality hoses will continue to be important to prevent hose failure in the future.”
69
5 Conclusion The environmental and economical advantages of using LNG as a marine fuel are already recognized. The industry has responded and are now preparing for fuel conversion, with the ferry market as the biggest consumer. High risks are assumed when it comes to vulnerable objects (third parties in the vicinity of the operation) during bunkering. Ferries have thus far been instructed not to allow passenger presence during bunkering. The functionality and strengths of LNG are quickly reduced and this restriction in particular is proving problematic for ferry companies, which have passengers onboard at all times. In response to the perceived risks associated with LNG bunkering operations, this study has focused on outlining the risks, and quantifying them to provide a detailed risk picture. The purpose of this study was to create probabilistic safety distances for LNG bunkering. The justification in doing this was to evaluate the level of safety for passengers onboard LNG fueled vessels during bunkering. The evaluation has been based on achieving the accepted ISO standard requirement of a probability of flammable gas outside the safety zone being less than 10-‐6 per bunkering operation as a criterion. Based on the results provided by PHASTRisk in section 4.3: Risk Evaluation, it clearly demonstrates that passenger safety can be maintained during bunkering operations. The results of this study conclude that there is no unreasonable risk associated with allowing passenger presence during bunkering. Passenger safety issues should as such not limit the application of LNG as fuel for ferries. The areas onboard withed vessels are at the most inside a 10-‐8 risk level. This is the lowest level of risk considered by any industry. The only expense and concern of the industry at this moment should consequently be on economically establishing sustainable infrastructure for small-‐scale bunkering. The assessment made here is generic, and even though it could be adjusted for individual bunkering cases, it is not expected that significant variations in risk contours will be experienced from typical system variations to this base case. The variations in results have more scope for site-‐specific issues like weather and traffic density in the port area. Weather cannot be controlled, but should be evaluated before choosing a specific bunkering location. Based on the PHAST dispersion results, unstable weather and high winds resulted in shorter distances for all hole sizes. The remaining element left to consider is nautical activity and the SIMOPS failures high activity introduce. There are several zones that can be established to control the risk of this category, which means that if exclusion zones or security zones are properly defined then safety zones for passengers will not be an issue.
70
6 Treatment of Residual Risk For studies of risk there is large number of sensitivities that can be analyzed, and further studies should be made. This study has focused on the sensitivities, which are believed to have a significant effect with respect to calculations of the safety zone. This includes weather sensitivities, hole size distributions and some variations in the SIMOPS Offshore frequency to account for varying nautical activity. As discussed, risks associated with LNG bunkering can be divided into risks inherent to the process equipment (system specific) and risks specific to the bunkering location (site-‐specific). The site-‐specific sensitivities can have an affect on the risk level prior, such as port traffic and some have an effect when an accident involving a leak has taken place, like weather. Weather sensitivities are considered in the study and to some extent port traffic, but any safety zone implemented needs to be carefully evaluated against specific site details. LNG bunkering systems can have some variations in design, but the basic principles will for practical purposes be the same. Several of the process parameters and functions are set by the physics of LNG and the guidelines and standards. The system specific solutions that were not analyzed for sensitivity in this study were set to be the most conservative to avoid underestimating the risk. In this study a single loading hose was assumed, instead of two or three that could be used in shore to ship applications. The reason for this is that one loading hose is more relevant for the costal applications that have been the main focus of this study. Regulatory requirements limit extensive system variations, and set a number of standard that must be met even before the security zone comes into question. If regulatory requirements are followed this would mean that risk contours would not be larger than the presented even if there were changes to the system or operating parameters. Following, is a discussion on sensitivities that could be considered in future risk assessments for LNG bunkering.
6.1 Operating Conditions In this study, constant cargo temperature was assumed for both the main LNG line and the vapor return line. This means that the discharging unit (the bunker barge) has to deliver the same cargo temperatures for every operation. Realistically, this is not the case, and cargo temperatures are expected to vary between -‐140 to -‐162oC on arrival to the bunkering site. Temperature variations could also lead to variations in density and pressure, which will have an effect on the transfer operation and how the varying density will influence the development of the gas leak. Sensitivity analysis on varying temperatures could have been performed, but was considered outside the scope of this study. This study has chosen the temperature assumption that is the most conservative, which are the coldest temperatures and consequently the highest density. This makes the evaporation slowest in the situation of an LNG release.
71
Constant pressure throughout the piping system is not a reality during bunkering operations, as the flowing system will see the pressure drop through its equipment and pipe configurations. Pressure changes and pressure variations could have been calculated using Bernoulli. This would have required more specific data on the system such as; process equipment, specific lengths of pipes, piping configurations, etc., with the associated friction factors within the pipes and hoses. Including this in the calculations would have made the model more advanced. The highest allowed pressure was assumed in all parts of the system for the purpose of determining probabilistic safety zones. It would have given lower calculated consequences of a leak than the outcome of this study and the recommendations made. Another DNV report did study the effect of pressure variations, and this was the concluding remark: “When staying in a reasonable range of pressure around the base case, the operating pressure has little influence on the final result. The variation of operating pressure has a greater impact at low pressure (i.e. 1-‐2bar(g)), than for higher pressures. Lower pressures usually result in shorter safety distances, except for large leak in windy weather conditions.”70
6.2 Hose Dimensions Transfer hoses are produced with varying dimensions, and both length and diameter could have been analyzed as sensitivity. Another DNV study looked at the effect of varying dimensions.71 Overall it proved that hose length had little effect, while hose diameter was significant in the case of full bore rupture. The variation in hose length mainly impacts the static inventory that would be released as a consequence of a hose rupture.
6.3 Emergency Release Couplers In this report we assumed that the hoses would be equipped with breakaway couplings (or ERC). This is recommended and seems already to have become a standard practice in the industry. Breakaway couplings will ensure that the weak point of the hose is at the coupling. The cryogenic transfer hose has a breaking strength, which will exceed the strength of the breakaway coupling leading to activation of the emergency function of the breakaway coupling. When activated, the breakaway coupling will close in less than a second by the mechanical closing system (valve). The quick closure significantly reduces any released volumes. Based on bunkering guidelines and recommendation from authorities, which stress the use of ERC, it has been assumed that this is present and the use is best practice, but nevertheless sensitivities could also have been performed.
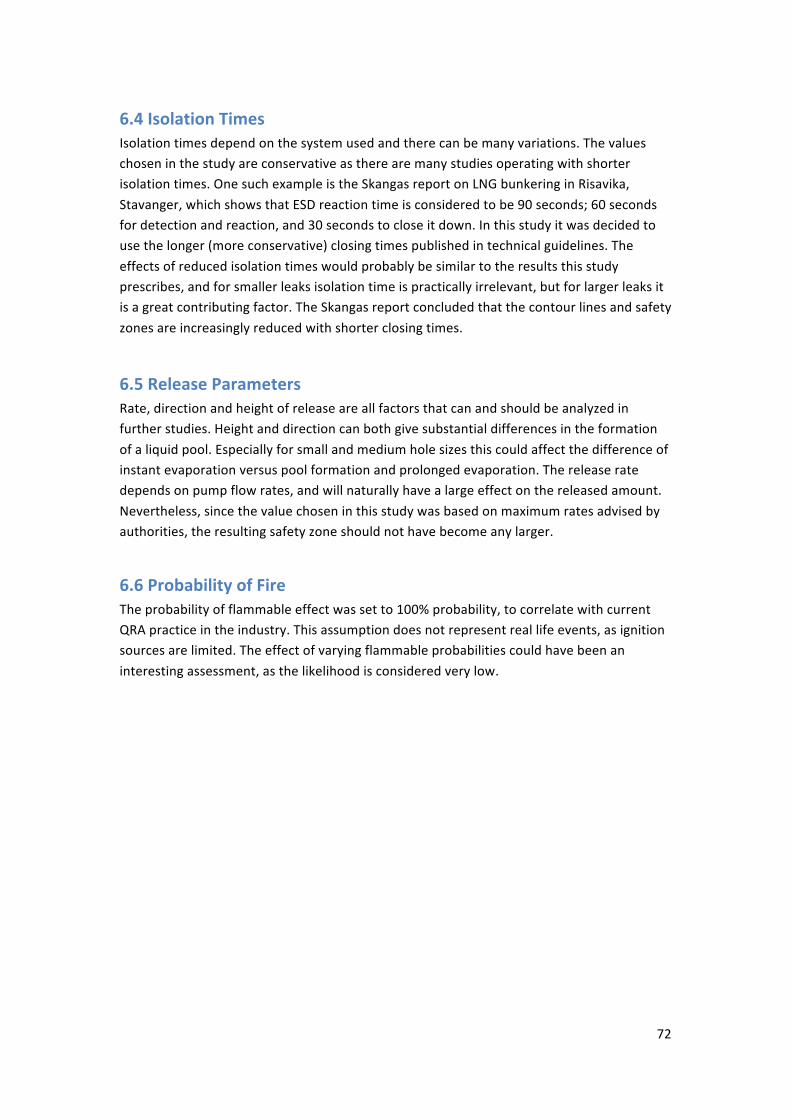
72
6.4 Isolation Times Isolation times depend on the system used and there can be many variations. The values chosen in the study are conservative as there are many studies operating with shorter isolation times. One such example is the Skangas report on LNG bunkering in Risavika, Stavanger, which shows that ESD reaction time is considered to be 90 seconds; 60 seconds for detection and reaction, and 30 seconds to close it down. In this study it was decided to use the longer (more conservative) closing times published in technical guidelines. The effects of reduced isolation times would probably be similar to the results this study prescribes, and for smaller leaks isolation time is practically irrelevant, but for larger leaks it is a great contributing factor. The Skangas report concluded that the contour lines and safety zones are increasingly reduced with shorter closing times.
6.5 Release Parameters Rate, direction and height of release are all factors that can and should be analyzed in further studies. Height and direction can both give substantial differences in the formation of a liquid pool. Especially for small and medium hole sizes this could affect the difference of instant evaporation versus pool formation and prolonged evaporation. The release rate depends on pump flow rates, and will naturally have a large effect on the released amount. Nevertheless, since the value chosen in this study was based on maximum rates advised by authorities, the resulting safety zone should not have become any larger.
6.6 Probability of Fire The probability of flammable effect was set to 100% probability, to correlate with current QRA practice in the industry. This assumption does not represent real life events, as ignition sources are limited. The effect of varying flammable probabilities could have been an interesting assessment, as the likelihood is considered very low.
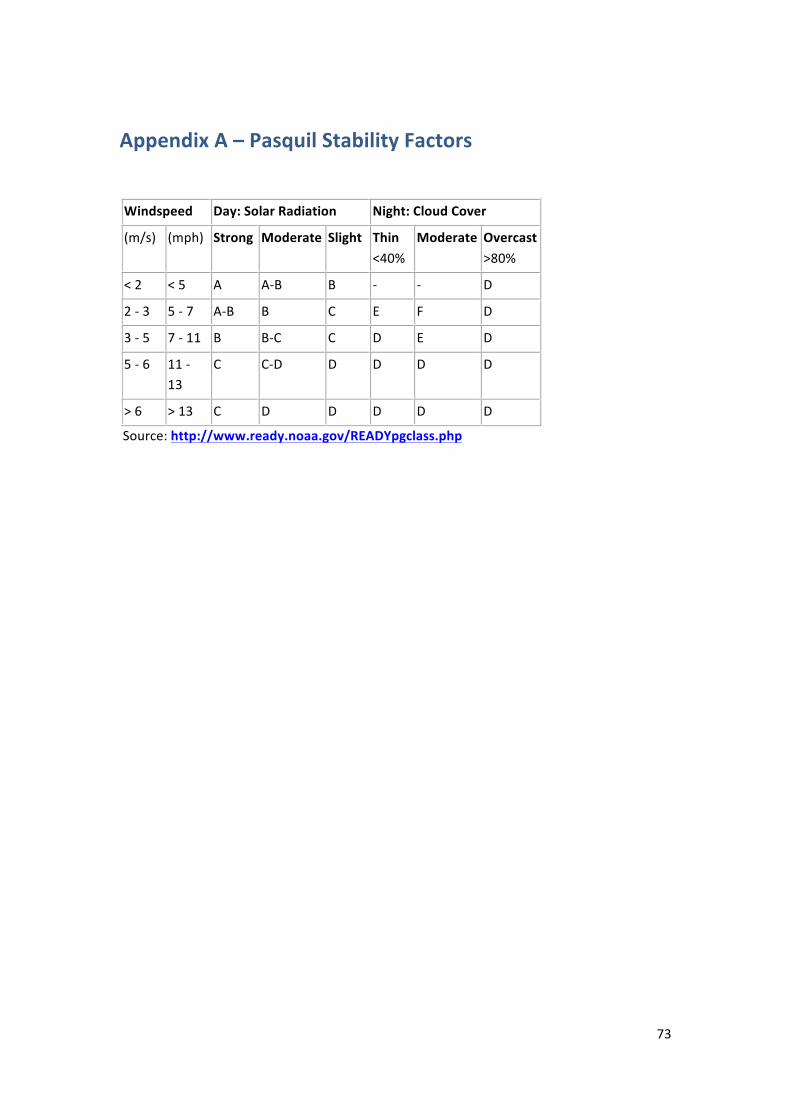
73
Appendix A – Pasquil Stability Factors Windspeed Day: Solar Radiation Night: Cloud Cover
(m/s) (mph) Strong Moderate Slight Thin <40%
Moderate Overcast >80%
< 2 < 5 A A-‐B B -‐ -‐ D
2 -‐ 3 5 -‐ 7 A-‐B B C E F D
3 -‐ 5 7 -‐ 11 B B-‐C C D E D
5 -‐ 6 11 -‐ 13
C C-‐D D D D D
> 6 > 13 C D D D D D
Source: http://www.ready.noaa.gov/READYpgclass.php
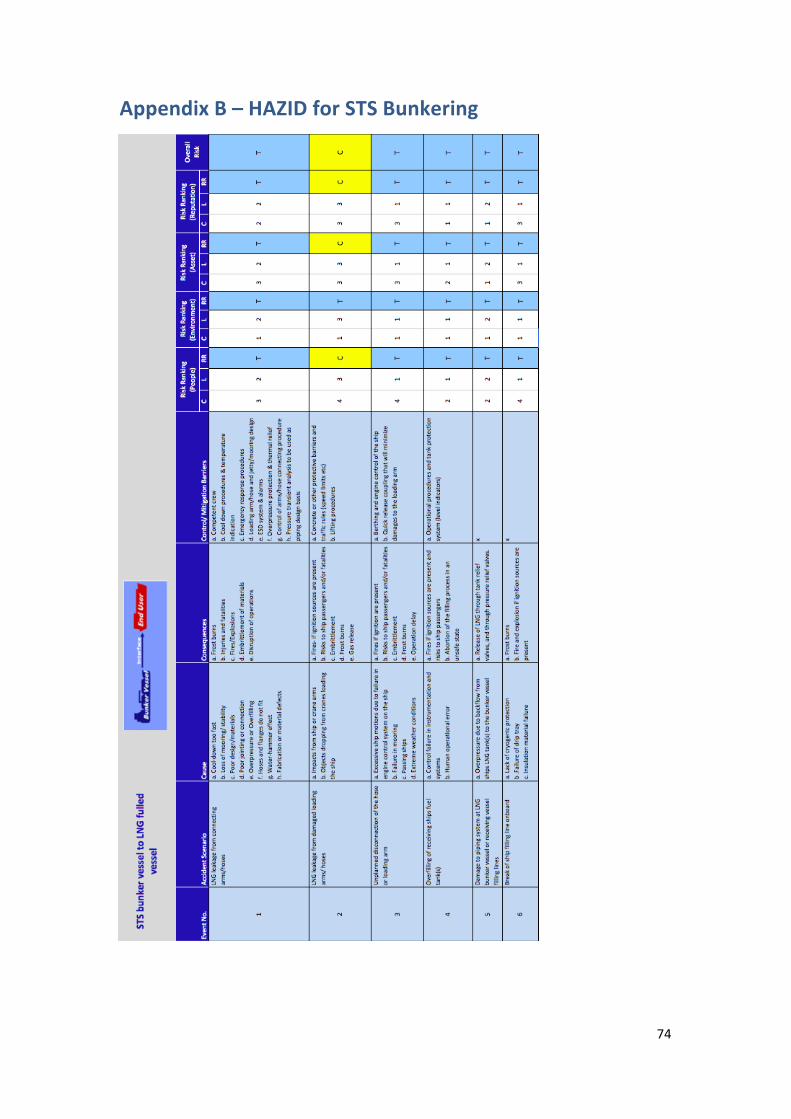
74
Appendix B – HAZID for STS Bunkering
75
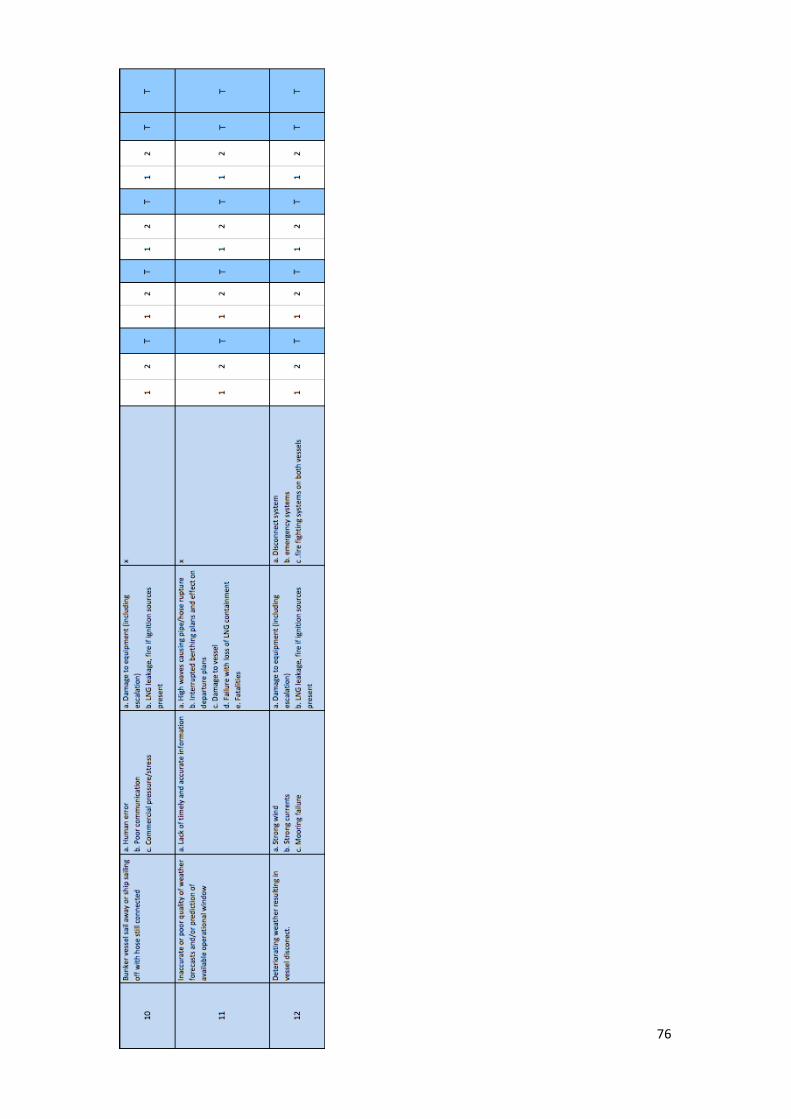
76
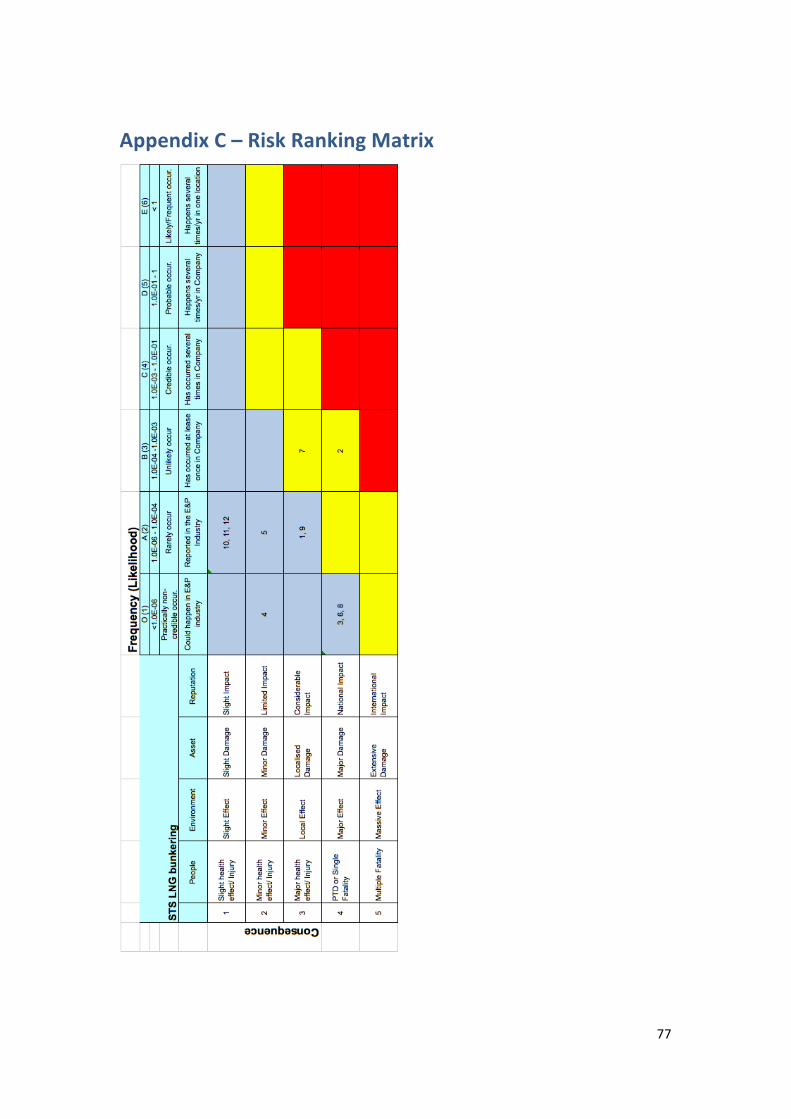
77
Appendix C – Risk Ranking Matrix
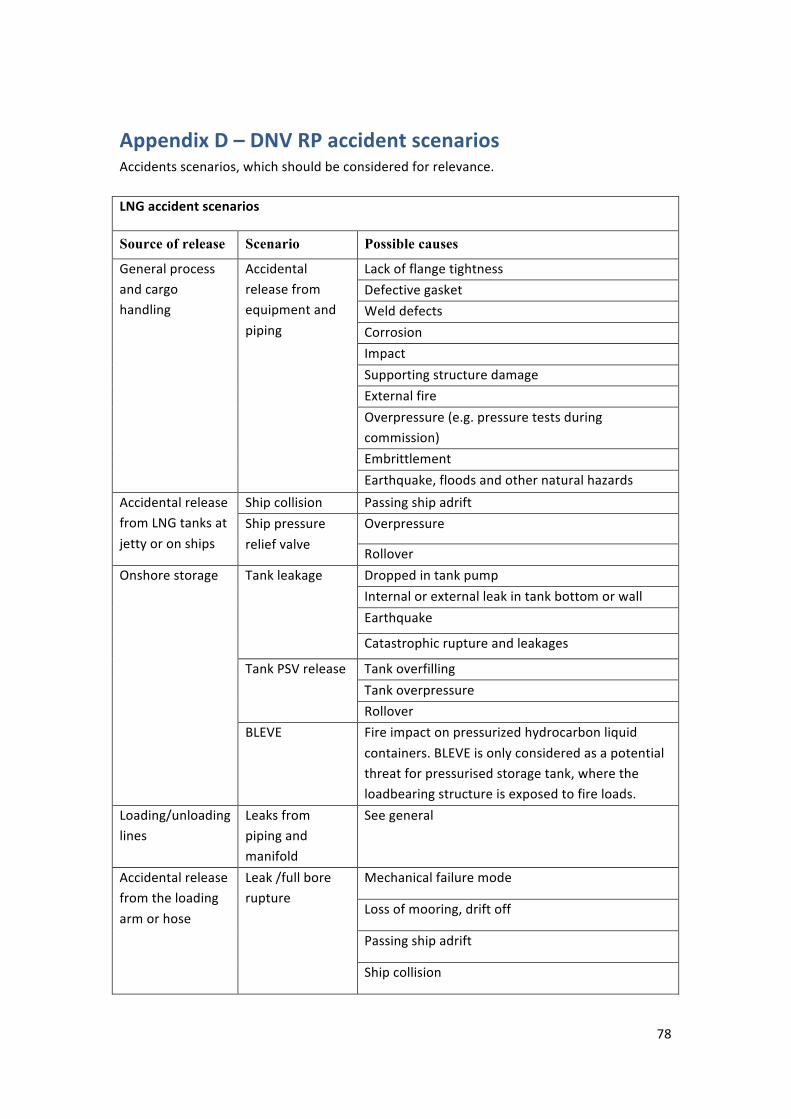
78
Appendix D – DNV RP accident scenarios Accidents scenarios, which should be considered for relevance. LNG accident scenarios
Source of release Scenario Possible causes
General process and cargo handling
Accidental release from equipment and piping
Lack of flange tightness Defective gasket Weld defects Corrosion Impact Supporting structure damage External fire Overpressure (e.g. pressure tests during commission) Embrittlement Earthquake, floods and other natural hazards
Accidental release from LNG tanks at jetty or on ships
Ship collision Passing ship adrift Ship pressure relief valve
Overpressure
Rollover Onshore storage Tank leakage Dropped in tank pump
Internal or external leak in tank bottom or wall Earthquake
Catastrophic rupture and leakages
Tank PSV release Tank overfilling Tank overpressure Rollover
BLEVE Fire impact on pressurized hydrocarbon liquid containers. BLEVE is only considered as a potential threat for pressurised storage tank, where the loadbearing structure is exposed to fire loads.
Loading/unloading lines
Leaks from piping and manifold
See general
Accidental release from the loading arm or hose
Leak /full bore rupture
Mechanical failure mode
Loss of mooring, drift off
Passing ship adrift
Ship collision
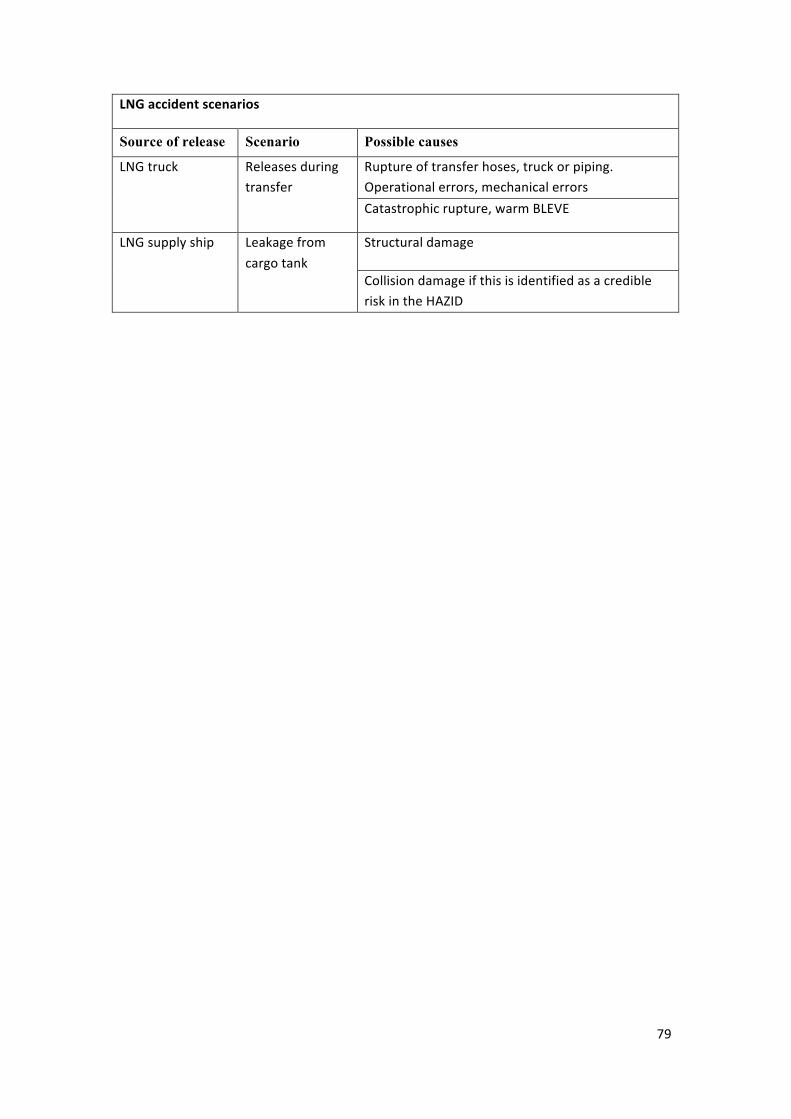
79
LNG accident scenarios
Source of release Scenario Possible causes
LNG truck Releases during transfer
Rupture of transfer hoses, truck or piping. Operational errors, mechanical errors Catastrophic rupture, warm BLEVE
LNG supply ship Leakage from cargo tank
Structural damage
Collision damage if this is identified as a credible risk in the HAZID
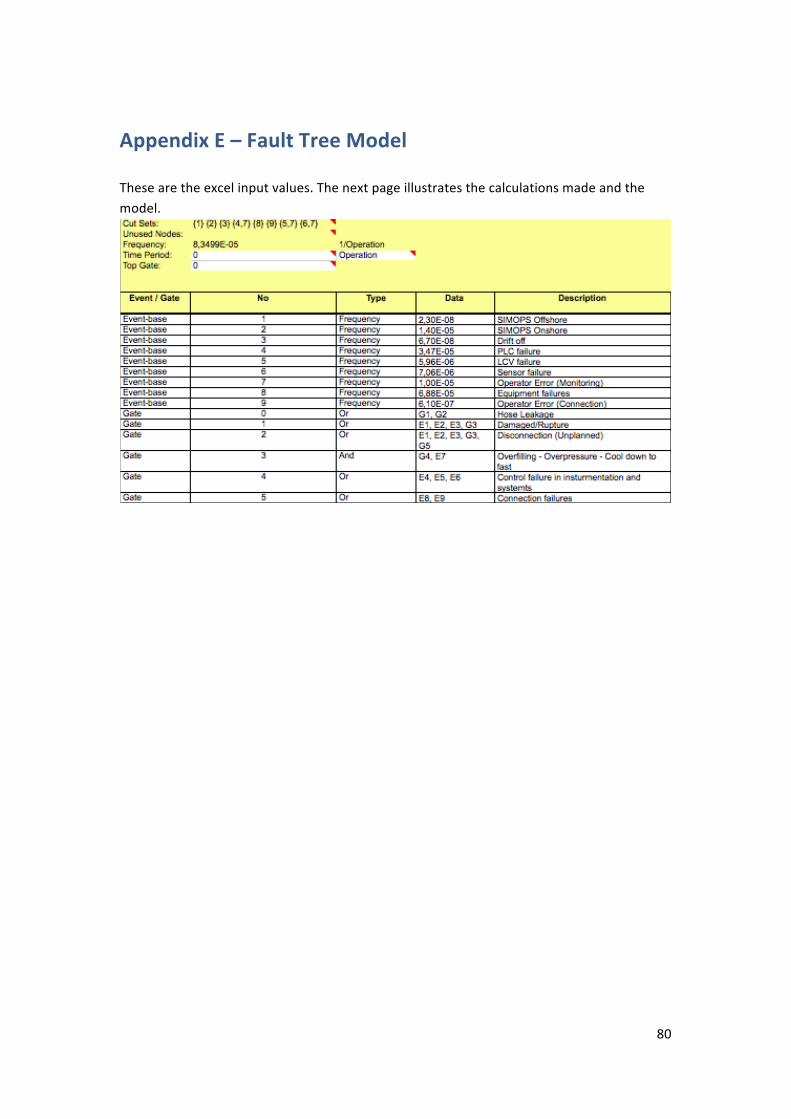
80
Appendix E – Fault Tree Model These are the excel input values. The next page illustrates the calculations made and the model.
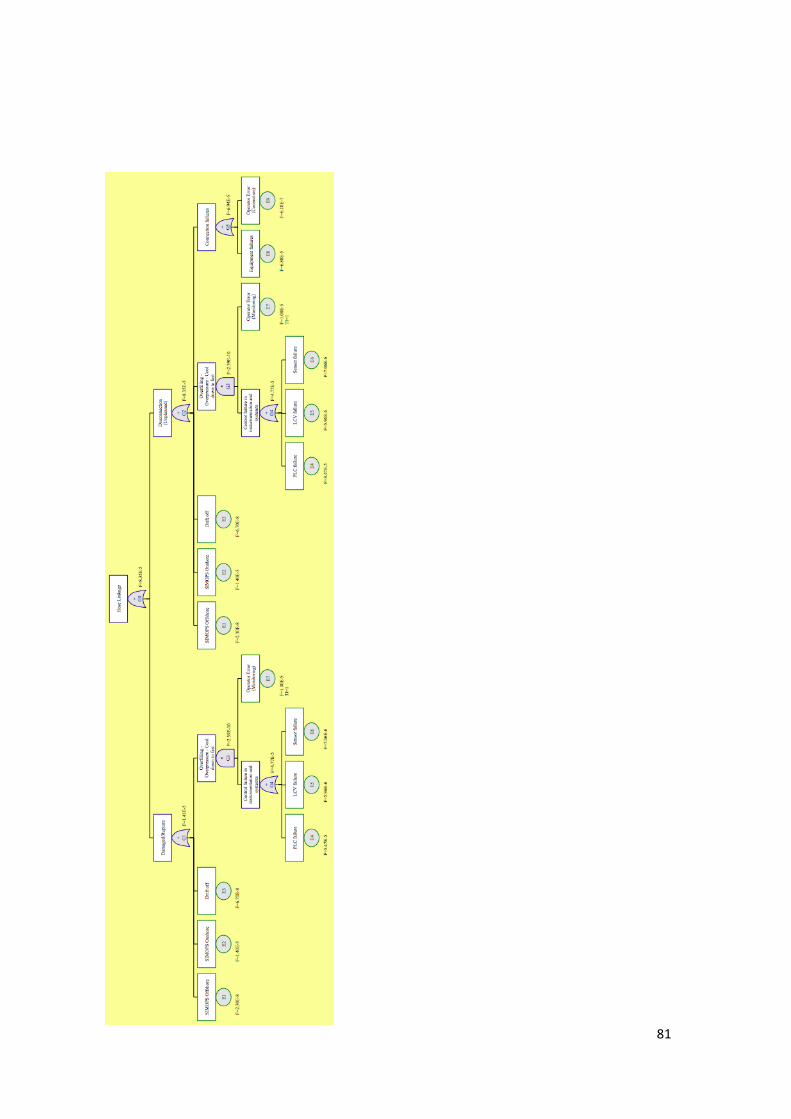
81

82
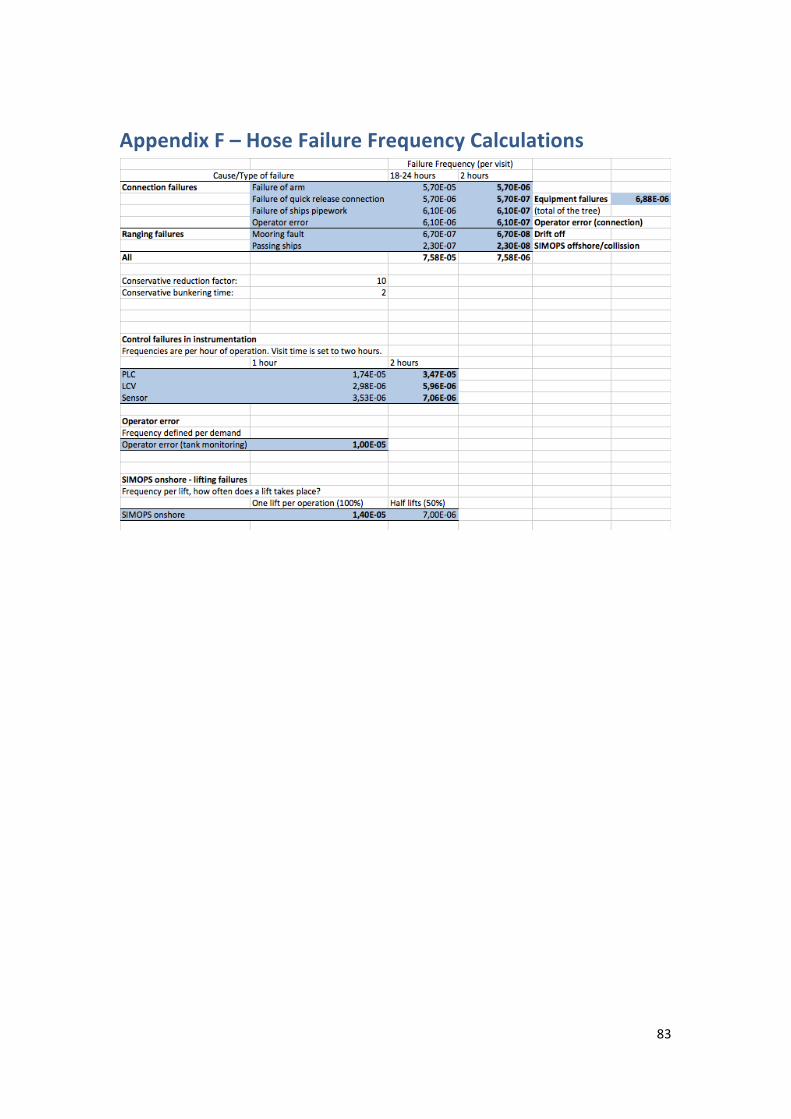
83
Appendix F – Hose Failure Frequency Calculations
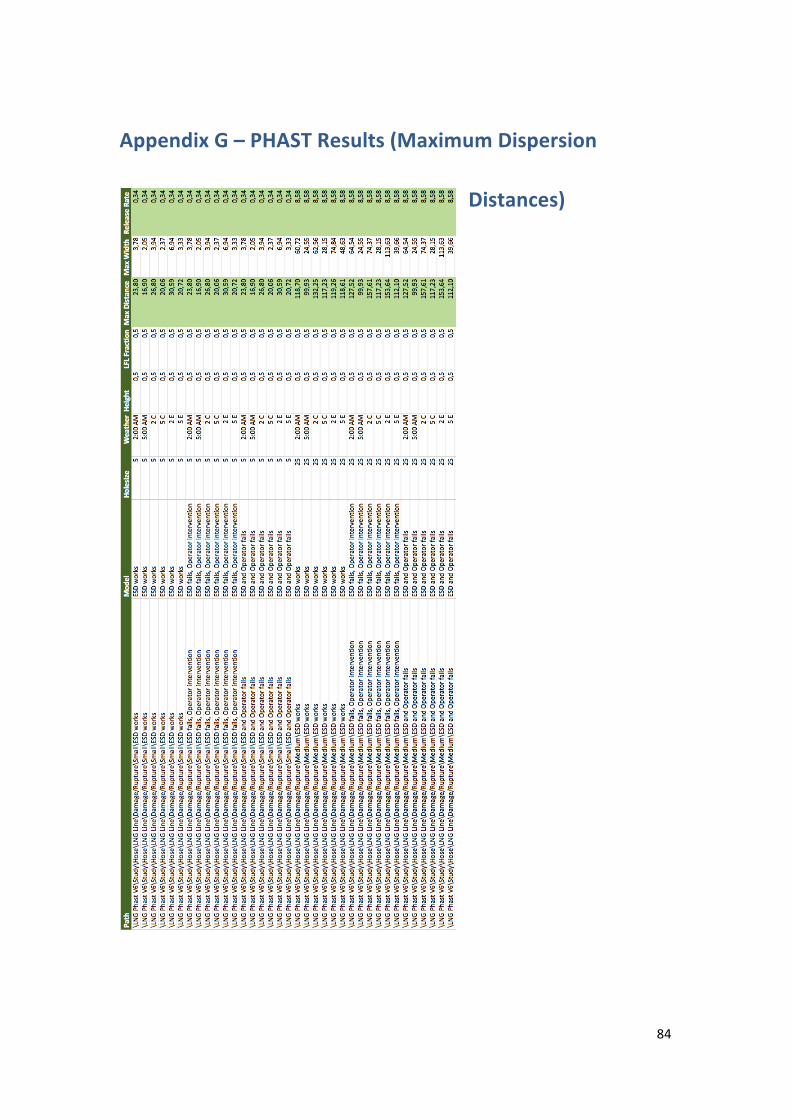
84
Appendix G – PHAST Results (Maximum Dispersion
Distances)
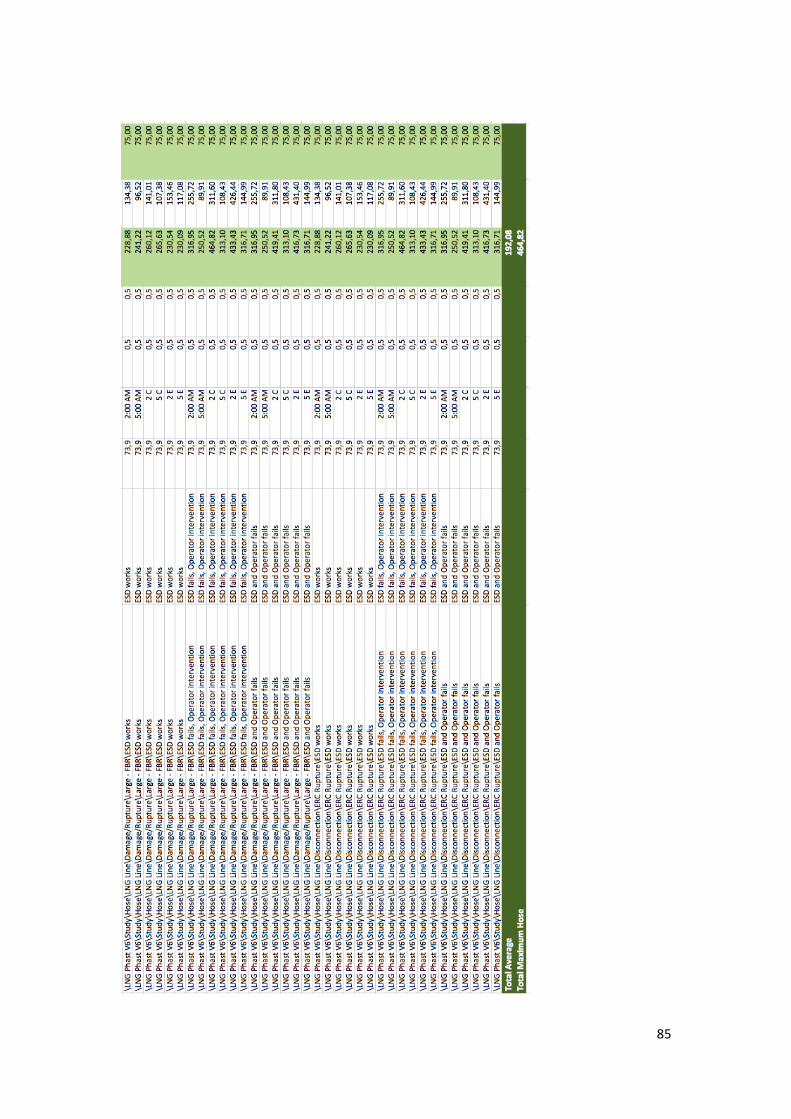
85
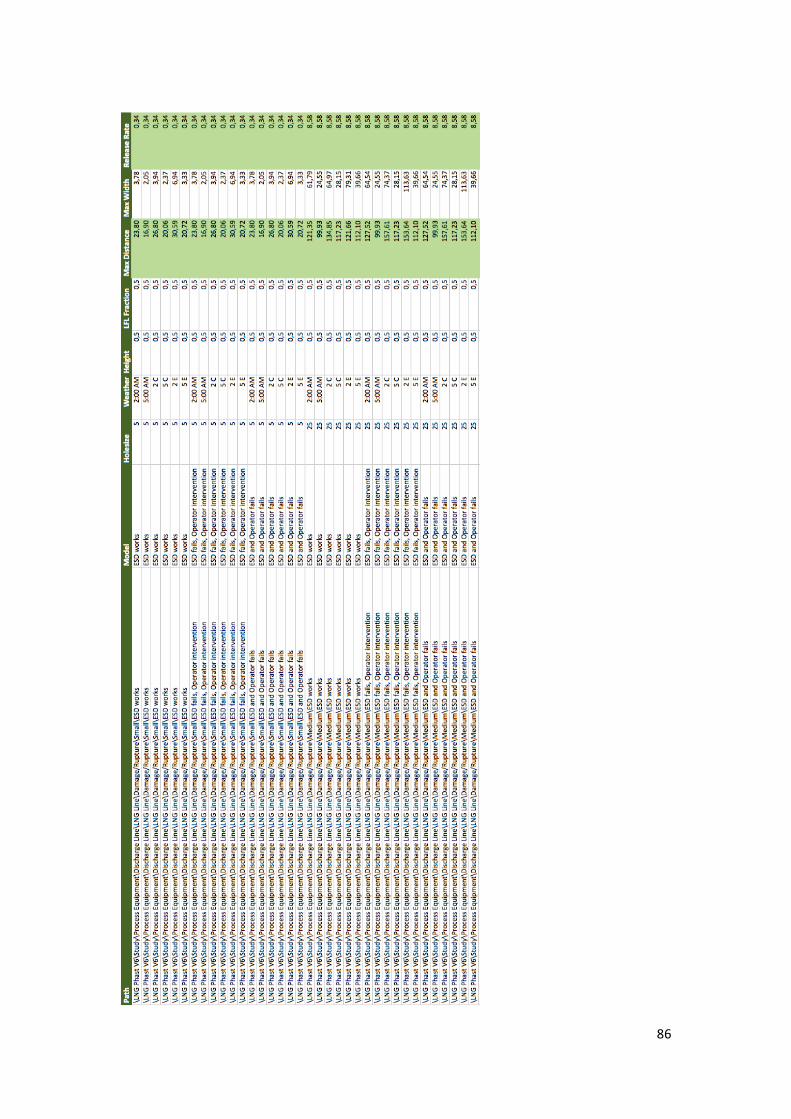
86
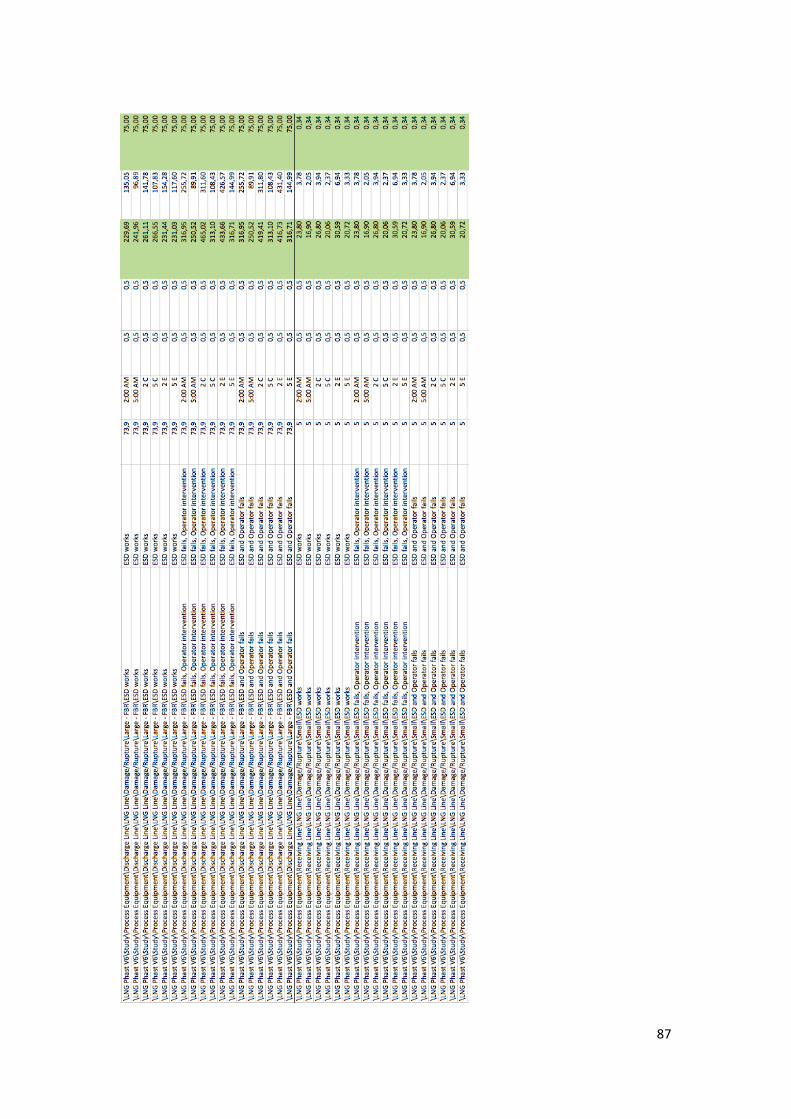
87
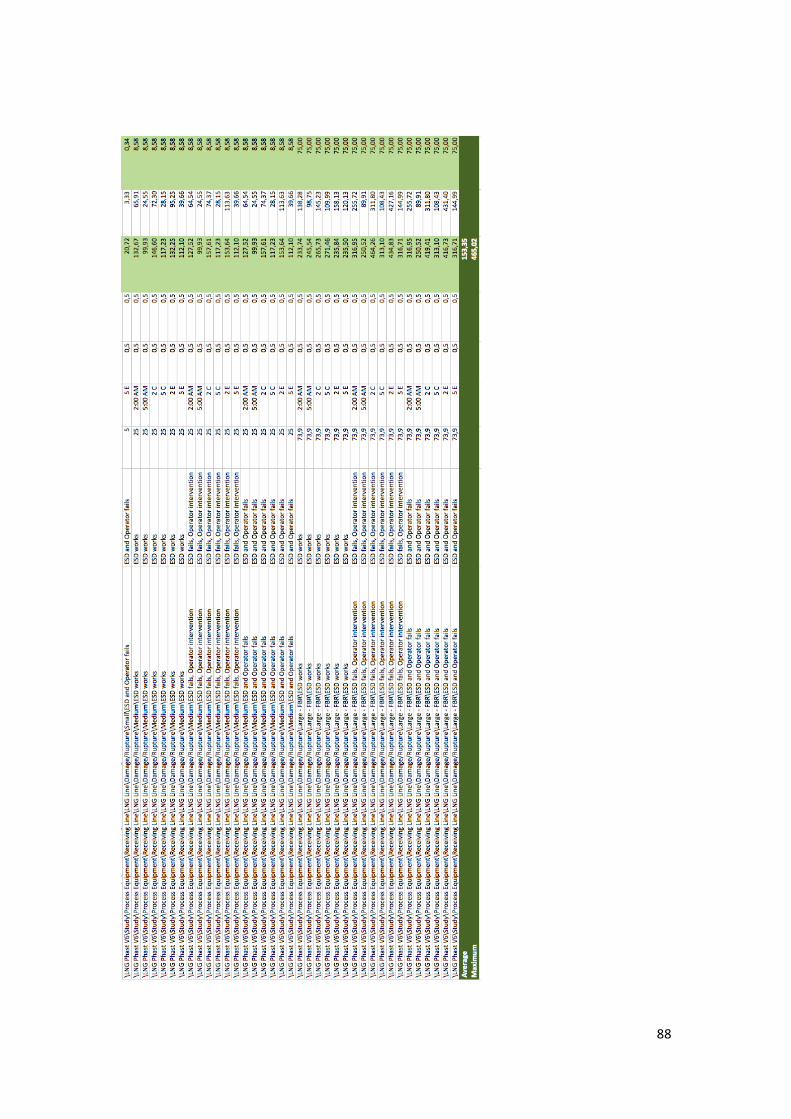
88
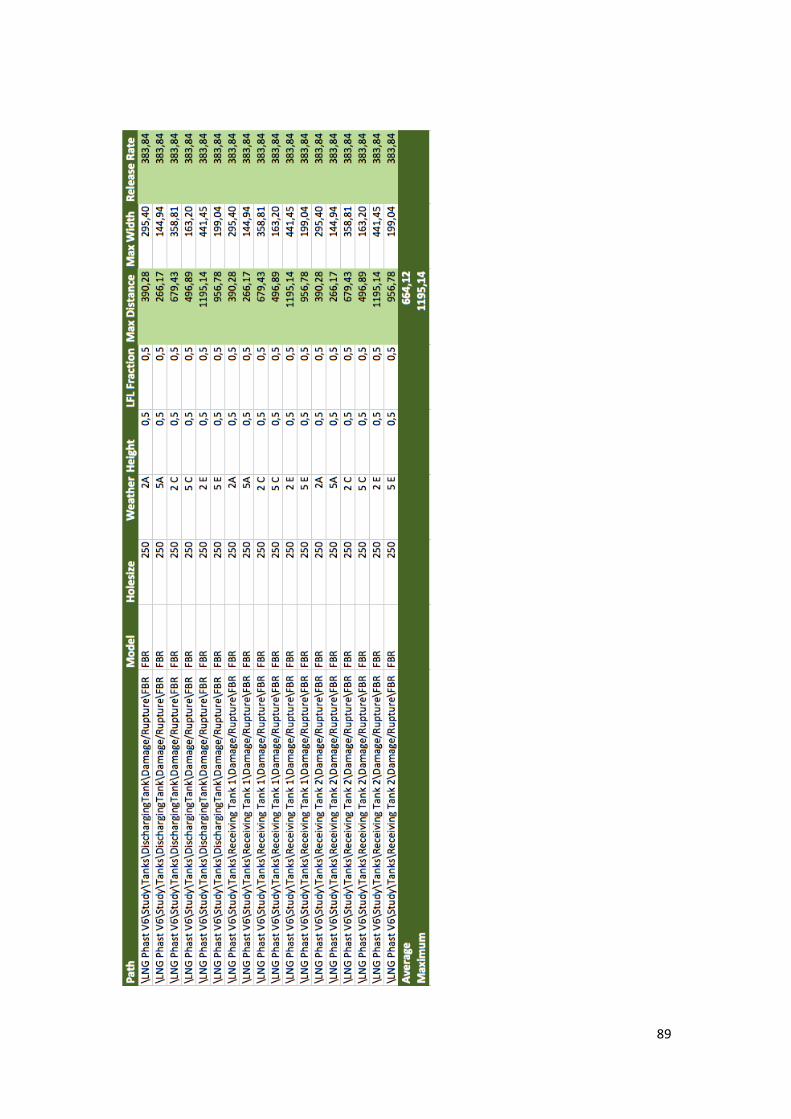
89
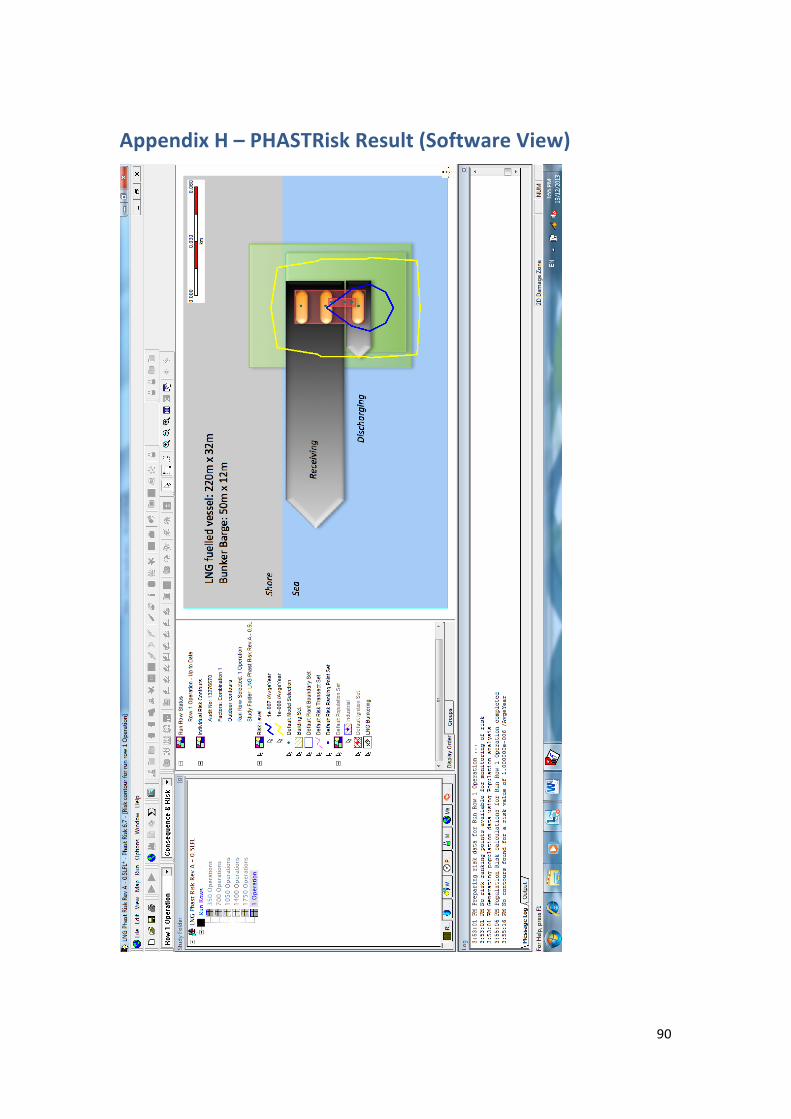
90
Appendix H – PHASTRisk Result (Software View)
91
Reference List 1 James, G. 2013. Riding The Wave. American Gas, April 2 James, G. 2013. Heavy Duty Stuff: LNG as Transport Fuel. American Gas, April. 2 James, G. 2013. Heavy Duty Stuff: LNG as Transport Fuel. American Gas, April. 3 LNG Shipping Review. 2012. Veka-‐Group Develops Small LNG Tankers. 4 James, G. 2013. Riding The Wave. American Gas, April 5 Germanischer Lloyd. 2013. Final Report European Maritime Safety Agency (EMSA) Study on Standards and Rules for Bunkering of Gas-‐Fueled Ships. [report]. 6 Germanischer Lloyd. 2013. Final Report European Maritime Safety Agency (EMSA) Study on Standards and Rules for Bunkering of Gas-‐Fueled Ships. [report]. 7 Shell Shipping. 2012. LNG Bunkering Installation Guidelines SST02167. [report]. 8 Blikom, L.P., & Folbert, M. (2013, 29). DNV GL Blog -‐ Energy of the Future. How to calculate safety zones for LNG bunkering. Retrieved November 29, 2013, from http://blogs.dnv.com/lng/2013/11/how-‐to-‐calculate-‐safety-‐zones-‐for-‐lng-‐bunkering-‐2/ 9 Det Norske Veritas. 2011. DNV report on the potential of LNG shipping in the Baltic. [report]. 10 D. van Meulen (2012) Port toolkit risk profile -‐ LNG bunkering, Rotterdam: Det Norske Veritas. [report] 11 ISO Technical Cometee (2013) ISO/TC 67/WG 10 Technical Report: International Organization for Standardization. [report] 12 Tellkamp, J., & Lie Strøm, K. (2013). DNV Recommended Practice for LNG bunkering installations. 13 Blikom, L.P., & Folbert, M. (2013, 29). DNV GL Blog -‐ Energy of the Future. How to calculate safety zones for LNG bunkering. Retrieved November 29, 2013, from http://blogs.dnv.com/lng/2013/11/how-‐to-‐calculate-‐safety-‐zones-‐for-‐lng-‐bunkering-‐2/ 14 Blikom, L.P., & Folbert, M. (2013, 29). DNV GL Blog -‐ Energy of the Future. How to calculate safety zones for LNG bunkering. Retrieved November 29, 2013, from http://blogs.dnv.com/lng/2013/11/how-‐to-‐calculate-‐safety-‐zones-‐for-‐lng-‐bunkering-‐2/ 15 Blikom, L.P., & Folbert, M. (2013, 29). DNV GL Blog -‐ Energy of the Future. How to calculate safety zones for LNG bunkering. Retrieved November 29, 2013, from http://blogs.dnv.com/lng/2013/11/how-‐to-‐calculate-‐safety-‐zones-‐for-‐lng-‐bunkering-‐2/ 16 Tellkamp, J., & Lie Strøm, K. (2013). DNV Recommended Practice for LNG bunkering installations. 17 Blikom, L.P., & Folbert, M. (2013, 29). DNV GL Blog -‐ Energy of the Future. How to calculate safety zones for LNG bunkering. Retrieved November 29, 2013, from http://blogs.dnv.com/lng/2013/11/how-‐to-‐calculate-‐safety-‐zones-‐for-‐lng-‐bunkering-‐2/ 18 Blikom, L.P., & Folbert, M. (2013, 29). DNV GL Blog -‐ Energy of the Future. How to calculate safety zones for LNG bunkering. Retrieved November 29, 2013, from http://blogs.dnv.com/lng/2013/11/how-‐to-‐calculate-‐safety-‐zones-‐for-‐lng-‐bunkering-‐2/ 19 RIVM (2009) Dutch Reference Manual Risk Assessments -‐ Purple Book, 3.2 edn., the Netherlands: National Institute of Public Health and the Environment (RIVM). 20 RIVM (2009) Dutch Reference Manual Risk Assessments -‐ Purple Book, 3.2 edn., the Netherlands: National Institute of Public Health and the Environment (RIVM). 21 Tellkamp, J., & Lie Strøm, K. (2013). DNV Recommended Practice for LNG bunkering installations. 22 Tellkamp, J., & Lie Strøm, K. (2013). DNV Recommended Practice for LNG bunkering installations. 23 D. van Meulen (2012) Port toolkit risk profile -‐ LNG bunkering, Rotterdam: Det Norske Veritas. [report] 24 DNV GL (2013) Failure Frequency Guide -‐ process equipment leak frequencies data for use in QRA, : DNV Serving the Processs Industry. 25 D. van Meulen (2012) Port toolkit risk profile -‐ LNG bunkering, Rotterdam: Det Norske Veritas. [report] 26 Tellkamp, J., & Lie Strøm, K. (2013). DNV Recommended Practice for LNG bunkering installations. 27 Tellkamp, J., & Lie Strøm, K. (2013). DNV Recommended Practice for LNG bunkering installations.
92
28 DNV GL (2013) Failure Frequency Guide -‐ process equipment leak frequencies data for use in QRA, : DNV Serving the Processs Industry. 29 DNV GL (2013) Failure Frequency Guide -‐ process equipment leak frequencies data for use in QRA, : DNV Serving the Processs Industry. 30 Det Norske Veritas (2013) 'PhastTM -‐ Adding value to the emergency planning and response process', DNV Software, (), pp. [Online]. Available at: http://www.dnv.com/binaries/1303_Phast%20Emergency%20Response_3_tcm4-‐546982.pdf [Accessed: 12th November 2014]. 31 DNV GL (2013) Phast, Available at: http://www.dnv.com/services/software/products/phast_safeti/phast/ [Accessed: 29th November 2010]. 32 DNV Software (2013) Enhance your HAZID using Phast, Available at: http://www.dnv.com/binaries/HAZID_0412_English_tcm4-‐525134.pdf (Accessed: 29th November 2010). 33 Shell Shipping. 2012. LNG Bunkering Installation Guidelines SST02167. [report]. 34 Shell Shipping. 2012. LNG Bunkering Installation Guidelines SST02167. [report]. 35 Shell Shipping. 2012. LNG Bunkering Installation Guidelines SST02167. [report]. 36 Tellkamp, J., & Lie Strøm, K. (2013). DNV Recommended Practice for LNG bunkering installations. 37 Swedish Marine Technology Forum, Linde Cryo AB, FKAB Marine Design, Det Norske Veritas AS, LNG GOT and White Smoke AB. 2010. LNG ship to ship bunkering procedure. Greenshipping. [report]. 38 Tellkamp, J., & Lie Strøm, K. (2013). DNV Recommended Practice for LNG bunkering installations. 39 Swedish Marine Technology Forum, Linde Cryo AB, FKAB Marine Design, Det Norske Veritas AS, LNG GOT and White Smoke AB. 2010. LNG ship to ship bunkering procedure. Greenshipping. [report]. 40 Tellkamp, J., & Lie Strøm, K. (2013). DNV Recommended Practice for LNG bunkering installations. 41 Pettersen, J. 2012. Compendium LNG Technology. TEP4185 Natural Gas Technology -‐ NTNU. 42 Blogs.dnv.com. 2013. Basics of LNG safety | DNV Blog – Energy of the Future. [online] Available at: http://blogs.dnv.com/lng/lars-‐petter-‐blikom/ [Accessed: 25 April 2013]. 43 Klaussen, Ø. 2013. Gas course category A, B and C -‐ for crew of gas-‐fulled ships. Gassteknikk. 44 Tellkamp, J., & Lie Strøm, K. (2013). DNV Recommended Practice for LNG bunkering installations. 45 G. van der Weijde and N. Mallon (June 19–24, 2011) Qualification of Multi-‐Composite Hoses for STS LNG Transfer, ISBN: 978-‐0-‐7918-‐4433-‐5, pp. 209-‐215, Rotterdam, The Netherlands: ASME 2011 30th International Conference on Ocean, Offshore and Arctic Engineering. 46 Tellkamp, J., & Lie Strøm, K. (2013). DNV Recommended Practice for LNG bunkering installations. 47 Tellkamp, J., & Lie Strøm, K. (2013). DNV Recommended Practice for LNG bunkering installations. 48 Tellkamp, J., & Lie Strøm, K. (2013). DNV Recommended Practice for LNG bunkering installations. 49 DNV Software (2013) Enhance your HAZID using Phast, Available at: http://www.dnv.com/binaries/HAZID_0412_English_tcm4-‐525134.pdf (Accessed: 29th November 2010). 50 D. van Meulen (2012) Port toolkit risk profile -‐ LNG bunkering, Rotterdam: Det Norske Veritas. [report] 51 Air Resources Laboratory (2011) Pasquill Stability Classes, Available at: http://www.ready.noaa.gov/READYpgclass.php |Accessed: 15th November 2010]. 52 Weather Measure (2007) What is a Wind Rose?, Available at: http://www.weathermeasure.com/2007/03/what-‐is-‐wind-‐rose.html [Accessed: 15th November 2010]. 53 Weather Measure (2007) What is a Wind Rose?, Available at: http://www.weathermeasure.com/2007/03/what-‐is-‐wind-‐rose.html [Accessed: 15th November 2010]. 54 Shell Shipping. 2012. LNG Bunkering Installation Guidelines SST02167. [report]. 55 Shell Shipping. 2012. LNG Bunkering Installation Guidelines SST02167. [report]. 56 Shell Shipping. 2012. LNG Bunkering Installation Guidelines SST02167. [report].
93
57 D. van Meulen (2012) Port toolkit risk profile -‐ LNG bunkering, Rotterdam: Det Norske Veritas.[report] 58 RIVM (2009) Dutch Reference Manual Risk Assessments -‐ Purple Book, 3.2 edn., the Netherlands: National Institute of Public Health and the Environment (RIVM). 59 RIVM (2009) Dutch Reference Manual Risk Assessments -‐ Purple Book, 3.2 edn., the Netherlands: National Institute of Public Health and the Environment (RIVM). 60 RIVM (2009) Dutch Reference Manual Risk Assessments -‐ Purple Book, 3.2 edn., the Netherlands: National Institute of Public Health and the Environment (RIVM). 61 Det Norske Veritas (2013) Appendix D – Leak Frequencies Analysis Report No./DNV Reg No.:2013-‐4091/17TLT29-‐3, Stavanger, Norway: Skangass AS. [report] 62 Det Norske Veritas (2013) Appendix A – Leak Frequencies Analysis Report No./DNV Reg No.:2013-‐4091/17TLT29-‐3, Stavanger, Norway: Skangass AS. [report] 63 RIVM (2009) Dutch Reference Manual Risk Assessments -‐ Purple Book, 3.2 edn., the Netherlands: National Institute of Public Health and the Environment (RIVM). 64 RIVM (2009) Dutch Reference Manual Risk Assessments -‐ Purple Book, 3.2 edn., the Netherlands: National Institute of Public Health and the Environment (RIVM). 65DNV GL (2013) Failure Frequency Guide -‐ process equipment leak frequencies data for use in QRA, : DNV Serving the Process Industry. 66 DNV GL (2013) Failure Frequency Guide -‐ process equipment leak frequencies data for use in QRA, : DNV Serving the Process Industry. 67 DNV GL (2013) Failure Frequency Guide -‐ process equipment leak frequencies data for use in QRA, : DNV Serving the Process Industry. 68 DNV GL (2013) Failure Frequency Guide -‐ process equipment leak frequencies data for use in QRA, : DNV Serving the Process Industry. 69 T. A. Pedersen & N. J. Lindtner (2011) Erfaringer – slangebrudd i fleksible laste-‐/losseslanger. GAS-‐ZX-‐001-‐04, : Gasnor; Slangebrudd-‐erfaringer 2003-‐2010. [report] 70 O. Baldan (2013) LNG Bunkering: Safety Distances, : Det Norske Veritas. [report] 71 O. Baldan (2013) LNG Bunkering: Safety Distances, : Det Norske Veritas. [report]
Related Documents