Timothy Lynam · Robert Cunliffe · Douglas Sheil Meilinda Wan · Agus Salim · Hari Priyadi · Imam Basuki Developing a predictive understanding of landscape valuation by the Punan Pelancau people of East Kalimantan Livelihoods, land types and the importance of ecosystem goods and services

Welcome message from author
This document is posted to help you gain knowledge. Please leave a comment to let me know what you think about it! Share it to your friends and learn new things together.
Transcript
Timothy Lynam · Robert Cunliffe · Douglas Sheil Meilinda Wan · Agus Salim · Hari Priyadi · Imam Basuki
Developing a predictive understanding of landscape valuation by the Punan Pelancau people of East Kalimantan
Livelihoods, land types and the importanceof ecosystem goods and services
Timothy Lynam, Robert Cunliffe, Douglas Sheil, Meilinda Wan, Agus Salim, Hari Priyadi and Imam Basuki
Developing a predictive understanding of landscape valuation
by the Punan Pelancau people of East Kalimantan
Livelihoods, land types and the importance
of ecosystem goods and services
Livelihoods, land types and the importance of ecosystem goods and servicesDeveloping a predictive understanding of landscape valuation by the Punan Pelancau people of East Kalimantan
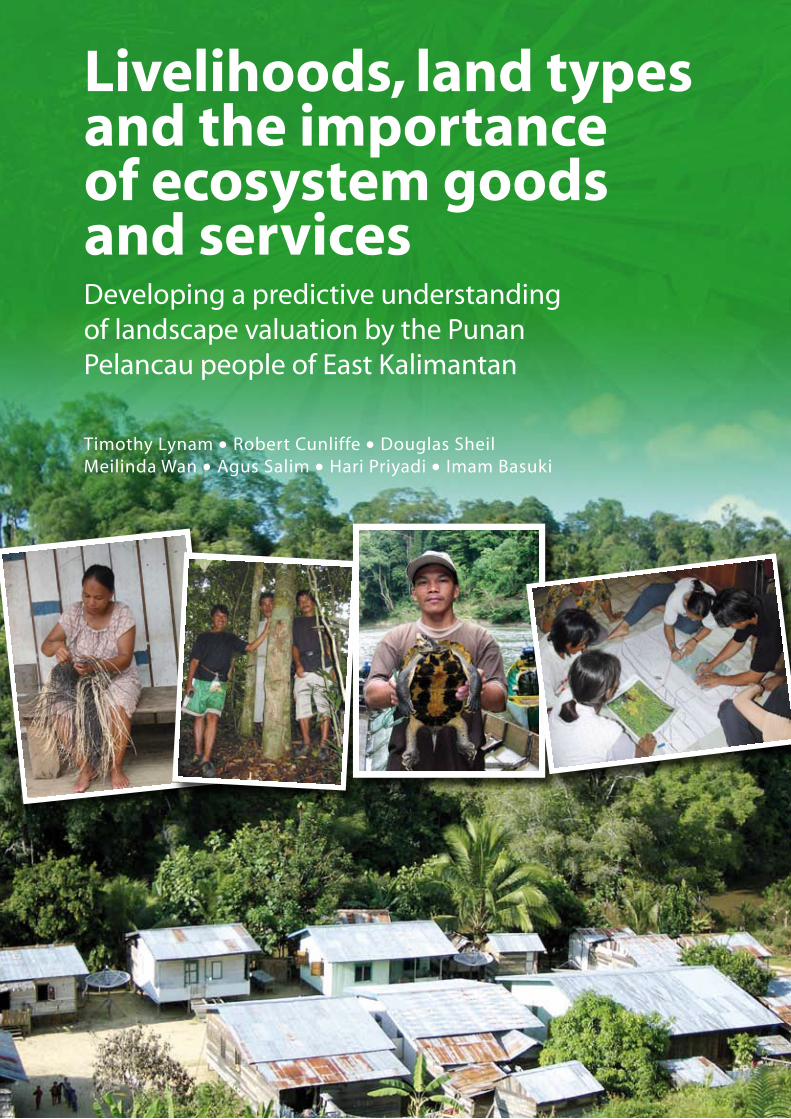
Cover photosFront cover: Licuala palm (silat) leaf (watermark), Lio Mutai Village (lower main image), weaving a rattan mat, gaharu collectors with a wild gaharu tree, a river terrapin collected for food, photographs by Douglas Sheil; mapping with satellite image, photograph by Tim Lynam
Back cover: Wild nutmeg leaf (watermark), research team and villagers, photographs by Douglas Sheil
Graphic design and layoutEko Prianto
64 pages + xii pages; 21cm x 29.7cmISBN: 979-24-4650-8
© 2006 All rights reservedPrinted by SMK Desa Putera, JakartaFirst edition, October 2006
Published byCenter for International Forestry Research (CIFOR)Mailing address: P.O. Box 6596 JKPWB, Jakarta 10065, IndonesiaOffice address: Jalan CIFOR, Situ Gede, Sindang Barang,Bogor Barat 16880, IndonesiaTelp.: +62 (0251) 622622. Fax.: +62 (0251) 622100E-mail: [email protected]: http://www.cifor.cgiar.org
iiiLivelihoods, land types and the importance of ecosystem goods and services:developing a predictive understanding of landscape valuation by the Punan Pelancau people of East Kalimantan
Executive Summary
IntroductionEast Kalimantan (Indonesian Borneo) is recognised globally for the high conservation value of its species-rich tropical rain forests. However, the region is undergoing rapid socioeconomic changes and the forests are being lost. The principal activities are cropping, (both commercial plantations and small-scale production), logging and mining. Driven by external investment, these developments are stimulating in-migration and the rapid growth of urban settlements. Indonesia is emerging from decades of centralised control, and while the recent decentralisation has considerable potential in terms of addressing local issues, the reality is that the old top-down procedures have considerable momentum and continue to dominate the administrative mindset. Within this context, it is all too easy for planners and developers to erroneously assume that what appear to be large empty tracts of forest are devoid of significance to local people, and to make important decisions that may have profound impacts on the livelihoods of local communities without even consulting them.
The primary purpose of the study was to investigate how the Punan Pelancau people view their surrounding landscape, to develop a predictive understanding of their assignment of landscape importance, and to present the result in the form of maps, to which planners and developers can easily relate. The study builds on previous work undertaken in a drier savanna woodland environment in Mozambique. A secondary aim was to test the methodologies developed in Mozambique within this wetter forest environment, and to further
Executive Summary
refine and improve them. This work was undertaken within the context of CIFOR’s broad objective of providing policy-relevant information that can enable more informed, productive, sustainable and equitable decisions about the management and use of tropical forests.
Materials and MethodsThe upper Malinau basin comprises extremely steep and rugged terrain, dominated by primary forest, with limited occurrences of fields and secondary forest in association with small indigenous settlements. Altitude varies from about 100 to 700 m, mean annual rainfall is in the order of 4000 mm, and mean daily temperatures are about 26 to 27oC. Soils are varied but inherently infertile, which, combined with the prevalence of steep slopes, renders the area unattractive for the development of commercial plantation crops such as oil palm, pepper, cocoa, coffee or rubber. Although the forests contain valuable timber resources, due to their remote location and the difficult terrain, logging has previously been relatively restricted. However, road building projects are a fundamental part of local planning and are increasingly opening the area to logging. The region supports a considerable wealth of additional plant and animal resources although these are still being documented.
The area is very sparsely settled (less than one inhabitant per km2), very difficult to access (by river, other than a single road constructed recently), and virtually undeveloped (for example, there are no schools or health facilities). Settlement is confined to a number of small Punan villages.
iv Livelihoods, land types and the importance of ecosystem goods and services:developing a predictive understanding of landscape valuation by the Punan Pelancau people of East Kalimantan
Formerly nomadic hunter-gatherers, most of the Punan now live in fixed settlements and are swidden cultivators, albeit with a relatively strong emphasis on extractive forest-based activities. The Punan Pelancau, one of several Punan lineages, were in the early 1980s officially all relocated to the downstream resettlement village of Long Loreh. Since then many have returned to live upstream. In February 2000, in addition to the Long Loreh community, there were some 35 households in three upstream locations: Sungai Uli, Lio Mutai and Metut. Further upstream, towards the headwaters of the Malinau, the Punan Pelancau claim ownership of a territory covering some 500 km2, which although currently devoid of any permanent settlements is used for the gathering of forest resources.
The investigation focused on the upstream area of Lio Mutai, Metut and the upstream tribal territory. During an initial field trip to Long Loreh, we worked with a group of Punan Pelancau informants who were familiar with the upstream area, to identify livelihood activities, land types, and the goods and services associated with each land type. These were scored in terms of relative importance, in respect of an average family achieving an adequate standard of living. A simple cost/benefit model was proposed whereby the importance value for any location was proportional to the weighted sum of all the goods and services to be found there (i.e. the benefits), divided by the distance from the village (representing the cost of accessing these resources). Distance, in this case, was a complex function, measured as the sum of the time taken to travel by boat, road, paths and off paths, all converted to hours. During a second field trip to Lio Mutai, field samples were taken in order to generate data to test the model. The resulting 113 sample points were selected to be at different distances from the village and to cover the variety of land types. Sampling was strongly constrained by the limited access and steep terrain, such that many parts of the tribal territory could not be reached. For each plot (roughly 25 m in radius) teams of villagers, including men and women, estimated levels of available resources and the distance to be travelled to get to the plot. The villagers would then consider how important the plot was to their well-being, and scored this using
a scale of 1–100, where 1 was the least important site the villagers could conceive within the overall sample area and 100 the most important. Additional exercises and discussion groups were convened to identify and clarify the nature of any specific locations of importance to the communities.
Various types of models and spatial analyses were investigated. The initial model was implemented as a Bayesian Belief Network (BBN). For each sample, given the particular values of goods and services recorded from the plot, and the estimated distance from the village to the plot, the model would generate a predicted importance score. Comparison of predicted scores against those given by the community (using Pearson’s correlation) was disappointing, thus stimulating the testing of alternative modelling techniques.
Attention was then turned to general linear models (GLMs). Various models were developed, using different combinations of goods and services. Models were developed with 80% of the field samples (constituting a core data set) and then tested using the remaining 20% (as independent samples). The predicted values for the independent data set were compared against the actual scores given by the community using Pearson’s correlation.
Standard Geographic Information System (GIS) techniques were used to develop spatial representations, or maps, of model inputs and landscape importance scores, and to carry out comparisons between predicted and observed importance surfaces. A third and simpler type of model was developed and tested in the field, which we called the ‘grid-cell’ method. In this case, community members would indicate scores directly onto a map, by placing different numbers of matchsticks into each grid square to indicate levels of different factors for that square. Three aspects were scored: the likelihood of finding resources in each cell (equivalent to benefits), the difficulty of procuring resources from the cell (equating to costs), and frequency of visits to the cell to search for eaglewood. These scores were then tested by comparing the score for each cell against the mean score for all sample points falling within the cell.
vLivelihoods, land types and the importance of ecosystem goods and services:developing a predictive understanding of landscape valuation by the Punan Pelancau people of East Kalimantan
In the main report the methods and approach used are described more fully to enable replication of the process.
Results
Livelihoods, Land Types, and Goods and ServicesThe Punan Pelancau live in small villages on the banks of the Malinau River, in wooden houses built using timber from the adjacent forests. Roofs are constructed with either tin sheets or silat (palm) leaves. Fields are cultivated in the surrounding areas, as well as fruit and vegetable gardens. People keep livestock, for consumption (chickens, ducks and pigs), hunting (dogs) and selling (chickens). Food resources harvested from the surrounding forests and rivers included wildlife (pigs, deer, monkeys), fish, wild fruits and other plant foods. Other resources collected included firewood, eaglewood (for income), rattan (for crafts), medicines and poisons.
The most important livelihood activities were said to be crop production, the collection of eaglewood, harvesting of wildlife and fish, and the making of crafts. Eaglewood was considered to be the most important source of income, but was restricted to about 50% of households. Concession fees, which accrued to all households, were identified as being the second most important source of income. Additional monies were derived through selling rattan products (30% of households), chickens (25%), fruit (20%) and vegetables (15%). Other important sources of income, but which were restricted to fewer households (10% or less), included operating kiosks in the village, the selling of meat and fish, and renting boats.
In terms of land types, the landscape is dominated by primary forest, with smaller portions of mountain forest and logged forest. Other land types associated with settlements were villages, old abandoned village sites, fields and fallows, and concession camps. Additional aquatic related types were big (deep, navigable) rivers, small (non-navigable) rivers, depositional areas (sand or rock banks), islands, waterfalls, salt springs and swamp forest. Logging roads and cemeteries were also considered to comprise specific types.
The most important type, in terms of contribution to household well-being, was said to be intact forest, followed by big and small rivers, and fields. The next most important types included village areas, old fields, concession camps and logging roads. Other types were considered to be of relatively minor importance. Interestingly, logging was valued as a source of income, but the resulting logged areas were rated as being of much lower value than intact forest.
Commonly identified goods and services derived from the different land types were wildlife, rattan, eaglewood, crops, fields, vegetable and fruit gardens, building materials including silat leaves for roofing, sago, wild fruits, fish and bamboo. Intact forests supplied the greatest variety of goods and services (some 30 items out of a total basket of nearly 50), although other than timber most of these were also available from other land types. Only 15 goods and services were listed for logged forest. Certain resources and services were associated with specific land types. For example, river transport, fish and turtles were specifically associated with rivers; crops were necessarily linked to fields, fruit and vegetable gardens; villages were the primary location for houses (as opposed to temporary shelters), meetings and for livestock; logging operations provided concession fees, markets for goods, facilities, road transport, employment opportunities and development assistance; river depositional areas provided resting places, sand, stones and bait for fishing; and view points were associated with mountain forest areas.
The principal constraints in terms of achieving access to resources were reported to be uncertainty regarding the finding of eaglewood, a lack of chainsaws and poor crop yields. The overall listing was dominated by concerns relating to transport and equipment, which collectively accounted for 43% of the overall relative importance weighting (RIW). Difficulties in obtaining natural resources made up a further 36% of the RIW, whilst the remaining 22% was related to difficulties concerning the production of crops. To our surprise distance was not identified as a constraint, nor was there any mention of physical barriers or institutional limitations. However, during discussions the Punan Pelancau raised concerns that they did not have full rights to the areas where they were living, these
vi Livelihoods, land types and the importance of ecosystem goods and services:developing a predictive understanding of landscape valuation by the Punan Pelancau people of East Kalimantan
being located within traditional territories seen as belonging to other Punan groups. They also saw a growing need to restrict access by outsiders, particularly non Punan people, to their own traditional territory and the resources therein.
Community members identified a number of other locations of specific significance. These people have traditionally been highly mobile, such that there were a number of deserted old village sites, fruit groves, graves and other sites of cultural significance in locations at considerable distance from current settlements. Various rules and regulations are traditionally associated with features like burial sites. It was difficult to discuss certain locations that were viewed as being associated with spirits. Although most individuals denied believing in these ‘old fashioned ideas’, it appeared that they did still have special significance. As these sites were scattered in an unpredictable manner no effort was made to include their ‘special values’ in the predictive spatial models, though we do acknowledge their genuine significance and cultural importance for the community.
In the main report the actual results of the livelihood assessments as well as the results of the identification of the goods and services used by the community are presented in greater detail. Detail is provided on each component of the identified livelihood activities. Detail is also provided on each of the identified land types and the goods and services generally procured from each of these. Also identified in greater detail are the factors likely to influence the scores assigned to goods and services as well as the factors that would constrain resource use patterns.
Field Sample ScoresImportance scores allocated to the 113 field samples varied from 4 to 100, the median value being 45 points. Although land types appeared to make an important contribution to the importance score for any location, statistically it was not possible to distinguish land types in terms of their importance scores. Even when the samples were scaled for their distance from Lio Mutai, the least important land type (logged forest) and the most important (fruit gardens) were distinguishable from the rest, but the others were indistinguishable.
Models and MapsThe initial BBN model took the form of benefits (the weighted sum of goods and services) divided by distance, the hypothesis being that importance would increase with higher levels of benefits and gradually decline with increasing distance from the village. Despite testing different combinations of resources and different distance functions (hours or kilometres), the degree of correspondence between expected and observed sample scores was never better than 22%.
A number of GLMs were developed and tested against the importance scores allocated in the field. The model judged to provide the most meaningful results (adjusted r2 = 0.725) included a group of goods on the benefit side related to production (fields, gardens, boat materials, rattan and poisons), and to factors concerning health and home (medicines, houses and water for drinking). The cost side was represented by a distance time function. Comparison of the predicted scores for the 23 ‘independent’ samples against their observed scores, using Pearson’s correlation, yielded a correlation coefficient of 0.576.
The grid-cell method was different from the other two modelling approaches in that it did not seek to understand the underlying processes so much as identify the importance scores assigned to a location. The results are therefore more descriptive than explanatory. The conceptual cost benefit model was used to guide the exercise, with benefits being represented by the likelihood of successfully finding resources in a given grid square, and costs by the degree of difficulty in accessing these resources. However, the predicted importance scores for each cell (i.e. success/difficulty) were less well correlated with the actual field scores than were the likelihood of success scores on their own.
High success or importance scores were indicated around the settlement areas of Lio Mutai and Metut, and in the upstream territory around the junctions of the Mekayan and Menoreh rivers with the Malinau, and in the upper catchments of the Kelawit and Menoreh Rivers. There was a negative relationship between the mean importance score for all samples within a particular cell and the score given to that cell for degree of difficulty in obtaining resources, but the correlation was weak. The general pattern
viiLivelihoods, land types and the importance of ecosystem goods and services:developing a predictive understanding of landscape valuation by the Punan Pelancau people of East Kalimantan
of difficulty in accessing resources was consistent with what might be expected, increasing with distance from Lio Mutai and from navigable rivers and roads.
Using GIS techniques, a spatial surface was generated of the field importance scores. This shows why it was so difficult to develop importance models using either the BBN or GLMs. The original conceptual model was of a steady decline in importance with increasing distance from the settlements of Lio Mutai and Metut. The surface clearly shows that this is not true: there are several peaks of higher importance upstream of these villages that do not neatly fit into the general trend of declining importance with increasing distance. Although there was a general trend of declining importance with increasing distance, there were a number of other processes at work, and which resulted in a very complex landscape importance surface.
The models and maps that were developed and used are described and discussed in greater detail in the main report. The results of the statistical analyses of the GLMs are presented and discussed.
DiscussionThe field results show that the Punan Pelancau have a much more complex relationship with their surrounding landscape than originally anticipated. In addition to there being a number of areas of settlement and importance to the community (Long Loreh, Lio Mutai, Metut and the Pelancau territory), within the undisturbed upstream forest portion there are also peaks and troughs of importance at varying distances from the closest settlements of Lio Mutai and Metut. This explains why it was difficult to get satisfactory results from either the BBN or GLM approaches, for both of which costs were equated to distance from the village.
Results from the initial participatory exercises, and the GLM and grid-cell models, suggest that potential benefits (resources, good and services) make a stronger contribution to landscape importance than do cost factors in general, and distance in particular. This is consistent with earlier findings from Mozambique.
The lack of correlation between importance scores and the presence of eaglewood was surprising, given that this was identified as being the most important resource to be harvested from the upstream forest areas, and was also rated as being the principal source of income.
However, income did not appear to be a significant determinant of landscape importance. Nor were land types good predictors of importance scores. Within each land type importance scores tended to range from low to high, such that even when scaled for distance, it was not possible to reliably distinguish between land types on the basis of importance scores.
The grid-cell method appears to have considerable potential as a simple tool to capture and represent community knowledge. The method is visible to community members, simple enough to be readily understood by everyone, and does not require any sophisticated analytical or modelling techniques. All grid cells are visible during the scoring process, such that the community members are working with an overview of the area. This should make it easier for participants to make the required abstract comparisons between different areas. The method has the additional benefit of covering the whole area, but without having to visit everywhere on the ground. If suitable base maps were made available, communities could probably do these grid-cell evaluations themselves, and this method could probably be a very useful tool for local inventories of resources. Interpretation and communication of the results is also straightforward.
The grid-cell method does, however, rely on the knowledge that participants have of the overall landscape, which in this case was perhaps unusually high, given the strong reliance of these communities on forest resources and the considerable distances that they travel to obtain some of these, particularly eaglewood.
The grid-cell results are also more descriptive than explanatory. However, combined with questions and discussions, the results could be used to generate useful hypotheses as to the likely factors governing the assignment of importance scores. What might be a useful approach to understanding landscape
viii Livelihoods, land types and the importance of ecosystem goods and services:developing a predictive understanding of landscape valuation by the Punan Pelancau people of East Kalimantan
importance in any given situation would be to start with the grid-cell method and then use these results to inform the application of more sophisticated modelling techniques, such as the Bayesian or general linear models investigated here.
We would also advocate for the careful identification of sites having specific cultural values and significance. Too often at present we hear of communities distraught by the destruction of gravesites and other important cultural sites. Such unnecessary interventions should be avoided wherever possible.
More generally, the iterative approach adopted here, of collecting data, posing hypotheses (models), testing them, and then using the results to further refine and improve the models, appears to offer a particularly rewarding and beneficial approach to the understanding of landscape importance. Equally rewarding was that it entailed close interaction with community participants and thus good opportunity for co-learning. In the context of development of the participating communities, the use of participatory
co-learning approaches can be expected to deliver the best long term results.
What are the implications for development planners? Apparently empty forest areas, such as the upstream Pelancau tribal territory, can have unexpectedly high and complex importance to local communities. This has direct implications for potential developments within the region such as resettlement programmes, logging or implementation of large-scale commercial agriculture. Hopefully these results will contribute to a better understanding of such remote and marginalized local communities, help raise awareness of their needs, and thus lead to more balanced decisions concerning the management and use of forest resources within the wider region.
In the main report there is considerable expansion on the implications of the results for the Pelancau people. Just as importantly, there is a detailed discussion of the strengths and weaknesses of the approach. In particular, recommendations for improving the method and approach are made.
ixLivelihoods, land types and the importance of ecosystem goods and services:developing a predictive understanding of landscape valuation by the Punan Pelancau people of East Kalimantan
Table of ContentsTable of Contents
Executive Summary ii
Abbreviations xi
Introduction 1
Study Area 3
Approach and Methods 6 Conceptual model 6 Community assessment of importance 6 Field sampling 7 Modelling and spatial analyses 8
Results 13 Community assessments 13 Model confrontations and spatial analyses 31
Implications for the Pelancau People 40
Evaluating the Process 42 Context 42 Overall approach 44 Community data 45 Field sampling 47 Models and spatial analyses 49
Conclusions 52 Suggested future research activities 53
Acknowledgements 54
References 55
Appendices 57 Appendix 1. Field data sheets 57 Appendix 2. Goods and services derived from different land types of the upstream (hulu) area 58
List of FiguresFigure 1. Location of the study area 4Figure 2. Two-dimensional plots of the data 9Figure 3. Correlation between krigged surfaces of several variables 10Figure 4. Area used for the model analysis 11
x Livelihoods, land types and the importance of ecosystem goods and services:developing a predictive understanding of landscape valuation by the Punan Pelancau people of East Kalimantan
Figure 5. Photograph of the grid-cell map 12Figure 6. BBN with case file 32Figure 7. Correlation plot of the predicted model value against the observed field
enumerator value 34Figure 8. Three-dimensional view of the output of the simplified model 35Figure 9. Difference between krigged surface of scores allocated to field samples
in the field and the final model estimated importance scores 36Figure 10. Prediction of the importance score for the entire region using alternative model 37Figure 11. Correlation between the scores given to each grid cell for likelihood of success in
procuring resources and the difficulty of accessing resources and the mean field sample value scores 37Figure 12. Correlation between the scores given to each grid cell for the difficulty of accessing resources and the mean field sample value scores 38Figure 13. Maps of the grid cell values related to success in procuring resources 38Figure 14. Map showing grid-cell values for difficulty of accessing resources in each cell 39Figure 15. Stylised example of a quadtree data structure 51
List of Tables Table 1. Groups of goods and services used in the statistical models 7Table 2. Number of field samples occurring in each of the grid cells 11Table 3. Major periods, events and changes in livelihood conditions
during the recent history of the Pelancau people 14Table 4. Major livelihood activities and their relative importance
to the well-being of the Pelancau people 15Table 5. Seasonal timing of the principal activities carried out
for the production of dryland rice 16Table 6. Factors determining the selection of fields at Lio Mutai and Metut 16Table 7. Current prices (per kg) for different grades of eaglewood offered
in Lio Mutai and at Long Loreh 18Table 8. Timber species used for construction of houses and boats 20Table 9. Places that are important to the well-being of the Pelancau people
of Lio Mutai and Metut 21Table 10. Land types of the upstream (hulu) area in scores based on Long Loreh CAT 22Table 11. Land types of the upstream (hulu) area in scores based on Lio Mutai CAT 23Table 12. Relative importance of land types of the upstream (hulu) area and other scores
based on Long Loreh and Lio Mutai CATs 24Table 13. Factors that may influence the relative importance scores assigned
to goods and services from each land type 25Table 14. Constraints on the use of resources from a given landscape unit
based on Long Loreh CAT 26Table 15. Constraints on the use of resources from a given landscape unit based on Lio Mutai CAT 26Table 16. Modes of transport used by people from Lio Mutai and Metut,
and their relative importance in terms of their overall well-being 27Table 17. Estimated times taken to move from and to Lio Mutai 28Table 18. Details of known burial sites for Pelancau people, situated at
or upstream of Lio Mutai 29Table 19. Principal sources of income indentified in scoring exercises 29Table 20. Principal forms of expenditure in scoring exercises 30
xiLivelihoods, land types and the importance of ecosystem goods and services:developing a predictive understanding of landscape valuation by the Punan Pelancau people of East Kalimantan
Table 21. Positive and negative factors likely to determine the future of the Pelancau people, and their relative importance 31
Table 22. Goods and services derived from upstream intact forest areas (hutan rimba) 47 Table 23. Goods and services derived from upstream navigable rivers (sungai besar) 58Table 24. Goods and services derived from upstream small rivers (sungai kecil) 59Table 25. Goods and services derived from upstream fields (ladang) 60Table 26. Goods and services derived from upstream village areas (kampung) 61Table 27. Goods and services derived from upstream logged forest areas (hutan loging) 61Table 28. Goods and services provided by upstream old field areas (jekau) 62Table 29. Goods and services derived from upstream forest or coal mining
concession areas (wilayah perusahaan) 62Table 30. Goods and services derived from upstream depositional areas
on large rivers (andras) 63Table 31. Goods and services derived from upstream mountain forest areas (hutan gunung) 63Table 32. Goods and services derived from upstream abandoned village areas (lepuun) 64Table 33. Goods and services derived from upstream logging roads (jalan perusahaan) 64Table 34. Goods and services derived from upstream salt springs (air asin) 65Table 35. Goods and services derived from swamp forest areas (hutan rawa) 65
List of Text BoxesBox 1. GLM results for best fit model of score assigned to landscape unit
for those owning boats 33Box 2. GLM results for most useful model of score assigned to landscape unit
for those owning boats 33Box 3. GLM results of predicted model output against observed field value 34

xii Livelihoods, land types and the importance of ecosystem goods and services:developing a predictive understanding of landscape valuation by the Punan Pelancau people of East Kalimantan
Abbreviations
ACM Adaptive Co-Management
BBN Bayesian Belief Network
BKKBN Badan Koordinasi Keluarga Berencana Nasional
CAT Community Assessment Team
CIFOR Center for International Forestry Research
GIS Geographic Information System
GLM General Linear Model
IDW Inverse Distance Weight
MLA Multidisciplinary Landscape Assessment
RIW Relative Importance Weight
RIWC Cumulative Standardised Relative Importance Weight
RIWS Standardised Relative Importance Weight
Abbreviations
1Livelihoods, land types and the importance of ecosystem goods and services:developing a predictive understanding of landscape valuation by the Punan Pelancau people of East Kalimantan
Introduction
Since 1996, three years after its establishment, CIFOR has developed a long-term multidisciplinary research program in the Malinau region of East Kalimantan. The broad objective is to provide policy-relevant information that will enable more informed, productive, sustainable and equitable decisions about the management and use of tropical forests. Or, more specifically, to contribute to achieving forest sustainability for a ‘large forest landscape’ in the humid tropics, where diverse, rapidly changing and often conflicting land use demands exist.
Earlier studies focused on gathering baseline information on the biophysical, social and economic situation of the area. More recently, attention has been given to documenting the biological wealth of the area. Rather than examining biodiversity in isolation, a conscious effort has been made to integrate it into a broader framework, such that its relevance to real decisions should be more directly apparent. Management decisions necessarily entail balancing biodiversity and conservation goals with other demands, and this requires an understanding of the values and preferences of all stakeholders, particularly local forest dependent communities.
The bulk of the biodiversity work has been carried out under the ‘Multidisciplinary Landscape Assessment’ or MLA (Sheil 2002; Sheil et al. 2003). The study had three main components: 1) finding out what occurs where, 2) assessing to whom it matters and in what way, and 3) identifying what steps are needed to maintain the biota in the future. A suite of methods was developed to identify and comprehend those
aspects of the landscape that were most significant in determining its importance to local communities, thus affording a better understanding of local priorities and the complex dependencies of local communities on forested landscapes (Sheil et al. 2003). Field activities combined biological and social aspects in order to determine not only what species and habitats were present, but also how local communities used and viewed them. This has enabled a richer understanding of local biodiversity, within the context of local people’s preferences, and can usefully contribute to the development of management plans and ‘principles of land-use planning’ that reflect local people’s views.
As part of its wider global objective of identifying how local users perceive and value landscapes, CIFOR had funded an associated short-term research project in Gorongosa National Park, Mozambique (Lynam et al. 2004). In this project a combination of participatory research methods, Bayesian probability modelling and spatial data analyses were used to generate and iteratively improve understanding of the factors determining the importance that local people assign to specific landscape elements or locations. Through developing a spatial map of the final benefit-cost model, it was possible to provide a predictive understanding of landscape unit importance across the two study areas where the work was carried out.
The purpose of the current study was to test and further improve the methods developed in Gorongosa, Mozambique, through application to the Malinau research area. The overall goal was
Introduction
2 Livelihoods, land types and the importance of ecosystem goods and services:developing a predictive understanding of landscape valuation by the Punan Pelancau people of East Kalimantan
to develop methods that allow values perceived by communities to be estimated quantitatively and extrapolated spatially with reference to landscape context, thus adding an important predictive spatial component to the biodiversity and landscape valuations generated in the earlier MLA studies. Key requirements were: 1) that the approach should be capable of including a range of values, including those associated with goods and services, potential land-uses, and less tangible views (spiritual, heritage, etc.); 2) that the presentation should be able to include not only generalised areas (landscape units), but also ‘sites’ with special values (e.g. birds’ nest caves, salt springs, gravesites, old villages, etc.); 3) that the approach should be readily adaptable to other communities and landscape contexts; and 4) that the system should be sufficiently flexible to readily
allow future modifications to reflect different data and/or changed understandings.
This report provides details on the community-based activities and field work, model development and spatial representations carried out under the study. It begins with a description of the study area (Section 2), and the methods employed (Section 3). This is followed by the results obtained (Section 4) and, thereafter, an evaluation of these results in terms of both their implications for local communities (Section 5), and a critical appraisal of the method (Section 6), in order to assess its effectiveness and whether or not it can be simply and cost-effectively extrapolated to other areas. In Section 7 we present some final conclusions and suggestions for future research activities.
3Livelihoods, land types and the importance of ecosystem goods and services:developing a predictive understanding of landscape valuation by the Punan Pelancau people of East Kalimantan
Study AreaStudy Area
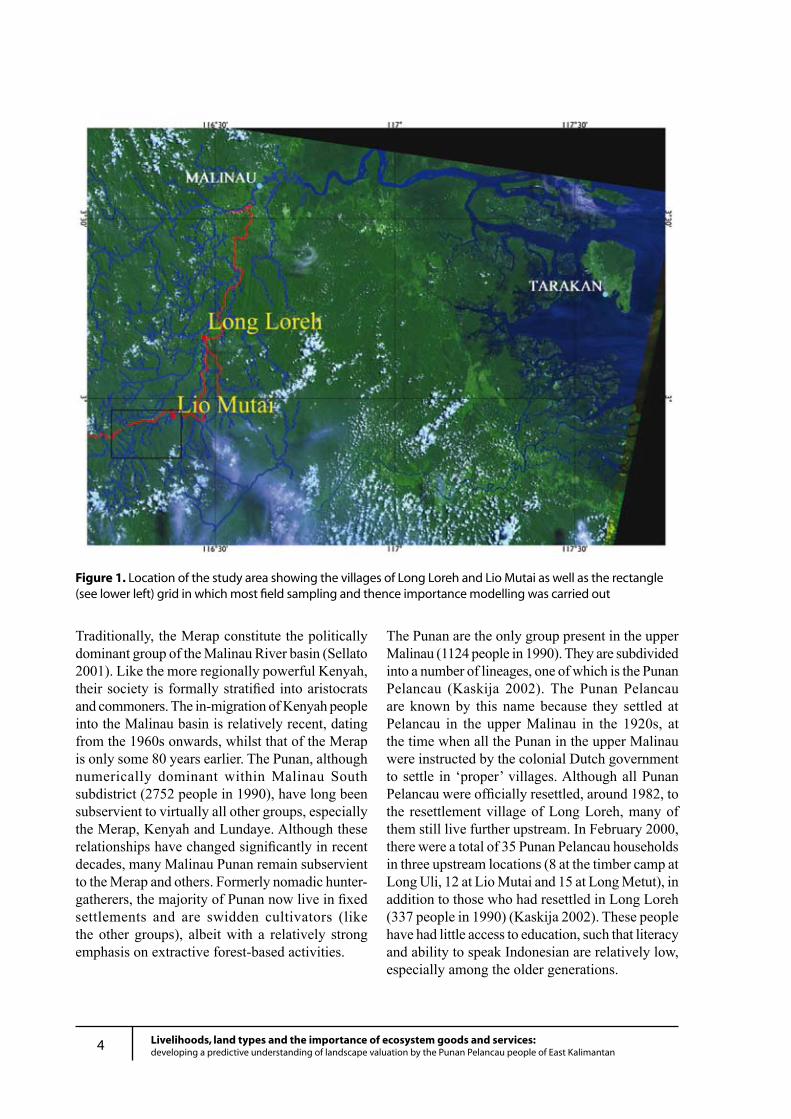
The study area forms part of the upper Malinau drainage in East Kalimantan. The Malinau River rises just to the east of Kayan Mentarang National Park and the highland watershed that forms the border between East Kalimantan and Malaysia. From here it drains some 120 km north-northeast to Malinau town, where it joins the Mentarang River, and then continues as the Sesayap River until it spills into the ocean near Tarakan, some 80 km to the east (Figure 1). The upper Malinau basin, from Lio Mutai upstream, is very sparsely settled (less than one inhabitant per km2), little developed (no schools or health facilities), and extremely difficult to access (by river only, although this is likely to change due to numerous new road developments).
The study area is dominated by rugged terrain, comprising seemingly endless hills and ridges, many of which are extremely narrow on top (a few metres or less in width). Flat land is restricted to minor occurrences of alluvial terraces along the Malinau River, particularly along the lower reaches, for example around Long Loreh. Altitude varies from about 100 to 700 m, mean annual rainfall is in the order of 4000 mm, and mean daily temperatures are about 26 to 27oC (Anonymous 1997 in: Basuki and Sheil 2005). Geologically the region is heterogeneous, comprising mainly old, weakly metamorphosed and sedimentary rocks (predominantly sandstones and siltstones in the Lio Mutai area), overlain in places by more recent volcanic formations. Soils are correspondingly diverse, although much of the potential heterogeneity is masked by deep weathering and leaching, such that fertility is consistently low (Basuki and Sheil
2005). The landscape is dominated by primary forest, with much smaller occurrences of fields and secondary forest. The area is unsuited to the development of large-scale plantations of crops such as oil palm, pepper, field rice, peanuts, cocoa, candlenuts, coffee or rubber (Basuki and Sheil 2005).
The Malinau region supports rich biological diversity, as documented in the review by Sheil (2002). Despite a number of recent surveys, mostly carried out under the auspices of the MLA, knowledge of most taxa remains partial. However, the lowland forests and associated river systems clearly provide a rich range of resources for local communities, including timber, construction materials, plant foods, wildlife, fish and medicines. Despite exploitation and modification of resources, through actions such as subsistence agriculture and, more recently, commercial timber extraction and coal mining, the majority of the region remains as primary forest.
The indigenous population in the South Malinau subdistrict (i.e. upriver from the Setulang confluence) numbered some 6338 people in 2001 (BKKBN, unpublished). This consists of several indigenous Dayak (hinterland) ethno-linguistic groups, including the Merap, Punan, Kenyah, Lundaye, Abai and several others (Kaskija 2002). There is a small but influential immigrant presence, particularly in the vicinity of Malinau town. In certain villages, the number of outsiders is growing rapidly, due to the reliance of most concession activities on a non-local workforce.
4 Livelihoods, land types and the importance of ecosystem goods and services:developing a predictive understanding of landscape valuation by the Punan Pelancau people of East Kalimantan
Traditionally, the Merap constitute the politically dominant group of the Malinau River basin (Sellato 2001). Like the more regionally powerful Kenyah, their society is formally stratified into aristocrats and commoners. The in-migration of Kenyah people into the Malinau basin is relatively recent, dating from the 1960s onwards, whilst that of the Merap is only some 80 years earlier. The Punan, although numerically dominant within Malinau South subdistrict (2752 people in 1990), have long been subservient to virtually all other groups, especially the Merap, Kenyah and Lundaye. Although these relationships have changed significantly in recent decades, many Malinau Punan remain subservient to the Merap and others. Formerly nomadic hunter-gatherers, the majority of Punan now live in fixed settlements and are swidden cultivators (like the other groups), albeit with a relatively strong emphasis on extractive forest-based activities.
The Punan are the only group present in the upper Malinau (1124 people in 1990). They are subdivided into a number of lineages, one of which is the Punan Pelancau (Kaskija 2002). The Punan Pelancau are known by this name because they settled at Pelancau in the upper Malinau in the 1920s, at the time when all the Punan in the upper Malinau were instructed by the colonial Dutch government to settle in ‘proper’ villages. Although all Punan Pelancau were officially resettled, around 1982, to the resettlement village of Long Loreh, many of them still live further upstream. In February 2000, there were a total of 35 Punan Pelancau households in three upstream locations (8 at the timber camp at Long Uli, 12 at Lio Mutai and 15 at Long Metut), in addition to those who had resettled in Long Loreh (337 people in 1990) (Kaskija 2002). These people have had little access to education, such that literacy and ability to speak Indonesian are relatively low, especially among the older generations.
Figure 1. Location of the study area showing the villages of Long Loreh and Lio Mutai as well as the rectangle (see lower left) grid in which most field sampling and thence importance modelling was carried out
5Livelihoods, land types and the importance of ecosystem goods and services:developing a predictive understanding of landscape valuation by the Punan Pelancau people of East Kalimantan
Land rights in the upper Malinau basin were, until recently, not a particularly significant or contentious issue. The non Punan groups appear to have had a strong sense of defensible territory, such that the Merap consider themselves to be the rightful owners of the whole upper Malinau basin though individual village boundaries appear to have been fuzzy. The Punan’s sense of territoriality has been much weaker, although they have had a definite sense of belonging to a particular tract of land. This has changed dramatically since the granting of village land to the Punan (wilayah desa), coupled with the establishment of various coal mining and timber operations, which have been required to pay compensation or concession fees to land owners, be they individuals or communities. Conflicts have also arisen from policies that have resulted in the resettlement of some communities from remoter areas in the same or neighbouring watersheds into more accessible areas that traditionally belong to other communities, as was the situation regarding the formal resettlement of the Punan Pelancau from the upper Malinau to Long Loreh (together with the Kenyah who came to Long Loreh from the Bahau area, which is situated further to the west outside the Malinau basin).
Against this background, the Punan Pelancau lay claim to what appears to be a relatively clearly
defined traditional territory in the upper Malinau, covering some 500 km2 between the Bahau and Hung Rivers and centred on the drainages of the Menoreh and Mekayan. The current settlements at Metut, Lio Mutai and Long Uli are, however, all situated outside of this territory, between 8 and 15 km further downstream, and within territories claimed by other Punan groups. The Long Loreh community, which comprises the largest grouping of the Punan Pelancau, is situated roughly 30 km further downstream. The members at Long Loreh feel distinctly disadvantaged, particularly in terms of access to land for agriculture around the village. All Pelancau groups make extensive use of the traditional territory for the harvesting of natural resources, and are thus familiar with the area. When viewed on a map, however, this region is empty of any settlements, and is thus a good example of a tropical forest landscape that centralised decision makers may consider unowned and unvalued.
Preliminary field work was done with the Punan Pelancau community at Long Loreh. However, for the development of the model and GIS spatial representation it was decided to focus on the upstream traditional area in the upper Malinau. Subsequent field sampling was thus carried out from Lio Mutai, extending along the Malinau River from Lio Mutai to the Menoreh River.
6 Livelihoods, land types and the importance of ecosystem goods and services:developing a predictive understanding of landscape valuation by the Punan Pelancau people of East Kalimantan
Approach and Methods Approach and Methods
The desired output was a map showing how importance attributed to the landscape by local communities varied with location in a rugged tropical forest landscape in East Kalimantan. To achieve this objective we adapted and evaluated methods developed in Mozambique for a dry Southern African landscape (Lynam et al. 2004). Maps were generated from a variety of data using statistical modelling and standard spatial interpolation processes. Data collection was carried out over two field trips during the last quarter of 2003.
The approach was iterative. First we developed a general conceptual model of landscape unit importance; next we clarified what was important to the community. We then developed an initial (uncalibrated) model combining the conceptual model and the main importance categories of community assessment. Field data was then gathered to confront and calibrate the model. The calibrated model was used to estimate the importance score across the landscape maps and then these estimates were evaluated using independent data generated by field surveys.
In addition, a new approach to the assessment of landscape importance, the ‘grid-cell method’, was developed and tested for comparison.
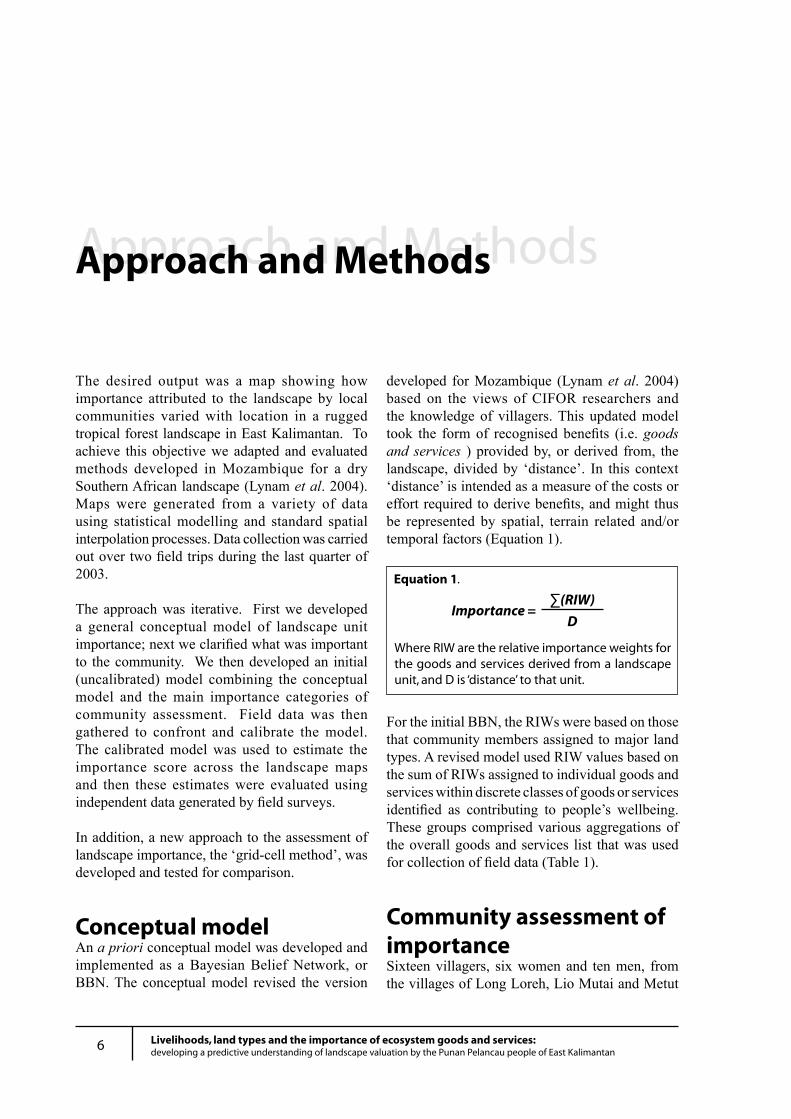
Conceptual modelAn a priori conceptual model was developed and implemented as a Bayesian Belief Network, or BBN. The conceptual model revised the version
developed for Mozambique (Lynam et al. 2004) based on the views of CIFOR researchers and the knowledge of villagers. This updated model took the form of recognised benefits (i.e. goods and services ) provided by, or derived from, the landscape, divided by ‘distance’. In this context ‘distance’ is intended as a measure of the costs or effort required to derive benefits, and might thus be represented by spatial, terrain related and/or temporal factors (Equation 1).
Where RIW are the relative importance weights for the goods and services derived from a landscape unit, and D is ‘distance’ to that unit.
Equation 1.
Importance =∑(RIW)
D
For the initial BBN, the RIWs were based on those that community members assigned to major land types. A revised model used RIW values based on the sum of RIWs assigned to individual goods and services within discrete classes of goods or services identified as contributing to people’s wellbeing. These groups comprised various aggregations of the overall goods and services list that was used for collection of field data (Table 1).
Community assessment of importanceSixteen villagers, six women and ten men, from the villages of Long Loreh, Lio Mutai and Metut
7Livelihoods, land types and the importance of ecosystem goods and services:developing a predictive understanding of landscape valuation by the Punan Pelancau people of East Kalimantan
were selected by their village peers to represent these communities, and to report the results of the research back to other community members. These Community Assessment Team (CAT) members were paid a daily allowance of Rp25,000 (roughly US$3.00) per person for their participation. A preparatory field data collection process was conducted over a 10 day period from 25 September to 4 October 2003 in Long Loreh. Community activities and field sampling were carried out over a 13 day period from 10-22 November 2003.
Group meetings were predominantly conducted in Indonesian, and this was the language used for recording information on flip charts as well as for general discussions. Some Punan informants were less comfortable with Indonesian, and used their local language, particularly when discussing more complicated issues. Few of the community members were able to write. None of the facilitators had a good grasp of the local Punan language, although some could follow the gist of some conversations. The CIFOR facilitators translated all findings from Indonesian into English for the benefit of the two external researchers.
Various baseline community data, such as local needs and the perceived relative importance of specific goods and services, were elicited using smaller sub-groups and a mixture of spidergrams (Lynam 1999; 2001) and tables. Results were validated in group discussions usually involving the entire CAT. For each land type the goods and services derived from that land type were identified and then scored in terms of their relative importance to the well being of an average household in the
community. An open ended scoring approach was used, in which the least important good or service was assigned a score of one, and thereafter each factor was scored relative to this least important factor.
Field samplingThe purpose of the field sampling was to generate data with which to test and revise the initial model. The field data sheet was based on previous experience in Mozambique and revised to incorporate suggestions put forward by the CAT during initial consultations, including translation into Indonesian. The first section captured information regarding the recorder, sample number, date, location and GPS co-ordinates of the sample. Next came assessments of key environmental attributes: land type, vegetation type, slope/topography and soil fertility. This was followed by a list of 18 goods and services, each of which was rated according to four categories (none, poor, moderate and good). The next component was concerned with time efforts and costs required to reach the sample point; the occurrence of any regulatory or physical barriers; and whether or not a boat or any other equipment was required in order to harvest the various resources within the sample area. This assessment included distance categories (close, moderate, far, very far) and different modes of transport (boat, path, off path, road). The final section elicited an overall landscape importance score, together with notes explaining the reasons and rationale (or any other aspects requiring further explanation). As boats provided an important and often crucial form of transport, it was important to enable responses to this question from the twin perspectives of those in the community who had boats versus those who did not. Provision was therefore made for the allocation of two landscape unit importance scores: one assuming access to a boat, and the other without.
Prior to the actual sampling, the data sheet was first presented and discussed, in order to familiarise CAT members and facilitators with its contents. Two training sites were used to familiarise the CAT with the process as well as to better standardise their perceptions of resource and distance scores and scoring.
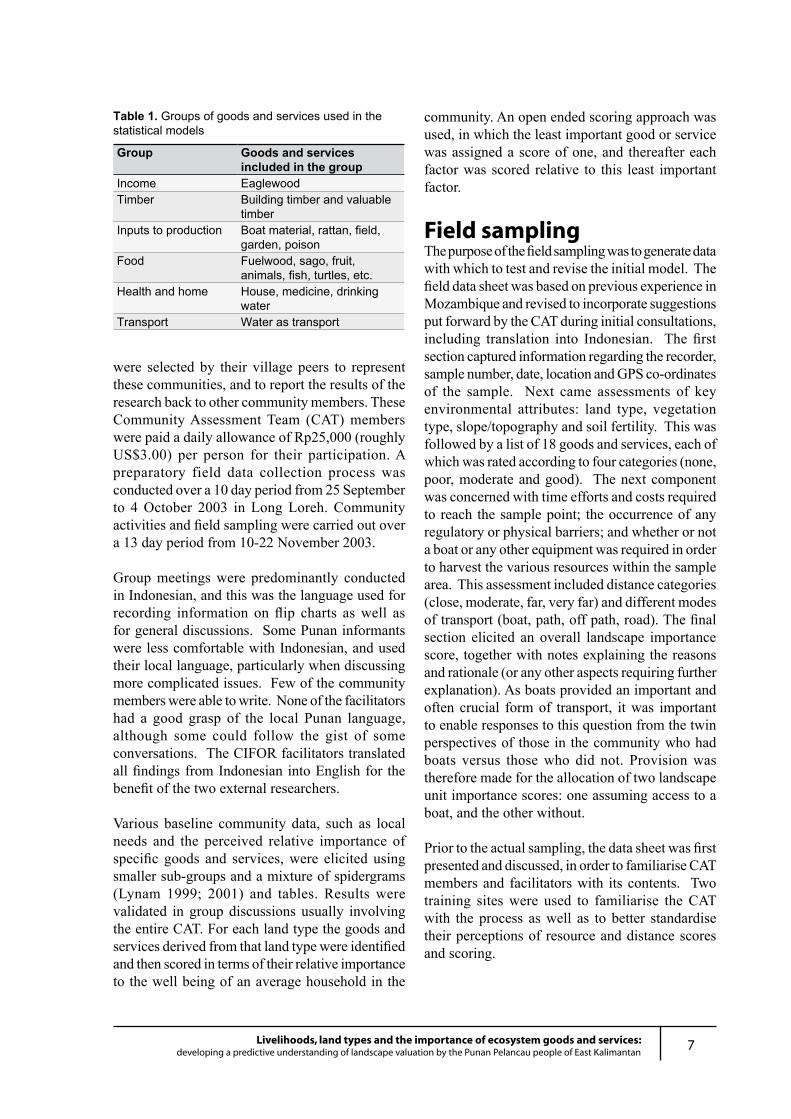
Table 1. Groups of goods and services used in the statistical models
Group Goods and services included in the group
Income EaglewoodTimber Building timber and valuable
timberInputs to production Boat material, rattan, field,
garden, poisonFood Fuelwood, sago, fruit,
animals, fish, turtles, etc.Health and home House, medicine, drinking
waterTransport Water as transport
8 Livelihoods, land types and the importance of ecosystem goods and services:developing a predictive understanding of landscape valuation by the Punan Pelancau people of East Kalimantan
Sampling teams comprised four CAT members, including at least one woman, plus one or two facilitators from the CIFOR research team. CAT members who had extensive knowledge of the landscape were distributed evenly among the teams.
The sample area was a circle with an approximately 25 m radius (i.e. 0.2 ha), the extent of which was estimated by pacing on the ground. No formal adjustment was made for slope. This size was considered large enough to capture most key resources present at any particular site, while also being sufficiently small to allow CAT members to assess the site prior to any scoring. Some samples were located on very steep slopes, whilst in other places movement was severely hindered by the presence of thick undergrowth.
Having surveyed the sample area, the CAT members would assemble at a central point, preferably with a view over the plot, and continue with the scoring. Consensus scores were sought for all variables through facilitated discussion and agreement, and entered on the data sheet by the facilitator. If the presence of a given resource was disputed this was physically checked. Scores of importance were based on the views of CAT members alone. Scoring of landscape importance was based on a scale of 1 (least important and associated with a known and agreed unimportant location) to 100 (most important and again associated with a commonly known and agreed location of high value).
At the end of each day the teams came together to present, compare and discuss results and difficulties.
The target region selected was the villages of Lio Mutai and Metut and their surrounds, plus the upstream traditional territory of the Pelancau Punan. The placement of samples was strongly constrained by logistics and difficult access. To reach any part of the upstream target area it was necessary to travel a considerable distance by boat. Under favourable conditions it took roughly one hour to travel up the Malinau and reach the closest point at the mouth of the Bahau River, and four hours to reach the Menoreh towards the other end of the sample area. Moreover, due to the extremely steep terrain, the furthest point from the river reached by sampling
teams was less than 3 km, although in some places the territory extended to more than 20 km away from the river. Use of a vehicle from the timber company at Long Uli was negotiated for one day, enabling a limited number of samples near the main access road further to the north of the river. The river flooded on two occasions ruling out upstream travel for several days.
Each day’s sampling was planned in advance. For each sampling excursion, each team was given a pre-defined site for the initial sample, together with a plan for the land type (or types) to be targeted, and a strategy for the actual placement of subsequent plots. This strategy usually entailed walking in a pre-decided direction, or along a pre-decided route (for example following a small river or ridge), and sampling after a pre-decided length of time or a pre-decided distance. In practice, given the various logistical challenges encountered, teams were often required to improvise and use their best judgement according to the situation. Working in this manner, each group managed between two and eight samples per day. Altogether, a total of 113 plots were achieved, 67 of which were situated within the upstream territory, and the remaining 47 in the vicinity of Lio Mutai and Metut. All ladang (cultivated field) samples were obtained from near to the villages of Lio Mutai and Metut, since the upstream territory lacks any cultivation.
Modelling and spatial analysesInitial confrontation of the BBN with field data indicated that the model was a poor representation of the determinants of landscape unit importance. The representation of importance scores, as expressed in Equation 1, appeared inadequate to describe the complexity observed in the field (Figure 2). The degree of error (observed compared to expected importance) identified using confusion matrices (Fielding and Bell 1997) always exceeded 78%. Different modeling approaches were therefore examined, in an attempt to improve our understanding of the spatial relationships underlying the observed importance scores.
Several general linear models (GLMs) were developed to express the relationships implied by the conceptual model. These models took the form
9Livelihoods, land types and the importance of ecosystem goods and services:developing a predictive understanding of landscape valuation by the Punan Pelancau people of East Kalimantan
Y = a + b*X. Stepwise linear models were used to identify and select the best fit models. Based on these explorations more realistic and hence useful models were defined, refined and used in our final analysis.
Each of the general linear models was developed using the same randomly selected 80% of field sample data (i.e. a core data set of 90 samples). The remaining 20% of the data (i.e. the independent data set of 23 samples) was removed from the data set prior to model development. This independent data set was used for all model confrontations and testing.
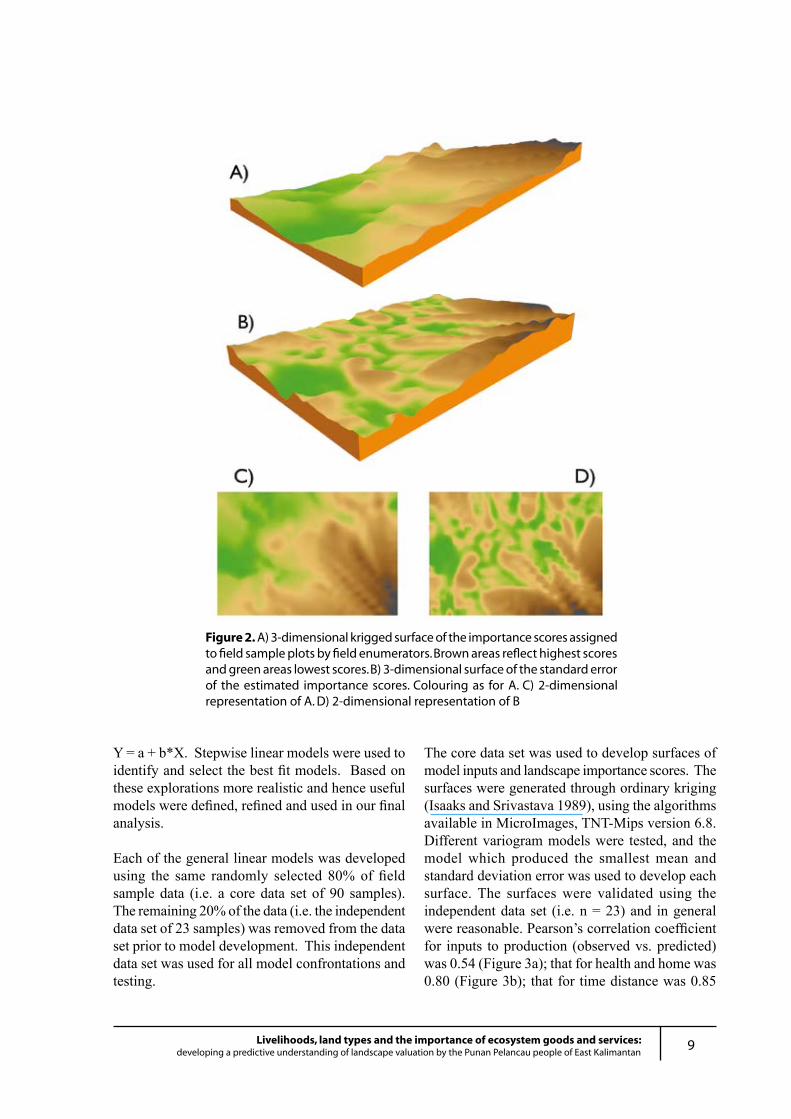
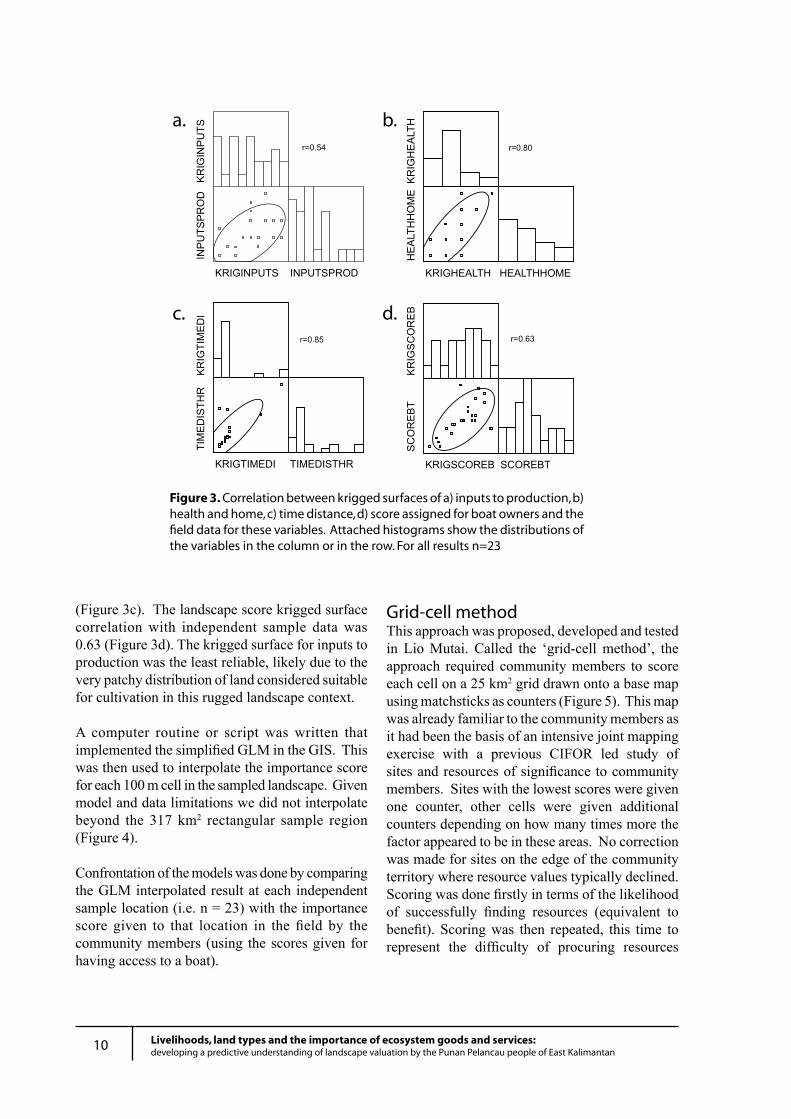
The core data set was used to develop surfaces of model inputs and landscape importance scores. The surfaces were generated through ordinary kriging (Isaaks and Srivastava 1989), using the algorithms available in MicroImages, TNT-Mips version 6.8. Different variogram models were tested, and the model which produced the smallest mean and standard deviation error was used to develop each surface. The surfaces were validated using the independent data set (i.e. n = 23) and in general were reasonable. Pearson’s correlation coefficient for inputs to production (observed vs. predicted) was 0.54 (Figure 3a); that for health and home was 0.80 (Figure 3b); that for time distance was 0.85
Figure 2. A) 3-dimensional krigged surface of the importance scores assigned to field sample plots by field enumerators. Brown areas reflect highest scores and green areas lowest scores. B) 3-dimensional surface of the standard error of the estimated importance scores. Colouring as for A. C) 2-dimensional representation of A. D) 2-dimensional representation of B
10 Livelihoods, land types and the importance of ecosystem goods and services:developing a predictive understanding of landscape valuation by the Punan Pelancau people of East Kalimantan
(Figure 3c). The landscape score krigged surface correlation with independent sample data was 0.63 (Figure 3d). The krigged surface for inputs to production was the least reliable, likely due to the very patchy distribution of land considered suitable for cultivation in this rugged landscape context.
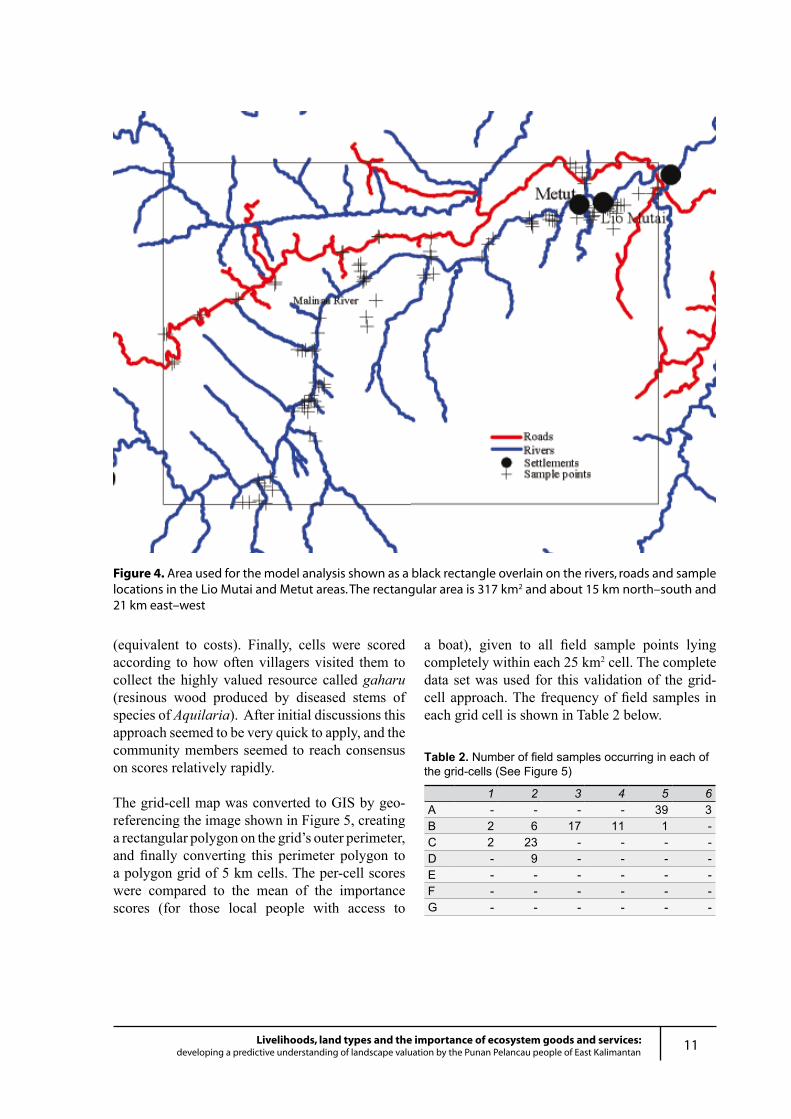
A computer routine or script was written that implemented the simplified GLM in the GIS. This was then used to interpolate the importance score for each 100 m cell in the sampled landscape. Given model and data limitations we did not interpolate beyond the 317 km2 rectangular sample region (Figure 4).
Confrontation of the models was done by comparing the GLM interpolated result at each independent sample location (i.e. n = 23) with the importance score given to that location in the field by the community members (using the scores given for having access to a boat).
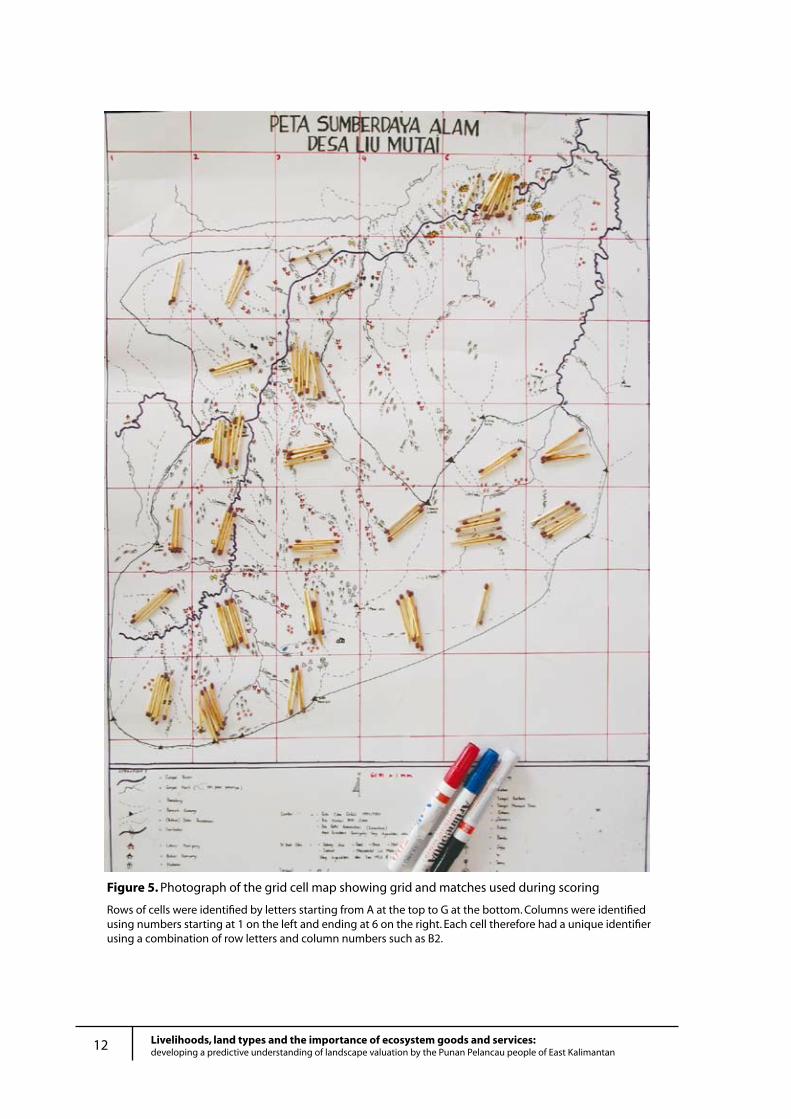
Grid-cell methodThis approach was proposed, developed and tested in Lio Mutai. Called the ‘grid-cell method’, the approach required community members to score each cell on a 25 km2 grid drawn onto a base map using matchsticks as counters (Figure 5). This map was already familiar to the community members as it had been the basis of an intensive joint mapping exercise with a previous CIFOR led study of sites and resources of significance to community members. Sites with the lowest scores were given one counter, other cells were given additional counters depending on how many times more the factor appeared to be in these areas. No correction was made for sites on the edge of the community territory where resource values typically declined. Scoring was done firstly in terms of the likelihood of successfully finding resources (equivalent to benefit). Scoring was then repeated, this time to represent the difficulty of procuring resources
Figure 3. Correlation between krigged surfaces of a) inputs to production, b) health and home, c) time distance, d) score assigned for boat owners and the field data for these variables. Attached histograms show the distributions of the variables in the column or in the row. For all results n=23
a.
c.
r=0.54
b.
d.
r=0.80
r=0.63
11Livelihoods, land types and the importance of ecosystem goods and services:developing a predictive understanding of landscape valuation by the Punan Pelancau people of East Kalimantan
(equivalent to costs). Finally, cells were scored according to how often villagers visited them to collect the highly valued resource called gaharu (resinous wood produced by diseased stems of species of Aquilaria). After initial discussions this approach seemed to be very quick to apply, and the community members seemed to reach consensus on scores relatively rapidly.
The grid-cell map was converted to GIS by geo-referencing the image shown in Figure 5, creating a rectangular polygon on the grid’s outer perimeter, and finally converting this perimeter polygon to a polygon grid of 5 km cells. The per-cell scores were compared to the mean of the importance scores (for those local people with access to
a boat), given to all field sample points lying completely within each 25 km2 cell. The complete data set was used for this validation of the grid-cell approach. The frequency of field samples in each grid cell is shown in Table 2 below.
Figure 4. Area used for the model analysis shown as a black rectangle overlain on the rivers, roads and sample locations in the Lio Mutai and Metut areas. The rectangular area is 317 km2 and about 15 km north–south and 21 km east–west
Table 2. Number of field samples occurring in each of the grid-cells (See Figure 5)
1 2 3 4 5 6A - - - - 39 3B 2 6 17 11 1 -C 2 23 - - - -D - 9 - - - -E - - - - - -F - - - - - -G - - - - - -
12 Livelihoods, land types and the importance of ecosystem goods and services:developing a predictive understanding of landscape valuation by the Punan Pelancau people of East Kalimantan
Figure 5. Photograph of the grid cell map showing grid and matches used during scoring
Rows of cells were identified by letters starting from A at the top to G at the bottom. Columns were identified using numbers starting at 1 on the left and ending at 6 on the right. Each cell therefore had a unique identifier using a combination of row letters and column numbers such as B2.
13Livelihoods, land types and the importance of ecosystem goods and services:developing a predictive understanding of landscape valuation by the Punan Pelancau people of East Kalimantan
ResultsResults
Community assessmentsThe key data derived through the community assessments were the identification and valuation of land types, the goods and services associated with each of these, and the identification and elucidation of potential cost factors that serve to make access to resources more difficult. These results directly informed the development of the models. The considerable volume of additional data provides important context for understanding and evaluating these key aspects. Additional data collected at Long Loreh, concerning the identification of land types and associated goods and services for the downstream Long Loreh area (Lynam et al. 2003), are not presented here since they make no direct contribution to the understanding of the upstream area which was the focus for the modelling and spatial analyses.
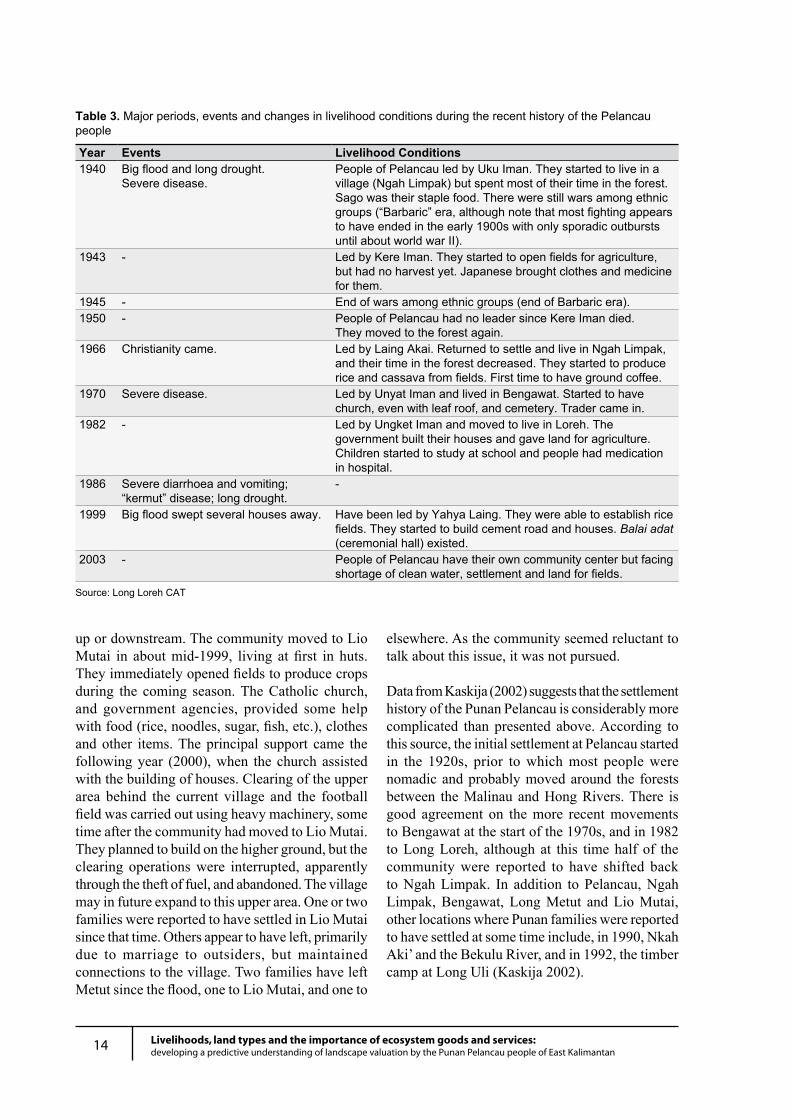
Historical events and timelineThe traditional leader of the Pelancau people developed a recent historical timeline in which the major periods and events of the community were identified (Table 3). During this period, from 1940 to the present, the Pelancau community have seen dramatic changes, including: the end of tribal wars, settling in villages, starting to grow field crops and switching diet from sago to rice, traders coming to sell products in their villages, the introduction of Christianity, and the start of schools and hospitals, principally in Long Loreh, collectively amounting to a steady increase in quality of life.
Additional details were obtained in Lio Mutai. According to the Lio Mutai CAT, the Punan
Pelancau were originally settled in Ngah Limpak. However, the terrain there was said to be very steep, such that it was not good for houses or fields. Wanting to find somewhere easier to live, the community shifted to Keramu in 1994. Another reason for shifting to Keramu was to be closer to the hospital at Long Loreh, since the community had experienced a lot of deaths due to disease at Ngah Limpak.
In February 1999 the entire Keramu village was swept away by a huge flood. Metut was also affected but less drastically, losing four houses. People managed to escape up the hill behind the village, but virtually everything else was lost. In addition to the houses, many dogs, chickens, boats (four from Keramu, two from Metut), boat engines, satellite dishes, sewing machines, ceremonial jars, and all other household items were lost.
Following the flood, the people of Keramu initially constructed temporary shelters or pondok, where they stayed for about a week. Thereafter, they shifted to the Roindo timber concession camp near Long Uli, where they stayed for two or three months, before moving to Lio Mutai. In Metut, some of those who had lost their houses were accommodated within the remaining three houses, whilst others slept in the church. The houses that were destroyed were later rebuilt within the village.
The Keramu community say they had little choice where to settle. Not willing to rebuild at Keramu, and having lost their boats and engines, it was difficult to consider moving any considerable distance either
14 Livelihoods, land types and the importance of ecosystem goods and services:developing a predictive understanding of landscape valuation by the Punan Pelancau people of East Kalimantan
up or downstream. The community moved to Lio Mutai in about mid-1999, living at first in huts. They immediately opened fields to produce crops during the coming season. The Catholic church, and government agencies, provided some help with food (rice, noodles, sugar, fish, etc.), clothes and other items. The principal support came the following year (2000), when the church assisted with the building of houses. Clearing of the upper area behind the current village and the football field was carried out using heavy machinery, some time after the community had moved to Lio Mutai. They planned to build on the higher ground, but the clearing operations were interrupted, apparently through the theft of fuel, and abandoned. The village may in future expand to this upper area. One or two families were reported to have settled in Lio Mutai since that time. Others appear to have left, primarily due to marriage to outsiders, but maintained connections to the village. Two families have left Metut since the flood, one to Lio Mutai, and one to
elsewhere. As the community seemed reluctant to talk about this issue, it was not pursued.
Data from Kaskija (2002) suggests that the settlement history of the Punan Pelancau is considerably more complicated than presented above. According to this source, the initial settlement at Pelancau started in the 1920s, prior to which most people were nomadic and probably moved around the forests between the Malinau and Hong Rivers. There is good agreement on the more recent movements to Bengawat at the start of the 1970s, and in 1982 to Long Loreh, although at this time half of the community were reported to have shifted back to Ngah Limpak. In addition to Pelancau, Ngah Limpak, Bengawat, Long Metut and Lio Mutai, other locations where Punan families were reported to have settled at some time include, in 1990, Nkah Aki’ and the Bekulu River, and in 1992, the timber camp at Long Uli (Kaskija 2002).
Table 3. Major periods, events and changes in livelihood conditions during the recent history of the Pelancau people
Year Events Livelihood Conditions1940 Big flood and long drought.
Severe disease.People of Pelancau led by Uku Iman. They started to live in a village (Ngah Limpak) but spent most of their time in the forest. Sago was their staple food. There were still wars among ethnic groups (“Barbaric” era, although note that most fighting appears to have ended in the early 1900s with only sporadic outbursts until about world war II).
1943 - Led by Kere Iman. They started to open fields for agriculture, but had no harvest yet. Japanese brought clothes and medicine for them.
1945 - End of wars among ethnic groups (end of Barbaric era).1950 - People of Pelancau had no leader since Kere Iman died.
They moved to the forest again.1966 Christianity came. Led by Laing Akai. Returned to settle and live in Ngah Limpak,
and their time in the forest decreased. They started to produce rice and cassava from fields. First time to have ground coffee.
1970 Severe disease. Led by Unyat Iman and lived in Bengawat. Started to have church, even with leaf roof, and cemetery. Trader came in.
1982 - Led by Ungket Iman and moved to live in Loreh. The government built their houses and gave land for agriculture. Children started to study at school and people had medication in hospital.
1986 Severe diarrhoea and vomiting; “kermut” disease; long drought.
-
1999 Big flood swept several houses away. Have been led by Yahya Laing. They were able to establish rice fields. They started to build cement road and houses. Balai adat (ceremonial hall) existed.
2003 - People of Pelancau have their own community center but facing shortage of clean water, settlement and land for fields.
Source: Long Loreh CAT
15Livelihoods, land types and the importance of ecosystem goods and services:developing a predictive understanding of landscape valuation by the Punan Pelancau people of East Kalimantan
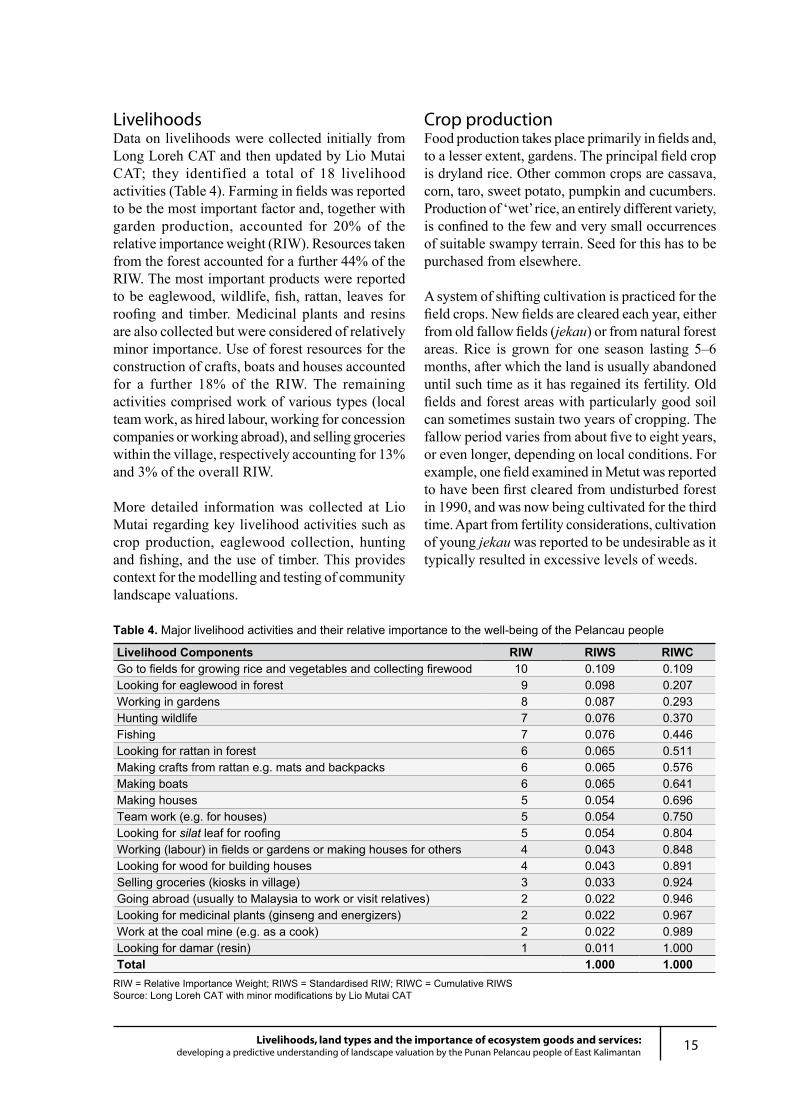
LivelihoodsData on livelihoods were collected initially from Long Loreh CAT and then updated by Lio Mutai CAT; they identified a total of 18 livelihood activities (Table 4). Farming in fields was reported to be the most important factor and, together with garden production, accounted for 20% of the relative importance weight (RIW). Resources taken from the forest accounted for a further 44% of the RIW. The most important products were reported to be eaglewood, wildlife, fish, rattan, leaves for roofing and timber. Medicinal plants and resins are also collected but were considered of relatively minor importance. Use of forest resources for the construction of crafts, boats and houses accounted for a further 18% of the RIW. The remaining activities comprised work of various types (local team work, as hired labour, working for concession companies or working abroad), and selling groceries within the village, respectively accounting for 13% and 3% of the overall RIW.
More detailed information was collected at Lio Mutai regarding key livelihood activities such as crop production, eaglewood collection, hunting and fishing, and the use of timber. This provides context for the modelling and testing of community landscape valuations.
Crop productionFood production takes place primarily in fields and, to a lesser extent, gardens. The principal field crop is dryland rice. Other common crops are cassava, corn, taro, sweet potato, pumpkin and cucumbers. Production of ‘wet’ rice, an entirely different variety, is confined to the few and very small occurrences of suitable swampy terrain. Seed for this has to be purchased from elsewhere.
A system of shifting cultivation is practiced for the field crops. New fields are cleared each year, either from old fallow fields (jekau) or from natural forest areas. Rice is grown for one season lasting 5–6 months, after which the land is usually abandoned until such time as it has regained its fertility. Old fields and forest areas with particularly good soil can sometimes sustain two years of cropping. The fallow period varies from about five to eight years, or even longer, depending on local conditions. For example, one field examined in Metut was reported to have been first cleared from undisturbed forest in 1990, and was now being cultivated for the third time. Apart from fertility considerations, cultivation of young jekau was reported to be undesirable as it typically resulted in excessive levels of weeds.
Table 4. Major livelihood activities and their relative importance to the well-being of the Pelancau people
Livelihood Components RIW RIWS RIWCGo to fields for growing rice and vegetables and collecting firewood 10 0.109 0.109Looking for eaglewood in forest 9 0.098 0.207Working in gardens 8 0.087 0.293Hunting wildlife 7 0.076 0.370Fishing 7 0.076 0.446Looking for rattan in forest 6 0.065 0.511Making crafts from rattan e.g. mats and backpacks 6 0.065 0.576Making boats 6 0.065 0.641Making houses 5 0.054 0.696Team work (e.g. for houses) 5 0.054 0.750Looking for silat leaf for roofing 5 0.054 0.804Working (labour) in fields or gardens or making houses for others 4 0.043 0.848Looking for wood for building houses 4 0.043 0.891Selling groceries (kiosks in village) 3 0.033 0.924Going abroad (usually to Malaysia to work or visit relatives) 2 0.022 0.946Looking for medicinal plants (ginseng and energizers) 2 0.022 0.967Work at the coal mine (e.g. as a cook) 2 0.022 0.989Looking for damar (resin) 1 0.011 1.000Total 1.000 1.000
RIW = Relative Importance Weight; RIWS = Standardised RIW; RIWC = Cumulative RIWSSource: Long Loreh CAT with minor modifications by Lio Mutai CAT
16 Livelihoods, land types and the importance of ecosystem goods and services:developing a predictive understanding of landscape valuation by the Punan Pelancau people of East Kalimantan
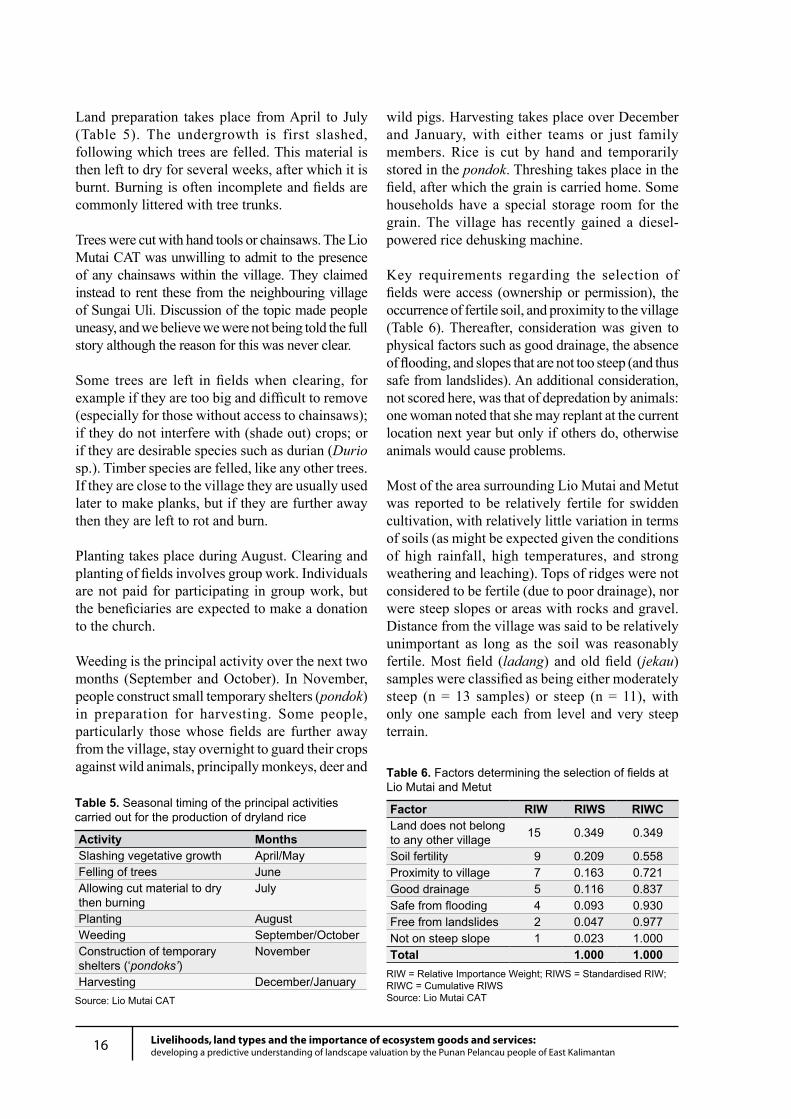
Land preparation takes place from April to July (Table 5). The undergrowth is first slashed, following which trees are felled. This material is then left to dry for several weeks, after which it is burnt. Burning is often incomplete and fields are commonly littered with tree trunks.
Trees were cut with hand tools or chainsaws. The Lio Mutai CAT was unwilling to admit to the presence of any chainsaws within the village. They claimed instead to rent these from the neighbouring village of Sungai Uli. Discussion of the topic made people uneasy, and we believe we were not being told the full story although the reason for this was never clear.
Some trees are left in fields when clearing, for example if they are too big and difficult to remove (especially for those without access to chainsaws); if they do not interfere with (shade out) crops; or if they are desirable species such as durian (Durio sp.). Timber species are felled, like any other trees. If they are close to the village they are usually used later to make planks, but if they are further away then they are left to rot and burn.
Planting takes place during August. Clearing and planting of fields involves group work. Individuals are not paid for participating in group work, but the beneficiaries are expected to make a donation to the church.
Weeding is the principal activity over the next two months (September and October). In November, people construct small temporary shelters (pondok) in preparation for harvesting. Some people, particularly those whose fields are further away from the village, stay overnight to guard their crops against wild animals, principally monkeys, deer and
wild pigs. Harvesting takes place over December and January, with either teams or just family members. Rice is cut by hand and temporarily stored in the pondok. Threshing takes place in the field, after which the grain is carried home. Some households have a special storage room for the grain. The village has recently gained a diesel-powered rice dehusking machine.
Key requirements regarding the selection of fields were access (ownership or permission), the occurrence of fertile soil, and proximity to the village (Table 6). Thereafter, consideration was given to physical factors such as good drainage, the absence of flooding, and slopes that are not too steep (and thus safe from landslides). An additional consideration, not scored here, was that of depredation by animals: one woman noted that she may replant at the current location next year but only if others do, otherwise animals would cause problems.
Most of the area surrounding Lio Mutai and Metut was reported to be relatively fertile for swidden cultivation, with relatively little variation in terms of soils (as might be expected given the conditions of high rainfall, high temperatures, and strong weathering and leaching). Tops of ridges were not considered to be fertile (due to poor drainage), nor were steep slopes or areas with rocks and gravel. Distance from the village was said to be relatively unimportant as long as the soil was reasonably fertile. Most field (ladang) and old field (jekau) samples were classified as being either moderately steep (n = 13 samples) or steep (n = 11), with only one sample each from level and very steep terrain.
Table 5. Seasonal timing of the principal activities carried out for the production of dryland rice
Activity MonthsSlashing vegetative growth April/MayFelling of trees JuneAllowing cut material to dry then burning
July
Planting AugustWeeding September/OctoberConstruction of temporary shelters (‘pondoks’)
November
Harvesting December/JanuarySource: Lio Mutai CAT
Table 6. Factors determining the selection of fields at Lio Mutai and Metut
Factor RIW RIWS RIWCLand does not belong to any other village 15 0.349 0.349
Soil fertility 9 0.209 0.558Proximity to village 7 0.163 0.721Good drainage 5 0.116 0.837Safe from flooding 4 0.093 0.930Free from landslides 2 0.047 0.977Not on steep slope 1 0.023 1.000Total 1.000 1.000
RIW = Relative Importance Weight; RIWS = Standardised RIW; RIWC = Cumulative RIWSSource: Lio Mutai CAT
17Livelihoods, land types and the importance of ecosystem goods and services:developing a predictive understanding of landscape valuation by the Punan Pelancau people of East Kalimantan
Qualitative data were obtained concerning crop yields. In addition to soil fertility, other factors identified as influencing yields were pests (birds, monkeys, rats, deer and pigs) and insects (worms). Historically, poor rice yields were said to have been obtained during the years 2002 (due to pests) and 1997/98 (whilst at Keramu, due to poor soils). In general, the quality of fields was considered to have been much the same for Lio Mutai, Keramu and Ngah Limpak, although it was thought that Lio Mutai may have more pest animals (deer and pigs) than elsewhere. Regarding problem animals it was reported that, although these could be chased away, some—like monkeys—might return to a field several times in one day. No use is made of insecticides or any other insect control measures. Weeds can also pose a challenge. CAT members reported that some people had this year, for the first time ever, used herbicides. They had reportedly learnt about this from relatives at Long Loreh, were relatively pleased with the results, and were planning to try it again next season. Lack of rainfall was not considered to be a significant constraint; the only drought year people could remember was 1982/83, at Ngah Limpak. Problems relating to too much rainfall were reported to be more common. Excessive rain was reported to weaken rice plants and result in lodging. The timing of lodging was important: if it occurred before flowering then nothing would be reaped, whilst after flowering some harvest would still be achieved.
Some attempt was made to assess the degree of self-sufficiency in food production. The CAT claimed that each household always achieved some harvest, and some informants insisted that rice production was always sufficient for the whole year. It was estimated that one family would need about 100 tins of rice per year. One group of informants gave the following estimates for three families who were reported to pool their production. Between them they were said to cultivate three fields, each about 1 ha in extent, from which they could expect a combined yield of about 300 tins, which was considered to be sufficient for the whole year. One 8 kg tin of rice was estimated to last for two days.
Although villagers apparently do not sell rice outside the village, they do use it to barter for other goods which they obtain from kiosks within the
village. If there is any excess production, this is simply stored for future use. There were two kiosks in both Lio Mutai and Metut, apparently owned by people within these villages in conjunction with traders. What the shop owners do with all the rice that they receive was not clarified. However, some of it is reportedly outlayed or advanced to individuals going on eaglewood collecting expeditions. The CAT reported some purchases of rice from outside the village. For example, one family reported buying three bags of rice last year, as some family from the Hung River had come to stay with them such that they did not have enough rice for the whole season. The overall impression was that there is a relatively high degree of self-sufficiency in terms of rice production, at least at the village level, but that some families run into shortages through bartering rice for other goods.
There are two types of gardens: fruit gardens and vegetable gardens, both of which occurred in specific and relatively restricted localities. There was one main fruit garden area for Lio Mutai, and one at Metut, plus additional smaller gardens in association with some of the fields. Other fruit gardens were found in association with the sites of old villages. Common products of fruit gardens included various fruits (rambutan, papaya, bananas, pineapples) and coconuts, and from vegetable gardens, crops such as chillies, eggplant and ginger. Other products harvested from garden areas included, rattan, silat leaf for roofing, animals (such as birds, monkeys and mouse deer), betel leaf and betel nut. Additional wild fruits and vegetables were reported to be harvested from forest areas and old fields.
Collecting eaglewoodEaglewood (Aquilaria spp.), or gaharu as it is known locally, is a key livelihood component and an important source of income for many families. Eaglewood is derived from a number of trees belonging to the genus Aquilaria. The local people recognise two species, a small-leaved mountain species and a lowland species that overlap in their distribution. In response to internal fungal infection, the affected part of the tree produces resin, giving rise to a portion of resin-infused heartwood within the tree. This is the product that is traded as eaglewood. Harvesting is usually destructive, requiring the felling of the tree, from
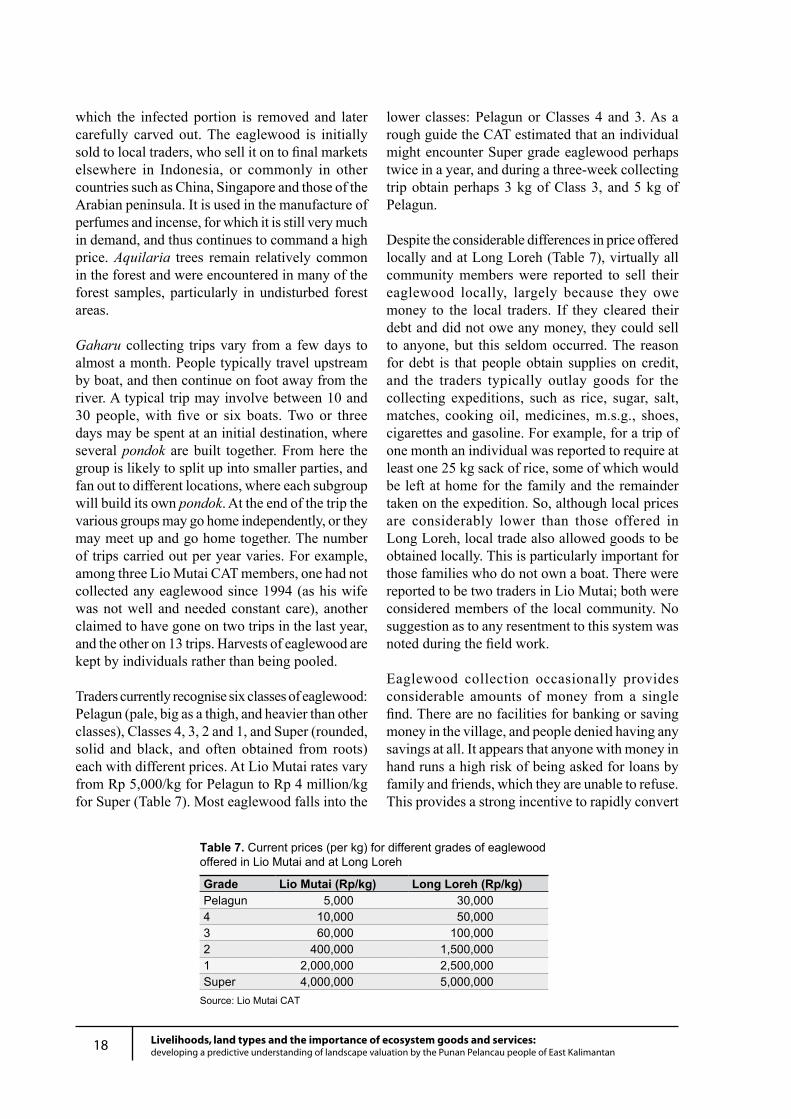
18 Livelihoods, land types and the importance of ecosystem goods and services:developing a predictive understanding of landscape valuation by the Punan Pelancau people of East Kalimantan
which the infected portion is removed and later carefully carved out. The eaglewood is initially sold to local traders, who sell it on to final markets elsewhere in Indonesia, or commonly in other countries such as China, Singapore and those of the Arabian peninsula. It is used in the manufacture of perfumes and incense, for which it is still very much in demand, and thus continues to command a high price. Aquilaria trees remain relatively common in the forest and were encountered in many of the forest samples, particularly in undisturbed forest areas.
Gaharu collecting trips vary from a few days to almost a month. People typically travel upstream by boat, and then continue on foot away from the river. A typical trip may involve between 10 and 30 people, with five or six boats. Two or three days may be spent at an initial destination, where several pondok are built together. From here the group is likely to split up into smaller parties, and fan out to different locations, where each subgroup will build its own pondok. At the end of the trip the various groups may go home independently, or they may meet up and go home together. The number of trips carried out per year varies. For example, among three Lio Mutai CAT members, one had not collected any eaglewood since 1994 (as his wife was not well and needed constant care), another claimed to have gone on two trips in the last year, and the other on 13 trips. Harvests of eaglewood are kept by individuals rather than being pooled.
Traders currently recognise six classes of eaglewood: Pelagun (pale, big as a thigh, and heavier than other classes), Classes 4, 3, 2 and 1, and Super (rounded, solid and black, and often obtained from roots) each with different prices. At Lio Mutai rates vary from Rp 5,000/kg for Pelagun to Rp 4 million/kg for Super (Table 7). Most eaglewood falls into the
lower classes: Pelagun or Classes 4 and 3. As a rough guide the CAT estimated that an individual might encounter Super grade eaglewood perhaps twice in a year, and during a three-week collecting trip obtain perhaps 3 kg of Class 3, and 5 kg of Pelagun.
Despite the considerable differences in price offered locally and at Long Loreh (Table 7), virtually all community members were reported to sell their eaglewood locally, largely because they owe money to the local traders. If they cleared their debt and did not owe any money, they could sell to anyone, but this seldom occurred. The reason for debt is that people obtain supplies on credit, and the traders typically outlay goods for the collecting expeditions, such as rice, sugar, salt, matches, cooking oil, medicines, m.s.g., shoes, cigarettes and gasoline. For example, for a trip of one month an individual was reported to require at least one 25 kg sack of rice, some of which would be left at home for the family and the remainder taken on the expedition. So, although local prices are considerably lower than those offered in Long Loreh, local trade also allowed goods to be obtained locally. This is particularly important for those families who do not own a boat. There were reported to be two traders in Lio Mutai; both were considered members of the local community. No suggestion as to any resentment to this system was noted during the field work.
Eaglewood collection occasionally provides considerable amounts of money from a single find. There are no facilities for banking or saving money in the village, and people denied having any savings at all. It appears that anyone with money in hand runs a high risk of being asked for loans by family and friends, which they are unable to refuse. This provides a strong incentive to rapidly convert
Table 7. Current prices (per kg) for different grades of eaglewood offered in Lio Mutai and at Long Loreh
Grade Lio Mutai (Rp/kg) Long Loreh (Rp/kg)Pelagun 5,000 30,0004 10,000 50,0003 60,000 100,0002 400,000 1,500,0001 2,000,000 2,500,000Super 4,000,000 5,000,000
Source: Lio Mutai CAT
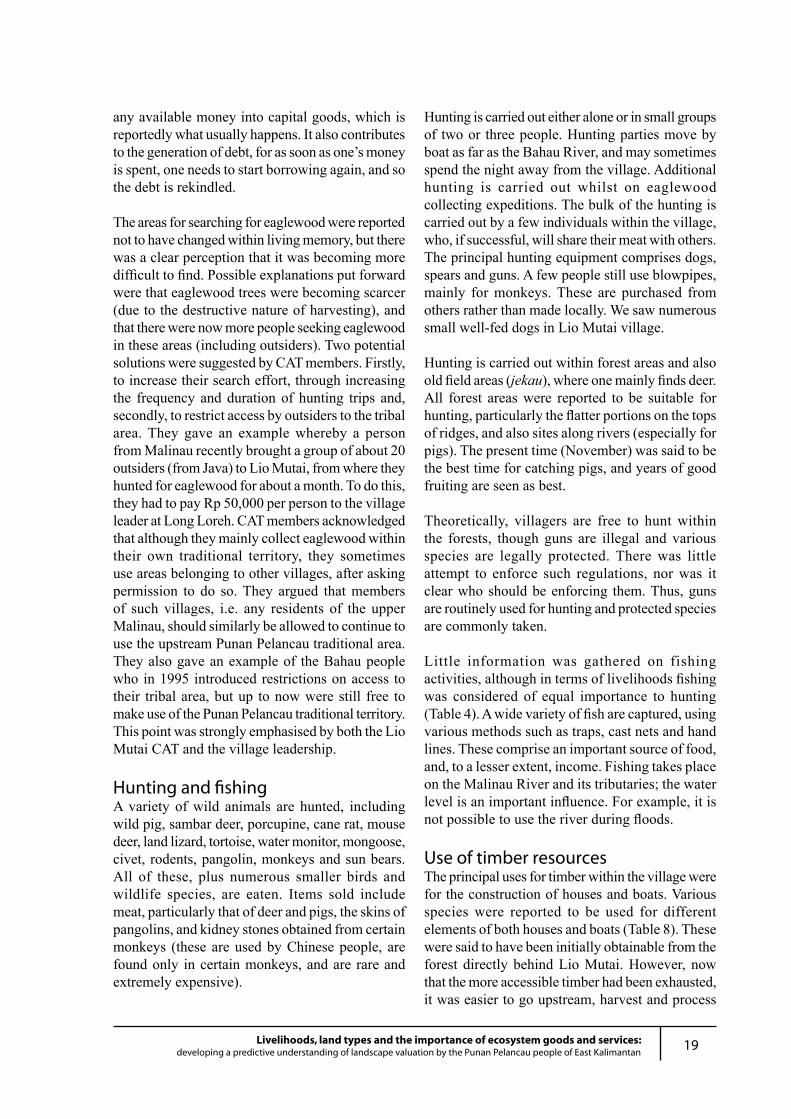
19Livelihoods, land types and the importance of ecosystem goods and services:developing a predictive understanding of landscape valuation by the Punan Pelancau people of East Kalimantan
any available money into capital goods, which is reportedly what usually happens. It also contributes to the generation of debt, for as soon as one’s money is spent, one needs to start borrowing again, and so the debt is rekindled.
The areas for searching for eaglewood were reported not to have changed within living memory, but there was a clear perception that it was becoming more difficult to find. Possible explanations put forward were that eaglewood trees were becoming scarcer (due to the destructive nature of harvesting), and that there were now more people seeking eaglewood in these areas (including outsiders). Two potential solutions were suggested by CAT members. Firstly, to increase their search effort, through increasing the frequency and duration of hunting trips and, secondly, to restrict access by outsiders to the tribal area. They gave an example whereby a person from Malinau recently brought a group of about 20 outsiders (from Java) to Lio Mutai, from where they hunted for eaglewood for about a month. To do this, they had to pay Rp 50,000 per person to the village leader at Long Loreh. CAT members acknowledged that although they mainly collect eaglewood within their own traditional territory, they sometimes use areas belonging to other villages, after asking permission to do so. They argued that members of such villages, i.e. any residents of the upper Malinau, should similarly be allowed to continue to use the upstream Punan Pelancau traditional area. They also gave an example of the Bahau people who in 1995 introduced restrictions on access to their tribal area, but up to now were still free to make use of the Punan Pelancau traditional territory. This point was strongly emphasised by both the Lio Mutai CAT and the village leadership.
Hunting and fishingA variety of wild animals are hunted, including wild pig, sambar deer, porcupine, cane rat, mouse deer, land lizard, tortoise, water monitor, mongoose, civet, rodents, pangolin, monkeys and sun bears. All of these, plus numerous smaller birds and wildlife species, are eaten. Items sold include meat, particularly that of deer and pigs, the skins of pangolins, and kidney stones obtained from certain monkeys (these are used by Chinese people, are found only in certain monkeys, and are rare and extremely expensive).
Hunting is carried out either alone or in small groups of two or three people. Hunting parties move by boat as far as the Bahau River, and may sometimes spend the night away from the village. Additional hunting is carried out whilst on eaglewood collecting expeditions. The bulk of the hunting is carried out by a few individuals within the village, who, if successful, will share their meat with others. The principal hunting equipment comprises dogs, spears and guns. A few people still use blowpipes, mainly for monkeys. These are purchased from others rather than made locally. We saw numerous small well-fed dogs in Lio Mutai village.
Hunting is carried out within forest areas and also old field areas (jekau), where one mainly finds deer. All forest areas were reported to be suitable for hunting, particularly the flatter portions on the tops of ridges, and also sites along rivers (especially for pigs). The present time (November) was said to be the best time for catching pigs, and years of good fruiting are seen as best.
Theoretically, villagers are free to hunt within the forests, though guns are illegal and various species are legally protected. There was little attempt to enforce such regulations, nor was it clear who should be enforcing them. Thus, guns are routinely used for hunting and protected species are commonly taken.
Little information was gathered on fishing activities, although in terms of livelihoods fishing was considered of equal importance to hunting (Table 4). A wide variety of fish are captured, using various methods such as traps, cast nets and hand lines. These comprise an important source of food, and, to a lesser extent, income. Fishing takes place on the Malinau River and its tributaries; the water level is an important influence. For example, it is not possible to use the river during floods.
Use of timber resourcesThe principal uses for timber within the village were for the construction of houses and boats. Various species were reported to be used for different elements of both houses and boats (Table 8). These were said to have been initially obtainable from the forest directly behind Lio Mutai. However, now that the more accessible timber had been exhausted, it was easier to go upstream, harvest and process
20 Livelihoods, land types and the importance of ecosystem goods and services:developing a predictive understanding of landscape valuation by the Punan Pelancau people of East Kalimantan
trees somewhere in close proximity to the river, and then use boats to transport the planks back to the village. Currently any of the main timber species were said to be available between Lio Mutai and, at the furthest, the Tekawang River (between Lio Mutai and Metut).
Local people claimed to lack the skills and equipment needed to produce planks. When planks were required, they said that they would hire people from downstream. In place of payment the hire operators were permitted to remove some planks by boat for their own use elsewhere.
In terms of access to and rights over timber resources, the CAT said that local people were free to use any timber as long as the area concerned was not part of any formal concession area (in which case they forfeit all rights to the timber resources). Despite the good quality and quantity of timber resources within the surrounding forests, there has been little logging due to the remoteness and poor accessibility of the area.
If anyone is interested in harvesting timber, it was explained that they had to first talk with the customary leadership, comprising the adat chief, the village chief and four important elders (two each from Lio Mutai and Metut). The ‘PU’ company was reported to have been the first timber company to come here. Initially an agreement was reached between the customary leaders, the company and the district government, for the company to construct an access road which they would fund through utilisation of the timber felled during
clearing for the road. The road was to be 8 m in width, but the company was authorised to remove any timber within 25 m of either side of the road. In the event, this proved not to be viable, and the company was cutting much further from the road. A new agreement allows the company to harvest within 1 km of the road.
In return for harvesting timber, the company is obliged to pay the community. Every Pelancau man, woman and child is entitled to an equal payment. The company gives the necessary fees to the village leader in Long Loreh, and a representative from each family is required to go there and receive the money on behalf of the household. This applies to all Pelancau people within Long Loreh, Lio Mutai and Metut. Those who have moved to other villages do not receive the fee, although if they were to return to one of the above settlements they would then be entitled to participate. Individuals are free to spend the money according to their own wishes, although there is usually a voluntary contribution to the church.
The Lio Mutai CAT was not clear as to all the details of the agreement between the customary leaders and the logging company. Fees from the company started coming in the middle of 2002. This year (2003) three payments had already been received, and another one was due in December. Each time, each individual received a payment of Rp 425,000 (c. US$50 at prevailing rate of exchange). People were not clear as to the frequency of future payments, nor how long this situation was likely to last.
Table 8. Timber species used for construction of houses and boats
Local Name Scientific Name UseHousehold constructionUlin Eusideroxylon zwageri Foundation poles/ladders/bathroom floor Kapur Dryobalanops sp. Roof beams/floorsMeranti Shorea sp. WallsAdau Elmerrillia tsiampacca DoorsKeruing Dipterocarpus sp. FloorsLegutung Alstonia sp. CeilingBoat constructionAdau Elmerrillia tsiampacca Base of boat (in water)Meranti Shorea sp. SidesTengkawang Dipterocarpus sp. SidesAfang kelalai Shorea sp. Base and sidesUlin Eusideroxylon zwageri Paddles
Source: Lio Mutai CAT
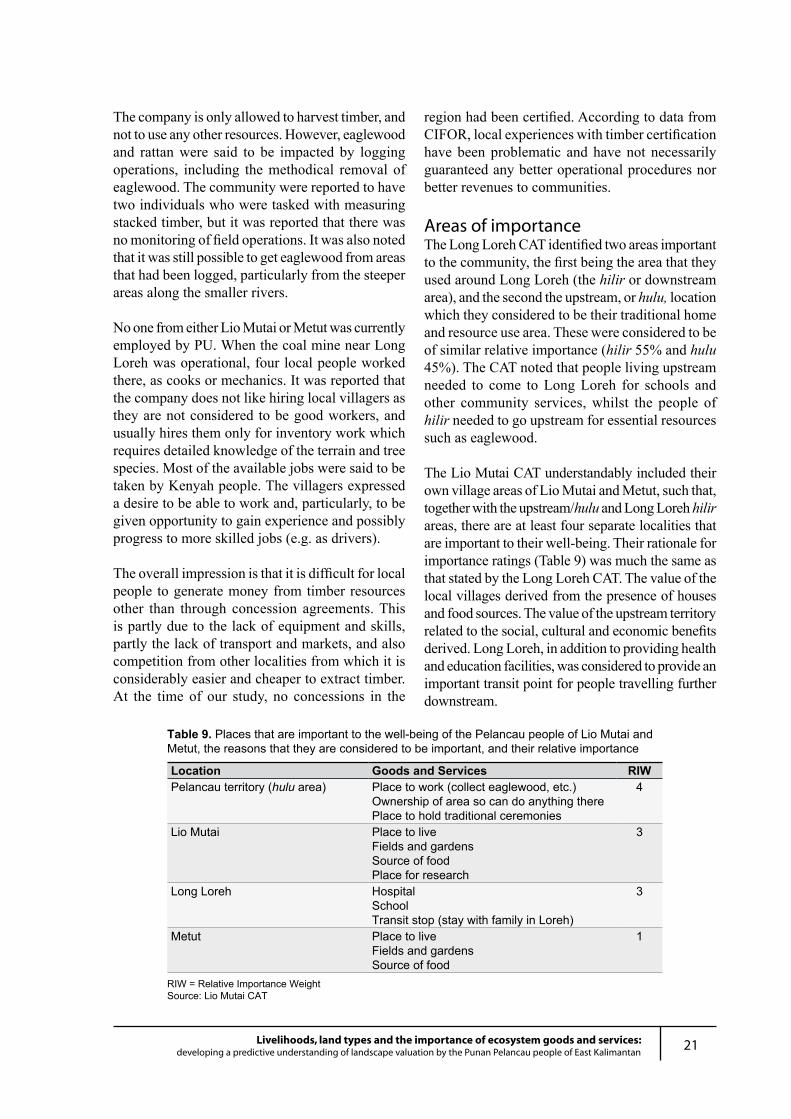
21Livelihoods, land types and the importance of ecosystem goods and services:developing a predictive understanding of landscape valuation by the Punan Pelancau people of East Kalimantan
The company is only allowed to harvest timber, and not to use any other resources. However, eaglewood and rattan were said to be impacted by logging operations, including the methodical removal of eaglewood. The community were reported to have two individuals who were tasked with measuring stacked timber, but it was reported that there was no monitoring of field operations. It was also noted that it was still possible to get eaglewood from areas that had been logged, particularly from the steeper areas along the smaller rivers.
No one from either Lio Mutai or Metut was currently employed by PU. When the coal mine near Long Loreh was operational, four local people worked there, as cooks or mechanics. It was reported that the company does not like hiring local villagers as they are not considered to be good workers, and usually hires them only for inventory work which requires detailed knowledge of the terrain and tree species. Most of the available jobs were said to be taken by Kenyah people. The villagers expressed a desire to be able to work and, particularly, to be given opportunity to gain experience and possibly progress to more skilled jobs (e.g. as drivers).
The overall impression is that it is difficult for local people to generate money from timber resources other than through concession agreements. This is partly due to the lack of equipment and skills, partly the lack of transport and markets, and also competition from other localities from which it is considerably easier and cheaper to extract timber. At the time of our study, no concessions in the
region had been certified. According to data from CIFOR, local experiences with timber certification have been problematic and have not necessarily guaranteed any better operational procedures nor better revenues to communities.
Areas of importanceThe Long Loreh CAT identified two areas important to the community, the first being the area that they used around Long Loreh (the hilir or downstream area), and the second the upstream, or hulu, location which they considered to be their traditional home and resource use area. These were considered to be of similar relative importance (hilir 55% and hulu 45%). The CAT noted that people living upstream needed to come to Long Loreh for schools and other community services, whilst the people of hilir needed to go upstream for essential resources such as eaglewood.
The Lio Mutai CAT understandably included their own village areas of Lio Mutai and Metut, such that, together with the upstream/hulu and Long Loreh hilir areas, there are at least four separate localities that are important to their well-being. Their rationale for importance ratings (Table 9) was much the same as that stated by the Long Loreh CAT. The value of the local villages derived from the presence of houses and food sources. The value of the upstream territory related to the social, cultural and economic benefits derived. Long Loreh, in addition to providing health and education facilities, was considered to provide an important transit point for people travelling further downstream.
Table 9. Places that are important to the well-being of the Pelancau people of Lio Mutai and Metut, the reasons that they are considered to be important, and their relative importance
Location Goods and Services RIWPelancau territory (hulu area) Place to work (collect eaglewood, etc.)
Ownership of area so can do anything therePlace to hold traditional ceremonies
4
Lio Mutai Place to liveFields and gardensSource of foodPlace for research
3
Long Loreh HospitalSchoolTransit stop (stay with family in Loreh)
3
Metut Place to liveFields and gardensSource of food
1
RIW = Relative Importance WeightSource: Lio Mutai CAT
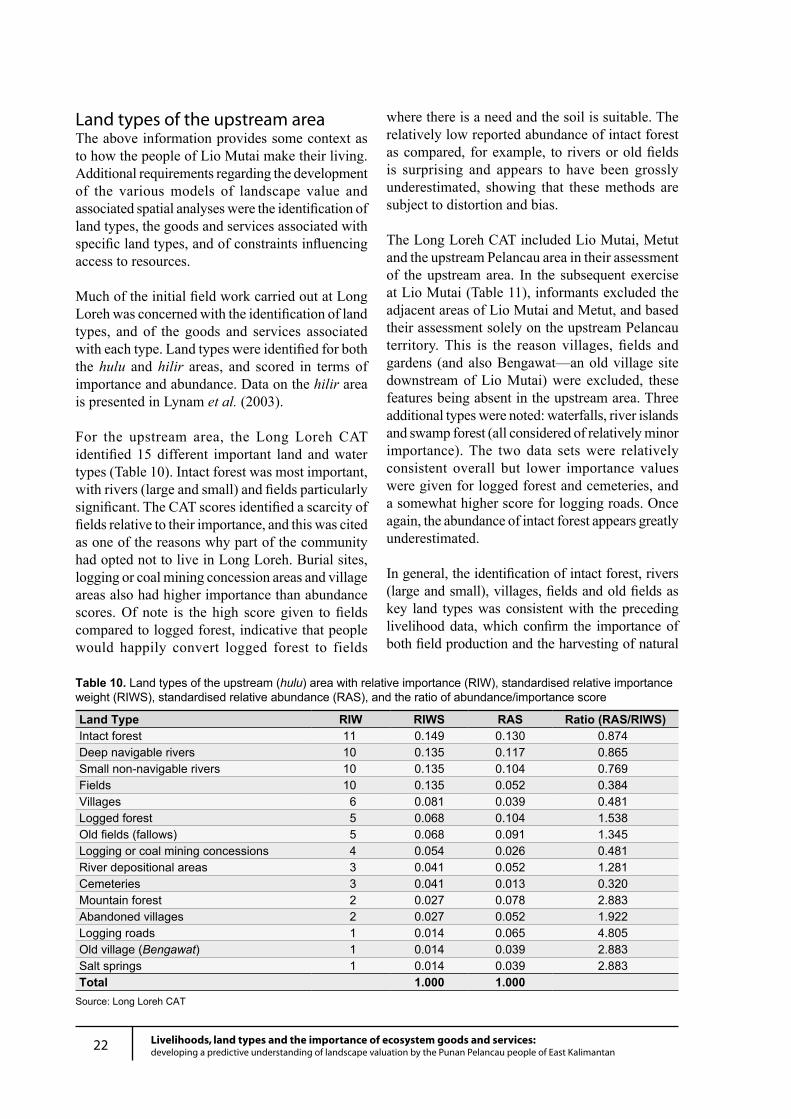
22 Livelihoods, land types and the importance of ecosystem goods and services:developing a predictive understanding of landscape valuation by the Punan Pelancau people of East Kalimantan
Land types of the upstream areaThe above information provides some context as to how the people of Lio Mutai make their living. Additional requirements regarding the development of the various models of landscape value and associated spatial analyses were the identification of land types, the goods and services associated with specific land types, and of constraints influencing access to resources.
Much of the initial field work carried out at Long Loreh was concerned with the identification of land types, and of the goods and services associated with each type. Land types were identified for both the hulu and hilir areas, and scored in terms of importance and abundance. Data on the hilir area is presented in Lynam et al. (2003).
For the upstream area, the Long Loreh CAT identified 15 different important land and water types (Table 10). Intact forest was most important, with rivers (large and small) and fields particularly significant. The CAT scores identified a scarcity of fields relative to their importance, and this was cited as one of the reasons why part of the community had opted not to live in Long Loreh. Burial sites, logging or coal mining concession areas and village areas also had higher importance than abundance scores. Of note is the high score given to fields compared to logged forest, indicative that people would happily convert logged forest to fields
where there is a need and the soil is suitable. The relatively low reported abundance of intact forest as compared, for example, to rivers or old fields is surprising and appears to have been grossly underestimated, showing that these methods are subject to distortion and bias.
The Long Loreh CAT included Lio Mutai, Metut and the upstream Pelancau area in their assessment of the upstream area. In the subsequent exercise at Lio Mutai (Table 11), informants excluded the adjacent areas of Lio Mutai and Metut, and based their assessment solely on the upstream Pelancau territory. This is the reason villages, fields and gardens (and also Bengawat—an old village site downstream of Lio Mutai) were excluded, these features being absent in the upstream area. Three additional types were noted: waterfalls, river islands and swamp forest (all considered of relatively minor importance). The two data sets were relatively consistent overall but lower importance values were given for logged forest and cemeteries, and a somewhat higher score for logging roads. Once again, the abundance of intact forest appears greatly underestimated.
In general, the identification of intact forest, rivers (large and small), villages, fields and old fields as key land types was consistent with the preceding livelihood data, which confirm the importance of both field production and the harvesting of natural
Table 10. Land types of the upstream (hulu) area with relative importance (RIW), standardised relative importance weight (RIWS), standardised relative abundance (RAS), and the ratio of abundance/importance score
Land Type RIW RIWS RAS Ratio (RAS/RIWS)Intact forest 11 0.149 0.130 0.874Deep navigable rivers 10 0.135 0.117 0.865Small non-navigable rivers 10 0.135 0.104 0.769Fields 10 0.135 0.052 0.384Villages 6 0.081 0.039 0.481Logged forest 5 0.068 0.104 1.538Old fields (fallows) 5 0.068 0.091 1.345Logging or coal mining concessions 4 0.054 0.026 0.481River depositional areas 3 0.041 0.052 1.281Cemeteries 3 0.041 0.013 0.320Mountain forest 2 0.027 0.078 2.883Abandoned villages 2 0.027 0.052 1.922Logging roads 1 0.014 0.065 4.805Old village (Bengawat) 1 0.014 0.039 2.883Salt springs 1 0.014 0.039 2.883Total 1.000 1.000
Source: Long Loreh CAT
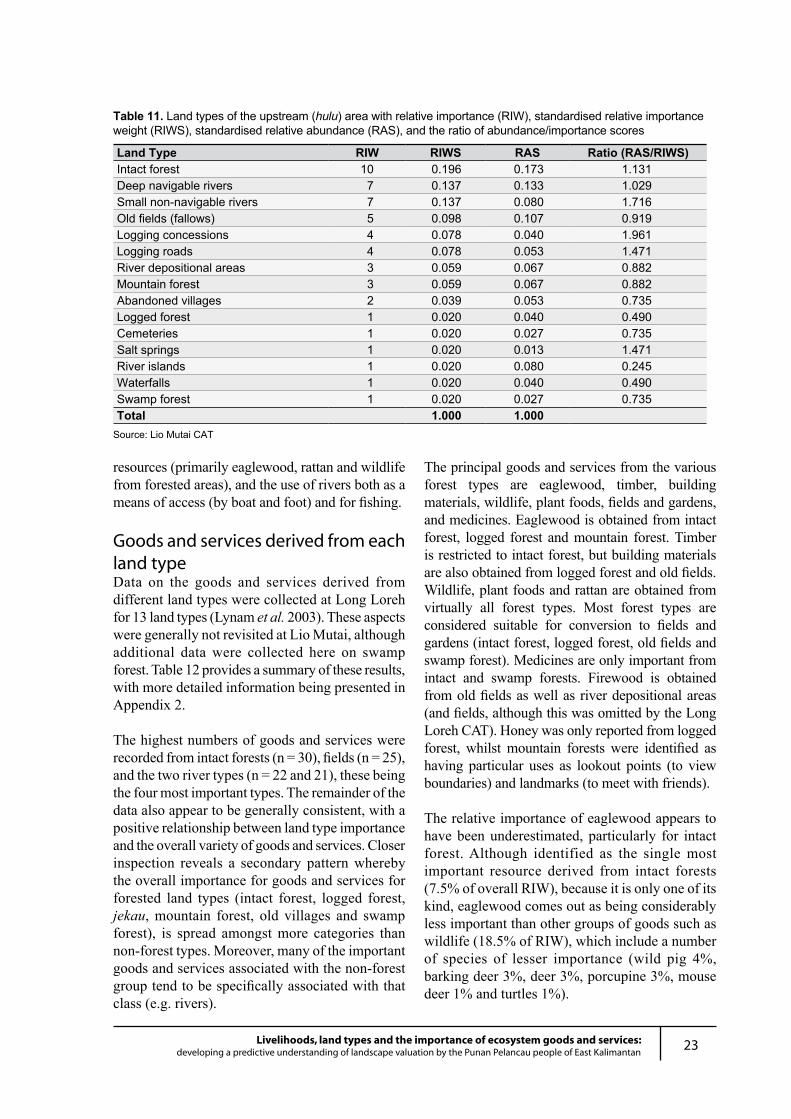
23Livelihoods, land types and the importance of ecosystem goods and services:developing a predictive understanding of landscape valuation by the Punan Pelancau people of East Kalimantan
resources (primarily eaglewood, rattan and wildlife from forested areas), and the use of rivers both as a means of access (by boat and foot) and for fishing.
Goods and services derived from each land typeData on the goods and services derived from different land types were collected at Long Loreh for 13 land types (Lynam et al. 2003). These aspects were generally not revisited at Lio Mutai, although additional data were collected here on swamp forest. Table 12 provides a summary of these results, with more detailed information being presented in Appendix 2.
The highest numbers of goods and services were recorded from intact forests (n = 30), fields (n = 25), and the two river types (n = 22 and 21), these being the four most important types. The remainder of the data also appear to be generally consistent, with a positive relationship between land type importance and the overall variety of goods and services. Closer inspection reveals a secondary pattern whereby the overall importance for goods and services for forested land types (intact forest, logged forest, jekau, mountain forest, old villages and swamp forest), is spread amongst more categories than non-forest types. Moreover, many of the important goods and services associated with the non-forest group tend to be specifically associated with that class (e.g. rivers).
The principal goods and services from the various forest types are eaglewood, timber, building materials, wildlife, plant foods, fields and gardens, and medicines. Eaglewood is obtained from intact forest, logged forest and mountain forest. Timber is restricted to intact forest, but building materials are also obtained from logged forest and old fields. Wildlife, plant foods and rattan are obtained from virtually all forest types. Most forest types are considered suitable for conversion to fields and gardens (intact forest, logged forest, old fields and swamp forest). Medicines are only important from intact and swamp forests. Firewood is obtained from old fields as well as river depositional areas (and fields, although this was omitted by the Long Loreh CAT). Honey was only reported from logged forest, whilst mountain forests were identified as having particular uses as lookout points (to view boundaries) and landmarks (to meet with friends).
The relative importance of eaglewood appears to have been underestimated, particularly for intact forest. Although identified as the single most important resource derived from intact forests (7.5% of overall RIW), because it is only one of its kind, eaglewood comes out as being considerably less important than other groups of goods such as wildlife (18.5% of RIW), which include a number of species of lesser importance (wild pig 4%, barking deer 3%, deer 3%, porcupine 3%, mouse deer 1% and turtles 1%).
Table 11. Land types of the upstream (hulu) area with relative importance (RIW), standardised relative importance weight (RIWS), standardised relative abundance (RAS), and the ratio of abundance/importance scores
Land Type RIW RIWS RAS Ratio (RAS/RIWS)Intact forest 10 0.196 0.173 1.131Deep navigable rivers 7 0.137 0.133 1.029Small non-navigable rivers 7 0.137 0.080 1.716Old fields (fallows) 5 0.098 0.107 0.919Logging concessions 4 0.078 0.040 1.961Logging roads 4 0.078 0.053 1.471River depositional areas 3 0.059 0.067 0.882Mountain forest 3 0.059 0.067 0.882Abandoned villages 2 0.039 0.053 0.735Logged forest 1 0.020 0.040 0.490Cemeteries 1 0.020 0.027 0.735Salt springs 1 0.020 0.013 1.471River islands 1 0.020 0.080 0.245Waterfalls 1 0.020 0.040 0.490Swamp forest 1 0.020 0.027 0.735Total 1.000 1.000
Source: Lio Mutai CAT
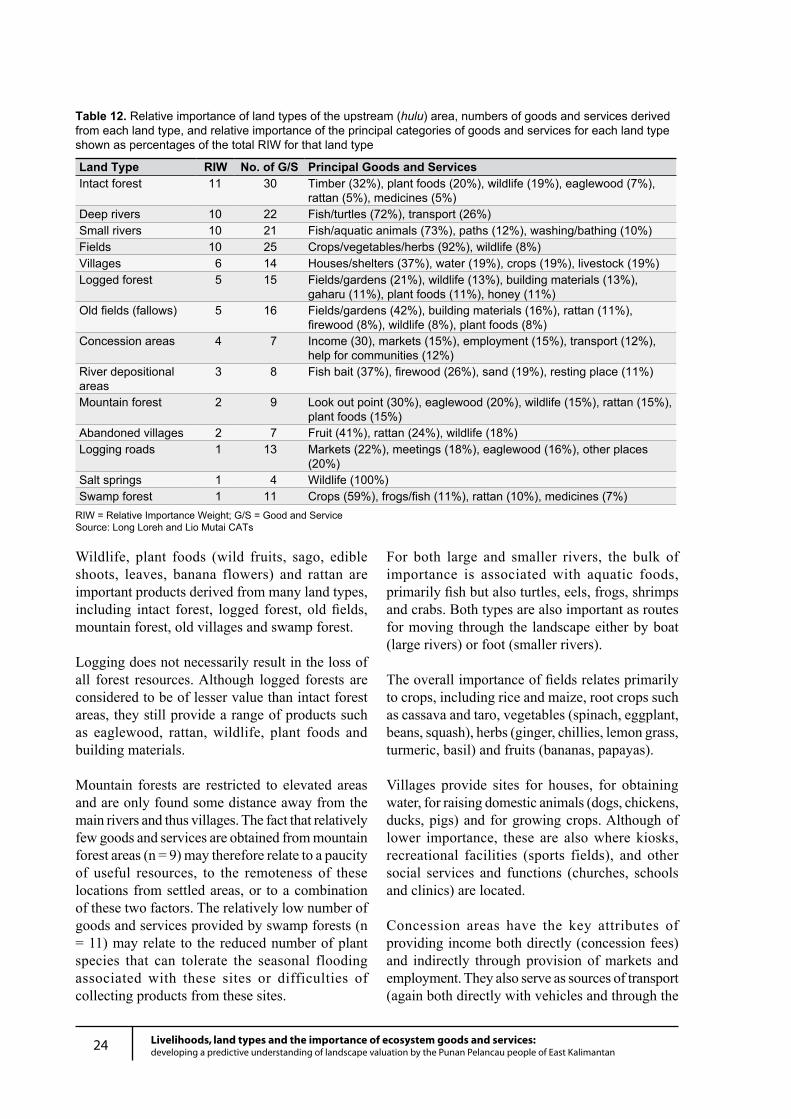
24 Livelihoods, land types and the importance of ecosystem goods and services:developing a predictive understanding of landscape valuation by the Punan Pelancau people of East Kalimantan
Wildlife, plant foods (wild fruits, sago, edible shoots, leaves, banana flowers) and rattan are important products derived from many land types, including intact forest, logged forest, old fields, mountain forest, old villages and swamp forest.
Logging does not necessarily result in the loss of all forest resources. Although logged forests are considered to be of lesser value than intact forest areas, they still provide a range of products such as eaglewood, rattan, wildlife, plant foods and building materials.
Mountain forests are restricted to elevated areas and are only found some distance away from the main rivers and thus villages. The fact that relatively few goods and services are obtained from mountain forest areas (n = 9) may therefore relate to a paucity of useful resources, to the remoteness of these locations from settled areas, or to a combination of these two factors. The relatively low number of goods and services provided by swamp forests (n = 11) may relate to the reduced number of plant species that can tolerate the seasonal flooding associated with these sites or difficulties of collecting products from these sites.
For both large and smaller rivers, the bulk of importance is associated with aquatic foods, primarily fish but also turtles, eels, frogs, shrimps and crabs. Both types are also important as routes for moving through the landscape either by boat (large rivers) or foot (smaller rivers).
The overall importance of fields relates primarily to crops, including rice and maize, root crops such as cassava and taro, vegetables (spinach, eggplant, beans, squash), herbs (ginger, chillies, lemon grass, turmeric, basil) and fruits (bananas, papayas).
Villages provide sites for houses, for obtaining water, for raising domestic animals (dogs, chickens, ducks, pigs) and for growing crops. Although of lower importance, these are also where kiosks, recreational facilities (sports fields), and other social services and functions (churches, schools and clinics) are located.
Concession areas have the key attributes of providing income both directly (concession fees) and indirectly through provision of markets and employment. They also serve as sources of transport (again both directly with vehicles and through the
Table 12. Relative importance of land types of the upstream (hulu) area, numbers of goods and services derived from each land type, and relative importance of the principal categories of goods and services for each land type shown as percentages of the total RIW for that land type
Land Type RIW No. of G/S Principal Goods and ServicesIntact forest 11 30 Timber (32%), plant foods (20%), wildlife (19%), eaglewood (7%),
rattan (5%), medicines (5%)Deep rivers 10 22 Fish/turtles (72%), transport (26%)Small rivers 10 21 Fish/aquatic animals (73%), paths (12%), washing/bathing (10%)Fields 10 25 Crops/vegetables/herbs (92%), wildlife (8%)Villages 6 14 Houses/shelters (37%), water (19%), crops (19%), livestock (19%)Logged forest 5 15 Fields/gardens (21%), wildlife (13%), building materials (13%),
gaharu (11%), plant foods (11%), honey (11%)Old fields (fallows) 5 16 Fields/gardens (42%), building materials (16%), rattan (11%),
firewood (8%), wildlife (8%), plant foods (8%)Concession areas 4 7 Income (30), markets (15%), employment (15%), transport (12%),
help for communities (12%)River depositional areas
3 8 Fish bait (37%), firewood (26%), sand (19%), resting place (11%)
Mountain forest 2 9 Look out point (30%), eaglewood (20%), wildlife (15%), rattan (15%), plant foods (15%)
Abandoned villages 2 7 Fruit (41%), rattan (24%), wildlife (18%)Logging roads 1 13 Markets (22%), meetings (18%), eaglewood (16%), other places
(20%)Salt springs 1 4 Wildlife (100%)Swamp forest 1 11 Crops (59%), frogs/fish (11%), rattan (10%), medicines (7%)
RIW = Relative Importance Weight; G/S = Good and ServiceSource: Long Loreh and Lio Mutai CATs
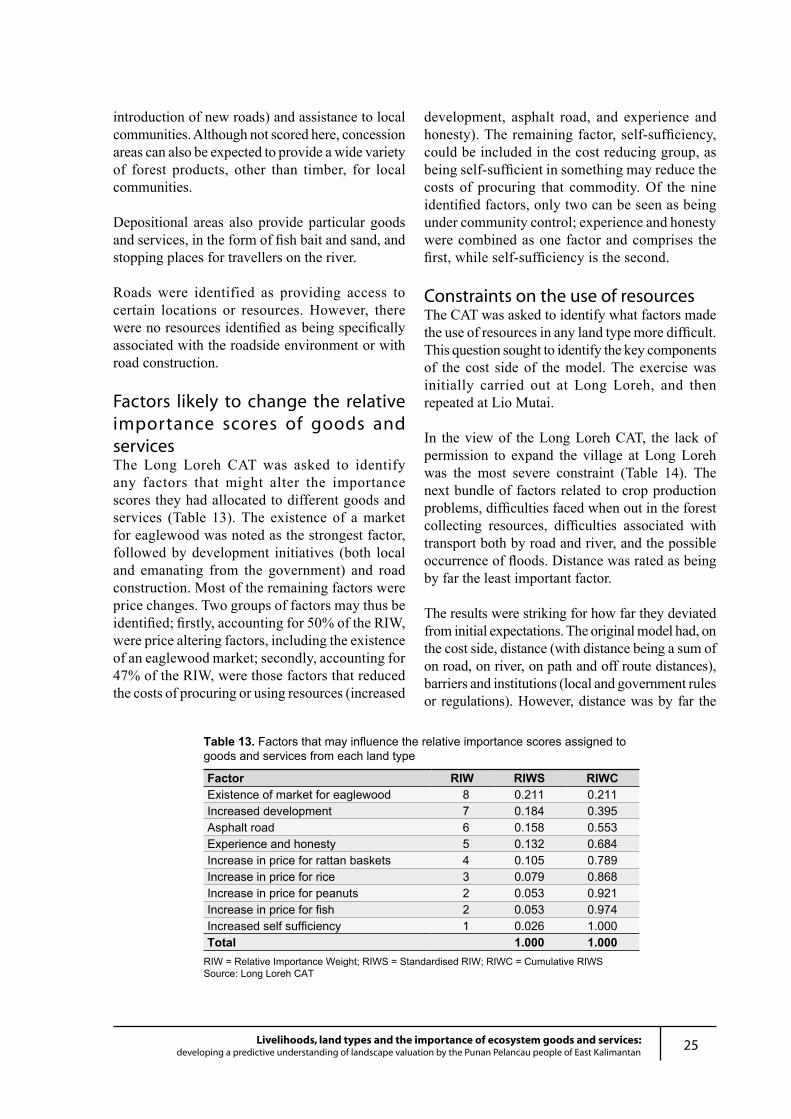
25Livelihoods, land types and the importance of ecosystem goods and services:developing a predictive understanding of landscape valuation by the Punan Pelancau people of East Kalimantan
introduction of new roads) and assistance to local communities. Although not scored here, concession areas can also be expected to provide a wide variety of forest products, other than timber, for local communities.
Depositional areas also provide particular goods and services, in the form of fish bait and sand, and stopping places for travellers on the river.
Roads were identified as providing access to certain locations or resources. However, there were no resources identified as being specifically associated with the roadside environment or with road construction.
Factors likely to change the relative importance scores of goods and servicesThe Long Loreh CAT was asked to identify any factors that might alter the importance scores they had allocated to different goods and services (Table 13). The existence of a market for eaglewood was noted as the strongest factor, followed by development initiatives (both local and emanating from the government) and road construction. Most of the remaining factors were price changes. Two groups of factors may thus be identified; firstly, accounting for 50% of the RIW, were price altering factors, including the existence of an eaglewood market; secondly, accounting for 47% of the RIW, were those factors that reduced the costs of procuring or using resources (increased
development, asphalt road, and experience and honesty). The remaining factor, self-sufficiency, could be included in the cost reducing group, as being self-sufficient in something may reduce the costs of procuring that commodity. Of the nine identified factors, only two can be seen as being under community control; experience and honesty were combined as one factor and comprises the first, while self-sufficiency is the second.
Constraints on the use of resourcesThe CAT was asked to identify what factors made the use of resources in any land type more difficult. This question sought to identify the key components of the cost side of the model. The exercise was initially carried out at Long Loreh, and then repeated at Lio Mutai.
In the view of the Long Loreh CAT, the lack of permission to expand the village at Long Loreh was the most severe constraint (Table 14). The next bundle of factors related to crop production problems, difficulties faced when out in the forest collecting resources, difficulties associated with transport both by road and river, and the possible occurrence of floods. Distance was rated as being by far the least important factor.
The results were striking for how far they deviated from initial expectations. The original model had, on the cost side, distance (with distance being a sum of on road, on river, on path and off route distances), barriers and institutions (local and government rules or regulations). However, distance was by far the
Table 13. Factors that may influence the relative importance scores assigned to goods and services from each land type
Factor RIW RIWS RIWCExistence of market for eaglewood 8 0.211 0.211Increased development 7 0.184 0.395Asphalt road 6 0.158 0.553Experience and honesty 5 0.132 0.684Increase in price for rattan baskets 4 0.105 0.789Increase in price for rice 3 0.079 0.868Increase in price for peanuts 2 0.053 0.921Increase in price for fish 2 0.053 0.974Increased self sufficiency 1 0.026 1.000Total 1.000 1.000
RIW = Relative Importance Weight; RIWS = Standardised RIW; RIWC = Cumulative RIWSSource: Long Loreh CAT
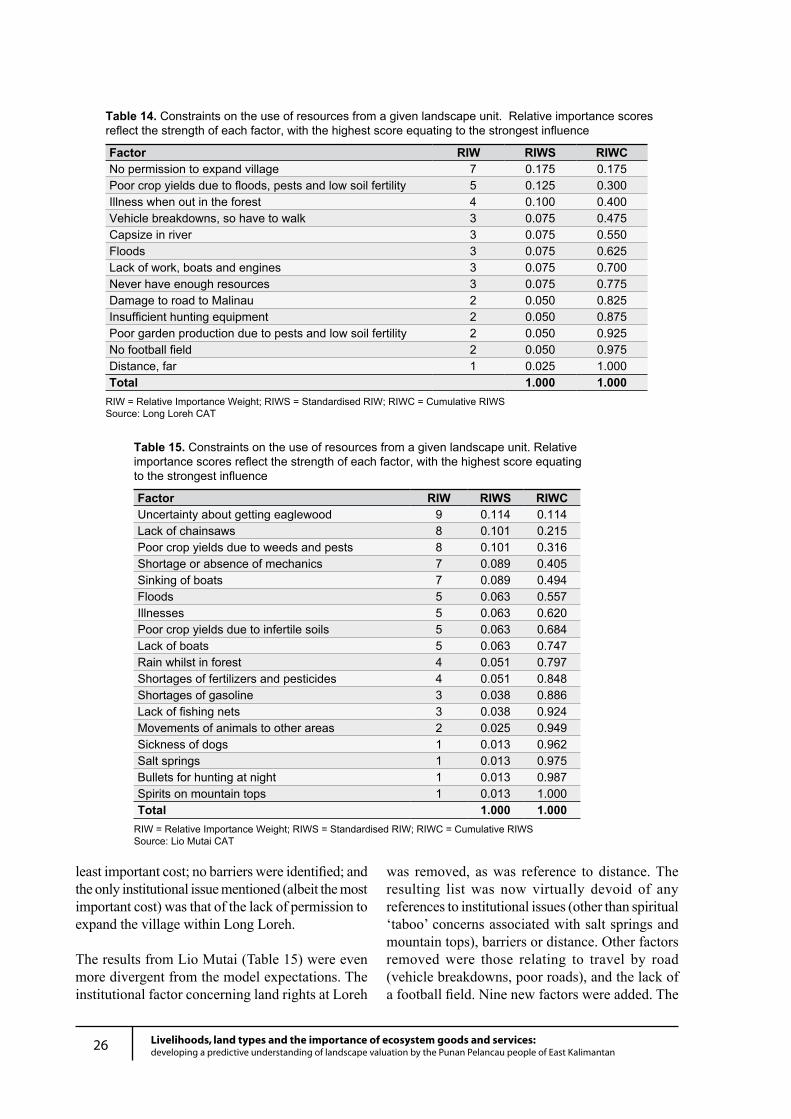
26 Livelihoods, land types and the importance of ecosystem goods and services:developing a predictive understanding of landscape valuation by the Punan Pelancau people of East Kalimantan
least important cost; no barriers were identified; and the only institutional issue mentioned (albeit the most important cost) was that of the lack of permission to expand the village within Long Loreh.
The results from Lio Mutai (Table 15) were even more divergent from the model expectations. The institutional factor concerning land rights at Loreh
was removed, as was reference to distance. The resulting list was now virtually devoid of any references to institutional issues (other than spiritual ‘taboo’ concerns associated with salt springs and mountain tops), barriers or distance. Other factors removed were those relating to travel by road (vehicle breakdowns, poor roads), and the lack of a football field. Nine new factors were added. The
Table 14. Constraints on the use of resources from a given landscape unit. Relative importance scores reflect the strength of each factor, with the highest score equating to the strongest influence
Factor RIW RIWS RIWCNo permission to expand village 7 0.175 0.175Poor crop yields due to floods, pests and low soil fertility 5 0.125 0.300Illness when out in the forest 4 0.100 0.400Vehicle breakdowns, so have to walk 3 0.075 0.475Capsize in river 3 0.075 0.550Floods 3 0.075 0.625Lack of work, boats and engines 3 0.075 0.700Never have enough resources 3 0.075 0.775Damage to road to Malinau 2 0.050 0.825Insufficient hunting equipment 2 0.050 0.875Poor garden production due to pests and low soil fertility 2 0.050 0.925No football field 2 0.050 0.975Distance, far 1 0.025 1.000Total 1.000 1.000
RIW = Relative Importance Weight; RIWS = Standardised RIW; RIWC = Cumulative RIWS Source: Long Loreh CAT
Table 15. Constraints on the use of resources from a given landscape unit. Relative importance scores reflect the strength of each factor, with the highest score equating to the strongest influence
Factor RIW RIWS RIWCUncertainty about getting eaglewood 9 0.114 0.114Lack of chainsaws 8 0.101 0.215Poor crop yields due to weeds and pests 8 0.101 0.316Shortage or absence of mechanics 7 0.089 0.405Sinking of boats 7 0.089 0.494Floods 5 0.063 0.557Illnesses 5 0.063 0.620Poor crop yields due to infertile soils 5 0.063 0.684Lack of boats 5 0.063 0.747Rain whilst in forest 4 0.051 0.797Shortages of fertilizers and pesticides 4 0.051 0.848Shortages of gasoline 3 0.038 0.886Lack of fishing nets 3 0.038 0.924Movements of animals to other areas 2 0.025 0.949Sickness of dogs 1 0.013 0.962Salt springs 1 0.013 0.975Bullets for hunting at night 1 0.013 0.987Spirits on mountain tops 1 0.013 1.000Total 1.000 1.000
RIW = Relative Importance Weight; RIWS = Standardised RIW; RIWC = Cumulative RIWSSource: Lio Mutai CAT
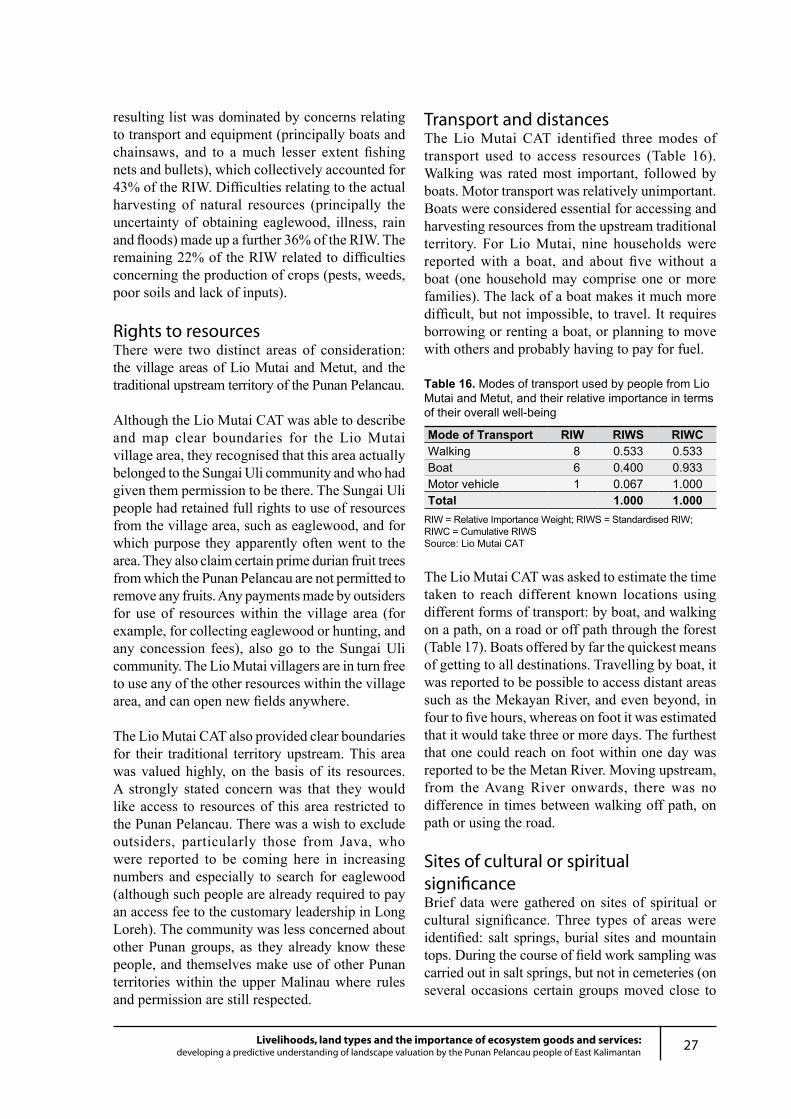
27Livelihoods, land types and the importance of ecosystem goods and services:developing a predictive understanding of landscape valuation by the Punan Pelancau people of East Kalimantan
resulting list was dominated by concerns relating to transport and equipment (principally boats and chainsaws, and to a much lesser extent fishing nets and bullets), which collectively accounted for 43% of the RIW. Difficulties relating to the actual harvesting of natural resources (principally the uncertainty of obtaining eaglewood, illness, rain and floods) made up a further 36% of the RIW. The remaining 22% of the RIW related to difficulties concerning the production of crops (pests, weeds, poor soils and lack of inputs).
Rights to resourcesThere were two distinct areas of consideration: the village areas of Lio Mutai and Metut, and the traditional upstream territory of the Punan Pelancau.
Although the Lio Mutai CAT was able to describe and map clear boundaries for the Lio Mutai village area, they recognised that this area actually belonged to the Sungai Uli community and who had given them permission to be there. The Sungai Uli people had retained full rights to use of resources from the village area, such as eaglewood, and for which purpose they apparently often went to the area. They also claim certain prime durian fruit trees from which the Punan Pelancau are not permitted to remove any fruits. Any payments made by outsiders for use of resources within the village area (for example, for collecting eaglewood or hunting, and any concession fees), also go to the Sungai Uli community. The Lio Mutai villagers are in turn free to use any of the other resources within the village area, and can open new fields anywhere.
The Lio Mutai CAT also provided clear boundaries for their traditional territory upstream. This area was valued highly, on the basis of its resources. A strongly stated concern was that they would like access to resources of this area restricted to the Punan Pelancau. There was a wish to exclude outsiders, particularly those from Java, who were reported to be coming here in increasing numbers and especially to search for eaglewood (although such people are already required to pay an access fee to the customary leadership in Long Loreh). The community was less concerned about other Punan groups, as they already know these people, and themselves make use of other Punan territories within the upper Malinau where rules and permission are still respected.
Transport and distancesThe Lio Mutai CAT identified three modes of transport used to access resources (Table 16). Walking was rated most important, followed by boats. Motor transport was relatively unimportant. Boats were considered essential for accessing and harvesting resources from the upstream traditional territory. For Lio Mutai, nine households were reported with a boat, and about five without a boat (one household may comprise one or more families). The lack of a boat makes it much more difficult, but not impossible, to travel. It requires borrowing or renting a boat, or planning to move with others and probably having to pay for fuel.
Table 16. Modes of transport used by people from Lio Mutai and Metut, and their relative importance in terms of their overall well-being
Mode of Transport RIW RIWS RIWCWalking 8 0.533 0.533Boat 6 0.400 0.933Motor vehicle 1 0.067 1.000Total 1.000 1.000
RIW = Relative Importance Weight; RIWS = Standardised RIW; RIWC = Cumulative RIWSSource: Lio Mutai CAT
The Lio Mutai CAT was asked to estimate the time taken to reach different known locations using different forms of transport: by boat, and walking on a path, on a road or off path through the forest (Table 17). Boats offered by far the quickest means of getting to all destinations. Travelling by boat, it was reported to be possible to access distant areas such as the Mekayan River, and even beyond, in four to five hours, whereas on foot it was estimated that it would take three or more days. The furthest that one could reach on foot within one day was reported to be the Metan River. Moving upstream, from the Avang River onwards, there was no difference in times between walking off path, on path or using the road.
Sites of cultural or spiritual significanceBrief data were gathered on sites of spiritual or cultural significance. Three types of areas were identified: salt springs, burial sites and mountain tops. During the course of field work sampling was carried out in salt springs, but not in cemeteries (on several occasions certain groups moved close to
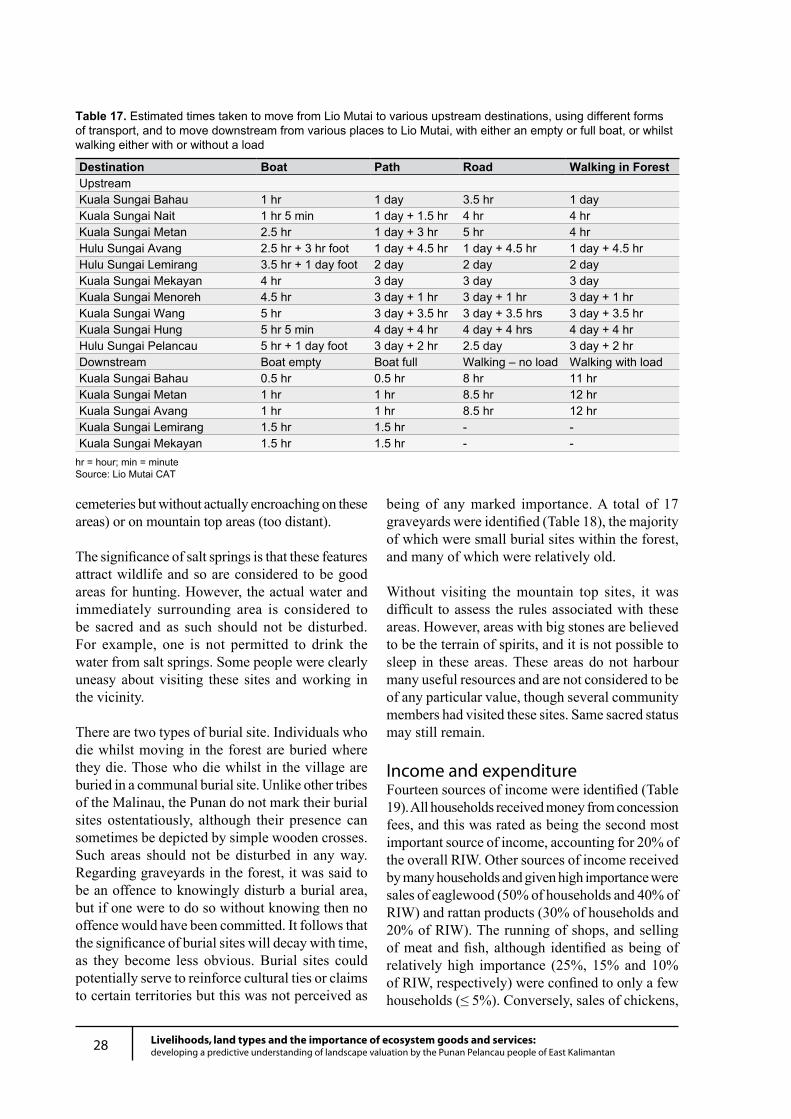
28 Livelihoods, land types and the importance of ecosystem goods and services:developing a predictive understanding of landscape valuation by the Punan Pelancau people of East Kalimantan
cemeteries but without actually encroaching on these areas) or on mountain top areas (too distant).
The significance of salt springs is that these features attract wildlife and so are considered to be good areas for hunting. However, the actual water and immediately surrounding area is considered to be sacred and as such should not be disturbed. For example, one is not permitted to drink the water from salt springs. Some people were clearly uneasy about visiting these sites and working in the vicinity.
There are two types of burial site. Individuals who die whilst moving in the forest are buried where they die. Those who die whilst in the village are buried in a communal burial site. Unlike other tribes of the Malinau, the Punan do not mark their burial sites ostentatiously, although their presence can sometimes be depicted by simple wooden crosses. Such areas should not be disturbed in any way. Regarding graveyards in the forest, it was said to be an offence to knowingly disturb a burial area, but if one were to do so without knowing then no offence would have been committed. It follows that the significance of burial sites will decay with time, as they become less obvious. Burial sites could potentially serve to reinforce cultural ties or claims to certain territories but this was not perceived as
being of any marked importance. A total of 17 graveyards were identified (Table 18), the majority of which were small burial sites within the forest, and many of which were relatively old.
Without visiting the mountain top sites, it was difficult to assess the rules associated with these areas. However, areas with big stones are believed to be the terrain of spirits, and it is not possible to sleep in these areas. These areas do not harbour many useful resources and are not considered to be of any particular value, though several community members had visited these sites. Same sacred status may still remain.
Income and expenditureFourteen sources of income were identified (Table 19). All households received money from concession fees, and this was rated as being the second most important source of income, accounting for 20% of the overall RIW. Other sources of income received by many households and given high importance were sales of eaglewood (50% of households and 40% of RIW) and rattan products (30% of households and 20% of RIW). The running of shops, and selling of meat and fish, although identified as being of relatively high importance (25%, 15% and 10% of RIW, respectively) were confined to only a few households (≤ 5%). Conversely, sales of chickens,
Table 17. Estimated times taken to move from Lio Mutai to various upstream destinations, using different forms of transport, and to move downstream from various places to Lio Mutai, with either an empty or full boat, or whilst walking either with or without a load
Destination Boat Path Road Walking in ForestUpstreamKuala Sungai Bahau 1 hr 1 day 3.5 hr 1 dayKuala Sungai Nait 1 hr 5 min 1 day + 1.5 hr 4 hr 4 hrKuala Sungai Metan 2.5 hr 1 day + 3 hr 5 hr 4 hrHulu Sungai Avang 2.5 hr + 3 hr foot 1 day + 4.5 hr 1 day + 4.5 hr 1 day + 4.5 hr Hulu Sungai Lemirang 3.5 hr + 1 day foot 2 day 2 day 2 dayKuala Sungai Mekayan 4 hr 3 day 3 day 3 dayKuala Sungai Menoreh 4.5 hr 3 day + 1 hr 3 day + 1 hr 3 day + 1 hrKuala Sungai Wang 5 hr 3 day + 3.5 hr 3 day + 3.5 hrs 3 day + 3.5 hrKuala Sungai Hung 5 hr 5 min 4 day + 4 hr 4 day + 4 hrs 4 day + 4 hrHulu Sungai Pelancau 5 hr + 1 day foot 3 day + 2 hr 2.5 day 3 day + 2 hrDownstream Boat empty Boat full Walking – no load Walking with loadKuala Sungai Bahau 0.5 hr 0.5 hr 8 hr 11 hrKuala Sungai Metan 1 hr 1 hr 8.5 hr 12 hrKuala Sungai Avang 1 hr 1 hr 8.5 hr 12 hrKuala Sungai Lemirang 1.5 hr 1.5 hr - -Kuala Sungai Mekayan 1.5 hr 1.5 hr - -
hr = hour; min = minuteSource: Lio Mutai CAT
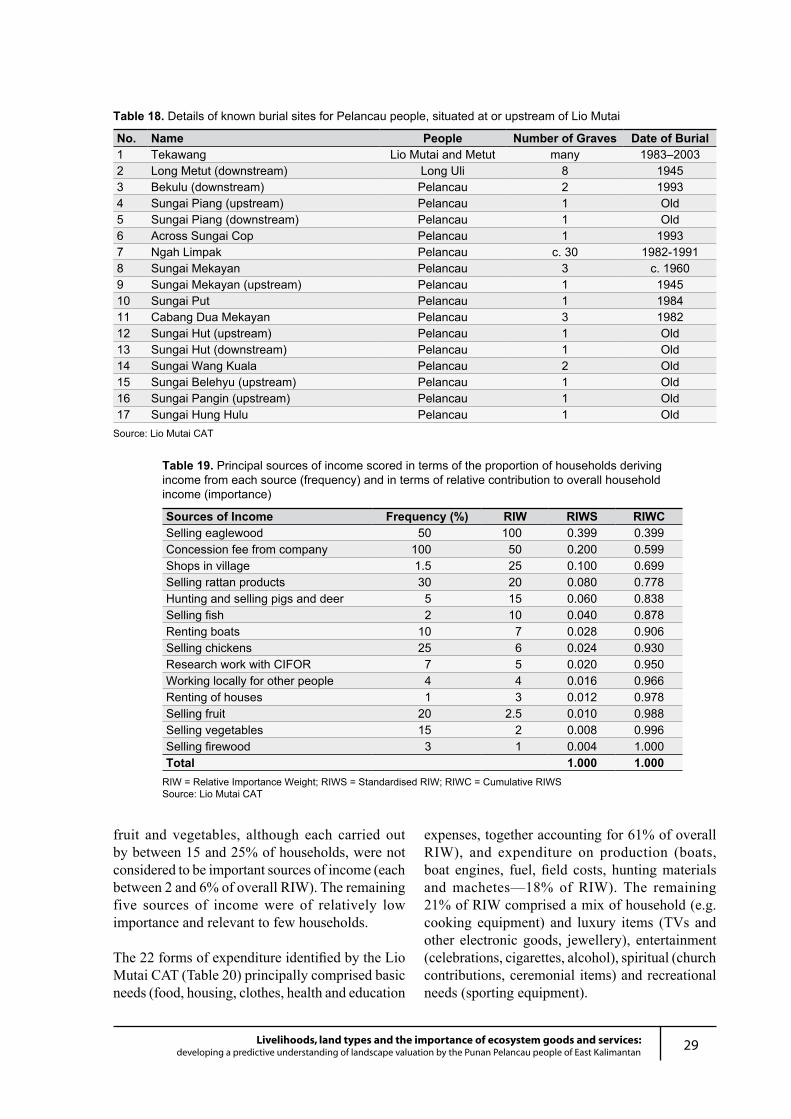
29Livelihoods, land types and the importance of ecosystem goods and services:developing a predictive understanding of landscape valuation by the Punan Pelancau people of East Kalimantan
Table 18. Details of known burial sites for Pelancau people, situated at or upstream of Lio Mutai
No. Name People Number of Graves Date of Burial1 Tekawang Lio Mutai and Metut many 1983–20032 Long Metut (downstream) Long Uli 8 19453 Bekulu (downstream) Pelancau 2 19934 Sungai Piang (upstream) Pelancau 1 Old5 Sungai Piang (downstream) Pelancau 1 Old6 Across Sungai Cop Pelancau 1 19937 Ngah Limpak Pelancau c. 30 1982-19918 Sungai Mekayan Pelancau 3 c. 19609 Sungai Mekayan (upstream) Pelancau 1 194510 Sungai Put Pelancau 1 198411 Cabang Dua Mekayan Pelancau 3 198212 Sungai Hut (upstream) Pelancau 1 Old13 Sungai Hut (downstream) Pelancau 1 Old14 Sungai Wang Kuala Pelancau 2 Old15 Sungai Belehyu (upstream) Pelancau 1 Old16 Sungai Pangin (upstream) Pelancau 1 Old17 Sungai Hung Hulu Pelancau 1 Old
Source: Lio Mutai CAT
fruit and vegetables, although each carried out by between 15 and 25% of households, were not considered to be important sources of income (each between 2 and 6% of overall RIW). The remaining five sources of income were of relatively low importance and relevant to few households.
The 22 forms of expenditure identified by the Lio Mutai CAT (Table 20) principally comprised basic needs (food, housing, clothes, health and education
expenses, together accounting for 61% of overall RIW), and expenditure on production (boats, boat engines, fuel, field costs, hunting materials and machetes—18% of RIW). The remaining 21% of RIW comprised a mix of household (e.g. cooking equipment) and luxury items (TVs and other electronic goods, jewellery), entertainment (celebrations, cigarettes, alcohol), spiritual (church contributions, ceremonial items) and recreational needs (sporting equipment).
Table 19. Principal sources of income scored in terms of the proportion of households deriving income from each source (frequency) and in terms of relative contribution to overall household income (importance)
Sources of Income Frequency (%) RIW RIWS RIWCSelling eaglewood 50 100 0.399 0.399Concession fee from company 100 50 0.200 0.599Shops in village 1.5 25 0.100 0.699Selling rattan products 30 20 0.080 0.778Hunting and selling pigs and deer 5 15 0.060 0.838Selling fish 2 10 0.040 0.878Renting boats 10 7 0.028 0.906Selling chickens 25 6 0.024 0.930Research work with CIFOR 7 5 0.020 0.950Working locally for other people 4 4 0.016 0.966Renting of houses 1 3 0.012 0.978Selling fruit 20 2.5 0.010 0.988Selling vegetables 15 2 0.008 0.996Selling firewood 3 1 0.004 1.000Total 1.000 1.000
RIW = Relative Importance Weight; RIWS = Standardised RIW; RIWC = Cumulative RIWS Source: Lio Mutai CAT
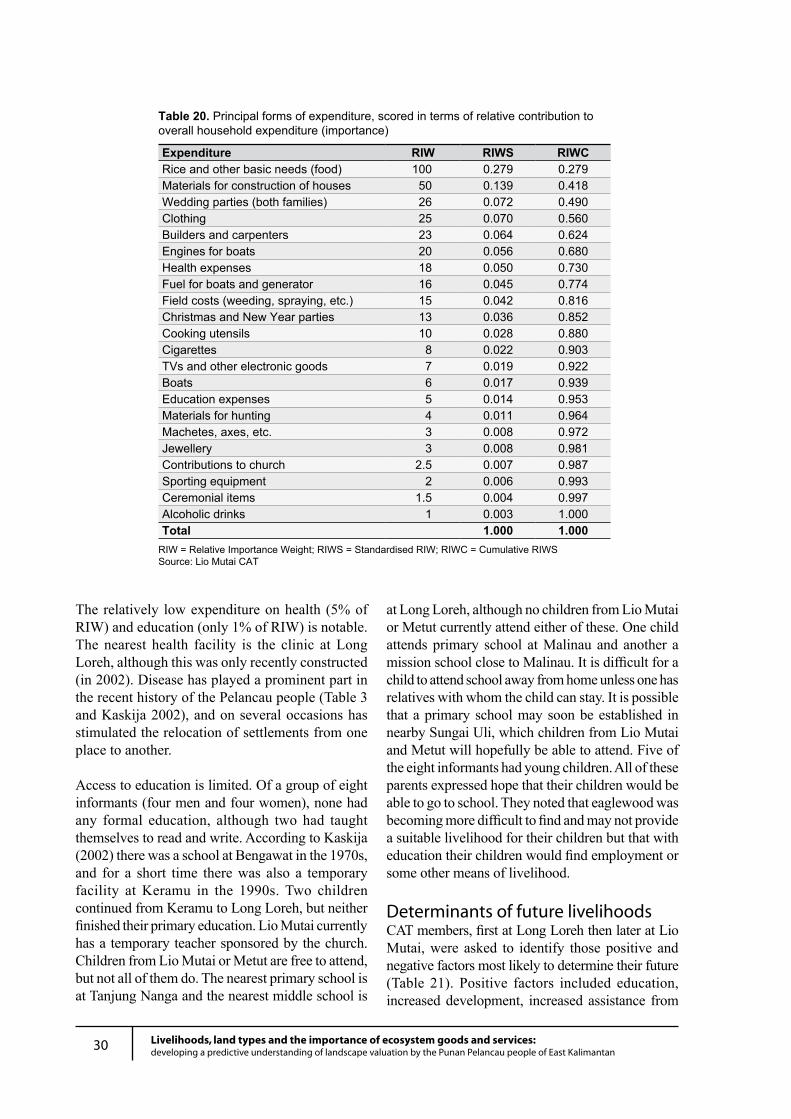
30 Livelihoods, land types and the importance of ecosystem goods and services:developing a predictive understanding of landscape valuation by the Punan Pelancau people of East Kalimantan
The relatively low expenditure on health (5% of RIW) and education (only 1% of RIW) is notable. The nearest health facility is the clinic at Long Loreh, although this was only recently constructed (in 2002). Disease has played a prominent part in the recent history of the Pelancau people (Table 3 and Kaskija 2002), and on several occasions has stimulated the relocation of settlements from one place to another.
Access to education is limited. Of a group of eight informants (four men and four women), none had any formal education, although two had taught themselves to read and write. According to Kaskija (2002) there was a school at Bengawat in the 1970s, and for a short time there was also a temporary facility at Keramu in the 1990s. Two children continued from Keramu to Long Loreh, but neither finished their primary education. Lio Mutai currently has a temporary teacher sponsored by the church. Children from Lio Mutai or Metut are free to attend, but not all of them do. The nearest primary school is at Tanjung Nanga and the nearest middle school is
at Long Loreh, although no children from Lio Mutai or Metut currently attend either of these. One child attends primary school at Malinau and another a mission school close to Malinau. It is difficult for a child to attend school away from home unless one has relatives with whom the child can stay. It is possible that a primary school may soon be established in nearby Sungai Uli, which children from Lio Mutai and Metut will hopefully be able to attend. Five of the eight informants had young children. All of these parents expressed hope that their children would be able to go to school. They noted that eaglewood was becoming more difficult to find and may not provide a suitable livelihood for their children but that with education their children would find employment or some other means of livelihood.
Determinants of future livelihoodsCAT members, first at Long Loreh then later at Lio Mutai, were asked to identify those positive and negative factors most likely to determine their future (Table 21). Positive factors included education, increased development, increased assistance from
Table 20. Principal forms of expenditure, scored in terms of relative contribution to overall household expenditure (importance)
Expenditure RIW RIWS RIWCRice and other basic needs (food) 100 0.279 0.279Materials for construction of houses 50 0.139 0.418Wedding parties (both families) 26 0.072 0.490Clothing 25 0.070 0.560Builders and carpenters 23 0.064 0.624Engines for boats 20 0.056 0.680Health expenses 18 0.050 0.730Fuel for boats and generator 16 0.045 0.774Field costs (weeding, spraying, etc.) 15 0.042 0.816Christmas and New Year parties 13 0.036 0.852Cooking utensils 10 0.028 0.880Cigarettes 8 0.022 0.903TVs and other electronic goods 7 0.019 0.922Boats 6 0.017 0.939Education expenses 5 0.014 0.953Materials for hunting 4 0.011 0.964Machetes, axes, etc. 3 0.008 0.972Jewellery 3 0.008 0.981Contributions to church 2.5 0.007 0.987Sporting equipment 2 0.006 0.993Ceremonial items 1.5 0.004 0.997Alcoholic drinks 1 0.003 1.000Total 1.000 1.000
RIW = Relative Importance Weight; RIWS = Standardised RIW; RIWC = Cumulative RIWSSource: Lio Mutai CAT
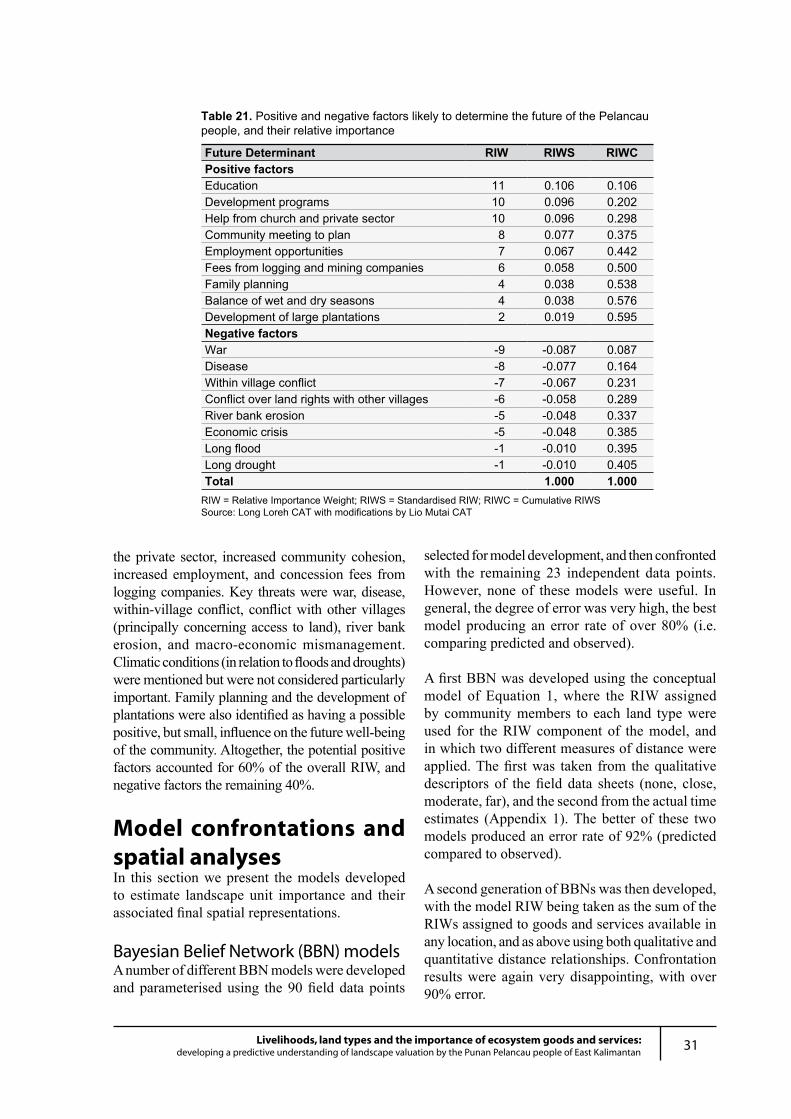
31Livelihoods, land types and the importance of ecosystem goods and services:developing a predictive understanding of landscape valuation by the Punan Pelancau people of East Kalimantan
the private sector, increased community cohesion, increased employment, and concession fees from logging companies. Key threats were war, disease, within-village conflict, conflict with other villages (principally concerning access to land), river bank erosion, and macro-economic mismanagement. Climatic conditions (in relation to floods and droughts) were mentioned but were not considered particularly important. Family planning and the development of plantations were also identified as having a possible positive, but small, influence on the future well-being of the community. Altogether, the potential positive factors accounted for 60% of the overall RIW, and negative factors the remaining 40%.
Model confrontations and spatial analysesIn this section we present the models developed to estimate landscape unit importance and their associated final spatial representations.
Bayesian Belief Network (BBN) modelsA number of different BBN models were developed and parameterised using the 90 field data points
Table 21. Positive and negative factors likely to determine the future of the Pelancau people, and their relative importance
Future Determinant RIW RIWS RIWCPositive factorsEducation 11 0.106 0.106Development programs 10 0.096 0.202Help from church and private sector 10 0.096 0.298Community meeting to plan 8 0.077 0.375Employment opportunities 7 0.067 0.442Fees from logging and mining companies 6 0.058 0.500Family planning 4 0.038 0.538Balance of wet and dry seasons 4 0.038 0.576Development of large plantations 2 0.019 0.595Negative factorsWar -9 -0.087 0.087Disease -8 -0.077 0.164Within village conflict -7 -0.067 0.231Conflict over land rights with other villages -6 -0.058 0.289River bank erosion -5 -0.048 0.337Economic crisis -5 -0.048 0.385Long flood -1 -0.010 0.395Long drought -1 -0.010 0.405Total 1.000 1.000
RIW = Relative Importance Weight; RIWS = Standardised RIW; RIWC = Cumulative RIWSSource: Long Loreh CAT with modifications by Lio Mutai CAT
selected for model development, and then confronted with the remaining 23 independent data points. However, none of these models were useful. In general, the degree of error was very high, the best model producing an error rate of over 80% (i.e. comparing predicted and observed).
A first BBN was developed using the conceptual model of Equation 1, where the RIW assigned by community members to each land type were used for the RIW component of the model, and in which two different measures of distance were applied. The first was taken from the qualitative descriptors of the field data sheets (none, close, moderate, far), and the second from the actual time estimates (Appendix 1). The better of these two models produced an error rate of 92% (predicted compared to observed).
A second generation of BBNs was then developed, with the model RIW being taken as the sum of the RIWs assigned to goods and services available in any location, and as above using both qualitative and quantitative distance relationships. Confrontation results were again very disappointing, with over 90% error.
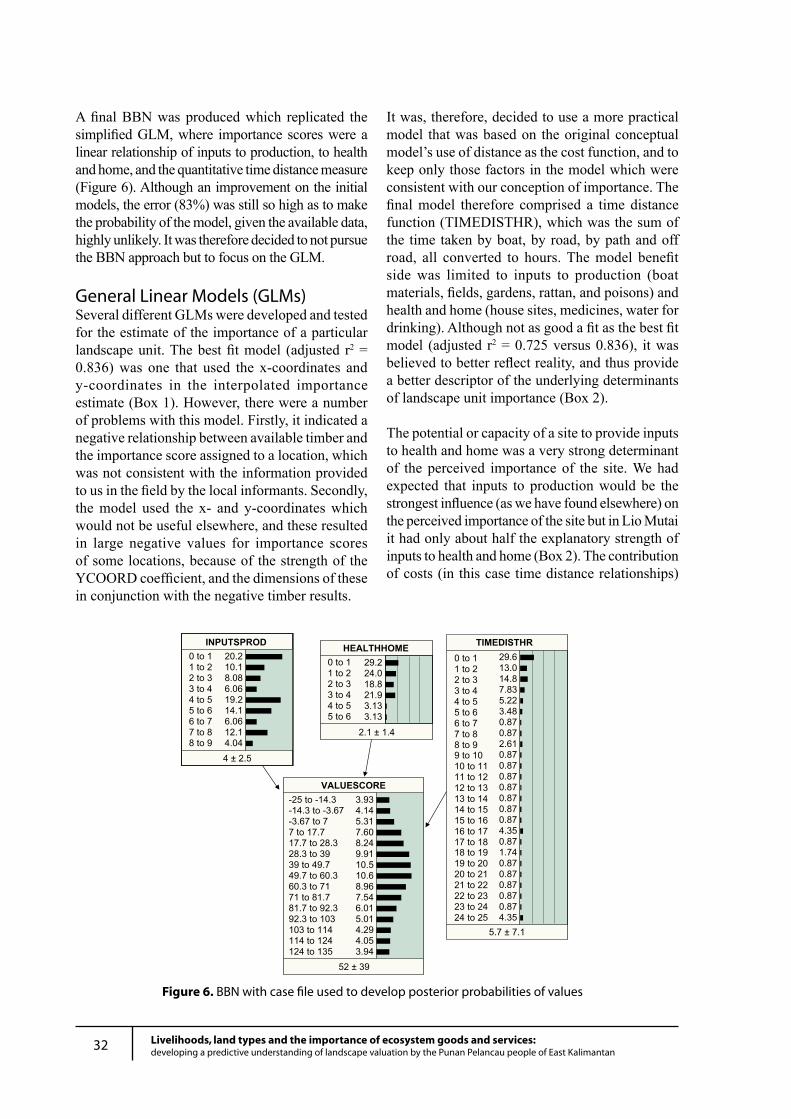
32 Livelihoods, land types and the importance of ecosystem goods and services:developing a predictive understanding of landscape valuation by the Punan Pelancau people of East Kalimantan
0 to 11 to 22 to 33 to 44 to 55 to 6
0 to 11 to 22 to 33 to 44 to 55 to 66 to 77 to 88 to 9
20.210.18.086.0619.214.16.0612.14.044 ± 2.5
-25 to -14.3-14.3 to -3.67-3.67 to 77 to 17.717.7 to 28.328.3 to 3939 to 49.749.7 to 60.360.3 to 7171 to 81.781.7 to 92.392.3 to 103103 to 114114 to 124124 to 135
3.934.145.317.608.249.9110.510.68.967.546.015.014.294.053.94
52 ± 39
29.613.014.87.835.223.480.870.872.610.870.870.870.870.870.870.874.350.871.740.870.870.870.870.874.35
5.7 ± 7.1
29.224.018.821.93.133.13
2.1 ± 1.4
INPUTSPROD HEALTHHOME TIMEDISTHR
VALUESCORE
0 to 11 to 22 to 33 to 44 to 55 to 66 to 77 to 88 to 99 to 1010 to 1111 to 1212 to 1313 to 1414 to 1515 to 1616 to 1717 to 1818 to 1919 to 2020 to 2121 to 2222 to 2323 to 2424 to 25
Figure 6. BBN with case file used to develop posterior probabilities of values
A final BBN was produced which replicated the simplified GLM, where importance scores were a linear relationship of inputs to production, to health and home, and the quantitative time distance measure (Figure 6). Although an improvement on the initial models, the error (83%) was still so high as to make the probability of the model, given the available data, highly unlikely. It was therefore decided to not pursue the BBN approach but to focus on the GLM.
General Linear Models (GLMs)Several different GLMs were developed and tested for the estimate of the importance of a particular landscape unit. The best fit model (adjusted r2 = 0.836) was one that used the x-coordinates and y-coordinates in the interpolated importance estimate (Box 1). However, there were a number of problems with this model. Firstly, it indicated a negative relationship between available timber and the importance score assigned to a location, which was not consistent with the information provided to us in the field by the local informants. Secondly, the model used the x- and y-coordinates which would not be useful elsewhere, and these resulted in large negative values for importance scores of some locations, because of the strength of the YCOORD coefficient, and the dimensions of these in conjunction with the negative timber results.
It was, therefore, decided to use a more practical model that was based on the original conceptual model’s use of distance as the cost function, and to keep only those factors in the model which were consistent with our conception of importance. The final model therefore comprised a time distance function (TIMEDISTHR), which was the sum of the time taken by boat, by road, by path and off road, all converted to hours. The model benefit side was limited to inputs to production (boat materials, fields, gardens, rattan, and poisons) and health and home (house sites, medicines, water for drinking). Although not as good a fit as the best fit model (adjusted r2 = 0.725 versus 0.836), it was believed to better reflect reality, and thus provide a better descriptor of the underlying determinants of landscape unit importance (Box 2).
The potential or capacity of a site to provide inputs to health and home was a very strong determinant of the perceived importance of the site. We had expected that inputs to production would be the strongest influence (as we have found elsewhere) on the perceived importance of the site but in Lio Mutai it had only about half the explanatory strength of inputs to health and home (Box 2). The contribution of costs (in this case time distance relationships)
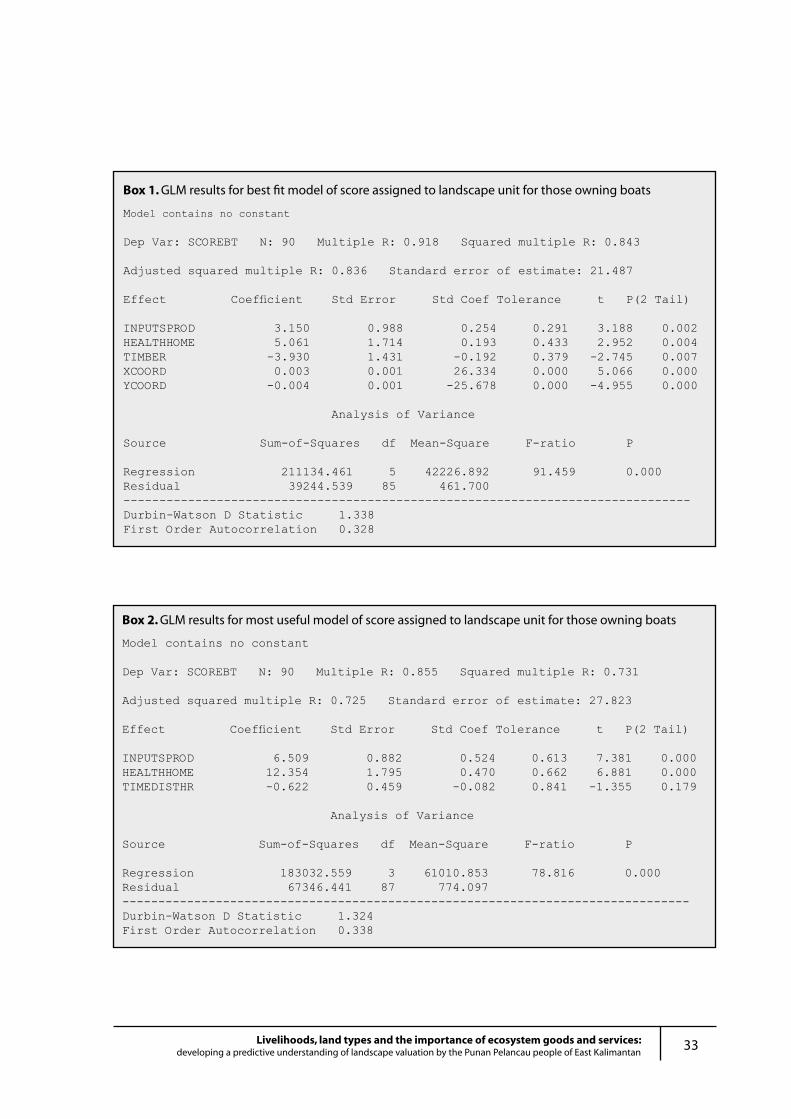
33Livelihoods, land types and the importance of ecosystem goods and services:developing a predictive understanding of landscape valuation by the Punan Pelancau people of East Kalimantan
Box 1. GLM results for best fit model of score assigned to landscape unit for those owning boats
Model contains no constant Dep Var: SCOREBT N: 90 Multiple R: 0.918 Squared multiple R: 0.843 Adjusted squared multiple R: 0.836 Standard error of estimate: 21.487 Effect Coefficient Std Error Std Coef Tolerance t P(2 Tail) INPUTSPROD 3.150 0.988 0.254 0.291 3.188 0.002HEALTHHOME 5.061 1.714 0.193 0.433 2.952 0.004TIMBER -3.930 1.431 -0.192 0.379 -2.745 0.007XCOORD 0.003 0.001 26.334 0.000 5.066 0.000YCOORD -0.004 0.001 -25.678 0.000 -4.955 0.000 Analysis of Variance Source Sum-of-Squares df Mean-Square F-ratio P Regression 211134.461 5 42226.892 91.459 0.000Residual 39244.539 85 461.700-------------------------------------------------------------------------------Durbin-Watson D Statistic 1.338First Order Autocorrelation 0.328
Box 2. GLM results for most useful model of score assigned to landscape unit for those owning boats
Model contains no constant Dep Var: SCOREBT N: 90 Multiple R: 0.855 Squared multiple R: 0.731 Adjusted squared multiple R: 0.725 Standard error of estimate: 27.823 Effect Coefficient Std Error Std Coef Tolerance t P(2 Tail) INPUTSPROD 6.509 0.882 0.524 0.613 7.381 0.000HEALTHHOME 12.354 1.795 0.470 0.662 6.881 0.000TIMEDISTHR -0.622 0.459 -0.082 0.841 -1.355 0.179 Analysis of Variance Source Sum-of-Squares df Mean-Square F-ratio P Regression 183032.559 3 61010.853 78.816 0.000Residual 67346.441 87 774.097-------------------------------------------------------------------------------Durbin-Watson D Statistic 1.324First Order Autocorrelation 0.338
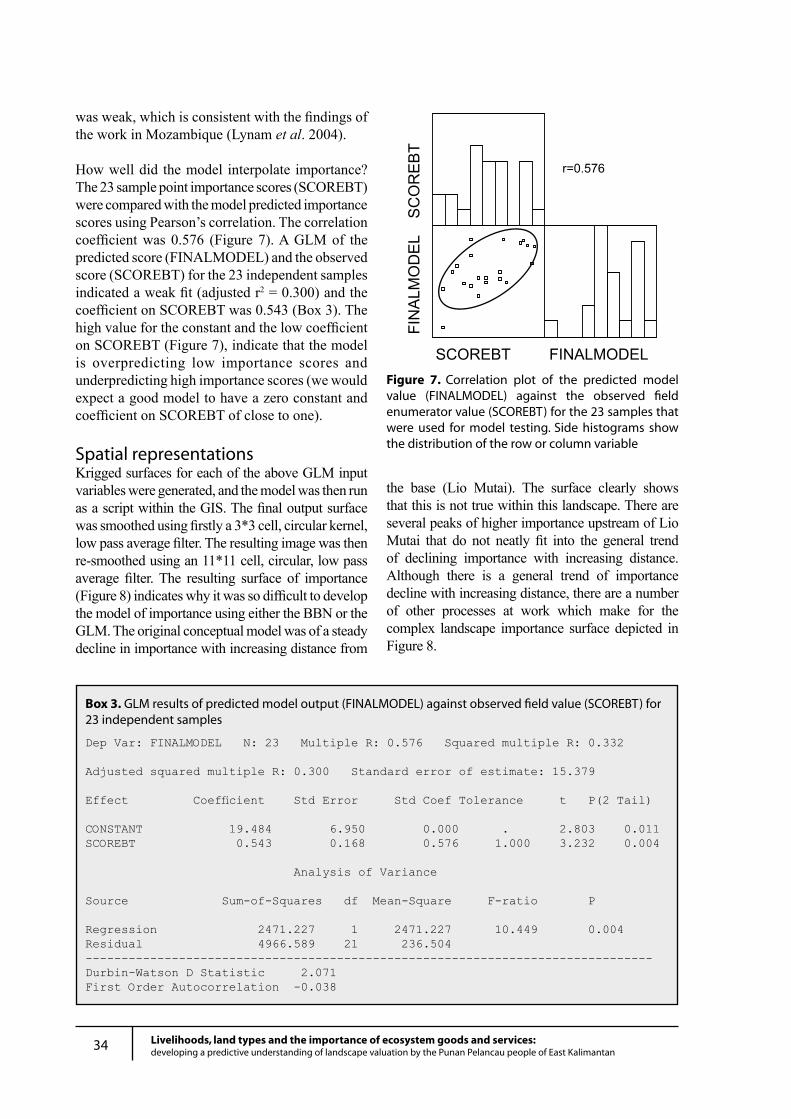
34 Livelihoods, land types and the importance of ecosystem goods and services:developing a predictive understanding of landscape valuation by the Punan Pelancau people of East Kalimantan
Box 3. GLM results of predicted model output (FINALMODEL) against observed field value (SCOREBT) for 23 independent samples
Dep Var: FINALMODEL N: 23 Multiple R: 0.576 Squared multiple R: 0.332 Adjusted squared multiple R: 0.300 Standard error of estimate: 15.379 Effect Coefficient Std Error Std Coef Tolerance t P(2 Tail) CONSTANT 19.484 6.950 0.000 . 2.803 0.011SCOREBT 0.543 0.168 0.576 1.000 3.232 0.004 Analysis of Variance Source Sum-of-Squares df Mean-Square F-ratio P Regression 2471.227 1 2471.227 10.449 0.004Residual 4966.589 21 236.504-------------------------------------------------------------------------------Durbin-Watson D Statistic 2.071First Order Autocorrelation -0.038
was weak, which is consistent with the findings of the work in Mozambique (Lynam et al. 2004).
How well did the model interpolate importance? The 23 sample point importance scores (SCOREBT) were compared with the model predicted importance scores using Pearson’s correlation. The correlation coefficient was 0.576 (Figure 7). A GLM of the predicted score (FINALMODEL) and the observed score (SCOREBT) for the 23 independent samples indicated a weak fit (adjusted r2 = 0.300) and the coefficient on SCOREBT was 0.543 (Box 3). The high value for the constant and the low coefficient on SCOREBT (Figure 7), indicate that the model is overpredicting low importance scores and underpredicting high importance scores (we would expect a good model to have a zero constant and coefficient on SCOREBT of close to one).
Spatial representationsKrigged surfaces for each of the above GLM input variables were generated, and the model was then run as a script within the GIS. The final output surface was smoothed using firstly a 3*3 cell, circular kernel, low pass average filter. The resulting image was then re-smoothed using an 11*11 cell, circular, low pass average filter. The resulting surface of importance (Figure 8) indicates why it was so difficult to develop the model of importance using either the BBN or the GLM. The original conceptual model was of a steady decline in importance with increasing distance from
Figure 7. Correlation plot of the predicted model value (FINALMODEL) against the observed field enumerator value (SCOREBT) for the 23 samples that were used for model testing. Side histograms show the distribution of the row or column variable
the base (Lio Mutai). The surface clearly shows that this is not true within this landscape. There are several peaks of higher importance upstream of Lio Mutai that do not neatly fit into the general trend of declining importance with increasing distance. Although there is a general trend of importance decline with increasing distance, there are a number of other processes at work which make for the complex landscape importance surface depicted in Figure 8.
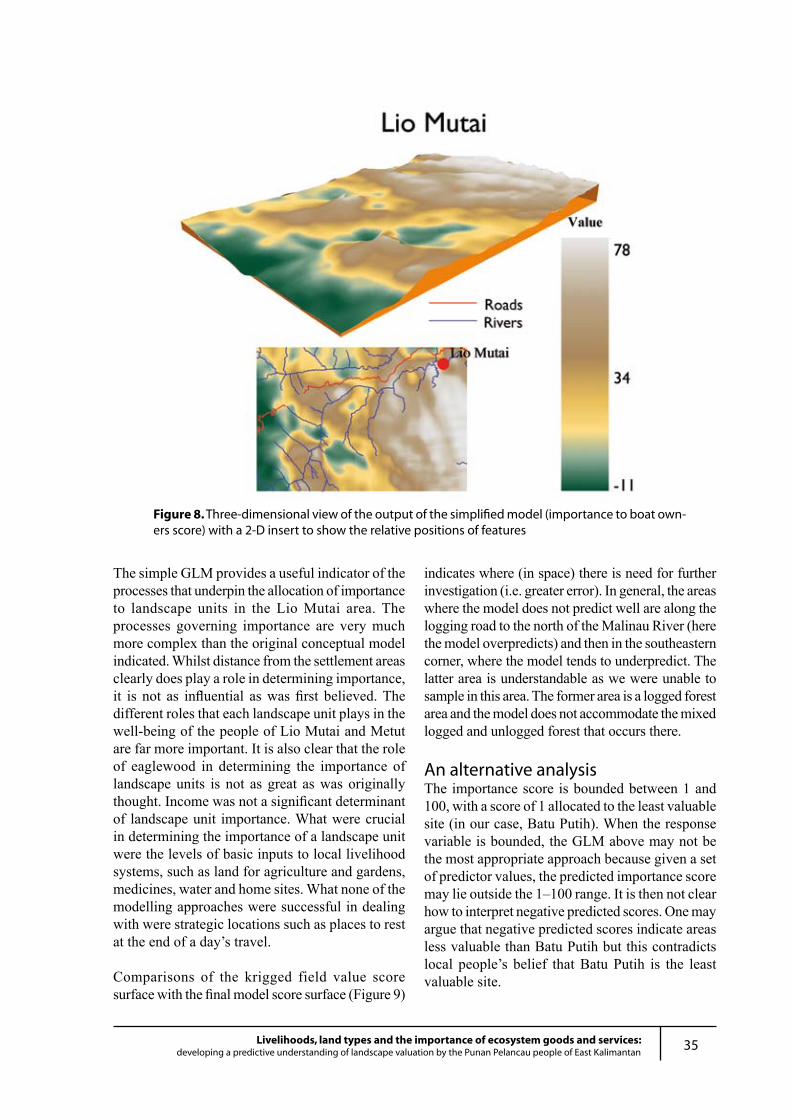
35Livelihoods, land types and the importance of ecosystem goods and services:developing a predictive understanding of landscape valuation by the Punan Pelancau people of East Kalimantan
Figure 8. Three-dimensional view of the output of the simplified model (importance to boat own-ers score) with a 2-D insert to show the relative positions of features
The simple GLM provides a useful indicator of the processes that underpin the allocation of importance to landscape units in the Lio Mutai area. The processes governing importance are very much more complex than the original conceptual model indicated. Whilst distance from the settlement areas clearly does play a role in determining importance, it is not as influential as was first believed. The different roles that each landscape unit plays in the well-being of the people of Lio Mutai and Metut are far more important. It is also clear that the role of eaglewood in determining the importance of landscape units is not as great as was originally thought. Income was not a significant determinant of landscape unit importance. What were crucial in determining the importance of a landscape unit were the levels of basic inputs to local livelihood systems, such as land for agriculture and gardens, medicines, water and home sites. What none of the modelling approaches were successful in dealing with were strategic locations such as places to rest at the end of a day’s travel.
Comparisons of the krigged field value score surface with the final model score surface (Figure 9)
indicates where (in space) there is need for further investigation (i.e. greater error). In general, the areas where the model does not predict well are along the logging road to the north of the Malinau River (here the model overpredicts) and then in the southeastern corner, where the model tends to underpredict. The latter area is understandable as we were unable to sample in this area. The former area is a logged forest area and the model does not accommodate the mixed logged and unlogged forest that occurs there.
An alternative analysisThe importance score is bounded between 1 and 100, with a score of 1 allocated to the least valuable site (in our case, Batu Putih). When the response variable is bounded, the GLM above may not be the most appropriate approach because given a set of predictor values, the predicted importance score may lie outside the 1–100 range. It is then not clear how to interpret negative predicted scores. One may argue that negative predicted scores indicate areas less valuable than Batu Putih but this contradicts local people’s belief that Batu Putih is the least valuable site.
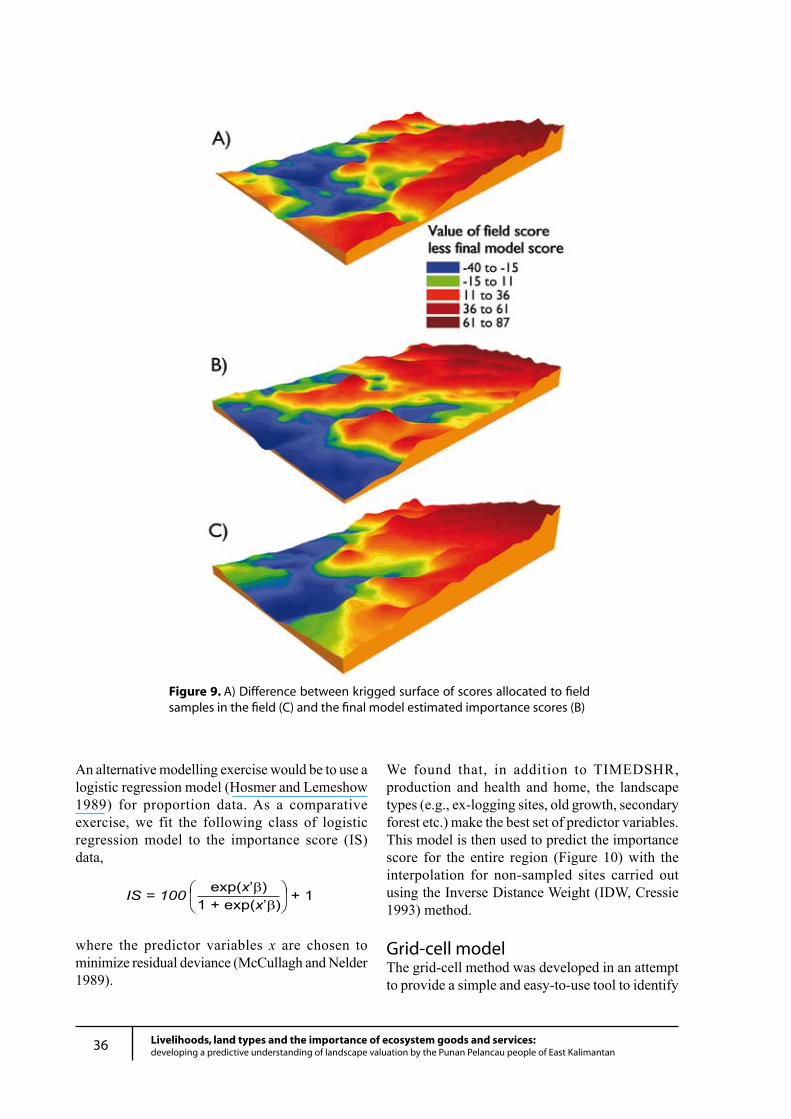
36 Livelihoods, land types and the importance of ecosystem goods and services:developing a predictive understanding of landscape valuation by the Punan Pelancau people of East Kalimantan
An alternative modelling exercise would be to use a logistic regression model (Hosmer and Lemeshow 1989) for proportion data. As a comparative exercise, we fit the following class of logistic regression model to the importance score (IS) data,
where the predictor variables x are chosen to minimize residual deviance (McCullagh and Nelder 1989).
We found that, in addition to TIMEDSHR, production and health and home, the landscape types (e.g., ex-logging sites, old growth, secondary forest etc.) make the best set of predictor variables. This model is then used to predict the importance score for the entire region (Figure 10) with the interpolation for non-sampled sites carried out using the Inverse Distance Weight (IDW, Cressie 1993) method.
Grid-cell modelThe grid-cell method was developed in an attempt to provide a simple and easy-to-use tool to identify
Figure 9. A) Difference between krigged surface of scores allocated to field samples in the field (C) and the final model estimated importance scores (B)
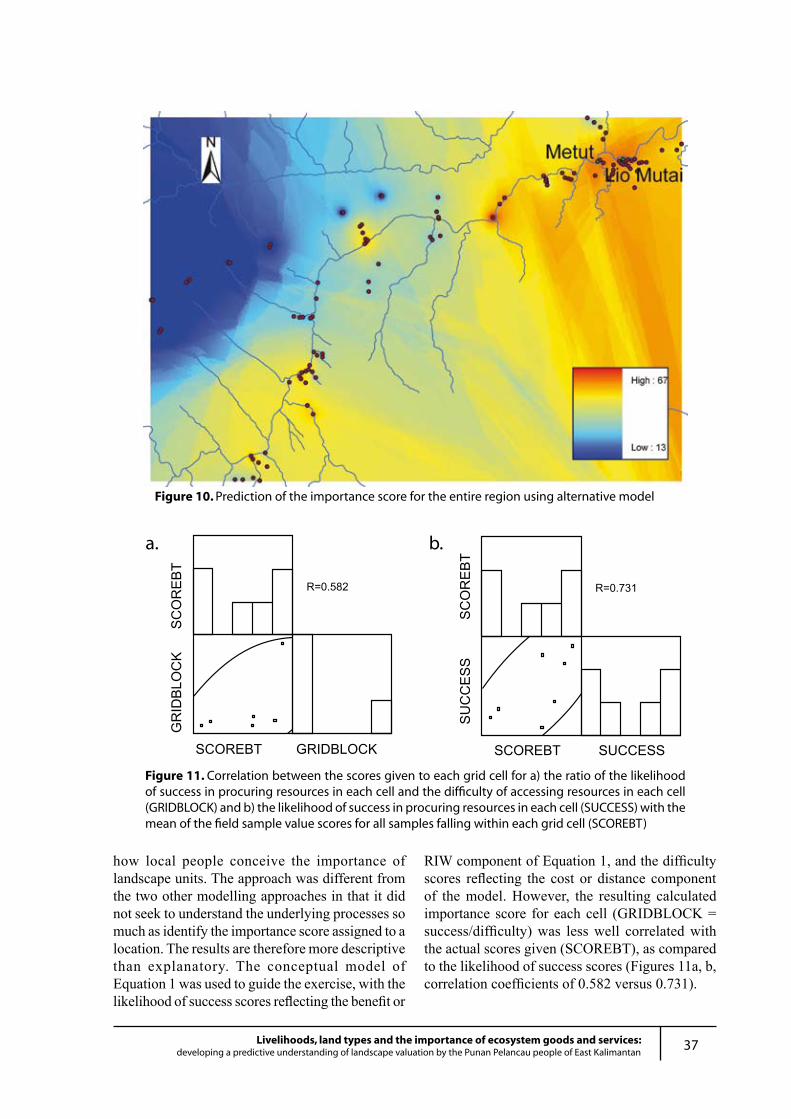
37Livelihoods, land types and the importance of ecosystem goods and services:developing a predictive understanding of landscape valuation by the Punan Pelancau people of East Kalimantan
Figure 10. Prediction of the importance score for the entire region using alternative model
how local people conceive the importance of landscape units. The approach was different from the two other modelling approaches in that it did not seek to understand the underlying processes so much as identify the importance score assigned to a location. The results are therefore more descriptive than explanatory. The conceptual model of Equation 1 was used to guide the exercise, with the likelihood of success scores reflecting the benefit or
Figure 11. Correlation between the scores given to each grid cell for a) the ratio of the likelihood of success in procuring resources in each cell and the difficulty of accessing resources in each cell (GRIDBLOCK) and b) the likelihood of success in procuring resources in each cell (SUCCESS) with the mean of the field sample value scores for all samples falling within each grid cell (SCOREBT)
a. b.
RIW component of Equation 1, and the difficulty scores reflecting the cost or distance component of the model. However, the resulting calculated importance score for each cell (GRIDBLOCK = success/difficulty) was less well correlated with the actual scores given (SCOREBT), as compared to the likelihood of success scores (Figures 11a, b, correlation coefficients of 0.582 versus 0.731).
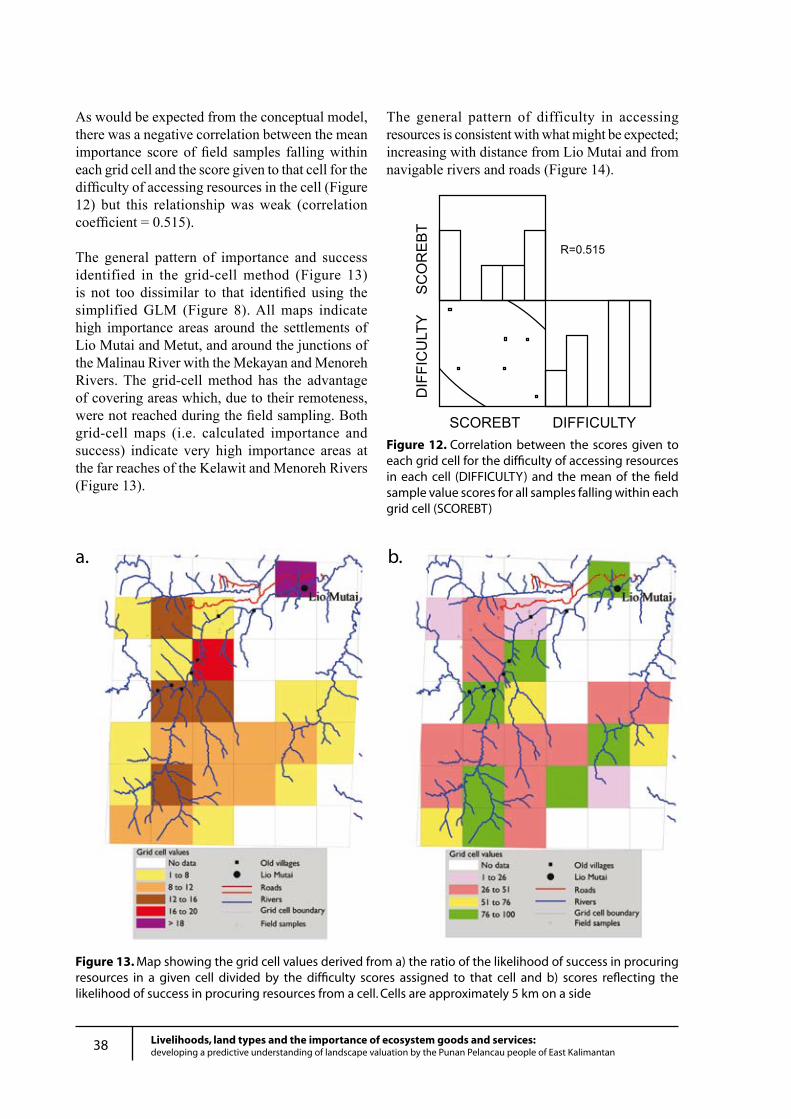
38 Livelihoods, land types and the importance of ecosystem goods and services:developing a predictive understanding of landscape valuation by the Punan Pelancau people of East Kalimantan
Figure 13. Map showing the grid cell values derived from a) the ratio of the likelihood of success in procuring resources in a given cell divided by the difficulty scores assigned to that cell and b) scores reflecting the likelihood of success in procuring resources from a cell. Cells are approximately 5 km on a side
a. b.
As would be expected from the conceptual model, there was a negative correlation between the mean importance score of field samples falling within each grid cell and the score given to that cell for the difficulty of accessing resources in the cell (Figure 12) but this relationship was weak (correlation coefficient = 0.515).
The general pattern of importance and success identified in the grid-cell method (Figure 13) is not too dissimilar to that identified using the simplified GLM (Figure 8). All maps indicate high importance areas around the settlements of Lio Mutai and Metut, and around the junctions of the Malinau River with the Mekayan and Menoreh Rivers. The grid-cell method has the advantage of covering areas which, due to their remoteness, were not reached during the field sampling. Both grid-cell maps (i.e. calculated importance and success) indicate very high importance areas at the far reaches of the Kelawit and Menoreh Rivers (Figure 13).
The general pattern of difficulty in accessing resources is consistent with what might be expected; increasing with distance from Lio Mutai and from navigable rivers and roads (Figure 14).
Figure 12. Correlation between the scores given to each grid cell for the difficulty of accessing resources in each cell (DIFFICULTY) and the mean of the field sample value scores for all samples falling within each grid cell (SCOREBT)
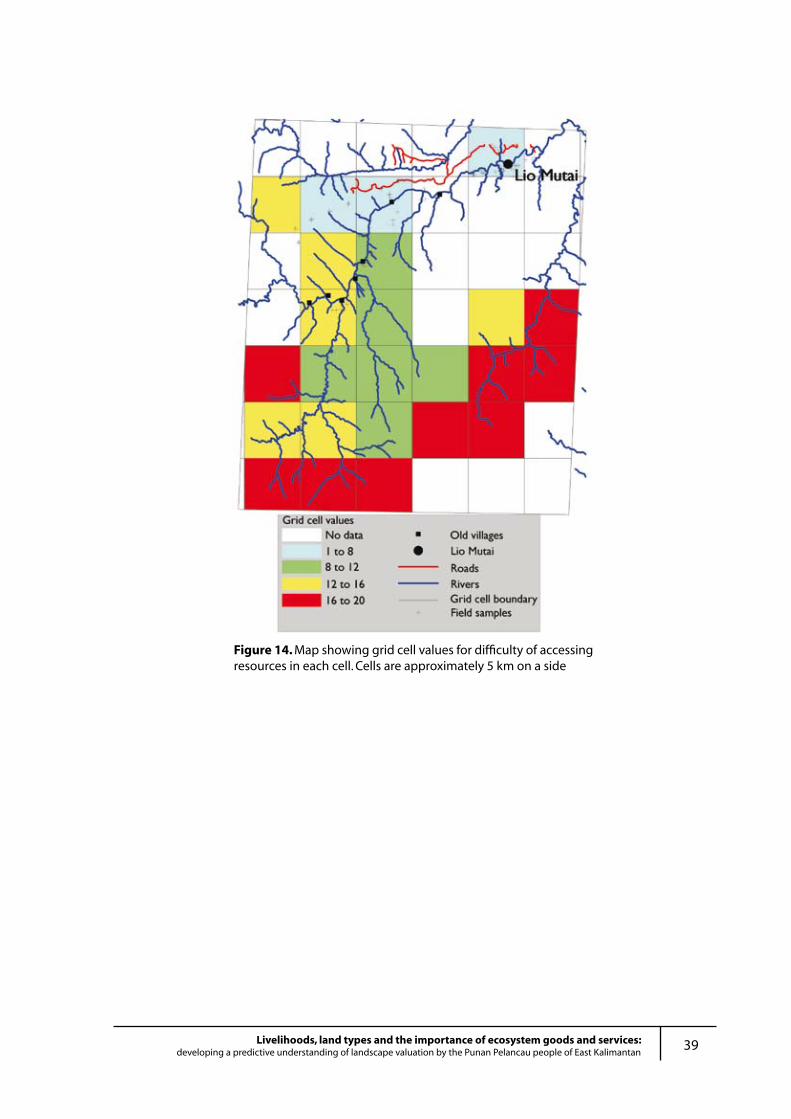
39Livelihoods, land types and the importance of ecosystem goods and services:developing a predictive understanding of landscape valuation by the Punan Pelancau people of East Kalimantan
Figure 14. Map showing grid cell values for difficulty of accessing resources in each cell. Cells are approximately 5 km on a side
40 Livelihoods, land types and the importance of ecosystem goods and services:developing a predictive understanding of landscape valuation by the Punan Pelancau people of East Kalimantan
Recent studies emphasise the rapid changes currently taking place within the upper Malinau basin (Kaskija 2002; Sellato 2001; Sheil et al. 2003). Some relate to the Malinau in particular, while others are a product of national trends such as changing patterns of governance and economic conditions.
Access has improved, initially through the introduction of boats and engines in the 1980s, and more recently through construction of several roads into the upper Malinau. This has eased transport difficulties, leading to an increase in shops in the larger villages such as Long Loreh, and even the smaller villages such as Lio Mutai and Metut (each of which now has two kiosks supplying basic household requirements). The development of roads is also leading to changes in settlement patterns, as roads become focal points for new settlements and cultivation.
Improving access has also led to increased interest and presence in the region by outsiders (and vice versa), including the establishment of a number of commercial mining and logging concessions. This has increased competition for land, both within and between villages. It has also created new opportunities for employment (although few jobs have gone to Punan), new markets for local produce and compensation fees.
These developments occur in a vacuum of governance, such that regulation, roles and responsibilities concerning land ownership and resources are in a state of considerable flux and confusion. Logging and land clearing permits are
now allocated by local authorities rather than central government. In some cases villagers appear to be successfully establishing stronger control over local resources. Elsewhere the reverse seems true. In response to the rising awareness of the importance of actual ownership of land, there are a growing number of land disputes both within villages and concerning boundaries between villages, and individualistic behaviour is on the increase.
A further consequence of increasing access and openness to the outside world has been the introduction of new technologies, such as chainsaws for clearing land, the introduction of new crops and animals, and the use of agrochemicals such as herbicides.
Generally, the shift from a subsistence to a market economy appears to have begun, and this appears to be fuelling trends of increasing materialism and demands for improvements in the form of better social and economic conditions. However, in terms of health facilities, schools and employment opportunities, the Punan of the upper Malinau remain strongly disadvantaged. For example, reported levels of child mortality appear unacceptably high.
The field data collected confirm the presence of many of these trends, such as increasing ownership of boats, the recent introduction of roads, the establishment of a timber concession within the Pelancau territory (and from which the community now receives a regular concession fee), the selling of goods to the timber camp at Long Uli (such as meat, chickens, vegetables and fruit), the recent
Implications for the Pelancau PeopleImplications for the Pelancau People
41Livelihoods, land types and the importance of ecosystem goods and services:developing a predictive understanding of landscape valuation by the Punan Pelancau people of East Kalimantan
introduction of herbicides, the lack of health and schooling facilities, the limited opportunities for employment, and clear signs of increasing materialism.
The data also provided hints of potential threats to livelihoods. There were frequent reports that eaglewood is becoming increasingly difficult to find, thus threatening incomes, and that instead more emphasis is being placed on agricultural production or education in preparation for employment. Yet Sheil (2002) shows that the agricultural potential of Lio Mutai and Metut is particularly poor, and quite unsuitable for any large-scale establishment of plantation crops on a sustainable basis. The current timber concession provides an important source of income to the Pelancau community, but seemingly at a high price to the resource base. Most of the territory to the north of the Malinau has now been logged, and at this rate the pace of exploitation is likely to outstrip regeneration of the resource base. Other than such concession arrangements, there seem to be few alternatives to generating income from timber resources. Unless there are marked improvements in schooling the community will continue to be strongly disadvantaged in terms of employment opportunities and similarly, unless access to health facilities is improved, high mortality will continue.
The concerns raised and responses given by CAT members indicate a high level of awareness of these potential livelihood problems. Some suggested
solutions included restricting or securing access to valuable resources such as eaglewood and timber (‘the eaglewood in our area should be for the Pelancau only’, ‘logging companies should not be allowed to come here without permission from our chief’, and ‘who is stronger, communities or government, in terms of allocating timber concessions?’); attracting support and business opportunities from outsiders (for example, through encouraging research activities by organisations such as CIFOR), and seeking to be more effective in putting forward their views to the outside world.
Another key finding of the study is that the Lio Mutai/Metut community has four disparate locations that are important to their well-being: these being their home village areas (Lio Mutai and Metut), the downstream settlement of Long Loreh and the upstream traditional territory. This is different from most (though not all) other communities and has many policy implications, particularly with respect to resettlement initiatives.
This study could contribute to the future well-being of the Pelancau people in two ways; firstly, through the enhanced understanding and self-awareness of their livelihood systems that the participatory process brings to community members; and secondly, through the general increase in knowledge and understanding of the community by others which should result in better informed management and policy decisions.
Implications for the Pelancau People
42 Livelihoods, land types and the importance of ecosystem goods and services:developing a predictive understanding of landscape valuation by the Punan Pelancau people of East Kalimantan
In this section we review the key lessons that we have learnt through this project and provide suggestions as to how the approach that was tested in Lio Mutai could be improved for use in other locations. To effectively evaluate what we have achieved and to propose changes that might lead to a robust and generally useful approach, we need to be clear on the context in which we expect the approach to be used. We therefore begin with a discussion of what we see as the context in which the approach and procedures developed and tested might be applied. This does not mean they could not or should not be used in any other context. We merely provide a referential context to facilitate the provision of tangible and useful suggestions rather than a list of possibly less useful abstractions. Having set the scene, we first examine the general approach employed, and then explore individually the approaches used for collection of community data, the field sampling, and the modelling and spatial analyses.
ContextThe principal objective of this work was to develop a method that enabled an improved understanding of how local people value landscapes, and how this can be represented spatially and extrapolated to wider areas. The underlying rationale for this, within a development context, is to contribute to improved management decisions by both local communities and other interested parties. The general approach followed was to formulate an a priori model of landscape importance, gather community data, use these findings to update the model, generate field sample data with which to test the model and, based
on the confrontation process, to again re-evaluate and update the model. Key aspects of this approach, we believe, are that it is participatory, iterative and promotes co-learning and that it serves to enhance the adaptive capacity of managers. In this section we discuss what we mean by co-learning and adaptive management capacity, and why we consider these to be important attributes.
To usefully identify the importance of some landscape unit we must be clear as to who needs to know, when and for what purpose. We anticipate, for example, that a geologist working for a coal mining company would identify different landscape units than would the people of Lio Mutai. She would probably also score the relative importance of these landscape units very differently to the way the people of Lio Mutai might score their importance. We identify two loosely defined classes of activity in which the processes described here might be embedded. The first is information extraction. This is the collection of information for some audience and purpose that does not directly involve the community. The second is co-learning. This is a process in which learning by researchers and community members is at least as important as the information generated. We acknowledge that these two approaches are end points of a continuum. But the selection of where the emphasis lies has important implications for what tools and procedures are used. In particular, it has implications for the level and type of interaction with the community (and other interested parties), for the selection of community participants, for the methods of data collection and analysis, and has important implications for the reliability of
Evaluating the ProcessEvaluating the Process
43Livelihoods, land types and the importance of ecosystem goods and services:developing a predictive understanding of landscape valuation by the Punan Pelancau people of East Kalimantan
the results. The procedures used in Lio Mutai were designed as part of a participatory, co-learning process. Our evaluation and suggestions are focused on this end of the continuum. It is here that we believe lasting impact may be achieved in terms of broad development aspirations.
Why do we focus on the co-learning approach? We believe that the ultimate goal of applied research (and we see what we have done as being predominantly applied), as contributing to the achievement of management or use practices that lead to socially desirable outcomes. We use the term socially to reflect society at large1.
It is widely accepted that managers need to understand the processes that govern the state of their worlds in order to effectively manage, or effectively lobby those who can manage, the factors that have an important impact on their current and future well-being. Satisfying this need to understand with information or training is a common and important development objective. But in a world of non-linear change and surprise is knowledge of processes enough to ensure sustained human well-being? We believe the answer is no. We are unlikely to ever know enough about the state or functioning of these systems, and the systems we, or the people of Lio Mutai, seek to manage are themselves forever changing. What then can be done? One solution is to seek to enhance the adaptive capacity of managers at all levels or scales, from individual through community to policy. What do we mean by enhance management capacity? In the context of the work in Lio Mutai we see enhanced adaptive capacity as including the following inter-related attributes:• Enhance the capacity of managers to identify
and to articulate socially acceptable goals or objectives.
• Enhance the capacity of managers to detect the state and changes in the state of their world, with precision and accuracy appropriate to the situation.
• Enhance the capacity of managers to learn. In particular, to learn about the complex web of relationships that link systems governing structures, process and events and human well-being.
• Enhance the capacity of managers to identify and implement economically, socio-politically, technically and ecologically feasible response options.
The identification of how important landscape elements are to the well-being of the people of Lio Mutai, in the context of the co-learning process followed, should have contributed to the articulation of social objectives (what is important to whom); to the detection of current states (through field sampling); and to learning through exploration, in a social context of what is important to whom and under what conditions. Due to the exploratory nature of this project none of these were particularly well developed, and the last was particularly weakly developed.
In Lio Mutai we asked the selected community representatives to do something they had not done before and may well not have even considered. We asked them to identify how important each landscape component or unit was to the well-being of their community. We asked this first in abstract terms and then went into the field and asked them to do it in concrete, practical terms. We are sure that in carrying out this activity with these people we altered their conceptions of the state of their world as well as stimulated them to think about the relationships among components of their world. When we ask a community group to score a landscape unit to reflect its importance to their well-being we are asking them to perform a very complex task. We suspect the assignment of importance is a function of the following information or processes:• The group's conception of the state or condition
of the world that we are asking about. What goods or services are in each location and how much of each of these are there?
• The group's conception of the relationships between the state or condition of the world and what is of importance to them (we assume their well-being). What are each of the goods and services used for, by whom, when and how does each of these uses contribute to or detract from individual or community well-being?
1 We recognise that different sectors of society and even different societies will weight different outcomes differently. At the very worst we could use Pareto optimality as a selection criterion here, but we recognise that existing social power relations may be the result of historical distortions and hence acknowledge that some people may have to be made a little worse off to make the disadvantaged a little better off.
44 Livelihoods, land types and the importance of ecosystem goods and services:developing a predictive understanding of landscape valuation by the Punan Pelancau people of East Kalimantan
• The group's (which may reflect their society's but also may just reflect the group's) preference ordering function which orders locations in terms of importance, based on the above considerations.
We use the term conceive intentionally. Few of the people we were asking to perform this complex task had ever been to the locations we were asking them to score for importance, or they had only been there some time ago. Thus they were manipulating abstract representations of the world, often with little direct experience of the things they were scoring.
There are important points to be made here. How the people conceive the world is crucial in the process. Their conceptions may be accurate but they may also be inaccurate. Some members of the group may have more accurate conceptions than others. The social ordering processes are important in establishing the relative weights of different conceptions of the state and relationships among components of the world held by different individuals. We are sure that through field visits people's conceptions are altered and we must thus expect importance ordering to change as new information is obtained by field visits. This is a normal and important part of a co-learning process. It is clearly a major problem for information extraction processes. We also suspect that through the processes of defining and then probing importance scores in the workshops that were used, the group's conceptions and hence importance orderings were also altered. These are key reasons why the process of defining landscape unit importance scores needs to be carefully planned. Information extraction under these conditions may be useful but it is also a risky undertaking in terms of providing reliable results.
We are thus clear proponents of the co-learning approach when dealing with social processes and states. Values, importance scores and preferences are all socially mediated variables. They are important components of the processes through which people manage their worlds. But they need to be understood in the context of adaptive, learning and purposive people living in hierarchically structured, multi-scale societies.
Overall approachBased on the above arguments, our first suggestion for effectively identifying the relative importance of different landscape units to local communities is to do it in a co-learning process. We see this as being a rich analytical approach that should: a) provide improved understanding, for both CIFOR and the communities involved, of the factors determining importance as well as the importance of different landscape units themselves; b) allow more reliable estimates of importance; and c) at the same time enhance the adaptive capacity of the community participants. In this respect the iteration between abstract exploration of importance and field sampling appears to a remarkably enriching process and should be maintained.
A related issue is the exploration of the understanding of the processes or factors underpinning importance, especially those likely to influence importance in the future. The use of scenarios to explore how importance scores might change in the future and why could be a very useful activity. Doing this could also facilitate the exploration of more subtle processes such as aesthetics or water and disease management, which were not clearly articulated in the process reported here.
The degree to which we were successful or not is somewhat clouded by the mixed objectives that we started with. Primarily we were testing a method designed to operate in a participatory co-learning situation in an information extraction situation. Considering the approach used for Lio Mutai, there are several areas in which the co-learning process could be improved. Firstly, it would be desirable for the community to participate in the development of the field data sheet and sampling process, rather than to do this entirely independently, as was the case here. Secondly, the various models remained largely hidden from the community informants. The grid-cell method, due to its simplicity, appears to hold considerable promise in terms of actively involving the community with model development. Thirdly, little was achieved in terms of feedback of results to community participants. This is obviously a key step in terms of the co-learning process and enhancing the adaptive management capacity of community participants.
45Livelihoods, land types and the importance of ecosystem goods and services:developing a predictive understanding of landscape valuation by the Punan Pelancau people of East Kalimantan
The method employed at Lio Mutai was sufficiently flexible and robust to enable the development of a predictive model of landscape importance and of spatial representations of landscape importance. However, our confidence in the model predictions degrades quite rapidly with increasing distance from the Malinau River (Figure 2). Based on our experiences in both Mozambique and Kalimantan we have learnt that importance to local communities is largely a function of the benefit streams that are perceived to be derivable from the landscape units. Costs do not play much of a role in determining perceived importance. This was contrary to our initial expectations.
We recognise that as a test site for the approach developed in Mozambique, Lio Mutai was probably one of the most difficult sites we could have hoped for. In particular, the spatial arrangement whereby the Pelancau people are split amongst a number of villages, all of which are situated well outside of their customary territory (and which was the focus for development of the various models and spatial representations), posed a particular challenge for the study. This necessarily incurred a much greater degree of complexity than had either been faced in previous studies in Mozambique, or had been anticipated at the outset of the study. Given this particular spatial arrangement, it was highly unlikely that the simple a priori model would be capable of successfully describing the situation on the ground. The complexity of the situation did, however, have the advantage of spurring the development of alternative modelling techniques, particularly the grid-cell method. This appears to hold considerable promise for this type of work, as discussed below.
Another consideration that is likely to have important implications for model development is the fact the Lio Mutai test case, like the previous Muaredzi and Nhanchururu study areas in Mozambique, comprises a situation of unusually low population density. All three communities are relatively well endowed and enjoy relatively easy access to most of the natural resources on which their livelihoods depend. The Pelancau community suggested that eaglewood resources are declining, but most other resources were considered to be relatively abundant and readily accessible. This has implications for both the benefit and cost
streams of the model. It also raises questions as to how applicable these results may be to other communities where resources are less readily available. This is an issue that deserves further consideration.
Community dataKey aspects of the community data included the identification and importance scoring of land types, goods and services and potential cost factors. Assessment of these exercises can be treated on two levels. Firstly, relating to the generation of appropriate and useful data as required to inform the development of the modelling and spatial analyses. Secondly, there are broader, more general caveats or questions relating to the use of numeric scoring approaches for assessing relative importance or preference, many of which are raised by Sheil et al. (2003). Although clearly relevant here, this study did not attempt to specifically address these more general concerns. The methods used were relatively simple and, we believe, have been adequately tested elsewhere. The following points thus relate more to the usefulness or effectiveness of these methods in generating the necessary data as required for development of the various models and spatial surfaces.
Different people in the community hold different knowledge about their landscape. The total knowledge of the community may not necessarily be the sum of the knowledge held by individuals because social power relations may influence the expression of the held knowledge. Not many people in the community groups that we worked with had direct knowledge of the entire Pelancau area. In particular, few of the women had been to even the relatively close sample locations. But the women played an important role in defining the social importance weights. Even among the men, many had not been to many of the sample locations and those who had had often only been there some time ago. Yet all were willing to contribute to scoring the relative importance of locations both in the abstract and again when physically sampling specific sites.
The community teams thus need to be carefully selected with the project objectives clearly in mind. There is a clear trade-off between learning
46 Livelihoods, land types and the importance of ecosystem goods and services:developing a predictive understanding of landscape valuation by the Punan Pelancau people of East Kalimantan
and efficiency. Small, knowledgeable teams make for fast and relatively low-cost exercises but they may lack the necessary depth, and breadth, of social groups required to reliably weight different landscape units or ecosystem services. A key question that the analyst needs to start by asking is, ‘to what extent are knowledge (versus social) weights important?’ The answer to this question will have important implications for the selection of community groups. The more important social weights are (and this includes social buy-in to the results) the more inclusive the process needs to be of representative groups of the community.
The complex pattern of settlement of the Pelancau community among several villages, all of which were situated outside their traditional territory, presented particular difficulties for the study. An immediate and undesirable consequence was that we ended up working with two different CATs. This resulted in some inconsistencies. For example, the conceptual upstream area for which land types and goods and services were initially identified and valued by the Long Loreh CAT did not exactly match that used by the Lio Mutai CAT and our model development and analyses. Note also the inclusion of ‘fields’ in the initial list of upstream-land-types identified by the Long Loreh CAT and their omission by the Lio Mutai CAT.
There were a number of other limitations concerning the identification and importance scoring of land types. For example, the variation in importance scores was relatively constrained, such that at Lio Mutai the most important type (intact forest) was rated as being only 10 times more important than the least valuable types (logged forest, cemeteries, salt springs, river islands, waterfalls and swamp forest—Table 11). Intuitively, this does not match the accompanying data concerning the range of goods and services derived from the various land types (Table 12). The Lio Mutai CAT was emphatic that all land types were important, and were thus possibly reluctant to give low scores to any types. This is likely to have contributed to the apparent compression of values between land types. Other potential limitations were the lack of any clear definition between hutan rimba (intact forest) and hutan gunung (mountain forest), as became apparent during the sampling exercise, and the fact that logging concessions, as a land type, were not
discretely separate from other forest categories, such as intact forest, mountain forest, or even logged forest, and which may thus have lead to some distortions of relative importance scores.
Similar criticisms apply to the relative weighting of goods and services within land types. Thus, for intact forest, eaglewood was rated as being only twice as important as what appear to be much lower value resources, such as sago (fulung and jema), poison for blowpipes, and certain wildlife species such as deer and porcupine (Table 22). This result appears inconsistent with the identification of the harvesting of eaglewood as a key livelihood activity (Table 4) and important source of income (Table 19). This must necessarily impact on the development of any models which draw on these results.
How could these factors be improved? Given the spatial set-up of the Pelancau community, it would obviously have been better to have started work at Lio Mutai rather than Long Loreh. This would have meant working with only a single CAT, and could have contributed to a clearer definition of the area of interest for the modelling and spatial analyses. However, this was primarily a logistical constraint, as are frequently encountered in field studies of this nature, and in which case one must make the best of the particular situation, as we did here.
Concerning the relative weightings of land types and goods and services, minor improvements could perhaps be achieved through more rigorous facilitation. However, the main difficulty is probably that these exercises were necessarily carried out early on in the field process (since the data were required for development of the model), at which time the CAT members were still gaining familiarity with the scoring methods, and the facilitators were still developing their understanding of livelihoods and patterns of occurrence and use of natural resources. It is also possible that the relative preferences of the CAT may have altered during the course of the project. In future it is likely to be useful to revisit these issues towards the end of the field process, in order to check and reconfirm the relative preference scores.
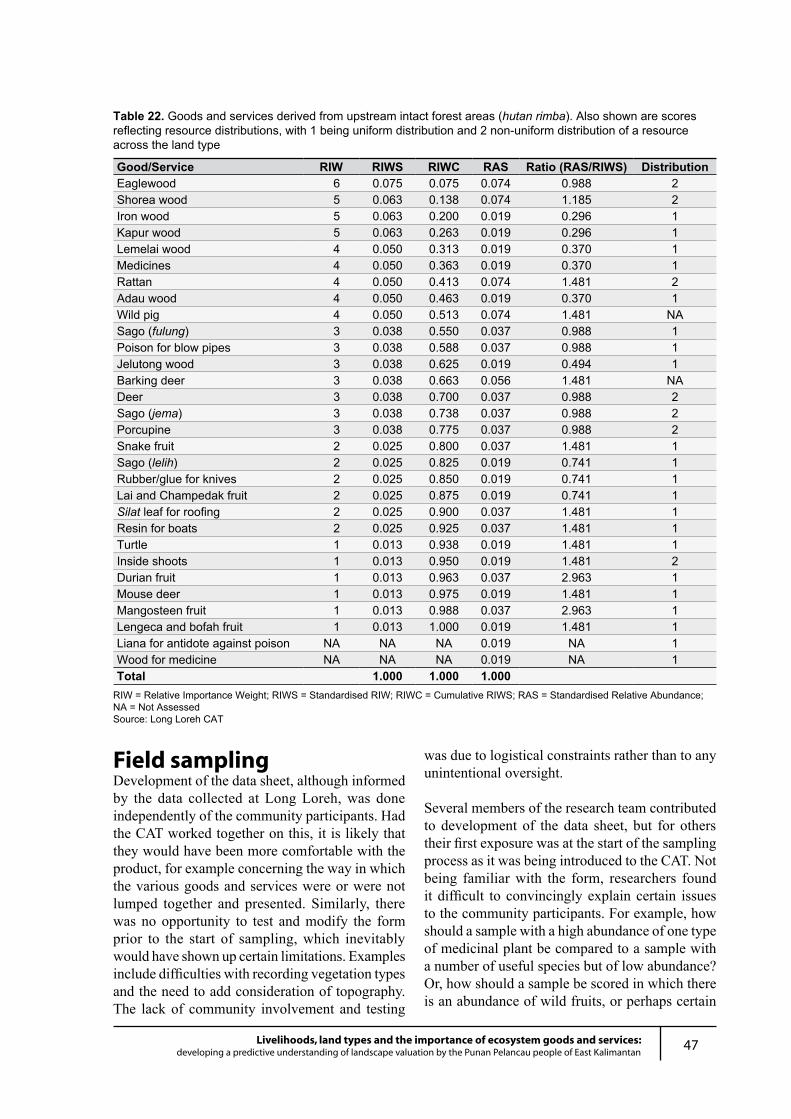
47Livelihoods, land types and the importance of ecosystem goods and services:developing a predictive understanding of landscape valuation by the Punan Pelancau people of East Kalimantan
Field samplingDevelopment of the data sheet, although informed by the data collected at Long Loreh, was done independently of the community participants. Had the CAT worked together on this, it is likely that they would have been more comfortable with the product, for example concerning the way in which the various goods and services were or were not lumped together and presented. Similarly, there was no opportunity to test and modify the form prior to the start of sampling, which inevitably would have shown up certain limitations. Examples include difficulties with recording vegetation types and the need to add consideration of topography. The lack of community involvement and testing
was due to logistical constraints rather than to any unintentional oversight.
Several members of the research team contributed to development of the data sheet, but for others their first exposure was at the start of the sampling process as it was being introduced to the CAT. Not being familiar with the form, researchers found it difficult to convincingly explain certain issues to the community participants. For example, how should a sample with a high abundance of one type of medicinal plant be compared to a sample with a number of useful species but of low abundance? Or, how should a sample be scored in which there is an abundance of wild fruits, or perhaps certain
Table 22. Goods and services derived from upstream intact forest areas (hutan rimba). Also shown are scores reflecting resource distributions, with 1 being uniform distribution and 2 non-uniform distribution of a resource across the land type
Good/Service RIW RIWS RIWC RAS Ratio (RAS/RIWS) DistributionEaglewood 6 0.075 0.075 0.074 0.988 2Shorea wood 5 0.063 0.138 0.074 1.185 2Iron wood 5 0.063 0.200 0.019 0.296 1Kapur wood 5 0.063 0.263 0.019 0.296 1Lemelai wood 4 0.050 0.313 0.019 0.370 1Medicines 4 0.050 0.363 0.019 0.370 1Rattan 4 0.050 0.413 0.074 1.481 2Adau wood 4 0.050 0.463 0.019 0.370 1Wild pig 4 0.050 0.513 0.074 1.481 NASago (fulung) 3 0.038 0.550 0.037 0.988 1Poison for blow pipes 3 0.038 0.588 0.037 0.988 1Jelutong wood 3 0.038 0.625 0.019 0.494 1Barking deer 3 0.038 0.663 0.056 1.481 NADeer 3 0.038 0.700 0.037 0.988 2Sago (jema) 3 0.038 0.738 0.037 0.988 2Porcupine 3 0.038 0.775 0.037 0.988 2Snake fruit 2 0.025 0.800 0.037 1.481 1Sago (lelih) 2 0.025 0.825 0.019 0.741 1Rubber/glue for knives 2 0.025 0.850 0.019 0.741 1Lai and Champedak fruit 2 0.025 0.875 0.019 0.741 1Silat leaf for roofing 2 0.025 0.900 0.037 1.481 1Resin for boats 2 0.025 0.925 0.037 1.481 1Turtle 1 0.013 0.938 0.019 1.481 1Inside shoots 1 0.013 0.950 0.019 1.481 2Durian fruit 1 0.013 0.963 0.037 2.963 1Mouse deer 1 0.013 0.975 0.019 1.481 1Mangosteen fruit 1 0.013 0.988 0.037 2.963 1Lengeca and bofah fruit 1 0.013 1.000 0.019 1.481 1Liana for antidote against poison NA NA NA 0.019 NA 1Wood for medicine NA NA NA 0.019 NA 1Total 1.000 1.000 1.000
RIW = Relative Importance Weight; RIWS = Standardised RIW; RIWC = Cumulative RIWS; RAS = Standardised Relative Abundance; NA = Not AssessedSource: Long Loreh CAT
48 Livelihoods, land types and the importance of ecosystem goods and services:developing a predictive understanding of landscape valuation by the Punan Pelancau people of East Kalimantan
sago species, but which community members make very little use of? Or, how should the timber within a sample be valued in a situation where there is no use for it at present, but where it may in future be harvested? (This relates to a broader question as to how to capture potential or future values as compared to current values). Or, should a small river sample be evaluated purely on the basis of the resources associated with the drainage, or as a forest plot (for example) with a narrow stream passing through it? The lesson from this was clear, that one should always go over the data sheet in detail with all facilitators prior to introducing it to the CAT.
In order to increase the number of samples possible during the available time, it was decided to split the CAT into four smaller groups, as had previously been done in Mozambique. Working in small groups inevitably leads to increased risks of biases relating to the differential knowledge and perceptions of different CAT members. For example, it was suggested that older CAT members would be likely to have quite different perceptions of hardships and difficulties, such as long distances and steep slopes, than younger and less experienced individuals. This is likely to apply to many other parameters too. In addition, the smaller the group the more likely it is that deliberations will be dominated by one or two of the more knowledgeable or influential individuals, which at times was observed to occur.
It is also possible that different groups may allocate different scores to the same or similar samples, and which at times appeared to be the case. The potential for such bias was recognised, and efforts were made to counter it, firstly through carrying out the two training plots at the outset of the sampling and, secondly, through holding regular report-back sessions, in which each group would present their samples and provide justification for the scores that they had given. The ideal solution would have been to work as a single group, but then the total number of samples would have been greatly reduced. A more sensible suggestion would be to increase the training input at the start of the exercise, thus giving the combined group a greater number of common reference points.
Distance was a key parameter in the initial model. Casual examination of the sample data suggests considerable discrepancies between some of the
distance and time estimates, and between these estimates and the actual distances or times taken to access a particular sample. This again suggests a need for more training at the outset of the exercise, for both the CAT members and facilitators, and also for researchers to be more vigilant as regards the scoring of these aspects in the field.
CAT members on occasion raised concerns that the score allocated to a particular sample was not necessarily representative of the general value of the wider landscape. This relates to the size of the sample as compared to the spatial distribution of different resources across the landscape. For example, some samples within intact forest that was considered to be of relatively high value, included very little in the way of useful resources, and were thus given relatively low scores. The reverse situation could also apply. It may not be appropriate to use the same sample size for all land types, as was done here. A better way of doing things would be to investigate the scale of the field sampling units as part of the abstract exploration process, and perhaps to iteratively update these as the sampling is started. We suggest that for the Pelancau area a multi-resolution field sampling unit could be used to improve both understanding and efficiency. Determinants of what size sample unit to use are likely to be influenced by people’s knowledge of what is in any location in terms of resources or other factors of interest, and also the uniformity of the area in terms of the factors determining importance. The less uniform an area is the larger the sample unit may need to be. For example, a unit of 1 ha, or smaller, might be adequate for a field, whereas a 16 km2 area would probably be satisfactory for intact forest, and a 200 m length might be useful for rivers.
Scoring of samples was initially carried out using an open-ended system. This produced very little in the way of variation between samples, as was virtually inevitable once the CAT had allocated a relatively low score to the initial sample, but which was considered to be of comparatively high importance. This limitation was successfully overcome by introducing a closed scoring system with defined end points, and re-scoring the initial plots. The introduction of an additional middle reference point could possibly have been a useful further refinement, forcing another level of comparisons in the scoring of each sample.
49Livelihoods, land types and the importance of ecosystem goods and services:developing a predictive understanding of landscape valuation by the Punan Pelancau people of East Kalimantan
Following the introduction of the closed scoring system, it was necessary to re-score the 17 samples that had already been completed. Each group reconsidered the samples it had done according to the newly defined scale of 1–100 points. Although this successfully resulted in wider variation between the samples, in doing so significant changes were made in terms of the relative scoring of samples within each group. This raises concerns as to the validity of the whole scoring process. Space was provided on the data sheet to record notes concerning allocation of the landscape score, but such notes were not necessarily recorded for each sample. A possible improvement to the scoring process would be to ensure more rigorous comparisons between different samples, and also more systematic recording as to the underlying rationale for the score given to each sample.
A final and obvious limitation of the sampling exercise was the very poor spatial distribution of samples. There were two elements to this: firstly, the highly biased coverage with virtually all samples being in close proximity to the river and, secondly, the low intensity of samples. These weaknesses were fully apparent at the time of sampling, but without dramatically increasing the sampling effort there was little that could be done about this.
Models and spatial analysesWe have learnt a number of lessons concerning model development and testing and the subsequent spatial analyses. These are discussed below together with ways in which the methods could possibly be extended and improved.
The functions describing the relationships between landscape units and local importance are more complex than we had originally thought.• The simple model of value declining with
distance was not adequate to describe the complex surface of importance depicted in Figure 2 or 9. Although clearly a first iteration of our (joint) understanding of a complex process, the simple model was way off the mark.
• Given the data, the model we originally posed was highly unlikely.
• Even a cursory look at Figure 2 or 9 will demonstrate that this is a highly complex surface that we were seeking to model. Although we were able to identify simple trends and components for such a model (inputs to livelihood are important, distance is important but differentially so for different goods or services), we are still far from developing simple and useful models.
• Rural people appear to give greatest value to factors providing access to means of production. In the case of Lio Mutai this was land for agriculture and home sites.
Land types, even when scaled for distance from settlement areas, were not good predictors of landscape unit importance scoring. • Land types were important contributors to the
importance scores assigned to any given location. But statistically, we were unable to differentiate groups of scores based on land types, even when these land types were scaled for their distance from Lio Mutai. The most important land type (fields) and the least important (logged forest) were distinguishable from the rest, but the others were indistinguishable when scaled for distance.
The BBN models developed for this analysis were not found to be particularly useful. • Given the severe time constraints we were not
able to explore alternative Bayesian models, or to fully explore whether or not we could make the BBN approach work more usefully.
• Although the frequentist general linear models served their purpose in terms of providing informative models of what factors contributed to the allocated importance scores, the frequentist approach does not lend itself to the co-learning approach that we advocate. The Bayesian approach to analysis is by definition iterative. We believe co-learning is best seen as an iterative process. The frequentist approach to data analysis is not iterative. Philosophically we believe the Bayesian approach of testing for p(H|x), or the probability of the model (H) given the data (x), is more useful in the co-learning context than the frequentist approach of testing for p(x|H), or the probability of the data given the model.
50 Livelihoods, land types and the importance of ecosystem goods and services:developing a predictive understanding of landscape valuation by the Punan Pelancau people of East Kalimantan
The nature of the terrain, and hence our inability to access much of the Punan Pelancau area, meant that our sampling effort was concentrated in a narrow band close to the Malinau River. This was less than satisfactory. As a result our confidence in the model predictions degrades quite rapidly with increasing distance from the Malinau River (Figure 2).
The scale of field sampling appeared not to match the scales at which people conceive of their world. This made it difficult for the field teams to come up with satisfactory scores for field samples. It also meant that the resolution of the original, abstract importance scoring activities (carried out in Long Loreh and then refined in Lio Mutai) was likely to have been very different to the resolution of the field sampling. We believe this could have an important impact on the usefulness of the models that are developed.
A new analytical procedure we used in this project was the use of geostatistics, and especially krigging, to develop two-dimensional surfaces of input variables and model confrontation data. This approach has the great advantage of providing a spatial representation of where, in space, uncertainty could be reduced through further sampling (e.g. Figure 2). This could be very useful in an iterative co-learning approach. We suspect, but were unable to test, that a similar effect might be achievable in the grid-cell method by asking the informants to score a grid map to reflect their uncertainty in the values they had assigned to each cell (i.e. values of importance or difficulty). This would provide a clear indication of where further field sampling would be required.
The grid-cell method appeared to provide a simple and easily understood approach to identifying landscape unit values. The nature of the method made it difficult to compare results with field data, but for the few samples that we were able to make comparisons the results were pleasing. We suspect, but were not able to test this, that the grid-cell method would be relatively robust and hence useful as a tool in either information extraction processes or in co-learning processes. We believe the grid-cell method offers great promise for establishing and understanding landscape unit importance to local communities (or any other stakeholder group for that matter). These are our reasons:
• The grid-cell method is simple and appears to be readily understood by everyone, and does not require sophisticated analytical or modelling techniques (at least initially).
• A major weakness in the general approach we have used is that the model itself is kept hidden from the community. This has advantages (avoidance of strategic bias) but also disadvantages (less co- in the co-learning). We believe the grid-cell approach could be used to iteratively explore the processes or factors underpinning value with the community. We see this as a great advantage. Whilst it could be done with the BBN or GLM approaches, it would be that much more difficult to do as the model representations themselves would be quite difficult to understand.
• Grid resolutions used in the method could be readily adapted to conform to the quadtree model of knowledge as well as the requirements of different field sample resolutions. This requires a little expansion. We suspect that the knowledge people have of their world is rather like what is called a quadtree data structure (Figure 15). This is a very efficient data structure for mixed resolution data sets. Basically, the data structure branches into ever finer resolutions when there is a need. In the context of Lio Mutai, people appear to know in considerable detail (i.e. spatial and temporal resolution) those areas that are either close to their villages or are very important to their well-being. Those areas that are not as important are not known as well. Our preliminary tests with the grid-cell method indicate that it is well suited to dealing with this type of mixed resolution knowledge. Thus, the grid-cell approach could be used as a single iteration, information extraction tool, or could be used iteratively, with each iteration improving the understanding of where importance scores vary at different resolutions, and why specific importance scores are assigned to a given location.
• A very important advantage of the method is that informants can score the relative importance of all units in the landscape whilst all are visible to them and hence in mind. They, therefore, have to explicitly deal with the spatial configurations of units.
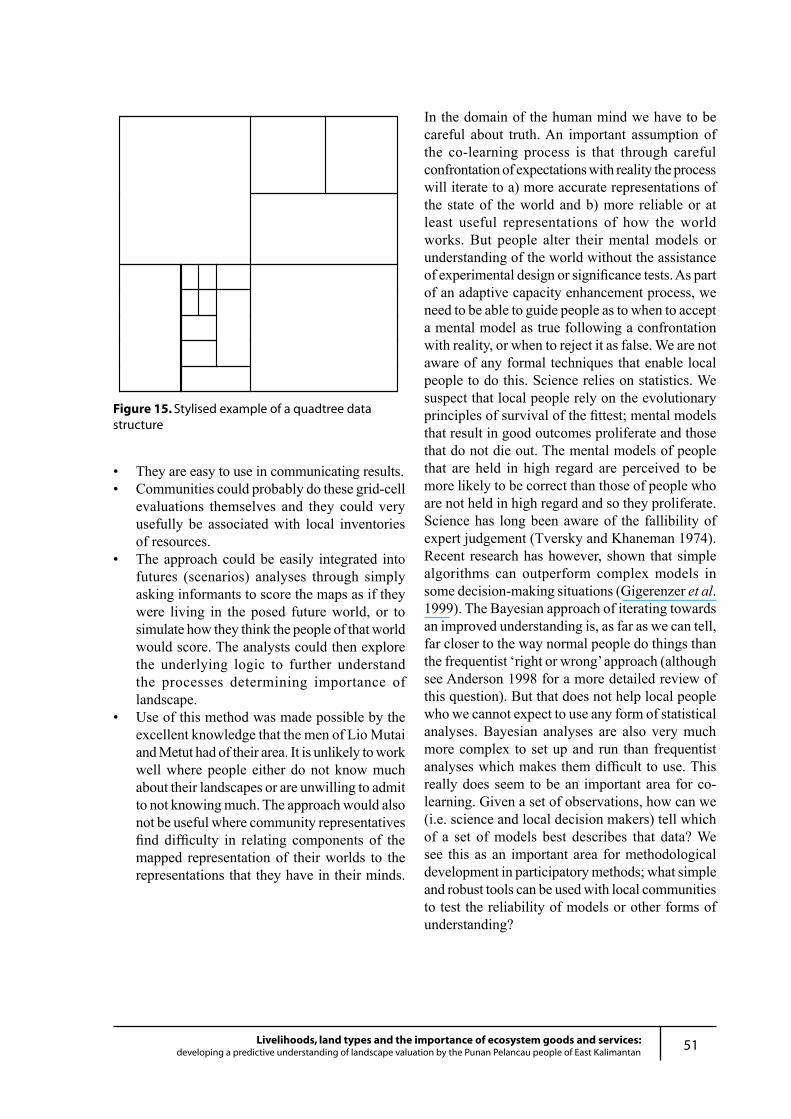
51Livelihoods, land types and the importance of ecosystem goods and services:developing a predictive understanding of landscape valuation by the Punan Pelancau people of East Kalimantan
• They are easy to use in communicating results.• Communities could probably do these grid-cell
evaluations themselves and they could very usefully be associated with local inventories of resources.
• The approach could be easily integrated into futures (scenarios) analyses through simply asking informants to score the maps as if they were living in the posed future world, or to simulate how they think the people of that world would score. The analysts could then explore the underlying logic to further understand the processes determining importance of landscape.
• Use of this method was made possible by the excellent knowledge that the men of Lio Mutai and Metut had of their area. It is unlikely to work well where people either do not know much about their landscapes or are unwilling to admit to not knowing much. The approach would also not be useful where community representatives find difficulty in relating components of the mapped representation of their worlds to the representations that they have in their minds.
In the domain of the human mind we have to be careful about truth. An important assumption of the co-learning process is that through careful confrontation of expectations with reality the process will iterate to a) more accurate representations of the state of the world and b) more reliable or at least useful representations of how the world works. But people alter their mental models or understanding of the world without the assistance of experimental design or significance tests. As part of an adaptive capacity enhancement process, we need to be able to guide people as to when to accept a mental model as true following a confrontation with reality, or when to reject it as false. We are not aware of any formal techniques that enable local people to do this. Science relies on statistics. We suspect that local people rely on the evolutionary principles of survival of the fittest; mental models that result in good outcomes proliferate and those that do not die out. The mental models of people that are held in high regard are perceived to be more likely to be correct than those of people who are not held in high regard and so they proliferate. Science has long been aware of the fallibility of expert judgement (Tversky and Khaneman 1974). Recent research has however, shown that simple algorithms can outperform complex models in some decision-making situations (Gigerenzer et al. 1999). The Bayesian approach of iterating towards an improved understanding is, as far as we can tell, far closer to the way normal people do things than the frequentist ‘right or wrong’ approach (although see Anderson 1998 for a more detailed review of this question). But that does not help local people who we cannot expect to use any form of statistical analyses. Bayesian analyses are also very much more complex to set up and run than frequentist analyses which makes them difficult to use. This really does seem to be an important area for co-learning. Given a set of observations, how can we (i.e. science and local decision makers) tell which of a set of models best describes that data? We see this as an important area for methodological development in participatory methods; what simple and robust tools can be used with local communities to test the reliability of models or other forms of understanding?
Figure 15. Stylised example of a quadtree data structure
52 Livelihoods, land types and the importance of ecosystem goods and services:developing a predictive understanding of landscape valuation by the Punan Pelancau people of East Kalimantan
Drawing on the methods used, the results obtained, and their subsequent appraisal, we draw the following principal conclusions.
The spatial distribution of Pelancau settlements and areas of resource use provided an unexpectedly complicated situation for testing the method. Whilst challenging to model, this situation equally stimulated the use and development of alternative methods, some of which show considerable promise.
In terms of choices of methods, it is imperative at the outset to be clear as to the purpose of the study, and who are the intended clients, for this will dictate whether to lean more towards purely extractive or co-learning approaches. We believe that, in the context of development of the participating communities, the implementation of participatory co-learning approaches is likely to yield the best long-term results.
The current study amply demonstrated the considerable complexity concerning the allocation of importance scores to landscape units. In the face of such complexity, iterative approaches involving learning by community participants and researchers alike are strongly suggested in order to achieve reliable results.
Despite our strong advocacy for co-learning, we recognise a number of ways in which the adopted approach could be improved so as to enhance the opportunities for co-learning. These include greater involvement of the community with respect to development of the field data sheet; determination
of the appropriate sizes for sample units (and which may vary with land types); the development and evaluation of models; and final feedback and evaluation of research findings.
The methods employed for the community valuations and the generation of field data proved readily adaptable to cope with the relatively complex situation faced in the field. However, there are a number of ways in which these could be improved. These include:
Increasing the training of CAT members and facilitators at the start of the sampling process so as to reduce the potential variation between groups, particularly as regards the assignment of distance estimates and overall importance scores.
Using a closed system of scoring for overall landscape importance values, and establishing at the outset at least three agreed reference points to guide the scoring of subsequent samples.
During the scoring process, ensuring more rigorous comparisons between samples, including more systematic recording as to the rationale for allocation of overall landscape importance scores.
Revisiting the abstract importance scores assigned to land types towards the end of the field sampling process.
Turning to the modelling component, it is clear that the functions describing the relationships between landscape units and local importance are more complex than we had originally thought, and we are
ConclusionsConclusions
53Livelihoods, land types and the importance of ecosystem goods and services:developing a predictive understanding of landscape valuation by the Punan Pelancau people of East Kalimantan
still some way from developing simple and useful models. Land types were not good predictors of landscape unit importance, and whilst distance is important, the simple model of declining value with distance was not adequate to describe the situation that we were seeking to model. However, in Lio Mutai, as in Mozambique, the stocks of resource on a landscape unit are significantly correlated to the perceived importance of that unit to the community. The costs of accessing those resources do not appear to play a major role in the perceived importance of the unit.
The BBN models did not perform well. However, because Bayesian approaches necessarily entail an iterative approach, we believe that these are well suited to situations where co-learning is preferred, and are thus worthy of further investigation.
The GLMs did provide a reasonable first estimate of landscape importance, where importance was largely a function of inputs to production and well-being or basic needs. However, these methods do not lend themselves to the co-learning approach that we advocate.
The use of geostatistical methods, particularly the generation of krigged surfaces, proved to be extremely useful, particularly as regards the identification of areas where additional information is required in order to reduce the level of uncertainty associated with any model. This could be usefully applied in an iterative co-learning approach.
The grid-cell method appears to offer a simple and adaptable approach that is likely to suit both co-learning and more extractive approaches to information gathering, and is clearly worthy of further testing and refinement. It is easily understood, lends itself to iterative exploration, and provides a simple way of presenting results. Through use of varying cell sizes it appears to offer good potential for matching the scale of landscape unit importance scoring with both levels of knowledge and patterns of environmental variation. However, it does not provide an understanding of the underlying processes governing the allocation of importance scores, and requires that participants have a good knowledge of their area.
Suggested future research activitiesDrawing on these conclusions, there are a number of aspects that could usefully be further investigated and developed. These include:
Exploring techniques that would enable the generation of better spatial maps, suitable for the mapping of land types, and the subsequent development of models and spatial representations based on the occurrence of land types. Low level videography or different remotely sensed images are examples.
Further testing of this approach in an attempt to seek more useful models of landscape valuation, and to develop a better understanding of the potential for such models to describe situations of different complexities and with varying abundances of resources.
Further exploration of understanding of the processes or factors underpinning importance, especially those likely to influence importance in the future. In particular, the use of scenarios to explore how importance scores might change in the future and why, could be a very useful activity.
Further exploration of Bayesian models to develop a simple and reliable Bayesian approach.
Further testing and development of the grid-cell method, for example to accommodate different resolutions of knowledge and environmental variation as well as expressions of uncertainty. Also needed would be field sampling and associated analytical approaches to test and thence refine the grid-cell ‘models’. It would also be useful to test the applicability of this method to local resource inventories, and to futures or scenario analyses.
Developing methods for community-based testing and validation of models to complement existing statistical methods.
Developing methods for assessing the degree to which such approaches do or do not contribute to an enhanced adaptive capacity of community participants.
54 Livelihoods, land types and the importance of ecosystem goods and services:developing a predictive understanding of landscape valuation by the Punan Pelancau people of East Kalimantan
This project was supported by funds provided to CIFOR by the European Commission. The study was designed to complement and support activities supported by the International Tropical Timber Organization in Malinau, and drew on research already conducted in Mozambique with funds from the Swiss Agency for Development and Cooperation (see Lynam et al. 2004).
We are grateful to the villagers of Long Loreh, Lio Mutai and Metut for their patience and understanding, and particularly to the following CAT participants, firstly at Long Loreh: Loren Anding, Kramuh Incau, Adau Ipu, Usat Ipu, Jainun, Ipu Kere, Paulus Kodong, Marta Latah, Murni Puan, Dora Riyanti, Ibung Unyat, Laya Unyat and Palan Unyat, and later at Lio Mutai: Latah Balah, Lung Acing, Lada Ilau, Adau Ipu, Awing Ayu, Punyuh Incau, Lungo Laway, Juha Baya, Laing Lada, Titus Lingai, Unyat Iman, Haip Leging, Buring Kere, Ripka Lungo, Laway Usat and Ajang Telip. We also thank Jalung Ayu the village leader
at Lio Mutai for his support, and Marta Kere, Rita Ungkong and Dora Riyanti for looking after our culinary needs.
We thank the numerous staff and colleagues at CIFOR who contributed to this study. In particular, Miriam van Heist provided useful advice and background data, as did Lini Wollenberg, who also commented on an earlier version of this manuscript, and shared with us her remarkable herpetological knowledge! Andy Darmawan was incredibly helpful with all our GIS requirements. We also owe a great deal of thanks to the CIFOR team in Malinau, in particular Petrus Gunarso and Kresno Santosa. Ramses Iwan from the ACM (Adaptive Co-Management) team played a crucial role in introducing us to the Punan Pelancau community in Long Loreh and assisting with the initial field work. Thanks too to Godwin Limberg and the rest of the ACM team who were always extremely willing to share and help.
AcknowledgementsAcknowledgements
55Livelihoods, land types and the importance of ecosystem goods and services:developing a predictive understanding of landscape valuation by the Punan Pelancau people of East Kalimantan
Anderson, J.L. 1998. Embracing uncertainty: The interface of Bayesian statistics and cognitive psychology. Conservation Ecology [online] 2(1): 2 URL: http://www.consecol.org/vol2/iss1/art2
Basuki, I. and Sheil, D. 2005. Local perspectives of forest landscapes: A preliminary evaluation of land and soils, and their importance in Malinau, East Kalimantan, Indonesia. CIFOR, Bogor, Indonesia.
Cressie, N. 1993. Statistics for spatial data. Rev. ed. John Wiley & Sons, New York.
Fielding, A.H. and Bell, J.F. 1997. A review of methods for the assessment of prediction errors in conservation presence/absence models. Environmental Conservation 24: 38-49.
Gigerenzer, G., Todd, P.M. and the ABC Research Group. 1999. Simple heuristics that make us smart. Oxford University Press, New York.
Hosmer, D.W. and Lemeshow, S. 1989. Applied logistic regression. Wiley, New York, New York, USA.
Isaaks, E.H. and Srivastava, R.M. 1989. An introduction to applied geostatistics. Oxford University Press, Oxford, UK.
Kaskija, L. 2002. Claiming the forest: Punan local histories and recent developments in Bulungan, East Kalimantan. CIFOR, Bogor, Indonesia.
Lynam, T. 1999. Adaptive analysis of locally complex systems in a globally complex world. Conservation Ecology 3(2): 13. [online] URL: http://www.consecol.org/vol3/iss2/art13/
Lynam, T., Cunliffe, R. and Mapaure, I. 2004. Assessing the importance of woodland landscape locations for both local communities and conservation in Gorongosa and Muanza Districts, Sofala Province, Mozambique. Ecology and Society 9(4): 1. [online] URL: http://www.ecologyandsociety.org/vol9/iss4/art1/
Lynam, T., Wan, M. and Basuki, I. 2003. Livelihoods, land types and the importance of ecosystem goods and services to the Punan people of Long Loreh, East Kalimantan: A first estimate. Unpublished report, CIFOR, Bogor, Indonesia.
Lynam, T. J. P. 2001. Participatory systems analysis—an introductory guide. IES Special Report No. 22. Institute of Environmental Sciences, University of Zimbabwe, Harare.
McCullagh, P. and Nelder, J.A. 1989. Generalized Linear Models, Vol. 37 of Monographs on Statistics and Applied Probability. 2nd ed. Chapman and Hall, London.
Sellato, B. 2001. Forest resources and people in Bulungan: Elements for a history of settlement, Trade, and social dynamics in Borneo, 1880–2000. CIFOR, Bogor, Indonesia.
Sheil, D. 2002. Biodiversity Research in Malinau. In: Technical Report Phase I (1997-2001), ITTO Project PD 12/97 Rev.1 (F). Forest, science and sustainability: The Bulungan model forest. CIFOR, MOF and ITTO, Bogor, Indonesia.
Sheil, D., Puri, R.K., Basuki, I., Heist, M. van, Wan, M., Liswanti, N., Rukmiyati, Sardjono, M.A., Samsoedin, I. Sidiyasa, K., Chrisandini, Permana, E., Angi, E.M., Gatzweiler, F., Johnson, B. and Wijaya., A. 2003. Exploring biological diversity, environment and local people’s perspectives in forest landscapes: Methods for a multidisciplinary landscape assessment. CIFOR with ITTO, Bogor, Indonesia.
Tversky, A. and Kahneman, D. 1974. Judgement under uncertainty: Heuristics and biases. Science 185: 1124–1131.
ReferencesReferences
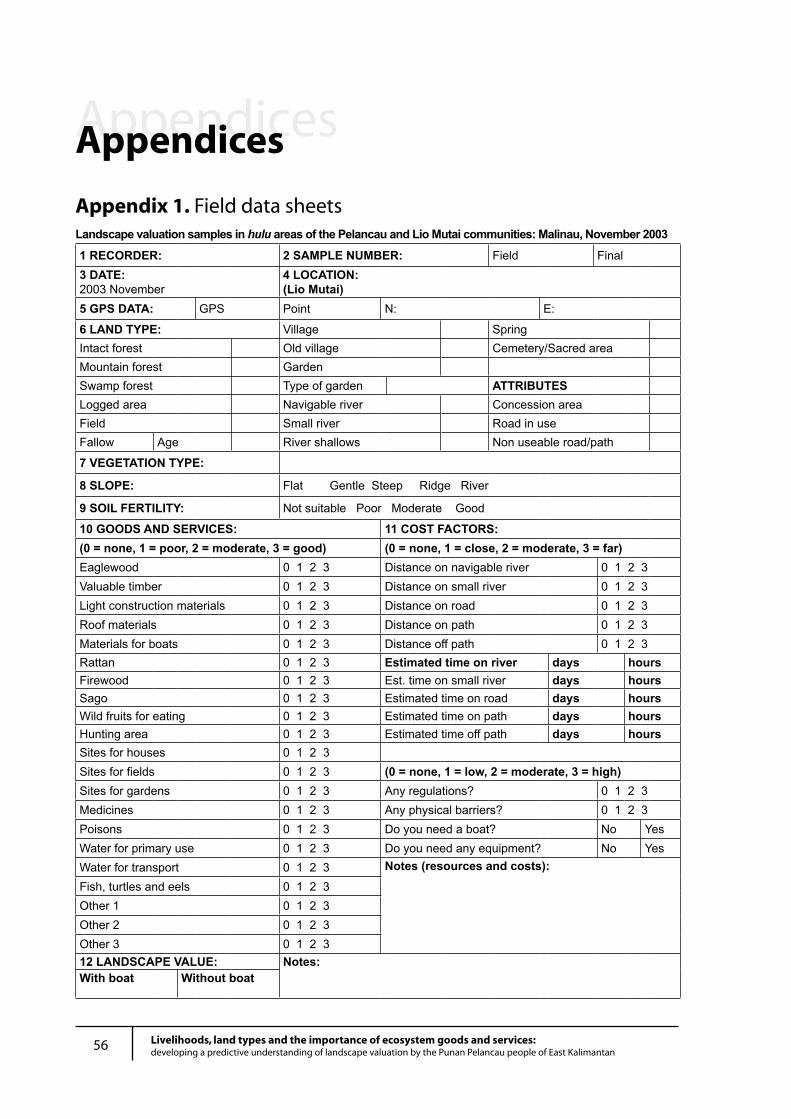
56 Livelihoods, land types and the importance of ecosystem goods and services:developing a predictive understanding of landscape valuation by the Punan Pelancau people of East Kalimantan
AppendicesAppendices
Landscape valuation samples in hulu areas of the Pelancau and Lio Mutai communities: Malinau, November 2003
1 RECORDER: 2 SAMPLE NUMBER: Field Final3 DATE:2003 November
4 LOCATION:(Lio Mutai)
5 GPS DATA: GPS Point N: E:
6 LAND TYPE: Village SpringIntact forest Old village Cemetery/Sacred areaMountain forest GardenSwamp forest Type of garden ATTRIBUTESLogged area Navigable river Concession areaField Small river Road in useFallow Age River shallows Non useable road/path
7 VEGETATION TYPE:
8 SLOPE: Flat Gentle Steep Ridge River
9 SOIL FERTILITY: Not suitable Poor Moderate Good
10 GOODS AND SERVICES: 11 COST FACTORS:(0 = none, 1 = poor, 2 = moderate, 3 = good) (0 = none, 1 = close, 2 = moderate, 3 = far)Eaglewood 0 1 2 3 Distance on navigable river 0 1 2 3Valuable timber 0 1 2 3 Distance on small river 0 1 2 3Light construction materials 0 1 2 3 Distance on road 0 1 2 3Roof materials 0 1 2 3 Distance on path 0 1 2 3Materials for boats 0 1 2 3 Distance off path 0 1 2 3Rattan 0 1 2 3 Estimated time on river days hoursFirewood 0 1 2 3 Est. time on small river days hoursSago 0 1 2 3 Estimated time on road days hoursWild fruits for eating 0 1 2 3 Estimated time on path days hoursHunting area 0 1 2 3 Estimated time off path days hoursSites for houses 0 1 2 3Sites for fields 0 1 2 3 (0 = none, 1 = low, 2 = moderate, 3 = high)Sites for gardens 0 1 2 3 Any regulations? 0 1 2 3Medicines 0 1 2 3 Any physical barriers? 0 1 2 3Poisons 0 1 2 3 Do you need a boat? No YesWater for primary use 0 1 2 3 Do you need any equipment? No YesWater for transport 0 1 2 3 Notes (resources and costs):Fish, turtles and eels 0 1 2 3Other 1 0 1 2 3Other 2 0 1 2 3Other 3 0 1 2 312 LANDSCAPE VALUE: Notes:With boat Without boat
Appendix 1. Field data sheets
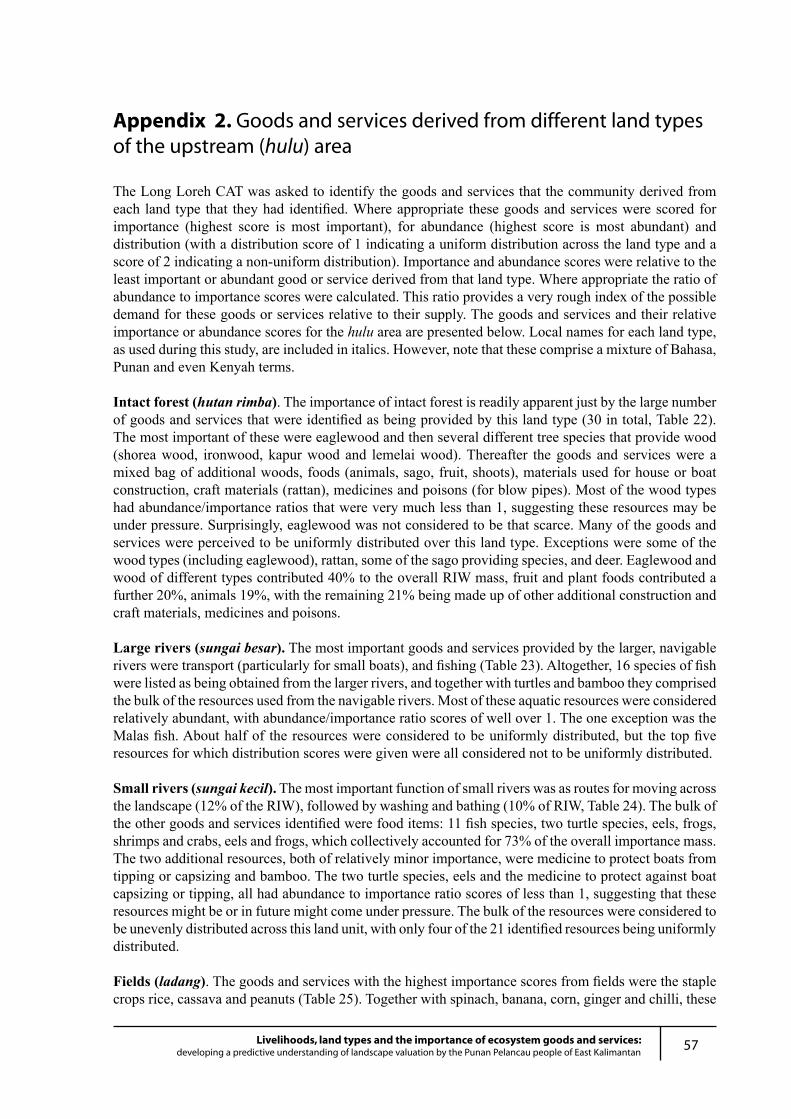
57Livelihoods, land types and the importance of ecosystem goods and services:developing a predictive understanding of landscape valuation by the Punan Pelancau people of East Kalimantan
Appendix 2. Goods and services derived from different land types of the upstream (hulu) area
The Long Loreh CAT was asked to identify the goods and services that the community derived from each land type that they had identified. Where appropriate these goods and services were scored for importance (highest score is most important), for abundance (highest score is most abundant) and distribution (with a distribution score of 1 indicating a uniform distribution across the land type and a score of 2 indicating a non-uniform distribution). Importance and abundance scores were relative to the least important or abundant good or service derived from that land type. Where appropriate the ratio of abundance to importance scores were calculated. This ratio provides a very rough index of the possible demand for these goods or services relative to their supply. The goods and services and their relative importance or abundance scores for the hulu area are presented below. Local names for each land type, as used during this study, are included in italics. However, note that these comprise a mixture of Bahasa, Punan and even Kenyah terms.
Intact forest (hutan rimba). The importance of intact forest is readily apparent just by the large number of goods and services that were identified as being provided by this land type (30 in total, Table 22). The most important of these were eaglewood and then several different tree species that provide wood (shorea wood, ironwood, kapur wood and lemelai wood). Thereafter the goods and services were a mixed bag of additional woods, foods (animals, sago, fruit, shoots), materials used for house or boat construction, craft materials (rattan), medicines and poisons (for blow pipes). Most of the wood types had abundance/importance ratios that were very much less than 1, suggesting these resources may be under pressure. Surprisingly, eaglewood was not considered to be that scarce. Many of the goods and services were perceived to be uniformly distributed over this land type. Exceptions were some of the wood types (including eaglewood), rattan, some of the sago providing species, and deer. Eaglewood and wood of different types contributed 40% to the overall RIW mass, fruit and plant foods contributed a further 20%, animals 19%, with the remaining 21% being made up of other additional construction and craft materials, medicines and poisons.
Large rivers (sungai besar). The most important goods and services provided by the larger, navigable rivers were transport (particularly for small boats), and fishing (Table 23). Altogether, 16 species of fish were listed as being obtained from the larger rivers, and together with turtles and bamboo they comprised the bulk of the resources used from the navigable rivers. Most of these aquatic resources were considered relatively abundant, with abundance/importance ratio scores of well over 1. The one exception was the Malas fish. About half of the resources were considered to be uniformly distributed, but the top five resources for which distribution scores were given were all considered not to be uniformly distributed.
Small rivers (sungai kecil). The most important function of small rivers was as routes for moving across the landscape (12% of the RIW), followed by washing and bathing (10% of RIW, Table 24). The bulk of the other goods and services identified were food items: 11 fish species, two turtle species, eels, frogs, shrimps and crabs, eels and frogs, which collectively accounted for 73% of the overall importance mass. The two additional resources, both of relatively minor importance, were medicine to protect boats from tipping or capsizing and bamboo. The two turtle species, eels and the medicine to protect against boat capsizing or tipping, all had abundance to importance ratio scores of less than 1, suggesting that these resources might be or in future might come under pressure. The bulk of the resources were considered to be unevenly distributed across this land unit, with only four of the 21 identified resources being uniformly distributed.
Fields (ladang). The goods and services with the highest importance scores from fields were the staple crops rice, cassava and peanuts (Table 25). Together with spinach, banana, corn, ginger and chilli, these
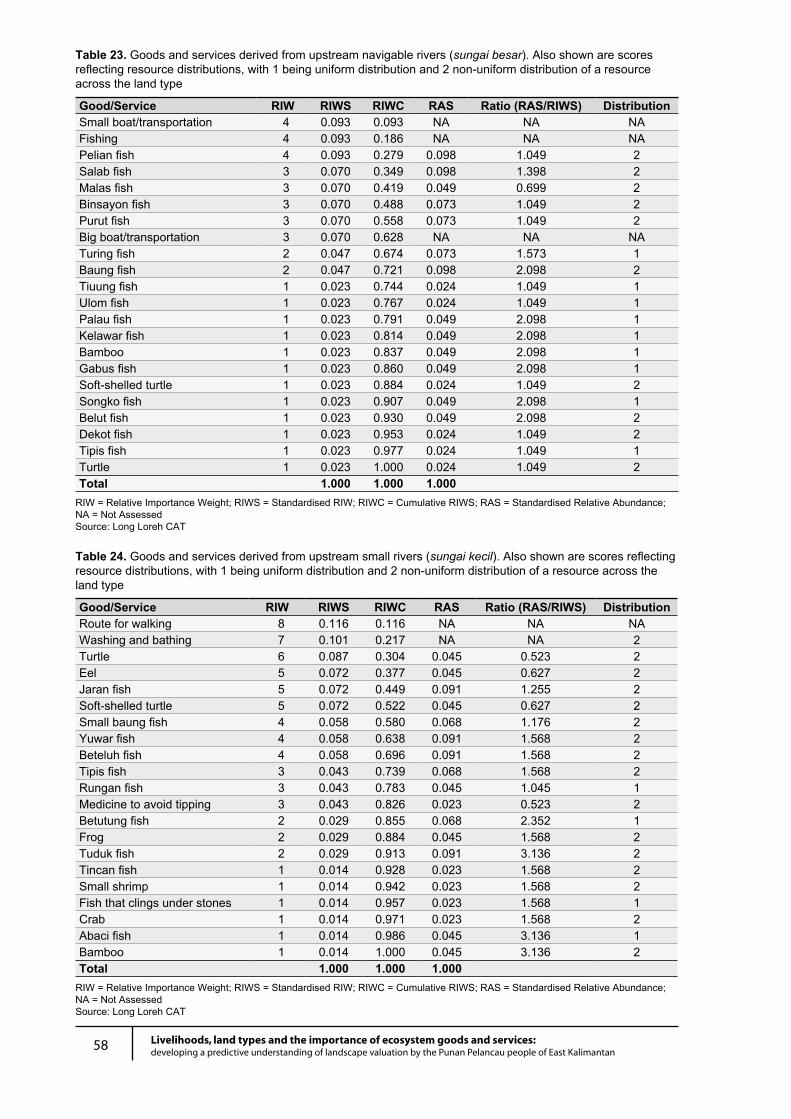
58 Livelihoods, land types and the importance of ecosystem goods and services:developing a predictive understanding of landscape valuation by the Punan Pelancau people of East Kalimantan
Table 24. Goods and services derived from upstream small rivers (sungai kecil). Also shown are scores reflecting resource distributions, with 1 being uniform distribution and 2 non-uniform distribution of a resource across the land type
Good/Service RIW RIWS RIWC RAS Ratio (RAS/RIWS) DistributionRoute for walking 8 0.116 0.116 NA NA NAWashing and bathing 7 0.101 0.217 NA NA 2Turtle 6 0.087 0.304 0.045 0.523 2Eel 5 0.072 0.377 0.045 0.627 2Jaran fish 5 0.072 0.449 0.091 1.255 2Soft-shelled turtle 5 0.072 0.522 0.045 0.627 2Small baung fish 4 0.058 0.580 0.068 1.176 2Yuwar fish 4 0.058 0.638 0.091 1.568 2Beteluh fish 4 0.058 0.696 0.091 1.568 2Tipis fish 3 0.043 0.739 0.068 1.568 2Rungan fish 3 0.043 0.783 0.045 1.045 1Medicine to avoid tipping 3 0.043 0.826 0.023 0.523 2Betutung fish 2 0.029 0.855 0.068 2.352 1Frog 2 0.029 0.884 0.045 1.568 2Tuduk fish 2 0.029 0.913 0.091 3.136 2Tincan fish 1 0.014 0.928 0.023 1.568 2Small shrimp 1 0.014 0.942 0.023 1.568 2Fish that clings under stones 1 0.014 0.957 0.023 1.568 1Crab 1 0.014 0.971 0.023 1.568 2Abaci fish 1 0.014 0.986 0.045 3.136 1Bamboo 1 0.014 1.000 0.045 3.136 2Total 1.000 1.000 1.000
RIW = Relative Importance Weight; RIWS = Standardised RIW; RIWC = Cumulative RIWS; RAS = Standardised Relative Abundance; NA = Not AssessedSource: Long Loreh CAT
Table 23. Goods and services derived from upstream navigable rivers (sungai besar). Also shown are scores reflecting resource distributions, with 1 being uniform distribution and 2 non-uniform distribution of a resource across the land type
Good/Service RIW RIWS RIWC RAS Ratio (RAS/RIWS) DistributionSmall boat/transportation 4 0.093 0.093 NA NA NAFishing 4 0.093 0.186 NA NA NAPelian fish 4 0.093 0.279 0.098 1.049 2Salab fish 3 0.070 0.349 0.098 1.398 2Malas fish 3 0.070 0.419 0.049 0.699 2Binsayon fish 3 0.070 0.488 0.073 1.049 2Purut fish 3 0.070 0.558 0.073 1.049 2Big boat/transportation 3 0.070 0.628 NA NA NATuring fish 2 0.047 0.674 0.073 1.573 1Baung fish 2 0.047 0.721 0.098 2.098 2Tiuung fish 1 0.023 0.744 0.024 1.049 1Ulom fish 1 0.023 0.767 0.024 1.049 1Palau fish 1 0.023 0.791 0.049 2.098 1Kelawar fish 1 0.023 0.814 0.049 2.098 1Bamboo 1 0.023 0.837 0.049 2.098 1Gabus fish 1 0.023 0.860 0.049 2.098 1Soft-shelled turtle 1 0.023 0.884 0.024 1.049 2Songko fish 1 0.023 0.907 0.049 2.098 1Belut fish 1 0.023 0.930 0.049 2.098 2Dekot fish 1 0.023 0.953 0.024 1.049 2Tipis fish 1 0.023 0.977 0.024 1.049 1Turtle 1 0.023 1.000 0.024 1.049 2Total 1.000 1.000 1.000
RIW = Relative Importance Weight; RIWS = Standardised RIW; RIWC = Cumulative RIWS; RAS = Standardised Relative Abundance; NA = Not AssessedSource: Long Loreh CAT
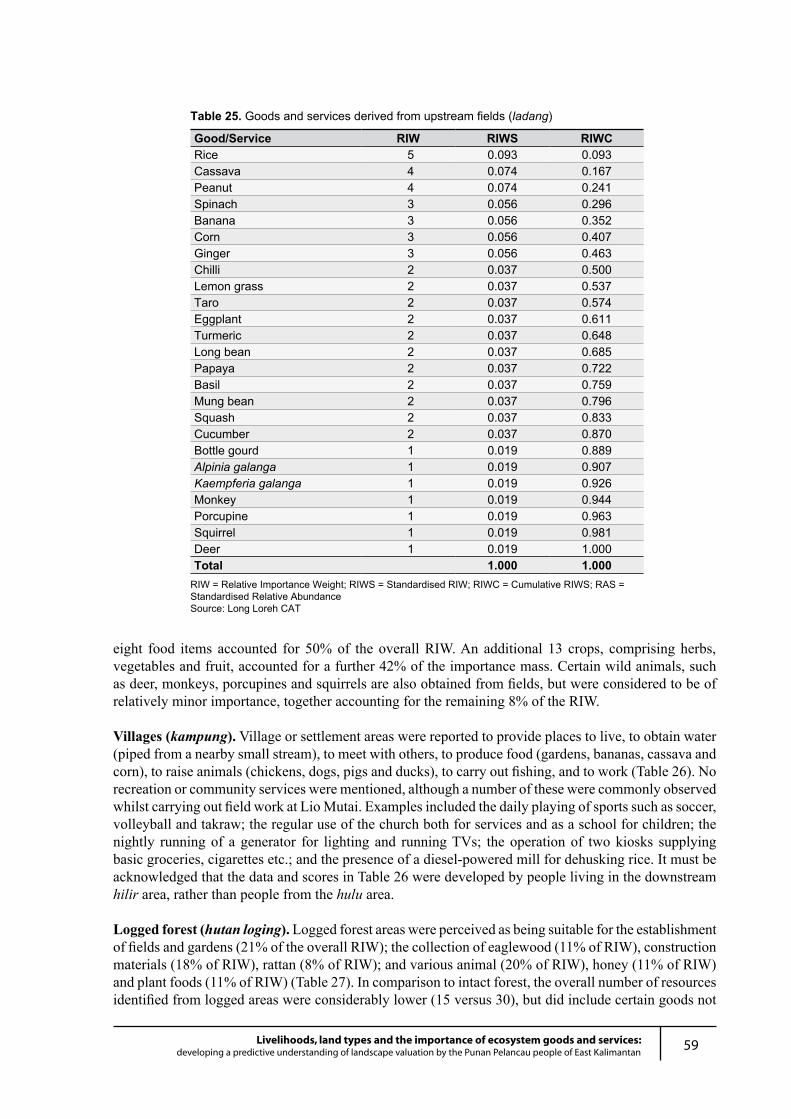
59Livelihoods, land types and the importance of ecosystem goods and services:developing a predictive understanding of landscape valuation by the Punan Pelancau people of East Kalimantan
Table 25. Goods and services derived from upstream fields (ladang)
Good/Service RIW RIWS RIWCRice 5 0.093 0.093Cassava 4 0.074 0.167Peanut 4 0.074 0.241Spinach 3 0.056 0.296Banana 3 0.056 0.352Corn 3 0.056 0.407Ginger 3 0.056 0.463Chilli 2 0.037 0.500Lemon grass 2 0.037 0.537Taro 2 0.037 0.574Eggplant 2 0.037 0.611Turmeric 2 0.037 0.648Long bean 2 0.037 0.685Papaya 2 0.037 0.722Basil 2 0.037 0.759Mung bean 2 0.037 0.796Squash 2 0.037 0.833Cucumber 2 0.037 0.870Bottle gourd 1 0.019 0.889Alpinia galanga 1 0.019 0.907Kaempferia galanga 1 0.019 0.926Monkey 1 0.019 0.944Porcupine 1 0.019 0.963Squirrel 1 0.019 0.981Deer 1 0.019 1.000Total 1.000 1.000
RIW = Relative Importance Weight; RIWS = Standardised RIW; RIWC = Cumulative RIWS; RAS = Standardised Relative Abundance Source: Long Loreh CAT
eight food items accounted for 50% of the overall RIW. An additional 13 crops, comprising herbs, vegetables and fruit, accounted for a further 42% of the importance mass. Certain wild animals, such as deer, monkeys, porcupines and squirrels are also obtained from fields, but were considered to be of relatively minor importance, together accounting for the remaining 8% of the RIW.
Villages (kampung). Village or settlement areas were reported to provide places to live, to obtain water (piped from a nearby small stream), to meet with others, to produce food (gardens, bananas, cassava and corn), to raise animals (chickens, dogs, pigs and ducks), to carry out fishing, and to work (Table 26). No recreation or community services were mentioned, although a number of these were commonly observed whilst carrying out field work at Lio Mutai. Examples included the daily playing of sports such as soccer, volleyball and takraw; the regular use of the church both for services and as a school for children; the nightly running of a generator for lighting and running TVs; the operation of two kiosks supplying basic groceries, cigarettes etc.; and the presence of a diesel-powered mill for dehusking rice. It must be acknowledged that the data and scores in Table 26 were developed by people living in the downstream hilir area, rather than people from the hulu area.
Logged forest (hutan loging). Logged forest areas were perceived as being suitable for the establishment of fields and gardens (21% of the overall RIW); the collection of eaglewood (11% of RIW), construction materials (18% of RIW), rattan (8% of RIW); and various animal (20% of RIW), honey (11% of RIW) and plant foods (11% of RIW) (Table 27). In comparison to intact forest, the overall number of resources identified from logged areas were considerably lower (15 versus 30), but did include certain goods not
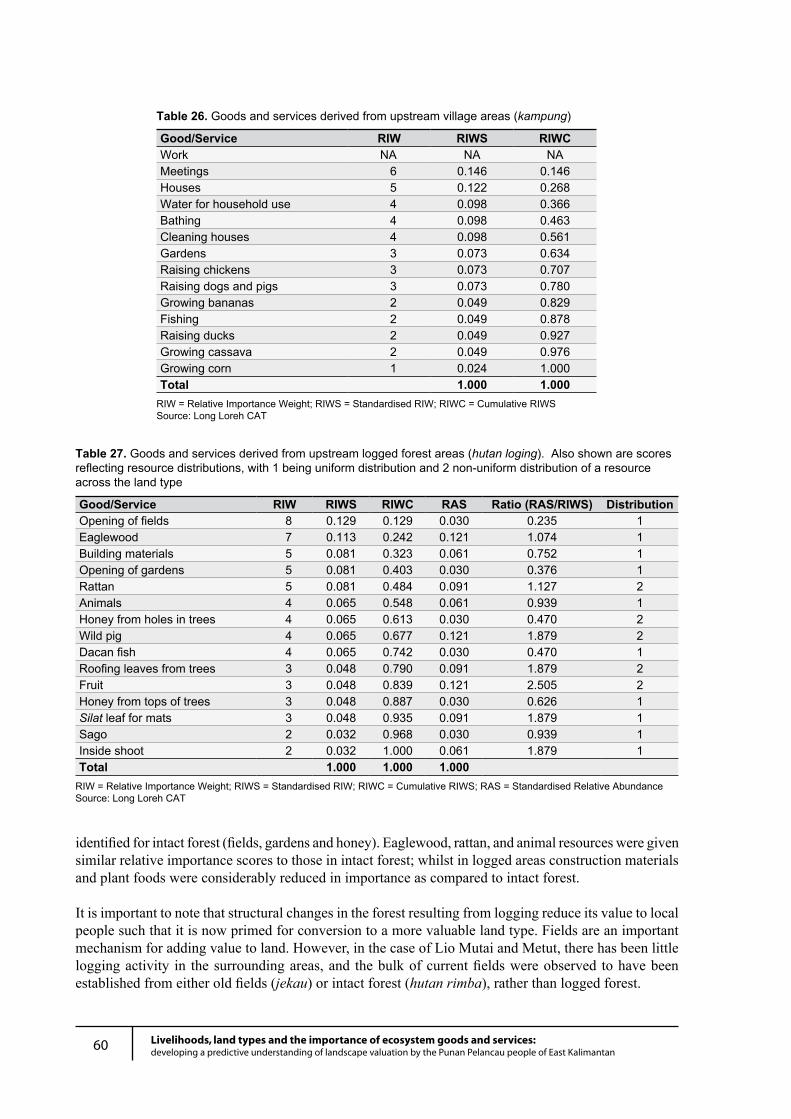
60 Livelihoods, land types and the importance of ecosystem goods and services:developing a predictive understanding of landscape valuation by the Punan Pelancau people of East Kalimantan
Table 26. Goods and services derived from upstream village areas (kampung)
Good/Service RIW RIWS RIWCWork NA NA NAMeetings 6 0.146 0.146Houses 5 0.122 0.268Water for household use 4 0.098 0.366Bathing 4 0.098 0.463Cleaning houses 4 0.098 0.561Gardens 3 0.073 0.634Raising chickens 3 0.073 0.707Raising dogs and pigs 3 0.073 0.780Growing bananas 2 0.049 0.829Fishing 2 0.049 0.878Raising ducks 2 0.049 0.927Growing cassava 2 0.049 0.976Growing corn 1 0.024 1.000Total 1.000 1.000
RIW = Relative Importance Weight; RIWS = Standardised RIW; RIWC = Cumulative RIWSSource: Long Loreh CAT
Table 27. Goods and services derived from upstream logged forest areas (hutan loging). Also shown are scores reflecting resource distributions, with 1 being uniform distribution and 2 non-uniform distribution of a resource across the land type
Good/Service RIW RIWS RIWC RAS Ratio (RAS/RIWS) DistributionOpening of fields 8 0.129 0.129 0.030 0.235 1Eaglewood 7 0.113 0.242 0.121 1.074 1Building materials 5 0.081 0.323 0.061 0.752 1Opening of gardens 5 0.081 0.403 0.030 0.376 1Rattan 5 0.081 0.484 0.091 1.127 2Animals 4 0.065 0.548 0.061 0.939 1Honey from holes in trees 4 0.065 0.613 0.030 0.470 2Wild pig 4 0.065 0.677 0.121 1.879 2Dacan fish 4 0.065 0.742 0.030 0.470 1Roofing leaves from trees 3 0.048 0.790 0.091 1.879 2Fruit 3 0.048 0.839 0.121 2.505 2Honey from tops of trees 3 0.048 0.887 0.030 0.626 1Silat leaf for mats 3 0.048 0.935 0.091 1.879 1Sago 2 0.032 0.968 0.030 0.939 1Inside shoot 2 0.032 1.000 0.061 1.879 1Total 1.000 1.000 1.000
RIW = Relative Importance Weight; RIWS = Standardised RIW; RIWC = Cumulative RIWS; RAS = Standardised Relative Abundance Source: Long Loreh CAT
identified for intact forest (fields, gardens and honey). Eaglewood, rattan, and animal resources were given similar relative importance scores to those in intact forest; whilst in logged areas construction materials and plant foods were considerably reduced in importance as compared to intact forest.
It is important to note that structural changes in the forest resulting from logging reduce its value to local people such that it is now primed for conversion to a more valuable land type. Fields are an important mechanism for adding value to land. However, in the case of Lio Mutai and Metut, there has been little logging activity in the surrounding areas, and the bulk of current fields were observed to have been established from either old fields (jekau) or intact forest (hutan rimba), rather than logged forest.
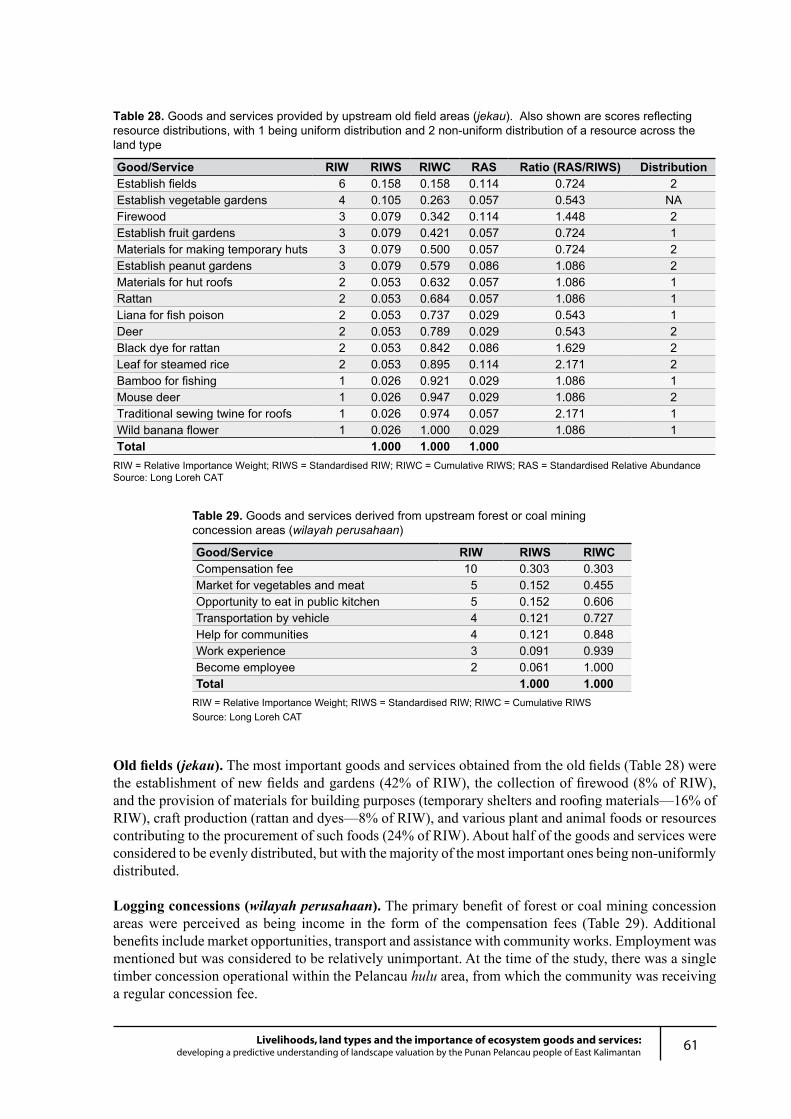
61Livelihoods, land types and the importance of ecosystem goods and services:developing a predictive understanding of landscape valuation by the Punan Pelancau people of East Kalimantan
Table 29. Goods and services derived from upstream forest or coal mining concession areas (wilayah perusahaan)
Good/Service RIW RIWS RIWCCompensation fee 10 0.303 0.303Market for vegetables and meat 5 0.152 0.455Opportunity to eat in public kitchen 5 0.152 0.606Transportation by vehicle 4 0.121 0.727Help for communities 4 0.121 0.848Work experience 3 0.091 0.939Become employee 2 0.061 1.000Total 1.000 1.000
RIW = Relative Importance Weight; RIWS = Standardised RIW; RIWC = Cumulative RIWS Source: Long Loreh CAT
Table 28. Goods and services provided by upstream old field areas (jekau). Also shown are scores reflecting resource distributions, with 1 being uniform distribution and 2 non-uniform distribution of a resource across the land type
Good/Service RIW RIWS RIWC RAS Ratio (RAS/RIWS) DistributionEstablish fields 6 0.158 0.158 0.114 0.724 2Establish vegetable gardens 4 0.105 0.263 0.057 0.543 NAFirewood 3 0.079 0.342 0.114 1.448 2Establish fruit gardens 3 0.079 0.421 0.057 0.724 1Materials for making temporary huts 3 0.079 0.500 0.057 0.724 2Establish peanut gardens 3 0.079 0.579 0.086 1.086 2Materials for hut roofs 2 0.053 0.632 0.057 1.086 1Rattan 2 0.053 0.684 0.057 1.086 1Liana for fish poison 2 0.053 0.737 0.029 0.543 1Deer 2 0.053 0.789 0.029 0.543 2Black dye for rattan 2 0.053 0.842 0.086 1.629 2Leaf for steamed rice 2 0.053 0.895 0.114 2.171 2Bamboo for fishing 1 0.026 0.921 0.029 1.086 1Mouse deer 1 0.026 0.947 0.029 1.086 2Traditional sewing twine for roofs 1 0.026 0.974 0.057 2.171 1Wild banana flower 1 0.026 1.000 0.029 1.086 1Total 1.000 1.000 1.000
RIW = Relative Importance Weight; RIWS = Standardised RIW; RIWC = Cumulative RIWS; RAS = Standardised Relative Abundance Source: Long Loreh CAT
Old fields (jekau). The most important goods and services obtained from the old fields (Table 28) were the establishment of new fields and gardens (42% of RIW), the collection of firewood (8% of RIW), and the provision of materials for building purposes (temporary shelters and roofing materials—16% of RIW), craft production (rattan and dyes—8% of RIW), and various plant and animal foods or resources contributing to the procurement of such foods (24% of RIW). About half of the goods and services were considered to be evenly distributed, but with the majority of the most important ones being non-uniformly distributed.
Logging concessions (wilayah perusahaan). The primary benefit of forest or coal mining concession areas were perceived as being income in the form of the compensation fees (Table 29). Additional benefits include market opportunities, transport and assistance with community works. Employment was mentioned but was considered to be relatively unimportant. At the time of the study, there was a single timber concession operational within the Pelancau hulu area, from which the community was receiving a regular concession fee.
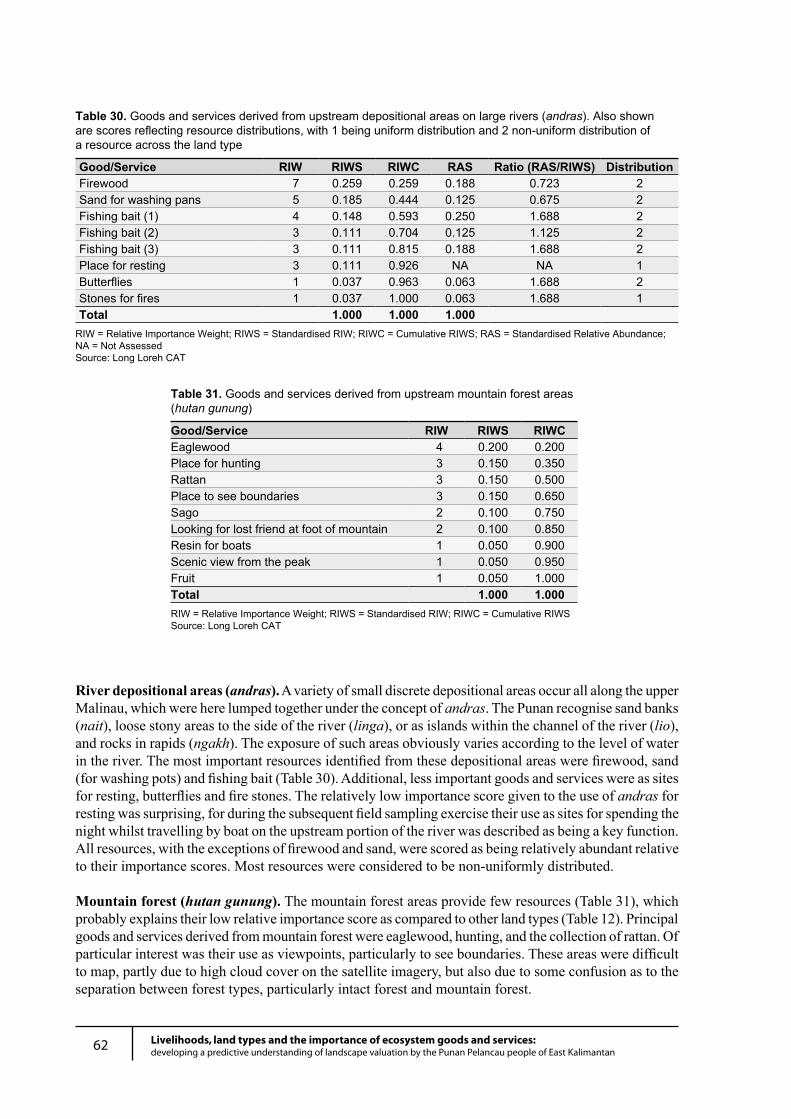
62 Livelihoods, land types and the importance of ecosystem goods and services:developing a predictive understanding of landscape valuation by the Punan Pelancau people of East Kalimantan
Table 30. Goods and services derived from upstream depositional areas on large rivers (andras). Also shown are scores reflecting resource distributions, with 1 being uniform distribution and 2 non-uniform distribution of a resource across the land type
Good/Service RIW RIWS RIWC RAS Ratio (RAS/RIWS) DistributionFirewood 7 0.259 0.259 0.188 0.723 2Sand for washing pans 5 0.185 0.444 0.125 0.675 2Fishing bait (1) 4 0.148 0.593 0.250 1.688 2Fishing bait (2) 3 0.111 0.704 0.125 1.125 2Fishing bait (3) 3 0.111 0.815 0.188 1.688 2Place for resting 3 0.111 0.926 NA NA 1Butterflies 1 0.037 0.963 0.063 1.688 2Stones for fires 1 0.037 1.000 0.063 1.688 1Total 1.000 1.000 1.000
RIW = Relative Importance Weight; RIWS = Standardised RIW; RIWC = Cumulative RIWS; RAS = Standardised Relative Abundance; NA = Not AssessedSource: Long Loreh CAT
Table 31. Goods and services derived from upstream mountain forest areas (hutan gunung)
Good/Service RIW RIWS RIWCEaglewood 4 0.200 0.200Place for hunting 3 0.150 0.350Rattan 3 0.150 0.500Place to see boundaries 3 0.150 0.650Sago 2 0.100 0.750Looking for lost friend at foot of mountain 2 0.100 0.850Resin for boats 1 0.050 0.900Scenic view from the peak 1 0.050 0.950Fruit 1 0.050 1.000Total 1.000 1.000RIW = Relative Importance Weight; RIWS = Standardised RIW; RIWC = Cumulative RIWSSource: Long Loreh CAT
River depositional areas (andras). A variety of small discrete depositional areas occur all along the upper Malinau, which were here lumped together under the concept of andras. The Punan recognise sand banks (nait), loose stony areas to the side of the river (linga), or as islands within the channel of the river (lio), and rocks in rapids (ngakh). The exposure of such areas obviously varies according to the level of water in the river. The most important resources identified from these depositional areas were firewood, sand (for washing pots) and fishing bait (Table 30). Additional, less important goods and services were as sites for resting, butterflies and fire stones. The relatively low importance score given to the use of andras for resting was surprising, for during the subsequent field sampling exercise their use as sites for spending the night whilst travelling by boat on the upstream portion of the river was described as being a key function. All resources, with the exceptions of firewood and sand, were scored as being relatively abundant relative to their importance scores. Most resources were considered to be non-uniformly distributed.
Mountain forest (hutan gunung). The mountain forest areas provide few resources (Table 31), which probably explains their low relative importance score as compared to other land types (Table 12). Principal goods and services derived from mountain forest were eaglewood, hunting, and the collection of rattan. Of particular interest was their use as viewpoints, particularly to see boundaries. These areas were difficult to map, partly due to high cloud cover on the satellite imagery, but also due to some confusion as to the separation between forest types, particularly intact forest and mountain forest.
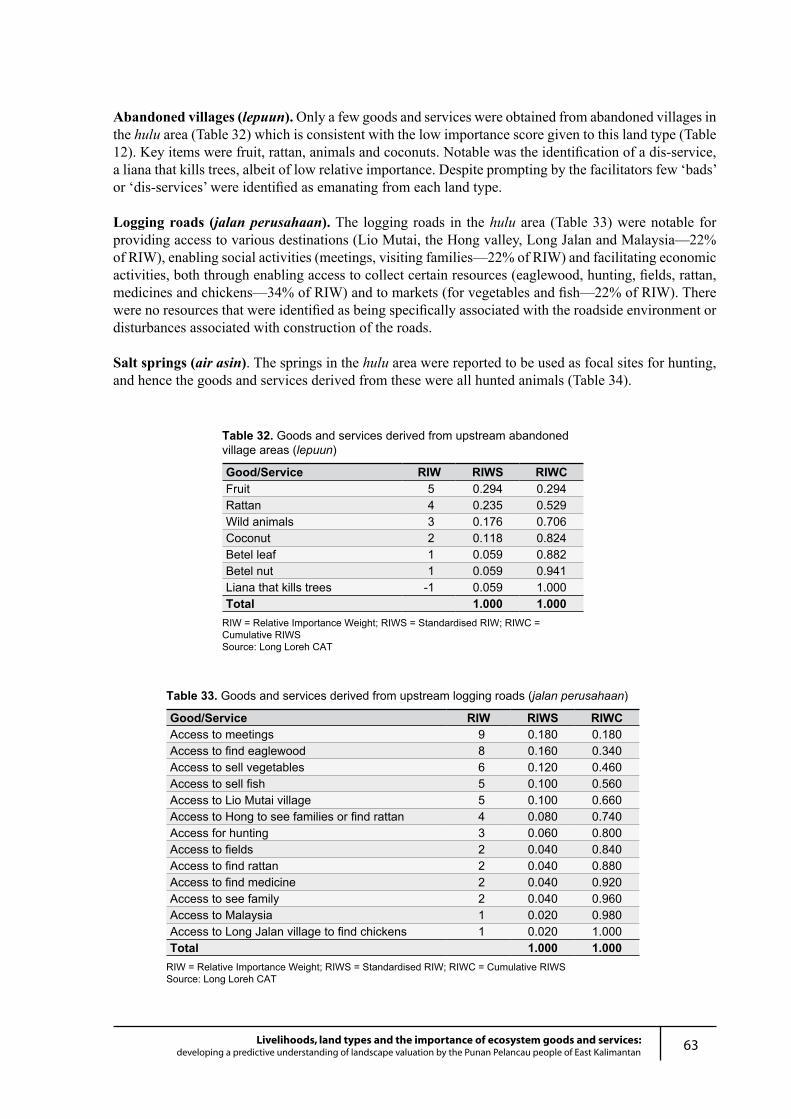
63Livelihoods, land types and the importance of ecosystem goods and services:developing a predictive understanding of landscape valuation by the Punan Pelancau people of East Kalimantan
Abandoned villages (lepuun). Only a few goods and services were obtained from abandoned villages in the hulu area (Table 32) which is consistent with the low importance score given to this land type (Table 12). Key items were fruit, rattan, animals and coconuts. Notable was the identification of a dis-service, a liana that kills trees, albeit of low relative importance. Despite prompting by the facilitators few ‘bads’ or ‘dis-services’ were identified as emanating from each land type.
Logging roads (jalan perusahaan). The logging roads in the hulu area (Table 33) were notable for providing access to various destinations (Lio Mutai, the Hong valley, Long Jalan and Malaysia—22% of RIW), enabling social activities (meetings, visiting families—22% of RIW) and facilitating economic activities, both through enabling access to collect certain resources (eaglewood, hunting, fields, rattan, medicines and chickens—34% of RIW) and to markets (for vegetables and fish—22% of RIW). There were no resources that were identified as being specifically associated with the roadside environment or disturbances associated with construction of the roads.
Salt springs (air asin). The springs in the hulu area were reported to be used as focal sites for hunting, and hence the goods and services derived from these were all hunted animals (Table 34).
Table 32. Goods and services derived from upstream abandoned village areas (lepuun)
Good/Service RIW RIWS RIWCFruit 5 0.294 0.294Rattan 4 0.235 0.529Wild animals 3 0.176 0.706Coconut 2 0.118 0.824Betel leaf 1 0.059 0.882Betel nut 1 0.059 0.941Liana that kills trees -1 0.059 1.000Total 1.000 1.000
RIW = Relative Importance Weight; RIWS = Standardised RIW; RIWC = Cumulative RIWSSource: Long Loreh CAT
Table 33. Goods and services derived from upstream logging roads (jalan perusahaan)
Good/Service RIW RIWS RIWCAccess to meetings 9 0.180 0.180Access to find eaglewood 8 0.160 0.340Access to sell vegetables 6 0.120 0.460Access to sell fish 5 0.100 0.560Access to Lio Mutai village 5 0.100 0.660Access to Hong to see families or find rattan 4 0.080 0.740Access for hunting 3 0.060 0.800Access to fields 2 0.040 0.840Access to find rattan 2 0.040 0.880Access to find medicine 2 0.040 0.920Access to see family 2 0.040 0.960Access to Malaysia 1 0.020 0.980Access to Long Jalan village to find chickens 1 0.020 1.000Total 1.000 1.000
RIW = Relative Importance Weight; RIWS = Standardised RIW; RIWC = Cumulative RIWSSource: Long Loreh CAT
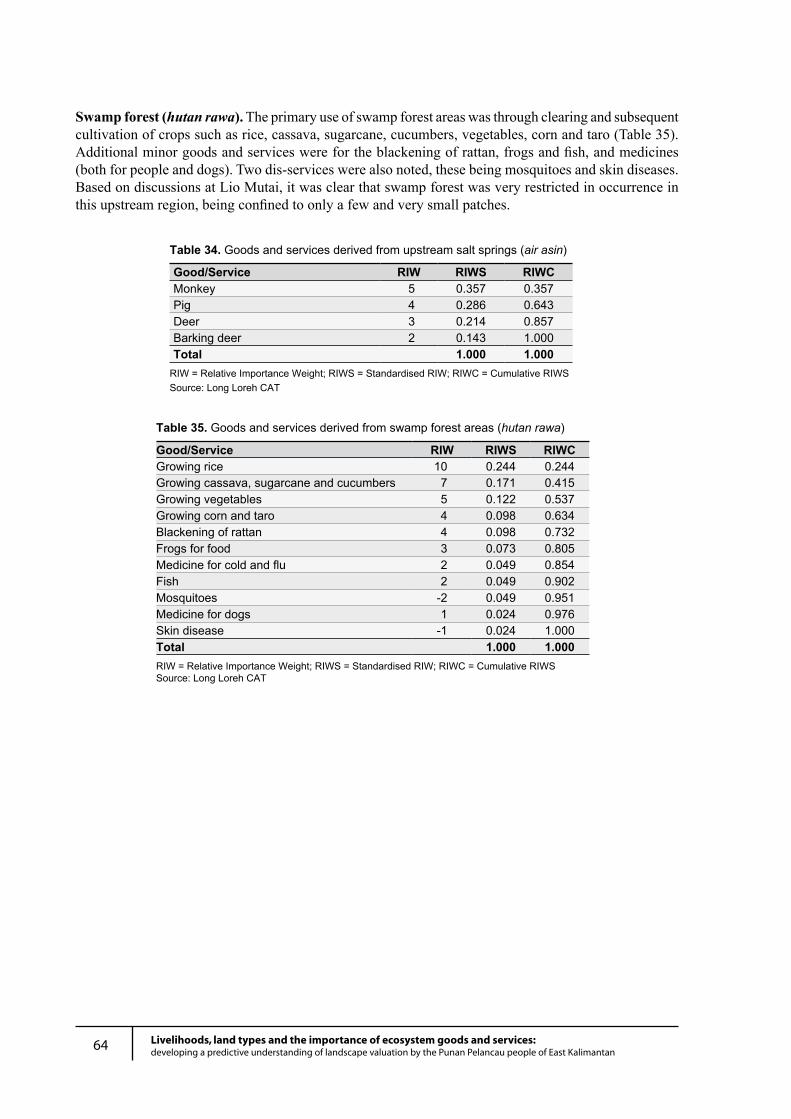
64 Livelihoods, land types and the importance of ecosystem goods and services:developing a predictive understanding of landscape valuation by the Punan Pelancau people of East Kalimantan
Table 34. Goods and services derived from upstream salt springs (air asin)
Good/Service RIW RIWS RIWCMonkey 5 0.357 0.357Pig 4 0.286 0.643Deer 3 0.214 0.857Barking deer 2 0.143 1.000Total 1.000 1.000
RIW = Relative Importance Weight; RIWS = Standardised RIW; RIWC = Cumulative RIWSSource: Long Loreh CAT
Table 35. Goods and services derived from swamp forest areas (hutan rawa)
Good/Service RIW RIWS RIWCGrowing rice 10 0.244 0.244Growing cassava, sugarcane and cucumbers 7 0.171 0.415Growing vegetables 5 0.122 0.537Growing corn and taro 4 0.098 0.634Blackening of rattan 4 0.098 0.732Frogs for food 3 0.073 0.805Medicine for cold and flu 2 0.049 0.854Fish 2 0.049 0.902Mosquitoes -2 0.049 0.951Medicine for dogs 1 0.024 0.976Skin disease -1 0.024 1.000Total 1.000 1.000RIW = Relative Importance Weight; RIWS = Standardised RIW; RIWC = Cumulative RIWSSource: Long Loreh CAT
Swamp forest (hutan rawa). The primary use of swamp forest areas was through clearing and subsequent cultivation of crops such as rice, cassava, sugarcane, cucumbers, vegetables, corn and taro (Table 35). Additional minor goods and services were for the blackening of rattan, frogs and fish, and medicines (both for people and dogs). Two dis-services were also noted, these being mosquitoes and skin diseases. Based on discussions at Lio Mutai, it was clear that swamp forest was very restricted in occurrence in this upstream region, being confined to only a few and very small patches.
The Center for International Forestry Research (CIFOR) is a leading international forestry
research organisation established in 1993 in response to global concerns about the social,
environmental, and economic consequences of forest loss and degradation. CIFOR is
dedicated to developing policies and technologies for sustainable use and management
of forests, and for enhancing the well-being of people in developing countries who rely
on tropical forests for their livelihoods. CIFOR is one of the 15 centres supported by the
Consultative Group on International Agricultural Research (CGIAR). With headquarters
in Bogor, Indonesia, CIFOR has regional offices in Brazil, Burkina Faso, Cameroon and
Zimbabwe, and it works in over 30 other countries around the world.
Donors
CIFOR receives its major funding from governments, international development
organizations, private foundations and regional organizations. In 2005, CIFOR received
financial support from Australia, Asian Development Bank (ADB), Belgium, Brazil,
Canada, China, Centre de coopération internationale en recherche agronomique pour
le développement (CIRAD), Cordaid, Conservation International Foundation (CIF),
European Commission, Finland, Food and Agriculture Organization of the United
Nations (FAO), Ford Foundation, France, German Agency for Technical Cooperation (GTZ),
German Federal Ministry for Economic Cooperation and Development (BMZ), Indonesia,
International Development Research Centre (IDRC), International Fund for Agricultural
Development (IFAD), International Tropical Timber Organization (ITTO), Israel, Italy, The
World Conservation Union (IUCN), Japan, Korea, Netherlands, Norway, Netherlands
Development Organization, Overseas Development Institute (ODI), Peruvian Secretariat
for International Cooperation (RSCI), Philippines, Spain, Sweden, Swedish University of
Agricultural Sciences (SLU), Switzerland, Swiss Agency for the Environment, Forests and
Landscape, The Overbrook Foundation, The Nature Conservancy (TNC), Tropical Forest
Foundation, Tropenbos International, United States, United Kingdom, United Nations
Environment Programme (UNEP), World Bank, World Resources Institute (WRI) and World
Wide Fund for Nature (WWF).
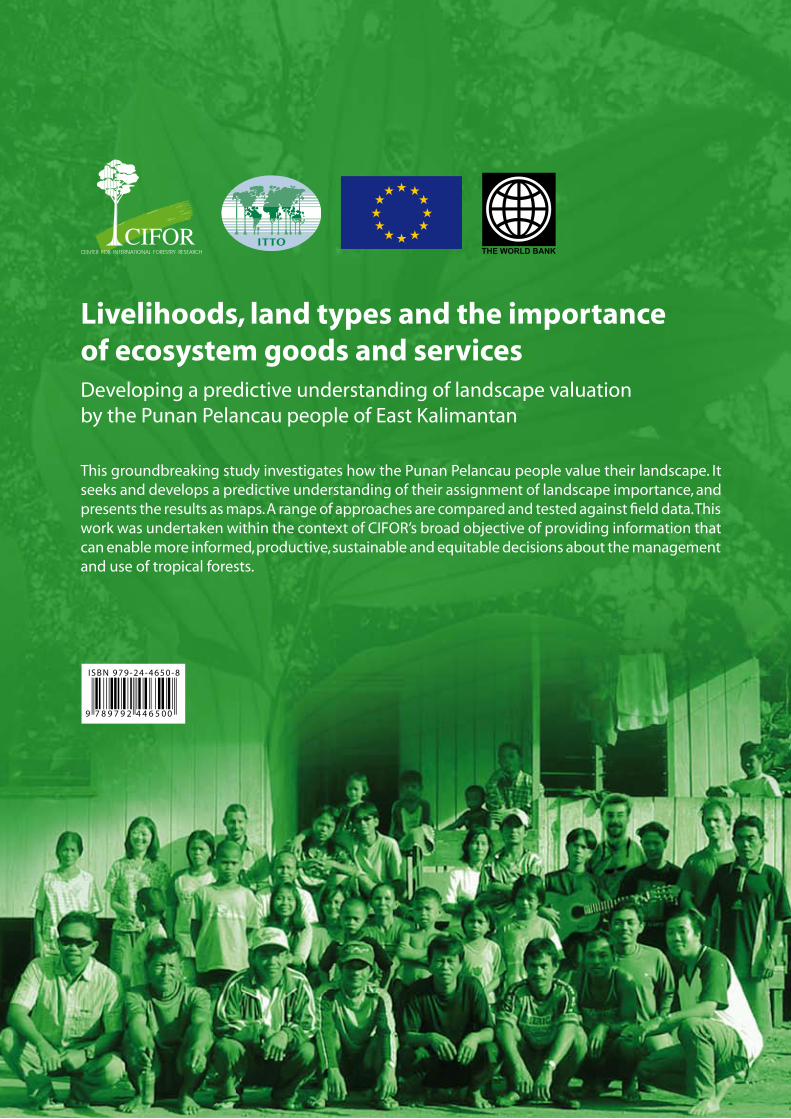
This groundbreaking study investigates how the Punan Pelancau people value their landscape. It seeks and develops a predictive understanding of their assignment of landscape importance, and presents the results as maps. A range of approaches are compared and tested against field data. This work was undertaken within the context of CIFOR’s broad objective of providing information that can enable more informed, productive, sustainable and equitable decisions about the management and use of tropical forests.
Developing a predictive understanding of landscape valuation by the Punan Pelancau people of East Kalimantan
Livelihoods, land types and the importanceof ecosystem goods and services
9 7 8 9 7 9 2 4 4 6 5 0 0
ISBN 979-24-4650-8
Related Documents