1 LIVE NATION ENTERTAINMENT REPORTS FOURTH QUARTER AND FULL YEAR 2016 RESULTS Full Year 2016 - A Record Year for Live Nation Revenue Up 15% to $8.4 Billion Operating Income Up 48% to $195 Million Free Cash Flow Up 5% to $352 Million AOI Up 12% to $646 Million at Constant Currency Live Nation Concerts Attendance of 71 Million, Up 12% Sponsorship & Advertising Revenue Up 13% Ticketmaster Fee-Bearing GTV Up 16% at Constant Currency Secondary GTV Up 26% at Constant Currency LOS ANGELES – February 23, 2017 – Live Nation Entertainment (NYSE: LYV) today released financial results for the three and twelve months ended December 31, 2016. Live Nation delivered its sixth consecutive year of record results across revenue, adjusted operating income, or AOI, and free cash flow, and also delivered operating income growth in 2016. For the year, revenue was up 15%, operating income was up 48%, and free cash flow was up 5%, all as reported, and AOI was up 12% at constant currency. Our core divisions - concerts, ticketing and advertising - each delivered their strongest operating income and AOI results in the history of the company. We continue to see the tremendous power of live events, with strong global consumer demand. Live is a truly unique entertainment form - it cannot be duplicated. It is elevated, not threatened, by technology and is borderless. Fans around the world can now discover, follow, share and embrace artists, creating greater demand for live shows. We believe the live business will continue to have strong growth for years to come as fans globally drive demand, artists are motivated to tour, and technology drives conversion. Concerts Market Share Growth Accelerated in 2016 Live Nation continued to grow its global market share, adding over 7 million fans globally in 2016 for a total of over 71 million fans, driving revenue up 18%, operating income up 88%, and more than doubling concerts AOI. We built on our global leadership position in every part of our business, with double-digit fan growth in both North America and internationally, and across stadiums, amphitheaters, festivals, theaters and clubs.

Welcome message from author
This document is posted to help you gain knowledge. Please leave a comment to let me know what you think about it! Share it to your friends and learn new things together.
Transcript

1
LIVE NATION ENTERTAINMENT REPORTS FOURTH QUARTER AND FULL YEAR 2016 RESULTS
Full Year 2016 - A Record Year for Live NationRevenue Up 15% to $8.4 BillionOperating Income Up 48% to $195 MillionFree Cash Flow Up 5% to $352 MillionAOI Up 12% to $646 Million at Constant CurrencyLive Nation Concerts Attendance of 71 Million, Up 12%Sponsorship & Advertising Revenue Up 13%Ticketmaster Fee-Bearing GTV Up 16% at Constant CurrencySecondary GTV Up 26% at Constant Currency
LOS ANGELES – February 23, 2017 – Live Nation Entertainment (NYSE: LYV) today released financial results
for the three and twelve months ended December 31, 2016.
Live Nation delivered its sixth consecutive year of record results across revenue, adjusted operating income, or
AOI, and free cash flow, and also delivered operating income growth in 2016. For the year, revenue was up 15%,
operating income was up 48%, and free cash flow was up 5%, all as reported, and AOI was up 12% at constant
currency. Our core divisions - concerts, ticketing and advertising - each delivered their strongest operating income
and AOI results in the history of the company.
We continue to see the tremendous power of live events, with strong global consumer demand. Live is a truly
unique entertainment form - it cannot be duplicated. It is elevated, not threatened, by technology and is borderless.
Fans around the world can now discover, follow, share and embrace artists, creating greater demand for live
shows. We believe the live business will continue to have strong growth for years to come as fans globally drive
demand, artists are motivated to tour, and technology drives conversion.
Concerts Market Share Growth Accelerated in 2016
Live Nation continued to grow its global market share, adding over 7 million fans globally in 2016 for a total of
over 71 million fans, driving revenue up 18%, operating income up 88%, and more than doubling concerts AOI.
We built on our global leadership position in every part of our business, with double-digit fan growth in both North
America and internationally, and across stadiums, amphitheaters, festivals, theaters and clubs.
2
We continued expanding our global footprint in 2016 as we added promoting offices in Germany, South Africa,
and Israel, taking us to 40 countries worldwide. Across all our markets, we invested $4.4 billion to put on 26
thousand shows, with Live Nation now by far the largest financial supporter of artists in music.
Fans more than ever find the live experience, from club shows to arenas to festivals, a top entertainment choice
and the best way to celebrate their favorite artists and share the experience with other fans. This, combined with
an ongoing shift of consumer spending toward experiences, is helping drive a structural increase in demand for
concerts globally. And in addition to fan growth, with this demand we are also seeing an increasing willingness
by fans to spend more for tickets to the show and once they are there.
Average ticket prices for our shows increased by 5% in 2016, with high single- to double-digit growth at
amphitheaters, arenas and stadiums. These increases were driven largely by higher pricing for the best tickets,
as artists more effectively captured the true value from their shows.
Once at the show, average per fan spending grew as well. At our amphitheaters, spending grew by 9% to over
$22 as we added more high-end products, improved the quality of our food and beverage offering and increased
our points of sale.
Our growth is continuing into 2017, a further sign of the tremendous fan demand for our concerts and the success
of our global growth strategy. Ticket sales are up double digits year-on-year through February 17th, driven by
sales for arena and stadium shows, and we are confident we will again see strong growth in fan demand across
our business this year.
Advertising Continued Strong Growth in 2016
We grew our high-margin sponsorship & advertising revenue by 13%, operating income by 4%, both as reported,
and AOI by 10% at constant currency in 2016, with our 71 million onsite fans providing a unique advertising
platform for our sponsors, which we then extend through online advertising.
In 2016, our top strategic sponsors were a key driver of our growth as our 50 plus sponsors that spend over $1
million per year with us collectively spent $245 million to reach our fans, up 20% from last year.
Sponsorship at our festivals, connecting brands with those onsite millennial fans, continued to grow as we increased
festival sponsorship contribution margin by 18% at constant currency and festival sponsorship contribution margin
per fan by 12% at like-for-like festivals for the year.
At the same time, we continue to amplify our onsite advertising with our online reach. In 2016, we generated
over 4 billion views across Live Nation sites and platform partners including Snapchat, Facebook and YouTube,
providing our brand partners with further scale and reach.
3
We expect continued advertising growth at historical levels in 2017, with over 70% of our budgeted advertising
revenue for the year already contracted, and pacing double digits ahead of last year at this time.
Ticketmaster Extends Global Leadership in Ticketing
In 2016, Ticketmaster continued growing its global leadership in ticketing, with fee-bearing gross transaction value,
or GTV, up 16% and overall GTV up 11% to $28 billion at constant currency while delivering 480 million tickets
to fans in 28 countries. This drove our 11% increase in ticketing revenue, 10% increase in operating income,
both as reported, and 6% growth in AOI at constant currency.
Our secondary ticketing GTV growth of 26% in 2016, at constant currency, was driven by the premise that we
should safely and transparently provide all options to fans at Ticketmaster, which has been embraced by ticket
buyers. Overall, the Ticketmaster platform continues to demonstrate its effectiveness in selling tickets to fans,
with 6 of the top 10 sales months ever occurring in 2016, and conversion rates up across both online and mobile
platforms.
Our recent investments in Ticketmaster’s enterprise platform and open API now allow clients to sell tickets on
partner sites, driving the sale of over 10 million tickets in 2016. This has further deepened our relationship with
teams and artists who are looking for enhanced reach with sites such as Spotify, Bandsintown, Facebook, Groupon
and Costco, and more in progress.
With the combination of a stronger than ever ticketing destination at Ticketmaster and increasingly broad
distribution, Ticketmaster is better positioned than ever to continue growing its global leadership position in
ticketing. This success is continuing into 2017, as ticket sales are up 9% through February 17th, positioning us
for continued growth.
2017 Growth Drivers
As I have noted, the key leading indicators for each of our businesses are up year-on-year into February, pointing
to continued strong growth in 2017. We plan on holding more concerts for more fans in more countries than ever
before. We expect to sell more advertising, both onsite and online. And through continued product innovation
and expanded distribution at Ticketmaster, we plan on selling more tickets and driving increased conversion.
Our success in 2016 reaffirms that Live Nation has created an unparalleled live platform, bringing 550 million fans
in 40 countries to those unrivaled 2-hour events each year. The live business continues to have a strong growth
opportunity with artists touring as their primary source of income and using concerts as the best way to engage
and connect with their fans.
4
For Live Nation, we believe this sets us up well as our scale and breadth continue to grow and we drive increased
value with our business model of higher profits per show, more advertising and increased ticket sales. All of this
creates tremendous runway for Live Nation to continue delivering the level of growth we have demonstrated over
the last several years.
Michael RapinoPresident and Chief Executive OfficerLive Nation Entertainment, Inc.
Photo Credits: Beyonce - Frank Micelotta, Coldplay - Getty Images, Luke Bryan - Rich Frollini
The company will webcast a teleconference today at 5:00 p.m. Eastern Time to discuss its financial performance. Interested parties should visit the “Events & Webcasts” section of the company’s website at investors.livenationentertainment.com to listen to the webcast. Supplemental statistical and financial information to be provided on the call, if any, will be available under the Reports section at the same link. A replay of the webcast will also be available on the Live Nation website.
About Live Nation Entertainment: Live Nation Entertainment, Inc. (NYSE: LYV) is the world’s leading live entertainment company comprised of global market leaders: Ticketmaster, Live Nation Concerts, Live Nation Media & Sponsorship and Artist Nation Management. For additional information, visit investors.livenationentertainment.com.
Investor Contact:Maili [email protected]
Media Contact:Carrie [email protected]
5
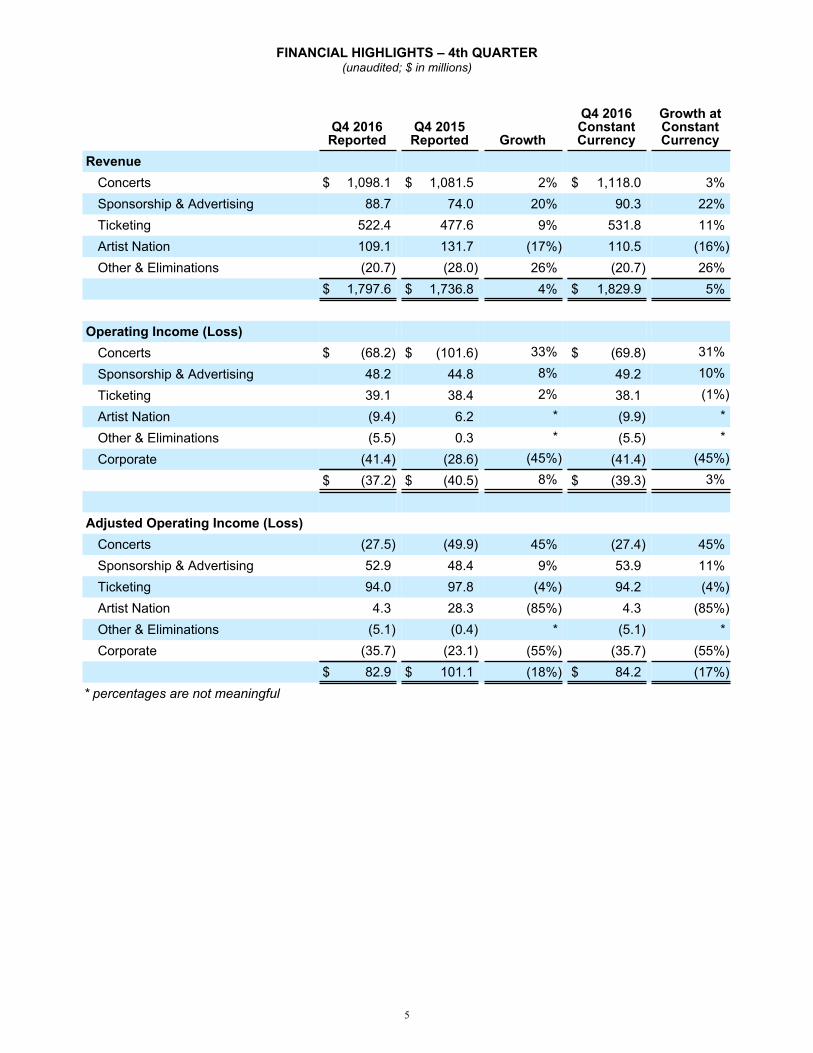
FINANCIAL HIGHLIGHTS – 4th QUARTER(unaudited; $ in millions)
Q4 2016Reported
Q4 2015Reported Growth
Q4 2016ConstantCurrency
Growth atConstantCurrency
RevenueConcerts $ 1,098.1 $ 1,081.5 2% $ 1,118.0 3%Sponsorship & Advertising 88.7 74.0 20% 90.3 22%Ticketing 522.4 477.6 9% 531.8 11%Artist Nation 109.1 131.7 (17%) 110.5 (16%)Other & Eliminations (20.7) (28.0) 26% (20.7) 26%
$ 1,797.6 $ 1,736.8 4% $ 1,829.9 5%
Operating Income (Loss)Concerts $ (68.2) $ (101.6) 33% $ (69.8) 31%
Sponsorship & Advertising 48.2 44.8 8% 49.2 10%
Ticketing 39.1 38.4 2% 38.1 (1%)
Artist Nation (9.4) 6.2 * (9.9) *
Other & Eliminations (5.5) 0.3 * (5.5) *
Corporate (41.4) (28.6) (45%) (41.4) (45%)
$ (37.2) $ (40.5) 8% $ (39.3) 3%
Adjusted Operating Income (Loss)Concerts (27.5) (49.9) 45% (27.4) 45%Sponsorship & Advertising 52.9 48.4 9% 53.9 11%Ticketing 94.0 97.8 (4%) 94.2 (4%)Artist Nation 4.3 28.3 (85%) 4.3 (85%)Other & Eliminations (5.1) (0.4) * (5.1) *Corporate (35.7) (23.1) (55%) (35.7) (55%)
$ 82.9 $ 101.1 (18%) $ 84.2 (17%) * percentages are not meaningful

6
FINANCIAL HIGHLIGHTS – 12 MONTHS(unaudited; $ in millions)
12 Months2016
Reported
12 Months2015
Reported Growth
12 Months 2016
Constant Currency
Growth atConstantCurrency
RevenueConcerts $ 5,874.1 $ 4,965.0 18% $ 5,961.9 20%Sponsorship & Advertising 377.6 333.7 13% 384.4 15%Ticketing 1,827.9 1,639.6 11% 1,851.5 13%Artist Nation 421.7 434.2 (3%) 426.6 (2%)Other & Eliminations (146.4) (126.8) (16%) (146.4) (16%)
$ 8,354.9 $ 7,245.7 15% $ 8,478.0 17%
Operating Income (Loss)Concerts $ (12.1) $ (105.3) 88% $ (16.2) 85%
Sponsorship & Advertising 228.1 218.4 4% 233.6 7%
Ticketing 174.5 158.2 10% 171.9 9%
Artist Nation (51.2) (28.2) (82%) (52.0) (84%)
Other & Eliminations (14.7) (0.1) * (14.7) *
Corporate (129.7) (111.6) (16%) (129.7) (16%)
$ 194.9 $ 131.4 48% $ 192.9 47%
Adjusted Operating Income (Loss)Concerts 138.9 61.5 126% 138.4 125%Sponsorship & Advertising 247.6 229.9 8% 253.0 10%Ticketing 365.3 346.5 5% 365.9 6%Artist Nation 10.3 33.2 (69%) 10.5 (68%)Other & Eliminations (14.0) (2.2) * (14.0) *Corporate (108.0) (90.9) (19%) (108.0) (19%)
$ 640.1 $ 578.0 11% $ 645.8 12% * percentages are not meaningful
As of December 31, 2016, total cash and cash equivalents were $1.5 billion, which includes $591 million in ticketing client cash and $411 million in free cash. Event-related deferred revenue was up 30% to $722 million as of December 31, 2016, compared to $553 million as of the same date in 2015.

7
KEY OPERATING METRICS
Year Ended December 31, 2016 2015 2014
(in thousands except estimated events)
Concerts (1)
Estimated events:North America 17,554 16,846 15,941International 8,708 8,665 6,853
Total estimated events 26,262 25,511 22,794Estimated fans:
North America 48,813 43,739 40,069International 22,330 19,703 18,486
Total estimated fans 71,143 63,442 58,555Ticketing (2)
Number of fee-bearing tickets sold 185,543 173,871 163,184Number of non-fee-bearing tickets sold 298,157 298,549 300,030
Total tickets sold 483,700 472,420 463,214
(1) Events generally represent a single performance by an artist. Fans generally represent the number of people who attended an event. Festivals are counted as one event in the quarter in which the festival begins, but number of fans is based on the days the fans were present at the festival and thus can be reported in multiple quarters. Events and fan attendance metrics are estimated each quarter.
(2) The number of fee-bearing tickets sold includes primary and secondary tickets that are sold using our Ticketmaster systems or that we issue through affiliates. This metric includes primary tickets sold during the year regardless of event timing, except for our own events where our concert promoters control ticketing which are reported as the events occur. The non-fee-bearing tickets sold includes primary tickets sold using our Ticketmaster systems, through season seat packages and our venue clients’ box offices, along with tickets sold on our ‘do it yourself’ platform.

8
Reconciliation of Non-GAAP Measures to Their Most Directly Comparable GAAP Measures (Unaudited)
Reconciliation of Adjusted Operating Income (Loss) to Free Cash Flow
($ in millions) Q4 2016 Q4 2015Adjusted operating income $ 82.9 $ 101.1Less: Cash interest expense — net (28.7) (24.8)
Cash taxes (3.0) (14.8) Maintenance capital expenditures (33.7) (34.6) Distributions to noncontrolling interests (29.8) (16.8)
Distributions from (contributions to) investments in nonconsolidated affiliates (9.0) 0.0Free cash flow $ (21.3) $ 10.1
Revenue generating capital expenditures (32.5) (15.6) Net $ (53.8) $ (5.5)
($ in millions)12 Months
201612 Months
2015Adjusted operating income $ 640.1 $ 578.1Less: Cash interest expense — net (96.7) (92.6)
Cash taxes (30.3) (44.3) Maintenance capital expenditures (92.1) (79.0) Distributions to noncontrolling interests (55.1) (30.6)
Distributions from (contributions to) investments in nonconsolidated affiliates (14.0) 3.3Free cash flow $ 351.9 $ 334.9
Revenue generating capital expenditures (94.7) (65.7) Net $ 257.2 $ 269.2
Reconciliation of Cash and Cash Equivalents to Free Cash
($ in millions)December 31,
2016Cash and cash equivalents $ 1,526.6Client cash (591.0)Deferred revenue — event-related (721.6)Accrued artist fees (35.1)Collections on behalf of others (31.2)Prepaids related to artist settlements/events 263.4 Free cash $ 411.1

9
Forward-Looking Statements, Non-GAAP Financial Measures and Reconciliations:Certain statements in this press release constitute “forward-looking statements” within the meaning of the Private Securities Litigation Reform Act of 1995. Such forward-looking statements include, but are not limited to, statements regarding the growth prospects of live events and the related strength of global consumer demand, artist touring frequencies and onsite spending by fans, both in 2017 and beyond; expected advertising growth at a historic level in 2017; Ticketmaster’s global ticketing leadership position and growth potential; the company’s anticipated growth in 2017 at levels consistent with recent years, and related plans to hold more concerts, sell more advertising and sell more tickets with increased conversion in 2017; and the expected growth in the company’s scale and breadth as it executes on its business model. Live Nation wishes to caution you that there are some known and unknown factors that could cause actual results to differ materially from any future results, performance or achievements expressed or implied by such forward-looking statements, including but not limited to operational challenges in achieving strategic objectives and executing on the company’s plans, the risk that the company’s markets do not evolve as anticipated, the potential impact of any economic slowdown and operational challenges associated with selling tickets and staging events.Live Nation refers you to the documents it files from time to time with the U.S. Securities and Exchange Commission, or SEC, specifically the section titled “Item 1A. Risk Factors” of the company’s most recent Annual Report filed on Form 10-K, and Quarterly Reports on Form 10-Q and its Current Reports on Form 8-K, which contain and identify other important factors that could cause actual results to differ materially from those contained in the company’s projections or forward-looking statements. You are cautioned not to place undue reliance on these forward-looking statements which speak only as of the date on which they are made. All subsequent written and oral forward-looking statements by or concerning Live Nation are expressly qualified in their entirety by the cautionary statements above. Live Nation does not undertake any obligation to publicly update or revise any forward-looking statements because of new information, future events or otherwise.This press release contains certain non-GAAP financial measures as defined by SEC Regulation G. A reconciliation of each such measure to its most directly comparable GAAP financial measure, together with an explanation of why management believes that these non-GAAP financial measures provide useful information to investors, is provided herein.Adjusted Operating Income (Loss), or AOI, is a non-GAAP financial measure that the company defines as operating income (loss) before acquisition expenses (including transaction costs, changes in the fair value of accrued acquisition-related contingent consideration obligations, and acquisition-related severance and compensation), depreciation and amortization (including goodwill impairment), loss (gain) on disposal of operating assets and certain stock-based compensation expense. The company uses AOI to evaluate the performance of its operating segments. The company believes that information about AOI assists investors by allowing them to evaluate changes in the operating results of the portfolio of the businesses separate from non-operational factors that affect net income, thus providing insights into both operations and the other factors that affect reported results. AOI is not calculated or presented in accordance with GAAP. A limitation of the use of AOI as a performance measure is that it does not reflect the periodic costs of certain amortizing assets used in generating revenue in the company’s business. Accordingly, AOI should be considered in addition to, and not as a substitute for, operating income (loss), net income (loss), and other measures of financial performance reported in accordance with GAAP. Furthermore, this measure may vary among other companies; thus, AOI as presented herein may not be comparable to similarly titled measures of other companies.Constant Currency is a non-GAAP financial measure. The company calculates currency impacts as the difference between current period activity translated using the current period’s currency exchange rates and the comparable prior period’s currency exchange rates. The company presents constant currency information to provide a framework for assessing how our underlying businesses performed excluding the effect of foreign currency rate fluctuations. Free Cash Flow is a non-GAAP financial measure that the company defines as AOI less maintenance capital expenditures, less net cash interest expense, less cash taxes, less net distributions to noncontrolling interest partners, plus distributions from investments in nonconsolidated affiliates net of contributions. The company uses free cash flow, among other measures, to evaluate the ability of its operations to generate cash that is available for purposes other than maintenance capital expenditures. The company believes that information about free cash flow provides investors with an important perspective on the cash available to service debt and make acquisitions. Free cash flow is not calculated or presented in accordance with GAAP. A limitation of the use of free cash flow as a performance measure is that it does not necessarily represent funds available for operations and is not necessarily a measure of the company’s ability to fund its cash needs. Accordingly, free cash flow should be considered in addition to, and not as a substitute for, operating income (loss) and other measures of financial performance reported in accordance with GAAP. Furthermore, this measure may vary among other companies; thus, free cash flow as presented herein may not be comparable to similarly titled measures of other companies.Free Cash is a non-GAAP financial measure that the company defines as cash and cash equivalents less ticketing-related client funds, less event-related deferred revenue, less accrued expenses due to artists and cash collected on behalf of others, plus event-related prepaids. The company uses free cash as a proxy for how much cash it has available to, among other things, optionally repay debt balances, make acquisitions and fund revenue generating capital expenditures. Free cash is not calculated or presented in accordance with GAAP. A limitation of the use of free cash as a performance measure is that it does not necessarily represent funds available from operations and it is not necessarily a measure of our ability to fund our cash needs. Accordingly, free cash should be considered in addition to, and not as a substitute for, cash and cash equivalents and other measures of financial performance reported in accordance with GAAP. Furthermore, this measure may vary among other companies; thus, free cash as presented herein may not be comparable to similarly titled measures of other companies.

10
Reconciliations of Non-GAAP Measures to Their Most Directly Comparable GAAP Measures (Unaudited)
Reconciliation of Adjusted Operating Income (Loss) to Operating Income (Loss)
($ in millions)
Adjustedoperatingincome(loss)
constantcurrency
Foreignexchange
impact
Adjustedoperatingincome(loss)
reported
Non-cash andstock-based
compensationexpense
Loss (gain)on disposalof operating
assets
Depreciation and
amortizationAcquisitionexpenses
Operatingincome(loss)
Three Months Ended December 31, 2016
Concerts $ (27.4) $ (0.1) $ (27.5) $ 1.2 $ 0.1 $ 36.5 $ 2.9 $ (68.2)Sponsorship &Advertising 53.9 (1.0) 52.9 0.3 — 4.4 — 48.2Ticketing 94.2 (0.2) 94.0 1.3 — 53.2 0.4 39.1Artist Nation 4.3 — 4.3 0.7 — 12.2 0.8 (9.4)Other andEliminations (5.1) — (5.1) 0.2 — 0.2 — (5.5)Corporate (35.7) — (35.7) 3.8 — 1.9 — (41.4) Total Live Nation $ 84.2 $ (1.3) $ 82.9 $ 7.5 $ 0.1 $ 108.4 $ 4.1 $ (37.2)
Three Months Ended December 31, 2015
Concerts $ (49.9) $ — $ (49.9) $ 1.6 $ — $ 41.5 $ 8.6 $ (101.6)Sponsorship &Advertising 48.4 — 48.4 0.3 — 3.3 — 44.8Ticketing 97.8 — 97.8 0.7 — 58.7 — 38.4Artist Nation 28.3 — 28.3 1.2 — 21.0 (0.1) 6.2Other andEliminations (0.4) — (0.4) — — (0.6) (0.1) 0.3Corporate (23.1) — (23.1) 4.0 0.3 1.2 — (28.6) Total Live Nation $ 101.1 $ — $ 101.1 $ 7.8 $ 0.3 $ 125.1 $ 8.4 $ (40.5)
Twelve Months Ended December 31, 2016
Concerts $ 138.4 $ 0.5 $ 138.9 $ 6.7 $ (0.1) $ 137.6 $ 6.8 $ (12.1)Sponsorship &Advertising 253.0 (5.4) 247.6 1.3 — 18.2 — 228.1Ticketing 365.9 (0.6) 365.3 3.7 0.1 185.9 1.1 174.5Artist Nation 10.5 (0.2) 10.3 3.8 — 57.1 0.6 (51.2)Other andEliminations (14.0) — (14.0) 0.2 — 0.4 0.1 (14.7)Corporate (108.0) — (108.0) 17.0 0.1 4.5 0.1 (129.7) Total Live Nation $ 645.8 $ (5.7) $ 640.1 $ 32.7 $ 0.1 $ 403.7 $ 8.7 $ 194.9
Twelve Months Ended December 31, 2015
Concerts $ 61.5 $ — $ 61.5 $ 7.0 $ 0.4 $ 146.8 $ 12.6 $ (105.3)Sponsorship &Advertising 229.9 — 229.9 1.6 — 9.9 — 218.4Ticketing 346.5 — 346.5 2.9 — 184.1 1.3 158.2Artist Nation 33.2 — 33.2 4.9 0.2 55.0 1.3 (28.2)Other andEliminations (2.2) — (2.2) — — (2.1) — (0.1)Corporate (90.9) — (90.9) 17.0 0.2 3.5 — (111.6) Total Live Nation $ 578.0 $ — $ 578.0 $ 33.4 $ 0.8 $ 397.2 $ 15.2 $ 131.4
11
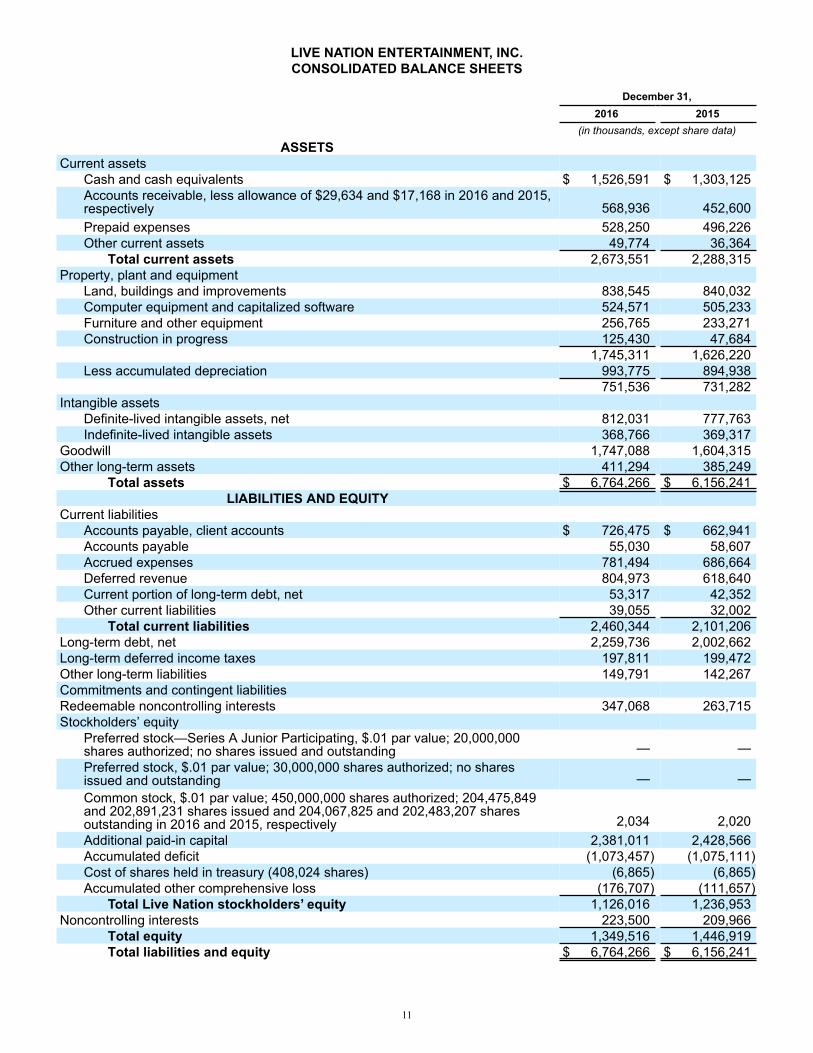
LIVE NATION ENTERTAINMENT, INC.CONSOLIDATED BALANCE SHEETS
December 31,2016 2015
(in thousands, except share data)
ASSETSCurrent assets
Cash and cash equivalents $ 1,526,591 $ 1,303,125Accounts receivable, less allowance of $29,634 and $17,168 in 2016 and 2015,respectively 568,936 452,600Prepaid expenses 528,250 496,226Other current assets 49,774 36,364
Total current assets 2,673,551 2,288,315Property, plant and equipment
Land, buildings and improvements 838,545 840,032Computer equipment and capitalized software 524,571 505,233Furniture and other equipment 256,765 233,271Construction in progress 125,430 47,684
1,745,311 1,626,220Less accumulated depreciation 993,775 894,938
751,536 731,282Intangible assets
Definite-lived intangible assets, net 812,031 777,763Indefinite-lived intangible assets 368,766 369,317
Goodwill 1,747,088 1,604,315Other long-term assets 411,294 385,249
Total assets $ 6,764,266 $ 6,156,241LIABILITIES AND EQUITY
Current liabilitiesAccounts payable, client accounts $ 726,475 $ 662,941Accounts payable 55,030 58,607Accrued expenses 781,494 686,664Deferred revenue 804,973 618,640Current portion of long-term debt, net 53,317 42,352Other current liabilities 39,055 32,002
Total current liabilities 2,460,344 2,101,206Long-term debt, net 2,259,736 2,002,662Long-term deferred income taxes 197,811 199,472Other long-term liabilities 149,791 142,267Commitments and contingent liabilitiesRedeemable noncontrolling interests 347,068 263,715Stockholders’ equity
Preferred stock—Series A Junior Participating, $.01 par value; 20,000,000shares authorized; no shares issued and outstanding — —Preferred stock, $.01 par value; 30,000,000 shares authorized; no sharesissued and outstanding — —Common stock, $.01 par value; 450,000,000 shares authorized; 204,475,849and 202,891,231 shares issued and 204,067,825 and 202,483,207 sharesoutstanding in 2016 and 2015, respectively 2,034 2,020Additional paid-in capital 2,381,011 2,428,566Accumulated deficit (1,073,457) (1,075,111)Cost of shares held in treasury (408,024 shares) (6,865) (6,865)Accumulated other comprehensive loss (176,707) (111,657)
Total Live Nation stockholders’ equity 1,126,016 1,236,953Noncontrolling interests 223,500 209,966
Total equity 1,349,516 1,446,919Total liabilities and equity $ 6,764,266 $ 6,156,241

12
LIVE NATION ENTERTAINMENT, INC.CONSOLIDATED STATEMENTS OF OPERATIONS
Year Ended December 31,
2016 2015 2014
(in thousands except share and per share data)
Revenue $ 8,354,934 $ 7,245,731 $ 6,866,964Operating expenses:
Direct operating expenses 6,082,708 5,196,473 4,919,969Selling, general and administrative expenses 1,548,450 1,411,855 1,337,316Depreciation and amortization 403,651 397,241 368,143Goodwill impairment — — 134,961Loss (gain) on disposal of operating assets 124 845 (4,494)Corporate expenses 125,061 107,945 103,905
Operating income 194,940 131,372 7,164Interest expense 106,506 102,881 106,312Loss on extinguishment of debt 14,049 — 188Interest income (2,573) (3,528) (3,606)Equity in earnings of nonconsolidated affiliates 17,802 (1,502) (4,166)Other expense, net 10,830 27,168 8,256Income (loss) before income taxes 48,326 6,353 (99,820)Income tax expense 28,029 22,122 4,630Net income (loss) 20,297 (15,769) (104,450)Net income (loss) attributable to noncontrolling interests 17,355 16,739 (13,643)
Net income (loss) attributable to common stockholders of Live Nation $ 2,942 $ (32,508) $ (90,807)
Basic and diluted net loss per common share available to commonstockholders of Live Nation $ (0.23) $ (0.33) $ (0.49)
Weighted average common shares outstanding:Basic and diluted 202,076,243 200,973,485 198,874,019
Reconciliation to net income (loss) available to common stockholdersof Live Nation:
Net income (loss) attributable to common stockholders of LiveNation $ 2,942 $ (32,508) $ (90,807)Accretion of redeemable noncontrolling interests (49,952) (33,179) (5,660)
Basic and diluted net loss available to common stockholders of LiveNation $ (47,010) $ (65,687) $ (96,467)
13
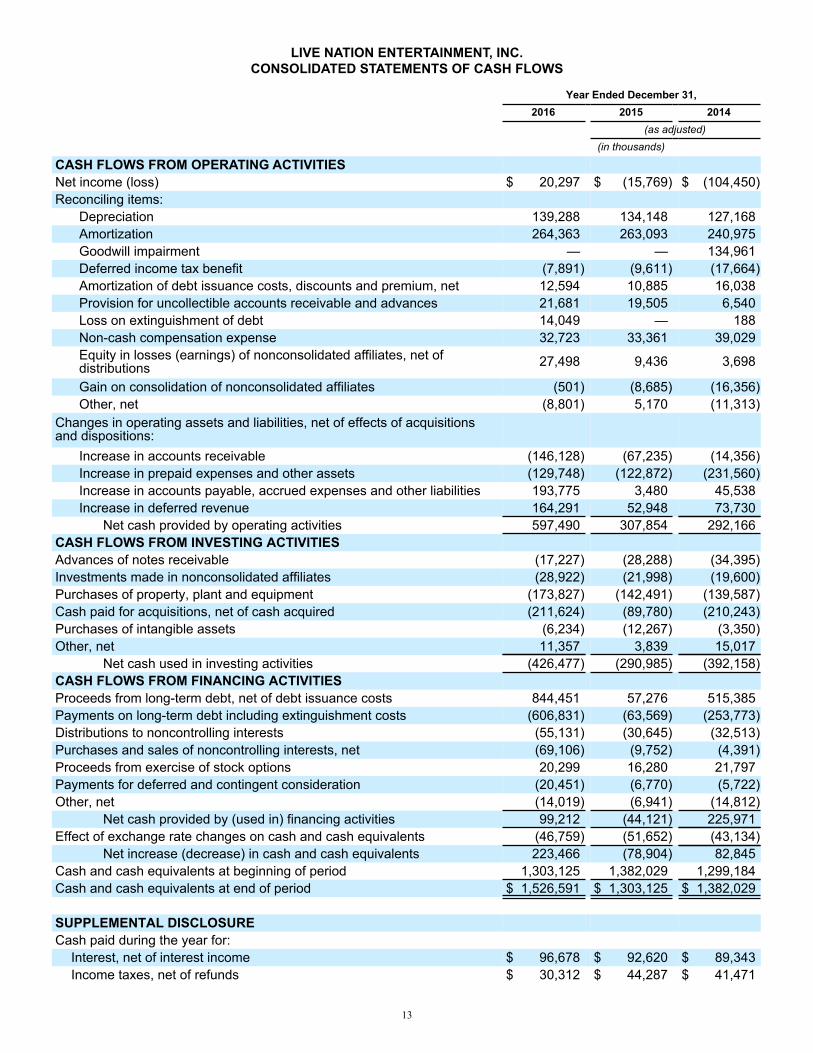
LIVE NATION ENTERTAINMENT, INC.CONSOLIDATED STATEMENTS OF CASH FLOWS
Year Ended December 31,2016 2015 2014
(as adjusted)
(in thousands)
CASH FLOWS FROM OPERATING ACTIVITIESNet income (loss) $ 20,297 $ (15,769) $ (104,450)Reconciling items:
Depreciation 139,288 134,148 127,168Amortization 264,363 263,093 240,975Goodwill impairment — — 134,961Deferred income tax benefit (7,891) (9,611) (17,664)Amortization of debt issuance costs, discounts and premium, net 12,594 10,885 16,038Provision for uncollectible accounts receivable and advances 21,681 19,505 6,540Loss on extinguishment of debt 14,049 — 188Non-cash compensation expense 32,723 33,361 39,029Equity in losses (earnings) of nonconsolidated affiliates, net of distributions 27,498 9,436 3,698
Gain on consolidation of nonconsolidated affiliates (501) (8,685) (16,356)Other, net (8,801) 5,170 (11,313)
Changes in operating assets and liabilities, net of effects of acquisitionsand dispositions:
Increase in accounts receivable (146,128) (67,235) (14,356)Increase in prepaid expenses and other assets (129,748) (122,872) (231,560)Increase in accounts payable, accrued expenses and other liabilities 193,775 3,480 45,538Increase in deferred revenue 164,291 52,948 73,730
Net cash provided by operating activities 597,490 307,854 292,166CASH FLOWS FROM INVESTING ACTIVITIESAdvances of notes receivable (17,227) (28,288) (34,395)Investments made in nonconsolidated affiliates (28,922) (21,998) (19,600)Purchases of property, plant and equipment (173,827) (142,491) (139,587)Cash paid for acquisitions, net of cash acquired (211,624) (89,780) (210,243)Purchases of intangible assets (6,234) (12,267) (3,350)Other, net 11,357 3,839 15,017
Net cash used in investing activities (426,477) (290,985) (392,158)CASH FLOWS FROM FINANCING ACTIVITIESProceeds from long-term debt, net of debt issuance costs 844,451 57,276 515,385Payments on long-term debt including extinguishment costs (606,831) (63,569) (253,773)Distributions to noncontrolling interests (55,131) (30,645) (32,513)Purchases and sales of noncontrolling interests, net (69,106) (9,752) (4,391)Proceeds from exercise of stock options 20,299 16,280 21,797Payments for deferred and contingent consideration (20,451) (6,770) (5,722)Other, net (14,019) (6,941) (14,812)
Net cash provided by (used in) financing activities 99,212 (44,121) 225,971Effect of exchange rate changes on cash and cash equivalents (46,759) (51,652) (43,134)
Net increase (decrease) in cash and cash equivalents 223,466 (78,904) 82,845Cash and cash equivalents at beginning of period 1,303,125 1,382,029 1,299,184Cash and cash equivalents at end of period $ 1,526,591 $ 1,303,125 $ 1,382,029
SUPPLEMENTAL DISCLOSURECash paid during the year for:
Interest, net of interest income $ 96,678 $ 92,620 $ 89,343Income taxes, net of refunds $ 30,312 $ 44,287 $ 41,471
Related Documents