Economic Issues and Concepts Chapter 1 LIPSEY & CHRYSTAL ECONOMICS 12e

Welcome message from author
This document is posted to help you gain knowledge. Please leave a comment to let me know what you think about it! Share it to your friends and learn new things together.
Transcript
Economic Issues and ConceptsChapter 1
LIPSEY & CHRYSTAL
ECONOMICS 12e
Learning Outcomes
• Modern market economy uses price signals to solve the complex problems involved in using resources to produce goods and services that people want.
• The choice between competing demands for scarce resources.
Learning Outcomes
• Interaction between production, employment, and consumption decisions.
• Market economy generally delivers outcomes desired by consumers.
• Governments step in when markets fail to produce results that are regarded as successful.
ECONOMIC ISSUES AND CONCEPTS
The Complexity of the Modern Economy• A market economy is self-organizing in the sense that
when individuals act independently to pursue their own self-interest, responding to prices set on open markets, they produce co-ordinated and relatively efficient economic activity.
ECONOMIC ISSUES AND CONCEPTS
Resources and Scarcity• Scarcity is a fundamental problem faced by all
economies because not enough resources - land, labour, capital, and entrepreneurship - are available to produce all the goods and services that people would like to consume.
• Scarcity makes it necessary to choose among alternative possibilities: what products will be produced and in what quantities.
• The concept of opportunity cost emphasises scarcity and choice by measuring the cost of obtaining a unit of one product in terms of the number of units of other products that could have been obtained instead.
• A production-possibility boundary shows all of the combinations of goods that can be produced by an economy whose resources are fully employed.
• Movement from one point to another on the boundary shows a shift in the amounts of goods being produced, which requires a reallocation of resources.
ECONOMIC ISSUES AND CONCEPTS
Who Makes the Choices and How• Modern economies are based on the specialization and
division of labour, which necessitate the exchange of goods and services.
• Exchange takes place in markets and is facilitated by the use of money.
• Much of economics is devoted to a study of how markets work to co-ordinate millions of individual, decentralized decisions.
• Three pure types of economy can be distinguished: traditional, command, and free market.
• In practice, all economies are mixed economies in that their economic behaviour responds to mixes of tradition, government command, and price incentives.
ECONOMIC ISSUES AND CONCEPTS
• Governments play an important part in modern mixed economies.
• They create and enforce important background institutions such as private property.
• They intervene to increase economic efficiency by correcting situations where markets do not effectively perform their co-ordinating functions.
• They also redistribute income and wealth in the interests of equity.
ECONOMIC ISSUES AND CONCEPTS
Unattainable combinations
Production possibility boundary
Quantity of public sector goods
Qu
anti
ty o
f p
riva
te s
ecto
r go
ods
A Production-Possibility Boundary
0
Attainablecombinations

Production possibility boundary
Quantity of public sector goods
c0
g00
a
Attainablecombinations
Qu
anti
ty o
f p
riva
te s
ecto
r go
ods
Unattainable combinations
A Production-Possibility Boundary

Production possibility boundary
c1 b
•d
c
c0
Attainablecombinations
Qu
anti
ty o
f p
riva
te s
ecto
r go
ods
0
a
g0 g1
Quantity of public sector goods
Unattainable combinations
A Production-Possibility Boundary
Production possibility boundary
c0
g0
c1 b
•d
c
g1
C
G
Attainablecombinations
Qu
anti
ty o
f p
riva
te s
ecto
r go
ods
Quantity of public sector goods
0
aUnattainable combinations
A Production-Possibility Boundary

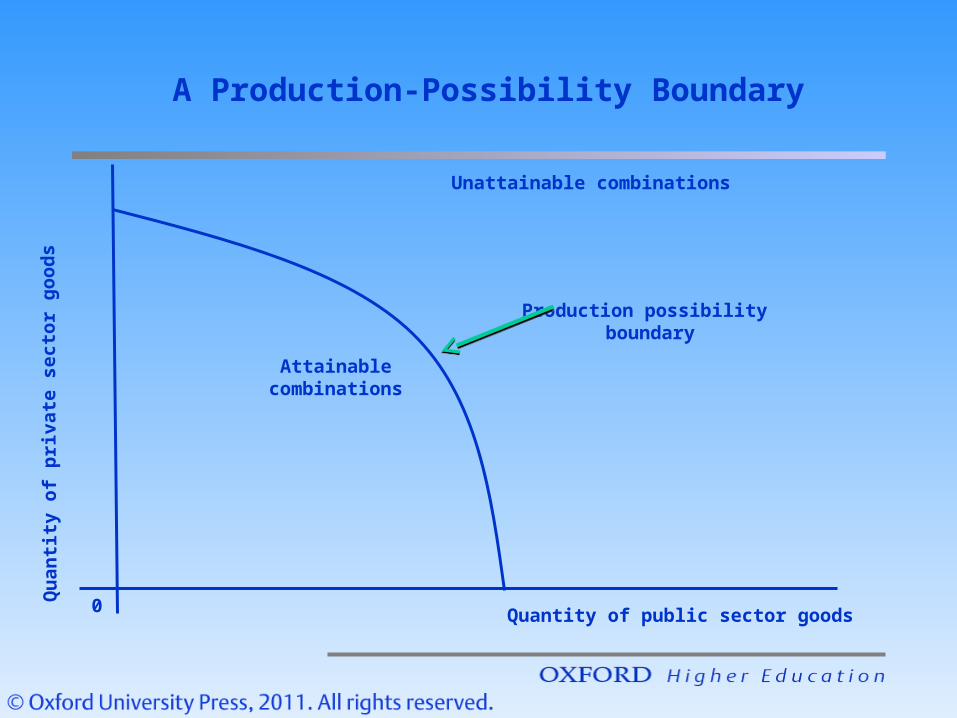
A production-possibility boundary
The quantity of public sector goods produced is measured along the horizontal axis.
The quantity of private sector goods is measured along the vertical axis.
Any point on the diagram indicates some amount of each kind of good produced.
The production-possibility boundary separates the attainable combinations, such as a, b, and c, from unattainable combinations, such as d.
Points a and b represent efficient uses of society’s resources. Point c represents either an inefficient use of resources or a failure
to use all the resources that are available.
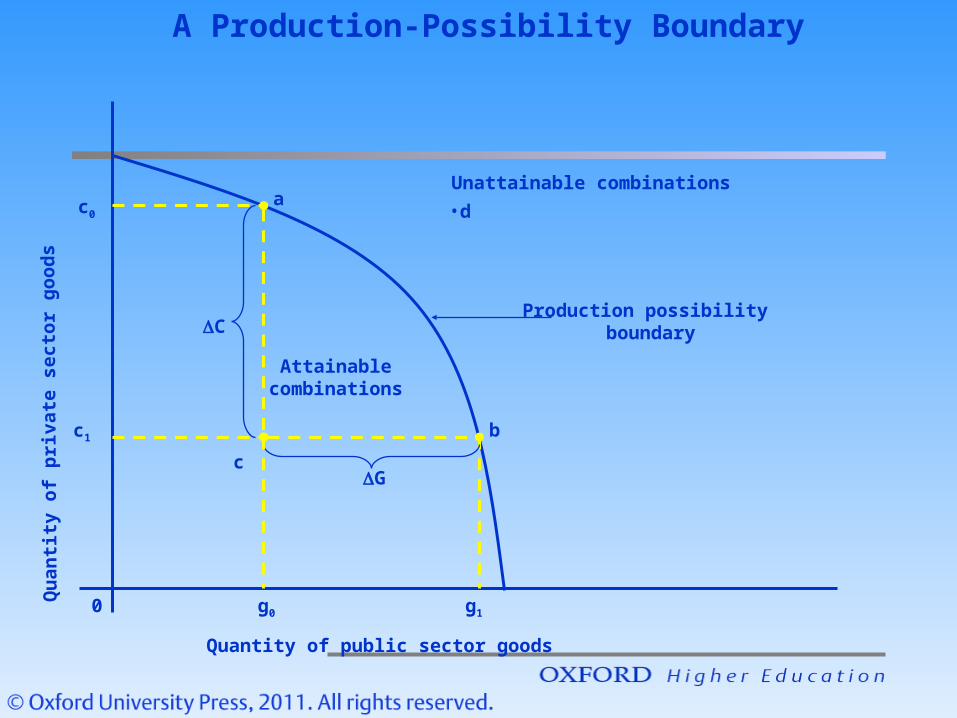
The boundary is negatively sloped because in a fully employed economy more of one good can be produced only if resources are freed by producing less of other goods.
Moving from point a (with coordinates c0 and g0) to point b (with coordinates c1 and g1) implies producing an additional amount of public sector goods, indicated by G in the figure
The opportunity cost of this increase in G is a reduction in private sector goods by the amount indicated by C.
A production-possibility boundary
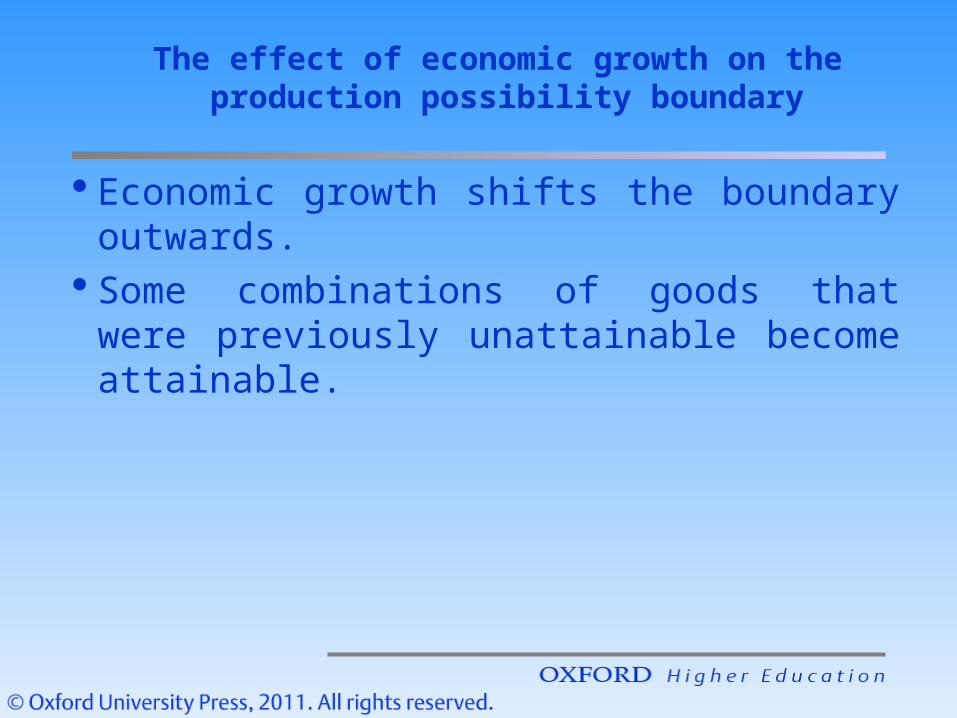
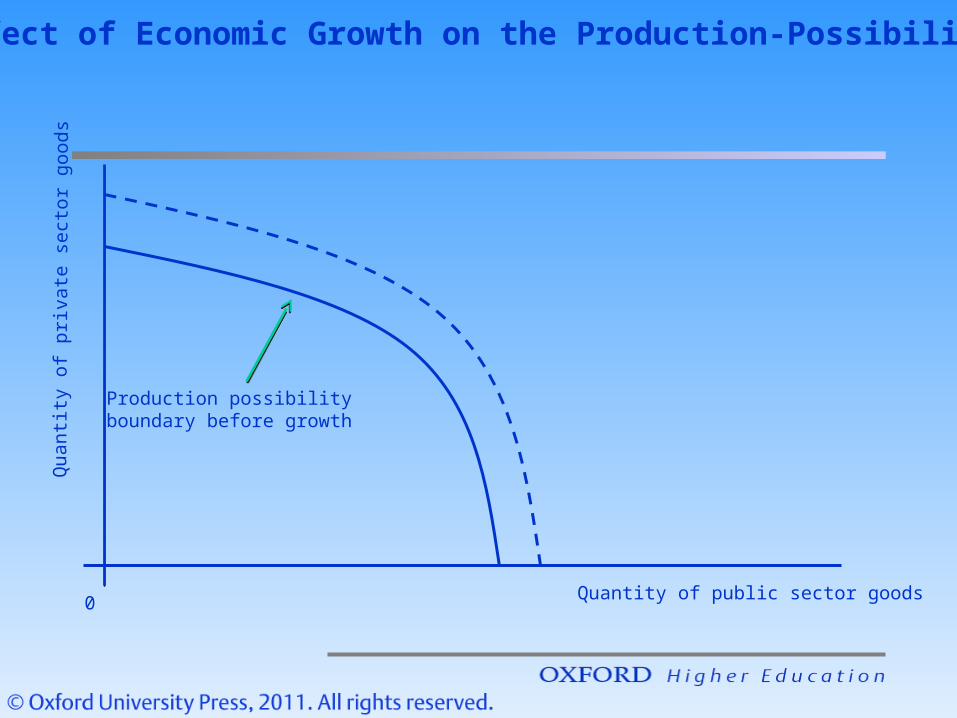
The effect of economic growth on the production possibility boundary
Economic growth shifts the boundary outwards. Some combinations of goods that were
previously unattainable become attainable.
Quantity of public sector goods
Qua
ntit
y of
pri
v ate
se c
tor
g ood
s
0
The Effect of Economic Growth on the Production-Possibility Boundary
Production possibility boundary before growth

Production possibility boundary after growth
Quantity of public sector goods
0
a
b
d
Production possibility boundary before growthQ
uant
ity
of p
riv a
te s
e cto
r g o
ods
The Effect of Economic Growth on the Production-Possibility Boundary

services
services
Factor
Goods Market
Factor Market
Individuals(consumers)
Firms(producers)
Goods and
The Circular Flow of Income and Expenditure
services
goods and Services
factor Services
services
Payments for
Factor
The Circular Flow of Income and Expenditure
Goods Market
Factor Market
Individuals(consumers)
Firms(producers)
Payments for
Goods and
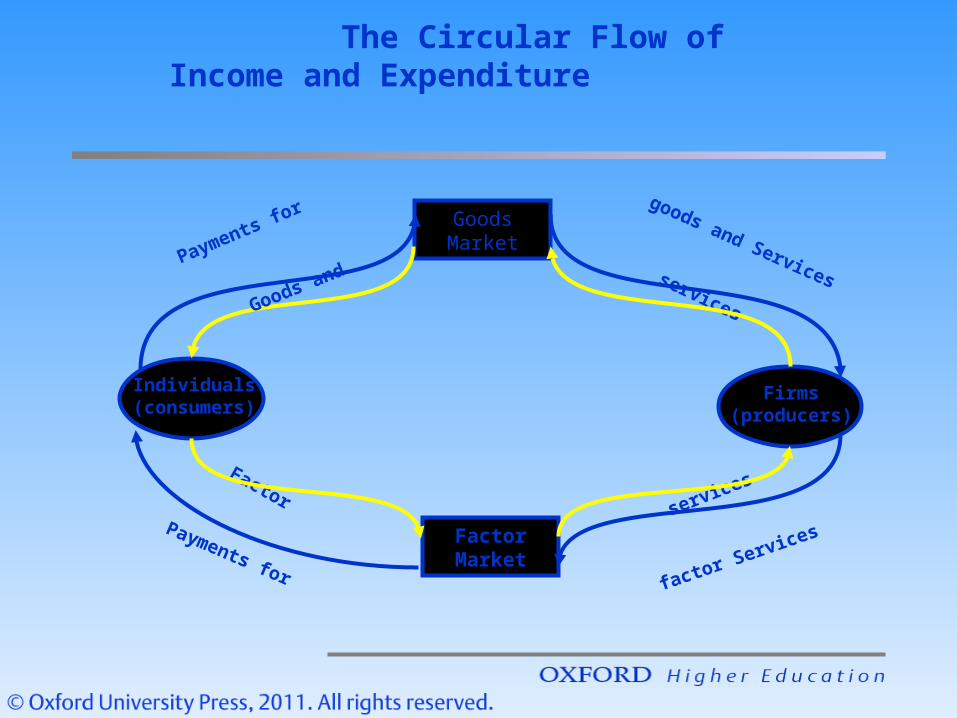
The circular flow of income and expenditure
The yellow line shows the flows of goods and services while the white line shows the payments made to purchase these.
Factor services flow from individuals who own the factors (including their own labour) through factor markets to firms who use them to make goods and services (yellow arrow).
The goods and services then flow through goods markets to those who consume them (yellow arrow).
Money payments flow through factor markets from firms to individuals (white arrow).
When individuals spend this income buying goods and services, money flows through goods markets back to producers (white arrow).

Absolute Advantage
Time spent fully producing one
or the other
Sweaters Suits
Peter
Jane
Total
either
100
400
either
or
40
or
10

Absolute Advantage
Time spent fully producing one
or the other
Time divided equally between producing the
two products
Sweaters Suits Sweaters Suits
Peter
Jane
Total
either
100
400
either
or
40
or
10
50 20
200 5
250 25
Absolute Advantage
Time spent fully producing one
or the other
Time divided equally between producing the
two products
Full Specialization
Sweaters Suits Sweaters Suits Sweaters Suits
Peter
Jane
Total
either
100
400
either
or
40
or
10
50 20 - 40
200 5 400 -
250 25 400 40

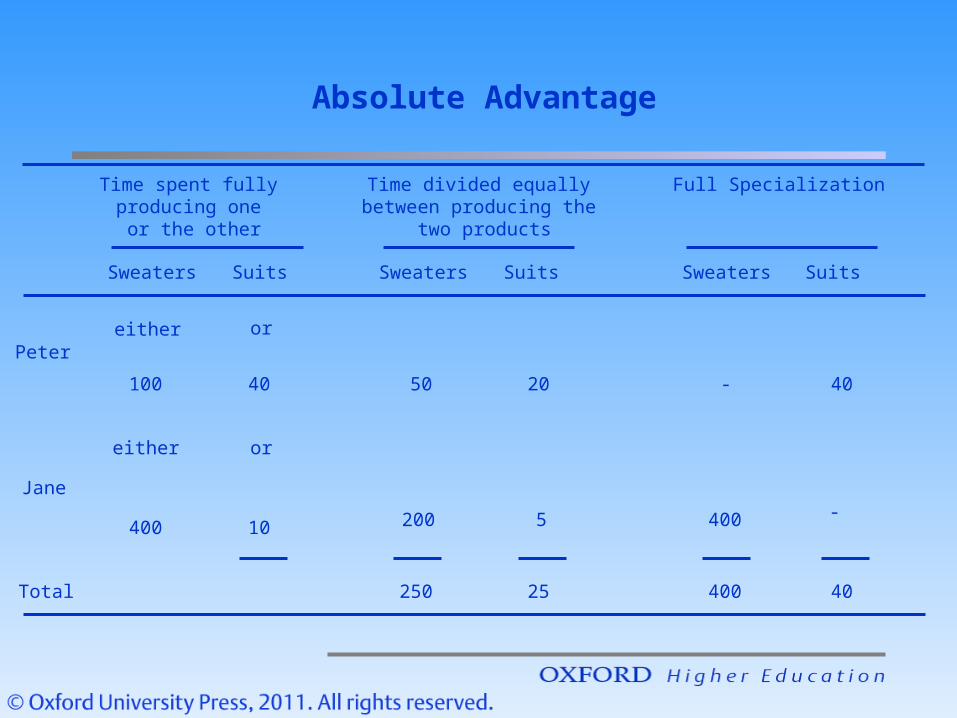
Absolute advantage
The first columns show that, working full time on his own, Peter can produce either 100 sweaters or 40 suits per year, whereas Jane can produce 400 sweaters or 10 suits.
Thus Jane has an absolute advantage in producing sweaters and Jacob has an absolute advantage in producing suits.
The second columns show the outputs if they both spend half their time producing each commodity.
The third columns show the results when Peter specializes in suits, producing 40 of them, and Jane specializes in sweaters, producing 400.
Sweaters production rises from 250 to 400, while suits production goes from 25 to 40.

Comparative Advantage
48
Time spent fully producing one
or the other
Peter
Jane
Total
either
100
400
either
or
40
or
Sweaters Suits

Comparative Advantage
48 24
44
Time spent fully producing one
or the other
Time divided equally between producing the
two products
Peter
Jane
Total
either
100
400
either
or
40
or
50 20
200
250
Sweaters Suits Sweaters Suits
Comparative Advantage
48 24 12
44 300 52
Time spent fully producing one
or the other
Time divided equally between producing the
two products
Full Specialization
Peter
Jane
Total
either
100
400
either
or
40
or
50 20 - 40
200 300
250
Sweaters Suits Sweaters Suits Sweaters Suits

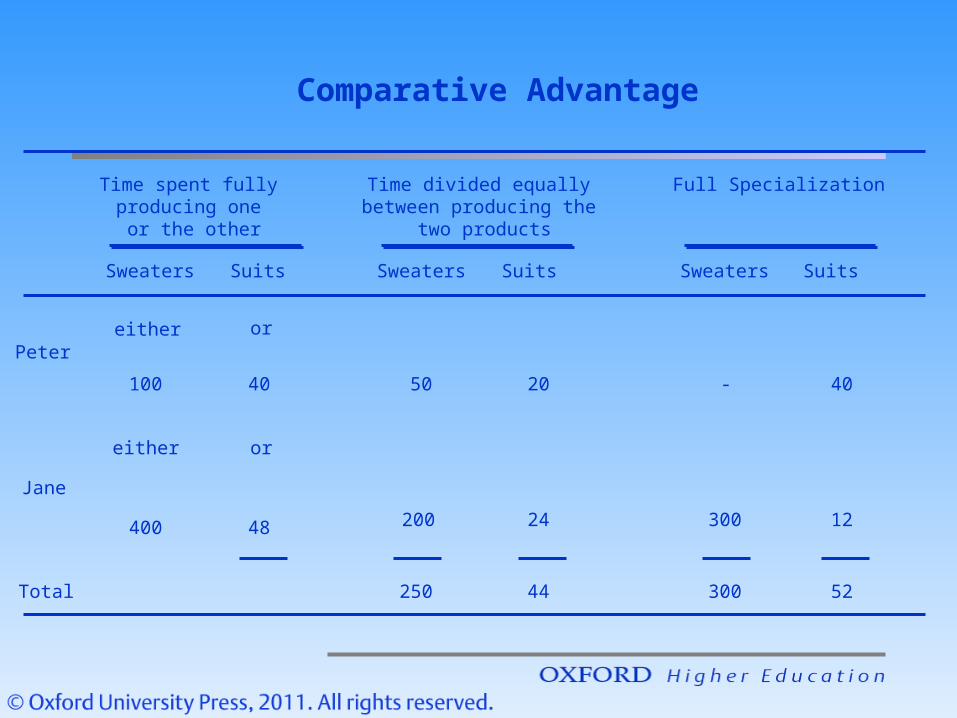
Comparative advantage
The first columns in the table show that Jane is more productive than Peter in both suits and sweaters.
Compared with Peter, Jane is 400 per cent more efficient at producing sweaters and 20 per cent more efficient at producing suits.
The second columns give the outputs when Peter and Jane each divide their time equally between the two products.
It is possible to increase the combined production of both commodities by having Jane increase her production of sweaters and Peter increase his production of suits.
The third column gives an example in which Peter specializes fully in suits production and Jane spends 25 per cent of her time on suits and 75 per cent on sweaters.
Total production of sweaters rises from 250 to 300, while total production of suits goes from 44 to 52.
• This example is only an illustration. The principles can be generalized in the following way.
Absolute efficiencies are not necessary for there to be gains from specialization.
Gains from specialization occur whenever there are differences in the margin of advantage one producer enjoys over another in various lines of production.
• Total production can always be increased when each producer becomes more specialized in the production of the commodity in which it has a comparative advantage.
Comparative advantage
Related Documents