LINKING GEOMORPHIC CHANGES TO SALMONID HABITAT ATA SCALE RELEVANT TO FISH JOSEPH M. WHEATON, a * JAMES BRASINGTON, b STEPHEN E. DARBY, c JOSEPH MERZ, d,g GREGORY B. PASTERNACK, e DAVID SEAR c and DAMIA ´ VERICAT f a Department of Watershed Sciences, Utah State University, 5210 Old Main Hill, NR 210, Logan, UT 84322-5210, USA b Institute of Geography & Earth Sciences, Aberystwyth University, Aberystwyth, SY23 3DB, UK c School of Geography, University of Southampton, Highfield, Southampton, SO17 1BJ, UK d Cramer Fish Sciences, 636 Hedburg Way, Suite 22, Oakdale, CA 95361, USA e Department of Land, Air and Water Resources, University of California at Davis, One Shields Avenue, Davis, CA 95616, USA f Hydrology Group, Forest Technology Centre of Catalonia, Crta. Sant Llorenc ¸ de Morunys, km 2 (direccio ´ Port del Comte), E-25280 Solsona (Lleida), Catalunya, Spain g Institute of Marine Sciences, University of California Santa Cruz, Santa Cruz, CA 95064, USA ABSTRACT The influence of geomorphic change on ecohydraulics has traditionally been difficult to quantify. With recent improvements in surveying technology, high-resolution, repeat and topographic surveys have become a common tool for estimating fluvial sediment budgets and documenting spatial patterns of net erosion and net deposition. Using a case study from a spawning habitat rehabilitation (SHR) project on California’s Mokelumne River, some new DEM-differencing analytical tools and ecohydraulic models were used to test whether hypotheses about pool-riffle maintenance mechanisms used in designing SHR projects were producing self-sustaining spawning habitat when subjected to competent flows. Following peak flows associated with the spring snow-melt, a total of 999.6 m 3 of erosion and 810.1 m 3 of deposition were recorded throughout the study area, with a net loss of 196.2 m 3 . Using an ecohydraulic spawning habitat suitability model to segregate the sediment budget, over 53% of the area in which gravel was placed in a 2005 SHR retained the same habitat quality characteristics, and 22% improved. The response to the flood was generically characterized by shallow deposition associated with areas of divergent flow over riffles and scour associated with areas of convergent flow in pools. Areas where habitat remained stable generally experienced only low- magnitude elevation changes, and accounted for only 19.5% of the total volumetric change. Areas where habitat quality degraded (primarily pool exit slopes) were dominated by larger magnitude erosion and made up 46% of the total volumetric change. By contrast, areas where habitat quality improved (primarily constructed riffle) accounted for 34.5% the total volumetric change, and were dominated by shallow, low magnitude deposition. The results support hypotheses about pool-riffle maintenance mechanisms used to design the rehabilitation projects, while also highlighting some simple but powerful techniques for linking ecohydraulic and geomorphic field monitoring data at a salmon-relevant spatial scale. Copyright # 2009 John Wiley & Sons, Ltd. key words: DEM of difference (DoD); ecohydraulics; fluvial geomorphology; morphological method; Mokelumne River; CA Received 25 May 2009; Revised 26 June 2009; Accepted 9 July 2009 INTRODUCTION Repeat topographic surveys are useful for monitoring geomorphic changes in rivers and calculating morphological sediment budgets (Brasington et al., 2000; Brewer and Passmore, 2002). With improvements in surveying technology, the acquisition of topographic data is now cheaper, easier and becoming more common (Downs and Kondolf, 2002). Moreover, topographic data can now readily be acquired at spatial resolutions equal to or smaller than the size of fish themselves, and can therefore be used to characterize their physical habitat (i.e. degree of suitability of local depth, velocity, substrate and cover, in a stream to support a particular biological activity) at an ecologically relevant scale. RIVER RESEARCH AND APPLICATIONS River. Res. Applic. (2009) Published online in Wiley InterScience (www.interscience.wiley.com) DOI: 10.1002/rra.1305 *Correspondence to: Joseph M. Wheaton, Department of Watershed Sciences, Utah State University, 5210 Old Main Hill, NR 210, Logan, UT 84322-5210, USA. E-mail: [email protected] Copyright # 2009 John Wiley & Sons, Ltd.

Welcome message from author
This document is posted to help you gain knowledge. Please leave a comment to let me know what you think about it! Share it to your friends and learn new things together.
Transcript

LINKING GEOMORPHIC CHANGES TO SALMONID HABITATAT A SCALE RELEVANT TO FISH
JOSEPH M. WHEATON,a* JAMES BRASINGTON,b STEPHEN E. DARBY,c JOSEPH MERZ,d,g
GREGORY B. PASTERNACK,e DAVID SEARc and DAMIA VERICATf
a Department of Watershed Sciences, Utah State University, 5210 Old Main Hill, NR 210, Logan, UT 84322-5210, USAb Institute of Geography & Earth Sciences, Aberystwyth University, Aberystwyth, SY23 3DB, UK
c School of Geography, University of Southampton, Highfield, Southampton, SO17 1BJ, UKd Cramer Fish Sciences, 636 Hedburg Way, Suite 22, Oakdale, CA 95361, USA
e Department of Land, Air and Water Resources, University of California at Davis, One Shields Avenue, Davis, CA 95616, USAf Hydrology Group, Forest Technology Centre of Catalonia, Crta. Sant Llorenc de Morunys, km 2 (direccio Port del Comte), E-25280 Solsona
(Lleida), Catalunya, Spaing Institute of Marine Sciences, University of California Santa Cruz, Santa Cruz, CA 95064, USA
ABSTRACT
The influence of geomorphic change on ecohydraulics has traditionally been difficult to quantify. With recent improvements insurveying technology, high-resolution, repeat and topographic surveys have become a common tool for estimating fluvialsediment budgets and documenting spatial patterns of net erosion and net deposition. Using a case study from a spawning habitatrehabilitation (SHR) project on California’s Mokelumne River, some new DEM-differencing analytical tools and ecohydraulicmodels were used to test whether hypotheses about pool-riffle maintenance mechanisms used in designing SHR projects wereproducing self-sustaining spawning habitat when subjected to competent flows. Following peak flows associated with the springsnow-melt, a total of 999.6m3 of erosion and 810.1m3 of deposition were recorded throughout the study area, with a net loss of196.2m3. Using an ecohydraulic spawning habitat suitability model to segregate the sediment budget, over 53% of the area inwhich gravel was placed in a 2005 SHR retained the same habitat quality characteristics, and 22% improved. The response to theflood was generically characterized by shallow deposition associated with areas of divergent flow over riffles and scourassociated with areas of convergent flow in pools. Areas where habitat remained stable generally experienced only low-magnitude elevation changes, and accounted for only 19.5% of the total volumetric change. Areas where habitat qualitydegraded (primarily pool exit slopes) were dominated by larger magnitude erosion and made up 46% of the total volumetricchange. By contrast, areas where habitat quality improved (primarily constructed riffle) accounted for 34.5% the total volumetricchange, and were dominated by shallow, low magnitude deposition. The results support hypotheses about pool-rifflemaintenance mechanisms used to design the rehabilitation projects, while also highlighting some simple but powerfultechniques for linking ecohydraulic and geomorphic field monitoring data at a salmon-relevant spatial scale. Copyright #2009 John Wiley & Sons, Ltd.
key words: DEM of difference (DoD); ecohydraulics; fluvial geomorphology; morphological method; Mokelumne River; CA
Received 25 May 2009; Revised 26 June 2009; Accepted 9 July 2009
INTRODUCTION
Repeat topographic surveys are useful for monitoring geomorphic changes in rivers and calculating morphologicalsediment budgets (Brasington et al., 2000; Brewer and Passmore, 2002). With improvements in surveyingtechnology, the acquisition of topographic data is now cheaper, easier and becoming more common (Downs andKondolf, 2002). Moreover, topographic data can now readily be acquired at spatial resolutions equal to or smallerthan the size of fish themselves, and can therefore be used to characterize their physical habitat (i.e. degree ofsuitability of local depth, velocity, substrate and cover, in a stream to support a particular biological activity) at anecologically relevant scale.
RIVER RESEARCH AND APPLICATIONS
River. Res. Applic. (2009)
Published online in Wiley InterScience(www.interscience.wiley.com) DOI: 10.1002/rra.1305
*Correspondence to: Joseph M. Wheaton, Department of Watershed Sciences, Utah State University, 5210 Old Main Hill, NR 210, Logan, UT84322-5210, USA. E-mail: [email protected]
Copyright # 2009 John Wiley & Sons, Ltd.
As a discipline, ecohydraulics has typically only relied on topographic datasets as boundary conditions forhydraulic and ecohydraulic models. Although temporal physical habitat dynamics are frequently explored byconsidering how different flows (i.e. hydrologic dynamics) influence habitat quality and availability, thetopographic boundary is almost always treated as static. Repeat topographic surveys provide an opportunity to lookat how physical habitat changes in response to geomorphic dynamics and river management activities. With thisricher topographic data, demand is increasing for robust and useful methods of analysing and interpreting digitalelevation model (DEM) of differences (DoDs) calculated from repeat topographic surveys (Golet et al., 2003; Laneand Chandler, 2003). Assuming actual geomorphic changes can be distinguished from noise (i.e. minimum levelsof detection can be defined), the challenge of making meaningful interpretations of the identified changes remains(Brasington et al., 2003; Lane et al., 2003). A wealth of information on the kinematics and mechanisms ofgeomorphic change is recorded in DoDs. As the resulting morphologies are a large part of defining the template forphysical habitat conditions for aquatic and riparian species (Brierley and Fryirs, 2000), it follows that DoDs mightalso be useful for considering the ecohydraulic ramifications of net geomorphic change.To explore this logical conjecture more thoroughly, we consider the example of spawning salmonids. The types
of abiotic factors that define good conditions for spawning and incubation are well understood (Kondolf andWolman, 1993; Geist and Dauble, 1998; Montgomery et al., 1999; Greig et al., 2007). Riverine salmonids typicallyspawn in cool, clear and well-oxygenated streams. The female constructs a nest or ‘redd’ in habitats typicallycomprised of clean gravels (i.e. substrate with a low percentage of fine grained< 2mm material), with appropriatedepths and velocities, and adequate inter-gravel flow for embryo survival. Spawning activity is often in closeproximity to structural cover (e.g. pools, large woody debris, boulder clusters and overhanging vegetation) andhydrodynamic shear zones that provide important refuge from predation and resting zones for energy conservation.(Wheaton et al., 2004c). Whether in the context of a natural non-regulated river, a heavily regulated river or arestoration project, uncertainty exists regarding the ramifications of fluvial erosion and deposition on the quality ofspawning habitat (Merz et al., 2006) and the likelihood of embryo survival (Lisle and Lewis, 1992). These issuesare becoming increasingly prevalent as more money is spent on river restoration efforts (Bernhardt et al., 2005),more attention is given to restoration monitoring (Downs and Kondolf, 2002) and expectations grow as to whatmonitoring can say about the benefits (if any) that restoration efforts provide (Wheaton, 2008).The purpose of this paper is to explicitly explore the linkages between geomorphic change and ecohydraulic
habitat at a scale relevant to fish. For example, we would like to know how high-flow dam releases (defined here asgreater than bankfull flows) influence physical habitat quality (as estimated from ecohydraulic habitat models) forsalmonids at restoration sites. More specifically, wewould like to knowwhether design hypotheses about pool-rifflemaintenance mechanisms (e.g. Wheaton et al., 2004a,c; Elkins et al., 2007) that are being used in designingspawning habitat rehabilitation (SHR) projects are producing predicted outcomes when subjected to competentflows. These questions are addressed with analyses of repeat topographic surveys that record changes following awet winter and large dam releases to a SHR site on the heavily regulated Mokelumne River in California. The casestudy we use relies on some analytical DoD tools developed by Wheaton et al. (in press) and Wheaton (2008),which account for propagated reliability uncertainties in the original DEMs, and then allow a flexible spatialsegregation of the DoD sediment budget through the use of masks. Determining the ecohydraulic implications ofgeomorphic change is a fundamental scientific question, which has not typically been investigated at a scalemeaningful to fish or in a quantitative fashion.
DoD UNCERTAINTY AND MASKING METHODS
Sediment budgets derived from high resolution (i.e. finer than 2m) DoDs are known to provide useful insight intogross geomorphic changes at the reach-scale (Lane et al., 1994;McLean and Church, 1999). However, they can alsobe used to evaluate more detailed mechanistic inferences of finer scale processes occurring at the resolution of theDoD. To better exploit DoDs, a robust method to account for reliability uncertainties in the DoD is required. Thosereliability uncertainties include a lack of measurements, inexactness of measurements, poor spatial coverage and/orinterpolation errors. This is particularly important in fluvial environments, because a large portion of the elevationchanges of interest can be of relatively low magnitudes (i.e.< 0.25m). These changes are often similar to the
Copyright # 2009 John Wiley & Sons, Ltd. River. Res. Applic. (2009)
DOI: 10.1002/rra
J. M. WHEATON ET AL.
magnitude of uncertainty in the elevation data itself. The uncertainty in DoD-calculated net elevation change ispropagated from the uncertainties in the original DEM representations and the original survey data (Lane et al.,1994). This is fundamentally a change detection problem, and the most typical way of addressing this is through theestimation of a minimum level of detection (minLoD), below which calculated changes cannot be reliablydistinguished from noise (i.e. changes due to uncertainties in elevation model). A single minLoD value tends to beestimated for an entire DoD and is assumed not to vary in space (e.g. Brasington et al., 2000; Fuller et al., 2003).Unfortunately, such an approach proves overly conservative in many areas (e.g. floodplains experiencing shallowdeposition) and overly liberal in other areas (e.g. steep banks experiencing erosion magnitudes similar to the bankheights).
Our technique used in this paper defines a minLoD on a cell-by-cell basis in the DoD, reflecting the spatialvariability of DoD uncertainty. The method is reviewed briefly here and is described fully in Wheaton et al.(in press) and Wheaton (2008). A fuzzy inference system (FIS) is employed to consider how the variouscomponents contributing to DEM uncertainty (e.g. point density, slope and instrument point quality) combine toproduce elevation uncertainties in individual DEMs. It is important to emphasize that this FIS is applied on a cell-by-cell basis at the resolution of the DEM (typically 25–100 cm). This is arguably the habitat scale experienced byfish. Those spatially variable uncertainties are propagated into the DoD using standard error propagation, and aT-score is then used to represent those uncertainties probabilistically (e.g. Brasington et al., 2003; Lane et al.,2003). This enables minLoD thresholding on the basis of a user-defined confidence interval. Probability estimatescan be improved upon using Bayes Theorem and a movingwindow analysis of the spatial coherence of individualerosion and deposition units. Essentially, the probability of change being real for cells with small magnitudechanges, which might otherwise be beneath the estimated minLoD, are reassessed based on whether or not the smallmagnitude change is consistent with the trend of change in surrounding cells. For example, a cell that exhibits smallamounts of erosion, surrounded entirely by cells that are also erosional would be assigned a higher probability ofbeing real, whereas if the same cell was surrounded by entirely depositional cells it would be assigned a lowerprobability of being real. Once both analyses are performed, a spatially variable map of the probability of DoDchanges being real is used to threshold the DoD by a user-defined confidence interval (95% in this paper). Thosecells with probability above the confidence interval are then included in the volumetric sediment budget estimatefrom the DoD.
Once the best estimate of uncertainty is acquired and a thresholded DoD calculated, a technique is needed tosegregate the budget spatially to interpret what the changes mean. The estimate of surface representationuncertainty is based on the quantification of a reliability uncertainty, which culminates from a combination ofmeasurement and interpolation errors. The more interesting question of what the changes we believe to be realactually mean is an example of a structural uncertainty. One easily overlooked attribute of a DoD is the explicitinformation about spatial patterns of geomorphic change inherent in the maps themselves. Whereas any individualDEM only represents a snap shot in time of the Earth’s surface, a DoD actually says something about the spatial andhistorical contingencies (Phillips, 2001) that have coalesced to produce the more recent morphology. Wheaton(2008) highlighted three types of DoD masking that can be used for budget segregation:
1. Standard classification (e.g. morphological units, facies, habitat types, hydraulic, etc.) of either the newer(typical) or older DEM.
2. Classification of difference (CoD, unique categories by differencing standard classifications of the older andnewer DEMs each with n categories; always end up with n2 categories).
3. Geomorphic interpretation of DoD (expert-based classification of DoD itself in conjunction with field evidence,aerial photos and other layers).
In the context of GIS, a mask is a sub-area of an entire dataset that will be included in an analysis (Jones, 1997). Ifthe mask is defined with vector data it is a polygon, whereas if it is defined as a raster it is the collection of cells withthe same integer value within that raster. For the purposes of this paper, the masks that will be used should have aspecific geomorphic meaning—either relating to a specific style of change, an inferred geomorphic process or aparticular morphological characteristic. The DoD data that fall within each mask are used to calculate areal andvolumetric elevation change distributions (ECDs) and summary statistics. To segregate the DoD analysis by
Copyright # 2009 John Wiley & Sons, Ltd. River. Res. Applic. (2009)
DOI: 10.1002/rra
LINKING GEOMORPHIC CHANGES TO SALMONID HABITAT
multiple masks is a simple matter of aggregating the discrete masks (polygons or unique integer values within agrid) into a single mutually exclusive classification.The geomorphic interpretation is an obvious motivation for the budget segregation, but there may be
ecohydraulic interpretations as well. There are at least three types of ecologically relevant masks that might be usedto explore the implications of geomorphic changes to salmonids. The first is a physical habitat classification mask(e.g. Newson et al., 1998; Raven et al., 1998; Brierley and Fryirs, 2000), and this can be applied either as a standardclassification or a CoD (see bullets above for distinction). Secondly, a mask, constructed of redd surveys could beused to assess flood impact during the incubation period (as in this paper) or if surveys were detailed enough, howmuch sediment was moved by the red construction process itself (e.g. Gottesfeld et al., 2004). Finally, ecohydraulichabitat suitability models (e.g. Leclerc et al., 1995) might be used as masks to draw correlations between the qualityof habitat and the types of change it experiences (i.e. a standard classification), or to assess how morphologicalchanges relate to habitat quality changes (i.e. CoD). In a GIS, the masks (areas or polygons) are created in a similarfashion by the user with manual or automated classification regardless of the classification type (e.g. geomorphic orecological).
MOKELUMNE STUDY SITE
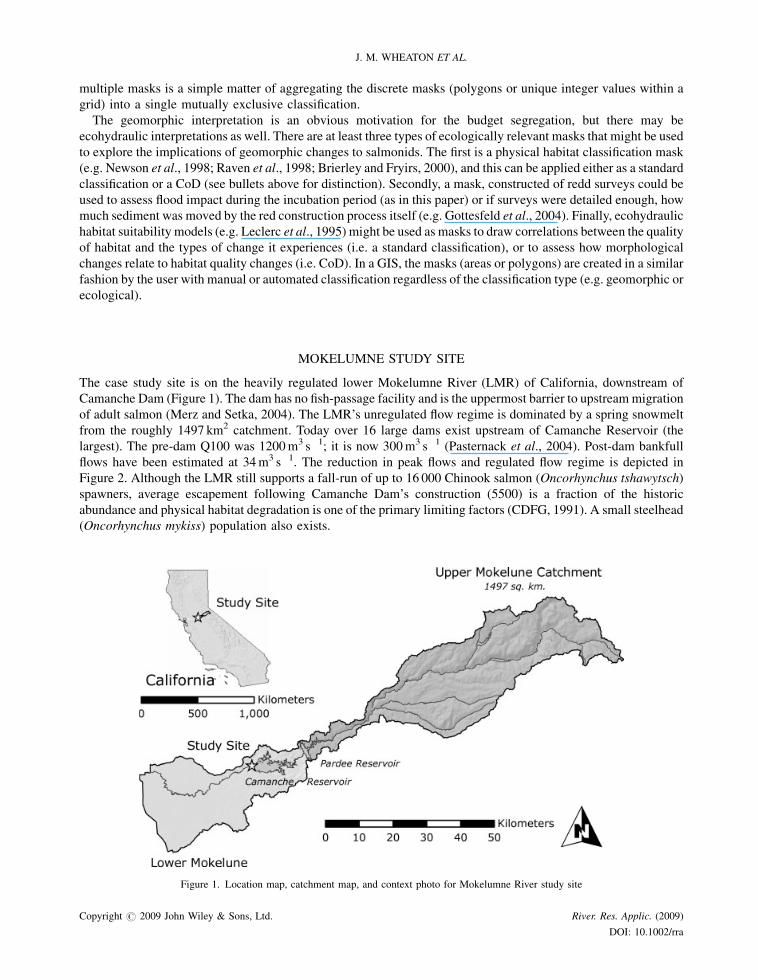
The case study site is on the heavily regulated lower Mokelumne River (LMR) of California, downstream ofCamanche Dam (Figure 1). The dam has no fish-passage facility and is the uppermost barrier to upstreammigrationof adult salmon (Merz and Setka, 2004). The LMR’s unregulated flow regime is dominated by a spring snowmeltfrom the roughly 1497 km2 catchment. Today over 16 large dams exist upstream of Camanche Reservoir (thelargest). The pre-dam Q100 was 1200m3 s!1; it is now 300m3 s!1 (Pasternack et al., 2004). Post-dam bankfullflows have been estimated at 34m3 s!1. The reduction in peak flows and regulated flow regime is depicted inFigure 2. Although the LMR still supports a fall-run of up to 16 000 Chinook salmon (Oncorhynchus tshawytsch)spawners, average escapement following Camanche Dam’s construction (5500) is a fraction of the historicabundance and physical habitat degradation is one of the primary limiting factors (CDFG, 1991). A small steelhead(Oncorhynchus mykiss) population also exists.
Figure 1. Location map, catchment map, and context photo for Mokelumne River study site
Copyright # 2009 John Wiley & Sons, Ltd. River. Res. Applic. (2009)
DOI: 10.1002/rra
J. M. WHEATON ET AL.
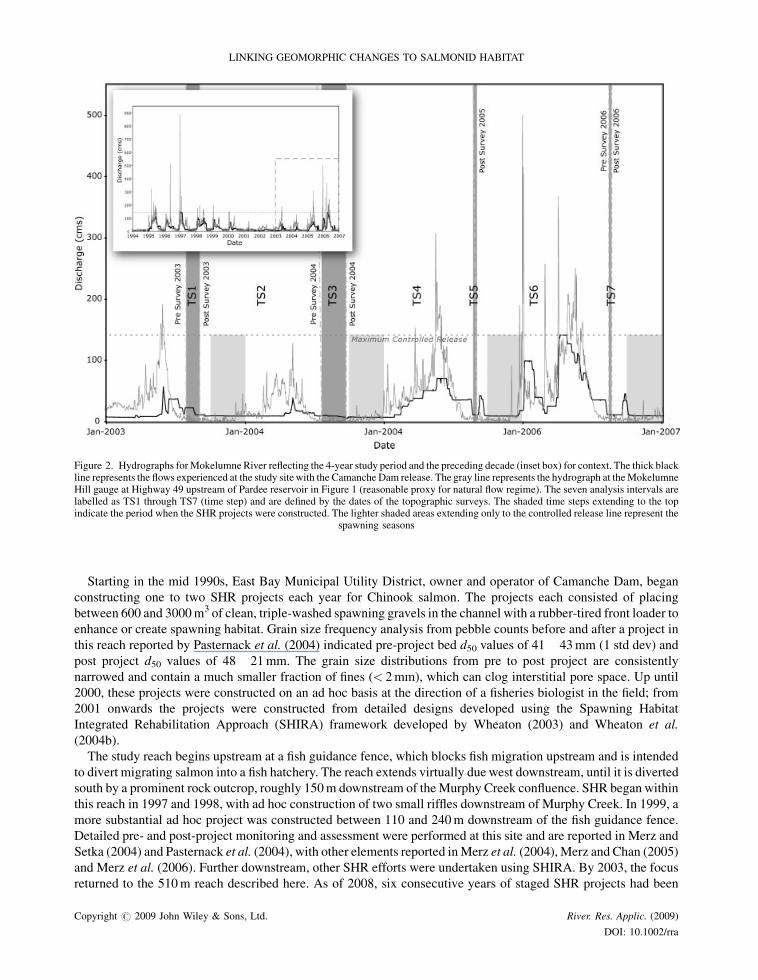
Starting in the mid 1990s, East Bay Municipal Utility District, owner and operator of Camanche Dam, beganconstructing one to two SHR projects each year for Chinook salmon. The projects each consisted of placingbetween 600 and 3000m3 of clean, triple-washed spawning gravels in the channel with a rubber-tired front loader toenhance or create spawning habitat. Grain size frequency analysis from pebble counts before and after a project inthis reach reported by Pasternack et al. (2004) indicated pre-project bed d50 values of 41" 43mm (1 std dev) andpost project d50 values of 48" 21mm. The grain size distributions from pre to post project are consistentlynarrowed and contain a much smaller fraction of fines (< 2mm), which can clog interstitial pore space. Up until2000, these projects were constructed on an ad hoc basis at the direction of a fisheries biologist in the field; from2001 onwards the projects were constructed from detailed designs developed using the Spawning HabitatIntegrated Rehabilitation Approach (SHIRA) framework developed by Wheaton (2003) and Wheaton et al.(2004b).
The study reach begins upstream at a fish guidance fence, which blocks fish migration upstream and is intendedto divert migrating salmon into a fish hatchery. The reach extends virtually due west downstream, until it is divertedsouth by a prominent rock outcrop, roughly 150m downstream of theMurphy Creek confluence. SHR began withinthis reach in 1997 and 1998, with ad hoc construction of two small riffles downstream of Murphy Creek. In 1999, amore substantial ad hoc project was constructed between 110 and 240m downstream of the fish guidance fence.Detailed pre- and post-project monitoring and assessment were performed at this site and are reported in Merz andSetka (2004) and Pasternack et al. (2004), with other elements reported inMerz et al. (2004), Merz and Chan (2005)and Merz et al. (2006). Further downstream, other SHR efforts were undertaken using SHIRA. By 2003, the focusreturned to the 510m reach described here. As of 2008, six consecutive years of staged SHR projects had been
Figure 2. Hydrographs forMokelumne River reflecting the 4-year study period and the preceding decade (inset box) for context. The thick blackline represents the flows experienced at the study sitewith the Camanche Dam release. The gray line represents the hydrograph at theMokelumneHill gauge at Highway 49 upstream of Pardee reservoir in Figure 1 (reasonable proxy for natural flow regime). The seven analysis intervals arelabelled as TS1 through TS7 (time step) and are defined by the dates of the topographic surveys. The shaded time steps extending to the topindicate the period when the SHR projects were constructed. The lighter shaded areas extending only to the controlled release line represent the
spawning seasons
Copyright # 2009 John Wiley & Sons, Ltd. River. Res. Applic. (2009)
DOI: 10.1002/rra
LINKING GEOMORPHIC CHANGES TO SALMONID HABITAT

constructed in the reach, all relying on the Elkins et al. (2007) design concept of slope creation. Sawyer et al. (2009)used DoDs between design and as-built surfaces to evaluate the ability of SHR project construction methods toachieve detailed ecohydraulic design specifications.In 2005, the SHR project that was built aimed to continue rehabilitating the longitudinal profile of the river
through slope creation, but it also included a set of site-specific goals. A technical report detailing all phases of the2005 project is available upon request to co-author Pasternack. The 2005 site was located at an abnormally deep(i.e.> 3m) pool in the river that was created by historic instream gravel mining. This large artificial hole acted as asink for sediment in transport and prevented gravel eroded from upstream SHR projects from migratingdownstream and building or expanding other bars. Such holes are common in the rivers draining to the CentralValley of California and pose the problem of whether to expend resources filling them in or ignore them and focuson riffles where per-unit gravel placement yields more immediate high-quality habitat. In this case, it was decidedthat the long-term geomorphic benefits of filling in the hole and creating a suite of geomorphic units appropriate tothe modern hydrologic and geomorphic regimes outweighed the cost in terms of achieving a low amount of highquality habitat per unit of gravel added (a project evaluation metric termed ‘gravel efficiency’). Following standardpractice on the Mokelumne, annual projects were designed to accommodate the available gravel and thus it took2 years (2005 and 2006) to completely fill in the hole and establish the new suite of geomorphic units.
METHODS APPLIED AT MOKELUMNE
High resolution topographic surveys (i.e.> 1ptm!2) were conducted with Leica TCRA 1205, Leica TPS 1200 andTopcon GTS-802A total stations each year prior to the projects being constructed and immediately following theirconstruction as shown in Figure 2. Each of these surveys was analysed in Wheaton (2008), but here just 1 year isreported to illustrate the utility of the ecohydraulic masking methods. Of the 5 years of repeat topographic surveys,the 2005–2006 season is the best possible test of the response of the SHR projects to the maximummagnitude eventthat the study reach is capable of experiencing due to flow regulation. Specifically, looking at changes in 2005–2006should illuminate the fate of 2017m3 of gravel placed as part of a 2005 SHR project to create and improve spawninghabitat. Camanche Dam cannot control a release greater than 141.6m3 s!1 and uncontrolled flows bypass therehabilitated reach via an emergency spillway that enters downstream of the site. As shown in Figure 2, the141.6m3 s!1 release was maintained for over a week as part of the spring snowmelt in 2006. Although smallercontrolled ‘pulse flow’ releases were released in 2003 and 2005, these 2006 flows were the first geomorphic test in ahigh-flow setting of the Mokelumne SHIRA projects.DEMs of 25-cm resolution from after the 2005 SHR project placement (Figure 3A) and prior to the 2006 SHR
project placement (Figure 3B) were constructed by building TINs from the raw survey data and converting the TINsto rasters using ESRI’s ArcGIS 3DAnalyst. The DEMs were differenced to create a DoD (shown in Figure 3D) anda spatially variable uncertainty analysis was applied as described in ‘DoD Uncertainty and Masking Methods’section and thresholded at a 95% confidence interval (i.e. only changes that have a 95% probability of being real areincluded in the budget). Areal and volumetric ECDs were derived from this DoD (Figures 3D and E, respectively).This DoD and its ECD were subsequently segregated, as described in ‘DoD Uncertainty and Masking Methods’section, using three different masks to aid in interpreting the ecohydraulic significance of the geomorphic changesto spawning salmonids:
1. A simple geomorphic interpretation of the DoD.2. A standard classification of physical habitat at the geomorphic unit (i.e. bar) scale.3. A classification of difference between before and after ecohydraulic model estimates of spawning habitat
quality.
All these analyses were processed using a DoD uncertainty analysis program in Matlab produced by Wheatonet al. (in press; note that software is available to download with paper). For the third mask, an estimate of habitatquality was necessary and the methods used are described in the next subsection.
Copyright # 2009 John Wiley & Sons, Ltd. River. Res. Applic. (2009)
DOI: 10.1002/rra
J. M. WHEATON ET AL.
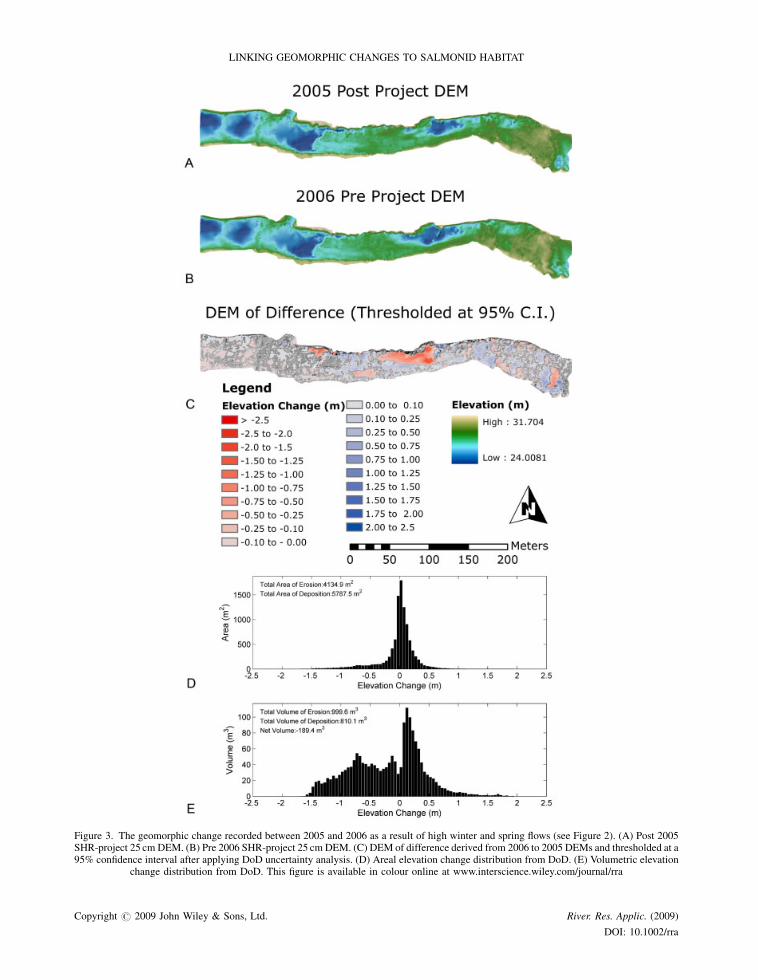
Figure 3. The geomorphic change recorded between 2005 and 2006 as a result of high winter and spring flows (see Figure 2). (A) Post 2005SHR-project 25 cm DEM. (B) Pre 2006 SHR-project 25 cm DEM. (C) DEM of difference derived from 2006 to 2005 DEMs and thresholded at a95% confidence interval after applying DoD uncertainty analysis. (D) Areal elevation change distribution from DoD. (E) Volumetric elevation
change distribution from DoD. This figure is available in colour online at www.interscience.wiley.com/journal/rra
Copyright # 2009 John Wiley & Sons, Ltd. River. Res. Applic. (2009)
DOI: 10.1002/rra
LINKING GEOMORPHIC CHANGES TO SALMONID HABITAT

Assessing habitat quality
To address the question of spawning habitat quality, 2D ecohydraulic habitat suitability simulations at typicalspawning flows (10m3 s!1) were modelled using pre- and post-high-flow release morphologies. The habitatsuitability model used is based on depth and velocity habitat suitability curves for fall-run Chinook from the LMRas reported in Elkins et al. (2007) and Wheaton (2003). Substrate is not included in the model because grain sizedistributions of the placed gravel in the study reach are optimal for spawning and do not limit habitat quality or helpdifferentiate it (Pasternack et al., 2004). The only exceptions at this site are the pools, which can have sub-optimalgrain size distributions, but they are already segregated out as poor or non-spawning habitat by the hydraulic habitatsuitability criteria alone. In this study, each of those curves was modelled using a single fifth-order polynomialequation to calculate suitability based on velocity or depth separately. The two univariate suitability measures arethen combined using a weighted sum (equal weighting of 0.5) to produce a global habitat suitability index (GHSI)that ranges from 0 to 1, with 1 being the highest quality. Habitat quality is calculated on a node-by-node basis usingvelocity and depth predictions from a 2D hydraulic model simulation at a given flow (Leclerc et al., 1995; Crowderand Diplas, 2000; Elkins et al., 2007). For the Mokelumne, with over 14 years of complete redd surveys and sevenyears of 2D hydraulic model simulations at spawning flows, there is a high degree of confidence in the predictivecapability of the GHSI model. That is, the documented occurrence of spawning within the study reach is very wellpredicted by modelled high- and medium-quality habitat suitability classes in the GHSI, with only rare utilizationof predicted low (< 13%) and poor quality (< 1%) habitat areas, and virtually no utilization of GHSI-predicted non-habitat (Wheaton et al., 2004a; Elkins et al., 2007). Where spawning is correlated with lower quality classes, it hasalmost always been explained in terms of redd proximity to habitat heterogeneity elements such as shear zonerefugia or structural cover (Wheaton et al., 2004c).These ecohydraulic model predictions of habitat quality are compared to the DoD changes that describe the
geomorphic changes from the high flow dam releases. By using a CoD of the habitat suitability classes before andafter as a mask for the DoD, ECDs were derived to address the question of impact of geomorphic changes on habitatquality directly. The two classifications employed are the GHSI spawning habitat suitability predictions from the2005 post-project to the 2006 pre-project. In each, six categories were considered:
1. Outside 2005 SHR placement area,2. non-spawning habitat,3. very poor-quality spawning habitat,4. low-quality spawning habitat,5. medium-quality spawning habitat and6. high-quality spawning habitat
Thus the CoD had 36 categories. The six CoD categories for the areas outside the 2005 SHR placement area werediscarded. The remaining 32 categories were simplified into three classes whereby habitat quality either remainedthe same, improved or degraded.
RESULTS AND INTERPRETATION
Gross geomorphic changes from high-flow dam releases
Figure 3 shows the best estimate for the DoD budget after applying the DoD Uncertainty Analysis. A total of999.6m3 of net erosion and 810.1m3 of net deposition were recorded throughout the study area, so the reach asa whole experienced a net loss of 196.2m3. The ECD in Figure 3E shows a bimodal distribution that roughlybalances with only a 10% degradational tendency. The ECD signature of this water year is characteristic of a naturalriver: with a high depositional peak of low-magnitude deposition (i.e. broad sheets of deposition) and a more spreadout and uniform erosional distribution, reflecting more spatially concentrated areas of erosion but spanning agreater range of scour depths.A separate DoD analysis of the as-built 2005 SHR placement, suggested that 2017m3 of gravel were placed
(Wheaton, 2008). From the gross net loss estimate in the following year, one might conclude that the gravel used to
Copyright # 2009 John Wiley & Sons, Ltd. River. Res. Applic. (2009)
DOI: 10.1002/rra
J. M. WHEATON ET AL.

create the project was washing away and therefore a loss of created spawning habitat must be taking place. Indeed,Merz et al. (2006) documented the systematic net loss (between 3 and 20%) of gravel from three other SHR projectsalso on the LMR. They attributed the losses to a combination of fluvial erosion, gravitational sloughing,mobilization from spawning fish (i.e. faunal pedoturbation) settling and measurement uncertainties. Here, themeasurement and DEM uncertainties have been accounted for robustly. Thus, the question remains towhat extent isthat net loss in the study reach the result of settling and compaction of SHR placed gravels versus fluvial erosion ofbed material? Moreover, to what extent are these changes actually changing spawning habitat quality and/ordegrading it? Awealth of spatially explicit information from the DoDs can be exploited with masks to segregate thebudget and investigate such questions.
Geomorphic interpretation of change
Figure 4A shows a simple geomorphological interpretation of the observed net changes that took place to thestudy reach. In this segregation of the DoD, four masks help discriminate between changes due to natural fluvial neterosion and net deposition outside the area (pink in online version) where SHR gravel was placed. The segregatedbudget is shown in Figure 5 and tabulated in Table I. First, the questionable changes are separated out, these accountfor about 8% of the total volume of change. These changes exhibit an ECD typical of potentially erroneous changeswith a normal distribution centered around no change and dominated by low magnitude (and difficult to detect)elevation change. Outside the SHR placement area, net fluvial scour (primarily in pools) outpaces net fluvialdeposition at 25 versus 14% of the total volume of change (i.e. pool maintenance is occurring), respectively. Over47% of the total volume of erosion is taking place outside the SHR placement boundaries (44% inside the SHRboundaries). Within the SHR boundaries, 51% of the total volumetric changes in the DoD coverage are takingplace. Interestingly deposition slightly outpaced erosion (476.0 vs. 445.3m3). It should be noted that with the SHRboundaries, actual fluvial erosion is difficult to distinguish from elevations being lowered due to settling and/orcompaction (Merz et al., 2006). Although the reach experienced net degradation, the SHR project area actuallyexperienced net aggradation as a result of a major flood. Thus, the net loss for the entire reach is more a result offluvial erosion (e.g. in the pools) outside the SHR project area rather than due to the loss of placed gravels. Such aconclusion could not have been drawn without segregating the budget spatially with masks. However, it would behelpful to look more closely within these coarse masks to determine how these geomorphic changes have changedphysical habitat.
Changes to morphological units
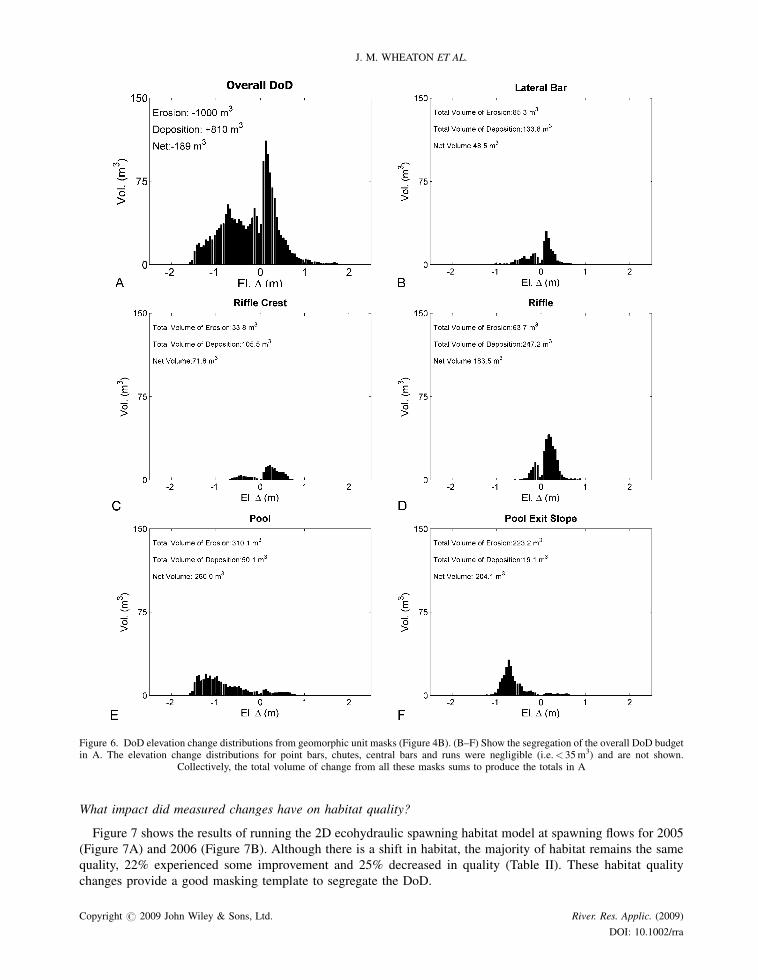
Figure 6 shows the segregation of the DoD budget (Figure 6A) by the morphological units defined inFigure 4B. The riffles, riffle crests and lateral bars form the bulk of the area where gravel was placed as part of theSHR project and bulk of spawning habitat for salmonids. Their ECDs (Figures 6B–D) are all bimodal, exhibitingsome net erosion and some net deposition, but each had a stronger depositional signal with a low magnitude peakaround 10–25 cm of deposition. Their collective net aggradational signal explains the net aggradation shown withinthe SHR site above in Figure 5C. The pools and pool-exit-slopes (Figures 5E and F) also each show some erosionand some deposition but the erosional signature overwhelms the depositional one. The pool exit-slope has a morepronounced peak centered at about 50–60 cm of erosion, reflecting the downstream adjustment of the pool-boundary eroding into the riffle. The pool, by contrast, has a broader distribution with some substantial highermagnitude erosion in the 100–150 cm range, indicating the lateral erosion and widening of the pool into the lateralbars. The majority of the scour (c. 60%) was in the form of deepening or accentuation of pool boundaries in areaswith convergent flow, whereas nearly half of the deposition (c. 48%) was over wide riffles with divergent flows overthem.
From a physical habitat perspective, what are the implications of shallow net deposition over bars and riffles andnet scour of pools? Both sediment transport processes lead to a rejuvenation and turnover of substrates, which isthought to promote higher rates of hypohrheic exchange and therefore higher survival of incubating salmonidembryos in the gravels (Montgomery et al., 1996; Merz et al., 2004). Such sediment transport processes could beproblematic if they coincided with the embryo incubation period and scour depths exceeded the burial depth of eggs(see discussion). However, such processes accentuate meso-scale habitat patch differences into zones suitable for
Copyright # 2009 John Wiley & Sons, Ltd. River. Res. Applic. (2009)
DOI: 10.1002/rra
LINKING GEOMORPHIC CHANGES TO SALMONID HABITAT

different salmonid freshwater life stages (i.e. riffle building supporting spawning and pool maintenance supportingrearing).In the context of the SHR efforts, although the habitat is changing the riffles and bars are growing and persisting
as places of net deposition and the pools are being maintained (as opposed to reverting to a plane-bed or runmorphology). This pattern of change was explicitly encouraged in the rehabilitation project design to promote
Figure 4. Two types of masks used to segregate DoD budget from Figure 3E. (A) A simple geomorphic interpretation divides the DoD (C) intofluvial erosion and deposition outside the SHR gravel placement area, versus changes within it (see also Figure 5). The orange areas are zoneswhere little to no field evidence of geomorphic change was present. (B) A standard classification of the earlier DEM into ecologically relevantgeomorphic units will provide masks of the DoD (C), which can be used to highlight specifically what changes took place to those units (see also
Figure 6). This figure is available in colour online at www.interscience.wiley.com/journal/rra
Copyright # 2009 John Wiley & Sons, Ltd. River. Res. Applic. (2009)
DOI: 10.1002/rra
J. M. WHEATON ET AL.

riffle-pool self-sustainability, relying on the flow convergence routing mechanism suggested by MacWilliams et al.(2006). This is the first real test of the pool maintenance design hypotheses proposed in Wheaton et al. (2004d) athigh flows. While these results are encouraging, within the SHR area it would be useful to know how these changesin physical habitat influenced habitat quality.
Figure 5. DoD elevation change distributions from geomorphic interpretation masks (Figure 4A) of overall DoD budget in Figures 3E. (A, B)Show fluvial deposition and scour respectively that took place without SHR gravel placement boundaries. (C) Shows changes that took place
within the SHR gravel placement boundaries. (D) Questionable change
Table I. Segregation of the DoD budget by geomorphic interpretation
Erosion volume (m3) Deposition volume (m3) Total volume (m3)
Fluvial Deposition 2.4 257.6 260.1Fluvial scour 464.8 3.0 467.8Changes to SHR placed gravel 445.3 476.0 921.4Questionable change 81.9 66.2 148.0Placed boulder 5.1 0.4 5.5Total 999.5 803.3 1802.8
Copyright # 2009 John Wiley & Sons, Ltd. River. Res. Applic. (2009)
DOI: 10.1002/rra
LINKING GEOMORPHIC CHANGES TO SALMONID HABITAT
What impact did measured changes have on habitat quality?
Figure 7 shows the results of running the 2D ecohydraulic spawning habitat model at spawning flows for 2005(Figure 7A) and 2006 (Figure 7B). Although there is a shift in habitat, the majority of habitat remains the samequality, 22% experienced some improvement and 25% decreased in quality (Table II). These habitat qualitychanges provide a good masking template to segregate the DoD.
Figure 6. DoD elevation change distributions from geomorphic unit masks (Figure 4B). (B–F) Show the segregation of the overall DoD budgetin A. The elevation change distributions for point bars, chutes, central bars and runs were negligible (i.e.< 35m3) and are not shown.
Collectively, the total volume of change from all these masks sums to produce the totals in A
Copyright # 2009 John Wiley & Sons, Ltd. River. Res. Applic. (2009)
DOI: 10.1002/rra
J. M. WHEATON ET AL.

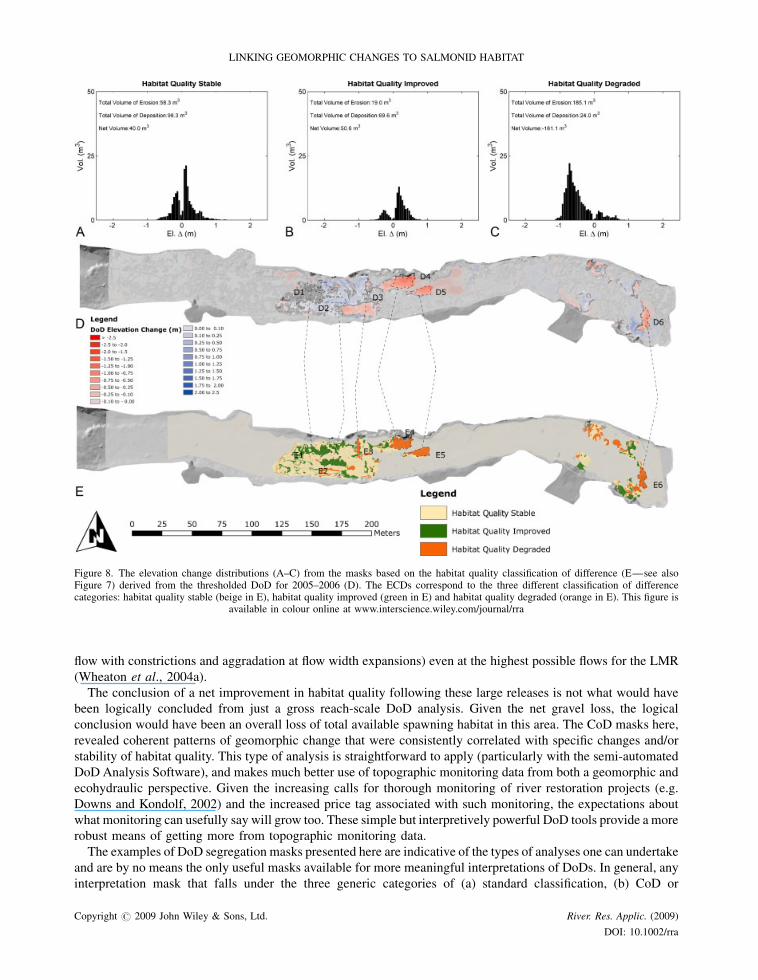
Figure 8A–C shows the primary results of the DoD budget segregation based on a 2D ecohydraulic habitatsuitability modelling analysis with three ECDs for the primary habitat change categories. The top portion ofTable II tabulates the same results. Over 53% of the area in which gravel was placed in 2005 retained the samehabitat quality characteristics, as predicted by GHSI. Interestingly, this stable habitat class shows the most balancedECD (although it is depositionally biased; Figure 8A) and only accounts for 19.5% of the total volumetric change tothe SHR area. By contrast, the improved and degraded habitat quality class masks account for 34.5 and 46.0% of thetotal volumetric change, respectively (Figures 8B and C). The improved and degraded classes also make aninteresting contrast geomorphically through their ECDs. In general, habitat degradation was associated with neterosion whereas habitat improvement was associated with net deposition. Both the stable and improved class ECDshave their most pronounced peak in areas of shallow deposition (10–25 cm), with the stable class favouringshallower deposition. The habitat degradation class ECD has its erosional peak at about 75 cm. This is primarily dueto the erosion and re-sculpting of the pool-exit slope.While such a change does result in habitat quality reduction bysimple hydraulic suitability criteria, pool-exit slopes tend to be hot-spots of spawning activity due to their proximityto deep pool refugia and increased hyporheic downwelling (Geist and Dauble, 1998; Geist, 2000; Wheaton et al.,2004c). Such erosion is a reflection of the translation of the pool-exit slope downstream.
Figure 7. The derivation of the habitat suitability classification of difference for 2005–2006. Habitat quality was compared on a cell-by-cellbasis from the beginning of the time step (fall 2005: sub-figure A) to the end of the time step (summer 2006: subfigure B) to calculate wherehabitat quality remained stable, improved or degraded in sub-figure C. The changes in habitat are due to the geomorphic changes. The greyed outareas reflect those areas outside the SHR placement zone and outside the analysis extent. This figure is available in colour online at
www.interscience.wiley.com/journal/rra
Copyright # 2009 John Wiley & Sons, Ltd. River. Res. Applic. (2009)
DOI: 10.1002/rra
LINKING GEOMORPHIC CHANGES TO SALMONID HABITAT
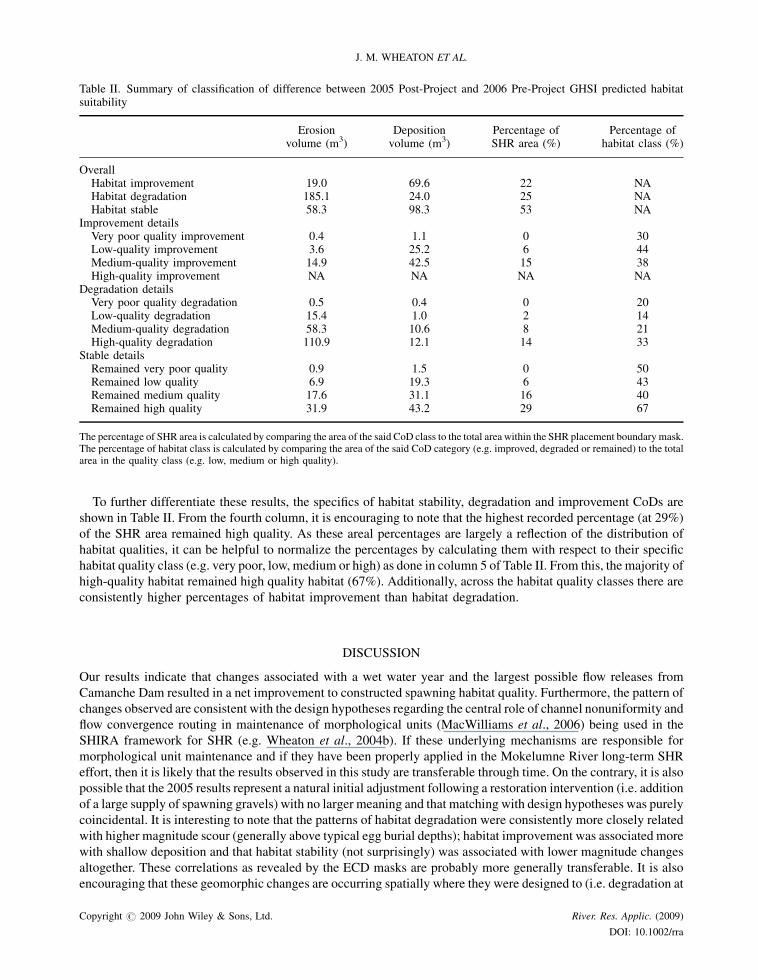
To further differentiate these results, the specifics of habitat stability, degradation and improvement CoDs areshown in Table II. From the fourth column, it is encouraging to note that the highest recorded percentage (at 29%)of the SHR area remained high quality. As these areal percentages are largely a reflection of the distribution ofhabitat qualities, it can be helpful to normalize the percentages by calculating them with respect to their specifichabitat quality class (e.g. very poor, low, medium or high) as done in column 5 of Table II. From this, the majority ofhigh-quality habitat remained high quality habitat (67%). Additionally, across the habitat quality classes there areconsistently higher percentages of habitat improvement than habitat degradation.
DISCUSSION
Our results indicate that changes associated with a wet water year and the largest possible flow releases fromCamanche Dam resulted in a net improvement to constructed spawning habitat quality. Furthermore, the pattern ofchanges observed are consistent with the design hypotheses regarding the central role of channel nonuniformity andflow convergence routing in maintenance of morphological units (MacWilliams et al., 2006) being used in theSHIRA framework for SHR (e.g. Wheaton et al., 2004b). If these underlying mechanisms are responsible formorphological unit maintenance and if they have been properly applied in the Mokelumne River long-term SHReffort, then it is likely that the results observed in this study are transferable through time. On the contrary, it is alsopossible that the 2005 results represent a natural initial adjustment following a restoration intervention (i.e. additionof a large supply of spawning gravels) with no larger meaning and that matching with design hypotheses was purelycoincidental. It is interesting to note that the patterns of habitat degradation were consistently more closely relatedwith higher magnitude scour (generally above typical egg burial depths); habitat improvement was associated morewith shallow deposition and that habitat stability (not surprisingly) was associated with lower magnitude changesaltogether. These correlations as revealed by the ECD masks are probably more generally transferable. It is alsoencouraging that these geomorphic changes are occurring spatially where they were designed to (i.e. degradation at
Table II. Summary of classification of difference between 2005 Post-Project and 2006 Pre-Project GHSI predicted habitatsuitability
Erosionvolume (m3)
Depositionvolume (m3)
Percentage ofSHR area (%)
Percentage ofhabitat class (%)
OverallHabitat improvement 19.0 69.6 22 NAHabitat degradation 185.1 24.0 25 NAHabitat stable 58.3 98.3 53 NA
Improvement detailsVery poor quality improvement 0.4 1.1 0 30Low-quality improvement 3.6 25.2 6 44Medium-quality improvement 14.9 42.5 15 38High-quality improvement NA NA NA NA
Degradation detailsVery poor quality degradation 0.5 0.4 0 20Low-quality degradation 15.4 1.0 2 14Medium-quality degradation 58.3 10.6 8 21High-quality degradation 110.9 12.1 14 33
Stable detailsRemained very poor quality 0.9 1.5 0 50Remained low quality 6.9 19.3 6 43Remained medium quality 17.6 31.1 16 40Remained high quality 31.9 43.2 29 67
The percentage of SHR area is calculated by comparing the area of the said CoD class to the total area within the SHR placement boundary mask.The percentage of habitat class is calculated by comparing the area of the said CoD category (e.g. improved, degraded or remained) to the totalarea in the quality class (e.g. low, medium or high quality).
Copyright # 2009 John Wiley & Sons, Ltd. River. Res. Applic. (2009)
DOI: 10.1002/rra
J. M. WHEATON ET AL.
flow with constrictions and aggradation at flow width expansions) even at the highest possible flows for the LMR(Wheaton et al., 2004a).
The conclusion of a net improvement in habitat quality following these large releases is not what would havebeen logically concluded from just a gross reach-scale DoD analysis. Given the net gravel loss, the logicalconclusion would have been an overall loss of total available spawning habitat in this area. The CoD masks here,revealed coherent patterns of geomorphic change that were consistently correlated with specific changes and/orstability of habitat quality. This type of analysis is straightforward to apply (particularly with the semi-automatedDoD Analysis Software), and makes much better use of topographic monitoring data from both a geomorphic andecohydraulic perspective. Given the increasing calls for thorough monitoring of river restoration projects (e.g.Downs and Kondolf, 2002) and the increased price tag associated with such monitoring, the expectations aboutwhat monitoring can usefully say will grow too. These simple but interpretively powerful DoD tools provide a morerobust means of getting more from topographic monitoring data.
The examples of DoD segregation masks presented here are indicative of the types of analyses one can undertakeand are by no means the only useful masks available for more meaningful interpretations of DoDs. In general, anyinterpretation mask that falls under the three generic categories of (a) standard classification, (b) CoD or
Figure 8. The elevation change distributions (A–C) from the masks based on the habitat quality classification of difference (E—see alsoFigure 7) derived from the thresholded DoD for 2005–2006 (D). The ECDs correspond to the three different classification of differencecategories: habitat quality stable (beige in E), habitat quality improved (green in E) and habitat quality degraded (orange in E). This figure is
available in colour online at www.interscience.wiley.com/journal/rra
Copyright # 2009 John Wiley & Sons, Ltd. River. Res. Applic. (2009)
DOI: 10.1002/rra
LINKING GEOMORPHIC CHANGES TO SALMONID HABITAT

(c) geomorphic interpretation can be used to glean more information out of DoDs. The choice is up to theinvestigator. Moreover masking helps break up the net change in storage terms of a sediment budget into physicallyand spatially important patterns at scales of relevance to organisms; in this case salmon. The masking analysis iseasy to apply for large datasets as it has been semi-automated in a wizard-assisted DoDAnalysis software packageavailable in Wheaton et al. (submitted).Although not presented here, Wheaton (2008) reported another example of DoD masking that is relevant to
salmonid fish—redds. What makes the redds potentially useful DoD masks is that they allow assessment of localimpacts at each redd and thus make a more precise assessment of overall impact of single or multiple events(depending on when the topographic surveys were performed). A redd mask is primarily appropriate wheretopographic surveys exist before and after a change event (e.g. flood) that coincides with the incubation period forsalmon embryos. Using redds as masks, impacts of net geomorphic changes can be inferred. For example, net scourover redds can be compared with known or typical burial depth of embryos. Similarly, net deposition over reddseffectively increases the burial depth of eggs, and may do so to the point that fry cannot emerge and/or inter-gravelflow is no longer adequate. Unfortunately, the morphological method takes no account of the calibre andcomposition of sediment or mechanisms like infiltration of fine sediment into interstitial spaces. Thus, using reddsurveys as a mask for DoDs derived from the incubation period will likely give a conservative estimate of thepotential impact to incubating salmonids from deposition. If the topographic surveys were performed prior to andfollowing redd construction, the redd masks could be used to estimate the volume of material liberated by salmonduring redd construction (e.g. Gottesfeld et al., 2004; Merz et al., 2006).This analysis only looks at how availability of different quality spawning habitats changed in response to net
geomorphic changes. Habitat utilization data might provide a useful proxy to see if spawning salmonids actuallyuse the habitat. Redd surveys have been conducted on the Mokelumne on a weekly basis during the spawningseason each year since 1994 (Elkins et al., 2007). In the autumn following the 2005, SHR project and preceding thehigh flow releases of the spring of 2006, there were 245 redds recorded in the project area. The fall-run in thefollowing year, after the high flows, by contrast only had 87 redds. The redds were still utilizing the high qualityhabitat, but the lower numbers had more to do with the total run size. The highest recorded number of redds (2157)since monitoring began was recorded in 2005; whereas 2006 was one of the lowest (755). However, whennormalized to run size, 11.3% of the total run used the SHR project area in 2005 and 11.5% in 2006. Thus, the minornet improvement in habitat quality seems to be matched by minor gains in relative habitat utilization. Embryonicsurvival and or physical conditions influencing survival (e.g. intragravel flow velocity, porosity, dissolved oxygen,temperature, etc.) were not monitored in this study. However, previous work by Merz et al. (2004) on theMokelumne established that SHR projects do generally lead to increased embryo survival.
CONCLUSION
Repeat topographic river surveying is becoming more affordable and tractable and recent developments inaccounting for DEM uncertainty allow greater confidence levels in making detailed DoDs interpretations. Asgeomorphic changes to rivers result in changes to physical habitat at a scale that fish experience, DoDs can beexploited to make ecohydraulic interpretations from topographic monitoring data. In this paper, some simplemasking tools were introduced to demonstrate how the ecohydraulic implications of geomorphic change canbe elucidated from DoDs. We illustrated these concepts with the example of high flow dam releases on physicalspawning habitat quality for salmonids in a heavily regulated California River. Spawning habitat quality did notchange in over half the areas experiencing scour and deposition, but these areas also experienced very lowmagnitude elevation changes. In general, high flow net deposition led to expansion of riffle habitat and spawninghabitat quality improvement; whereas erosion led to net scour (primarily along the pool-exit slope) that lead tospawning habitat degradation but preservation of the pool habitat. This case study acts as a proof of concept thatDoDs can be used to make more sophisticated interpretations of topographic monitoring data, which explicitlyhighlight the ecohydraulic significance of geomorphic change. More significantly, these ecohydraulically usefulinterpretations revealed by these analyses would not have been possible from more traditional, reach-scaleinterpretation of the DoDs.
Copyright # 2009 John Wiley & Sons, Ltd. River. Res. Applic. (2009)
DOI: 10.1002/rra
J. M. WHEATON ET AL.

ACKNOWLEDGEMENTS
This research was primarily funded by a PhD studentship for the lead author at the University of Southampton paidfor jointly by the School of Geography and the NERC Centre for Ecology and Hydrology, with international feescovered by an Overseas Research Studentship from Universities UK. Financial support for the Mokelumne datacollection was provided by the US Fish andWildlife Service (contracting entity for CALFEDBay-Delta EcosystemRestoration Program: Cooperative Agreement DCN# 113322G003). Construction projects were funded byEBMUD and CVPIA. EBMUD and UC Davis staff and students assisted with topographic surveys. The authorsare grateful to the numerous individuals who assisted in the data collection on the Mokelumne River) and want tospecifically acknowledge Marisa Escobar who was the lead scientist for the SHIRA-based project design in 2005and 2006. Administrative support was provided by staff at the Center for Watershed Sciences at UC Davis. Theauthors thank two anonymous reviewers and the special issue editors, whose feedback helped greatly to improve theclarity of the manuscript.
REFERENCES
Bernhardt ES, Palmer MA, Allan JD, Alexander G, Barnas K, Brooks S, Carr J, Clayton S, Dahm C, Follstad-Shah J, Galat D, Gloss S, Goodwin
P, Hart D, Hassett B, Jenkinson R, Katz S, Kondolf GM, Lake PS, Lave R, Meyer JL, O’Donnell TK, Pagano L, Powell B, Sudduth E. 2005.
Synthesizing US river restoration efforts. Science 308(5722): 636–637. DOI:10.1126/science.1109769Brasington J, Rumsby BT,Mcvey RA. 2000.Monitoring andmodellingmorphological change in a braided gravel-bed river using high resolution
GPS-based survey. Earth Surface Processes and Landforms 25(9): 973–990. DOI: 10.1002/1096.-9837(200008)25:9<973::AIDESP111>3.0.CO;2-Y
Brasington J, Langham J, Rumsby B. 2003. Methodological sensitivity of morphometric estimates of coarse fluvial sediment transport.Geomorphology 53(3–4): 299–316. DOI: 10.1016/S0169-555X(02)00320-3
Brewer PA, Passmore DG. 2002. Sediment budgeting techniques in gravel bed rivers. In Sediment Flux to Basins: Causes, Controls and
Consequences, Special Publication 191, Jones S, Frostick L (Eds). Geological Society: London; 97–113.
Brierley GJ, Fryirs K. 2000. River styles, a geomorphic approach to catchment characterization: implications for river rehabilitation in Begacatchment, New South Wales, Australia. Environmental Management 25(6): 661–679. DOI: 10.1007/s002670010052
CDFG. 1991. Lower Mokelumne River Fisheries Management Plan. California Department of Fish and Game: The Resources Agency,
Sacramento, CA. Available
Crowder DW, Diplas P. 2000. Using two-dimensional hydrodynamic models at scales of ecological importance. Journal of Hydrology 230(3–4):172–191. DOI: 10.1016/S0022-1694(00)00177-3
Downs PW, Kondolf GM. 2002. Post-project appraisals in adaptive management of river channel restoration. Environmental Management 29(4):477–496. DOI: 10.1007/s00267-001-0035-X
Elkins EM, Pasternack GB, Merz JE. 2007. The use of slope creation for rehabilitating incised, regulated, gravel bed rivers. Water Resources
Research 43: W05432. DOI:10.1029/2006WR005159
Fuller IC, Large ARG, Charlton ME, Heritage GL, Milan DJ. 2003. Reach-scale sediment transfers: an evaluation of two morphological
budgeting approaches. Earth Surface Processes and Landforms 28(8): 889–903. DOI: 10.1002/esp.1011Geist DR. 2000. Hyporheic discharge of river water into fall chinook salmon (Oncorhynchus tshawytscha) spawning areas in the Hanford Reach,
Columbia River. Canadian Journal of Fisheries and Aquatic Sciences 57: 1647–1656. DOI: 10.1139/cjfas-57-8-1647Geist DR, Dauble DD. 1998. Redd site selection and spawning habitat use by fall chinook salmon: the importance of geomorphic features in large
rivers. Environmental Management 22(5): 655–669. DOI: 10.1007/s002679900137Golet GH, Brown DL, Crone EE, Geupel GR, Greco SE, Holl KO, Jukkola DE, Kondolf GM, Larsen EW, Ligon FK. 2003. Using science to
evaluate restoration efforts and ecosystem health on the Sacramento River Project, California. In: California riparian systems: processes and
floodplain management, ecology and restoration, 2001 Riparian Habitat and Floodplains Conference Proceedings, Faber PM (Ed). RiparianHabitat Joint Venture: Sacramento, California; 368–385.
Gottesfeld AS, Hassan MA, Tunnicliffe JF, Poirer RW. 2004. Sediment dispersion in salmon spawning streams: the influence of floods and
salmon redd construction. Journal of the American Water Resources Association 40(4): 1071–1086. DOI: 10.1111/j.1752-
1688.2004.tb01068.xGreig SM, Sear DA, Carling PA. 2007. A review of factors influencing the availability of dissolved oxygen to incubating salmonid embryos.
Hydrological Processes 21(3): 323–334. DOI: 10.1002/hyp.6188Jones C. 1997. Geographical Infromation Systems and Computer Cartography. Addison Wesley Longman Limited: Essex; 319.
Kondolf GM, Wolman MG. 1993. The Sizes of Salmonid Spawning Gravels. Water Resources Research 29(7): 2275–2285.Lane SN, Chandler JH, Richards KS. 1994. Developments in monitoring and modeling small-scale river bed topography. Earth Surface
Processes and Landforms 19(4): 349–368. DOI: 10.1002/esp.3290190406Lane SN, Chandler JH. 2003. Editorial: the generation of high quality topographic data for hydrology and geomorphology: New data sources,
new applications and new problems. Earth Surface Processes and Landforms 28(3): 229–230. DOI: 10.1002/esp.479
Copyright # 2009 John Wiley & Sons, Ltd. River. Res. Applic. (2009)
DOI: 10.1002/rra
LINKING GEOMORPHIC CHANGES TO SALMONID HABITAT

Lane SN, Westaway RM, Hicks DM. 2003. Estimation of erosion and deposition volumes in a large, gravel-bed, braided river using synoptic
remote sensing. Earth Surface Processes and Landforms 28(3): 249–271. DOI: 10.1002/esp.483Leclerc M, Boudreault A, Bechara JA, Corfa G. 1995. Two-dimensional hydrodynamic modeling: a neglected tool in the instream flow
incremental methodology. Transactions of the American Fisheries Society 124(5): 645–662. DOI: 10.1577/1548-8659. (1995)24<0645:TDHMAN>2.3.CO;2
Lisle TE, Lewis J. 1992. Effects of sediment transport on survival of salmonid embryos in a natural stream: a simulation approach. Canadian
Journal of Fisheries and Aquatic Sciences 49: 2344–2377. DOI: 10.1139/f92-257MacWilliams M, Wheaton JM, Pasternack GB, Kitanidis PK, Street RL. 2006. The flow convergence-routing hypothesis for pool-riffle
maintenance in alluvial rivers. Water Resources Research 42(10): W10427. doi 10.1029/2005WR004391
McLean DG, Church M. 1999. Sediment transport along lower Fraser River—2. Estimates based on the long-term gravel budget. Water
Resources Research 35(8): 2549–2559.Merz JE, Chan LKO. 2005. Effects of gravel augmentation on macroinvertebrate assemblages in a regulated California river. River Research and
Applications 21(1): 61–74. DOI:10.1002/rra.819Merz JE, Setka JD. 2004. Evaluation of a spawning habitat enhancement site for Chinook salmon in a regulated California River.North American
Journal of Fisheries Management 24(2): 397–407. DOI: 10.1577/M03-038.1Merz JE, Setka JD, Pasternack GB, Wheaton JM. 2004. Predicting benefits of spawning-habitat rehabilitation to salmonid (Oncorhynchus spp.)
fry production in a regulated California river. Canadian Journal of Fisheries and Aquatic Sciences 61(8): 1433–1446. DOI: 10.1139/f04-077Merz JE, Pasternack GB,Wheaton JM. 2006. Sediment budget for salmonid spawning habitat rehabilitation in a regulated river.Geomorphology
76(1–2): 207–228. DOI: 10.1016/j.geomorph.2005.11.004Montgomery DR, Buffington JM, Peterson NP, Schuett-Hames D, Quinn TP. 1996. Stream-bed scour, egg burial depths, and the influence of
salmonid spawning on bed surface mobility and embryo survival. Canadian Journal of Fisheries and Aquatic Sciences 53(5): 1061–1070.Montgomery DR, Beamer EM, Pess GR, Quinn TP. 1999. Channel type and salmonid spawning distribution and abundance.Canadian Journal ofFisheries and Aquatic Sciences 56: 377–387.
Newson MD, Clark MJ, Sear DA, Brookes A. 1998. The geomorphological basis for classifying rivers. Aquatic Conservation-Marine and
Freshwater Ecosystems 8(4): 415–430.Pasternack GB, Wang CL, Merz JE. 2004. Application of a 2D hydrodynamic model to design of reach-scale spawning gravel replenishment onthe Mokelumne River, California. River Research and Applications 20(2): 205–225. DOI: 10.1002/rra.748
Phillips JD. 2001. Contingency and generalization in pedology, as exemplified by texture-contrast soils. Geoderma. 102(3–4): 347–370.Raven PJ, Boon PJ, Dawson FH, Ferguson AJD. 1998. Towards an integrated approach to classifying and evaluating rivers in the UK. Aquatic
Conservation-Marine and Freshwater Ecosystems 8: 383–393.Sawyer A, Pasternack GB, Merz JE, Senter A. 2009. Construction constraints for geomorphic-unit rehabilitation on regulated gravel-bed rivers.
River Research and Applications 29(4): 416–437. DOI: 10.1002/rra.1173Wheaton JM. 2003. Spawning Habitat Rehabilitation. M.S. Thesis, University of California at Davis, Davis, CA; 223. Available at: http://www.geog.soton.ac.uk/users/WheatonJ/downloads/Wheaton-MS-Thesis.pdf
Wheaton JM. 2008. Uncertainty in Morphological Sediment Budgeting of Rivers.Unpublished PhD, University of Southampton, Southampton;
412. Available at: http://www.joewheaton.org.uk/Research/Projects/PhDThesis.asp
Wheaton JM, Pasternack GB, Merz JE. 2004a. Spawning habitat rehabilitation—II. Using hypothesis testing and development in design,Mokelumne River, California, U.S.A. International Journal of River Basin Management 2(1): 21–37.
Wheaton JM, Pasternack GB, Merz JE. 2004b. Spawning habitat rehabilitation—I. Conceptual approach and methods. International Journal of
River Basin Management 2(1): 3–20.Wheaton JM, Pasternack GB, Merz JE. 2004c. Use of habitat heterogeneity in salmonid spawning habitat rehabilitation design. In Garcia D andMartinez PV (Garcia D and Martinez PV), Fifth International Symposium on Ecohydraulics: Aquatic Habitats: Anlalysis and Restoration,
IAHR-AIRH, Madrid, Spain; 791–796.
Wheaton JM, Brasington J, Darby SE, Sear D. in press. Accounting for uncertainty in DEMs from repeat ground-based topographic surveysEarth Surface Processes and Landforms.
Copyright # 2009 John Wiley & Sons, Ltd. River. Res. Applic. (2009)
DOI: 10.1002/rra
J. M. WHEATON ET AL.
Related Documents